the Creative Commons Attribution 4.0 License.
the Creative Commons Attribution 4.0 License.
 | 23 May 2022
Integration of observed and model-derived groundwater levels in landslide threshold models in Rwanda
Markus Hrachowitz
Thom Bogaard
The incorporation of specific regional hydrological characteristics in empirical statistical landslide threshold models has considerable potential to improve the quality of landslide predictions towards reliable early warning systems. The objective of this research was to test the value of regional groundwater level information, as a proxy for water storage fluctuations, to improve regional landslide predictions with empirical models based on the concept of threshold levels. Specifically, we investigated (i) the use of a data-driven time series approach to model the regional groundwater levels based on short duration monitoring observations and (ii) the predictive power of single variable and bilinear threshold landslide prediction models derived from groundwater levels and precipitation. Based on statistical measures of the model fit (R2 and RMSE), the groundwater level dynamics estimated by the transfer function noise time series model are broadly consistent with the observed groundwater levels. The single variable threshold models derived from groundwater levels exhibited the highest landslide prediction power with 82 %–93 % of true positive alarms despite the quite high rate of false alarms with about 26 %–38 %. The further combination as bilinear threshold models reduced the rate of false alarms by about 18 %–28 % at the expense of reduced true alarms by about 9 %–29 % and is thus less advantageous than single variable threshold models. In contrast to precipitation-based thresholds, relying on threshold models exclusively defined using hydrological variables such as groundwater can lead to improved landslide predictions due to their implicit consideration of long-term antecedent conditions until the day of landslide occurrence.
- Article
(3285 KB) - Full-text XML
- BibTeX
- EndNote


Landslide and other natural hazard prediction models are developed with the purpose of being implemented into early warning systems (LEWSs) (Fathani et al., 2016; Pecoraro et al., 2019; Piciullo et al., 2018). LEWSs are defined as tools to monitor the long-term hydrological and short-term meteorological variations to predict and timely inform about the imminent periods of landslide danger. Most landslide prediction approaches and development of early warning criteria routinely rely on meteorological threshold level concepts which define the typical precipitation characteristics like event rainfall volume, event rainfall intensity, and event duration that initiate landslides (e.g., Guzzetti et al., 2008; Brunetti et al., 2010; Rosi et al., 2016; Peruccacci et al., 2017). However, this exclusive reliance on meteorological data is problematic for several reasons. The most common problem attributed to these meteorological threshold level concepts is the frequent lack of considering pre-event hydrological processes and specific characteristics of the studied region that predisposes the slope to near failure (Bogaard and Greco, 2014, 2018; Mostbauer et al., 2018; Peres et al., 2018). These approaches are therefore known to generate high rates of false and missed alarms and thus reduce the quality of landslide early warning systems. Hydrology, being an important aspect in landslide hazard assessment, is still not sufficiently explored, although many landslides are hydrologically caused and meteorologically triggered (Bogaard and Greco, 2018). While landslides are hydrologically caused by elevated pre-event subsurface water storage, they are meteorologically triggered by the input of precipitation and snowmelt during a specific event that leads to a further increase in pore water pressure and a decrease in frictional forces between particles that reduces the effective shearing resistance and thus creates slope instability (van Beek, 2002; Bishop, 1954; Kuriakose, 2010). According to Bogaard and Greco (2014, 2015), the integration of hydrological processes into large-scale models is still incomplete and therefore limits the application in landslide prediction models. The need for landslide hydro-meteorological-based thresholds was highlighted and further postulated that both false and missed alarms could be significantly reduced if the wetness state is incorporated in landslide prediction models through direct measurements of soil water content or groundwater levels. However, various ways of including such hydrological state information into landslide hydro-meteorological thresholds have been recently attempted. These include the direct use of in situ hydrological data through standard observation networks such as stream flow or local soil moisture observations (e.g., Mirus et al., 2018b; Wicki et al., 2020) but also data from satellite-derived hydrological measurement (e.g., Zhuo et al., 2019; Thomas et al., 2019; Marino et al., 2020; van Natijne et al., 2020), as well as hydrological variables estimated from hydrological models (e.g., Ciavolella et al., 2016; Mostbauer et al., 2018; Prenner et al., 2018, 2019; Wang et al., 2019; Zhao et al., 2020). It should be noted that research that incorporates hydrological parameters into landslide prediction models using in situ data is scarce due to the absence of long-term hydrological monitoring of sufficient spatial and temporal coverage in most regions worldwide. This is in particular true for many African countries, where the underlying problem limiting landslide research is the lack of sufficient local data. Freely available satellite and global hydrological-model-derived information is also still poorly explored. In Rwanda, many river catchments have been recently equipped with groundwater observation wells, piezometers, and river water level gauges. However, frequently, the recorded data are insufficient to build historical time series that match the time period of landslide inventories and that could be incorporated into a landslide hydro-meteorological threshold model. Recently, Uwihirwe et al. (2020) published the first empirical landslide hazard assessment relation for Rwanda, which is an important step forward in landslide early warning in that country. The defined precipitation-based landslide threshold included the antecedent precipitation conditions as an indirect proxy for hydrological conditions. However, it still suffers from an elevated number of false and missed alarms. Recent research suggests that the number of false alarms can be reduced once the hydrological state information is incorporated in landslide prediction models. Several papers reported significant improvement of landslide forecast quality for early warning systems by replacing the antecedent rainfall component with soil moisture data (Mirus et al., 2018b; Mostbauer et al., 2018; Prenner et al., 2018, 2019; Zhuo et al., 2019; Thomas et al., 2019; Wang et al., 2019; Marino et al., 2020; Zhao et al., 2020; van Natijne et al., 2020; Wicki et al., 2020). The need for landslide hydro-meteorological thresholds is therefore widely acknowledged. However, the functional relationship between hydrological and meteorological conditions potentially linked to landslide initiation is not yet standardized. Traditional precipitation-based threshold models commonly used power-law functions between precipitation variables like intensity–duration (I–D) and event–duration (E–D) (e.g., Caine, 1980; Guzzetti et al., 2007, 2008; Ma et al., 2015; Hong et al., 2017) using the threshold model line as the best separator for landslide and no-landslide conditions sometimes defined based on expert judgment. More advanced statistical approaches that include the frequentist, probabilistic, and receiver operating characteristics methods have been adopted and have replaced the deterministic method. The frequentist method (Brunetti et al., 2010; Melillo et al., 2018; Peruccacci et al., 2017; Piciullo et al., 2018) also defines the threshold line separating landslide from no-landslide conditions based on the targeted exceedance probabilities. The probabilistic method (Berti et al., 2012; Robbins, 2016) fundamentally relies on Bayes' prior and marginal probabilities for landslide occurrence. The probabilistic methods are criticized for the biased prior and marginal probabilities due to the incompleteness of typical landslide inventory data (Berti et al., 2012), while frequentist methods are constrained by their high dependency on a large and well-distributed dataset to achieve significant results (Brunetti et al., 2010; Monsieurs et al., 2019b). The receiver operating characteristic (ROC) curve method compares the landslide and no-landslide conditions based on the area under the curve (AUC) while indicating the trade-off between true and false positive rates associated with each level of the tested predictor variable or model. In landslide studies, the ROC approach has been mostly used to evaluate the performance of landslide prediction models (Hong et al., 2017; Wicki et al., 2020) despite its capability to define the landslide initiation thresholds once associated with other statistical metrics like the true skill statistics and radial distance. Some research that incorporates the hydrological parameters in landslide prediction models also used the exponential or power-law function (e.g., Crozier, 1999; Monsieurs et al., 2019a, b). Monsieurs et al. (2019a) used the frequentist statistical method to define the landslide power-law threshold model line between antecedent rainfall and landslide susceptibility in the western branch of the East African Rift region. Similarly, Crozier (1999) defined the exponential function between antecedent water status and daily rainfall in Wellington, New Zealand. However, recent research (Mirus et al., 2018a; Uwihirwe et al., 2020) used the ROC curve and other statistical metrics (true skill statistics, radial distance, and threat score) to define the landslide threshold for each tested landslide predictor variable. These thresholds indicate the optimum levels in one dimension (1D) of either the hydrological or meteorological condition potentially linked to landslide initiation at local, regional, and global scales. Hereafter, these thresholds are therefore referred to as single variable threshold models. The combination of the optimum thresholds from two landslide predictor variables in two dimensions (2D) as X–Y pairs is referred to as a bilinear threshold model, first proposed by Mirus et al. (2018a). Some landslide studies discussed different effects that groundwater systems may have on landslide initiation (Bronnimann, 2011; Cascini et al., 2010; Corominas et al., 2005; Duan et al., 2019; Hong and Wan, 2011; Trigo et al., 2005; Zhao et al., 2016). However, the asset that regional groundwater level information may have in predicting landslide initiation on a regional scale is still underexplored. It is hypothesized that the more water stored in the catchment, the higher the probability is that a certain rain event will trigger landslides in a catchment. Therefore, estimates of catchment water storage could be used as a pre-event hydrological process that predispose a slope to near failure and thus be among the hydrological landslide predictor variables. However, as this information is scarce in the study area, we presuppose the regional groundwater level to be a potential proxy of the relative regional catchment storage which can be used as a hydrological landslide predictor variable and could be useful once incorporated in landslide threshold model definitions. This research aims to include regional groundwater level information into hydro-meteorological landslide threshold models and assess their predictive capabilities. As this type of information is not fully available, we used a parsimonious model to temporally extend regional groundwater level information to the full time period covered by the Rwanda landslide inventory. More specifically, we here tested the hypothesis that the incorporation of model-derived groundwater levels in empirical landslide hazard assessment thresholds could improve the landslide warning capability in Rwanda.
This study was conducted using data from three catchments – Kivu, upper Nyabarongo, and Mukungwa (Nieuwenhuis et al., 2019) – located in the northwestern region of Rwanda, a landlocked country geographically located between 1–3∘ S and 28–31∘ E in central East Africa (Fig. 1). The northwestern region is geomorphologically characterized by rounded, angular hills and headlands, mountains, and volcanoes with an elevation of up to about 4500 m and steep slopes of up to 55 % (Fig. 2).
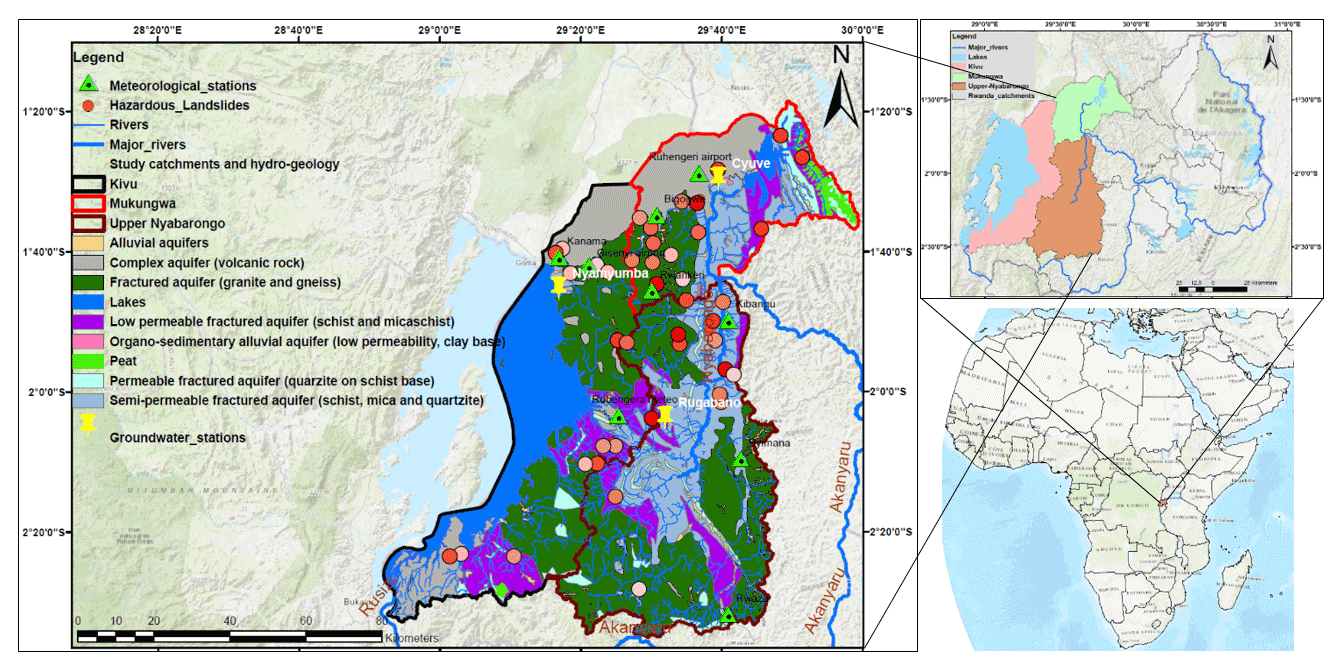
Figure 1Location of the study catchments: Kivu, upper Nyabarongo, and Mukungwa in Rwanda and Africa; hydrogeology of the study catchments; spatial and temporal distribution of landslides with light to dark red dots indicating old to new landslides recorded from 2006–2018 (Uwihirwe et al., 2020); and groundwater stations in yellow symbols and meteorological stations in light green symbols.
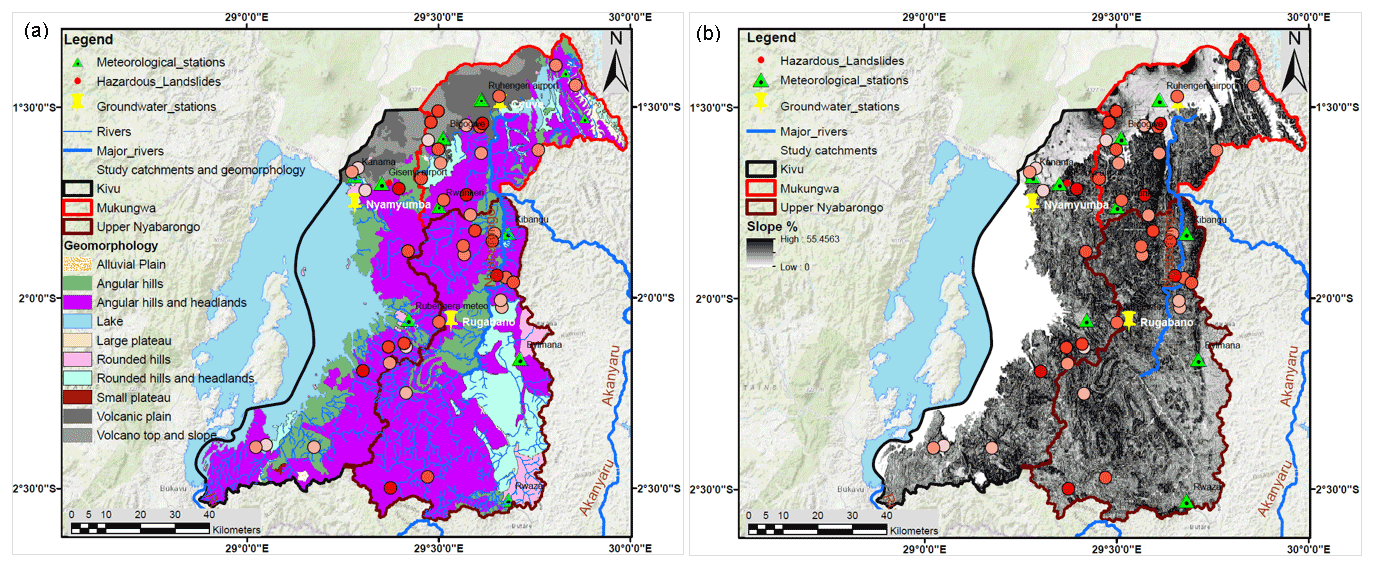
Figure 2Geomorphological characteristics of the study catchments and landslides: (a) landforms and (b) slope; spatial and temporal distribution of landslides with light to dark red dots indicating old to new landslides recorded from 2006–2018 (Uwihirwe et al., 2020).
The total area of Kivu catchment is about 7323 km2, 2425 km2 of which is located in Rwanda. The mean annual rainfall is around 1500 mm yr−1, while potential evaporation is estimated at about 860 mm yr−1 (Fig. 3). The Kivu catchment is dominated by basaltic aquifers (volcanic rock) in the north and southwest, fractured granite and gneiss aquifers in the center and southeast, and schists and mica schists in the center and south, while pegmatite is found in intermediate areas. The upper Nyabarongo catchment is located entirely within Rwanda with an area of about 3348 km2. The mean annual rainfall is around 1200 mm yr−1, and potential evaporation is estimated at around 870 mm yr−1 (Fig. 3). Granite and gneiss aquifers are dominant in the southern and to a lesser amount northwestern parts, while quartz-rich schists and mica schists dominate in central parts of the catchment (Fig. 1). The Mukungwa catchment covers a total area of 1949 km2 and is topographically dominated by the volcanic highlands region that receive abundant rainfall with a long-term mean annual rainfall of around 1200 mm yr−1 with an estimated actual evaporation of about 800 mm yr−1 (Fig. 3). The hydrogeology of the catchment (Fig. 1) is characterized by volcanic deposits with basalt in the north. Granite and pegmatite basement aquifers are found in the southwestern areas, while quartzite and mica schist are in the southeastern and eastern parts of the catchment. Landslides are most dominant in granite and mica schist units, while basaltic units seem to be quite resistant to landslide activities as shown in Fig. 1. This can be explained by the weathering products of volcanic rocks that produce a relatively permeable top layer but tend to form a layer of brecciated or intruded sills of low permeability at shallow depths, thus hampering deep groundwater recharge and being less prone to groundwater-induced landslides. Contrarily, the weathering products of granites are generally coarse-grained and tend to develop and preserve open-joint systems that increase permeability and thus the fast groundwater response that leads to landslide hazards. The weathering product of mica schists includes clay minerals that tend to fill up the fractures and thus slow the permeability. However, mica schists are prone to landslides due to rapid weathering, easy splitting along the joints and bedding planes, and loss of strength induced by the high content of mica. A field-based landslide inventory in the northwestern region indicated that these landslides are classified as rotational slide (34 %), flow (26 %), translational slide (17 %), fall (15 %), and complex type of mass movement (7 %) involving debris, earth, and rock materials. The typical landslides are deep with estimated areal extents between 2.8×101–4.4×10⁵ m2, failure volume between 1.3×101–5.8×10⁶ m3, and mobilization rate of about 21 mm yr−1 (Uwihirwe et al., 2020).

Figure 3Mean catchment annual rainfall and potential evaporation in (a) Kivu, (b) upper Nyabarongo, and (c) Mukungwa catchments.
3.1 Groundwater modeling: data and methodology
3.1.1 Meteorological data and selection of landslide-representative meteorological stations
The rainfall dataset was accessed from the Rwanda meteorology agency, while potential evaporation time series were calculated with the Thornthwaite method (Thornthwaite, 1948) using the mean daily temperature and monthly heat index. We used time series of daily rainfall and potential evaporation from nine meteorological stations located within the studied catchments for a period of 13 years from 2006–2018. The meteorological stations (Fig. 1) spatially distributed in the three studied catchments were selected based on their relative proximity to the observed locations of the landslides and include Rubengera, Kanama, and Gisenyi meteorological stations in the Kivu catchment; Byimana, Kibangu, and Rwaza stations in the upper Nyabarongo catchment; and Ruhengeri, Bigogwe, and Rwankeri meteorological stations in the Mukungwa catchment, as presented in Fig. 1.
3.1.2 Groundwater data and selection of landslide-representative groundwater stations
The time series of groundwater levels used for this study were accessed from the Rwanda water portal (https://waterportal.rwb.rw/data/ground_water, last access: 2 June 2021). We selected three groundwater observation stations (Fig. 1) with a temporal resolution of 1 d and a minimum continuous duration of 1 year. The three groundwater observation stations, Nyamyumba, Rugabano, and Cyuve, located within the Kivu, upper Nyabarongo, and Mukungwa catchments, respectively, recorded data from December 2016 till December 2018. However, the intrinsic limitation of this database is linked to the coarse spatial resolution of the data recording equipment, and the recorded data are insufficient to build historical time series that match the time period of landslide inventories (2006–2018). Nevertheless, this database has been previously used for the computation of water balance and catchment storage and proved to be useful in Rwanda (Nieuwenhuis et al., 2019; RWFA, 2019).
3.1.3 Transfer function noise (TFN) time series model
A transfer function noise (TFN) time series model describes the dynamic relationship between a single output series and one or more input series. The TFN model was used in this research to simulate groundwater levels (model output) using both rainfall and potential evaporation as model inputs (Bakker and Schaars, 2019; Collenteur et al., 2019). With TFN modeling, the groundwater response to both rainfall and evaporation is simulated with a scaled gamma response function. The structure of a TFN model to simulate groundwater levels is expressed with Eq. (1):
where ht is the groundwater levels (m) at time t, hs(t) is the contribution of stresses s at time t (m d−1), S is the total number of stresses (–) that contribute to the groundwater level change here represented by rainfall and evaporation, d is the base elevation of the model (–), and r(t) is the residuals (m). Each model can have an arbitrary number of stresses S that contribute to the head; hydrological stresses may include rainfall, evaporation, river levels, and groundwater extractions. The contribution of stress s to the groundwater level at time t is computed through convolution with Eq. (2):
with ss denoting the time series of stress s and θs expressing the groundwater impulse response function for stress s. The groundwater response is estimated using the scaled gamma response function that indicates the relationship between the variation in the input time series (rainfall and evaporation) and the variation in the groundwater levels as in Eq. (3):
with A denoting the scaling factor (–); a and n are shape parameters (–), while ⌈ expresses the gamma function.
3.1.4 Groundwater modeling approach
We used the TFN time series model implemented in “Pastas”, a new open-source Python package for analysis of groundwater time series. The TFN modeling explains an observed time series (here the observed groundwater levels) by one or more other time series (here rainfall and potential evaporation time series). The TFN model input time series, rainfall, and potential evaporation were available for the entire study period 2006–2018, whereas the observed groundwater level was available for December 2016 to December 2018. We have therefore used the 2 years of available groundwater observation time series, and these short-term data were only used for model calibration, and no validation was carried out due to the data limitations. By using the TFN modeling approach, we aimed for hindcasting and thus the reconstruction of past groundwater levels to overlap with the time period of the recorded landslide inventory in Rwanda (2006–2018) by using the fully available time series of rainfall and evaporation as model inputs or model stresses. Each model can have an arbitrary number of hydrological stresses that contribute to the groundwater level changes. These hydrological stresses include rainfall, evaporation, river levels, and groundwater extractions. For this study, however, we used rainfall and potential evaporation and assumed runoff and groundwater pumping to be negligible, although they were not assessed in our study area. The impulse groundwater response function to the stresses was fitted with the scaled gamma distribution function, and the calibrated parameters were A, n, a, and d, as described in Sect. 3.1.3 and summarized in Appendix A. The output of the TFN model was then daily groundwater levels ht (m) over the entire 13-year study period from 2006–2018. Apart from hindcasting, the TFN model spatially extrapolated the groundwater information and accounted for different precipitation and potential evaporation inputs from the nine spatially distributed meteorological stations – Rubengera, Kanama, Gisenyi, Byimana, Kibangu, Rwaza, Ruhengeri, Bigogwe, and Rwankeri – shown in Fig. 1. The extrapolation was undertaken by changing the model inputs and model parameters at the location of each of the meteorological stations and by implicitly relying on the main assumption here that other hydro-geomorphological parameters do not exhibit spatial variability within the individual catchment. This is an assumption made given the data scarcity and some intrinsic limitation of the database in the East African Rift region in general (Monsieurs et al., 2018) and Rwanda in particular. The modeled groundwater levels were standardized and used in the regional hydro-meteorological hazard assessment threshold definition. The standardization was computed with Eq. (4):
where ys is the standardized value of groundwater time series (–), xi is the value of time series (m) at time step i, is the average value of time series (m), σ is the standard deviation of time series (m), and i is the subsequent time step in a time series.
3.2 Regional landslide assessment: data and methodology
3.2.1 Landslide inventory
The available landslide inventory for Rwanda contains landslides recorded from 2006–2018. It was accessed from the NASA global landslide catalogue (https://data.nasa.gov/Earth-Science/Global-Landslide-Catalog/h9d8-neg4, last access: 26 June 2019) uploaded by the Landslide Inventory for the central section of the Western branch of the East African Rift (LIWEAR) project. The catalogue was further extended by Uwihirwe et al. (2020) through the compilation of additional rainfall-induced landslides as reported from local newspapers, blogs, technical reports, and field observations. Between 2006–2018, the catalogue counts 42 accurately dated landslides located within the studied region (Fig. 1). However, the detailed characteristics of these landslides such as the accurate size, types, cause, and triggers are frequently not recorded by the landslide hazard reporters.
3.2.2 Definition of landslide hydrological and meteorological conditions
The outputs from the TFN model, including groundwater levels, were used to define the landslide hydrological conditions in each of the studied catchments. The landslide hydrological conditions consist of standardized groundwater levels modeled on landslide day ht and day prior to the landslide-triggering event ht−1 and were here considered as landslide-causing or landslide-predisposing conditions. The meteorological conditions used here include event rainfall volume E (mm E−1), event rainfall intensity I (mm d−1), and event duration D (d) and were considered as landslide triggers. The event duration D was defined as individual periods of days with recorded rain interrupted by dry periods of at least 2 d. The event rainfall volume E was computed as the accumulated rainfall during each individual event period of duration D. The event rainfall intensity was then computed as a ratio of E and D. Both hydrological and meteorological conditions were binary classified into landslide and no-landslide conditions depending on whether they resulted in a landslide or not.
3.2.3 Quantification of landslide predictor variables
The landslide predictor variables which include the predisposing conditions ht and ht−1, as well as the triggering conditions E, I, and D, were tested for their relevance using ROC curves and the AUC metrics. ROC is used as a statistical tool indicating the trade-off between false positive rate (FPR) and true positive rate (TPR) associated with each threshold level on the curve (Hong et al., 2017; Postance and Hillier, 2017; Mirus et al., 2018a; Prenner et al., 2018). In landslide studies, the AUC is an indicator of the capacity of the test variable to correctly distinguish landslide from no-landslide conditions. It is therefore used as a statistical metric that compares the test variables to random guessing (AUC=0.5) and thereby indicates their significance in which the perfect test variable has an AUC equal to unity. The TPR and FPR corresponding to each threshold level on ROC curves are calculated with Eqs. (5) and (6):
where TP signifies true positive or true alarm, which is the number of landslides correctly predicted by the threshold model, FN signifies false negative or missed alarm, which is the number of landslides that occurred in reality but were not predicted by the defined threshold, and FPs (false positives) or false alarms are incorrect predictions of landslide occurrence by the threshold model, while in reality there was no landslide reported. TNs (true negatives) are correct predictions of no landslide occurrence.
3.2.4 Landslide threshold definition techniques
The optimum or the most informative threshold level above which landslides are highly likely to occur has been defined using two statistical techniques, i.e., the maximum true skill statistics (TSS) and minimum radial distance (Rad). The TSS is expressed as a balance between the true positive rate and false positive rate as indicated in Eq. (7):
where the maximum value of TSS indicates the optimum threshold for landslide initiation. For a perfect threshold model, the TSS reaches unity which indicates a zero FPR.
The radial distance (Rad) shows the relative distance from the defined threshold level to the perfect model or optimum point whose TPR is a unit and zero FPR and is computed with Eq. (8):
3.2.5 Single variable and bilinear threshold models and landslide predictive capabilities
According to Postance and Hillier (2017), the optimum landslide threshold model is the one that maximizes the TP alarms while minimizing FN and FP alarms. Based on these criteria, the optimum threshold was here selected among the ones defined either by maximum true skill statistics or by minimum radial distance as stated in Sect. 3.2.4. These optimum thresholds were first plotted in 1D, here referred to as the single variable threshold model line beyond which landslides are highly likely to occur. Furthermore, these optimum thresholds were combined and plotted in 2D, here referred to as the bilinear threshold model line beyond which landslides are highly likely to occur. The bilinear threshold models made of hydrological and meteorological predictors were formulated using x–y pairs such as ht–E, ht–I, ht−1–E, and ht−1–I and are referred to as hydro-meteorological threshold models. Furthermore, the thresholds from traditional landslide prediction models that exclusively rely on precipitation, precipitation threshold models, such as event–duration (E–D) and intensity–duration (I–D), were also defined in a bilinear framework and used as benchmarks for comparative performance evaluation. The predictive performance of these threshold models was evaluated using a confusion matrix and the resulting rate of positive (TP), false (FP), and failed (FN) alarms and true negatives (TNs).
4.1 Regional groundwater modeling
The outputs of the TFN time series model were daily groundwater levels (m) simulated over 13 years from 2006–2018, as presented in Fig. 4. The results demonstrate that the TFN time series model can broadly reproduce the main features of observed groundwater level fluctuations based on the metrics of goodness of the model fit, i.e., R2 and RMSE between observed and simulated groundwater levels. Overall, the model explains between 60 %–87 % of the variance in the observed groundwater data from the three studied catchments. The RMSE values of groundwater levels (∼0.09–1.84 m) similarly suggested a reasonable model fit across the catchments. More specifically, while the TFN model captures groundwater fluctuations rather well in the Kivu and Mukungwa catchments (RMSE values of groundwater levels <0.5 m), the model is somewhat less robust for the upper Nyabarongo (RMSE values of groundwater levels >0.5 m). The weaker model fits observed in upper Nyabarongo catchment are mostly the consequence of the relatively large distance between the groundwater well and the meteorological stations, as was also highlighted as a potential source for poor TFN model fits by Bakker and Schaars (2019). They further postulated that TFN time series models are relatively simple as they include only a handful of parameters and have the greater skill to simulate groundwater levels than more detailed models.
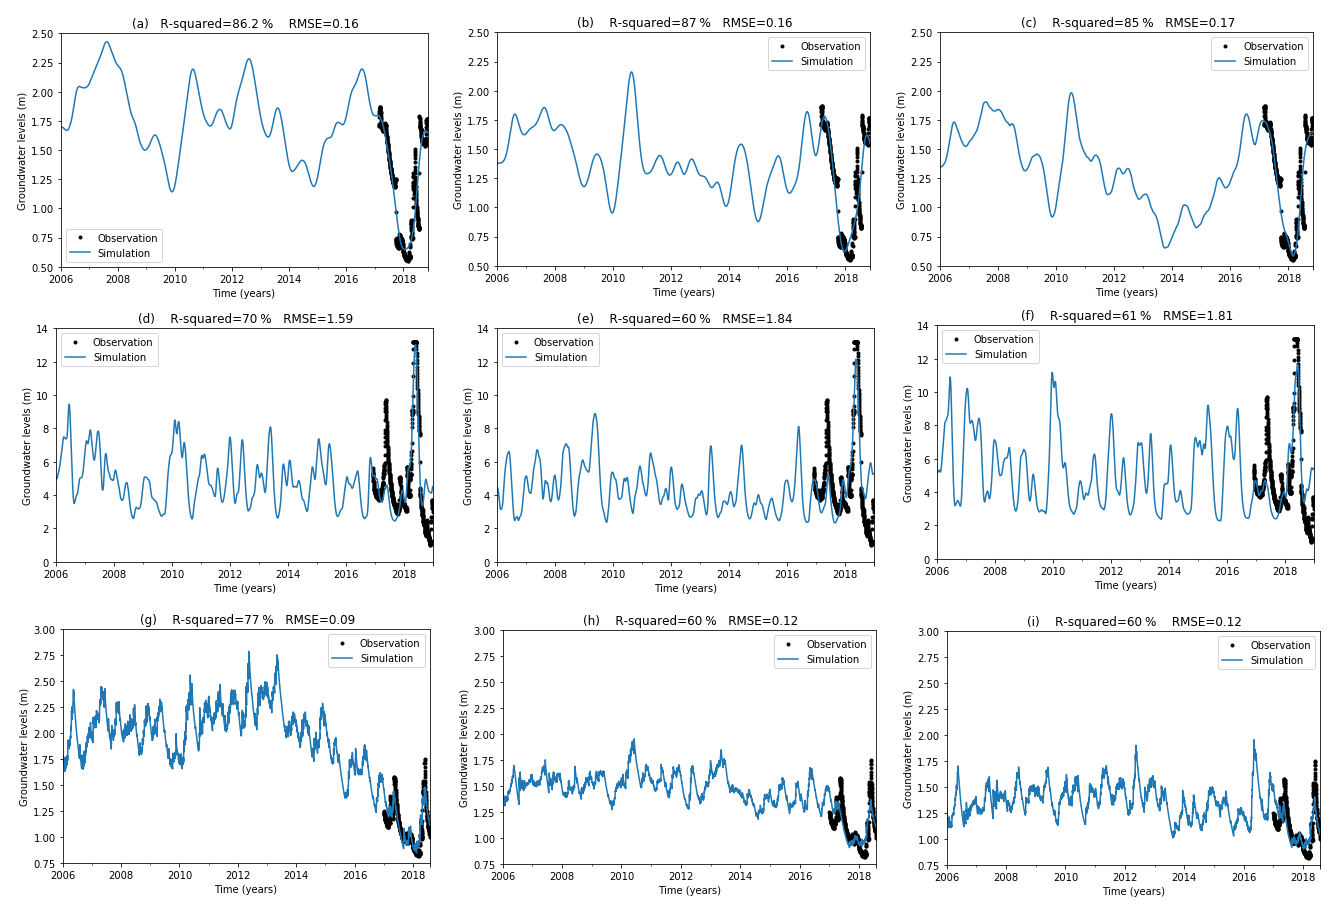
Figure 4Groundwater simulation with TFN model. (a–c) TFN model calibrated with groundwater observations from Nyamyumba groundwater observation well; rainfall and potential evaporation (Ep) time series as model inputs from three meteorological stations: (a) Rubengera (b) Kanama, and (c) Gisenyi located in Kivu catchment. (d–f) TFN model calibrated with groundwater observations from Rugabano groundwater observation well; rainfall and Ep time series as model inputs from three meteorological stations: (d) Byimana, (e) Kibangu, and (f) Rwaza located in upper Nyabarongo catchment. (g–i) TFN model calibrated with groundwater observations from Cyuve groundwater observation well; rainfall and Ep time series as model inputs from three meteorological stations: (g) Ruhengeri, (h) Bigogwe, and (i) Rwankeri located in Mukungwa catchment.
4.2 Catchment standardized groundwater levels and landslide activities
The standardized daily groundwater levels and the linked landslide hazards are presented in Fig. 5 for the Kivu, upper Nyabarongo, and Mukungwa catchments. The simulated groundwater levels were standardized based on the assumption that landslides occur when the groundwater levels positively deviate from the long-term mean up to a critical level for landslide initiation. The comparisons of mean daily rainfall and standardized groundwater levels across the three studied catchments, calculated by averaging data within each catchment, indicate general similarities in terms of landslide triggering and predisposing but also reveal systematic differences between the groundwater responses. For example, Mukungwa catchment is slowly responding and is also drier from 2014–2018 than the other catchments despite its elevated landslide hazard during that period. The results indicated that landslides are likely to occur at a certain level above the long-term mean groundwater level and thus justify the importance of groundwater and catchment wetness in terms of slope failure predisposition. They also indicate that landslides occur when the catchment groundwater reaches a certain peak level above the long-term mean which is a function of the rainfall received in the past depending on the time memory of each catchment. Even though the most hazardous landslides in the studied catchments are shallow-seated landslides which are mostly rainfall induced, the conducted field-based inventory indicated that the most frequently recorded landslides in northwestern Rwanda are deep-seated landslides which are highly likely linked to the combined effects of groundwater and other hydrogeological factors. The critical positive deviation of groundwater levels up to 3 m from the mean was noticed to be the range in which most landslide activity happens in the studied region. However, Van Asch et al. (1999) highlighted that deep-seated landslides at about 5–20 m depth are induced by rising groundwater level, with about 4 m below the ground surface being the critical threshold for landslide reactivation. Hong and Wan (2011) and Duan et al. (2019) forecasted the groundwater fluctuation and indicated that landslides are likely to occur when groundwater level increases by about 8 m from the datum. Even so, these absolute threshold values were not statistically approved using appropriate landslide threshold definition techniques.
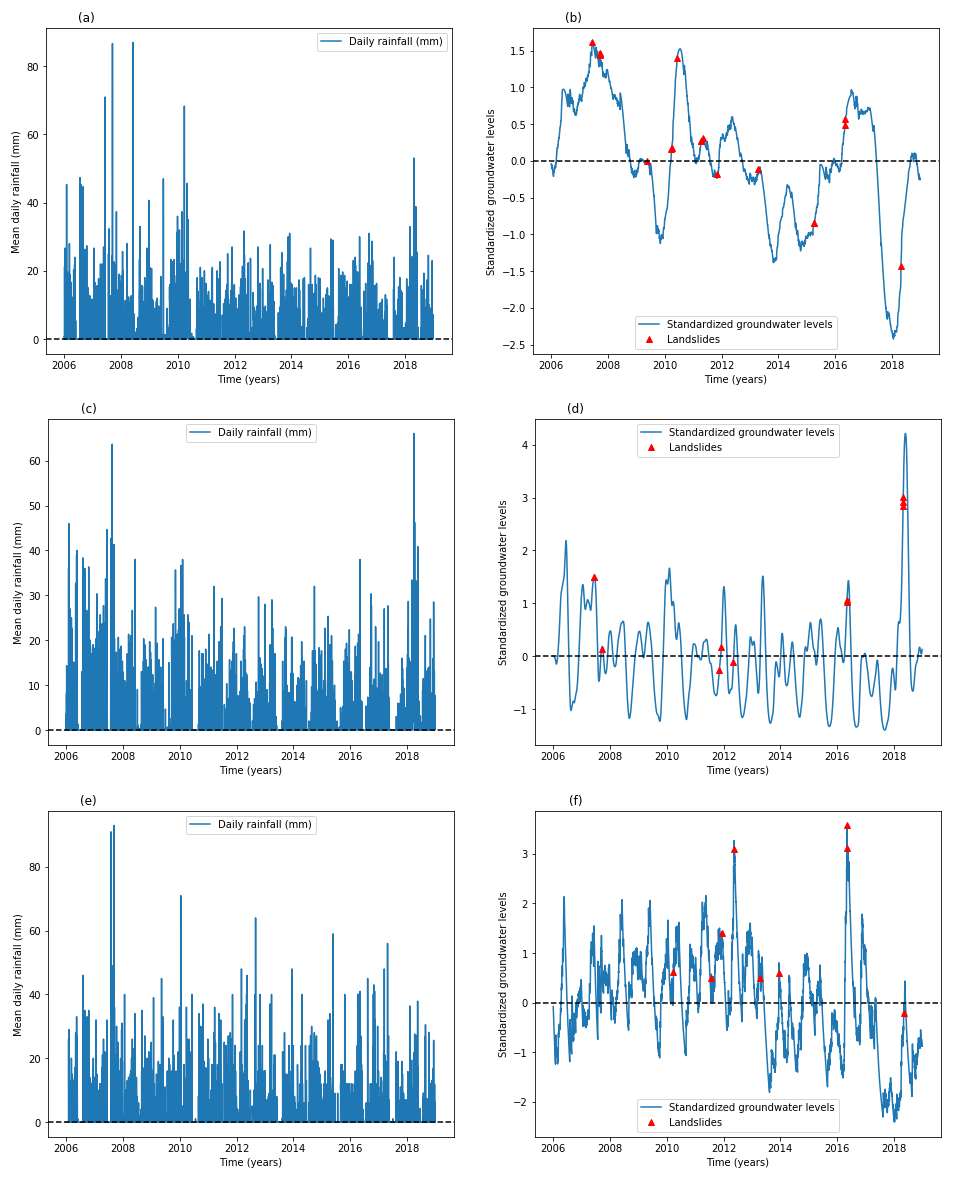
Figure 5(a) Mean daily catchment rainfall and (b) catchment mean standardized groundwater simulated with TFN model using meteorological data from Kivu catchment as model inputs, (c) mean daily catchment rainfall and (d) catchment mean standardized groundwater simulated with TFN model using meteorological data from upper Nyabarongo catchment as model inputs, and (e) mean daily catchment rainfall and (f) catchment mean standardized groundwater simulated with TFN model using meteorological data from Mukungwa catchment as model inputs; landslides represented with red dots.
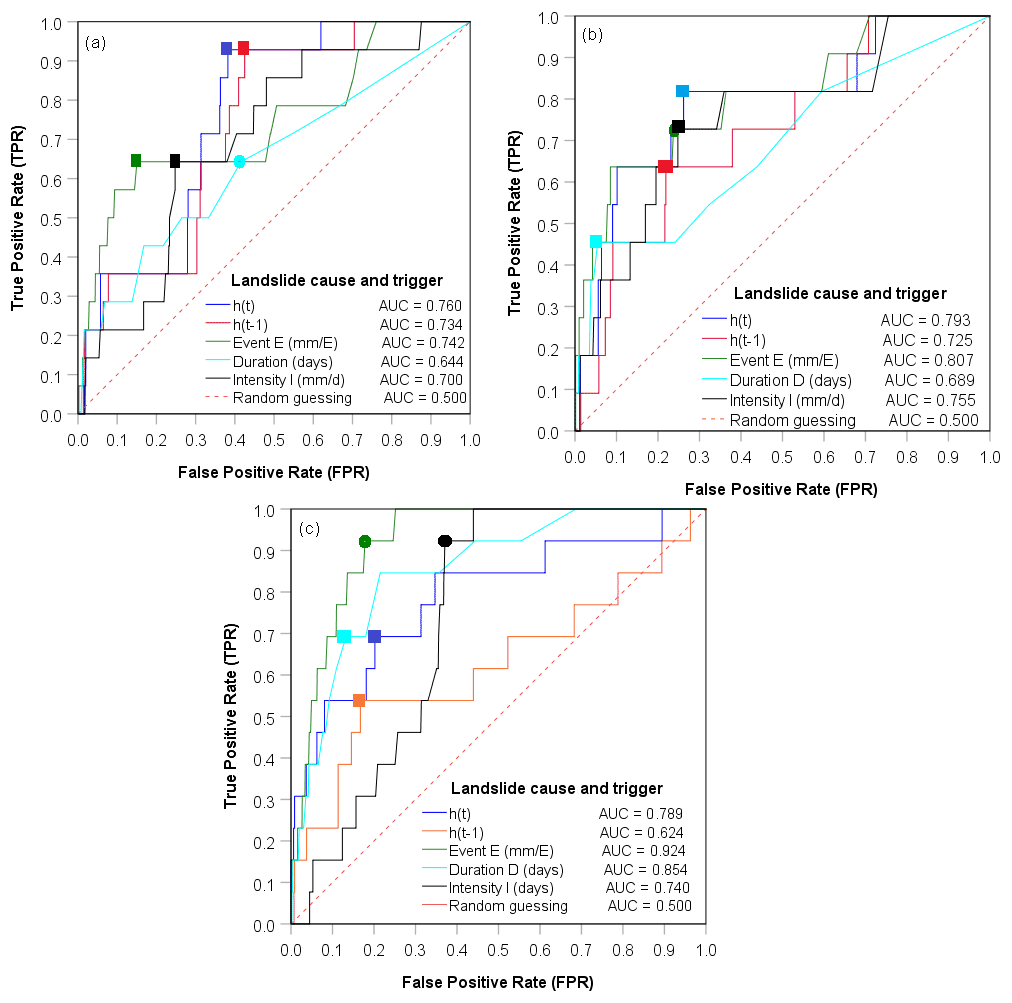
Figure 6Receiver operating characteristic (ROC) curves and area under the curve (AUC) for each landslide predictor variable in the studied catchments: (a) Kivu, (b) upper Nyabarongo, and (c) Mukungwa. The optimum thresholds defined using the maximum true skill statistics (TSS) are presented with square-shaped markers, while circle-shaped markers are thresholds defined with the minimum radial distance (Rad); once TSS and Rad reveal different threshold values, the optimum (with maximum TPR and minimum FPR) is kept; once TSS and Rad reveal similar threshold values, only the square-shaped marker (TSS) is kept. The corresponding balance of true and false positive rates is also presented.
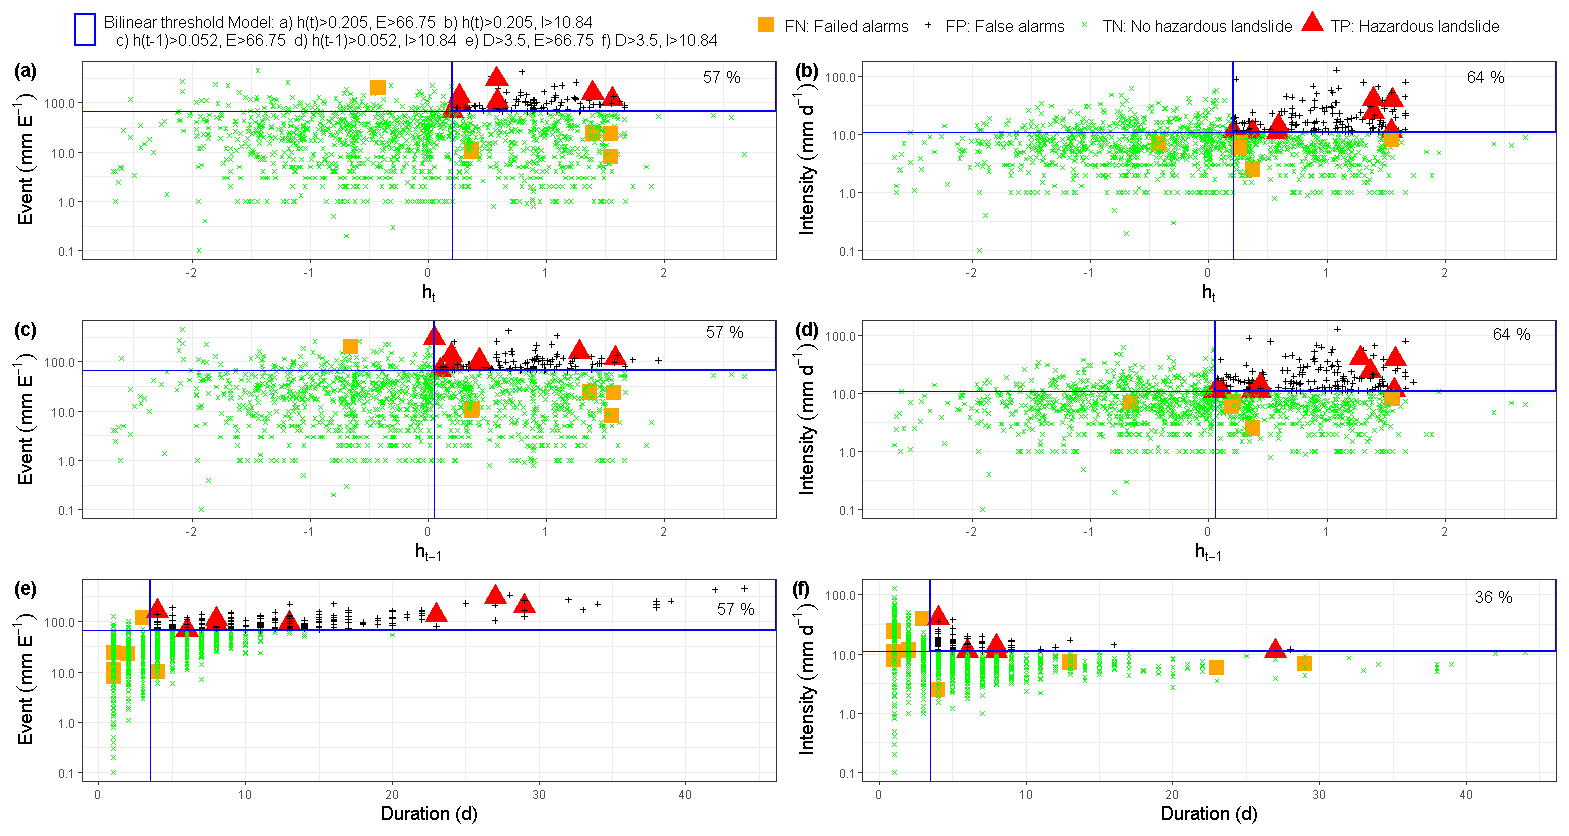
Figure 7Landslide warning capabilities of the hydro-meteorological and precipitation threshold models: (a) ht–E, (b) ht–I, (c) ht−1–E, (d) ht–E, (e) E–D, and (f) I–D in Kivu catchment.
4.3 Landslide predictor variables and their discriminatory power
The discriminatory power of each landslide predictor variable was evaluated using ROC curves and AUC metrics, as presented in Fig. 6. Based on the results, the standardized groundwater levels ht modeled on a landslide day with AUC between 0.76–0.80 and the event rainfall volume E whose AUC ranges from 0.74–0.93 were identified as the hydrological and meteorological variables with the highest discriminatory power to distinguish landslide from no-landslide conditions and thus the most dominant control on landslide occurrence in the studied region. The standardized groundwater levels ht−1 recorded prior to the landslide triggering event, with AUC ranging from 0.63–0.74, were not as significant as ht. This is likely a consequence of the hydrogeological properties of soil such as soil texture, presence of fissures, porosity, and permeability that contribute to aquifer leakage, drainage, and seepage of longer cumulated groundwater levels. Although the AUC metric was used to identify the variable with the highest skill to distinguish landslide from no-landslide conditions, it does not indicate the optimum threshold levels above which landslides are highly likely to occur. Therefore, the maximum true skill statistics (TSS) and minimum radial distance (Rad) statistical metrics were used to identify the optimum thresholds represented by the dots on the ROC curves, and the corresponding balance of TPR and FPR is presented in Fig. 6 and detailed in Table 1. The maximum TSS and minimum Rad indicated, for example, that landslides are highly likely to occur when standardized groundwater levels ht positively deviate by about 0.21 to 0.48 from the long-term mean, and these threshold levels resulted in about 82 %–93 % of correct predictions of landslides, i.e., true positive rate, and about 26 %–38 % of false positive rate. Similarly, both TSS and Rad indicated 66.8 mm per event as the optimum threshold rainfall volume E with 64 % of true positive rate and 15 % of false positive rate in Kivu catchment. However, the optimum thresholds E between 44.7–63.5 mm per event were defined by Rad in upper Nyabarongo and Mukungwa catchments and correctly predict about 73 %–92 % of landslides with a 18 %–24 % false positive rate. These findings indicated that the statistical metrics TSS and Rad lead to quite similar results, expressing their identical capabilities in landslide threshold definitions.
Table 1Single variable landslide threshold definition with the maximum true skill statistics (TSS) and minimum radial distance (Rad) and their predictive power.
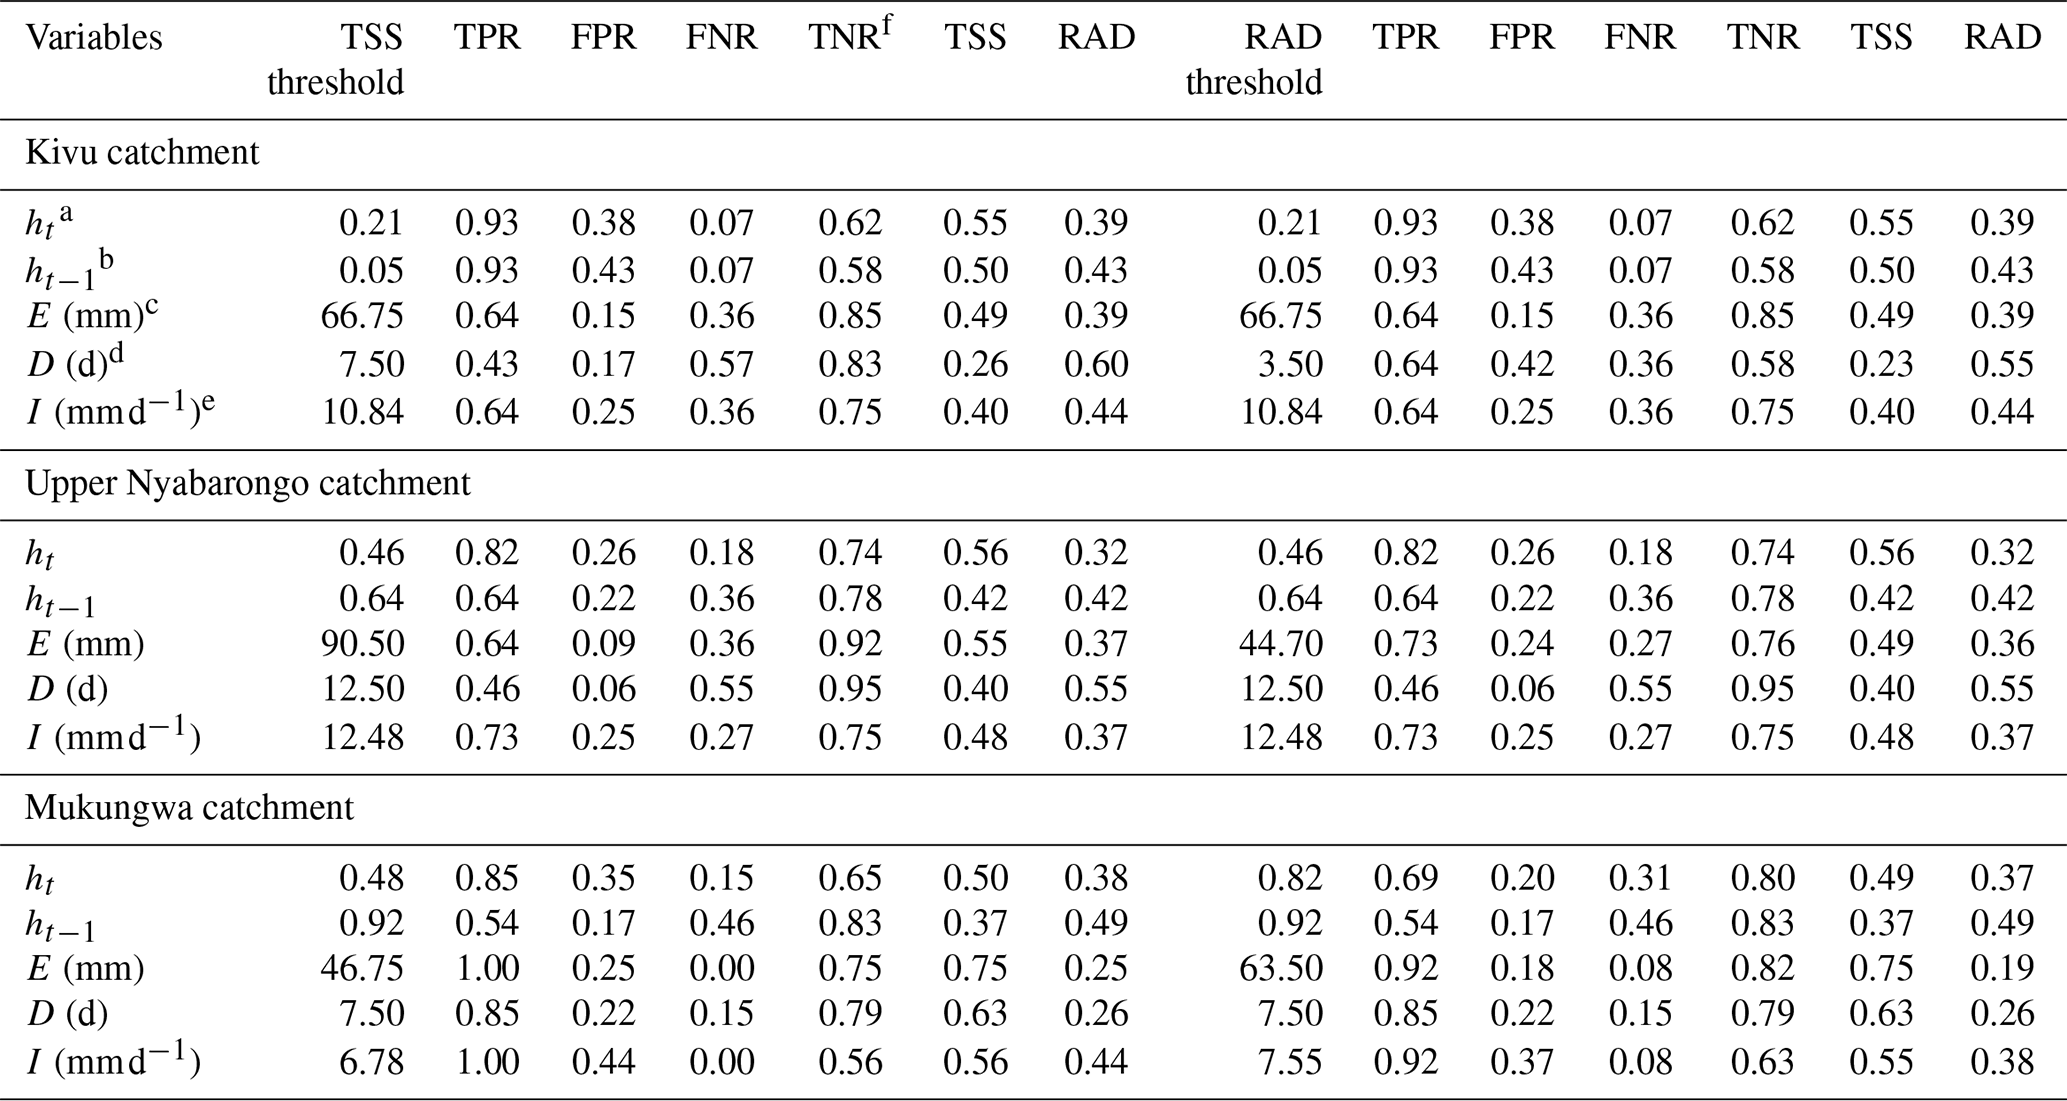
a Groundwater levels recorded on the day of landslide. b Groundwater levels recorded prior to landslide triggering event. c Event rainfall volume. d Event duration. e Event rainfall intensity. f True negative rate.
4.4 Comparative prediction power of single variable and bilinear threshold models
This research identified the landslide thresholds for each predictor variable, including the hydrological variables ht and ht−1 and meteorological variables E, I, and D. The landslide predictive capability was evaluated for each variable in 1D, here considered as the single variable threshold models presented in Table 1 and each of the blue lines in Figs. 7–9. The landslide predictive capability was also evaluated through a combination of variables in 2D as X–Y pairs, here considered as the bilinear threshold models summarized in Table 2 and the intersection of both blue lines in Figs. 7–9. Postance and Hillier (2017) indicate that the basic strategy for the selection of an accurate landslide threshold model is to choose the one that offers the greatest level of TPR alarms and that provides the lowest false negative rate (FNR) and FPR. Therefore, the findings of this research indicated that either hydrological or meteorological single variable threshold models have the greatest landslide predictive capability in terms of elevated true positive rate and low level of failed alarms as compared to the bilinear threshold models. For example with groundwater level modeled on landslide day ht with threshold values between 0.2–0.48 above the mean, 82 %–93 % of landslides were correctly predicted (TPR), and 25 %–38 % were incorrectly predicted landslides (FPR). Similarly, the event rainfall intensity I between 7.5–12.5 mm d−1 as single variable thresholds was able to correctly predict 64 %–92 % of landslides with 25 %–37 % as false alarms. Contrarily, the resulting bilinear threshold models ht–I were able to correctly predict 64 %–85 % with a 8 %–15 % FPR. The greatest landslide prediction capability of single variable threshold models in terms of TPR was also noticed in previously conducted research in Rwanda (Uwihirwe et al., 2020). However, it was noticed that relying on single variable threshold models that are exclusively defined using precipitation variables like event rainfall volume E and event intensity I, considered as landslide triggers, could lead to biased results due to the fact that many landslides occur not only due to the trigger itself but rather to a combination of both trigger and pre-event hydrological conditions. Contrarily, relying on single variable threshold models exclusively defined using hydrological variables like groundwater levels ht could lead to unbiased landslide predictions due to their high consideration of long-term antecedent conditions until the day of landslide occurrence. The bilinear threshold models lead to a minimized level of FPR which is the main focus behind the cause–trigger and bilinear threshold concepts proposed by Bogaard and Greco (2018) and Mirus et al. (2018a) with a rather reduced TPR.
Table 2Landslide bilinear threshold model and warning capabilities.

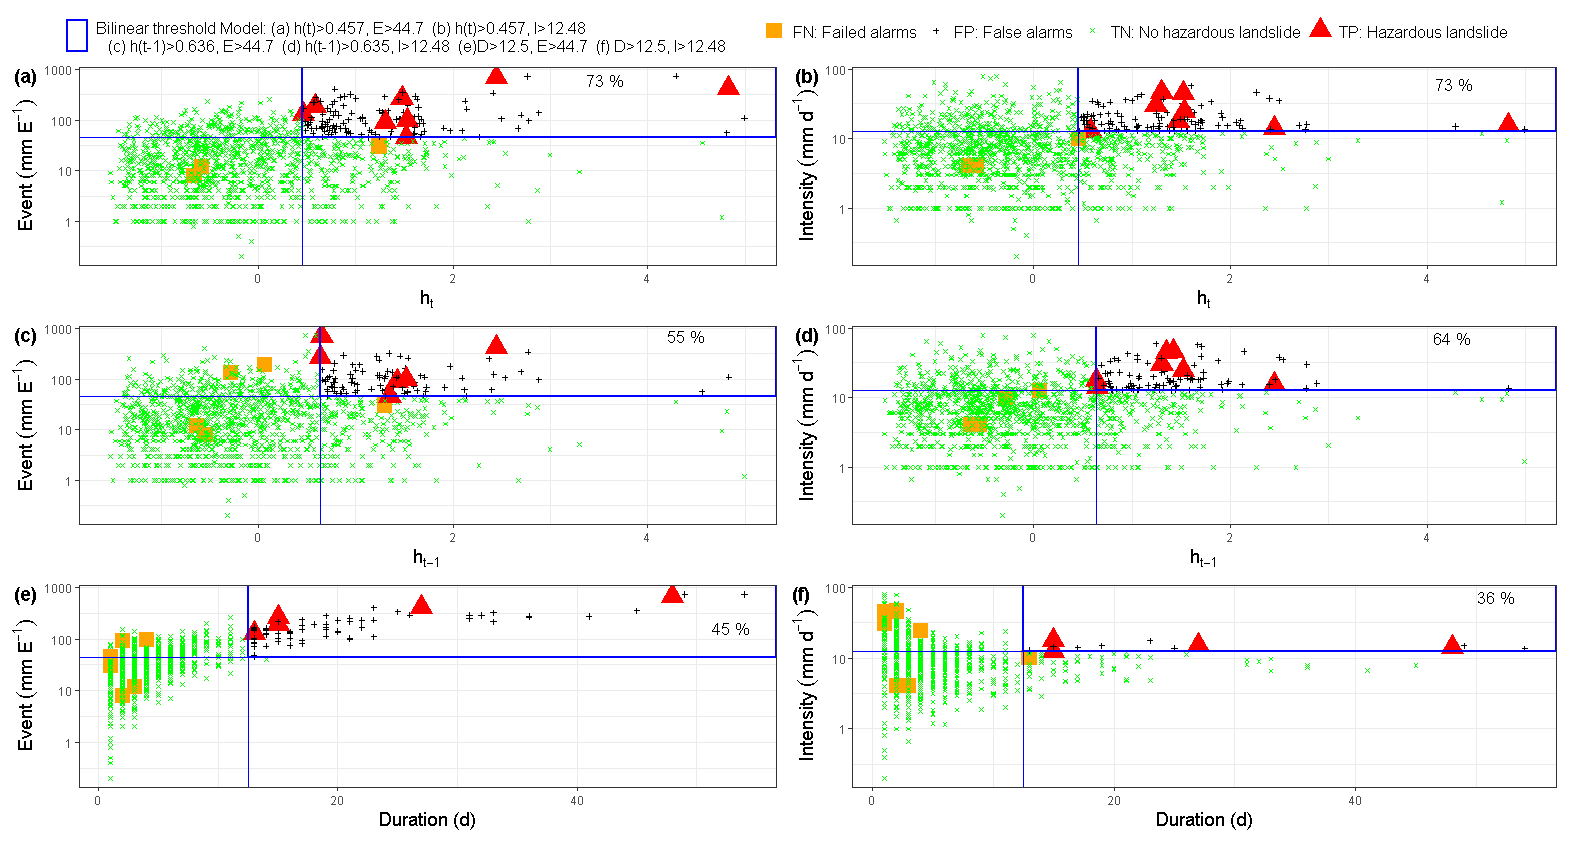
Figure 8Landslide warning capabilities of the hydro-meteorological and precipitation threshold models: (a) ht–E, (b) ht–I, (c) ht−1–E, (d) ht–E, (e) E–D, and (f) I–D in upper Nyabarongo catchment.

Figure 9Landslide warning capabilities of the hydro-meteorological and precipitation threshold: (a) ht–E, (b) ht–I, (c) ht−1–E, (d) ht–E, (e) E–D, and (f) I–D in Mukungwa catchment.
4.5 Comparative analysis of the warning capabilities of landslide hydro-meteorological thresholds and precipitation-based thresholds
The landslide hydro-meteorological threshold models defined as X–Y pairs in a 2D bilinear framework and their warning capabilities in Kivu catchment are presented in Fig. 7. The combined groundwater level–event rainfall intensity (ht–I; ht>0.205, I>10.84 mm d−1) threshold model outperforms other combinations in terms of true positive alarms with about 64 %. Comparing the predictive capabilities of ht–I, a hydro-meteorological threshold model, to I–D, a precipitation threshold model, a significant improvement of about 28 % in terms of the rate of true alarms was obtained from ht–I as compared to I–D. This confirms the high landslide prediction and warning capability of hydro-meteorological thresholds over precipitation-based thresholds. However, there was no significant improvement from E–D to ht–E and ht−1–E in terms of true alarms. This suggests that the combinations involving event rainfall volume E have lower landslide warning skill than the ones that consider the event rainfall intensity I. This may be explained by the fact that rainfall event volume E is estimated over various timescales D making E an unstandardized variable which could be normalized by the respective time duration, thus favoring the event rainfall intensity I. Unexpectedly, there was no significant improvement in terms of reduced FPR alarms by the tested landslide hydro-meteorological threshold models as compared to the precipitation-based threshold models in Kivu catchment.
The defined landslide hydro-meteorological threshold models in upper Nyabarongo catchment are presented in Fig. 8. Similar to Kivu catchment, the landslide hydro-meteorological threshold models ht–E, ht–I, ht−1–E, and ht−1–I perform much better with 55 %–73 % of correctly predicted landslides (TP) compared to precipitation threshold models E–D and I–D with around 36 %–45 % of true alarms. A significant reduction in the rate of failed/missed alarms (FN) with about 37 % from I–D to ht–I and about 28 % from E–D to ht–E was also observed. Unexpectedly, there was no significant improvement in terms of reduced false alarms by the landslide hydro-meteorological thresholds as compared to the landslide precipitation thresholds.
The defined landslide hydro-meteorological threshold models in Mukungwa catchment are shown in Fig. 9. Although there was no significant improvement in terms of FP alarms reduction as expected, the best landslide hydro-metrological threshold model ht–I outperforms the precipitation-based threshold I–D models in terms of elevated rate of TP alarms with about 85 % as compared to 77 % and low rate of FN alarms with 15 % compared to 23 %. The highest prediction level in terms of true alarms with 85 % was observed from both ht–I and E–D hydro-meteorological and precipitation-based threshold models. Contrary to Kivu and upper Nyabarongo catchments, precipitation-based threshold models E–D and I–D performed quite similar to ht–I and even better than other tested hydro-meteorological threshold models in Mukungwa catchment. This could be explained by the catchment-specific hydrogeological characteristics that probably make the catchment a very slow groundwater responding system and thus a rather more precipitation-induced than groundwater-induced landslide system.
4.6 Adaptability and limitation of the defined landslide threshold models
Within the framework of this research, we defined the landslide empirical hydro-meteorological thresholds using continuous historical precipitation time series and groundwater level time series as proxies for the catchment water storage. We mainly analyzed the difference in landslide thresholds and warning capabilities as a result of the differences in catchment water storage, estimated from the groundwater responses to precipitation. It was observed that for the catchment with a complex or slow groundwater responding system such as Mukungwa, the warning capability of the groundwater-based thresholds has weaker performance as compared to the fast and clear groundwater responding systems like Nyabarongo and Kivu catchments. This is truly owed to the catchment-specific hydrogeological and geomorphological characteristics. Nevertheless, the in-depth analysis of the hydrogeological and geomorphological differences between the three catchments and how they could be among the explanatory factors of the observed difference in landslide thresholds and the warning capabilities was not fully conducted. However, with reference to Fig. 1 and Appendix B, Mukungwa catchment is hydrogeologically characterized by a complex aquifer in volcanic rocks and is thus a complex or slow groundwater responding system. This is probably due to the weathering products of volcanic rocks that produce a relatively permeable top layer but tend to form a low-permeability layer of brecciated or intruded sills at shallow depths, thus hampering deep groundwater recharge. Contrarily, Nyabarongo and Kivu catchments are dominated by fractured granites with overall high transmissivity and recharge and are hence fast and clear groundwater responding systems (Appendix B). The weathering products of granites are generally coarse grained that tend to develop and preserve open-joint systems that increase permeability and thus fast groundwater response. In Nyabarongo and Kivu catchments, therefore, the landslide warning capability of groundwater-based thresholds performed higher than precipitation thresholds as opposed to Mukungwa catchment. This is to say that in regions with very slow groundwater responding systems where rainfall-induced shallow landslides prevail, precipitation-based thresholds can still practically be useful for landslide prediction and warning. However, the need for hydrological thresholds is true for both shallow- and deep-seated landslides (Cascini et al., 2010; Corominas et al., 2005; Duan et al., 2019; Hong and Wan, 2011), which are thus more powerful than precipitation-based thresholds. More studies also confirm the high warning capability of hydro-meteorological thresholds over precipitation-based thresholds after incorporation of either soil moisture or catchment storage (Ciavolella et al., 2016; Mirus et al., 2018a; Prenner et al., 2018; Thomas et al., 2019; Wicki et al., 2020). According to Uwihirwe et al. (2020), a study conducted in Rwanda to define precipitation thresholds, the highest predictive capability of precipitation-based thresholds in a bilinear framework that used the antecedent precipitation (API) and event rainfall intensity (I) as API30–I was about 68 % of true alarms and 27 % of false alarms. However, this prediction level was further improved through this research by considering the catchment-specific groundwater levels where the best predictor ht–I was able to correctly predict 85 % of landslides (TP) and 15 % of false alarms. Although the catchment water storage would have been a better landslide predictor, this type of information is scarce. Therefore, the groundwater level was considered as a proxy and used as a hydrological landslide predictor variable in our research. The component of groundwater has been on the one hand considered as a landslide triggering factor and on the other hand as a landslide predisposing factor (Cascini et al., 2010; Corominas et al., 2005; Duan et al., 2019; Hong and Wan, 2011). Being a hydrological parameter, it was subjectively considered as a landslide predisposing factor and plotted on the x axis of a 2D plot as a cause in a cause–trigger framework. However, the neutral use of groundwater levels (neither trigger nor cause) in a single variable threshold model ht provided excellent prediction results of up to 93 % of correctly predicted landslide and only 7 % of failed alarms with a rather high rate of false alarms of up to 38 %. The adopted approach for a hydro-meteorological and/or bilinear threshold model definition aimed to reduce the rate of false alarms associated with single variable thresholds and follows the cause–trigger concept (Bogaard and Greco, 2018) in which the groundwater levels as cause were combined with precipitation variables as trigger in a bilinear framework (Mirus et al., 2018a). We have tested different combinations of the optimum hydrological and meteorological threshold variables such as ht–E, ht–I, ht−1–E, and ht−1–I, and the combination of groundwater levels on the day of landslide and event rainfall intensity ht–I proved to have higher skill for landslide prediction and warning with a high rate of true alarms (64 %–85 %) and reduced rate of false alarms (8 %–15 %) as compared to other combinations. We remain convinced that the combination of appropriate threshold variables into a cause–trigger framework should consider the timescale of each variable to avoid overlapping timescales between hydrological and meteorological variables. However, the combinations of ht–E and ht–I may lead to overlapping timescales between groundwater levels and rainfall event. This would be very true for longer timescale triggers and very fast groundwater responding systems with very short time memory, which was not the case in our studied catchments. To account for this constraint, we have also considered the groundwater level recorded prior to landslide triggering event combinations ht−1–E and ht−1–I, but the result was not as significant as ht–E and ht–I. In this research, the single variable and bilinear threshold models were adopted rather than power-law models commonly used in landslide precipitation threshold like intensity–duration and event–duration. These single variable and bilinear threshold models were selected based on our dataset that displays most of the landslide conditions in the upper-right corner of the plots shown in Figs. 7–9 and the achieved landslide predictive capabilities summarized in Tables 1 and 2. Although one is free to choose any other model that fits the dataset, the single variable and bilinear threshold models proved to be more efficient for the hydro-meteorological threshold model definition (Mirus et al., 2018a; Uwihirwe et al., 2020). Furthermore, the TFN time series model was used for groundwater modeling because of its simplicity, fewer data requirements, and above all its higher skill in groundwater simulation (Bakker and Schaars, 2019; Collenteur et al., 2019). However, like other models, 100 % of the observed data cannot fit the model. Therefore, the modeled groundwater data used to define the hydro-meteorological threshold may be prone to minor errors. Additionally, the spatial extrapolation of groundwater information relied on the main assumption that other hydro-geomorphological parameters do not exhibit spatial variability within the individual catchment. This is an assumption made given the data scarcity in the East African Rift region in general (Monsieurs et al., 2018) and Rwanda in particular. Lastly, the landslide inventory used for this study relied largely on the information from government reports, newspapers, and other media in which many landslide events are likely to be missed. Although the reliance on these data sources is likely to lead to a bias towards larger landslide events and those with an impact on society, this landslide inventory is the most comprehensive currently available in the study area.
This research aimed to improve the landslide forecast quality by incorporating the catchment-specific groundwater levels as a proxy for regional water storage. A parsimonious transfer function noise (TFN) time series model was used to simulate the groundwater levels that temporally match with the available landslide inventory. Based on the statistical measures of goodness of fit, the root mean square error (RMSE values of groundwater levels <0.5 m), and the explained variance (R2>60 %), the TFN time series model demonstrates sufficient skill to simulate groundwater levels. The standardized groundwater levels ht modeled on a landslide day with AUC between 0.76–0.80 and the event rainfall volume E whose AUC ranges from 0.74–0.93 were identified as the hydrological and meteorological variables with the highest discriminatory power to distinguish landslide from no-landslide conditions, and they are thus the most dominant control on landslide occurrence in the studied region. The single variable threshold model derived from groundwater levels ht indicated the highest landslide prediction and/or warning capability with about 85 %–93 % of true positive alarms despite the resulting rate of false alarms between 26 %–38 %. Similarly, the single variable threshold models derived from precipitation intensity I and volume E reveal also great landslide predictive skill in terms of true positive alarms at about 64 %–100 % and false alarms at 15 %–44 %. However, it was noticed that relying on single variable threshold models exclusively derived from precipitation variables like E and I considered as landslide triggers could lead to biased results because of the fact that many landslides occur due to not only the trigger itself but rather a combination of both trigger and pre-event hydrological conditions. Contrarily, relying on single variable threshold models exclusively defined using hydrological variables like groundwater ht leads to unbiased landslide predictions due to their high consideration of long-term antecedent conditions until the day of landslide occurrence. The further combination of the optimum groundwater and precipitation thresholds as bilinear threshold models reduced the rate of false alarms by about 18 %–28 % at the expense of a reduced rate of true positive alarms by about 9 %–29 %, and it is thus less advantageous than single variable threshold models. However, the hydro-meteorological threshold models defined in the bilinear framework as ht–I indicated greater landslide predictive skill in terms of true positive alarms (64 %–85 %) than the traditional threshold model I–D (36 %–77 %) that exclusively relies on precipitation. Furthermore, the integration of catchment-specific groundwater levels in landslide hazard assessment in Rwanda improved the landslide prediction and warning capabilities of the existing precipitation-based threshold that used the API as a proxy for a hydrological condition and event intensity I for a meteorological condition. Overall, the incorporation of observed and model-derived groundwater variables in an empirical statistical approach and the use of region-specific hydrological characteristics improve the landslide prediction capacity as compared to the exclusive use of global precipitation-based threshold models.
Table A1Final values of the calibrated parameters.
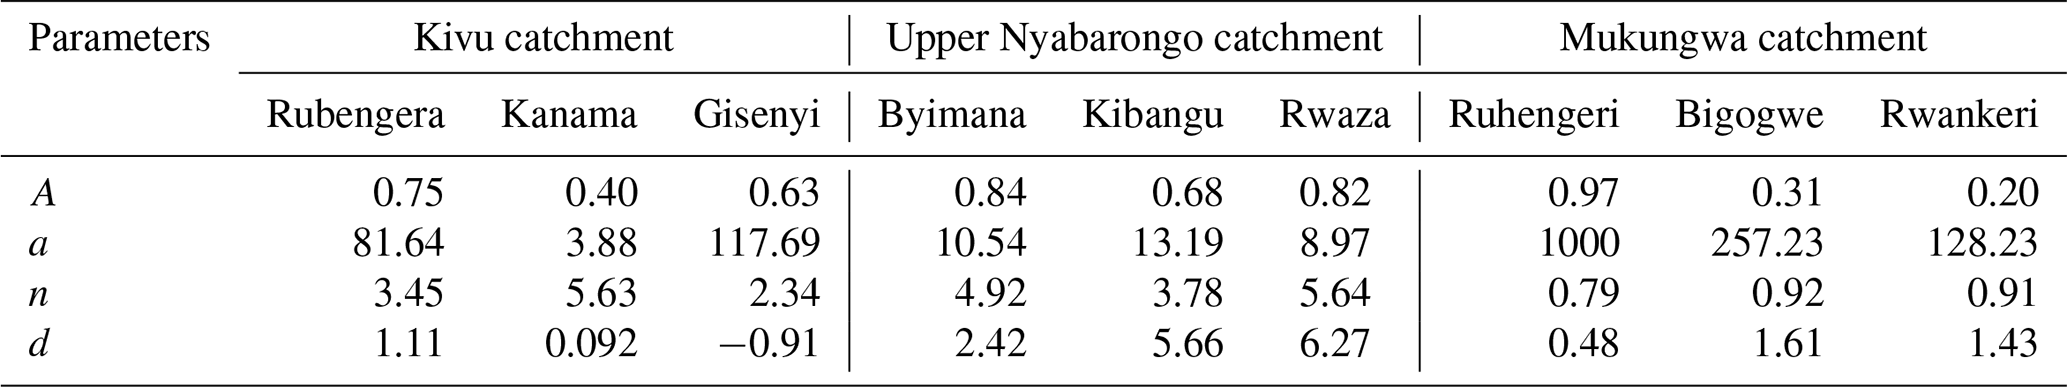
A denotes the scaling factor (–), a and n are shape parameters (–), and d is the base elevation of the model (–) as described in Sect. 3.1.3.

Figure B1Groundwater response function (a) block response and (b) step response to both rainfall and potential evaporation recorded from three landslide-representative meteorological stations in Kivu catchment, (c) block response and (d) step response to both rainfall and potential evaporation recorded from three landslide-representative meteorological stations in upper Nyabarongo catchment, and (e) block response and (f) step response to both rainfall and potential evaporation recorded from three landslide-representative meteorological stations in Mukungwa catchment.
The datasets for this research can be accessed at https://doi.org/10.4121/15040446.v1 (Uwihirwe, 2021).
JU collected data, implemented the modeling approaches, conducted statistical analysis, and conceptualized and prepared the manuscript outline. MS corrected the manuscript outline, shaped the discussion, and contributed to the perfection of the manuscript. TAB proposed the modeling approaches, verified the model outputs, shaped the manuscript outline, and contributed to the perfection of the manuscript.
The contact author has declared that neither they nor their co-authors have any competing interests.
Publisher's note: Copernicus Publications remains neutral with regard to jurisdictional claims in published maps and institutional affiliations.
We are so thankful to the Landslide Inventory for the central section of the Western branch of the East African Rift (LIWEAR) project for sharing the landslide inventory. We are thankful to the Rwanda meteorological agency and water resource board for offering access to the meteorological and hydrological datasets used for this research.
This paper was edited by Paolo Tarolli and reviewed by Roberto Valentino and Giulio Castelli.
Bakker, M. and Schaars, F.: Solving Groundwater Flow Problems with Time Series Analysis: You May Not Even Need an other Model, National Ground Water Association, 57, 826–833, https://doi.org/10.1111/gwat.12927, 2019.
Berti, M., Martina, M. L. V., Franceschini, S., Pignone, S., Simoni, A., and Pizziolo, M.: Probabilistic rainfall thresholds for landslide occurrence using a Bayesian approach, J. Geophys. Res.-Earth, 117, F04006, https://doi.org/10.1029/2012JF002367, 2012.
Bishop, A. W.: Some Factors Controlling the Pore Pressures set up during the Construction of Earth Dams, Imperial College, University of London, https://doi.org/10.1680/geot.1954.4.4.148, 1954.
Bogaard, T. and Greco, R.: Preface “Hillslope hydrological modelling for landslides prediction,” Hydrol. Earth Syst. Sci., 18, 4185–4188, https://doi.org/10.5194/hess-18-4185-2014, 2014.
Bogaard, T. and Greco, R.: Invited perspectives: Hydrological perspectives on precipitation intensity-duration thresholds for landslide initiation: proposing hydro-meteorological thresholds, Nat. Hazards Earth Syst. Sci., 18, 31–39, https://doi.org/10.5194/nhess-18-31-2018, 2018.
Bogaard, T. A. and Greco, R.: Landslide hydrology: from hydrology to pore pressure, WIREs Water 3, 439–459, https://doi.org/10.1002/wat2.1126, 2015.
Bronnimann, C. S.: Effect of Groundwater on Landslide Triggering, École Polytechnique Federale de Lausanne, https://core.ac.uk/download/pdf/147975151.pdf (last access: 16 April 2021), 2011.
Brunetti, M. T., Peruccacci, S., Rossi, M., Luciani, S., Valigi, D., and Guzzetti, F.: Rainfall thresholds for the possible occurrence of landslides in Italy, Nat. Hazards Earth Syst. Sci., 10, 447–458, https://doi.org/10.5194/nhess-10-447-2010, 2010.
Caine, N.: The Rainfall Intensity : Duration Control of Shallow Landslides and Debris Flows, JSTOR, 62, 23–27, https://www.jstor.org/stable/pdf/520449.pdf?refreqid=excelsior:a194dd220014eb4f33bd3ea4ff9483cd (last access: 20 May 2022), 1980.
Cascini, L., Calvello, M., and Grimaldi, G. M.: Groundwater Modeling for the Analysis of Active Slow-Moving Landslides, J. Geotech. Geoenviron., 136, 1220–1230, https://doi.org/10.1061/(asce)gt.1943-5606.0000323, 2010.
Ciavolella, M., Bogaard, T., Gargano, R., and Greco, R.: Is there Predictive Power in Hydrological Catchment Information for Regional Landslide Hazard Assessment?, Proced. Earth Plan. Sc., 16, 195–203, https://doi.org/10.1016/j.proeps.2016.10.021, 2016.
Collenteur, R. A., Bakker, M., Caljé, R., Klop, S. A., and Schaars, F.: Pastas: Open Source Software for the Analysis of Groundwater Time Series, Groundwater, 57, 877–885, https://doi.org/10.1111/gwat.12925, 2019.
Corominas, J., Moya, J., Ledesma, A., Lloret, A., and Gili, J. A.: Prediction of ground displacements and velocities from groundwater level changes at the Vallcebre landslide (Eastern Pyrenees, Spain), Landslides, 2, 83–96, https://doi.org/10.1007/s10346-005-0049-1, 2005.
Crozier, M. J.: Prediction of rainfall-triggered landslides: a test of the antecedent water status model, Earth Surf. Proc. Land., 833, 825–833, 1999.
Duan, G., Chen, D., and Niu, R.: Forecasting groundwater level for soil landslide based on a dynamic model and landslide evolution pattern, Water, 11, 2163, https://doi.org/10.3390/w11102163, 2019.
Fathani, T. F., Karnawati, D., and Wilopo, W.: An integrated methodology to develop a standard for landslide early warning systems, Nat. Hazards Earth Syst. Sci., 16, 2123–2135, https://doi.org/10.5194/nhess-16-2123-2016, 2016.
Guzzetti, F., Peruccacci, S., Rossi, M., and Stark, C. P.: Rainfall thresholds for the initiation of landslides in central and southern Europe, Meteorol. Atmos. Phys., 98, 239–267, https://doi.org/10.1007/s00703-007-0262-7, 2007.
Guzzetti, F., Peruccacci, S., Rossi, M., and Stark, C. P.: The rainfall intensity-duration control of shallow landslides and debris flows: An update, Landslides, 5, 3–17, https://doi.org/10.1007/s10346-007-0112-1, 2008.
Hong, M., Kim, J., and Jeong, S.: Rainfall intensity-duration thresholds for landslide prediction in South Korea by considering the effects of antecedent rainfall, Landslides, 15, 523–534, https://doi.org/10.1007/s10346-017-0892-x, 2017.
Hong, Y. M. and Wan, S.: Forecasting groundwater level fluctuations for rainfall-induced landslide, Nat. Hazards, 57, 167–184, https://doi.org/10.1007/s11069-010-9603-9, 2011.
Kuriakose, S. L.: Physically-based dynamic modelling of the effect of land use changes on shallow landslide initiation in the Western Ghats of Kerala, India, PhD Thesis, University of Twente, the Netherlands, ISBN 978-90-6164-298-5, 2010.
Ma, T., Li, C., Lu, Z., and Bao, Q.: Rainfall intensity–duration thresholds for the initiation of landslides in Zhejiang Province, China, Geomorphology, 245, 193–206, https://doi.org/10.1016/j.geomorph.2015.05.016, 2015.
Marino, P., Peres, D. J., Cancelliere, A., Greco, R., and Bogaard, T. A.: Soil moisture information can improve shallow landslide forecasting using the hydrometeorological threshold approach, Landslides, 17, 2041–2054, https://doi.org/10.1007/s10346-020-01420-8, 2020.
Melillo, M., Brunetti, M. T., Peruccacci, S., Gariano, S. L., Roccati, A., and Guzzetti, F.: A tool for the automatic calculation of rainfall thresholds for landslide occurrence, Environ. Modell. Softw., 105, 230–243, https://doi.org/10.1016/j.envsoft.2018.03.024, 2018.
Mirus, B., Morphew, M., and Smith, J.: Developing Hydro-Meteorological Thresholds for Shallow Landslide Initiation and Early Warning, Water-Sui, 10, 1274, https://doi.org/10.3390/w10091274, 2018a.
Mirus, B. B., Becker, R. E., Baum, R. L., and Smith, J. B.: Integrating real-time subsurface hydrologic monitoring with empirical rainfall thresholds to improve landslide early warning, Landslides, 15, 1909–1919, https://doi.org/10.1007/s10346-018-0995-z, 2018b.
Monsieurs, E., Liesbet, J., Michellier, C., Tchangabo, B. J., Ganza, B. G., Bibentyo, M. T., Kervyn, M., Mateso, M. J.-C., Nkurunziza, P., Ndayisenga, A., Buzera, K. C., Nahimana, L., Wim, T., Demoulin, A., Kervyn, M., and Dewitte, O.: Landslide inventory for hazard assessment in a data–poor context: a regional-scale approach in a tropical African environment, Landslides, 15, 2195–2209, https://doi.org/10.1007/s10346-018-1008-y, 2018.
Monsieurs, E., Dewitte, O., and Demoulin, A.: A susceptibility-based rainfall threshold approach for landslide occurrence, Nat. Hazards Earth Syst. Sci., 19, 775–789, https://doi.org/10.5194/nhess-19-775-2019, 2019a.
Monsieurs, E., Dewitte, O., Depicker, A., and Demoulin, A.: Towards a Transferable Antecedent Rainfall – Susceptibility Threshold Approach for Landsliding, Water-Sui, 11, 2202, https://doi.org/10.3390/W11112202, 2019b.
Mostbauer, K., Kaitna, R., Prenner, D., and Hrachowitz, M.: The temporally varying roles of rainfall, snowmelt and soil moisture for debris flow initiation in a snow-dominated system, Hydrol. Earth Syst. Sci., 22, 3493–3513, https://doi.org/10.5194/hess-22-3493-2018, 2018.
Nieuwenhuis, R., Taylor, E., Nieuwenhuis, R., Mugunga, R., and Mahirwe, B.: IWRM Programme Rwanda, the Netherlands, https://waterportal.rwb.rw/sites/default/files/2019-07/Catchment Plan Manual_v6_complete.pdf (last access: 2 June 2021), 2019.
Pecoraro, G., Calvello, M., and Piciullo, L.: Monitoring strategies for local landslide early warning systems, Landslides, 16, 213–231, https://doi.org/10.1007/s10346-018-1068-z, 2019.
Peres, D. J., Cancelliere, A., Greco, R., and Bogaard, T. A.: Influence of uncertain identification of triggering rainfall on the assessment of landslide early warning thresholds, Nat. Hazards Earth Syst. Sci., 18, 633–646, https://doi.org/10.5194/nhess-18-633-2018, 2018.
Peruccacci, S., Brunetti, M. T., Gariano, S. L., Melillo, M., Rossi, M., and Guzzetti, F.: Rainfall thresholds for possible landslide occurrence in Italy, Geomorphology, 290, 39–57, https://doi.org/10.1016/j.geomorph.2017.03.031, 2017.
Piciullo, L., Calvello, M., and Cepeda, J. M.: Territorial early warning systems for rainfall-induced landslides, Earth-Sci. Rev., 179, 228–247, https://doi.org/10.1016/j.earscirev.2018.02.013, 2018.
Postance, B. and Hillier, J.: Comparing threshold definition techniques for rainfall-induced landslides: A national assessment using radar rainfall, Earth Surf. Proc. Land., 560, 553–560, https://doi.org/10.1002/esp.4202, 2017.
Prenner, D., Kaitna, R., Mostbauer, K., and Hrachowitz, M.: The Value of Using Multiple Hydrometeorological Variables to Predict Temporal Debris Flow Susceptibility in an Alpine Environment, Water Resour. Res., 54, 6822–6843, https://doi.org/10.1029/2018WR022985, 2018.
Prenner, D., Hrachowitz, M., and Kaitna, R.: Trigger characteristics of torrential flows from high to low alpine regions in Austria, Sci. Total Environ., 658, 958–972, https://doi.org/10.1016/j.scitotenv.2018.12.206, 2019.
Robbins, J. C.: A probabilistic approach for assessing landslide-triggering event rainfall in Papua New Guinea, using TRMM satellite precipitation estimates, J. Hydrol., 541, 296–309, https://doi.org/10.1016/j.jhydrol.2016.06.052, 2016.
Rosi, A., Peternel, T., Jemec-Auflič, M., Komac, M., Segoni, S., and Casagli, N.: Rainfall thresholds for rainfall-induced landslides in Slovenia, Landslides, 13, 1571–1577, https://doi.org/10.1007/s10346-016-0733-3, 2016.
Rwanda Water Portal: https://waterportal.rwb.rw/index.php/data/ground_water, last access: 2 June 2021.
RWFA: Ground water recharge and storage enhancement in the eastern province of Rwanda, Rwanda water and forestry authority, Kigali-RWANDA, https://waterportal.rwb.rw/publications (last access: 2 June 2021), 2019.
Thomas, M. A., Collins, B. D., and Mirus, B. B.: Assessing the Feasibility of Satellite-Based Thresholds for Hydrologically Driven Landsliding, Water Resour. Res., 55, 9006–9023, https://doi.org/10.1029/2019WR025577, 2019.
Thornthwaite, C. W.: An approach toward a rational classification of climate, Am. Geogr. Soc., 38, 55–94, https://www.jstor.org/stable/pdf/210739.pdf?refreqid=excelsior{%}3A568a8e19eb0e98b20b95b0a0e1dac1f4 (last access: 18 February 2019), 1948.
Trigo, R. M., Zêzere, J. L., Rodrigues, M. L., and Trigo, I. F.: The Influence of the North Atlantic Oscillation on rainfall triggering of landslides near Lisbon, Nat. Hazards, 36, 331–354, https://doi.org/10.1007/s11069-005-1709-0, 2005.
Uwihirwe, J.: Data underlying the research of Integration of observed and model derived groundwater levels in landslide threshold models in Rwanda, TU Delft [data set], https://doi.org/10.4121/15040446.v1, 2021
Uwihirwe, J., Hrachowitz, M., and Bogaard, T. A.: Landslide precipitation thresholds in Rwanda, Landslides, 17, 2469–2481, https://doi.org/10.1007/s10346-020-01457-9, 2020.
Van Asch, T. W. J., Buma, J., and Van Beek, L. P. H.: A view on some hydrological triggering systems in landslides, Geomorphology, 30, 25–32, https://doi.org/10.1016/S0169-555X(99)00042-2, 1999.
van Beek, R.: Assessment of the influence of changes in land use and climate on landslide activity in a Mediterranean environment, Universiteit Utrecht, the Netherlands, ISBN 90-6809-329-0 (NGS), 2002.
van Natijne, A. L., Lindenbergh, R. C., and Bogaard, T. A.: Machine learning: New potential for local and regional deep-seated landslide nowcasting, Sensors-Basel, 20, 1–18, https://doi.org/10.3390/s20051425, 2020.
Wang, S., Zhang, K., van Beek, L. P. H., Tian, X., and Bogaard, T. A.: Physically-based landslide prediction over a large region: Scaling low-resolution hydrological model results for high-resolution slope stability assessment, Environ. Modell. Softw., 1675, 104607, https://doi.org/10.1016/j.envsoft.2019.104607, 2019.
Wicki, A., Lehmann, P., Hauck, C., Seneviratne, S. I., Waldner, P., and Stähli, M.: Assessing the potential of soil moisture measurements for regional landslide early warning, Landslides, 17, 1881–1896, https://doi.org/10.1007/s10346-020-01400-y, 2020.
Zhao, B., Dai, Q., Han, D., Zhang, J., Zhuo, L., and Berti, M.: Application of hydrological model simulations in landslide predictions, Landslides, 17, 877–891, https://doi.org/10.1007/s10346-019-01296-3, 2020.
Zhao, Y., Li, Y., Zhang, L., and Wang, Q.: Groundwater level prediction of landslide based on classification and regression tree, Geod. Geodyn., 7, 348–355, https://doi.org/10.1016/j.geog.2016.07.005, 2016.
Zhuo, L., Dai, Q., Han, D., Chen, N., Zhao, B., and Berti, M.: Evaluation of Remotely Sensed Soil Moisture for Landslide Hazard Assessment, IEEE J. Sel. Top. Appl., 12, 162–173, https://doi.org/10.1109/JSTARS.2018.2883361, 2019.