the Creative Commons Attribution 4.0 License.
the Creative Commons Attribution 4.0 License.
 | 20 May 2022
Enhancing disaster risk resilience using greenspace in urbanising Quito, Ecuador
John R. Elliott
Susanna K. Ebmeier
María Antonieta Vásquez
Camilo Zapata
Santiago Bonilla-Bedoya
Paulina Cubillo
Diego Francisco Orbe
Marco Córdova
Jonathan Menoscal
Elisa Sevilla
Greenspaces within broader ecosystem-based disaster risk reduction (Eco-DRR) strategies provide multiple benefits to society, biodiversity, and addressing climate breakdown. In this study, we investigated urban growth, its intersection with hazards, and the availability of greenspace for disaster risk reduction (DRR) in the city of Quito, Ecuador, which experiences multiple hazards including landslides, floods, volcanoes, and earthquakes. We used satellite data to quantify urban sprawl and developed a workflow incorporating high-resolution digital elevation models (DEMs) to identify potential greenspaces for emergency refuge accommodation (DRR greenspace), for example, following an earthquake. Quito's historical urban growth totalled ∼ 192 km2 for 1986–2020 and was primarily on flatter land, in some cases crossed by steep ravines. By contrast, future projections indicate an increasing intersection between easterly urbanisation and steep areas of high landslide susceptibility. Therefore, a timely opportunity exists for future risk-informed planning. Our workflow identified 18.6 km2 of DRR greenspaces, of which 16.3 km2 intersected with potential sources of landslide and flood hazards, indicating that hazard events could impact potential “safe spaces”. These spaces could mitigate future risk if designated as greenspaces and left undeveloped. DRR greenspace overlapped 7 % (2.5 km2) with municipality-designated greenspace. Similarly, 10 % (1.7 km2) of municipality-designated “safe space” for use following an earthquake was classified as potentially DRR suitable in our analysis. For emergency refuge, currently designated greenspaces could accommodate ∼ 2 %–14 % (depending on space requirements) of Quito's population within 800 m. This increases to 8 %–40 % considering all the potential DRR greenspace mapped in this study. Therefore, a gap exists between the provision of DRR and designated greenspace. Within Quito, we found a disparity between access to greenspaces across socio-economic groups, with lower income groups having less access and further to travel to designated greenspaces. Notably, the accessibility of greenspaces was high overall with 98 % (2.3 million) of Quito's population within 800 m of a designated greenspace, of which 88 % (2.1 million) had access to potential DRR greenspaces. Our workflow demonstrates a citywide evaluation of DRR greenspace potential and provides the foundation upon which to evaluate these spaces with local stakeholders. Promoting equitable access to greenspaces, communicating their multiple benefits, and considering their use to restrict propagating development into hazardous areas are key themes that emerge for further investigation.
- Article
(28919 KB) - Full-text XML
-
Supplement
(1513 KB) - BibTeX
- EndNote


Urbanising and increasing populations are a global trend that create a range of societal and environmental challenges including food and water security (Godfray et al., 2010; Hoekstra et al., 2018), air pollution (Fenger, 1999; Escobedo and Nowak, 2009; Zalakeviciute et al., 2018), disease (Marmot et al., 2008), loss of biodiversity (McDonald et al., 2020), climate change (De Sherbinin et al., 2007; Flörke et al., 2018), and exposure to disaster risk (Pelling et al., 2004). Approximately 68 % of the world's population are projected to live in urban areas by 2050, many of which are yet to be developed, and the rate of urbanisation is greatest for developing countries (UN DESA, 2019). The development of informal settlements takes place outside of regulatory frameworks such as land-use planning or building design codes (UN-Habitat, 2003; Oliver-Smith et al., 2016). Therefore, urbanisation often occurs within or creates hazardous areas, which exacerbates the socio-economic inequalities of disaster risk due to overcrowding, unsafe housing, and lack of infrastructure and services (Baker, 2012; Cardona et al., 2012). Reducing disaster risk and losses is the aim of the global Sendai Framework for Disaster Risk Reduction 2015–2030 (UNISDR, 2015) and is integral to achieving the UN sustainable development goals (SDGs). Specifically, goal 11 to “make cities and human settlements inclusive, safe, resilient and sustainable” targets reducing deaths and socio-economic impacts associated with disasters with a focus on the most vulnerable (UN General Assembly, 2015). Successful risk reduction in “tomorrow's cities” requires people-centred decision making to support a transition from disaster response to risk-informed planning (Galasso et al., 2021). Additionally, nature-based solutions (NbS) involving greenspace in cities are increasingly recognised within a framework of ecosystem-based disaster risk reduction (Eco-DRR) (Estrella and Saalismaa, 2013; Faivre et al., 2018; UNDRR, 2020) and can be designed and monitored using an increasing number of earth observation (EO) technologies (Kumar et al., 2021). EO data are widely used for land cover classifications to quantify historical trends in urban expansion and to model future urbanisation projections (Schneider and Woodcock, 2008; Bonilla-Bedoya et al., 2020b). Both high-resolution (< 1 m, commercial) (Myint et al., 2011; Georganos et al., 2018) and medium-resolution (10–30 m, open-access) (e.g. Landsat and Sentinel-2) optical satellite imagery are used for land cover and greenspace mapping (Fuller et al., 1994; Labib and Harris, 2018; Deng et al., 2019).
There are multiple definitions of greenspace; however, they generally include reference to public parks, gardens, open space, wetlands, street verges, woodland, and sports grounds (Taylor and Hochuli, 2017). Greenspace is associated with multiple impacts on urban and natural systems (Fig. 1a), including improving mental and physical health (James et al., 2015; WHO Regional Office for Europe, 2016; Marselle et al., 2020; Bauwelinck et al., 2021), conserving natural ecosystems and biodiversity (Aronson et al., 2017; McDonald et al., 2020), creating economic opportunities (McPherson, 1992), building community resilience to hazards (Colding and Barthel, 2013), including reducing landslide risk (Phillips and Marden, 2005; Sandholz et al., 2018) and urban flooding (Maragno et al., 2018), and providing safe spaces in the event of a disaster (Shrestha et al., 2018; Sphere Association, 2018; Shimpo et al., 2019; Jeong et al., 2021). However, greenspace planning in urban environments is often recreation-focused (Boulton et al., 2018). Therefore, it is important to recognise the provision of multi-benefit greenspaces within an Eco-DRR framework, as well as the diverse accessibility, ownership, and management of such spaces (Colding and Barthel, 2013). Similarly, the creation and designation of greenspace requires consideration of social justice issues, such as the impact on property values (Wolch et al., 2014; García-Lamarca et al., 2020).
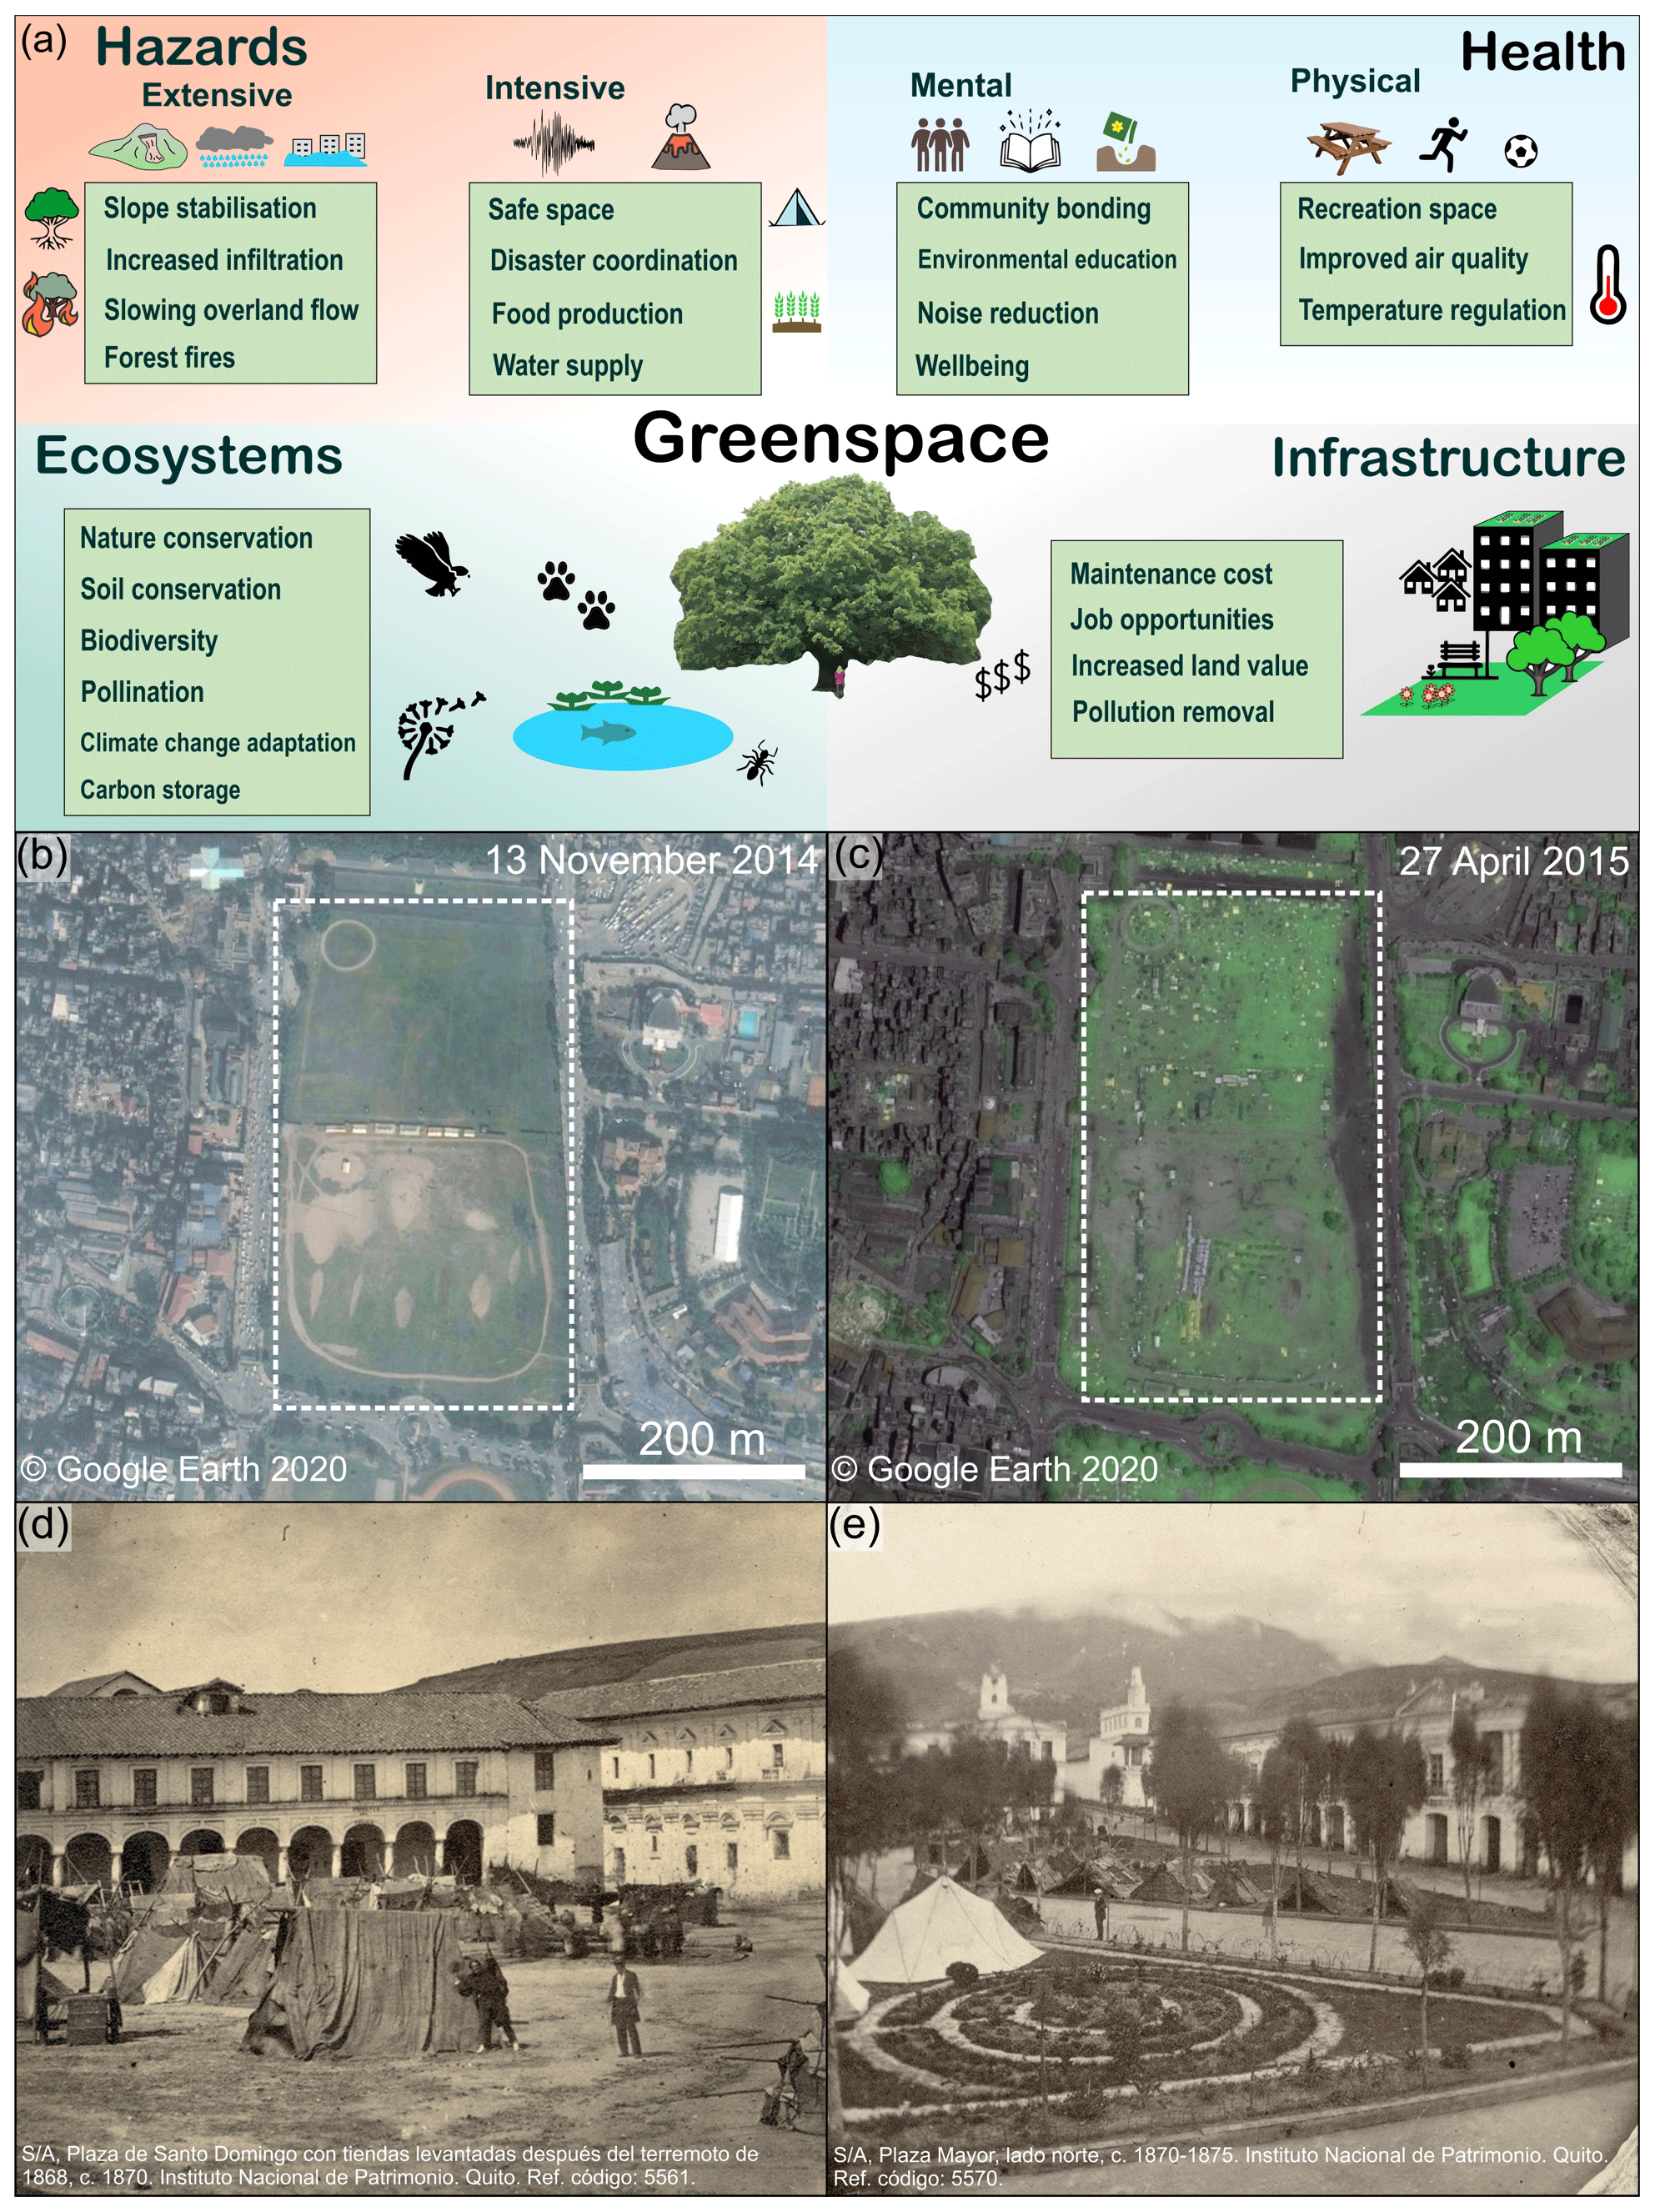
Figure 1(a) Example impacts of urban greenspace on hazards, health, ecosystems, and infrastructure. (b–c) An area of greenspace, “Tundikhel” (lat 27.702∘, long 85.315∘), in Kathmandu, Nepal, which was used for temporary tented accommodation following the Gorkha earthquake (25 April 2015). (d–e) Tents in Plaza Santo Domingo and Plaza Mayor (Plaza Grande) in Quito after the 1868 Ibarra earthquake.
Green cities, which incorporate diverse greenspace, green infrastructure, and interconnected social and ecological networks, provide opportunities to enhance disaster resilience and deliver multiple benefits for sustainable development and nature conservation (Benedict and MacMahon, 2002; Tidball and Krasny, 2012). These elements may be designed and integrated into planning policy (Jeong et al., 2021) or emerge following crises, such as loss of food security prompting the proliferation of urban gardening (Altieri et al., 1999; Gonzalez, 2003; Colding and Barthel, 2013). Similarly, following disaster events such as earthquakes, open spaces are used for emergency refuge (Allan et al., 2013; Borland, 2020). The latter point was the case following the 2015 Gorkha earthquake in Nepal, where greenspaces were used for temporary accommodation away from collapsed and damaged buildings (Fig. 1b–c). Temporary government camps housed over 30 000 people in the Kathmandu Valley, and over 1000 smaller shelter sites housed thousands more (Khazai et al., 2015). Greenspace was also prioritised in Tokyo following the 1923 Great Kantō Earthquake, in which parks originally designed to provide space for children were later valued as emergency refuges (Borland, 2020). Innovative greenspace design elements may also emerge following disaster events, such as integrating water bodies and pumps, edible plant species, and multi-purpose (e.g. seating, dining, and cooking) communal seating areas into greenspace areas (Bryant and Allan, 2013).
Historically, green space in Quito was defined by the rural–urban relationship. Until the end of the 19th century, green spaces were the ejidos, sites for agriculture and livestock, which were located on the outskirts of the city. The urbanisation model did not contemplate green spaces in its design, and natural spaces such as the ravines were mostly filled in (Aragundi et al., 2016). This is important because parks and plazas have been repeatedly used as refuge sites after earthquakes in Quito. For example, during the 1859 Quito earthquake and 1868 Ibarra earthquake, refugee tents were set up in the main plazas and parks of the city (e.g. Fig. 1d, e). During the 20th Century, the use of these greenspaces and open spaces like plazas as refuge after earthquakes was recognised through the creation of official “safe spaces” (see Sect. 4.3) (Metro Ecuador, 2019).
Quito has a population of over 2 million (2020), having doubled in just three decades from 1 million in the late 1980s and which is projected to exceed 3.4 million by 2040 (DMQ, 2018). The expansion of formal and informal settlements into hazardous areas increases disaster risk from events including landslides, flooding, volcanic eruptions, and earthquakes. Increased disaster risk is due to both increased exposure to natural hazards and the social vulnerability of the exposed communities (e.g. Valcárcel et al., 2017). Therefore, in this study we assessed the potential of greenspace for reducing disaster risk in contemporary Quito and for guiding the development of more resilient communities in future urban areas. Specifically, we (1) quantified Quito's recent historical urban expansion using satellite-based optical imagery and evaluated potential future urbanisation scenarios using land classification metrics, (2) investigated the intersection between the built environment and natural hazards, and (3) evaluated the potential role of urban greenspace for reducing disaster risk in Quito by providing “safe spaces”. In this study, we analyse a style of greenspace relevant to disaster risk reduction that is quantifiable using optical satellite data. Specifically, we focus on low-gradient open spaces that are vegetated. We do not consider specific greenspace amenities such as recreation facilities or accessibility restrictions, which cannot be determined using satellite data alone.
Quito is situated in the central region of Ecuador, just south of the Equator in the Inter-Andean Valley of South America at over 2800 m a.s.l. and is bounded by Pichincha Volcano (4794 m) to the west and steep topography to the east (Fig. 2). Topography and factors such as the inter-tropical convergence zone and the South Atlantic convergence zone determine Quito's climate (Hastenrath, 1997; Vincenti et al., 2012; Zambrano-Barragán et al., 2011). Quito's precipitation distribution has two modalities, March–April and October–December, with an average annual precipitation of 1200 mm and an average annual temperature of 13.4 ∘C (Vincenti et al., 2012; Zambrano-Barragán et al., 2011). In recent decades, Quito's urban extent has spread many kilometres to the north, east, and south (Bonilla-Bedoya et al., 2020b; Salazar et al., 2020). Westward expansion is limited, although not absent, due to the designated protected areas on the slopes of Pichincha volcano, which were implemented following urban encroachment and the occurrence of landslides and floods (Vidal et al., 2015; DMQ, 2018). Urban expansion is changing Quito's exposure to natural hazards including landslides, floods, volcanic activity, and earthquakes (Chatelain et al., 1999; Hall et al., 2008; Carmin and Anguelovski, 2009; Valcárcel et al., 2017). Quito's urban area now exceeds the current Metropolitan District of Quito (DMQ) administrative boundary (Bonilla-Bedoya et al., 2020a; Salazar et al., 2021). Therefore, in this study, we define two separate areas of interest (AOIs): (1) a “land cover AOI” for mapping land cover change, which encompasses the core urban area of Quito, and (2) a “city AOI” for mapping greenspace, which includes the administrative level 3 parishes of Quito, Cumbaya, Llano Chico, Calderon (Carapungo), Conocoto, Zambiza, and Nayón (Figs. 2a, S1 in the Supplement).
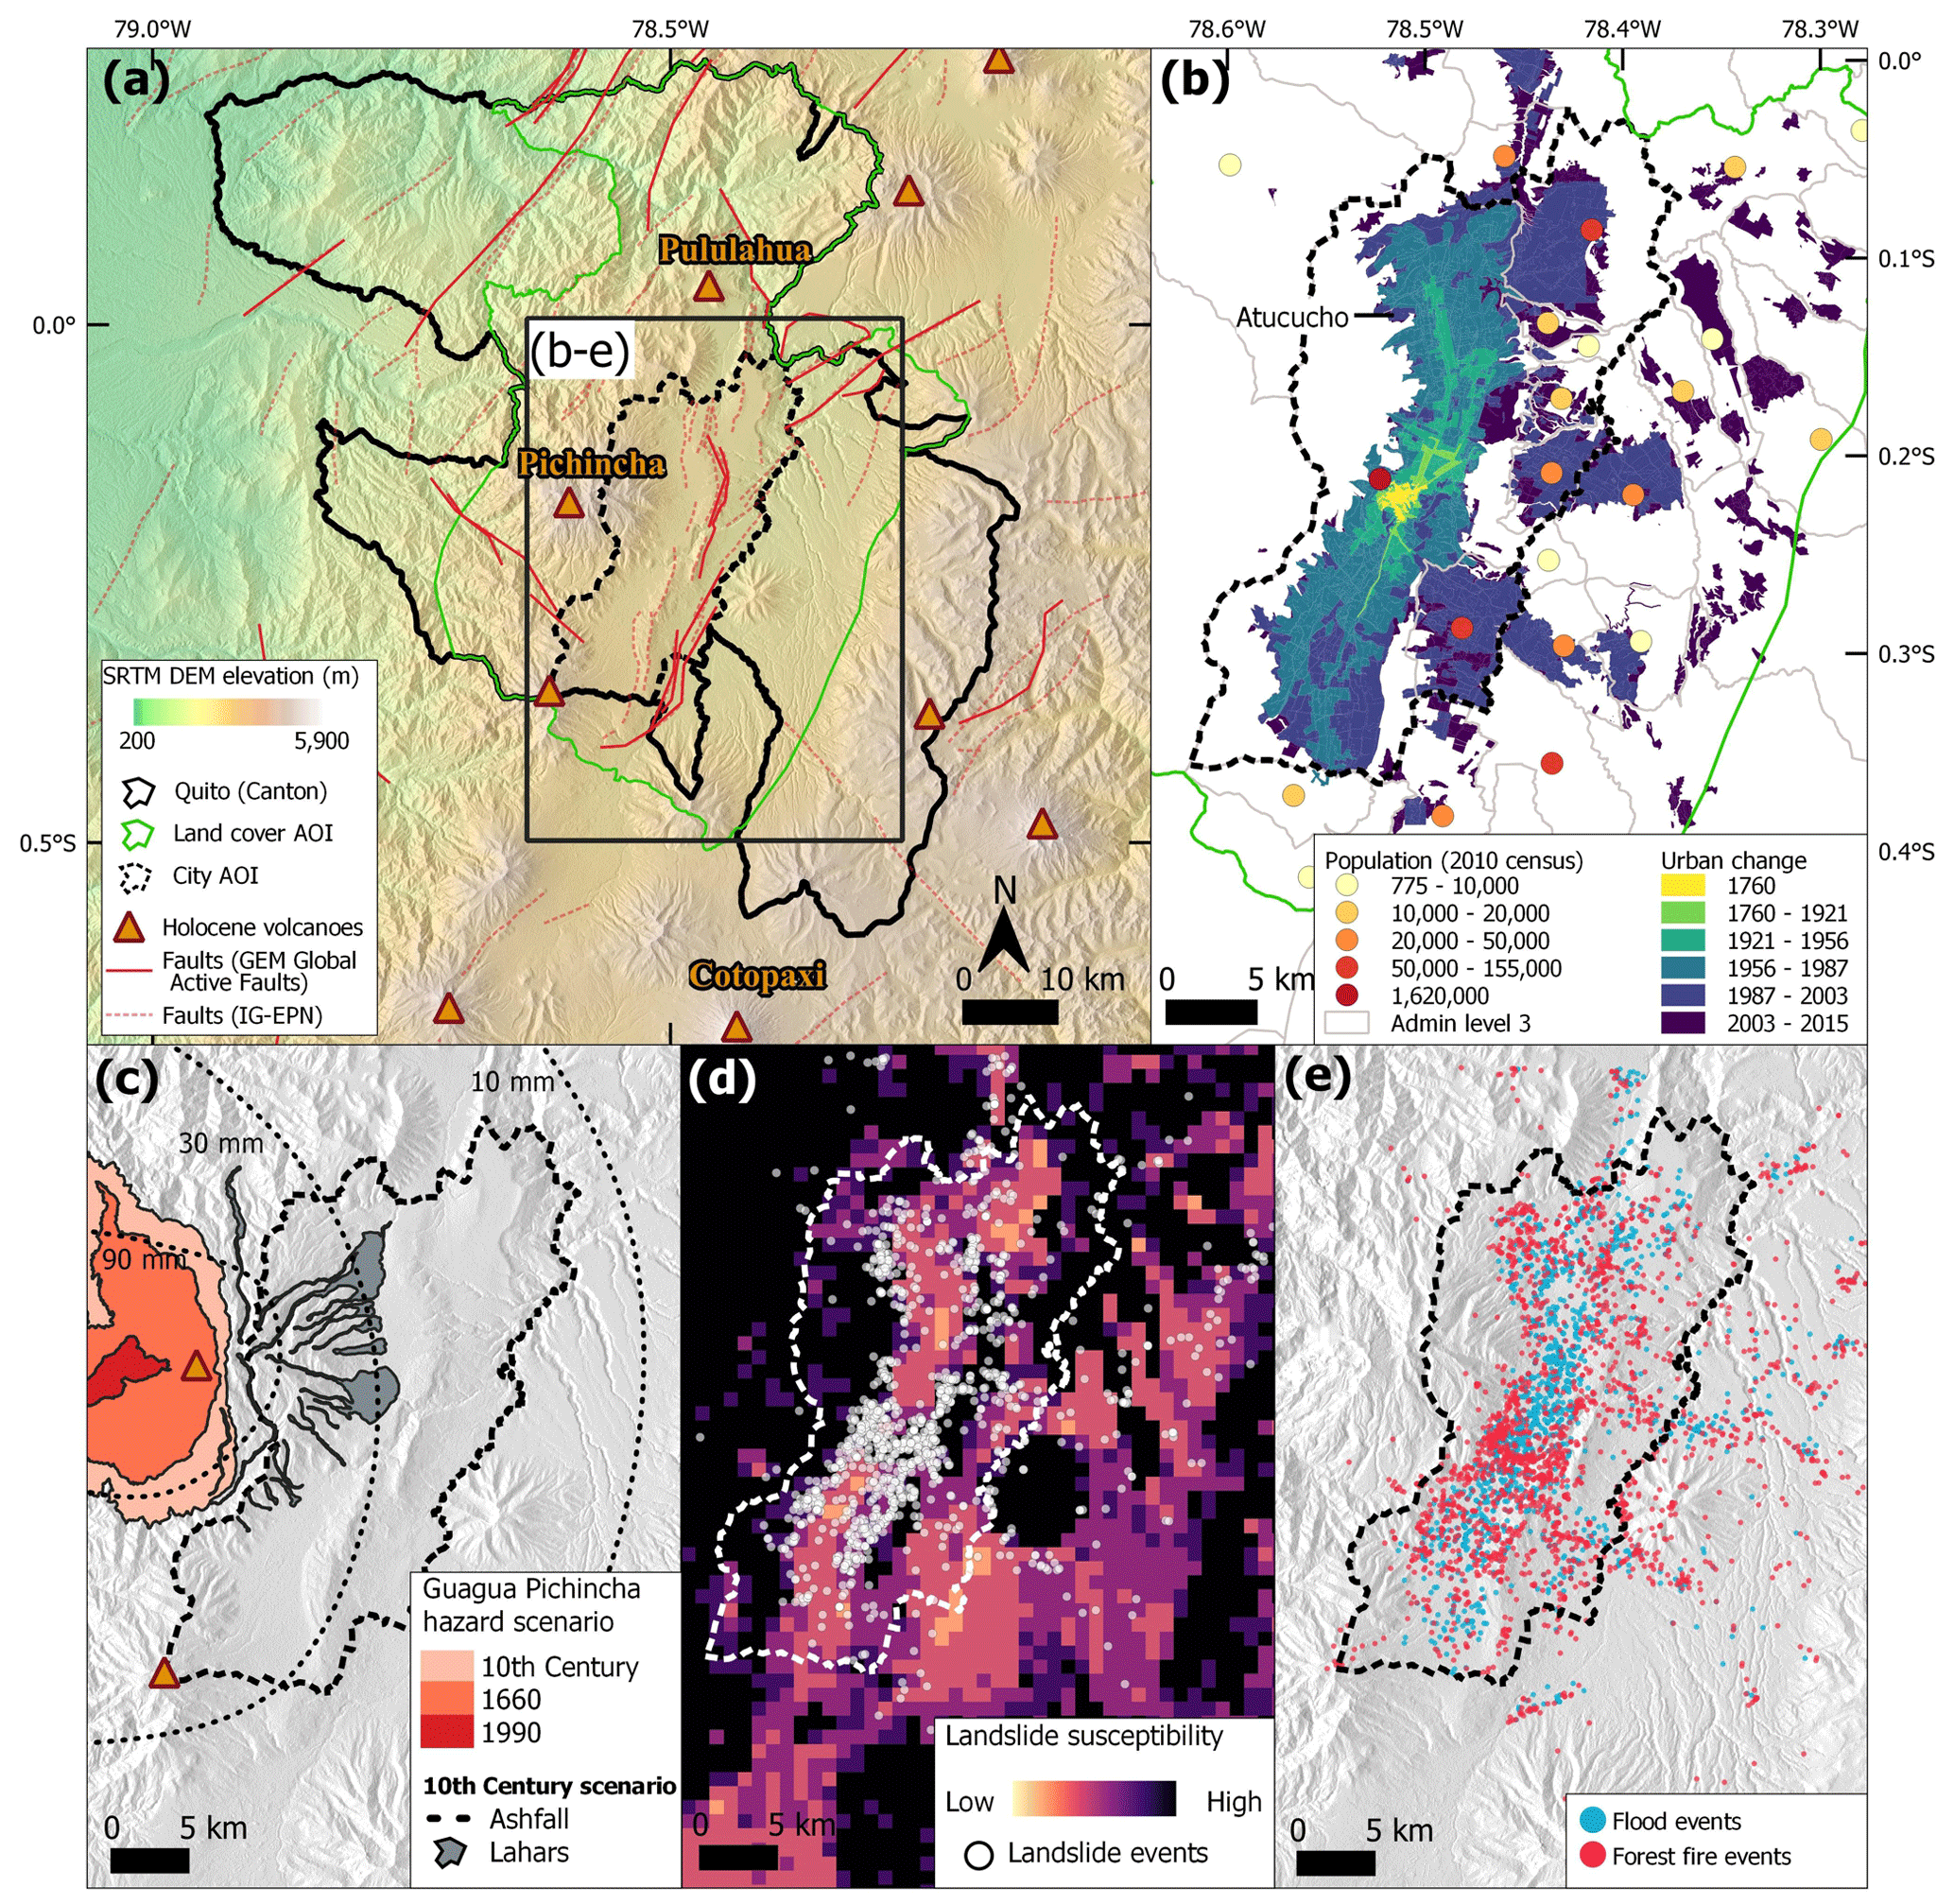
Figure 2(a) The location of Quito, Ecuador, in relation to regional seismic faults and volcanoes. Fault lines (red) are from the Geophysical Institute of the National Polytechnic School (IG-EPN) and Global Earthquake Model Global Active Faults (Styron, 2019). (b) Urban change and population of Quito are mapped using Open Government data (https://datosabiertos.gob.ec/, last access: 16 May 2022). (c) Volcanic hazards from the IG-EPN et al. (2019) Pichincha Volcano hazard map. (d) Landslide susceptibility map (Stanley and Kirschbaum, 2017) and observed landslide events (n=1321) (2006–2017) (https://datosabiertos.gob.ec/, last access: 16 May 2022). (e) Observed hydrometeorological (n=1574) and forest fire events (n=2358) (2006–2017) (https://datosabiertos.gob.ec/, last access: 16 May 2022).
Quito is surrounded by active faults (Fig. 2a), and the Global Earthquake Model estimates (Pagani et al., 2018) at the regional scale indicate a relatively high seismic hazard with a peak ground acceleration (PGA) of 0.55–0.9 g (with a 10 % probability of exceedance in 50 years) (Fig. S1). Similarly, Beauval (2018) estimate a PGA of ∼ 0.4–0.6 g for Quito in a return period of 475 years. The Quito Fault System creates seismic hazard across the city, with a maximum earthquake size estimated at Mw 6.6 and a recurrence time of ∼ 150–435 years (Alvarado et al., 2014). Earthquake scenario damage models show that the highest rates of potential building damage are associated with the areas of highest social vulnerability (Valcárcel et al., 2017). Volcanic eruptions also pose significant risk to large populations. Quito lies 12 km from the active volcano Guagua Pichincha, where activity over the past decades has been characterised by small explosions, ash, and gas emission (Loughlin et al., 2015). Past eruptions have covered Quito in ash; for example, the 1660 eruption ash deposits are ∼ 10 cm thick in central Quito (Robin et al., 2008). Recent pyroclastic flows and surges have been channelled by topography away from Quito to the west, but potential volcanic hazards in Quito include secondary lahars and ashfall, which are mapped using knowledge of historic eruptions (IG-EPN, 2019) (Fig. 2c). Quito's road network and water supply are also all vulnerable to flows and especially ash from multiple volcanoes (Wilson et al., 2012; Loughlin et al., 2015). Landslides and floods are both extensive natural hazards in Quito owing to the steep topography, intense rainfall, and filling of natural drainage channels to create building space (DMQ, 2018; Castelo et al., 2018; Domínguez-Castro et al., 2018; Perrin et al., 2001). Landslides are concentrated on the steep slopes of Quito's periphery and ravines (Fig. 2d), whereas flood events are spread across Quito's urban extent (Fig. 2e). Following heavy rainfall, mudflows are also a hazard on the lower and increasingly urbanised slopes of Pichincha (Perrin et al., 2001). Multi-hazards or cascading hazards could also emerge through combinations of single hazards, such as a volcanic eruption that deposits ash on slopes and blocks urban drains, which if followed by heavy rain could produce lahars and urban flooding respectively (Gill et al., 2021).
In terms of policy and planning, the issue of green space in the city currently maintains a spatial-functional emphasis, although environmental (mainly related to climate change) and socio-political (public space, right to the city) criteria have been incorporated. There was an important change in the first urban plan of the city (1942), in which the design envisages a series of green spaces, especially in the north of the city, under a criterion of recreational and sports spaces. This is the case of the current La Carolina park, which was initially the city's racecourse. The plan also considered a series of smaller green spaces within the residential areas. However, a balanced development between urban sprawl and the environment was not planned, but rather green and open spaces in general were thought of as part of the zoning logic of the time. This model of urban development between the 1970s and 2000s is the main risk factor for disasters in the city (Carrión and Erazo Espinosa, 2012). In 1993, the Metropolitan District of Quito (DMQ) was created, with 9.3 % of its territory being urban and 90.7 % rural. This new territorial configuration is relevant because both planning and risk analysis tend to concentrate only on the urbanised area (Peralta Arias and Higueras García, 2016).
When outlining the vision of Quito to the year 2040, the municipality of the Metropolitan District of Quito recognised the importance of an urban green network for delivering social and natural benefits, including risk mitigation (DMQ, 2018). This recognition of greenspace to reduce risk from morphoclimatic events has been present in the planning instruments of the municipality since the 1980s. The destructive mudflows of 1983 on the slopes of Pichincha that had been previously urbanised by informal settlements prompted the national government of Ecuador to legislate the law on “protective forests”. These forests were designed to prevent erosion, mitigate landslides, and control informal urbanisation on slopes around Quito. According to Sierra (2009), the role of greenspace in the borders of the city was first designed to create recreational and patrimonial landscapes from 1940s onwards and later, in the 1970s and 1980s, to incorporate environmental, city growth control, and risk mitigation properties. In the last 30 years, there has been municipal and community interest in the recovery of ravines for recreational activities and improving citizens' quality of life by implementing nature-based solutions alongside urban development; however, its realisation and impact have been small at the city scale, instead confined to planning-stage pilot projects such as in the San Enrique de Velasco district in the northwest of Quito (Salmon et al., 2021).
The following section details our methodology to quantify Quito's historical urban growth and investigation of future urban growth scenarios. We investigate Quito's growth in conjunction with topographical information and hazard datasets to reveal how Quito's exposure to hazards is changing through time. We then define a methodology to map greenspace that is potentially suitable for disaster risk reduction, considering the spatial distribution in relation to socio-economic data and per person accessibility if the spaces were used as an emergency refuge. These data are then used to reveal optimum locations for the designation of new protected greenspaces to enhance disaster risk resilience in Quito.
3.1 Urban growth
Urban growth for the period 1986 to 2020 was derived by applying a land cover classification workflow to 30 m resolution Landsat satellite imagery for the land cover AOI (Figs. 2a and 3a), including Landsat 4 Thematic Mapper (TM), Landsat 7 Enhanced Thematic Mapper Plus (ETM+), and Landsat 8 Operational Land Imager (OLI). Landsat imagery was selected June to September to avoid cloud cover during the wet season (Domínguez-Castro et al., 2018). Therefore, seasonal spectral variations in land covers are not captured. Images were pre-processed using Landsat-based detection of Trends in Disturbance and Recovery (LandTrendr) and Google Earth Engine to create multi-image mosaics with minimal cloud cover using a medoid pixel composite (Gorelick et al., 2017; Kennedy et al., 2018). Training data were manually digitised as 500 polygons (median polygon area of 5400 m2) with reference to the 1986 image using four classes: (1) urban, (2) woodland, (3) scrub vegetation and bare ground, and (4) agriculture and grassland. Training data were masked using the normalised difference vegetation index (NDVI) vegetation loss and growth masks that are output from LandTrendr to leave areas of training data that were spectrally consistent through time (1986–2020). Landsat composites were stacked with elevation and slope layers derived from the 30 m Shuttle Radar Topography Mission (SRTM) digital elevation model (DEM) (Farr et al., 2007) since these additional variables were shown to improve land cover classification performance (Zhu et al., 2016). We used a random forest classification, which is a decision tree approach popular for land cover classifications owing to their high accuracy, broad data handling, and low sensitivity to training data noise (Rodriguez-Galiano et al., 2012; Zhu et al., 2016). The Orfeo ToolBox random forest classifier (Inglada and Christophe, 2009) (Table S1) was run 50 times for each time period using 200 trees and a random sample of training data to account for imbalance between classes (Millard and Richardson, 2015) (Table S1). The modal value was used to produce the final classification map, which was accuracy assessed using an independent stratified random sample of 200 reference points in each class created using high-resolution satellite imagery (Fig. S2). High-resolution multispectral satellite imagery was not available in the 1980s, which reduces classification confidence in training and reference data; however, a panchromatic ∼ 1 m resolution aerial orthophoto of Quito in 1977 from the Instituto Geográfico Militar (1977) was used for reference. The accuracy assessment was used to produce an error-adjusted area and confidence interval of each land cover classification (e.g. Olofsson et al., 2013, 2014).
Future urbanisation scenarios in Quito were assessed with reference to Bonilla-Bedoya et al. (2020b) and Salazar et al. (2020). Both studies used predictor variables to model future urbanisation scenarios in Quito. Salazar et al. (2020) present a scenario to the year 2050, whereas Bonilla-Bedoya et al. (2020b) define an “urbanisation probability” without a scenario end date. Nonetheless, the spatial trends in both studies are similar. Predictors used to derive urbanisation probability included biophysical (e.g. precipitation, slope, and altitude), land cover and management (e.g. protected areas), infrastructure and services (e.g. road network), socio-economic (e.g. land value), and landscape metrics (e.g. landscape patch size and shape) (Bonilla-Bedoya et al., 2020b). We used “high” (urbanisation probability: 55 %–79 %) and “very high” (urbanisation probability: 79 %–100 %) classes from Bonilla-Bedoya et al. (2020b) in this study (Fig. S3) to evaluate future land cover scenarios and the intersection of urban areas with hazards.
3.2 Topography
The 30 m SRTM DEM was used to extract statistics on the elevation and slope within the land cover change area of interest (AOI), which encompasses the smaller city AOI (Fig. 2a). A higher-resolution (2 and 10 m) DEM and orthoimagery were created for a smaller AOI (Fig. 2a), which bounded the administrative level 3 parishes of Quito, Cumbaya, Llano Chico, Calderon (Carapungo), Conocoto, Zambiza, and Nayon. This AOI was covered by tri-stereo Pleiades imagery, which was acquired on five separate dates (5 November 2019, 28 January 2020, 9 February 2020, 6 June 2020, and 28 July 2020) in both panchromatic (∼ 0.7 m) and multispectral (∼ 2.8 m RGB and near-infrared) modes (Table S2). Tri-stereo acquisitions produce elevation models with lower uncertainties compared to bi-stereo acquisitions due to greater point cloud densities afforded by the extra viewing angle (Zhou et al., 2015). All imagery was delivered with radiometric processing to surface reflectance and processed using rational polynomial coefficients (RPCs) without ground control points (GCPs) (e.g. Airbus Defence and Space, 2012; Zhou et al., 2015). Agisoft Metashape v.1.6.5 was used to process the imagery to create a digital surface model (DSM), digital terrain model (DTM), and orthorectified imagery. Briefly, (1) the panchromatic and multispectral imagery was aligned in one bundle to produce a sparse point cloud; (2) the sparse cloud was filtered to remove outliers using Metashape's gradual selection tools; and (3) a dense point cloud was constructed using the panchromatic imagery, which was used to create a 2 m resolution DEM and (4) orthorectify the satellite imagery. Metashape's ground classification (maximum angle: 15∘; maximum distance: 0.5 m; cell size: 50 m) was applied to the dense cloud and used to create the DTM. An additional DSM was output at 10 m resolution to reduce data gaps for deriving a topographic wetness index (TWI) (Sect. 3.3).
Since the Pleiades DEM was processed without GCPs, we assessed the accuracy using Ice, Cloud and land Elevation Satellite (ICESAT-2) altimetry data. ICESAT-2 data have an expected vertical accuracy that is lower than the error expected from a Pleiades DEM created without ground control points (> 3–5 m) (Passalacqua et al., 2015; Markus et al., 2017) and were therefore used as an independent validation check. We extracted high confidence returns from the Advanced Topographic Laser Altimeter System (ATLAS) instrument ATL03 Global Geolocated Photon Height data acquired from 6 December 2018 to 3 June 2020 that intersected with the Pleiades data (Neumann et al., 2019, 2020). Photons were filtered to exclude slopes steeper than 20∘ and aggregated into 5 m grid cell mean values. Cells containing ≥ 2 photons with an elevation range ≤ 1 m were carried forward for the validation (n=11 922). We coregistered the Pleiades DEM and gridded ICESAT-2 data following the x, y, z shift correction of Nuth and Kääb (2011), and the differences in elevation values were compared. The mean vertical difference between the ICESAT-2 and Pleiades data was 0.38 m (1 standard deviation: 1.32 m) with a normalised median absolute deviation of 0.84 m.
3.3 Hazards
Information on natural hazards affecting Quito were collated from published sources and Ecuador's Open Government data. We used a global landslide susceptibility model that was validated against local and global landslide inventories, with an emphasis on rainfall-triggered events (Kirschbaum et al., 2016; Stanley and Kirschbaum, 2017). Landslide susceptibility was ranked on a scale of 1 (low) to 5 (high), and the model combined data on slope, faults, geology, forest loss, and road networks, aggregated to ∼ 1 km grid cells (Stanley and Kirschbaum, 2017). Open Government records of “accidents” 2006–2017 were used to identify the geographic distribution of mass movement events (n=1321), which were compared to the global landslide susceptibility model (Fig. S4) (Ministry of Territory, 2020). We masked Class 5 (high) of the landslide susceptibility model out of the future urbanisation scenario of Bonilla-Bedoya et al. (2020b) to create a restricted scenario of urban growth, which reflects DMQ's vision to remove high risk areas from future land occupation. We also excluded development on the slopes of Pichincha volcano (as unrealistically inaccessible given steep slopes) and included an area of development spanning the metropolitan district boundary in the south (Fig. S3). We refer to the original scenario of future urbanisation and the modified scenario as F-U and M-U respectively. Information on volcanic hazards was obtained from the Geophysical Institute of the National Polytechnic School (IG-EPN) through the National Information System (SNI) (SNI, 2020). Spatial variation in earthquake hazard across Quito was not explored in this study due to the coarse resolution (∼ 10 km) of available hazard information (Fig. S1). However, the high regional seismic hazard (Alvarado et al., 2014; Pagani et al., 2018) motivates our city-wide analysis of greenspace.
The 10 m Pleiades DEM was hydrologically corrected by breaching sinks (Lidberg et al., 2017), using the breach depressions least cost tool of Whitebox 1.4.0. The breached DEM was used to derive a TWI, which was intersected with flood events in the Open Government database (n=1274) to assess whether high TWI values correspond to greater incidences of flood events and therefore was indicative of potential flood hazard (Jalayer et al., 2014; Kelleher and McPhillips, 2020).
where a represents the specific catchment area, and tan β represents the local DEM slope. Therefore, the TWI describes the tendency for a cell to accumulate and evacuate water (Beven and Kirkby, 1979; Manfreda et al., 2011; Mattivi et al., 2019).
We assumed a positional uncertainty radius of 20 m in the flood event records based on the observed positional spread of recorded traffic collisions at road junctions in the same database (Fig. S5). The maximum TWI value within a 20 m radius of the recorded point was extracted and compared to the TWI for a random sample of 10 000 points to test whether there was a statistically significant difference in the TWI at locations of flood events (e.g. Kelleher and McPhillips, 2020). Notably, this method does not account for the subsurface drainage network present in an urban setting and therefore represents an assumption that this subsurface drainage network is overwhelmed during the flood event such that all flow passes over the DEM (Kelleher and McPhillips, 2020).
3.4 Greenspace
Orthorectified multispectral Pleiades imagery was pan-sharpened in ArcGIS Pro 2.6.0 using the Gram–Schmidt algorithm and Pleiades sensor band weights to create a four-band (red, green, blue, and near-infrared (NIR)) 0.5 m resolution multispectral image. Quito's vegetated greenspace distribution was mapped using the NDVI applied to the NIR and red bands of the pan-sharpened Pleiades satellite imagery (Fig. 3b).
Negative NDVI values correspond to areas lacking vegetation, whereas increasingly positive values represent healthy vegetation (Tucker et al., 1981; Pettorelli et al., 2005). In some cases, shadowed areas, for example due to buildings, display similar NDVI values to vegetation (Leblon et al., 1996; Yamazaki et al., 2009). We therefore used 100 randomly sampled patches (200×200 m) to evaluate the NDVI classification with reference to the pan-sharpened Pleiades orthoimage. Incorrect classifications had a small overall impact, accounting for 0.4 % of the evaluated NDVI area (Table S3) with a mean patch size of 13 ± 16 m2. Bright blue roofs also displayed a high NDVI value and were masked out using a simple “blueness” index of values ≤ 0.2, which was derived through manual inspection of blue roofs.
Whilst global coverage and daily observation are possible with the paired constellation, Pleiades imagery is not routinely acquired nor open access. Therefore, we also compared Pleiades NDVI values with those from an open-access Sentinel-2 image acquired on 6 February 2020 with the aim of testing their consistency, noting that whilst the spectral bands overlap, the bandwidth of Pleiades is greater (Pleiades: red 590–710 nm, NIR 740–940 nm; Sentinel-2: red 649–680 nm, NIR 780–886 nm).

Figure 3(a) Land cover classification and accuracy assessment workflow. (b) Classification of greenspace that could potentially contribute to disaster risk reduction (DRR), herein “DRR greenspace”.
3.4.1 Disaster risk reduction (DRR) greenspace
Greenspaces potentially suitable for providing safe spaces and contributing towards disaster risk reduction were identified using an EO-based workflow (Fig. 3b) for areas within 800 m (accessible within a ∼ 10 min walk) (e.g. Dou and Zhan, 2011; Jeong et al., 2021) of populations in Quito's urban extent. The workflow identified greenspace (1) that is vegetated, (2) greater than 10 m from a road to exclude road verges, (3) with slope ≤ 4∘ to provide a suitable gradient for “safe spaces” (Kılcı et al., 2015; Liu et al., 2011), and (4) with a local height (≤ 2 m) to identify open ground and exclude raised vegetation such as trees. Expansion and contraction buffers of 10 m were applied to connect adjacent patches of greenspace into greenspace “zones”, which for example could represent multiple patches of classified greenspace within a park. All areas of greenspace with a patch size ≥ 100 m2 within these zones were summed, and zones totalling ≥ 2000 m2 of greenspace were classified as “potential DRR greenspace”. Space requirements in a disaster situation are dynamic; however, a 100 m2 patch size is recommended to accommodate two people with communal space (cooking, access, facilities, etc.) in a camp-style settlement following guidelines in the Sphere Humanitarian Charter and Minimum Standards in Humanitarian Response Handbook (Anhorn and Khazai, 2015; Sphere Association, 2018). Zones of 2000 m2 approximate one quarter to one third of a professional football pitch and so could be expected to already exist as functional greenspaces (e.g. recreation parks) in an urban environment. These spaces were evaluated alongside a list of safe spaces designated by DMQ for use in an earthquake event (Metro Ecuador, 2019) (Table S4), in conjunction with population data projected to 2019 and socio-economic classification data (Instituto Geográfico Militar, 2019). These socio-economic classifications characterise a continuum of education, income, and lifestyle factors into five classes, ranging from “high” to “low”, in which “low” represents basic education and limited household facilities such as rubbish collection and plumbing, whereas “high” represents higher education and houses or apartments that are provisioned with state services (Instituto Geográfico Militar, 2019).
3.4.2 Greenspace capacity
Quito's 2019 population data (Instituto Geográfico Militar, 2019) were used to assess the population capacity of all DRR greenspace (Sect. 3.4.1) in the event that they were to be used for accommodation following a disaster such as an earthquake. We assessed the capacity of two types of greenspaces: (1) DRR greenspace that overlapped with DMQ-designated greenspaces, which included city parks and safe spaces (Sect. 3.4.1), and (2) all DRR greenspaces identified in this study that were either designated or undesignated. These two scenarios therefore represent the DRR capacity based on current designations (1), compared to the potential maximum capacity (2). We considered two separate cases of populations within 800 and 1600 m network buffers of each greenspace. For each scenario, we used a network analysis to assign population demand points to each greenspace based on their proximity, up to the maximum buffer distance. The network was constructed as a grid at 100 m resolution and considered population demand points also gridded at 100 m resolution, which were uniformly disaggregated from census polygons. The number of people that could be accommodated in each greenspace depends on the capacity of the space and the population demand in the surrounding buffer. We considered capacities based on Sphere Association (2018) guidelines, which suggest an allocation of 45 m2 per person (recommended amount per person accounting for communal facilities and infrastructure in an emergency shelter setting) and 3 m2 per person (minimum living space per person). All demand within the buffers was allocated to the closest greenspaces; therefore, excess demand was reported as overcapacity. We did not consider the possibility of people moving greater distances around the city to distribute the population demand more equally, which could occur following an initial disaster situation, or that only a fraction of the population would require access to refuge space in a disaster situation. Considering potential policy consideration, we also used a maximum capacitated coverage network analysis (e.g. Anhorn and Khazai, 2015) with the same datasets to find the “top 10” DRR greenspaces in Quito based on a minimum space requirement of 3 m2 per person and a travel distance of 800 m.
4.1 Urban growth
Our land cover classifications showed that the urban area of Quito expanded ∼ 192 km2 over the study period, more than doubling from 160 ± 50 km2 in 1986 to 352 ± 47 km2 in 2020 (Fig. 4, Table S5). Urban expansion was primarily aligned along-valley (north–south) and eastward (Fig. 5a) into areas of previously scrub vegetation/bare and agricultural/grassland classes. The future urbanisation scenario of Bonilla-Bedoya et al. (2020b) covered an urban area of 1232 km2 (F-U), whereas the M-U scenario covered 705 km2 (Fig. 4a), which was still double the observed 2020 urban area. Future urbanisation in the modelled scenarios was predominantly eastward, where lower-density urbanisation interspersed with the scrub vegetation/bare ground class was already apparent in 2020 (Fig. 5). The area of woodland and agriculture/grassland classes also increased in 1986–2020. A notable example of afforestation (4.8 km2) was the park Metropolitano del Sur, which is located on the southeast of the city limit (Fig. 5a).
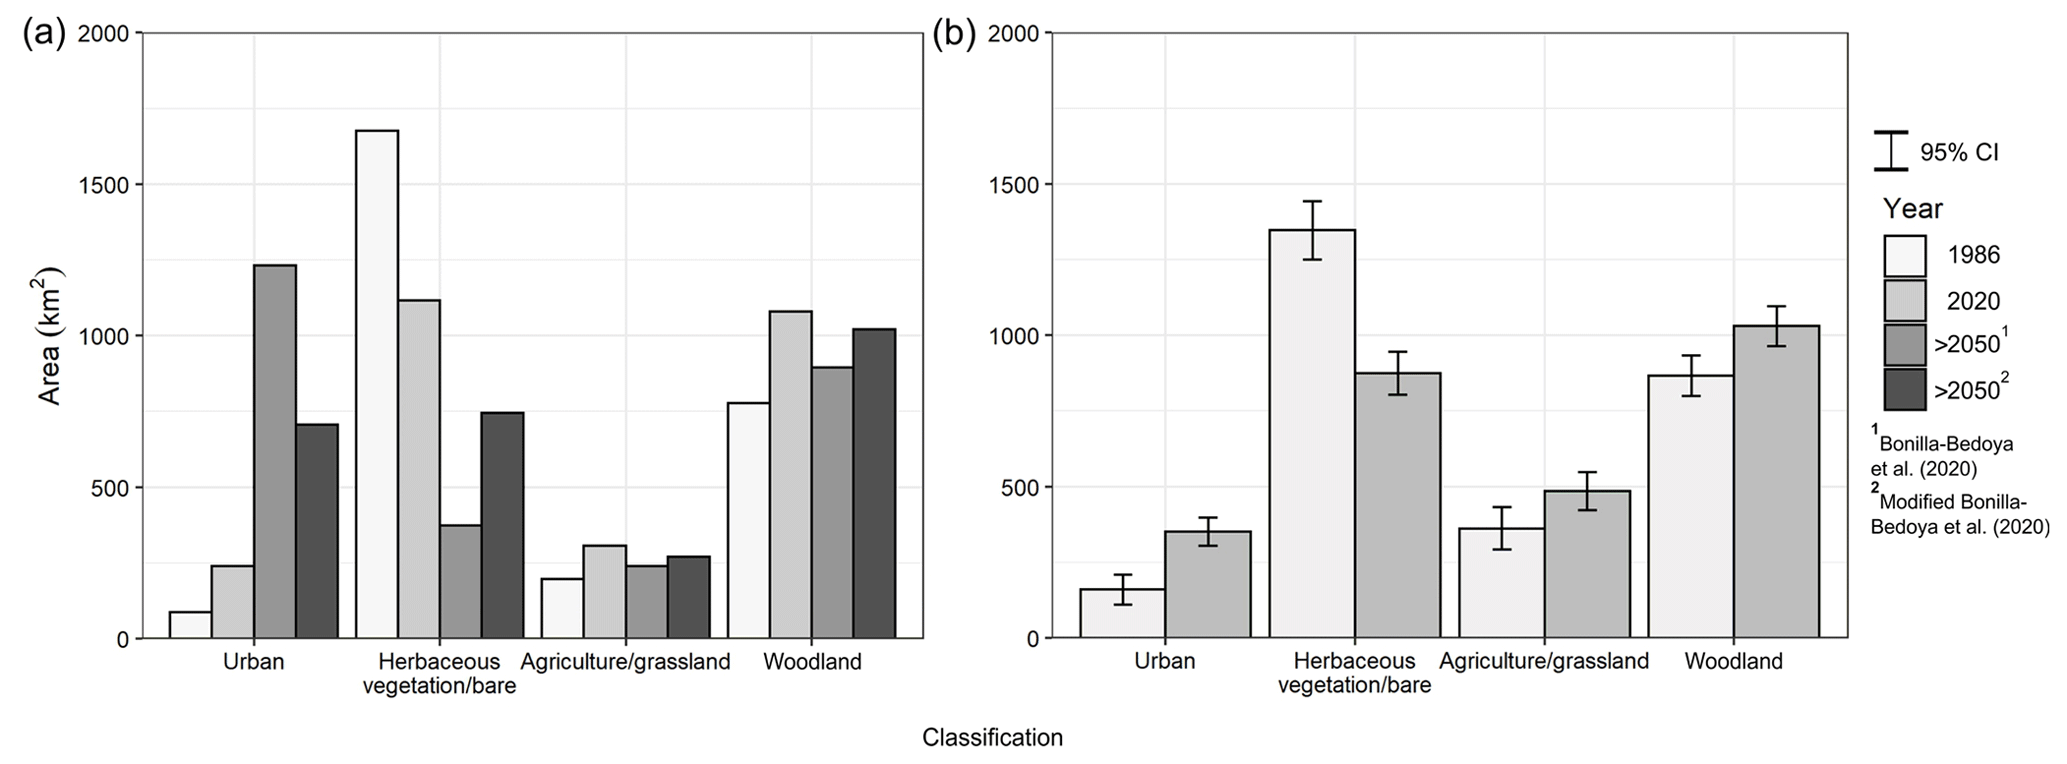
Figure 4(a) Mapped land cover classification results for 1986 and 2020 alongside modelled future land cover from two scenarios (superscript 1 and 2) using data from Bonilla-Bedoya et al. (2020b). (b) Error-adjusted (e.g. Olofsson et al., 2013, 2014) land cover classification results from 1986 and 2020.

Figure 5(a) 3D perspective showing urban growth for 1986–2020 and land cover. (b) Quito's urban area in 2020 compared to modelled future urbanisation (F-U) (Bonilla-Bedoya et al., 2020b) and a modified scenario (M-U). Background is a hillshaded SRTM DEM.
The median elevation of Quito's urban extent in 2020 (2780 m) was similar to 1986 (2810 m); however, the city covered a broader elevation range in 2020, tending towards lower elevations (Fig. 6a), which was also apparent for the F-U and M-U scenarios. The urban class displayed the smallest spread of values for topographic slope (Fig. 6b). Here, the median slope of the urban class was ∼ 5∘ in 1986 and 2020; however, this increased to 11 and 7∘ in the F-U and M-U scenarios respectively, in addition to a broader spread of slope values. Woodland featured the highest median slope of all land cover classes (∼ 28∘) and a comparable median elevation to the urban class (∼ 2700–2800 m).
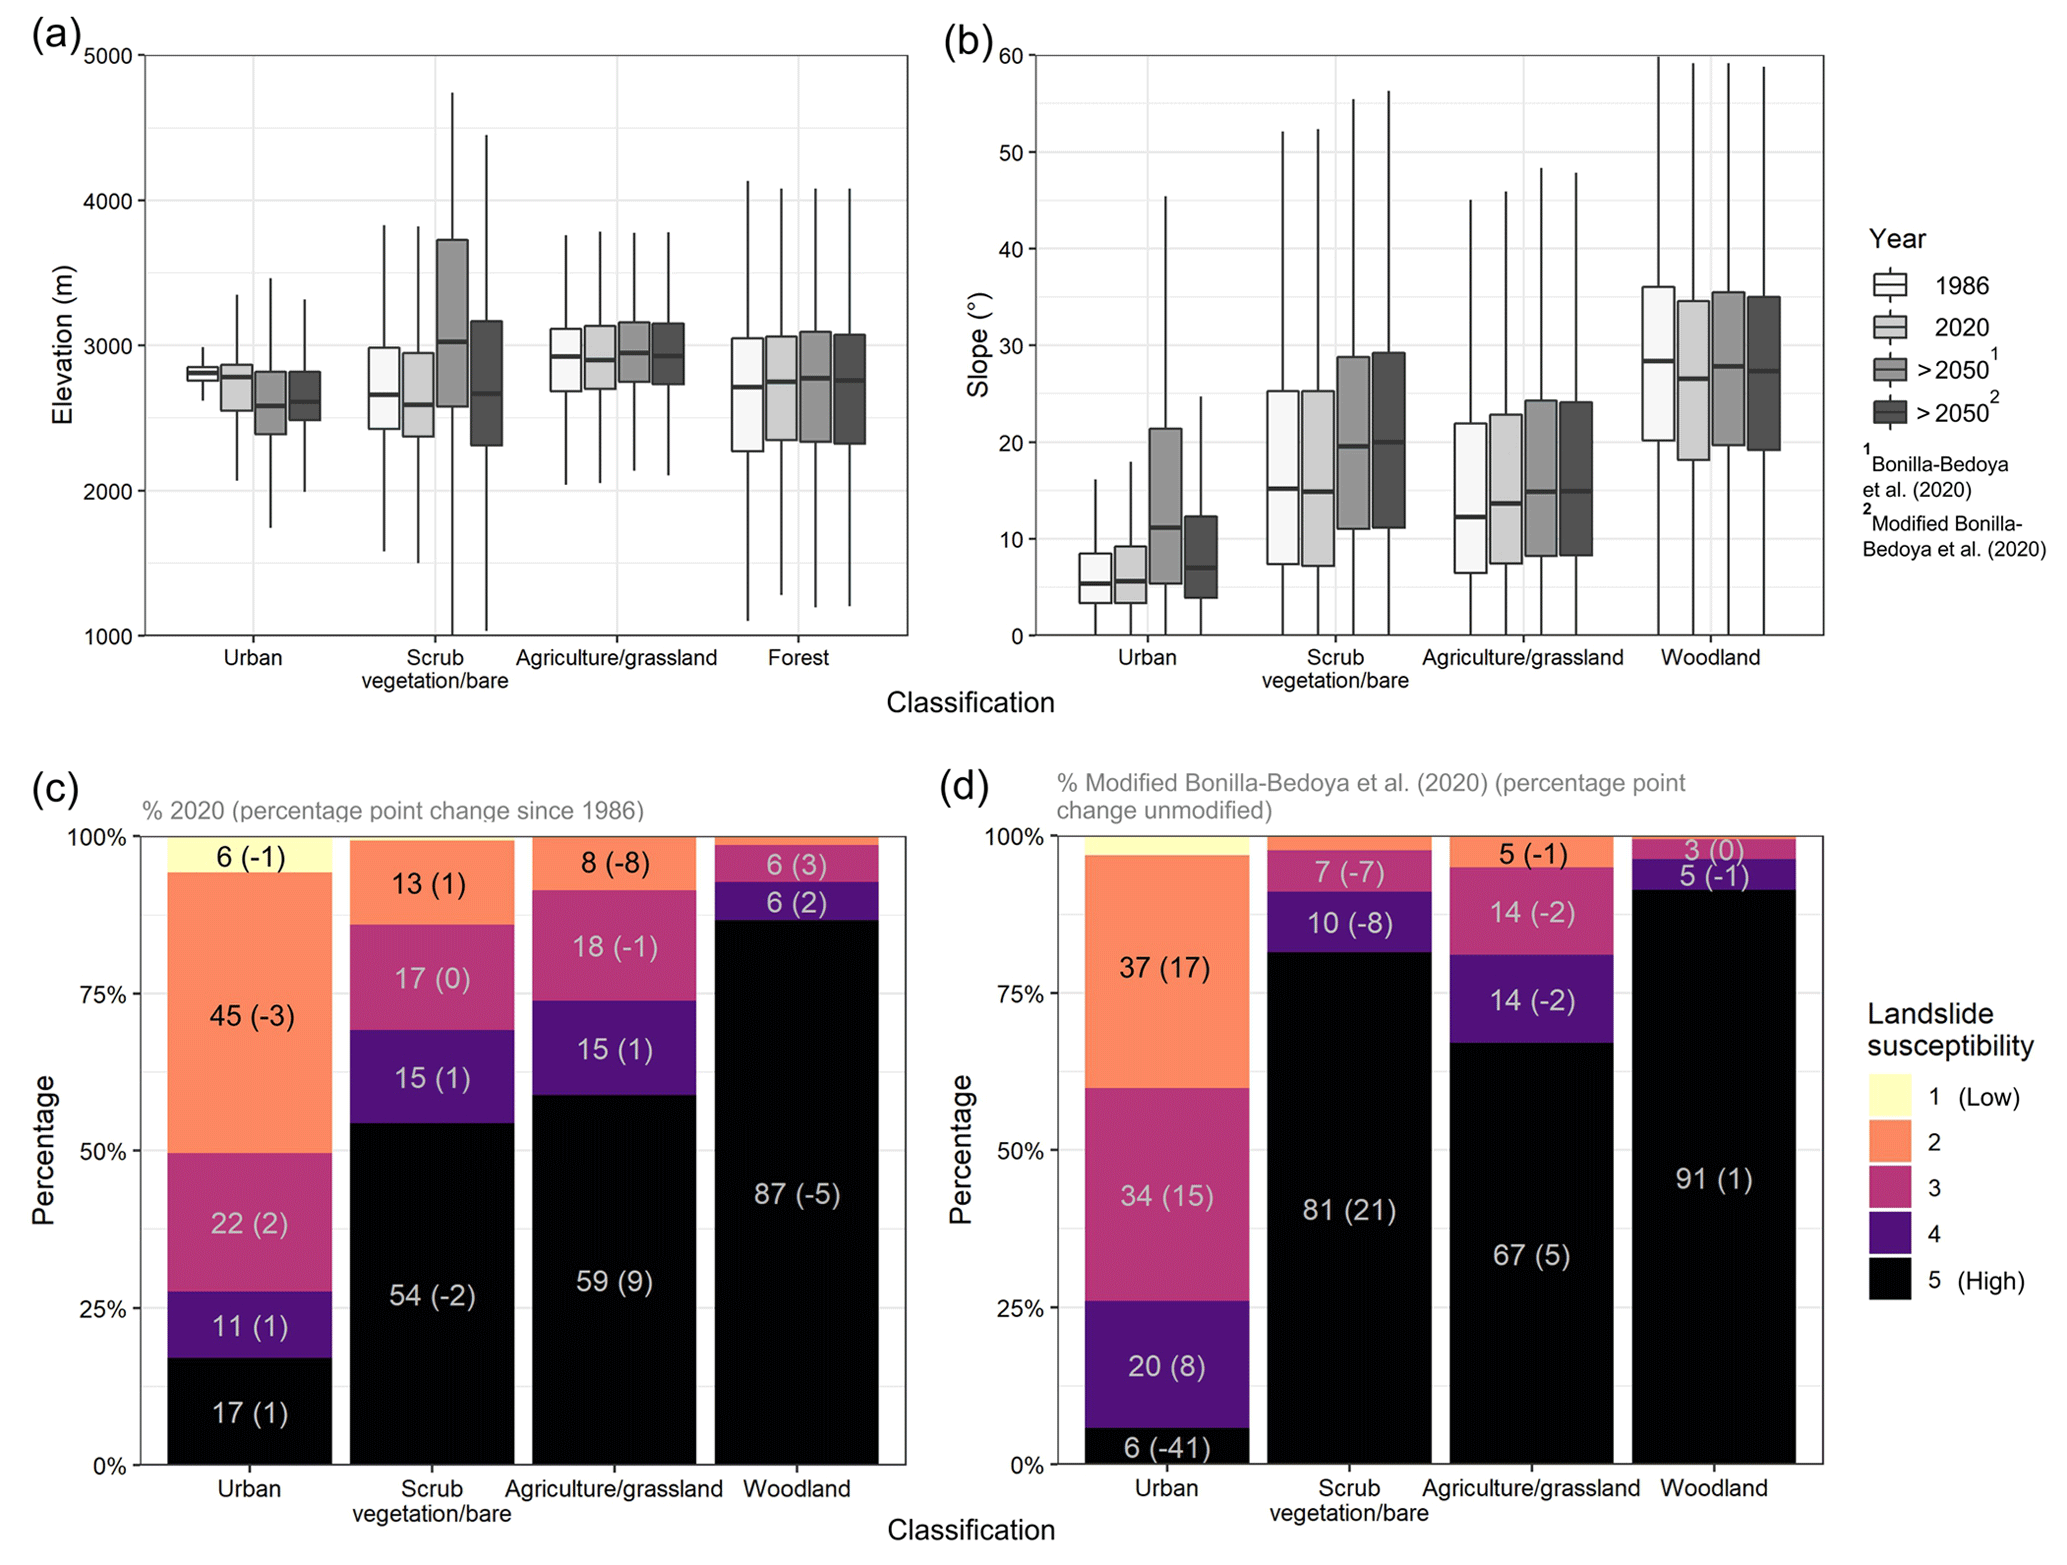
Figure 6Elevation (a) and slope (b) characteristics of the classified and modelled land cover scenarios. Boxes show the interquartile range and the median (horizontal line). Lines show values within 1.5 times the interquartile range. Outliers are not shown. (c) 2020 land cover intersections with landslide susceptibility and the percentage point change since 1986. (d) Future land cover intersections with landslide susceptibility using modified urbanisation probability (M-U) of Bonilla-Bedoya et al. (2020b), as well as the difference compared to the unmodified scenario (F-U).
4.2 Intersection with hazards
Landslides are one of the most common natural hazards in Quito (DMQ, 2018). We found good spatial association between observations of landslide events in Ecuador's Open Government database (2006–2017) and a landslide susceptibility model (Stanley and Kirschbaum, 2017) (Fig. S4). Of 1321 recorded events, 82 % (n=1089) fell within landslide susceptibility categories 3–5, of which 44 % (n=576) were in the highest category (5). A total of 10 events were observed in the lowest category (1). We observed a small change in the landslide susceptibility of the urban class for 1986–2020. Here, the urban area in the highest landslide susceptibility categories (4 and 5) increased by 2 percentage points for 1986–2020 (Fig. 6c). The largest change was observed in the agriculture/grassland class, which featured a 9 percentage point increase in category 5 (high) landslide susceptibility. Woodland mostly occurred within the highest landslide susceptibility category 5 (87 %) (Fig. 6c). Regarding future urbanisation, the M-U scenario restricted future urbanisation in landslide susceptibility category 5; therefore, the observed percentage of urban area in category 5 (6 %) was notably lower than in the F-U scenario (47 %), which did not enforce any restrictions.
Flood events in Quito that were recorded in Ecuador's Open Government database were evaluated alongside a TWI derived from the 10 m resolution Pleiades DEM, noting that this does not account for subsurface drainage. Median TWI values for all flood events (n=1274), clustered flood events where two or more events were located within 40 m of each other (n=125), and a random sample (n=10 000) were 13.3, 14.4, and 12.1 respectively (Fig. S6). Clustered flood events, which displayed the highest TWI, could correspond to areas of nuisance flooding since multiple events are located in close proximity (Kelleher and McPhillips, 2020). Two-sample independent Welch t tests (one-tailed) showed that the difference in TWI values between all flood events and clustered floods events was statistically significantly different from the random sample (p<0.05). Therefore, the mean TWI value was observed to be larger in areas of flood locations compared to the random sample.

4.3 Greenspace
Quito includes multiple types of greenspace that provide ecological, social, and disaster risk reduction benefits (Figs. 1a, 7). Within our AOI, 18.6 km2 of potential DRR greenspace was identified, which covered 6 % of the urban zone (Fig. 8). DMQ-designated greenspace had an area of 36.9 km2, of which 2.5 km2 (7 %) intersected with potential DRR greenspace. Similarly, DMQ-designated safe spaces covered 17.3 km2, of which 1.7 km2 (10 %) intersected with potential DRR greenspace. Comparing DRR greenspaces with hazard information revealed that 62 % of DRR greenspace intersected with areas of high TWI values (≥ 14.4 (median value for clustered flood events; Sect. 4.2)), 10 % intersected with areas of high (category 5) landslide susceptibility, and 6 % intersected with both hazards (Fig. 8b).
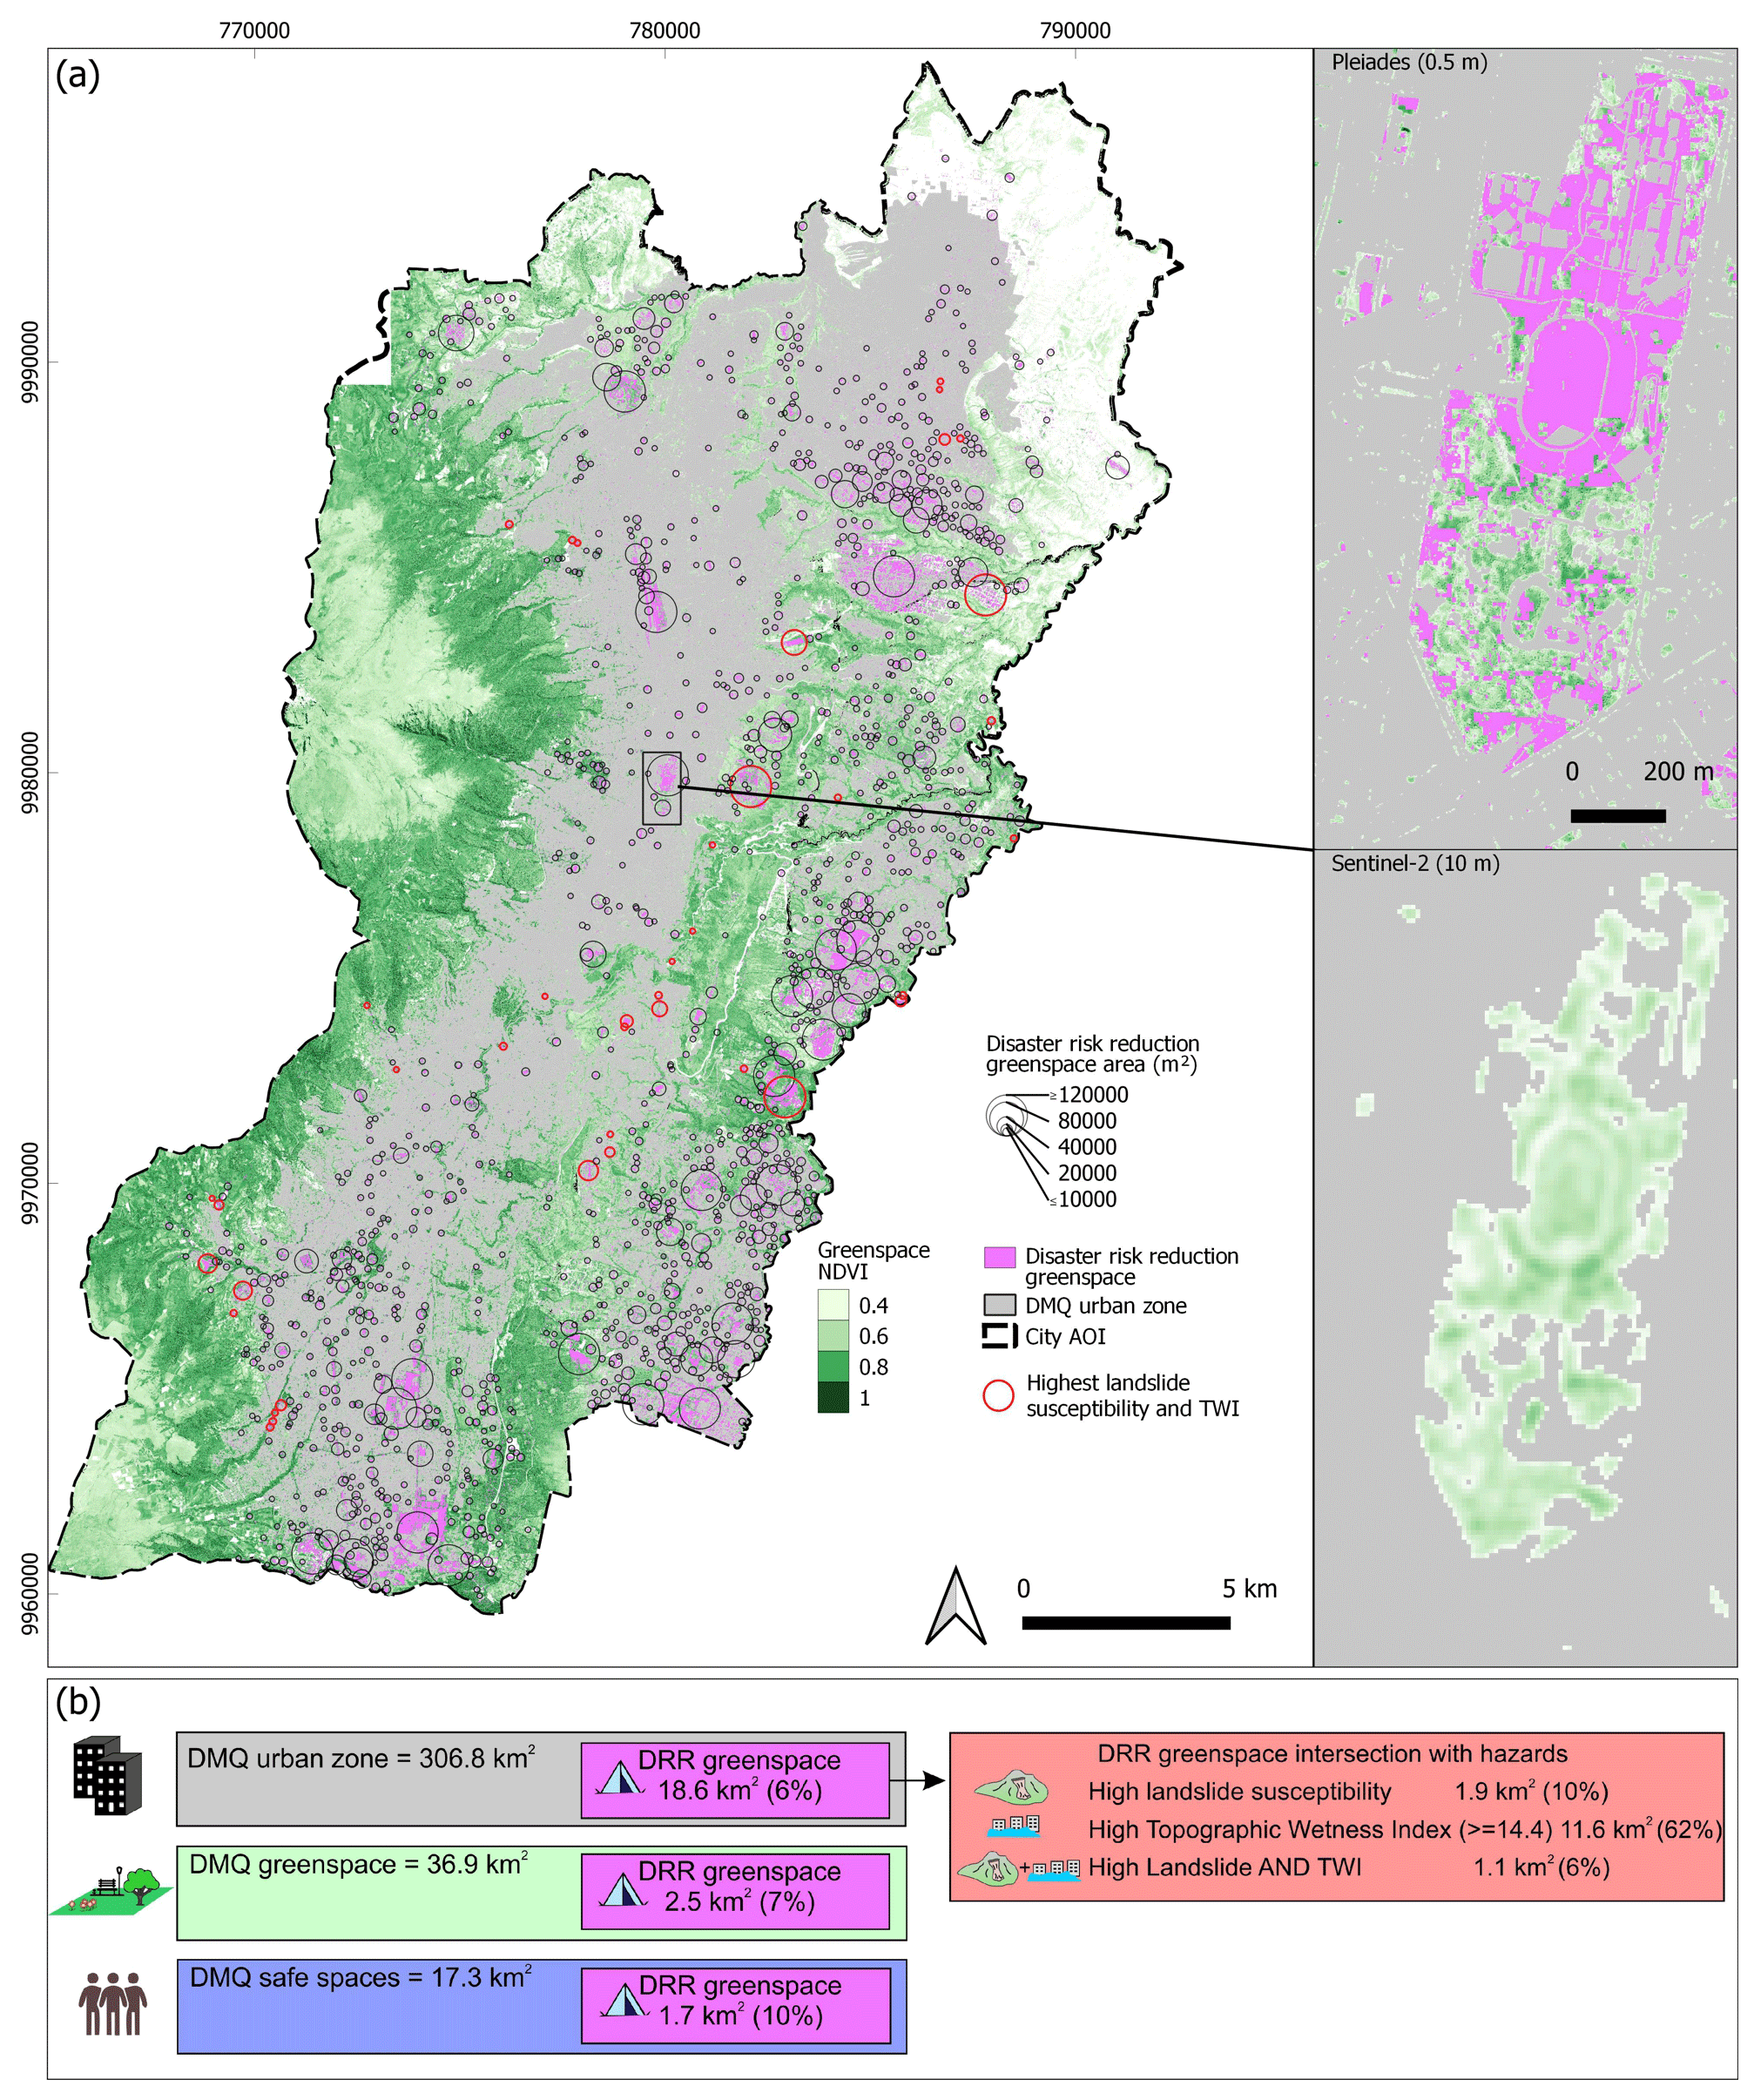
Figure 8(a) Greenspace mapped using the NDVI applied to Pleiades satellite imagery shown with classified potential DRR greenspace (black and red circles, pink shading). Red circles indicate DRR greenspace that intersects with landslide susceptibility class 5 (high) and a topographic wetness index value of ≥ 14.4 (median value for clustered flood events; Sect. 4.2). The inset of Carolina Park shows the similarity of Pleiades-derived greenspace compared to greenspace mapped using Sentinel-2 imagery. The Pleiades inset shows the distribution of potential DRR greenspace (pink) in Carolina Park. (b) Summary of greenspace availability and hazard intersections.
The association between population, socio-economic classification (Instituto Geográfico Militar, 2019), and greenspace accessibility was investigated for greenspaces ≥ 2000 m2. The number of people living within close proximity to designated greenspace was higher than for DRR greenspace (Fig. 9a). For example, 2.3 million (98 %) of Quito's population were within 800 m of a designated greenspace, compared to 2.1 million for the DRR greenspace (88 %). Distance to the nearest greenspace was greater for “low” and “medium-low” socio-economic classifications compared to “high” and “medium-high” (Fig. 9b). Here, the difference in median values was greatest for designated greenspace (466 m), compared to our classification of DRR greenspace (80 m). The amount of designated greenspace per person was smaller for lower socio-economic classifications, with a median of 3 m2 per person for the “low” classification compared to 8 m2 for “high”. However, the amount of DRR greenspace was greatest for lower socio-economic classifications, with a median of 24 m2 per person for “low” compared to 4 m2 for “high” (Fig. 9c). This reflects lower population densities on the city margins (Fig. 9d) and the persistence of agricultural land and undeveloped ground in these areas following urbanisation.
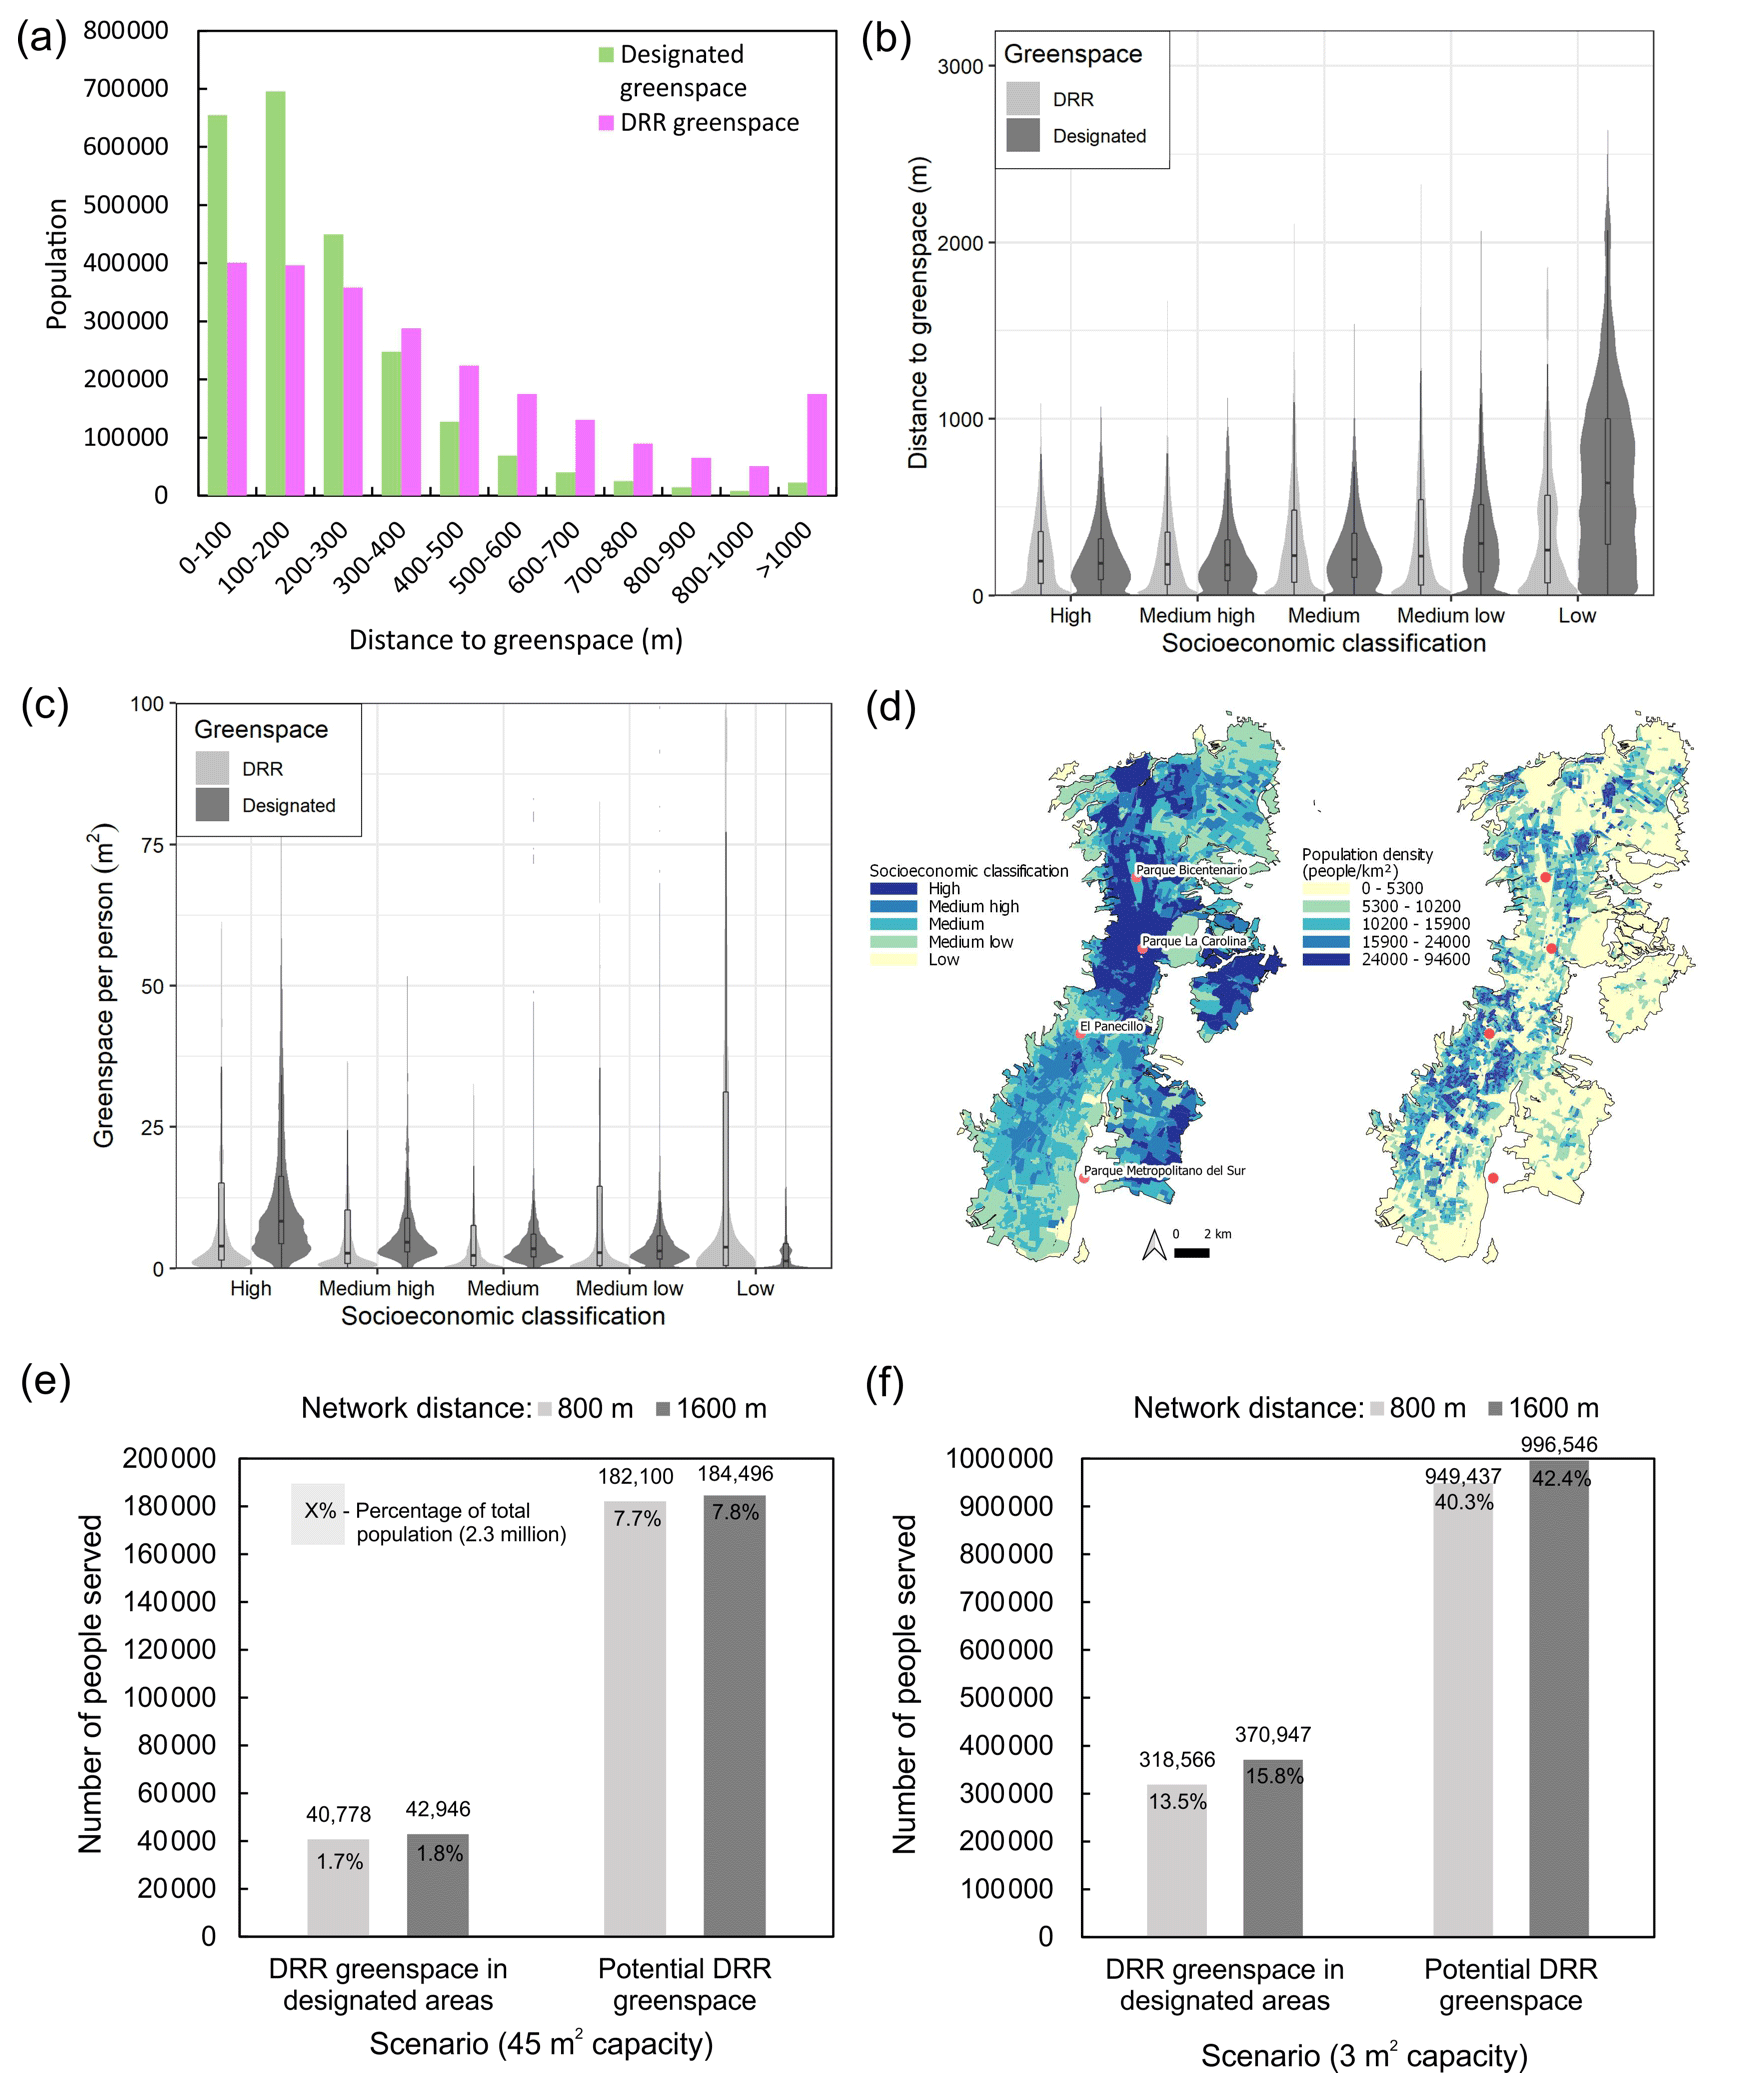
Figure 9(a) Population proximity to designated and DRR greenspace. (b) Violin plot showing distance to the nearest greenspace for each socio-economic classification. Overlaid boxplots show the interquartile range and the median (horizontal line). Lines show values within 1.5 times the interquartile range. Outliers are excluded. (c) Violin plot showing greenspace per person within 800 m for each socio-economic classification. Boxplots are overlaid with outliers excluded, and values >100 m2 per person are not shown. (d) Spatial variation in socio-economic classification and population density for Quito using data from the Instituto Geográfico Militar (2019). (e) Number of people that could be accommodated in DRR greenspace based on an allocation of 45 m2 per person capacity and (f) 3 m2 per person capacity. Panels (e–f) show capacitated populations for a network distance of 800 m (light grey bars) and 1600 m (dark grey bars) from the greenspace centroid and for DRR greenspace in designated spaces compared to all potential DRR greenspace mapped in this study.
4.3.1 Greenspace capacity
We assessed the capacity of each space considering the surrounding population demand. For populations within 800 m, DRR greenspace in currently designated areas could accommodate 1.7 % (40 778) of Quito's population (total 2.3 million) with an allocation of 45 m2 per person or 13.5 % (318 556) with 3 m2 per person (Figs. 9e–f, 10a). Considering all potential DRR greenspace (Fig. 8a), these values are 7.7 % and 40.3 % respectively (Fig. 9e–f). The top 10 DRR strategies providing greenspaces are shown in Figs. 10b and 11. Eight of these spaces overlap fully or partially with currently designated greenspaces or safe spaces, and two did not (Fig. 11). Of these 278 currently designated spaces, only 10 were not over-capacity based on the population demand (Fig. 10b).
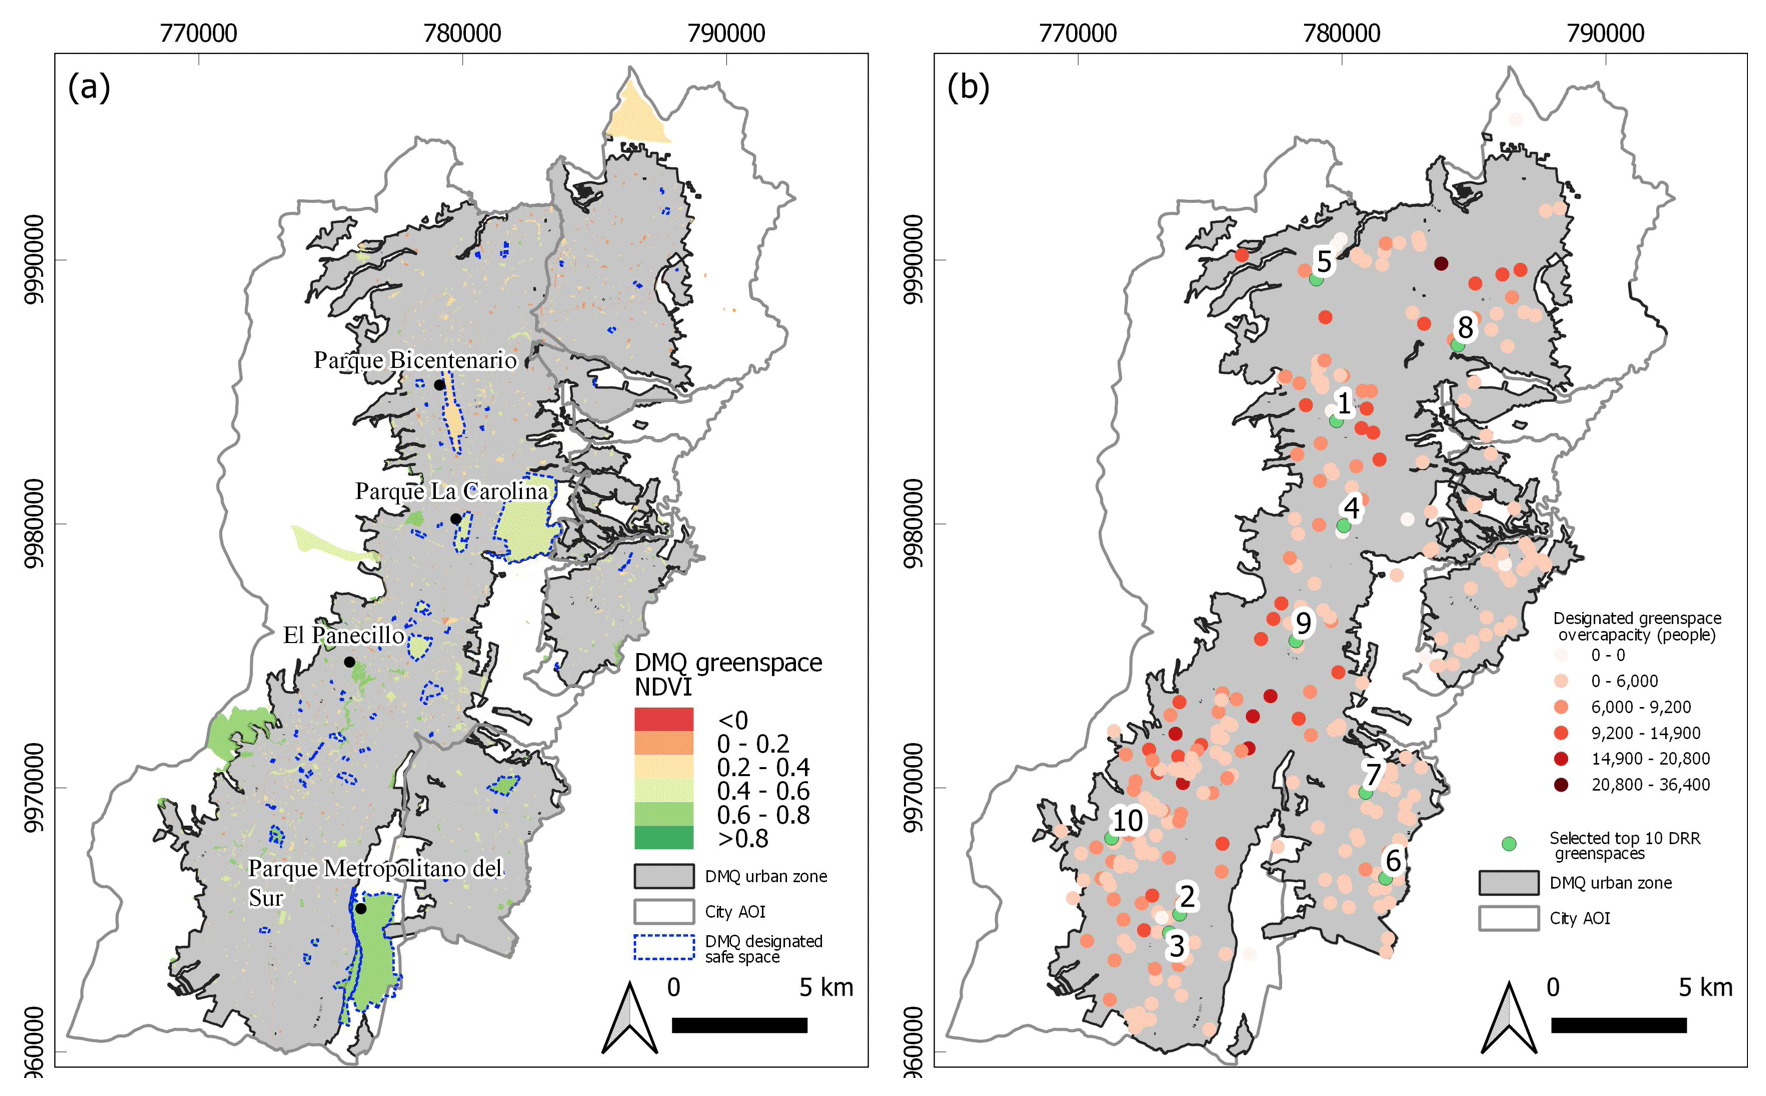
Figure 10(a) Designated green areas and safe spaces (dashed blue polygons) from Open Government data and their mean NDVI extracted using Pleiades satellite data. (b) Overcapacity of DRR greenspace in currently designated greenspaces or safe spaces. Green markers show the top 10 DRR greenspaces based on a maximum capacitated coverage model.
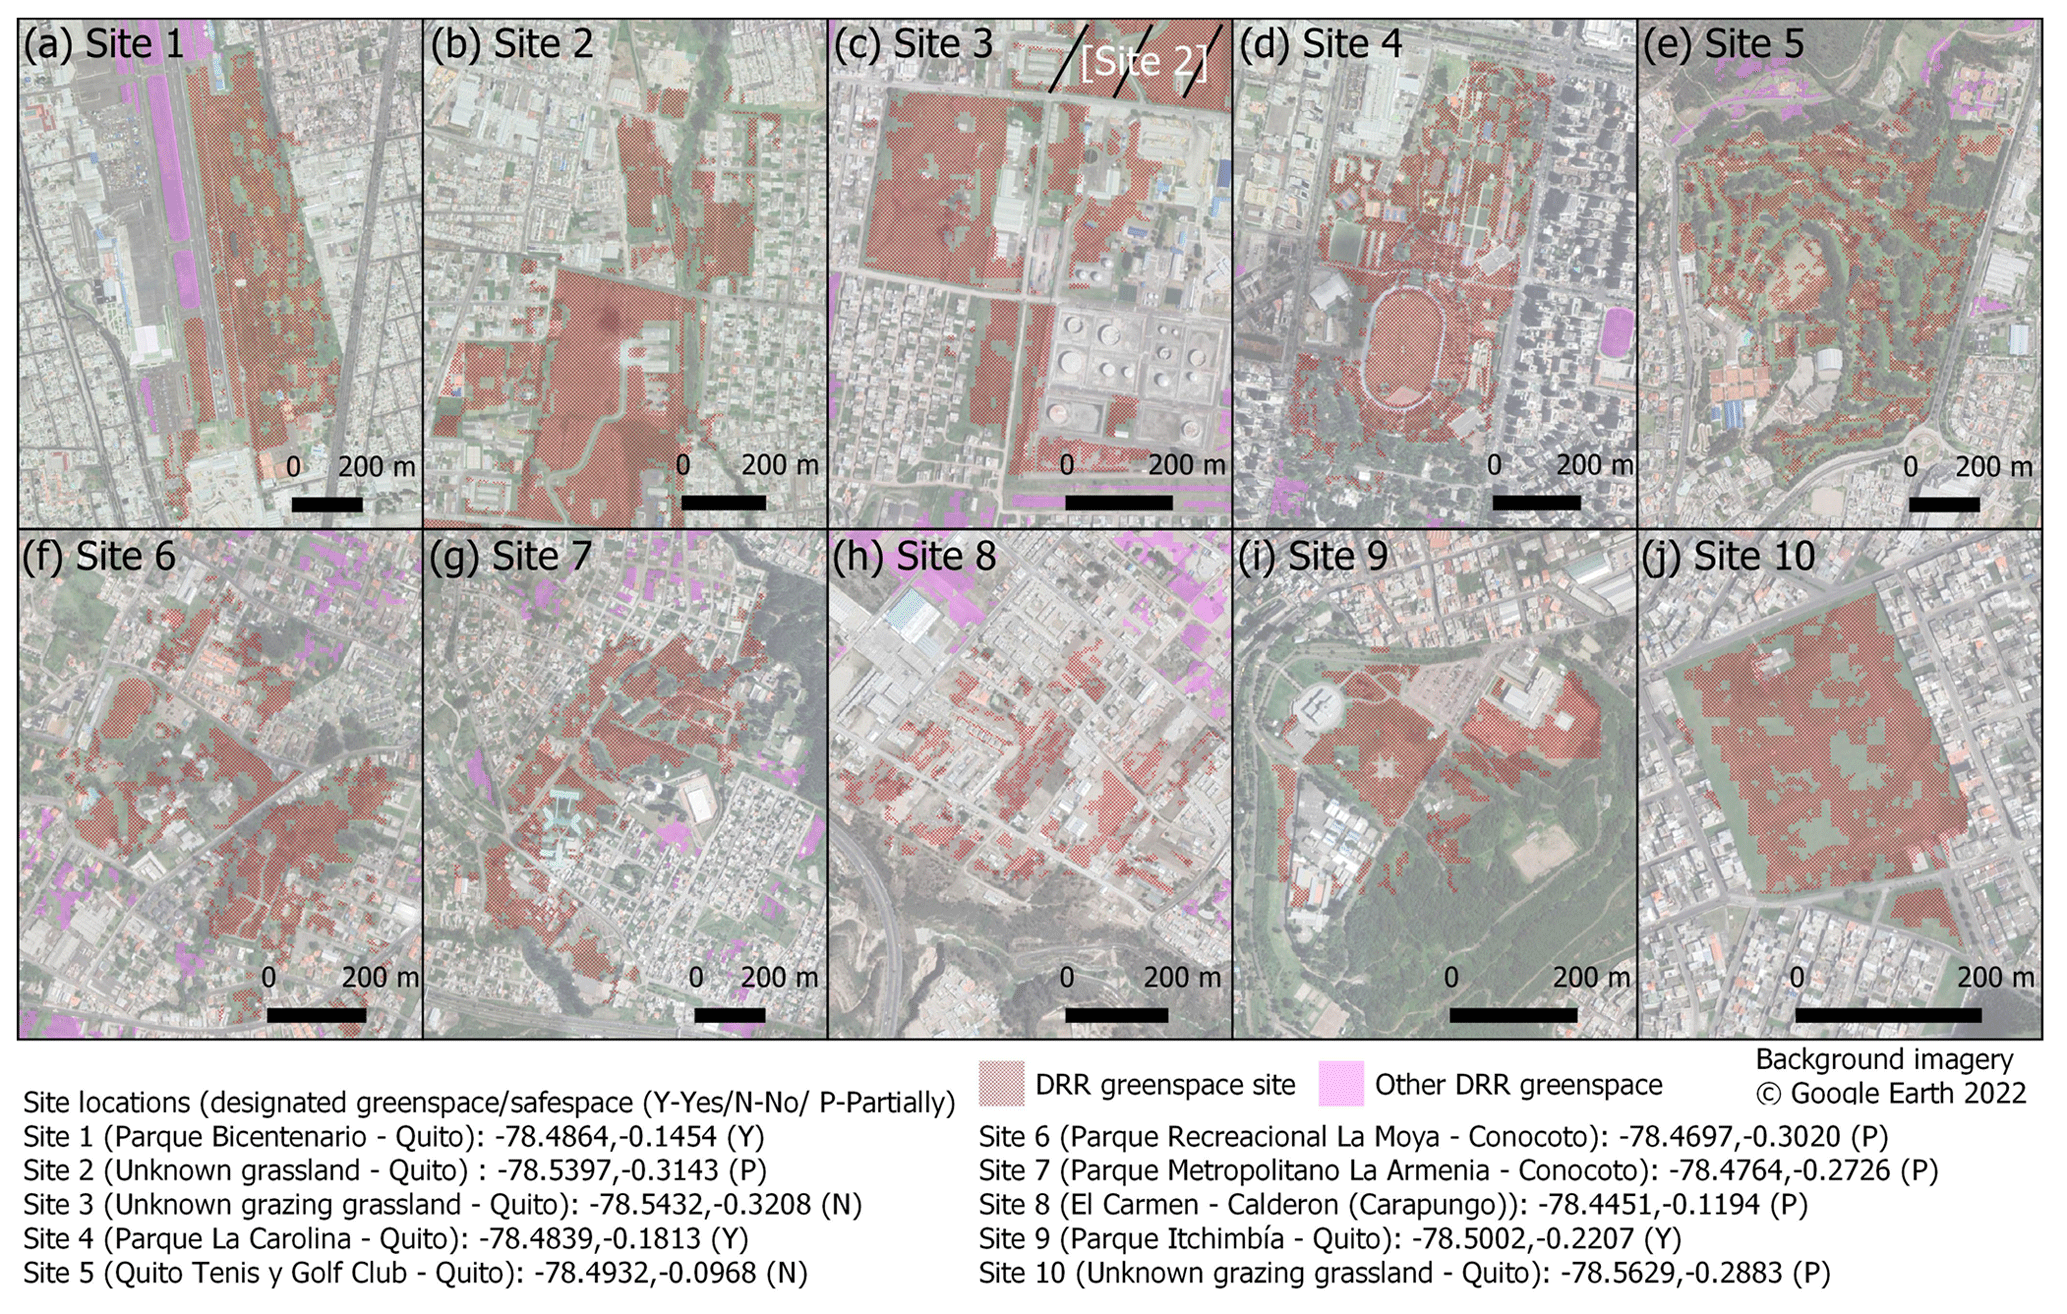
Figure 11Top 10 ranked DRR greenspaces (red) and other nearby DRR greenspaces (pink) derived using a maximum capacitated coverage network analysis, which finds the greenspaces capable of accommodating the most people within 800 m using a minimum space requirement of 3 m2 per person (Sect. 3.4.2).
5.1 Urban growth and hazard intersections
Quito's historical urban expansion is largely aligned north–south, whereas future urban expansion is focussed to the north and east (Fig. 5). Our study captures a period of land occupations starting in the 1980s including the settlement of Atucucho (Figs. 2b, 5a), which formed informally in 1988 (Testori, 2016). This occupation is visible in our land cover classification (Fig. 5a). The formation date is labelled as 2003 in Open Government data (Fig. 2b), which likely reflects its origins as an informal settlement that was potentially not included in official maps until 2003. In this case, satellite imagery can capture the urban sprawl of a city, including occupations that may not be apparent in historical maps. However, image classification methods usually only capture 2D sprawl and not vertical high-rise developments or redevelopments that are important for measuring exposure to natural hazards (e.g. Amey et al., 2021). Quito's past and projected urban growth has been studied by several authors in recent years (e.g. Bonilla-Bedoya et al., 2020b; Salazar et al., 2020; Valencia et al., 2020). Cross-comparisons are complicated by the use of different study areas since Quito's urban area now exceeds the designated metropolitan district boundary, which has prompted investigations to create a new district area (Salazar et al., 2021). By comparing our urban classification (year 2020) to that of Bonilla-Bedoya et al. (2020b) (year 2016) within the same area of interest, we find urban areas of 213 and 210 km2 respectively, which indicates classification consistency using EO data despite different methodological approaches.
We observed that expansion of Quito and future projections tend towards lower elevations (Fig. 6a) and steeper slopes (Fig. 6b), the latter of which is associated with encroachment into areas of high landslide susceptibility (Fig. 6c, d). Limited urban expansion to the west of Quito on the steep slopes of Pichincha volcano suggests that a programme of protection to avoid encroachment is working (Vidal et al., 2015). However, several of these areas or their vicinities are inhabited because of previous land invasion dynamics that affected the peripheral green belt. They can be characterised from a spatial and socio-economic approach as a homogeneous space, in which the less economically favoured classes experience greater possibilities of isolation from other social groups (Bonilla-Bedoya et al., 2020a). Further limiting eastward urban growth reduces the ashfall and lahar hazard in the event of an eruption (Fig. 2c) and the hazard posed by landslides (Fig. 2d). Additionally, the predominantly woodland slopes east of Quito (Fig. 5a) featured the highest landslide susceptibility scores (87 % of woodland is in class 5 (high) (Fig. 6c)) and are therefore a valuable target for protection against urbanisation. Our observed decreasing elevation trend of Quito's urban area (Fig. 6a) reflects north–south and eastward expansion into lower-lying flatter areas such that at a city scale, Quito's landslide susceptibility did not notably increase from 1986 to 2020 (Fig. 6c). These areas are also the location of projected future expansion (Bonilla-Bedoya et al., 2020b; Salazar et al., 2020; Valencia et al., 2020), predominantly through conversion of scrub vegetation and bare ground (Fig. 5a). Notable ravines exist in these areas; therefore, risk-informed planning to reduce encroachment on steep slopes, which was reflected in our M-U future urban scenario, is desirable to minimise landslide risk to future developments. These areas are also likely to be most susceptible to multi-hazards such as rainfall-triggered lahar remobilisation or landslides, as well as flood- and earthquake-triggered landslides (Gill and Malamud, 2017). Similarly, the filling of ravines from the 17th century onwards restricts the drainage capacity during intensive rainfall and increases flood risk (Aragundi et al., 2016); therefore, incorporating additional DRR greenspaces here to attenuate run-off and store water could be beneficial.
While risk-informed urbanisation can mitigate some hazards such as landslides, an intensive earthquake hazard exists in Quito (Fig. S1) such that urban risk reduction requires building resilience at community to city-wide levels (Alvarado et al., 2014; Valcárcel et al., 2017). A key element of resilience is the access to “safe spaces” following an earthquake event in which communities can avoid damaged buildings and infrastructure and receive emergency aid (Sphere Association, 2018). These spaces are increasingly viewed within a broader network of benefits to society and ecosystems (e.g. Fig. 1a) and are framed within Eco-DRR strategies (UNDRR, 2020). We therefore evaluated greenspaces in Quito that could offer DRR capabilities by both considering existing designated greenspaces and assessing other non-designated greenspaces.
5.2 Greenspace
Our study was designed to identify the basic requirements for sites that could be designated or developed as DRR greenspace using an earth-observation-based methodology that could be adapted and applied to other cities. This is timely since greenspace is becoming increasingly desirable to improve environment quality and contribute to addressing climate breakdown, and greenspace within Eco-DRR strategies can simultaneously mitigate against multiple hazards (Onuma and Tsuge, 2018; McVittie et al., 2018; Sudmeier-Rieux et al., 2021). Our DRR greenspace primarily addresses the basic requirements of people-space and amenable topography for medium- to long-term accommodation requirements, such as following a major earthquake. Examples are shown in Fig. 12 for areas in central Quito and on the periphery. Regarding urban risk, green space in Quito has been thought of from the perspective of threat. For example, interventions have been developed on the slopes of Pichincha from a logic of risk mitigation (Vidal et al., 2015). Recently, after the 2016 Ecuador earthquake, green and open spaces were incorporated throughout the city as safe points in case of evacuation (Rebotier, 2016) (Fig. 10a).
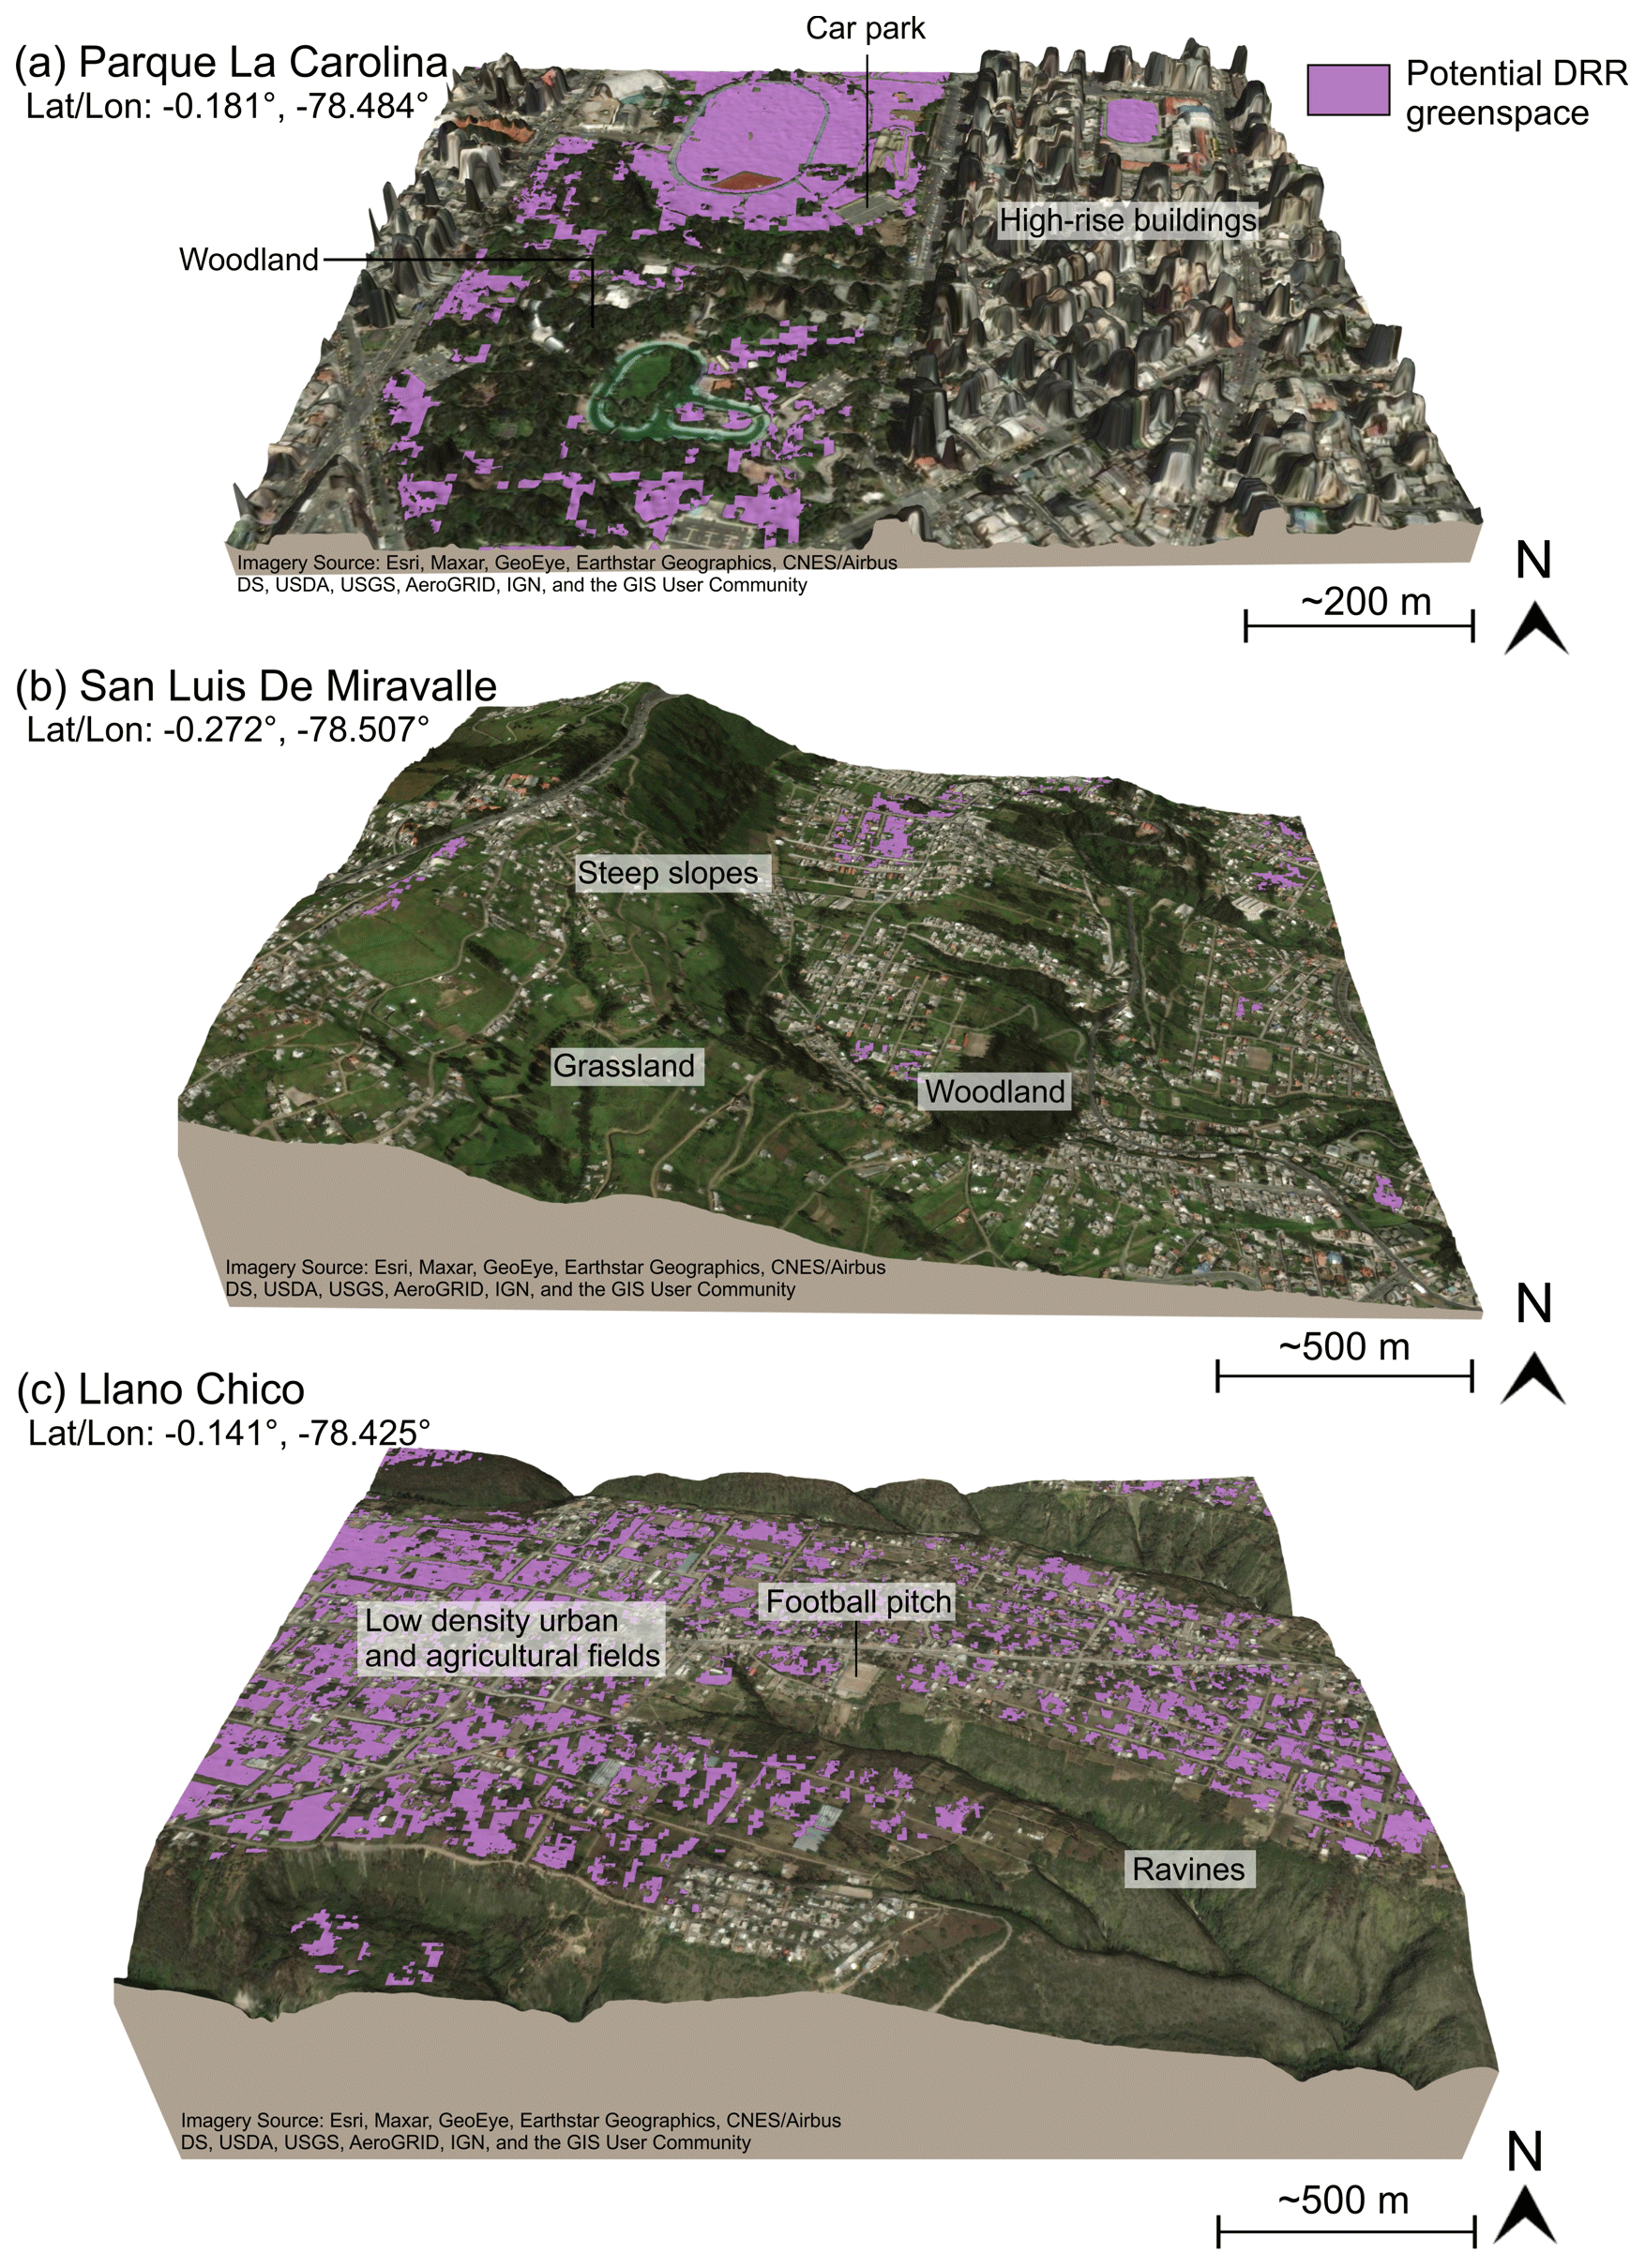
Figure 123D perspective showing examples of potential DRR greenspace identified in Quito. (a) Parque La Carolina is in central Quito amongst commercial high-rise buildings. (b) San Luis De Miravalle is located on the southeast of Quito and is characterised by lower-density urban development and steep slopes. (c) Llano Chico is in the east of Quito with low-density urban development mixed with agricultural land that is bounded by steep ravines.
We found that 7 % (2.5 km2) of the DMQ-designated greenspace was identified as potential DRR greenspace. Similarly, 10 % (1.7 km2) of the DMQ-designated safe spaces intersected with our classified DRR greenspace (Figs. 8, 10a). The total area of potential DRR greenspace within Quito was 18.6 km2; therefore, a large potential exists to incorporate new greenspaces into a DRR framework, especially in the south and east of the city, which are locations of projected future expansion and where urban expansion and population densities are lower (Figs. 5b, 9d). New designation of greenspaces could address some of the imbalance between greenspace access since 98 % (∼ 2.3 million) of Quito's population was within 800 m of a designated greenspace, compared to 2.1 million for the DRR greenspace (88 %) (Fig. 9a). Lower socio-economic classifications had a greater distance to travel to the nearest designated greenspace and a lower greenspace area per person overall (Fig. 9b, c), which was also observed by Cuvi et al. (2021), noting that informal developments have less access to larger designated parks. We found a median designated greenspace of 3 m2 per person for the “low” socio-economic classification. However, the availability of potential DRR greenspace to these same communities (median of 24 m2) shows that additional designations could help address the imbalance. This is also aligned with Quito's Vision 2040 document to increase greenspace in urban areas to ∼ 9 m2 per person (DMQ, 2018). Critical to addressing these inequalities is to ensure that all formal and informal settlements are reflected in socio-economic statistics and included in official maps.
Although we found high accessibility of greenspace within 800 m of populations, the capacity to serve surrounding populations for emergency refuge was 1.7 % considering the recommended space allocation of 45 m2 per person (Fig. 9a) (Sphere Association, 2018). Incorporating all additional spaces that are DRR suitable could increase this to 8 % or 40 % using a minimum living allocation of 3 m2 per person (Sphere Association, 2018). A network analysis producing the ranked top 10 DRR greenspaces (Fig. 11) showed that eight intersected with currently designated greenspaces or safe spaces, and two did not. These two spaces could be investigated for negotiating formal access to these spaces for use in an emergency, such as the golf course forming Site 5 (Fig. 11e).
We focus on greenspace as an emergency refuge; however, these spaces can also contribute to mitigating hazards both through physical processes such as water retention or slope stabilisation (Phillips and Marden, 2005; Maragno et al., 2018; Sandholz et al., 2018) and also through their existence in places that would be hazardous if urbanised. We found that of the potential DRR greenspace identified in Quito, 62 % intersected with TWI values indicative of potential flooding (Sect. 4.2), 10 % with areas of high landslide susceptibility, and 6 % with both hazards (Fig. 8, red circles). Therefore, there is potential to mitigate future risk by maintaining greenspace and therefore avoiding development in potentially hazardous areas, as well as incorporating additional DRR greenspaces that are not exposed to hazards for use as refuges.
5.3 Future work
Our study has provided a city-wide assessment of Quito's historical and future growth projections, as well as the potential role of greenspace in reducing disaster risk. The first-pass analysis of greenspace suitable for DRR could be used for local community-scale evaluation and stakeholder engagement to deliver improved resilience for the city. Subsequently, the methodology could be expanded to define a continuum of greenspace suitability for DRR by incorporating other important factors including site-specific suitability trade-offs such as land value, ownership, and access to water, electricity, and hospitals (Anhorn and Khazai, 2015; Hosseini et al., 2016). Similarly, we focussed on greenspaces since these spaces are most likely to be accessible, and they provide multiple benefits; however, concreted grey spaces such as commercial car parks could also serve a role in providing safe spaces for DRR, particularly if a disaster event occurred during work hours. Methodological developments could include multi-temporal and potentially higher-resolution datasets, for example landslide susceptibility information that reflects changing land cover and therefore an evolving hazard (Emberson et al., 2020). For example, a dynamic landslide susceptibility map could consider a potentially increased landslide hazard due to road cuttings in areas undergoing urban development (Froude and Petley, 2018) and the dynamic nature of landslide hazard in response to precipitation events (Kirschbaum and Stanley, 2018). Additionally, our investigation of flood events alongside a TWI would benefit from a better understanding of the capacity and distribution of the subsurface drainage network within Quito, particularly where natural drainage channels are blocked (e.g. Aragundi et al., 2016). Nonetheless, our assumptions that all flood water would flow on the surface represents a worst-case scenario during a flood event in which the artificial drainage network is at capacity.
The use of EO-based datasets broadens the applicability of our methods to other cities. Whilst other sources of multispectral satellite imagery (e.g. 3 m resolution PlanetScope or 10 m resolution Sentinel-2) could still delineate the types of greenspaces relevant to DRR (e.g. Fig. 8 inset), we relied on a high-resolution Pleiades DEM to provide topographic relief information on the greenspace DRR suitability. Global 30 m resolution DEMs could likely substitute this in some cases, though they are potentially less suitable in densely built urban environments where flat open greenspaces are interspaced with tall buildings and trees for example (Fig. 12a), which cannot be distinguished in 30 m elevation models. Here, elevation and slope values derived from 30 m resolution DEM represent an average of features (for example buildings, cars, and trees) within the 30 m cell. Therefore, the topography of greenspaces is resolved in less detail.
In this study, we used a combination of satellite data analysis and secondary datasets to quantify Quito's historical growth, future intersection with hazards, and distribution of greenspace within the city. Quito's historical growth (∼ 192 km2 1986 to 2020) was primarily on flatter, former agricultural land; hence there was limited encroachment towards hazards of Pichincha volcano and areas of higher landslide susceptibility. However, our work shows that future urbanisation projections suggest an increasing intersection between urban areas and areas of high landslide susceptibility, which requires risk-informed planning to mitigate. General accessibility of greenspaces is high, with 98 % (2.3 million) of Quito's population within 800 m of a designated greenspace and 88 % (2.1 million) for the DRR greenspace classification. However, within 800 m, the capacity of currently designated greenspaces and safe spaces would only fulfil 2 % of Quito's population needs if required for emergency refuge. Over 40 % could be accommodated by incorporating new DRR greenspaces identified in this study. We also found a disparity between access to greenspaces across socio-economic classifications, with low-medium groups having less access to designated greenspace (3 m2 per person for the “low” classification compared to 8 m2 for “high”). In some cases, these low-medium groups have the greatest opportunity for future designation of DRR greenspace due to their location on the city periphery in areas of lower population density. Our workflow uses satellite data to provide a first-pass evaluation of DRR greenspace potential and could therefore be adapted for application in other urbanising cities. The results provide the foundation to evaluate these spaces with stakeholders at community to city-wide scales since promoting equitable access to greenspaces, communicating their multiple benefits, and considering their use to restrict development in hazardous areas will be key to sustainable, risk-informed urban growth.
The data used to support the findings and results of this study are available in the Supplement and in the Zenodo repository https://doi.org/10.5281/zenodo.5881876 (Watson et al., 2022). Pleiades imagery data were provided through the CEOS Seismic Hazard Demonstrator and are restricted by license.
The supplement related to this article is available online at: https://doi.org/10.5194/nhess-22-1699-2022-supplement.
All authors have read and agreed to the published version of the manuscript. CSW, ES, MAV, JRE, and SKE designed the concept. JRE, CZ, SBB, PC, and DFO provided access to datasets. CSW performed the analysis and prepared the figures. CSW wrote the manuscript with input from JRE, SKE, MAV, CZ, SBB, PC, DFO, MC, JM, and ES.
The contact author has declared that neither they nor their co-authors have any competing interests.
Publisher’s note: Copernicus Publications remains neutral with regard to jurisdictional claims in published maps and institutional affiliations.
The Committee on Earth Observation Satellites (CEOS) and Centre national d'études spatiales (CNES) are thanked for providing access to the Pleiades satellite imagery used in this study. Pleiades images were made available by CNES in the framework of the CEOS Working Group for Disasters. © CNES (2018, 2019, 2020) and Airbus DS, all rights reserved. Commercial uses forbidden.
This research has been supported the UK Research and Innovation (UKRI) Global Challenges Research Fund (GCRF) Urban Disaster Risk Hub (grant no. NE/S009000/1) (Tomorrow's Cities), a NERC Innovation award (grant no. NE/S013911/1), and COMET. COMET is the NERC Centre for the Observation and Modelling of Earthquakes, Volcanoes and Tectonics, a partnership between UK Universities and the British Geological Survey. John Elliott is supported by a Royal Society University Research fellowship (UF150282), and Susanna Ebmeier is supported by a NERC Independent Research Fellowship (NE/R015546/1).
This paper was edited by Paolo Tarolli and reviewed by Esthela Salazar and one anonymous referee.
Airbus Defence and Space: Pléiades Imagery User Guide, https://www.intelligence-airbusds.com/en/8718-user-guides (last access: 29 October 2019), 2012.
Allan, P., Bryant, M., Wirsching, C., Garcia, D., and Rodriguez, M. T.: The Influence of Urban Morphology on the Resilience of Cities Following an Earthquake, Journal of Urban Design, 18, 242–262, https://doi.org/10.1080/13574809.2013.772881, 2013.
Altieri, M. A., Companioni, N., Cañizares, K., Murphy, C., Rosset, P., Bourque, M., and Nicholls, C. I.: The greening of the “barrios”: Urban agriculture for food security in Cuba, Agr. Hum. Values, 16, 131–140, https://doi.org/10.1023/A:1007545304561, 1999.
Alvarado, A., Audin, L., Nocquet, J. M., Lagreulet, S., Segovia, M., Font, Y., Lamarque, G., Yepes, H., Mothes, P., Rolandone, F., Jarrín, P., and Quidelleur, X.: Active tectonics in Quito, Ecuador, assessed by geomorphological studies, GPS data, and crustal seismicity, 33, 67–83, https://doi.org/10.1002/2012tc003224, 2014.
Amey, R. M. J., Elliott, J. R., Hussain, E., Walker, R., Pagani, M., Silva, V., Abdrakhmatov, K. E., and Watson, C. S.: Significant Seismic Risk Potential from Buried Faults Beneath Almaty City, Kazakhstan, revealed from high-resolution satellite DEMs, Earth and Space Science, 8, e2021EA001664, https://doi.org/10.1029/2021EA001664, 2021.
Anhorn, J. and Khazai, B.: Open space suitability analysis for emergency shelter after an earthquake, Nat. Hazards Earth Syst. Sci., 15, 789–803, https://doi.org/10.5194/nhess-15-789-2015, 2015.
Aragundi, S. M., Mena, A. P., and Zamora, J. J.: Historical Urban Landscape as a Descriptive Feature for Risk Assessment: the “Quebradas” of Quito, FICUP. An International Conference on Urban Physics, Quito – Galápagos, Ecuador, 26–30 September 2016.
Aronson, M. F., Lepczyk, C. A., Evans, K. L., Goddard, M. A., Lerman, S. B., MacIvor, J. S., Nilon, C. H., and Vargo, T.: Biodiversity in the city: key challenges for urban green space management, Front. Ecol. Environ., 15, 189–196, https://doi.org/10.1002/fee.1480, 2017.
Baker, J. L.: Climate Change, Disaster Risk, and the Urban Poor: Cities Building Resilience for a Changing World, Urban Development, Washington, DC, World Bank, https://openknowledge.worldbank.org/handle/10986/6018 (last access: 16 May 2022), 2012.
Bauwelinck, M., Casas, L., Nawrot, T. S., Nemery, B., Trabelsi, S., Thomas, I., Aerts, R., Lefebvre, W., Vanpoucke, C., Van Nieuwenhuyse, A., Deboosere, P., and Vandenheede, H.: Residing in urban areas with higher green space is associated with lower mortality risk: A census-based cohort study with ten years of follow-up, Environ. Int., 148, 106365, https://doi.org/10.1016/j.envint.2020.106365, 2021.
Beauval, C., Mariniere, J., Yepes, H., Audin, L., Nocquet, J. M., Alvarado, A., Baize, S., Aguilar, J., Singaucho, J., and Jomard, H.: A New Seismic Hazard Model for Ecuador, B. Seismol. Soc. Am., 108, 1443–1464, https://doi.org/10.1785/0120170259, 2018.
Benedict, M. and MacMahon, E.: Green Infrastructure: Smart Conservation for the 21st Century, Renewable Resources Journal, 20, 12–17, 2002.
Beven, K. J. and Kirkby, M. J.: A physically based, variable contributing area model of basin hydrology/Un modèle à base physique de zone d'appel variable de l'hydrologie du bassin versant, Hydrol. Sci. B., 24, 43–69, https://doi.org/10.1080/02626667909491834, 1979.
Bonilla-Bedoya, S., Estrella, A., Vaca Yánez, A., and Herrera, M. Á.: Urban socio-ecological dynamics: applying the urban-rural gradient approach in a high Andean city, Landscape Res., 45, 327–345, https://doi.org/10.1080/01426397.2019.1641589, 2020a.
Bonilla-Bedoya, S., Mora, A., Vaca, A., Estrella, A., and Herrera, M. Á.: Modelling the relationship between urban expansion processes and urban forest characteristics: An application to the Metropolitan District of Quito, Comput. Environ. Urban, 79, 101420, https://doi.org/10.1016/j.compenvurbsys.2019.101420, 2020b.
Borland, J.: Small parks, big designs: reconstructed Tokyo's new green spaces, 1923–1931, Urban History, 47, 106–125, https://doi.org/10.1017/S0963926819000567, 2020.
Boulton, C., Dedekorkut-Howes, A., and Byrne, J.: Factors shaping urban greenspace provision: A systematic review of the literature, Landscape Urban Plan., 178, 82–101, https://doi.org/10.1016/j.landurbplan.2018.05.029, 2018.
Bryant, M. and Allan, P.: Open space innovation in earthquake affected cities, in: Approaches to Disaster Management – Examining the Implications of Hazards, Emergencies and Disasters, edited by: Tiefenbacher, J. P., London, In-Tech, 230 pp., https://doi.org/10.5772/55465, 2013.
Cardona, O.-D., van Aalst, M. K., Birkmann, J., Fordham, M., McGregor, G., Perez, R., Pulwarty, R. S., Schipper, E. L. F., Sinh, B. T., Décamps, H., Keim, M., Davis, I., Ebi, K. L., Lavell, A., Mechler, R., Murray, V., Pelling, M., Pohl, J., Smith, A.-O., and Thomalla, F.: Determinants of Risk: Exposure and Vulnerability, in: Managing the Risks of Extreme Events and Disasters to Advance Climate Change Adaptation: Special Report of the Intergovernmental Panel on Climate Change, edited by: Field, C., Barros, V., Stocker, T., and Dahe, Q., Cambridge University Press, Cambridge, 65–108, doi:10.1017/CBO9781139177245.005, 2012.
Carmin, J. and Anguelovski, I.: Planning Climate Resilient Cities: Early Lessons from Early Adapters, World Bank, 5th Urban Research Symposium, Cities and Climate Change. Marseille, France, 28–30 June 2009.
Carrión, F. and Erazo Espinosa, J.: La forma urbana de Quito: una historia de centros y periferias, Bulletin de l'Institut français d'études andines, 41, 503–522, https://doi.org/10.4000/bifea.361, 2012.
Castelo, C. A. J., D'Howitt, M. C., Almeida, O. P., and Toulkeridis, T.: Comparative Determination of the Probability of Landslide Ocurrences and Susceptibility in Central Quito, Ecuador, 2018 International Conference on eDemocracy and eGovernment (ICEDEG), Ambato, Equador, 4–6 April 2018, 136–143, https://doi.org/10.1109/ICEDEG.2018.8372341, 2018.
Chatelain, J. L., Tucker, B., Guillier, B., Kaneko, F., Yepes, H., Fernandez, J., Valverde, J., Hoefer, G., Souris, M., Dupérier, E., Yamada, T., Bustamante, G., and Villacis, C.: Earthquake risk management pilot project in Quito, Ecuador, GeoJournal, 49, 185–196, https://doi.org/10.1023/A:1007079403225, 1999.
Colding, J. and Barthel, S.: The potential of “Urban Green Commons” in the resilience building of cities, Ecol. Econ., 86, 156–166, https://doi.org/10.1016/j.ecolecon.2012.10.016, 2013.
Cuvi, N. and Vélez, L. C. G.: Los Parques Urbanos de Quito: Distribución, Accesibilidad y Segregación Espacial, Environmental Science, 10, 200–231, https://doi.org/10.21664/2238-8869.2021v10i2.p200-231, 2021.
De Sherbinin, A., Schiller, A., and Pulsipher, A.: The vulnerability of global cities to climate hazards, Environ. Urban., 19, 39–64, https://doi.org/10.1177/0956247807076725, 2007.
Deng, J., Huang, Y., Chen, B., Tong, C., Liu, P., Wang, H., and Hong, Y.: A Methodology to Monitor Urban Expansion and Green Space Change Using a Time Series of Multi-Sensor SPOT and Sentinel-2A Images, Remote Sensing, 11, 1230, https://doi.org/10.3390/rs11101230, 2019.
DMQ: Visión de Quito 2040 y su Nuevo Modelo de Ciudad, http://repositoriointerculturalidad.ec/jspui/handle/123456789/33016 (last access: 16 May 2022), 2018.
Domínguez-Castro, F., García-Herrera, R., and Vicente-Serrano, S. M.: Wet and dry extremes in Quito (Ecuador) since the 17th century, Int. J. Climatol., 38, 2006–2014, https://doi.org/10.1002/joc.5312, 2018.
Dou, K. and Zhan, Q.: Accessibility analysis of urban emergency shelters: Comparing gravity model and space syntax, 2011 International Conference on Remote Sensing, Environment and Transportation Engineering, Nanjing, China, 24–26 June 2011, 5681–5684, 2011.
Emberson, R., Kirschbaum, D., and Stanley, T.: New global characterisation of landslide exposure, Nat. Hazards Earth Syst. Sci., 20, 3413–3424, https://doi.org/10.5194/nhess-20-3413-2020, 2020.
Escobedo, F. J. and Nowak, D. J.: Spatial heterogeneity and air pollution removal by an urban forest, Landscape Urban Plan., 90, 102–110, https://doi.org/10.1016/j.landurbplan.2008.10.021, 2009.
Estrella, M. and Saalismaa, N.: Ecosystem-based disaster risk reduction (Eco-DRR): An overview, The role of ecosystems in disaster risk reduction, edited by: Renaud, F. G., Sudmeier-Rieux, K., and Estrella, M., United Nations University Press, 512 pp., https://globalplatform.undrr.org/sites/default/files/2022-02/The%20role%20of%20ecosystems%20in%20disaster%20risk%20reduction.pdf (last access: 16 May 2020), 2013.
Faivre, N., Sgobbi, A., Happaerts, S., Raynal, J., and Schmidt, L.: Translating the Sendai Framework into action: The EU approach to ecosystem-based disaster risk reduction, Int. J. Disast. Risk Re., 32, 4–10, https://doi.org/10.1016/j.ijdrr.2017.12.015, 2018.
Farr, T. G., Rosen, P. A., Caro, E., Crippen, R., Duren, R., Hensley, S., Kobrick, M., Paller, M., Rodriguez, E., Roth, L., Seal, D., Shaffer, S., Shimada, J., Umland, J., Werner, M., Oskin, M., Burbank, D., and Alsdorf, D.: The Shuttle Radar Topography Mission, Rev. Geophys., 45, RG2004, https://doi.org/10.1029/2005RG000183, 2007.
Fenger, J.: Urban air quality, Atmos. Environ., 33, 4877–4900, https://doi.org/10.1016/S1352-2310(99)00290-3, 1999.
Flörke, M., Schneider, C., and McDonald, R. I.: Water competition between cities and agriculture driven by climate change and urban growth, Nature Sustainability, 1, 51–58, https://doi.org/10.1038/s41893-017-0006-8, 2018.
Froude, M. J. and Petley, D. N.: Global fatal landslide occurrence from 2004 to 2016, Nat. Hazards Earth Syst. Sci., 18, 2161–2181, https://doi.org/10.5194/nhess-18-2161-2018, 2018.
Fuller, R., Groom, G., and Jones, A.: The land-cover map of great Britain: an automated classification of landsat thematic mapper data, Photogramm. Eng. Rem. S., 60, 553–562, 1994.
Galasso, C., McCloskey, J., Pelling, M., Hope, M., Bean, C. J., Cremen, G., Guragain, R., Hancilar, U., Menoscal, J., Mwang'a, K., Phillips, J., Rush, D., and Sinclair, H.: Editorial. Risk-based, Pro-poor Urban Design and Planning for Tomorrow's Cities, Int. J. Disast. Risk Re., 58, 102158, https://doi.org/10.1016/j.ijdrr.2021.102158, 2021.
García-Lamarca, M., Connolly, J., and Anguelovski, I.: Green gentrification and displacement in Barcelona, in: Housing Displacement, Routledge, 156–170, 2020.
Georganos, S., Grippa, T., Vanhuysse, S., Lennert, M., Shimoni, M., and Wolff, E.: Very High Resolution Object-Based Land Use–Land Cover Urban Classification Using Extreme Gradient Boosting, IEEE Geosci. Remote S., 15, 607–611, https://doi.org/10.1109/LGRS.2018.2803259, 2018.
Gill, J. C. and Malamud, B. D.: Anthropogenic processes, natural hazards, and interactions in a multi-hazard framework, Earth-Sci. Rev., 166, 246–269, https://doi.org/10.1016/j.earscirev.2017.01.002, 2017.
Gill, J. C., Hussain, E., and Malamud, B. D.: Workshop Report: Multi-Hazard Risk Scenarios for Tomorrow's Cities, https://tomorrowscities.org/workshop-report-multi-hazard-risk-scenarios-tomorrows-cities, (last access: 18th May 2021), 2021.
Godfray, H. C. J., Beddington, J. R., Crute, I. R., Haddad, L., Lawrence, D., Muir, J. F., Pretty, J., Robinson, S., Thomas, S. M., and Toulmin, C.: Food Security: The Challenge of Feeding 9 Billion People, Science, 327, 812–818, https://doi.org/10.1126/science.1185383, 2010.
Gonzalez, C. G.: Seasons of Resistance: Sustainable Agriculture and Food Security in Cuba, Tulane Environmental Law Journal, 16, 685–732, 2003.
Gorelick, N., Hancher, M., Dixon, M., Ilyushchenko, S., Thau, D., and Moore, R.: Google Earth Engine: Planetary-scale geospatial analysis for everyone, Remote Sens. Environ., 202, 18–27, https://doi.org/10.1016/j.rse.2017.06.031, 2017.
Hall, M. L., Samaniego, P., Le Pennec, J. L., and Johnson, J. B.: Ecuadorian Andes volcanism: A review of Late Pliocene to present activity, J. Volcanol. Geoth. Res., 176, 1–6, https://doi.org/10.1016/j.jvolgeores.2008.06.012, 2008.
Hastenrath, S.: Annual cycle of upper air circulation and convective activity over the tropical Americas, J. Geophys. Res.-Atmos., 102, 4267–4274, https://doi.org/10.1029/96JD03122, 1997.
Hoekstra, A. Y., Buurman, J., and van Ginkel, K. C. H.: Urban water security: A review, Environ. Res. Lett., 13, 053002, https://doi.org/10.1088/1748-9326/aaba52, 2018.
Hosseini, S. A., de la Fuente, A., and Pons, O.: Multicriteria decision-making method for sustainable site location of post-disaster temporary housing in urban areas, J. Constr. Eng. M., 142, 04016036, https://doi.org/10.1061/(ASCE)CO.1943-7862.0001137, 2016.
IG-EPN, IGM, IRD.: Mapa de Peligros Volcánicos Potenciales del Volcán Guagua Pichincha 3ra. Edición, Quito – Ecuador, https://www.igepn.edu.ec/ggp-mapa-de-peligros/file (last access: 10 December 2020), 2019.
Inglada, J. and Christophe, E.: The Orfeo Toolbox remote sensing image processing software, 2009 IEEE International Geoscience and Remote Sensing Symposium, Cape Town, South Africa, 12–17 July 2009, IV-733-IV-736, doi:10.1109/IGARSS.2009.5417481, 2009.
Instituto Geográfico Militar: Fotografía aérea 360 Rollo 19 Cámara RC10 Proyecto Carta Nacional N-III_1977 Escala 1:60000 B/N, https://www.geoportaligm.gob.ec/geonetwork/srv/spa/catalog.search#/metadata/e56534b0-3b16-423e-a076-e0e41df07a81 (last access: 20 March 2020), 1977 (in Spanish).
Instituto Geográfico Militar: Generation of geospatial information at a scale 1:5000 for the determination of the physical fitness of the territory and urban development through the use of geotechnologies, http://www.geograficomilitar.gob.ec/ (last access: 16 May 2022), 2019 (in Spanish).
Jalayer, F., De Risi, R., De Paola, F., Giugni, M., Manfredi, G., Gasparini, P., Topa, M. E., Yonas, N., Yeshitela, K., Nebebe, A., Cavan, G., Lindley, S., Printz, A., and Renner, F.: Probabilistic GIS-based method for delineation of urban flooding risk hotspots, Nat. Hazards, 73, 975–1001, https://doi.org/10.1007/s11069-014-1119-2, 2014.
James, P., Banay, R. F., Hart, J. E., and Laden, F.: A Review of the Health Benefits of Greenness, Current Epidemiology Reports, 2, 131–142, https://doi.org/10.1007/s40471-015-0043-7, 2015.
Jeong, D., Kim, M., Song, K., and Lee, J.: Planning a Green Infrastructure Network to Integrate Potential Evacuation Routes and the Urban Green Space in a Coastal City: The Case Study of Haeundae District, Busan, South Korea, Sci. Total Environ., 761, 143179, https://doi.org/10.1016/j.scitotenv.2020.143179, 2021.
Kelleher, C. and McPhillips, L.: Exploring the application of topographic indices in urban areas as indicators of pluvial flooding locations, Hydrol. Process., 34, 780–794, 2020.
Kennedy, R. E., Yang, Z., Gorelick, N., Braaten, J., Cavalcante, L., Cohen, W. B., and Healey, S.: Implementation of the LandTrendr Algorithm on Google Earth Engine, Remote Sensing, 10, 691, https://doi.org/10.3390/rs10050691, 2018.
Khazai, B., Anhorn, J., Girard, T., Brink, S., Daniell, J., Bessel, T., Mühr, B., Flörchinger, V., and Kunz-Plapp, T.: Shelter response and vulnerability of displaced populations in the April 25, 2015 Nepal Earthquake, Center for Disaster Management and Risk Reduction Technology of the Karlsruhe Institute of Technology, and the South Asia Institute, Heidelberg University, 5, 31 pp., https://reliefweb.int/sites/reliefweb.int/files/resources/CEDIM_FDA_NepalEarthquake_Report2Shelter-4%20%281%29.pdf (last access: 16 May 2022), 2015.
Kılcı , F., Kara, B. Y., and Bozkaya, B.: Locating temporary shelter areas after an earthquake: A case for Turkey, Eur. J. Oper. Res., 243, 323–332, https://doi.org/10.1016/j.ejor.2014.11.035, 2015.
Kirschbaum, D., Stanley, T., and Yatheendradas, S.: Modeling landslide susceptibility over large regions with fuzzy overlay, Landslides, 13, 485–496, https://doi.org/10.1007/s10346-015-0577-2, 2016.
Kirschbaum, D. and Stanley, T.: Satellite-Based Assessment of Rainfall-Triggered Landslide Hazard for Situational Awareness, Earth's Future, 6, 505–523, https://doi.org/10.1002/2017EF000715, 2018.
Kumar, P., Debele, S. E., Sahani, J., Rawat, N., Marti-Cardona, B., Alfieri, S. M., Basu, B., Basu, A. S., Bowyer, P., Charizopoulos, N., Jaakko, J., Loupis, M., Menenti, M., Mickovski, S. B., Pfeiffer, J., Pilla, F., Pröll, J., Pulvirenti, B., Rutzinger, M., Sannigrahi, S., Spyrou, C., Tuomenvirta, H., Vojinovic, Z., and Zieher, T.: An overview of monitoring methods for assessing the performance of nature-based solutions against natural hazards, Earth-Sci. Rev., 217, 103603, https://doi.org/10.1016/j.earscirev.2021.103603, 2021.
Labib, S. M. and Harris, A.: The potentials of Sentinel-2 and LandSat-8 data in green infrastructure extraction, using object based image analysis (OBIA) method, Eur. J. Remote Sens., 51, 231–240, https://doi.org/10.1080/22797254.2017.1419441, 2018.
Leblon, B., Gallant, L., and Granberg, H.: Effects of shadowing types on ground-measured visible and near-infrared shadow reflectances, Remote Sens. Environ., 58, 322–328, https://doi.org/10.1016/S0034-4257(96)00079-X 1996.
Lidberg, W., Nilsson, M., Lundmark, T., and Ågren, A. M.: Evaluating preprocessing methods of digital elevation models for hydrological modelling, Hydrol. Process., 31, 4660–4668, 2017.
Liu, Q., Ruan, X., and Shi, P.: Selection of emergency shelter sites for seismic disasters in mountainous regions: Lessons from the 2008 Wenchuan Ms 8.0 Earthquake, China, J. Asian Earth Sci., 40, 926–934, 2011.
Loughlin, S. C., Sparks, R. S. J., Sparks, S., Brown, S. K., Jenkins, S. F., and Vye-Brown, C.: Global volcanic hazards and risk, Cambridge University Press, https://doi.org/10.1017/CBO9781316276273, 2015.
Manfreda, S., Di Leo, M., and Sole, A.: Detection of flood-prone areas using digital elevation models, J. Hydrol. Eng., 16, 781–790, 2011.
Maragno, D., Gaglio, M., Robbi, M., Appiotti, F., Fano, E. A., and Gissi, E.: Fine-scale analysis of urban flooding reduction from green infrastructure: An ecosystem services approach for the management of water flows, Ecol. Model., 386, 1–10, https://doi.org/10.1016/j.ecolmodel.2018.08.002, 2018.
Markus, T., Neumann, T., Martino, A., Abdalati, W., Brunt, K., Csatho, B., Farrell, S., Fricker, H., Gardner, A., Harding, D., Jasinski, M., Kwok, R., Magruder, L., Lubin, D., Luthcke, S., Morison, J., Nelson, R., Neuenschwander, A., Palm, S., Popescu, S., Shum, C. K., Schutz, B. E., Smith, B., Yang, Y., and Zwally, J.: The Ice, Cloud, and land Elevation Satellite-2 (ICESat-2): Science requirements, concept, and implementation, Remote Sens. Environ., 190, 260–273, https://doi.org/10.1016/j.rse.2016.12.029, 2017.
Marmot, M., Friel, S., Bell, R., Houweling, T. A. J., and Taylor, S.: Closing the gap in a generation: health equity through action on the social determinants of health, The Lancet, 372, 1661–1669, https://doi.org/10.1016/S0140-6736(08)61690-6, 2008.
Marselle, M. R., Bowler, D. E., Watzema, J., Eichenberg, D., Kirsten, T., and Bonn, A.: Urban street tree biodiversity and antidepressant prescriptions, Scientific Reports, 10, 22445, https://doi.org/10.1038/s41598-020-79924-5, 2020.
Mattivi, P., Franci, F., Lambertini, A., and Bitelli, G.: TWI computation: a comparison of different open source GISs, Open Geospatial Data, Software and Standards, 4, 1–12, 2019.
McDonald, R. I., Mansur, A. V., Ascensão, F., Colbert, M. L., Crossman, K., Elmqvist, T., Gonzalez, A., Güneralp, B., Haase, D., Hamann, M., Hillel, O., Huang, K., Kahnt, B., Maddox, D., Pacheco, A., Pereira, H. M., Seto, K. C., Simkin, R., Walsh, B., Werner, A. S., and Ziter, C.: Research gaps in knowledge of the impact of urban growth on biodiversity, Nature Sustainability, 3, 16–24, https://doi.org/10.1038/s41893-019-0436-6, 2020.
McPherson, E. G.: Accounting for benefits and costs of urban greenspace, Landscape Urban Plan., 22, 41–51, https://doi.org/10.1016/0169-2046(92)90006-L, 1992.
McVittie, A., Cole, L., Wreford, A., Sgobbi, A., and Yordi, B.: Ecosystem-based solutions for disaster risk reduction: Lessons from European applications of ecosystem-based adaptation measures, Int. J. Disast. Risk Re., 32, 42–54, https://doi.org/10.1016/j.ijdrr.2017.12.014, 2018.
Metro Ecuador: En caso de un sismo en Quito, estos son los sitios seguros en la ciudad. Metro Ecuador, 12 December, https://www.metroecuador.com.ec/ec/noticias/2019/05/28/caso-temblor-estos-los-sitios-seguros-quito.html (last access: 1 November 2021), 2019.
Millard, K. and Richardson, M.: On the Importance of Training Data Sample Selection in Random Forest Image Classification: A Case Study in Peatland Ecosystem Mapping, Remote. Sens., 7, 8489–8515, 2015.
Ministry of Territory: Habitat and Housing: Accidentes, https://territorio.maps.arcgis.com/home/item.html?id=5270bc85cf3249b29937d25d0b363396 (last access: 16 May 2022), 2020.
Myint, S. W., Gober, P., Brazel, A., Grossman-Clarke, S., and Weng, Q.: Per-pixel vs. object-based classification of urban land cover extraction using high spatial resolution imagery, Remote Sens. Environ., 115, 1145–1161, https://doi.org/10.1016/j.rse.2010.12.017, 2011.
Neumann, T. A., Martino, A. J., Markus, T., Bae, S., Bock, M. R., Brenner, A. C., Brunt, K. M., Cavanaugh, J., Fernandes, S. T., Hancock, D. W., Harbeck, K., Lee, J., Kurtz, N. T., Luers, P. J., Luthcke, S. B., Magruder, L., Pennington, T. A., Ramos-Izquierdo, L., Rebold, T., Skoog, J., and Thomas, T. C.: The Ice, Cloud, and Land Elevation Satellite – 2 mission: A global geolocated photon product derived from the Advanced Topographic Laser Altimeter System, Remote Sens. Environ., 233, 111325, https://doi.org/10.1016/j.rse.2019.111325, 2019.
Neumann, T. A., Brenner, A., Hancock, D., Robbins, J., Saba, J., Harbeck, K., Gibbons, A., Lee, J., Luthcke, S. B., and Rebold, T.: ATLAS/ICESat-2 L2A Global Geolocated Photon Data, Version 3, NASA National Snow and Ice Data Center Distributed Active Archive Center, Boulder, Colorado USA, 22 pp., https://doi.org/10.5067/ATLAS/ATL03.003, 2020.
Nuth, C. and Kääb, A.: Co-registration and bias corrections of satellite elevation data sets for quantifying glacier thickness change, The Cryosphere, 5, 271–290, https://doi.org/10.5194/tc-5-271-2011, 2011.
Oliver-Smith, A., Alcántara-Ayala, I., Burton, I., and Lavell, A.: Forensic Investigations of Disasters (FORIN): a conceptual framework and guide to research, https://www.irdrinternational.org/uploads/files/2020/08/n0EpdIvgoGZuwbrhioKRFLQiw5XlLfF1vIDE7tEB/FORIN-2-29022016.pdf (last access: 16 May 2022), 2016.
Olofsson, P., Foody, G. M., Stehman, S. V., and Woodcock, C. E.: Making better use of accuracy data in land change studies: Estimating accuracy and area and quantifying uncertainty using stratified estimation, Remote Sens. Environ., 129, 122–131, https://doi.org/10.1016/j.rse.2012.10.031, 2013.
Olofsson, P., Foody, G. M., Herold, M., Stehman, S. V., Woodcock, C. E., and Wulder, M. A.: Good practices for estimating area and assessing accuracy of land change, Remote Sens. Environ., 148, 42–57, https://doi.org/10.1016/j.rse.2014.02.015, 2014.
Onuma, A. and Tsuge, T.: Comparing green infrastructure as ecosystem-based disaster risk reduction with gray infrastructure in terms of costs and benefits under uncertainty: A theoretical approach, Int. J. Disast. Risk Re., 32, 22–28, https://doi.org/10.1016/j.ijdrr.2018.01.025, 2018.
Pagani, M., Garcia-Pelaez, J., Gee, R., Johnson, K., Poggi, V., Styron, R., Weatherill, G., Simionato, M., Viganò, D., Danciu, L., and Monelli, D.: Global Earthquake Model (GEM) Seismic Hazard Map (version 2018.1 – December 2018), https://doi.org/10.13117/GEM-GLOBAL-SEISMIC-HAZARD-MAP-2018.1, 2018.
Passalacqua, P., Belmont, P., Staley, D. M., Simley, J. D., Arrowsmith, J. R., Bode, C. A., Crosby, C., DeLong, S. B., Glenn, N. F., Kelly, S. A., Lague, D., Sangireddy, H., Schaffrath, K., Tarboton, D. G., Wasklewicz, T., and Wheaton, J. M.: Analyzing high resolution topography for advancing the understanding of mass and energy transfer through landscapes: A review, Earth-Sci. Rev., 148, 174–193, https://doi.org/10.1016/j.earscirev.2015.05.012, 2015.
Pelling, M., Maskrey, A., Ruiz, P., Hall, P., Peduzzi, P., Dao, Q.-H., Mouton, F., Herold, C., and Kluser, S.: Reducing disaster risk: a challenge for development, http://archive-ouverte.unige.ch/unige:77685 (last access: 16 May 2022), 2004.
Peralta Arias, J. J. and Higueras García, E.: Evaluación sostenible de los Planes Directores de Quito, Periodo 1942–2012, 5, 21–34, https://doi.org/10.18537/est.v005.n009.03, 2016.
Perrin, J. L., Bouvier, C., Janeau, J. L., Ménez, G., and Cruz, F.: Rainfall/runoff processes in a small peri-urban catchment in the Andes mountains. The Rumihurcu Quebrada, Quito (Ecuador), Hydrol. Process., 15, 843–854, https://doi.org/10.1002/hyp.190, 2001.
Pettorelli, N., Vik, J. O., Mysterud, A., Gaillard, J.-M., Tucker, C. J., and Stenseth, N. C.: Using the satellite-derived NDVI to assess ecological responses to environmental change, Trends Ecol. Evol., 20, 503–510, https://doi.org/10.1016/j.tree.2005.05.011, 2005.
Phillips, C. and Marden, M.: Reforestation Schemes to Manage Regional Landslide Risk, in: Landslide Hazard and Risk, chapter 18, 517–547, https://doi.org/10.1002/9780470012659.ch18, 2005.
Rebotier, J.: El riesgo y su gestión en Ecuador: una mirada de geografía social y política, Centro de Publicaciones Pontificia Universidad Católica del Ecuador, 132 pp., https://biblio.flacsoandes.edu.ec/libros/digital/56738.pdf (last access: 16 May 2022), 2016.
Robin, C., Samaniego, P., Le Pennec, J.-L., Mothes, P., and van der Plicht, J.: Late Holocene phases of dome growth and Plinian activity at Guagua Pichincha volcano (Ecuador), J. Volcanol. Geoth. Res., 176, 7–15, https://doi.org/10.1016/j.jvolgeores.2007.10.008, 2008.
Rodriguez-Galiano, V. F., Ghimire, B., Rogan, J., Chica-Olmo, M., and Rigol-Sanchez, J. P.: An assessment of the effectiveness of a random forest classifier for land-cover classification, ISPRS J. Photogramm., 67, 93–104, https://doi.org/10.1016/j.isprsjprs.2011.11.002, 2012.
Salazar, E., Henríquez, C., Sliuzas, R., and Qüense, J.: Evaluating Spatial Scenarios for Sustainable Development in Quito, Ecuador, ISPRS Int. J. Geo Inf., 9, 141, https://doi.org/10.3390/ijgi9030141, 2020.
Salazar, E., Henríquez, C., Durán, G., Qüense, J., and Puente-Sotomayor, F.: How to Define a New Metropolitan Area? The Case of Quito, Ecuador, and Contributions for Urban Planning, Land, 10, 413, https://doi.org/10.3390/land10040413, 2021.
Salmon, N., Yépez, G., Duque, M., Yépez, M., Báez, A., Masache-Heredia, M., Mejía, G., Mejía, P., Garofalo, G., and Montoya, D.: Co-design of a Nature-Based Solutions Ecosystem for Reactivating a Peri-Urban District in Quito, Ecuador, in: Governance of Climate Responsive Cities: Exploring Cross-Scale Dynamics, edited by: Peker, E. and Ataöv, A., Springer International Publishing, Cham, 79–104, 2021.
Sandholz, S., Lange, W., and Nehren, U.: Governing green change: Ecosystem-based measures for reducing landslide risk in Rio de Janeiro, Int. J. Disast. Risk Re., 32, 75–86, https://doi.org/10.1016/j.ijdrr.2018.01.020, 2018.
Schneider, A. and Woodcock, C. E.: Compact, Dispersed, Fragmented, Extensive? A Comparison of Urban Growth in Twenty-five Global Cities using Remotely Sensed Data, Pattern Metrics and Census Information, Urban Studies, 45, 659–692, https://doi.org/10.1177/0042098007087340, 2008.
Shimpo, N., Wesener, A., and McWilliam, W.: How community gardens may contribute to community resilience following an earthquake, Urban For. Urban Gree., 38, 124–132, https://doi.org/10.1016/j.ufug.2018.12.002, 2019.
Shrestha, S. R., Sliuzas, R., and Kuffer, M.: Open spaces and risk perception in post-earthquake Kathmandu city, Appl. Geogr., 93, 81–91, https://doi.org/10.1016/j.apgeog.2018.02.016, 2018.
Sierra, A.: La política de mitigación de los riesgos en las laderas de Quito: ?“qué vulnerabilidad combatir?, 737–753, https://doi.org/10.4000/bifea.2421, 2009.
SNI: Archivos de Informacion Geografica, Peligro Volcánico, https://sni.gob.ec/coberturas (last access: 16 May 2022), 2020.
Sphere Association: The Sphere Handbook: Humanitarian Charter and MinimumStandards in Humanitarian Response, fourth edition, Geneva, Switzerland, https://www.spherestandards.org/handbook/ (last access: 16 May 2022), 2018.
Stanley, T. and Kirschbaum, D. B.: A heuristic approach to global landslide susceptibility mapping, Nat. Hazards, 87, 145–164, https://doi.org/10.1007/s11069-017-2757-y, 2017.
Styron, R.: GEMScienceTools/gem-global-active-faults: First release of 2019 (Version 2019.0), Zenodo [code], https://doi.org/10.5281/zenodo.3376300, 2019.
Sudmeier-Rieux, K., Arce-Mojica, T., Boehmer, H. J., Doswald, N., Emerton, L., Friess, D. A., Galvin, S., Hagenlocher, M., James, H., Laban, P., Lacambra, C., Lange, W., McAdoo, B. G., Moos, C., Mysiak, J., Narvaez, L., Nehren, U., Peduzzi, P., Renaud, F. G., Sandholz, S., Schreyers, L., Sebesvari, Z., Tom, T., Triyanti, A., van Eijk, P., van Staveren, M., Vicarelli, M., and Walz, Y.: Scientific evidence for ecosystem-based disaster risk reduction, Nature Sustainability, 4, 803–810, https://doi.org/10.1038/s41893-021-00732-4, 2021.
Taylor, L. and Hochuli, D. F.: Defining greenspace: Multiple uses across multiple disciplines, Landscape Urban Plan., 158, 25–38, https://doi.org/10.1016/j.landurbplan.2016.09.024, 2017.
Testori, G.: Gobierno Barrial de Atucucho. An urban alternative based on self-governance and direct democracy, 17 pp., http://contested-cities.net/working-papers/wp-content/uploads/sites/8/2016/07/WPCC-165011-TestoriGiulia-GobiernoBarrialAtucucho.pdf (last access: 16 May 2022), 2016.
Tidball, K. G. and Krasny, M. E.: Greening in the red zone: Disaster, Resilience and Community Greening, 1 edn., Springer, 503 pp., https://doi.org/10.1007/978-90-481-9947-1, 2012.
Tucker, C. J., Holben, B. N., Elgin, J. H., and McMurtrey, J. E.: Remote sensing of total dry-matter accumulation in winter wheat, Remote Sens. Environ., 11, 171–189, https://doi.org/10.1016/0034-4257(81)90018-3, 1981.
UN DESA: World Urbanization Prospects: The 2018 Revision (ST/ESA/SER.A/420), New York: United Nations, https://population.un.org/wup/Publications/Files/WUP2018-KeyFacts.pdf (last access: 16 May 2022), 2019.
UNDRR: Ecosystem-Based Disaster Risk Reduction: Implementing Nature-based Solutions for Resilience, United Nations Office for Disaster Risk Reduction – Regional Office for Asia and the Pacific, Bangkok, Thailand, https://www.undrr.org/publication/ecosystem-based-disaster-risk-reduction-implementing-nature-based-solutions-0 (last access: 16 May 2022), 2020.
UN General Assembly: Transforming our world: the 2030 Agenda for Sustainable Development, Report No. A/RES/70/1, https://www.unfpa.org/sites/default/files/resource-pdf/Resolution_A_RES_70_1_EN.pdf (last access: 16 May 2022), 2015.
UN-Habitat: The Challenge of Slums: Global Report on Human Settlements 2003, 345 pp., https://www.alnap.org/help-library/the-challenge-of-slums-global-report-on-human-settlements-2003 (last access: 4 May 2021), 2003.
UNISDR: Sendai framework for disaster risk reduction 2015–2030, https://www.preventionweb.net/files/43291_sendaiframeworkfordrren.pdf (last access: 5 February 2020), 2015.
Valcárcel, J., Despotaki, V., Burton, C., Yepes-Estrada, C., Silva, V., and Villacis, C.: Integrated Assessment of Earthquake Risk in Quito, Ecuador Using Openquake, 16th World Conference on Earthquake Engineering, 16WCEE 2017, Santiago Chile, 9–13 January 2017.
Valencia, V. H., Levin, G., and Hansen, H. S.: Modelling the spatial extent of urban growth using a cellular automata-based model: a case study for Quito, Ecuador, Geogr. Tidsskr., 120, 156–173, https://doi.org/10.1080/00167223.2020.1823867, 2020.
Vidal, X., Burgos, L., and Zevallos, O.: 11 Protection and environmental restoration of the slopes of Pichincha in Quito, Ecuador, Water and Cities in Latin America: Challenges for Sustainable Development, Routledge, London, 181, 298 pp., https://doi.org/10.4324/9781315848440, 2015.
Vincenti, S. S., Zuleta, D., Moscoso, V., Jácome, P., Palacios, E., and Villacís, M.: Análisis estadístico de datos meteorológicos mensuales y diarios para la determinación de variabilidad climática y cambio climático en el Distrito Metropolitano de Quito, La Granja, 16, 23–47, https://lagranja.ups.edu.ec/index.php/granja/article/download/16.2012.03/232 (last access: 16 May 2022), 2012.
Watson, C. S., Elliott, J. R., Ebmeier, S. K., Vásquez, M. A., Zapata, C., Bonilla-Bedoya, S., Cubillo, P., Orbe, D. F., Córdova, M., Menoscal, J., and Sevilla, E.: Datasets supporting the paper “Enhancing disaster risk resilience using greenspace in urbanising Quito, Ecuador”, Zenodo [data set], https://doi.org/10.5281/zenodo.5881876, 2022.
WHO Regional Office for Europe: Urban green spaces and health, https://www.euro.who.int/__data/assets/pdf_file/0005/321971/Urban-green-spaces-and-health-review-evidence.pdf (last access: 16 May 2022), 2016.
Wilson, T. M., Stewart, C., Sword-Daniels, V., Leonard, G. S., Johnston, D. M., Cole, J. W., Wardman, J., Wilson, G., and Barnard, S. T.: Volcanic ash impacts on critical infrastructure, Phys. Chem. Earth, Parts A/B/C, 45-46, 5–23, https://doi.org/10.1016/j.pce.2011.06.006, 2012.
Wolch, J. R., Byrne, J., and Newell, J. P.: Urban green space, public health, and environmental justice: The challenge of making cities “just green enough”, Landscape Urban Plan., 125, 234–244, https://doi.org/10.1016/j.landurbplan.2014.01.017, 2014.
Yamazaki, F., Liu, W., and Takasaki, M.: Characteristics of shadow and removal of its effects for remote sensing imagery, 2009 IEEE International Geoscience and Remote Sensing Symposium, Cape Town, South Africa, 12–17 July 2009, 4, IV-426–IV-429 pp., https://doi.org/10.1109/IGARSS.2009.5417404, 2009.
Zalakeviciute, R., López-Villada, J., and Rybarczyk, Y.: Contrasted Effects of Relative Humidity and Precipitation on Urban PM2.5 Pollution in High Elevation Urban Areas, Sustainability, 10, 2064, https://doi.org/10.3390/su10062064, 2018.
Zambrano-Barragán, C., Zevallos, O., Villacís, M., and Enríquez, D.: Quito's Climate Change Strategy: A Response to Climate Change in the Metropolitan District of Quito, Ecuador, in: Resilient Cities, Dordrecht, 515–529, https://doi.org/10.1007/978-94-007-0785-6_51, 2011.
Zhou, Y., Parsons, B., Elliott, J. R., Barisin, I., and Walker, R. T.: Assessing the ability of Pleiades stereo imagery to determine height changes in earthquakes: A case study for the El Mayor-Cucapah epicentral area, J. Geophys. Res.-Sol. Ea., 120, 8793–8808, https://doi.org/10.1002/2015jb012358, 2015.
Zhu, Z., Gallant, A. L., Woodcock, C. E., Pengra, B., Olofsson, P., Loveland, T. R., Jin, S., Dahal, D., Yang, L., and Auch, R. F.: Optimizing selection of training and auxiliary data for operational land cover classification for the LCMAP initiative, ISPRS J. Photogramm., 122, 206–221, https://doi.org/10.1016/j.isprsjprs.2016.11.004, 2016.