the Creative Commons Attribution 4.0 License.
the Creative Commons Attribution 4.0 License.
 | 04 May 2022
System vulnerability to flood events and risk assessment of railway systems based on national and river basin scales in China
Weihua Zhu
Kai Liu
Ming Wang
Philip J. Ward
Elco E. Koks
Floods have negative effects on the reliable operation of transportation systems. In China alone, floods cause an average of ∼1125 h of railway service disruptions per year. In this study, we present a simulation framework to analyse the system vulnerability and risk of the railway system to floods. First, we developed a novel methodology for generating flood events at both the national and river basin scale. Based on flood hazard maps of different return periods, independent flood events are generated using the Monte Carlo sampling method. Combined with network theory and spatial analysis methods, the resulting event set provides the basis for national- and provincial-level railway risk assessments, focusing in particular on train performance loss. Applying this framework to the Chinese railway system, we show that the system vulnerability of the Chinese railway system to floods is highly heterogeneous as a result of spatial variations in the railway topology and traffic flows. Flood events in the Yangtze River basin show the largest impact on the national railway system, with approximately 40 % of the national daily trains being affected by a 100-year flood event in that basin. At the national level, the average percentage of daily affected trains and passengers for the national system is approximately 2.7 % of the total daily number of trips and passengers. The event-based approach presented in this study shows how we can identify critical hotspots within a complex network, taking the first steps in developing climate-resilient infrastructure.
- Article
(10719 KB) - Full-text XML
- BibTeX
- EndNote


Floods can have negative effects on transportation systems through both the destruction of physical infrastructure and the disruption of freight and traffic flows (Reed, 2004; Moran et al., 2010; Benn, 2013; Kellermann et al., 2015). For example, during the Tbilisi (Georgia) floods in June 2015, the estimated damage in terms of replacing affected assets was USD 14.8 million, whilst losses related to increases in travel time and operating costs were estimated at approximately USD 3 million (up until autumn 2015) (GFDRR, 2015). In May and June 2013, the Austrian Federal Railways faced severe damage by major floods in central Europe, with a total cost of more than USD 84 million. The event caused extensive damage to track structures and also caused widespread service disruptions, despite many protective actions that had been adopted ahead of time (Kellermann et al., 2016). In China, over 2146 rail service disruption events and over 20 825 h of discontinued service due to flooding were reported from 2000 to 2016 (Editorial Board of China Railway Yearbook, 2001–2017). In 2016, the direct economic loss (i.e. the costs for repairing the damaged railway infrastructure) of the Chinese railway system caused by floods was approximately USD 80 million (Editorial Board of China Railway Yearbook, 2001–2017). Therefore, there is a clear need to evaluate the vulnerability of the transportation system to extreme flood hazards and to identify high-risk transportation components to make the transportation systems safer and more effective for operation and maintenance.
Many studies have investigated flood impacts on transportation systems, focusing on either flood vulnerability of assets (Kellermann et al., 2015; Pregnolato et al., 2017; Singh et al., 2018; Koks et al., 2019) or the risk to the entire system (Gil and Steinbach, 2008; Kellermann et al., 2016; Lamb et al., 2019). In these studies, flood vulnerability is usually defined as the relationship between the characteristics of the transportation components (i.e. the physical structure, traffic flow, and traffic velocity) and the variables characterizing the intensity of the flood hazard (i.e. flood depth and flood velocity) (Pregnolato et al., 2017). However, as major river floods are usually driven by large-scale atmospheric circulations (Prudhomme and Genevier, 2011; Lavers et al., 2013) and affect large areas, they can disrupt several components concurrently across a network system (Becker and Grünewald, 2003; Kundzewicz et al., 2013). Within a network system, the impact on operational performance is often the result of failure of multiple components in the aftermath of a flood event (Gong et al., 2017). Consequently, a system-level perspective is essential to properly assess transportation system vulnerability due to flooding.
Some studies have assessed transportation vulnerability to natural hazards from a system-level perspective (Chang et al., 2010; Hong et al., 2015). Chang et al. (2010) investigated the potential impacts of climate change on travel disruption in the metropolitan area of Portland, Oregon. They combined a hydrologic, hydraulic model and a travel forecast model to process their study. Hong et al. (2015) assessed the Chinese railway system's vulnerability in terms of traffic flow loss based on historical flood events from 1981 to 2010. Unfortunately, due to the widespread lack of appropriate historical flood hazard data and computational issues with running large-scale hydraulic models (Sene, 2008; Chang et al., 2010), research so far has been carried out only on a case-study basis where historical scenarios are available (Hong et al., 2015). However, for inter-city and inter-country trade, national- and global-scale transportation systems have flourished in recent decades. Examples include pan-European transportation corridors (Janic and Vleugel, 2012) and the railway system of the Belt and Road Initiative (Yang et al., 2018); therefore, large-scale flood event data and methods should be improved to assess system-level vulnerability and risk on operational performance for such large spatial transportation systems.
The recent development of global flood hazard maps (Alfieri et al., 2013; Hirabayashi et al., 2013; Ward et al., 2013; Sampson et al., 2015; Dottori et al., 2016) has paved the way for performing large-scale flood risk assessments. These global flood hazard maps have been widely applied to assess the global risk to flooding in terms of population (Ward et al., 2013; Arnell et al., 2016; Dottori et al., 2016), gross domestic product (GDP) (Ward et al., 2013; Winsemius et al., 2013), economic damage (Ward et al., 2013; Dottori et al., 2016; Winsemius et al., 2016; Ward et al., 2017), and transportation infrastructure (Koks et al., 2019). Koks et al. (2019), for example, assessed the direct economic damage to transportation infrastructure assets using a conventional damage assessment approach through asset-specific fragility curves based on global flood data. Studies such as these facilitate a better understanding of the impacts of flood hazards on large-scale transportation systems and provide up-to-date knowledge on risk analysis frameworks.
This study aims to develop a framework to quantify the system vulnerability and risk to transportation systems in terms of operational performance loss under large-scale flood hazards. System vulnerability in this study is represented as the system performance loss with different flood intensities. When assessing possible cascading effects, the use of independent flood events is necessary (Nones and Pescaroli, 2016), as the presented floods in regional- or national-scale flood footprints, which show the flood depth for a given return period in that area, may not all happen at the same time. To overcome the shortcomings in existing studies, we develop a simplified practicable and novel method for generating a set of independent flood events at the national and river basin scale. The independent floods are generated using a curve-fitting method and Monte Carlo sampling method based on global flood hazard model maps and river basins. By coupling simulated flood events with the railway network using the spatial analysis method, we identify the railway failure hotspots caused by floods. At the same time, the potential performance loss is assessed using network theory. We illustrate our methodology by applying it to the Chinese railway system.
The paper is organized as follows. In Sect. 2, we propose a framework for the evaluation of system vulnerability and risk of flood hazards to transportation systems and use the Chinese railway system for application, including how to generate flood events, define the network system for the transportation system, calculate system vulnerability metrics, and quantify flood risk. Section 3 presents the main findings and results. Sections 4 and 5 provide the discussion and conclusion, respectively, to this article.
2.1 Data sources
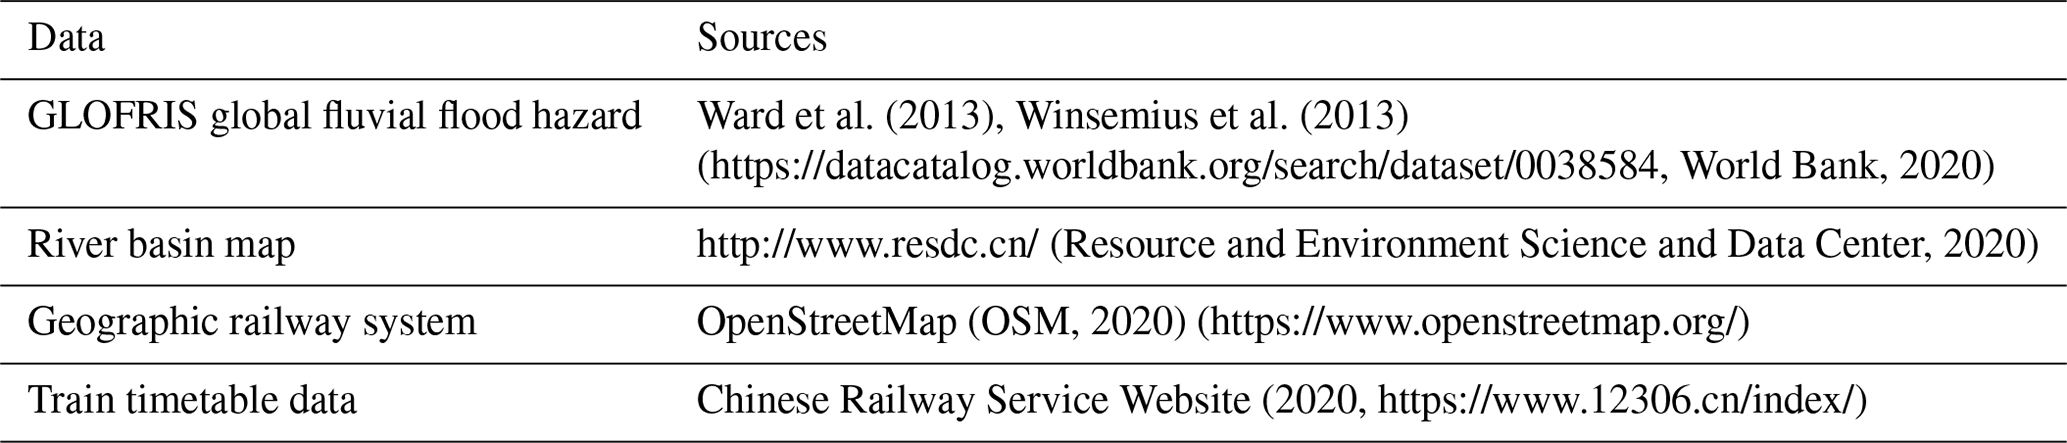
In this section, we describe in detail the data used in the study, including the flood hazard maps, the river basin map, and the Chinese railway data. The list of data used in this work is provided in Table 1.
2.1.1 Flood hazard maps
GLOFRIS global fluvial flood hazard maps of Winsemius et al. (2013) are used as flood hazard data in this work, which are developed using the GLOFRIS modelling cascade provided in Ward et al. (2013) and Winsemius et al. (2013). The GLOFRIS modelling cascade first simulates daily discharge using the PCRaster GlobalWater Balance (PCR-GLOBWB) global hydrological model (Beek et al., 2008, 2011). Based on daily discharge, daily flood volumes are simulated using the PCR-GLOBWB extension for dynamic routing, DynRout (PCR-GLOBWB-DynRout) (Ward et al., 2013; Winsemius et al., 2013). In the next step, flood volumes, for different return periods, 2, 5, 10, 25, 50, 100, 250, 500, and 1000 years, are obtained using the annual time series for maximum flood volumes by fitting a Gumbel distribution. These flood volumes are then converted into inundation maps (30 arcsec, ca. 1 km) using the inundation downscaling model of GLOFRIS (Winsemius et al., 2013). In the appendix materials, we provide flood maps for the 50- and 500-year return periods (Fig. A1). The maps show that the inundation depth highly varies in China. Railway lines in eastern coastal China and south China are faced with the most severe floods.
2.1.2 River basin map
The main river basin used in this work is shown in Fig. 1, which includes nine river basins: Continental Basin, Haihe River basin, Huaihe River basin, Pearl River basin, Songhua and Liaohe river basins, Southeast Basin, Southwest Basin, Yellow River basin, and Yangtze River basin. The data are from the Data Center for Resources and Environmental Sciences, Chinese Academy of Sciences, accessible from the Resource and Environment Data Cloud Platform (http://www.resdc.cn/, last access: 19 May 2020).
2.1.3 Chinese railway data
The geographic information, time table data, and passenger capacity data of Chinese railways are collected. The geographic information of the railway system is from OpenStreetMap (OSM), which provides the spatial distribution of the Chinese railway system (Fig. 1). The timetable data, which include the daily number of trains and associated routes from the Railway Service Website, and the passenger capacity data are obtained from https://www.china-emu.cn/ (last access: 19 May 2020) for China high-speed rail (G Train, D Train, and C Train) and https://zh.wikipedia.org/wiki (last access: 19 May 2020) for others (Z Train, T Train, K Train, etc.).
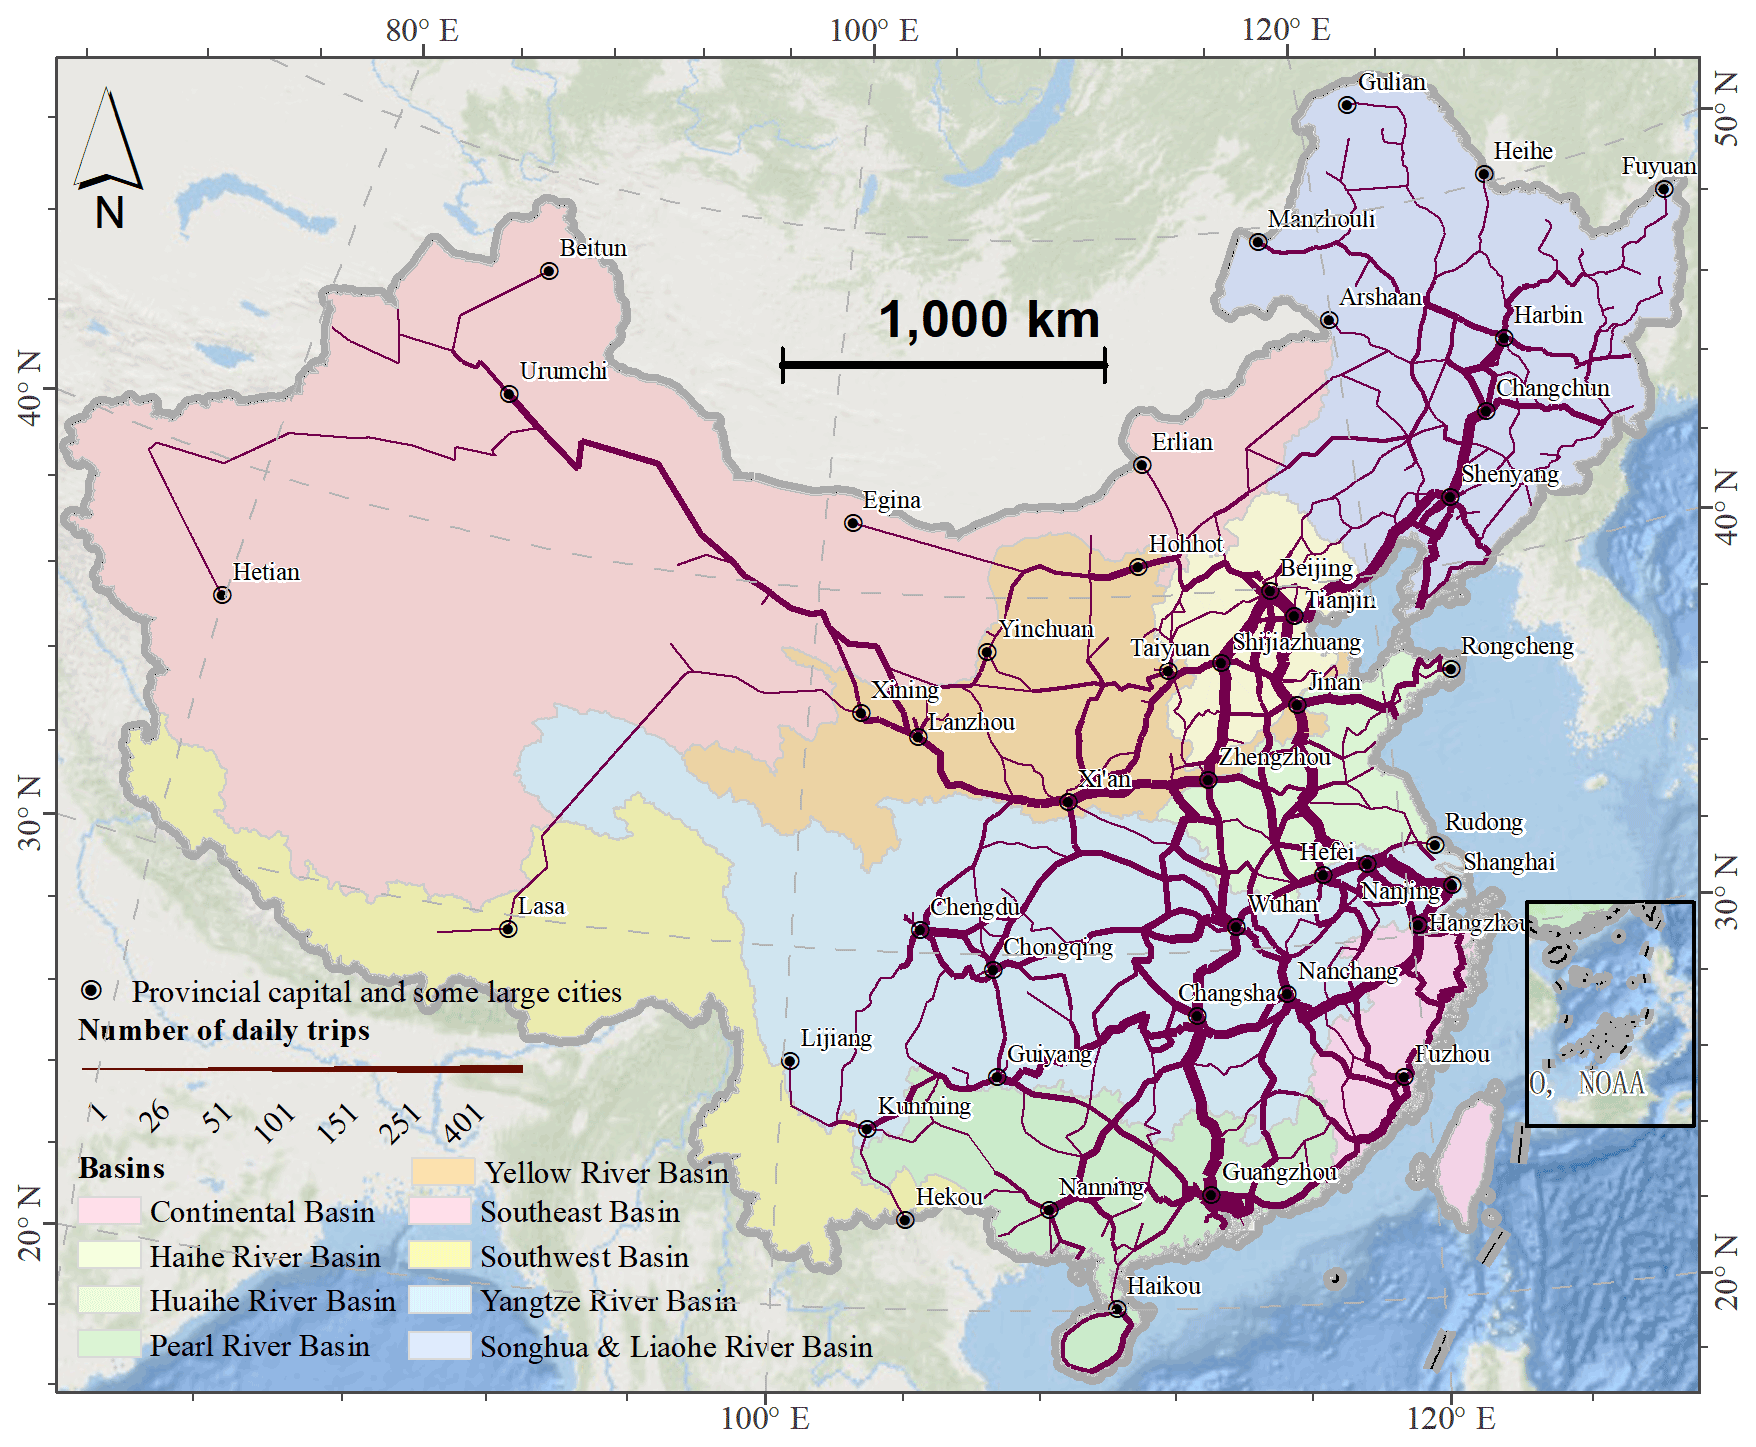
Figure 1The spatial distribution of the railway network, average daily number of trains, and the main river basin in China. The river basin layer comes from the Data Center for Resources and Environmental Sciences, Chinese Academy of Sciences, accessible from the Resource and Environment Data Cloud Platform (http://www.resdc.cn/, last access: 19 May 2020). Railway geometries © OpenStreetMap contributors 2019. Distributed under the Open Data Commons Open Database License (ODbL) v1.0. The timetable data include the daily number of trains and associated routes from the Railway Service Website (Liu et al., 2018a).
2.2 Methods and processing procedures
Flood risk can be defined as a function of flood hazard, exposure, and its related vulnerability. A flood hazard is usually characterized by its intensity and occurrence probability, exposure refers to the population and assets exposed to flooding, and vulnerability is often defined as the loss ratio of people or assets suffering different intensities of hazard (Samuels and Gouldby, 2009; Haimes, 2009; UNISDR, 2011; Winsemius et al., 2013). In this work, the hazard intensity is represented by the water depth (m). Exposure is represented by the railway network exposed to the flood hazard. Asset vulnerability is defined as the failure of a railway asset based on the design standard and is expressed as a failure threshold. If the failure threshold is exceeded, the service of the component is assumed to be disrupted, resulting in a 100 % performance loss of that asset. System vulnerability is represented as the system performance loss with different flood intensities. Risk is calculated as the expected annual performance loss at the national and provincial levels.
Figure 2 presents an overview of the framework used in this study. First, we generate a national- and river-basin-scale flood event set. To do this, we use flood hazard maps for different return periods at the national scale, taken from a global flood hazard model (see Sect. 2.1.1). We then divide these into flood hazard maps for the major river basins and use a curve-fitting method to estimate the flood depth for any return period for any cell. We then apply a Monte Carlo sampling method (Metropolis, 1987) to generate the flood events per river basin and aggregate these events to the national scale. Second, we define the railway system as a network using network theory (Newman, 2010). Third, we intersect the flood events with the railway network to identify the disrupted segments in the railway system based on a pre-defined failure threshold. In the last part of our analysis, we assess the system vulnerability and risk in terms of several performance loss metrics, including the daily total number and total percentage of trains affected (i.e. cancelled or detoured) and involved passengers as well as the total increased time and the average increased time for the detoured trains. We also analyse the parameters' sensitivity in the failure threshold and the related risk uncertainty.

Figure 2Methodology of the flood system vulnerability and risk assessment of railway infrastructure. Railway geometries © OpenStreetMap contributors 2019. Distributed under the Open Data Commons Open Database License (ODbL) v1.0.
2.2.1 National-scale flood event generation
To ensure the estimation is as accurate as possible for an event-based flood risk assessment based on the Monte Carlo sampling, a large number of independent flood events are required (Speight et al., 2017; Wu, 2019; Zhu et al., 2020). In the following subsections, we will describe the procedures to generate flood events, including input flood hazard maps, the function fitting procedure, and the Monte Carlo analysis, in more detail.
Input flood hazard maps
In this study, we assume that a flood event within one basin will produce a flood with the same intensity (return period) within that entire basin, whilst we assume that floods between different basins are independent of each other (Fraiture, 2007; Rojas et al., 2013). In this work, the flood hazard data are extracted from the GLOFRIS global fluvial flood hazard maps of Winsemius et al. (2013). To get the basin-scale flood hazard data, we divide China into nine major river basins according to the main river system.
Fitting procedure
For each grid cell, the GLOFRIS maps estimate the flood depth for the nine aforementioned return periods (2, 5, 10, 25, 50, 100, 250, 500, and 1000 years). To estimate the flood depth for any return period between 2 and 1000 years, we fit a quadratic spline function to develop an inundation depth-exceedance probability function (P) for each return period interval for each grid cell (Marsden, 1974; Vandebogert, 2017; Meshram et al., 2018). The quadratic spline is a method that uses a piecewise quadratic function to obtain the best-fitting curves. This interpolation method allows us to obtain a smooth, continuous curve through the provided flood depths for the different return periods.
The method is applied as follows, and examples of the inundation depth-exceedance probability function of grid cells are shown in Fig. 3a.
For each grid cell gx, y (x, y are respectively the horizontal and vertical coordinates of grid cell centre), the annual exceedance probability flood depth DT is calculated by Eq. (1):
where DT is the magnitude of a flood depth with a return period of T years, and P(DT) is the exceedance probability of DT. DT is between [D1, D1000], with … ≤D1000. We assume that D1 is equal to zero (i.e. 1-year event1 with a flood depth of 0 m2) and is the same as that of a 2-year event (the lowest return period in the GLOFRIS dataset). Let Pr(DT) denote a quadratic, continuously differentiable function of P(DT). Then, by definition
For each interval of grid cell gx, y, we can obtain its piecewise quadratic function by Eq. (3):
where Prx, y(DT) is a set of continuous inundation depth-exceedance probability functions consisting of eight continuous quadratic functions for gx, y and shown in Fig. 3a with curves. For , , and , we can calculate these constants by bracketing the critical point of P(DT) and derivative of the function Prx, y(DT); details on the interpolation methods can be found in a previous study by Sun and Yuan (2006). In this work, we assume that only one event occurs per year in each basin since we assume the intensity of events is equal to or larger than 1 year. When the return period is lower than 2, the flood depth is set to zero, which is the same as that of a 2-year event.
Simulation procedure
To produce a time series of flood events based on the created inundation depth-exceedance probability functions, we use a Monte Carlo sampling method. The basic idea of the Monte Carlo sampling method is that when the number of simulations is sufficiently large, the frequency of an event approximates the probability of the occurrence of the event (Baker, 2008; Speight et al., 2017). The flood event generation procedure is presented in Fig. 3 and Appendix Fig. A2 and can be summarized in two steps. First, we generate independent events at each basin and combined them into a national event. For an event (“i” is the sequence number of simulated flood event; “j” is the sequence number of basin number, which belongs to (1, 9)) and for each basin Bj, a random number between 0 and 1 is generated from a uniform distribution. The flood depth of the cells in basin Bj for event can be calculated using and the inundation depth-exceedance probability function based on the assumption that a flood event in one basin will produce a flood with the same intensity. For a national-scale flood event, basin-specific floods of nine basins can be randomly combined into a national-scale flood by assuming independence between the flood events among different basins; this concept is presented in Fig. 3b. Second, we repeat this process 10 000 times to generate a set of national-scale independent flood events as presented in Fig. 3c.
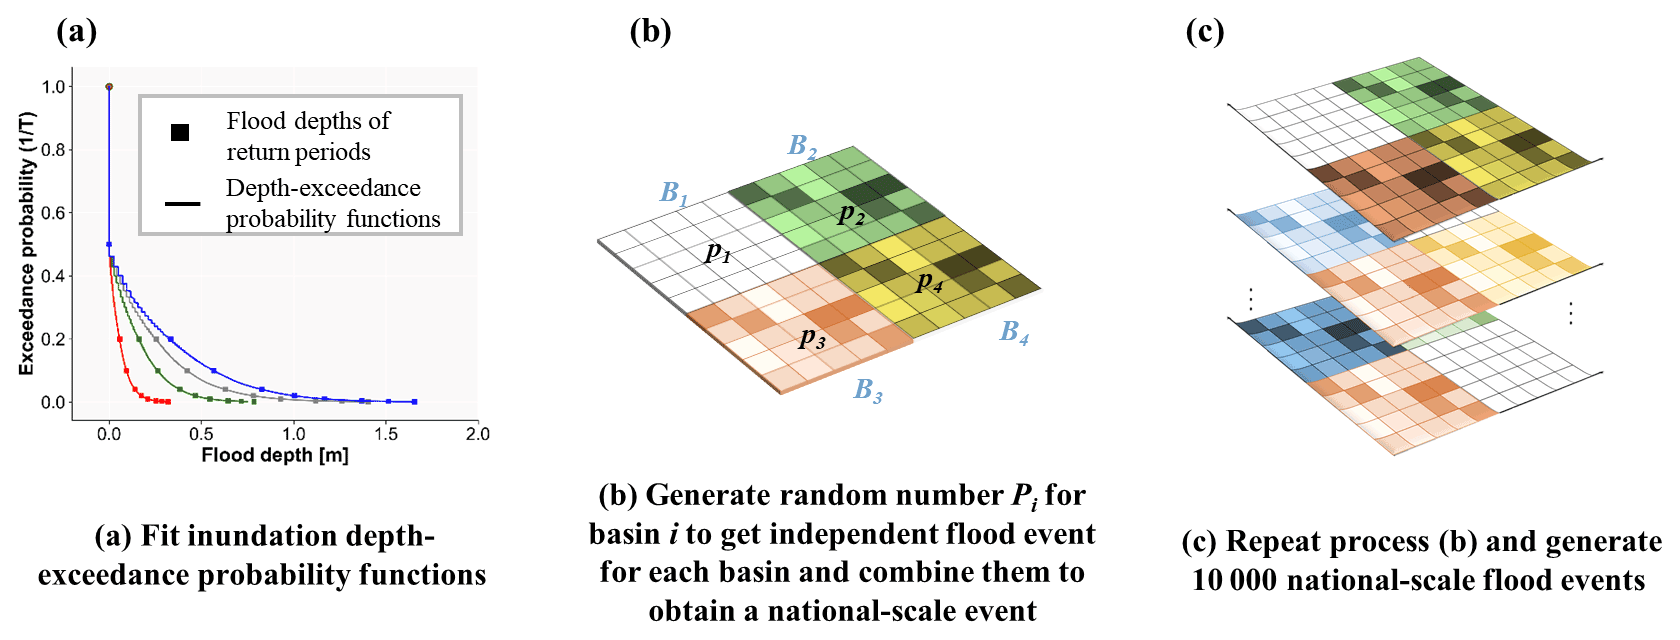
Figure 3An example of generating national-scale flood events. In (b), p1, p2, p3, and p4 are the random numbers between 0 and 1 generated for basins B1, B2, B3, and B4, which are used to generate basin-scale events based on the functions in (a). The layers of basin-scale floods in (b) are combined into a national-scale flood event. The layers in (c) are the 10 000 national-scale events using the process in (b).
For each basin to obtain 10 000-year events (we assume that 10 000 years of events are sufficient to cover almost all probable scenarios), we therefore apply a Monte Carlo method to sample 10 000 exceedance probabilities. For each of these exceedance probabilities, we estimate the inundation depth for each cell within that basin. We repeat this procedure for each basin, which results in a 10 000-year set of flood events for each basin. We then combine these sets into a national-scale flood event set by assuming independence between the flood events in the different river basins (Fig. 3c). Hence, for each of the 10 000 years, we simply take the estimated flood depths for each basin. For example, in year 1, basin 1 may have an exceedance probability of 0.5, whilst basin 2 may have an exceedance probability of 0.98. For year 1, the resulting national-scale flood map would therefore have values for a flood event with an exceedance probability of 0.5 in basin 1, a flood event with an exceedance probability of 0.98 in basin 2, and so forth. This procedure results in a 10 000-year national-scale flood event set.
We also assess the system vulnerability by calculating the impacts that could occur throughout China if a flood with a given return period were to occur within an individual basin. To do this, for each basin and each return period we draw 10 000 events for all other basins assuming independence. In total, this leads to a set of 810 000 events (10 000 events × 9 return periods × 9 basins).
2.2.2 Railway network building
Railway systems are commonly represented through spatially explicit networks as an analogy for their structure and flows (Rodrigue, 2016). This network representation can be used to calculate system performance metrics based on network theory. In this work, the Chinese railway system was modelled as a directed weighted network, which consists of a group of nodes (stations) connected by edges (railway lines) with daily train trips, where the edges have a travel direction associated with them. Based on the geographic information of the railway system and the timetable data (see Sect. 2.1.3), we build the Chinese railway network. As our method is primarily concerned with flood risk along rail segments between cities and not within cities, for simplicity, we combine multi-stations into one node using the location of the highest-capacity station in each city. In total, 2240 nodes are combined into 1790 nodes. The final extracted railway network has a total length of 90 600 km for (merged parallel) lines connecting two stations, consisting of 1973 edges and 1790 nodes (Fig. 1). Figure 1 shows the spatial distribution of the railway network and average daily number of trains. Topology and traffic flows vary greatly in space. The network density reduces greatly moving from eastern China to western China. For the traffic flow, the railways connecting large cities, like the railways from Beijing to Guangzhou, Harbin, and Shanghai and railway from Shanghai to Changsha have higher flows.
2.2.3 Failure condition based on an event
We assume that a railway is impassable when the water level on the railway line is higher than the failure threshold Wd of the railway service after drainage (CRPH, 2012; Espinet et al., 2018). The water level after drainage WLx, y of grid cell gx, y is calculated by Eq. (4):
where is the flood depth of a flood event, Wldx, y is the water level of the design standard of grid cell gx, y, and Dc is the drainage capacity rate.
The rail segment lij between two stations' failure condition is defined by Eqs. (5) and (6):
where Fcij is the failure condition of component lij, which has two states, namely normal (denoted by 1) and disrupted (denoted by 0). Z(xy) is the failure condition of grid cell gx, y; when the water level after drainage is larger than Wd, Z(xy)=0; otherwise, Z(xy)=1.
In this study, we consider a failure threshold of 0.2 m after drainage, according to the railway transportation emergency plan (CRPH, 2012; Espinet et al., 2018). The flood design standard of the culverts, bridges, and embankments of the Chinese national railway system is designed for 100-year water depth, according to the standard for flood control (CRPH, 2016). Furthermore, we assume that the drainage capacity rate is 0.83 of water level of the design standard, and it reduces the total amount of water that the railway structure can actually drain (CRPH, 2016; Espinet et al., 2018).
Failure hotspots of railway segments lij can be calculated by Eq. (7):
where AFij is the failure probability to the railway segments, E is the N-year flood event catalogue, and is the failure condition of railway segment lij under flood event e.
2.2.4 Performance loss metrics
Daily affected trains and passengers
Once a flood occurs, trains may be affected in two ways: (i) increased travel time or (ii) cancellation. The number of daily affected trains is calculated by Eq. (8):
where is the number of daily cancelled trains and is the number of daily detoured trains after a flood event.
We assume that the average number of passengers is 80 % of the train's capacity (Rezvani et al., 2015; Wei et al., 2017). Therefore, the number of affected passengers can be defined by Eq. (9):
where CAi is the capacity of the ith train.
Daily detoured trains and passengers influenced by detoured trains
Once a flood occurs, some trains will detour to complete their journeys. The daily detoured trains can be calculated based on four assumptions as follows (in order of descending priority), which is also presented in Appendix Fig. A3:
-
Stations are not repeated along the routes.
-
The train passes the largest number of original stations along the detoured route.
-
The detour with the smallest increase in travel time is selected.
-
Detouring is impossible when the increased time for re-routing is greater than 24 h.
The daily passengers influenced by detoured trains can be defined by Eq. (10):
Total increased time for the detoured trains
The total increased time for detoured trains is calculated by Eq. (11):
where is the running time of the ith train under flood event e, and Ti is the original travelling time of the ith train.
Average increased time for the detoured trains
The average increased time is calculated by Eq. (12):
where is the average increased time under flood event e.
Daily cancelled trains and passengers influenced by cancelled trains
Once a flood occurs, some trains may be cancelled if there is no alternative route possible or when the re-routing time is too long (greater than 24 h). The daily cancelled trains are calculated by Eq. (13):
where is the number of running trains in the system after a flood event, and NS is the original number of trains in the system.
The daily passengers influenced by cancelled trains can be defined by Eq. (14):
2.2.5 Calculating system vulnerability and risk
Each performance loss metric is calculated for each flood event. System vulnerability curves are generated to present the relationship between performance loss and flood intensity (return period). We use the expected daily affected trains, cancelled trains, detoured trains, affected passengers, and increased time for detoured trains to present the flood risk to the railway system according to Eq. (15):
where ARs is the expected daily flood risk level to the railway system, E is the N-event flood catalogue, and Ve is the performance loss metric, i.e. , , , , , , , and under flood event e, which are defined in Eqs. (8)–(14).
2.2.6 Uncertainty and sensitivity analysis
By applying an uncertainty analysis (UA), we identified the range of model output for imprecisely known input parameters (De Moel et al., 2012). A sensitivity analysis (SA) aims to determine the parameter effect on the model output (Koks and Haer, 2020). Parameters with greater effect should attract more additional attention to deal with the uncertainty they bring (Koks and Haer, 2020; De Moel et al., 2012). Detailed methods of uncertainty and sensitivity analysis can be found in previous studies by De Moel (2011) and Koks and Haer (2020).
In this study, we make assumptions on the train disruption threshold using three parameters (the water level failure threshold, drainage capacity rate, and design standard) based on emergency code and design code standards (CRPH, 2012). However, it should be noted that these standards are not known exactly for each asset and will change over time, such as dynamically changing protection standards and ageing infrastructure. Within a railway system, a lot of different asset types exist, with varying design standards. This implies that the capacity to cope with the hazard does vary from location to location. Therefore, it is worthwhile to perform a sensitivity analysis on these key parameters (De Moel and Aerts, 2011; Horacio et al., 2019). Hence, we perform an uncertainty and global sensitivity analysis in which we assess the performance loss metrics for a range of different values for these parameters. For water level failure, we use a range between 0.1 and 0.5 m. For the drainage capacity rate, we use a range between 0.7 and 0.9, and for the design standards, we use a range between 50 and 100 years. The list of all assumptions taken in this study and their range in the sensitivity analysis can be found in Appendix Table A1. In total, we create a set of 1000 different random parameter value combinations in the sample space.
3.1 Failure hotspots of railway segments
The annual failure probability of the network segments is shown in Fig. 4 and is calculated based on the 10 000-year national flood event set. The results show a clear regional differentiation (Fig. 4a). Areas with high annual failure probabilities are mainly located in the Yangtze River basin, Southeast Basin, and Pearl River basin areas. These three basins have a humid subtropical climate and high precipitation levels in the rainy season during the summer, and these areas also have the highest railway density (Fig. 1), mostly across rivers and located in flat areas in China, which makes these railway lines susceptible to flood hazards.
Figure 4b shows the percentage of the length of railway lines that fall into each failure probability category for the national- and basin-level analyses. Nationally, the failure probability is greater than 0 for more than 55 % of the total length of the railway lines. This percentage is heterogeneous across different river basins: it is highest in the Southeast Basin, followed by the Pearl River basin and the Yangtze River basin. Nationally, 6.8 % of the length of the railway lines has a failure probability greater than 0.02, with the highest proportions in the Yangtze River, Yellow River, and Southeast basins, with 12.5 %, 10 %, and 7.2 %, respectively. The results for the failure hotspots indicate that the railways located in Yangtze River, Southeast, and Pearl River basins need more attention and planned prevention measures to reduce the failure probability induced by floods.
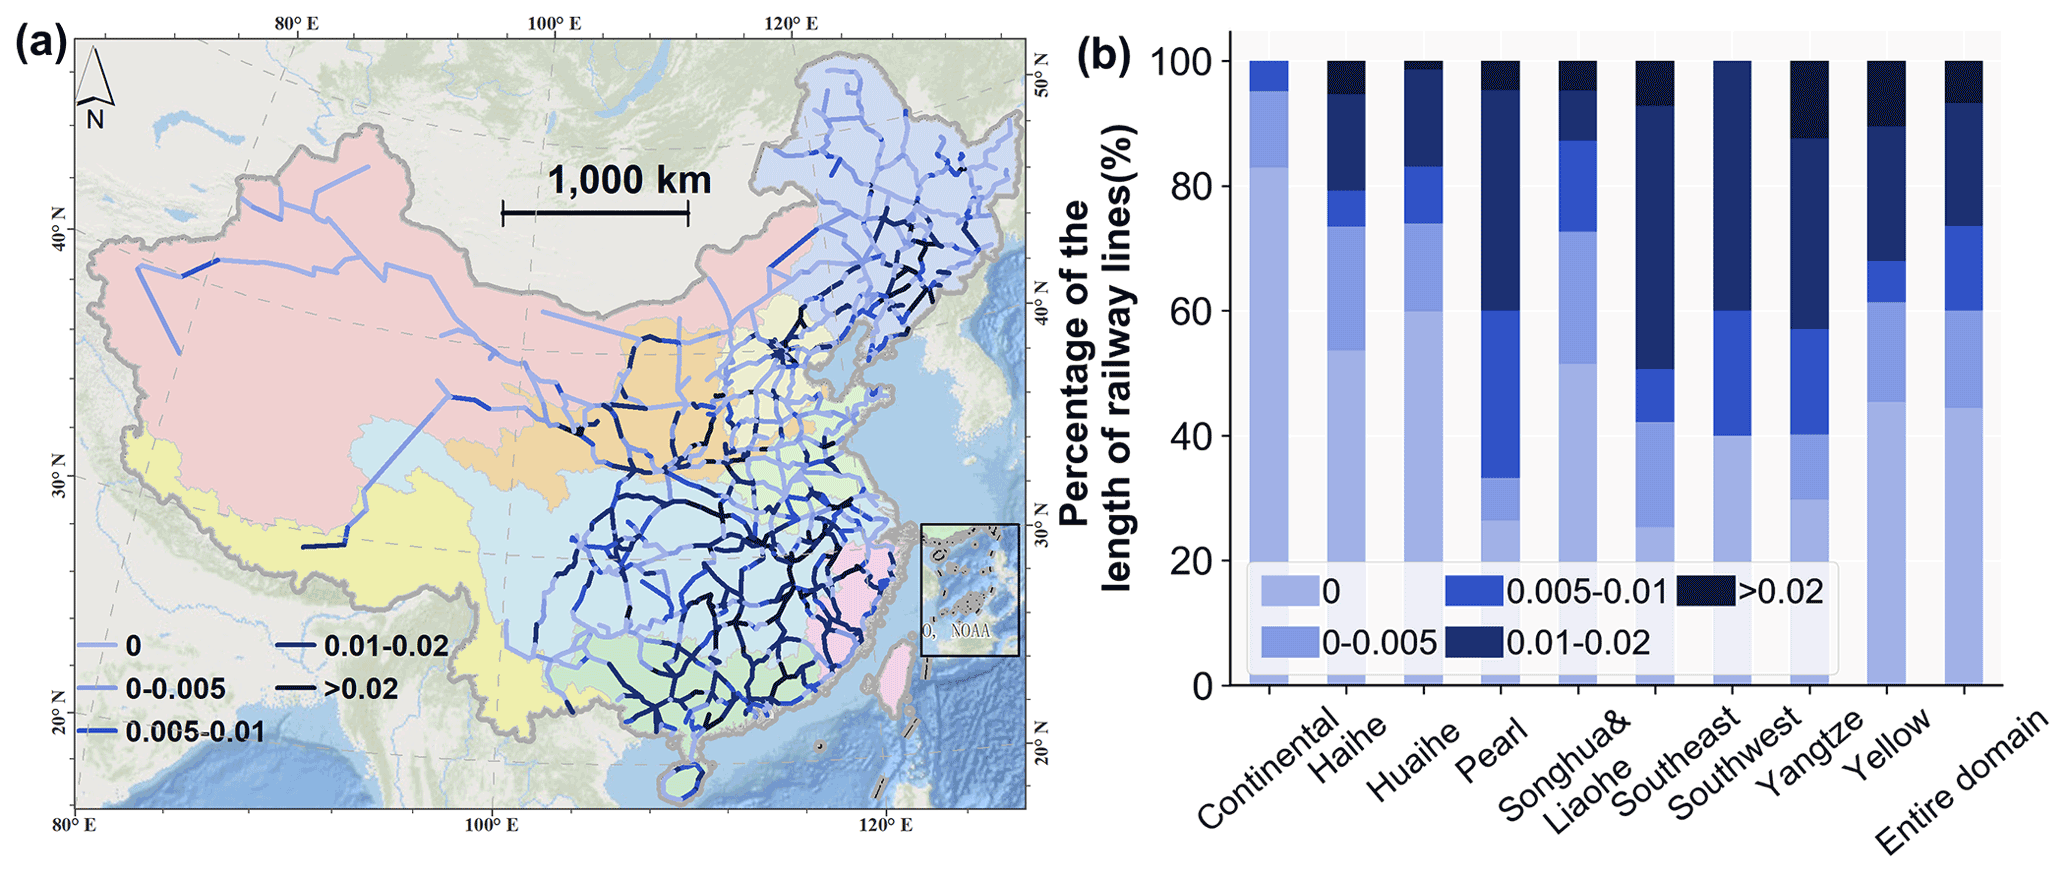
Figure 4(a) Annual failure probability map of the network segments affected by floods and (b) the percentage of the length of railway lines for different failure probability categories per river basin. Railway geometries © OpenStreetMap contributors 2019. Distributed under the Open Data Commons Open Database License (ODbL) v1.0.
3.2 Risk analysis of the Chinese railway system
The performance loss distribution curves of the railway system using the 10 000-year national-scale flood set are presented in Fig. 5. The results show that approximately 85 % of the flood events have little effect (less than 1 % of the daily trains and passengers) on the railway system from the perspective of all the performance metrics. For the daily affected trains, the absolute maximum number can reach 4200, and the average number is approximately 200 trips; these values represent 59 % and 2.7 % of the number of the daily trains. For the daily affected passengers, the absolute maximum number can reach 3 500 000, and the average number is approximately 165 000 people (60 % and 2.8 % of the number of the daily passengers). In addition, the largest average increased time for detoured trains can reach 14 h, and the mean average increased time for detoured trains is approximately 5 h.
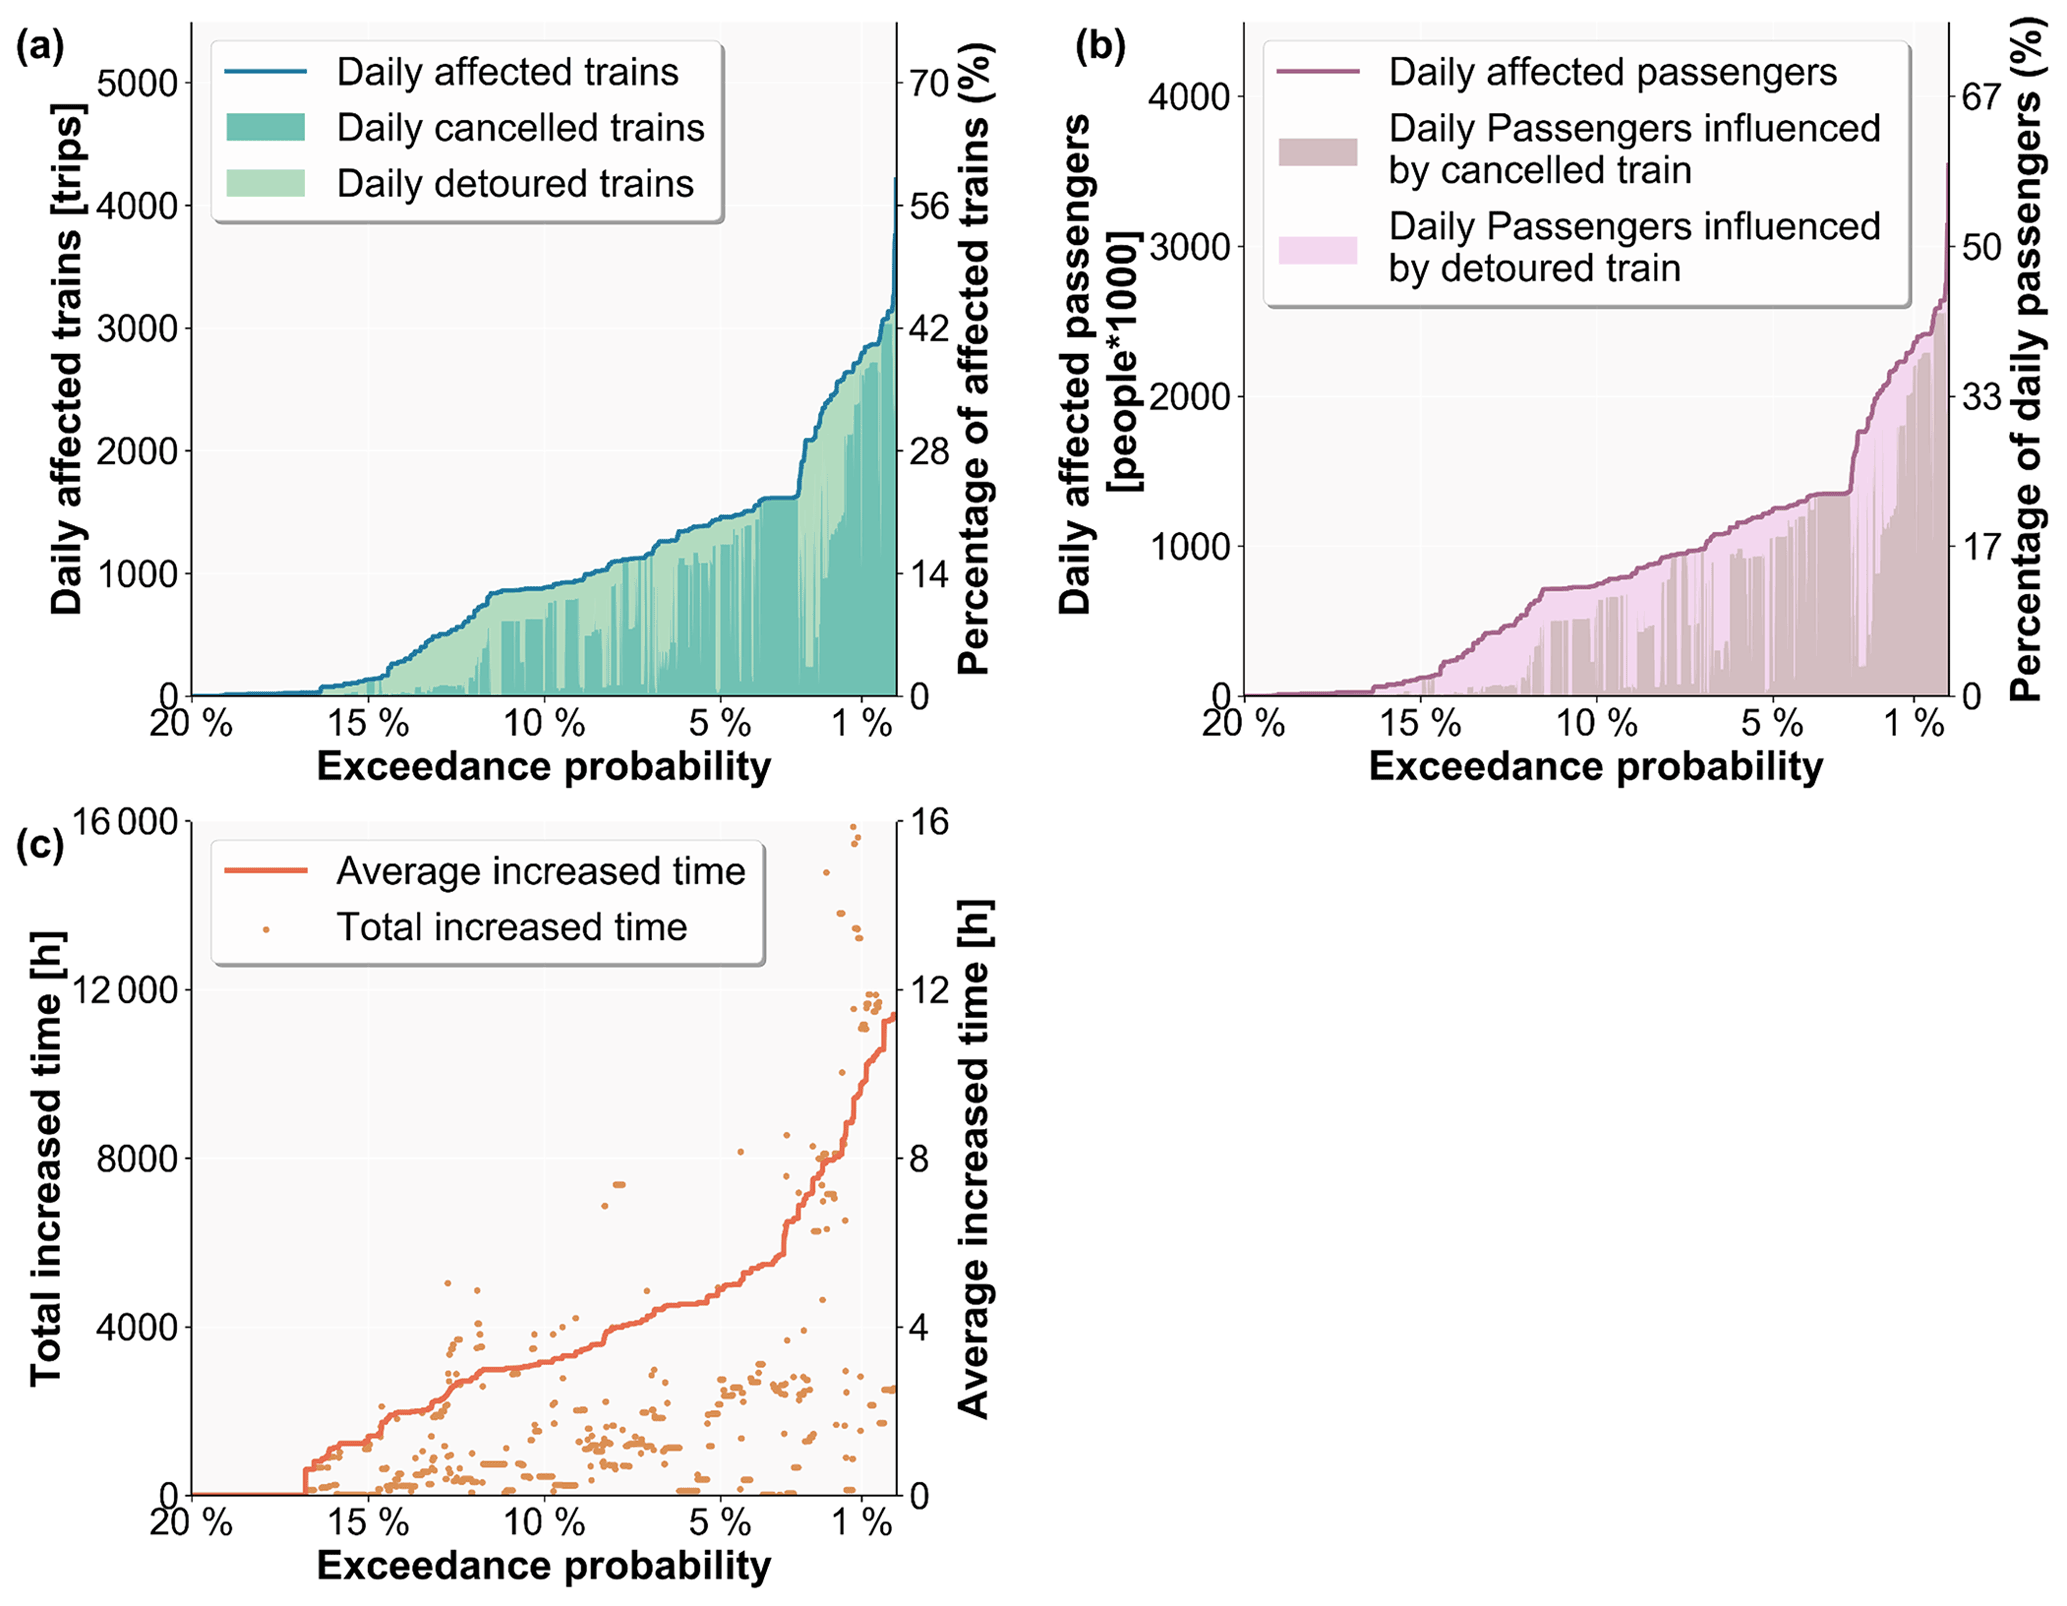
Figure 5Exceedance probability–performance loss curves: (a) exceedance probability–affected trains curve, (b) exceedance probability–affected passengers curve, and (c) exceedance probability–increased time curve.
The performance losses per province of the railway system are presented in Fig. 6 for a range of metrics. The risk differs considerably between regions when expressed in different risk metrics. When examining the metrics of the daily affected trains and affected passengers, we find that the provinces in central China, such as Henan, Hubei, and Anhui, have the highest absolute and relative risks, estimated to be over 40 daily affected trains (4.5 % relative to the province's number of daily trains) and more than 35 000 daily affected passengers (3.5 % relative to the number of the province's daily passengers). Interestingly, some provinces, such as Tibet Province, have a low risk in absolute terms but a high risk in relative terms because the Tibet Province has the smallest rail network and rail traffic density; only one line (i.e. Qinghai–Tibet Railway) crosses this region, which is therefore highly vulnerable to even a low-frequency flood hazard. Guangdong Province has the opposite results, with high risk in absolute terms and low risk in relative terms due to the large rail network and rail traffic density, which make the railway system more robust even with a high flood failure probability. The total and average increased time for detoured trains show contrasting results. The high risk in terms of the total increased time is mostly distributed in east China, whereas the highest average increased time is distributed in western provinces such as Xinjiang and Tibet provinces. From eastern China to western China, the traffic flow becomes significantly lower; more trains can be detoured with less time per trip in east China, and in the western provinces, fewer trains can be detoured but with more time per trip.
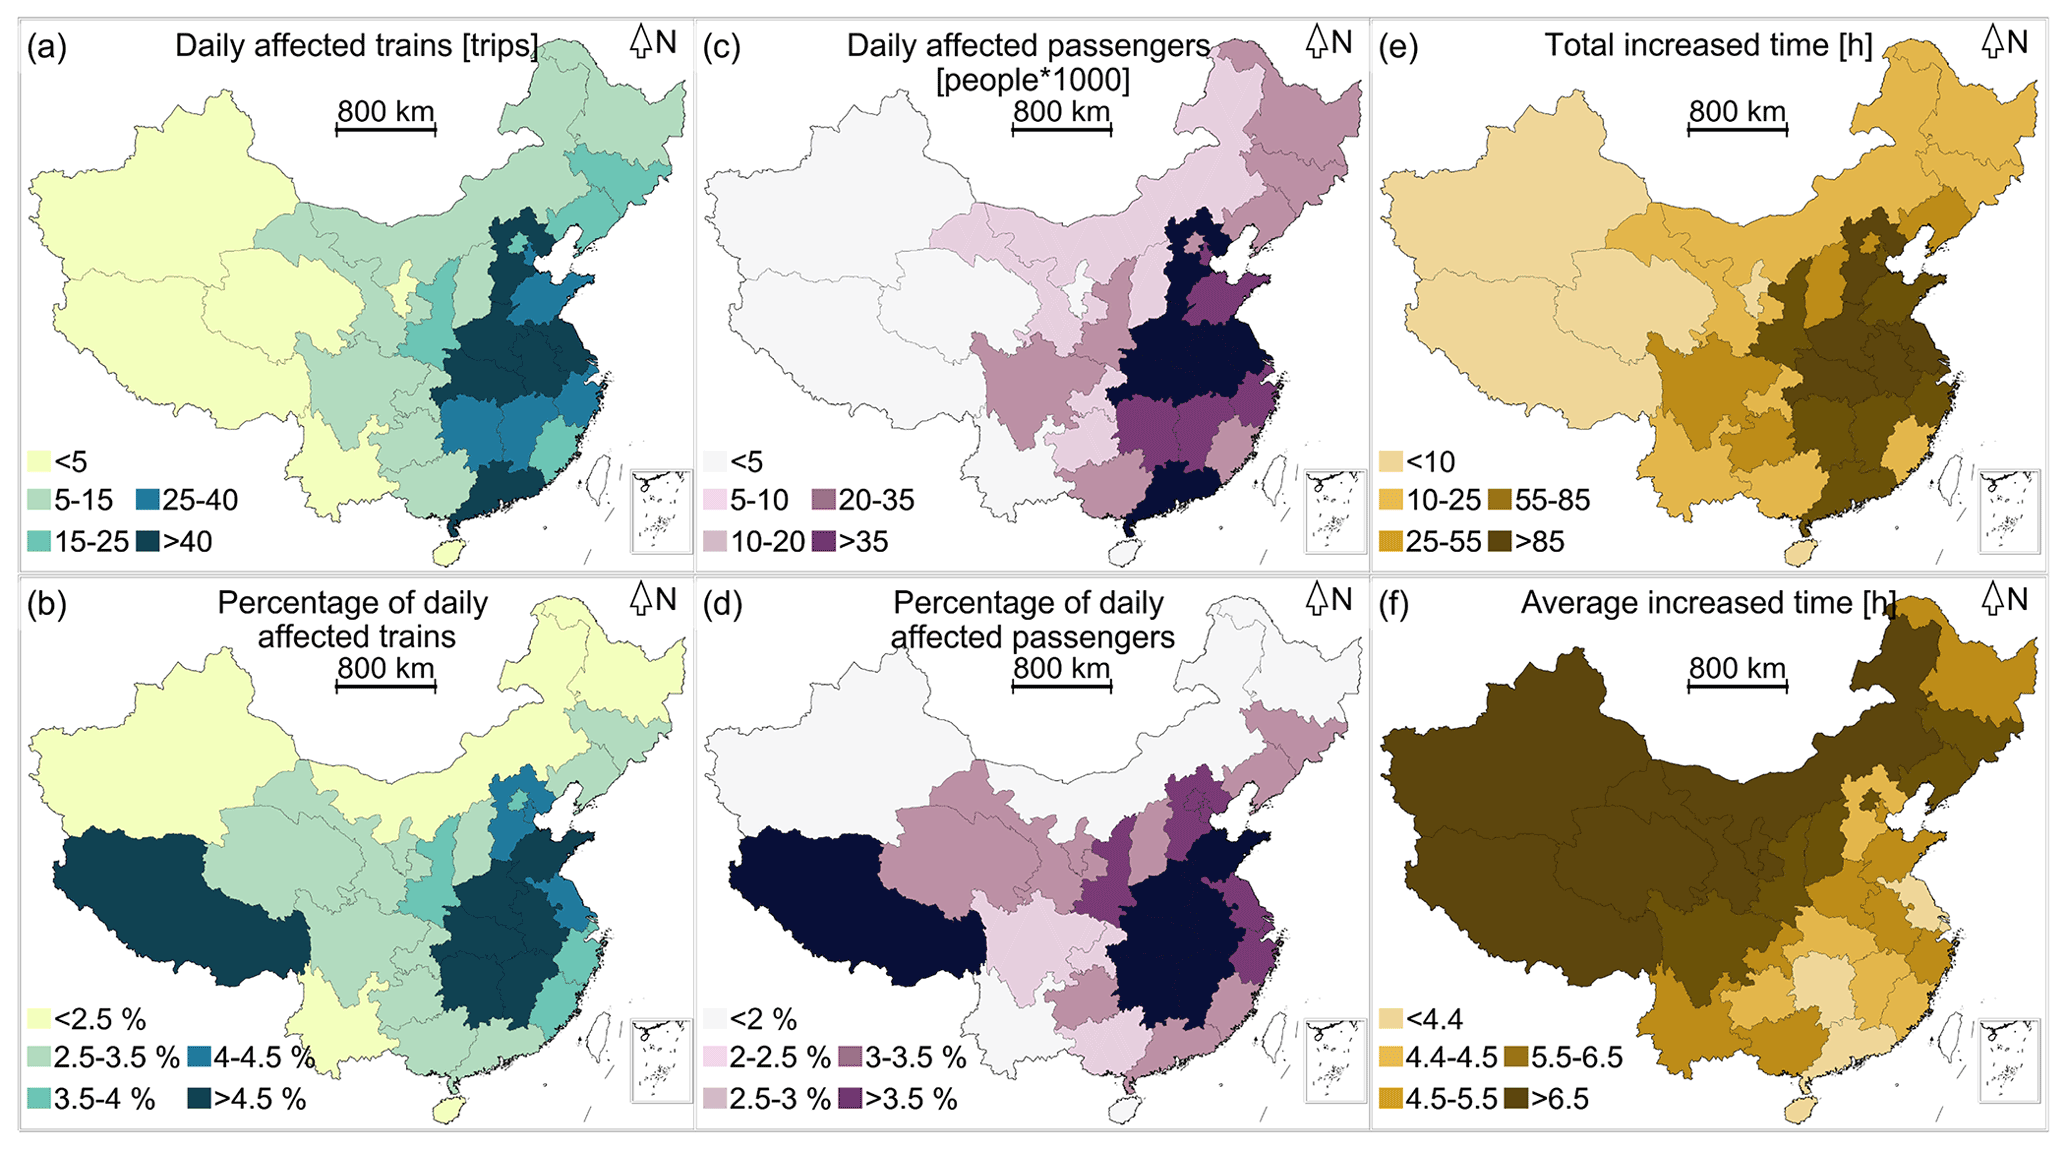
Figure 6Performance loss of the railway system per province. (a) The daily affected trains in absolute terms, (b) the daily affected trains relative to the number of the province's daily trains, (c) the daily affected passengers in absolute terms, (d) the daily affected passengers relative to the number of the province's daily passengers, (e) the daily total increased time for the detoured trains per province, and (f) daily average increased time for the detoured trains per province. Appendix Fig. A4 provides the risk map of detoured and cancelled trains and passengers influenced by detoured, cancelled trains. Appendix Fig. A5 provides a map of the Chinese provinces.
Several provinces appear at the highest level of the three metrics presented in Fig. 6 and can be classified as particularly vulnerable provinces. Anhui Province, for example, has one of the highest absolute and relative levels of risk to trains and passengers in Fig. 6a–d but also has the highest total increased time in Fig. 6e. Hubei Province shows one of the highest absolute and relative levels of risk to trains and passengers in Fig. 6a–d. Jiangsu Province has the highest absolute level of risk to trains and passengers in Fig. 6a and c and one of the highest total increased times in Fig. 6e. These provinces are at the highest risk compared to the other provinces. This information can help researchers and local authorities to determine high-risk areas and prioritize hazard-risk management interventions to reduce risk. These can be used in the first steps of developing climate-resilient infrastructure.
3.3 System vulnerability of the Chinese railway system
Figure 7 presents system vulnerability curves based on the 810 000 simulated flood events and shows the performance loss metrics (namely the percentage of daily affected trains and increased time) plotted against the return periods. The bottom-right plots for panels a and b show the national results, whilst the other figures show the results for each river basin. The coloured shading represents the distribution of the flood performance loss, where the lines refer to the median performance loss value and the bounded lines refer to the 10th and 90th percentiles. The low-impact events cause the median values to be the same as the lower bound for the nine river basins as a result of their high frequency.
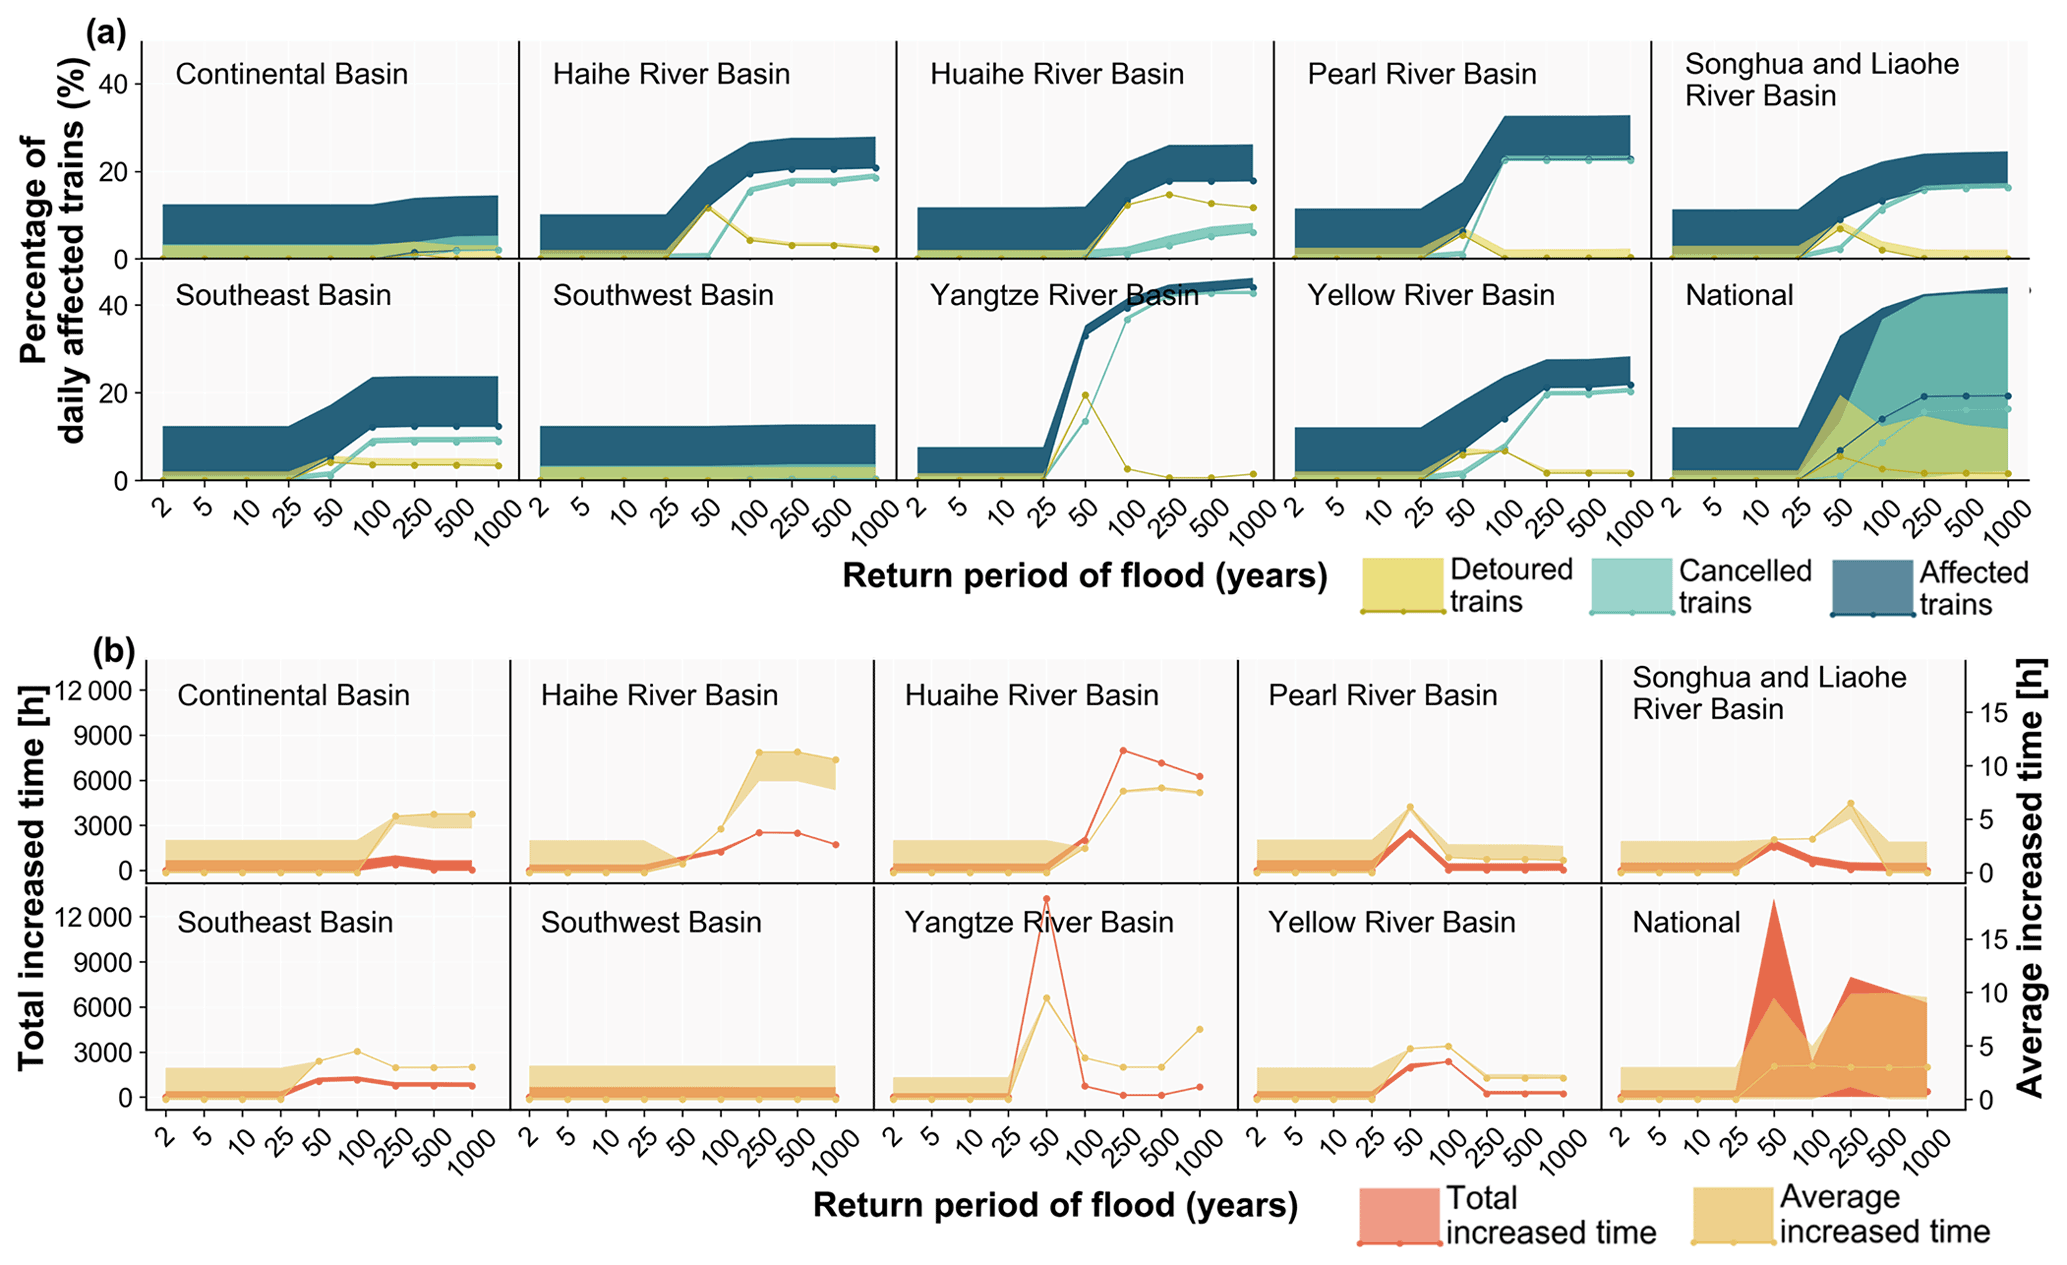
Figure 7System vulnerability curves induced by river floods from the national flood event set, showing (a) the percentage of daily affected trains relative to the total number of daily trains and (b) the increased time for the detoured trains. The shading shows the distribution of the flood performance loss, where the lines refer to the median performance loss value and the bounded lines refer to the 10th and 90th percentiles. In Appendix Fig. A6, we provide the system vulnerability curves for the passenger-level metrics. NB: for total increased travel time, the values can decrease at higher return periods – this is because some of the trains are cancelled, and therefore there is no travel time for those trains.
Due to the different definitions and focus of each metric, the relationship between each metric and flood intensity is also different. From Fig. 7a, we can see that the percentage of daily affected trains and daily cancelled trains relative to the total number of daily trains increases with the increases in the return period of the flood events for the nine basins. The percentage of daily detoured trains relative to the total number of daily trains and the total and average increased time for detoured trains do not always increase with increasing return period shown in Fig. 7a and b. The median performance loss for the five metrics is close to zero for floods with a return period below 25 years and remains stable when the flood hazard return period exceeds 100 years because of the railway design protection standards and assumed drainage capacity. For most basins, between the 25- and 100-year flood events, the percentage of daily affected trains and daily cancelled trains relative to the total number of daily trains per flood event increases. The rule is not suitable for the Southwest and Continental basins, where the percentages are pretty much constant and low. This is due to a lower railway line density and train trips in these two basins. A low impact is expected even though all railway lines are disrupted. The percentage of daily detoured trains relative to total daily trains and the total and average increased time increase between the 25- and 50-year flood events and sharply decrease between the 50- and 100-year events, especially for the Yangtze River, Yellow River, and Pearl River basin floods. This is because most of the north–south rail lines in China, such as the Beijing–Guangzhou and Beijing–Jiulong lines, cross these basins. Most trains that are detoured under a 50-year event cannot be detoured under a 100-year event, as most of the north–south rail lines suffer failures at this hazard intensity.
When comparing the results between the nine river basins, we find that, in general, floods in the basins in central and eastern China have the highest impacts on the Chinese national railway system. The percentage of daily affected trains (cancelled and detoured trains) of the total number of trains is the largest for the Yangtze River basin, followed by the Pearl River basin and the Yellow River basin. In the Yangtze River basin, the median percentage of daily affected trains (cancelled and detoured trains) relative to the total number of trains is close to 40 % for a 100-year flood event. For the Continental and Southwest basins, the value is close to zero. The high impacts of daily affected trains observed in the central and eastern areas are due to a significantly higher railway line density and daily train flows compared to the more inland river basins (see Fig. 1). The higher annual failure probability of the rail segments in the central and eastern regions shown in Fig. 4 also leads to a higher probability of failed railway segments per flood event and results in higher impact. The number of daily detoured trains in the Huaihe and Haihe river basins in eastern China is higher compared to other basins, which leads to a large total increased time when one flood occurs. The reason is that the Huaihe and Haihe river basins are located in eastern China and only cross railway lines in the eastern coastal area. Therefore, the affected trains have more detour options through the lines of the Yangtze and Yellow river basins, which lead to more detoured trains and associated total increased time. For each basin, based on the vulnerability curve, once we know the intensity of flooding that would occur, we can estimate the affected trains and passengers. Based on this kind of information, local authorities could prepare dispatch plans in advance of floods.
3.4 Risk uncertainty and parameter sensitivity
Figure 8 and Appendix Fig. A7 present the sensitivity of the results to the assumed parameters and the range of performance metric uncertainty. Overall, from the uncertainty histograms, we can see that all the performance metrics are right-skewed, especially for the average daily affected trains and affected passengers shown in Fig. 8a and c and average daily cancelled trains and passengers influenced by cancelled trains shown in Appendix Fig. A7b and d, which have a long right tail for high performance loss estimates. This seems a little bit less for the average daily detoured trains and passengers influenced by detoured trains shown in Appendix Fig. A7a and c and average increased time for detoured trains shown in Fig. 8e, which is probably the result of the assumption that detouring is impossible when the increased time for re-routing is greater than 24 hours, resulting in a smaller range of detoured options and thus a smaller range in resulting performance loss estimates. The average number of daily affected trains ranges from 100 to 500 trips. For daily affected passengers, it ranges between 100 000 and 450 000 people, and the average increased time ranges between 3.5 and 5.5 h with the change in the parameters.
In Figs. 8b, d, f and A7f, the pie charts show how much the uncertainty in each input parameter contributes to the variance of the performance loss estimates. The results show that the performance loss estimates are particularly sensitive to the values used for the design standards. Using the different parameter settings, we see a variation in the design standards of approximately 43 %. The variation in the drainage capacity rate and water level failure threshold produces similar uncertainty, which is approximately 28 %. Reducing uncertainty in risk assessment is particularly challenging as it would require location-specific parameters. Despite the difficulties, these geographically varying design standards should be developed in the future to reduce uncertainty and improve the performance loss estimates.
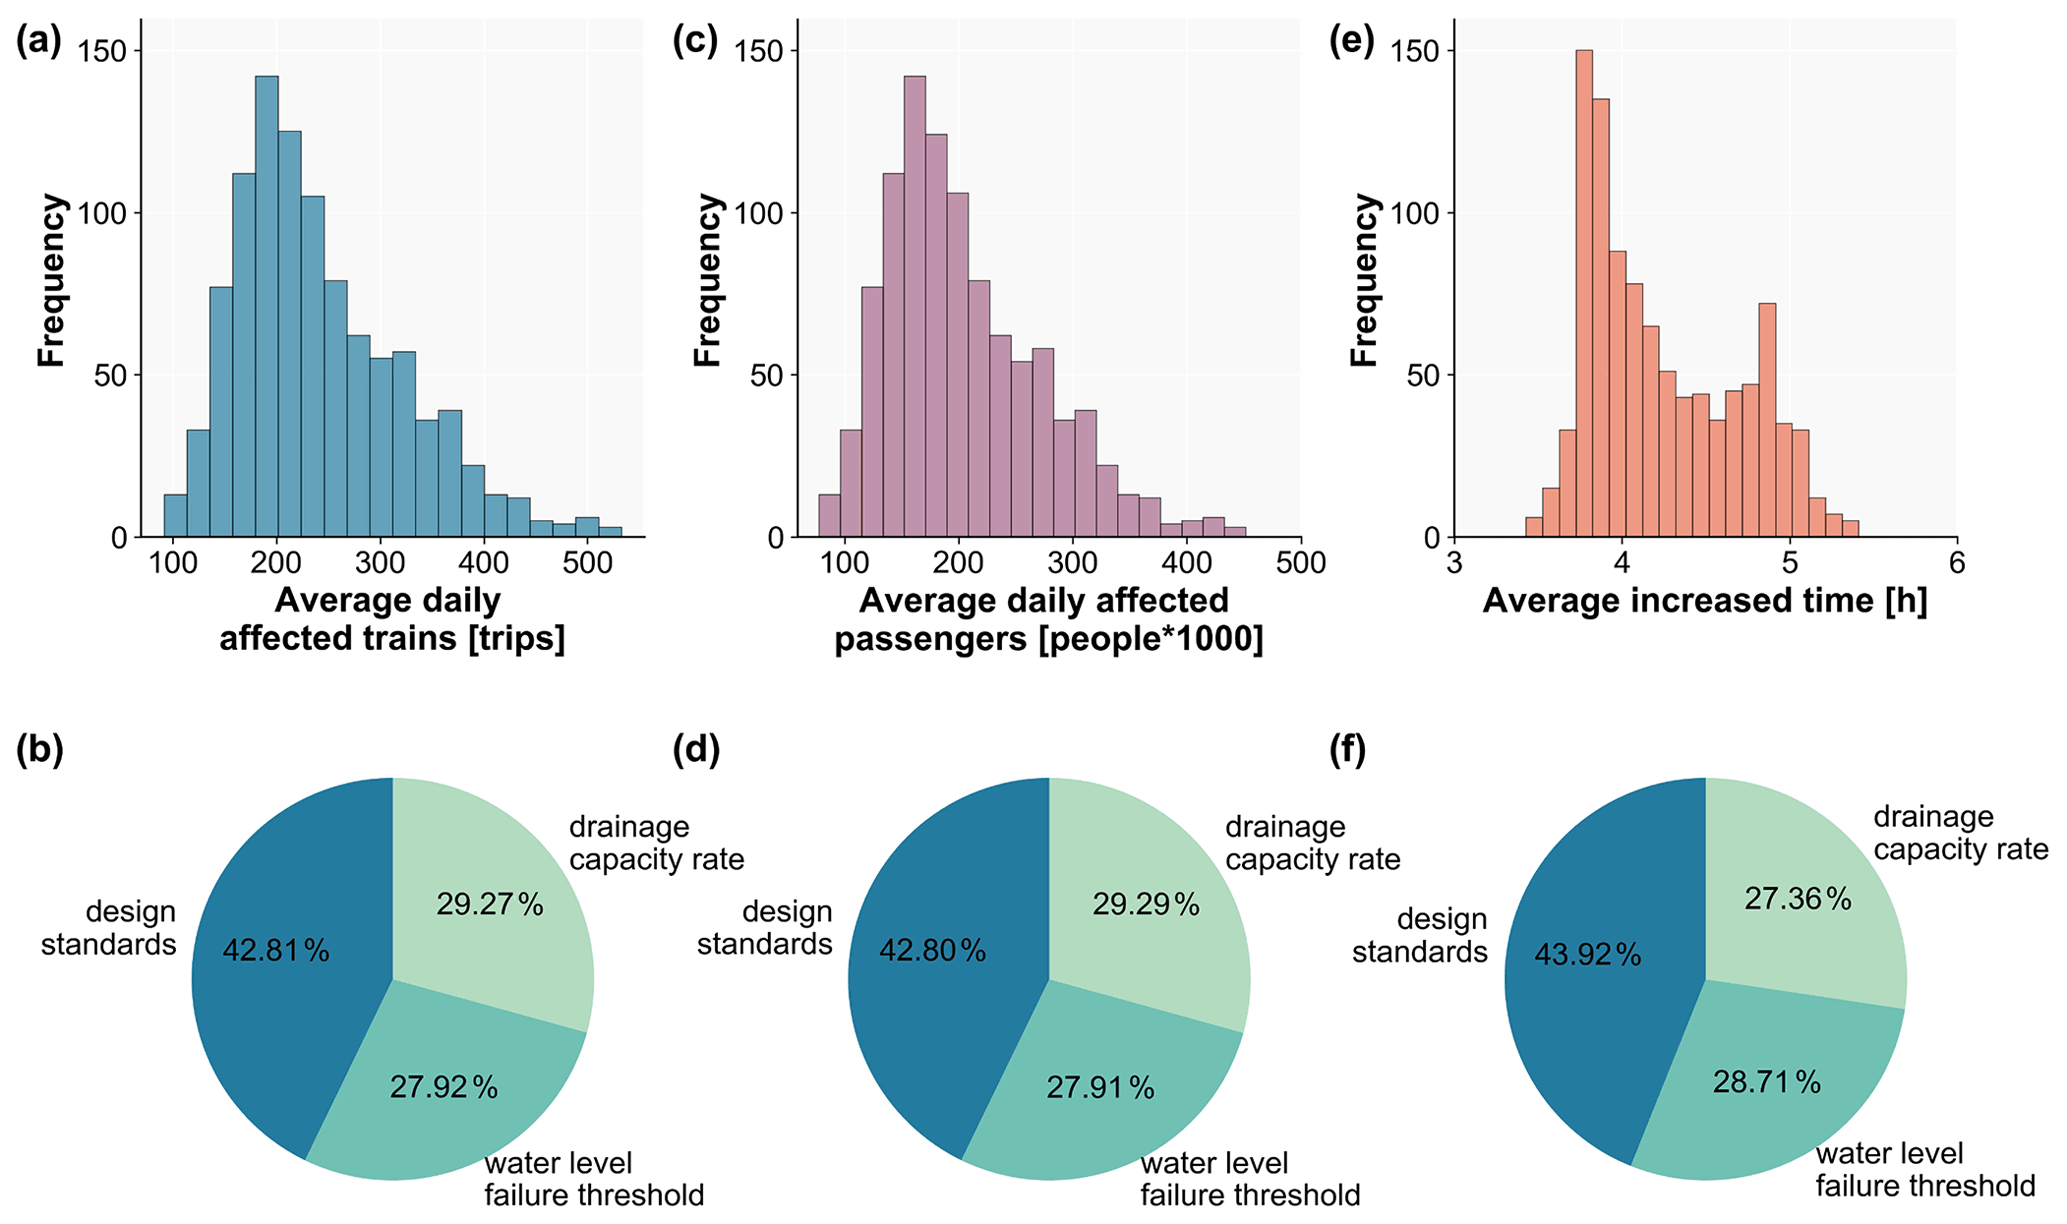
Figure 8Results of the uncertainty (histograms) and sensitivity (pie charts) analyses for the performance metrics. Panels (a) and (b) show the average daily affected trains, (c) and (d) average daily affected passengers, and (e) and (f) average increased time. Figure A7 provides the results of the other performance metrics.
Our results reveal clear geographical disparities in the failure hotspots. Areas with high annual failure probabilities are mainly located in the Yangtze River basin, Southeast Basin, and Pearl River basin. Comparing the failure probability from this study with the susceptibility map (Fig. A8) presented in seminal works by Liu et al. (Liu et al., 2018a, b), we find some differences in hotspots in Xinjiang Province and along the Beijing–Shanghai line. In our study, we find lower failure probabilities relative to the work of Liu et al. (2018b). For other regions, the spatial patterns are similar. Our study considers the same protection standards (the water level failure threshold, drainage capacity rate, and design standard) for the railway lines in the Chinese railway system. It should be noted that these standards will not remain constant over time, as a result of ageing infrastructure. This means that the failure probability in some areas in this study is biased compared to research based on historical data. Indeed, many older lines have been upgraded/improved so that the protection standards are more consistent with newer lines.
In our work, we find that in the Yangtze River basin, the median cancelled trains relative to total daily trains is between 0 % and 14 % when the flood intensity is between 25- and 50-year events. In 2016, from May to July, the Yangtze River basin and Huaihe River basin suffered severe rainfall (Lyu et al., 2018). In most affected areas within the Yangtze River basin, the floods that occurred exceeded the 25-year return period. Floods caused disruptions on several railway lines, including the Chengdu–Chongqing line, Hefei–Jiujiang line, and Sichuan–Guizhou line, which cross the Yangtze River basin. In the Huaihe River basin, damage occurred to the Beijing–Guangzhou line. From 30 June to 6 July, approximately 100 trips (about 2 % of the daily trains) were cancelled every day for the Chinese railway system. These observed impacts are within the range of our estimates.
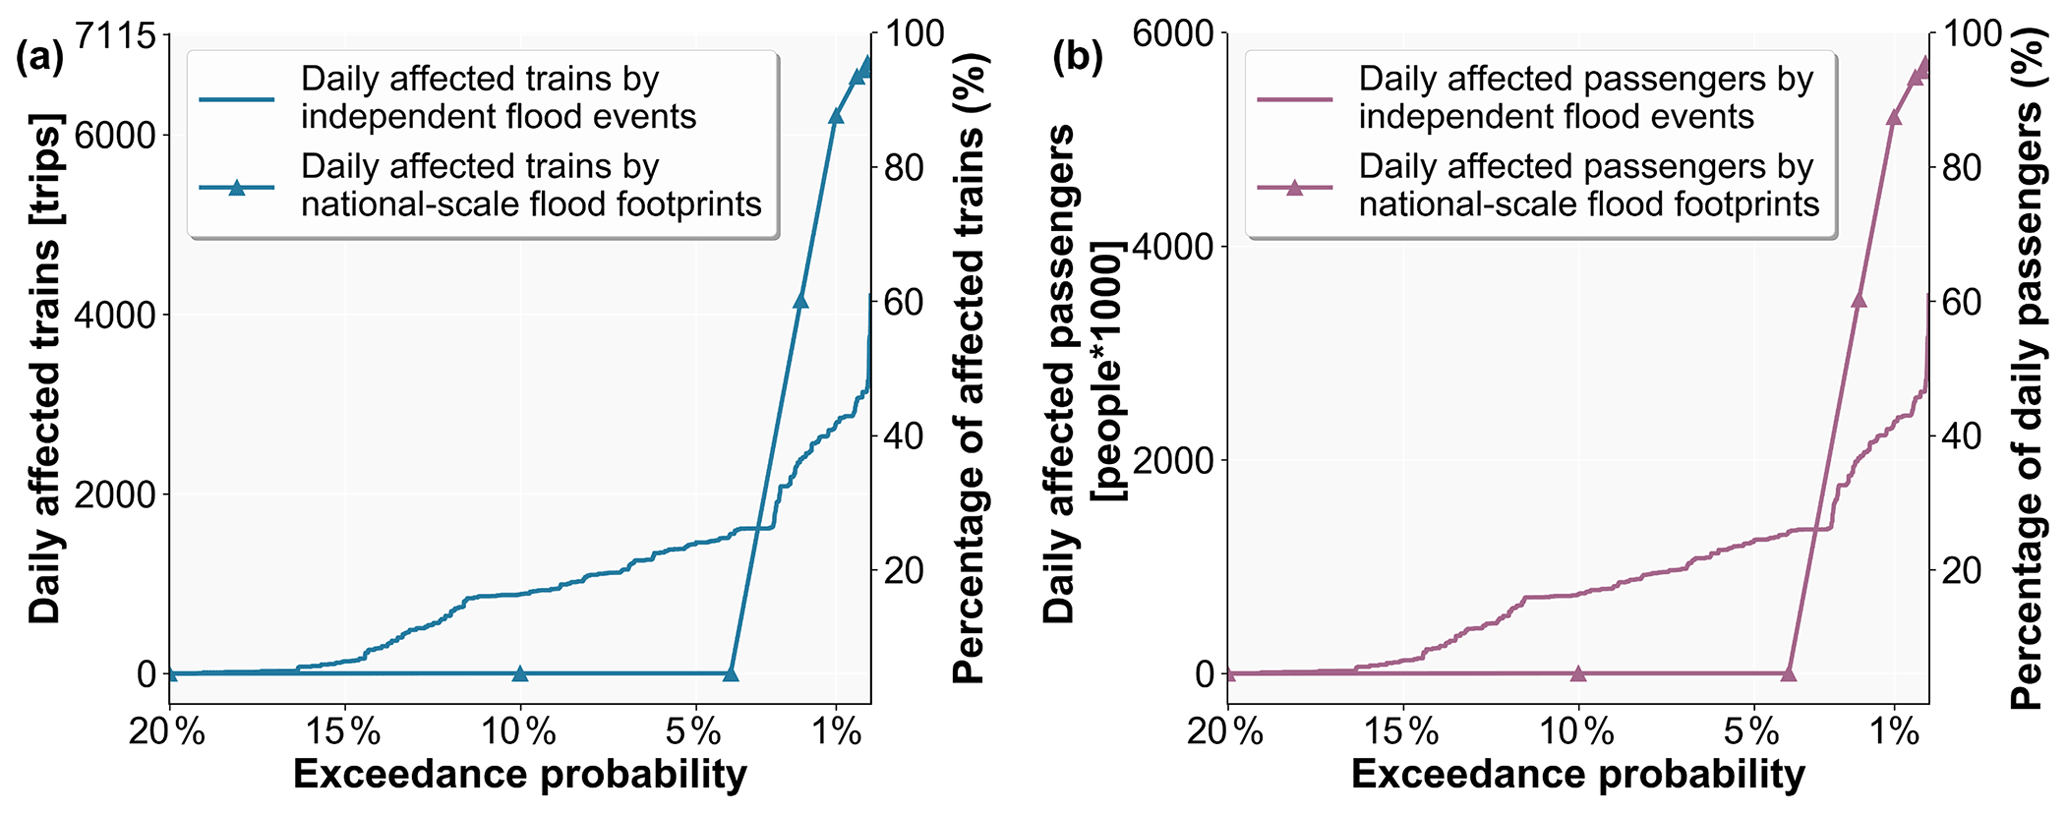
Figure 9Performance loss for the Chinese railway system using national-scale flood footprints of (a) daily affected trains and (b) daily affected passengers.
In this study, we assume that within a river basin, the flood probability is constant, whilst among different basins it is fully independent. In future work, we will assess the dependence structure of flood hazards within and between basins, for example, by means of the copula approach as presented in Jongman et al. (2014). As we assumed a disruption time of 1 d due to the lack of information on flood duration in this study, we may have underestimated the operational performance losses. Due to lacking timetable and passenger capacity day by day, we have assumed a timetable constant over time, without considering potential seasonal variations as well any possible feedback dynamics on the number of passengers in the case of train cancellation. Since our goal is to analyse the average number of affected trains and passengers over the year, the assumption is reasonable. In future work, it is worth investigating the typical period of occurrence of the main floods concerning the seasonal variability of the train trips and the number of passengers.
In the broader context of risk assessments for transportation systems, the simplified method for generating independent flood events offers a practical method for the large-scale assessment of performance losses and indirect risk. Most existing studies used regional- or national-scale flood footprints to assess flood-induced risk. However, in reality the floods shown in such a flood footprint would not all happen at the same time. For comparison, we calculated the performance loss for the Chinese railway system using national-scale flood footprints (2, 5, 10, 25, 50, 100, 250, 500, and 1000 years in all of China) as shown in Fig. 9a and b. Results show that the performance loss for both affected train trips and passengers is almost unaffected for national-scale flood footprints with a return period below 25 years. However, performance loss sharply increases when the flood hazard return period exceeds 50 years. More than 90 % of trains and passengers would be affected when the flood hazard return period exceeds 100 years. Compared with the performance loss obtained using the generated independent flood events, the results using the national-scale flood footprints are underestimated for low-intensity flood events and overestimated for high-intensity flood events. Therefore, when assessing possible cascading effects, the use of independent flood events is necessary (Nones and Pescaroli, 2016).
The increased frequency of extreme flood events, coupled with interregional trade growth, requires national- and global-scale transportation networks to be more resilient to cope with disruptive events. Evaluation of system-level vulnerability and identification of risk hotspots is a first step to enhance the robustness of the transport system. This study presents a framework for performing system-level vulnerability and risk assessments of a railway system under flooding. The developed framework couples simulated flood events with state-of-the-art network analysis to measure system disruptions caused by floods to identify risk hotspots. The system vulnerability and risk induced by the flooding are quantified in terms of the performance loss of the Chinese railway system. Results show that failure hotspots, system vulnerability, and risk of the Chinese railway system under floods are highly heterogeneous. The main conclusions are as follows.
High-failure hotspots are mainly distributed in south China, i.e. Yangtze River, Pearl River, and Southeast basins. In addition, floods in the basins in central and eastern China have the highest impacts on the Chinese railway system. Floods in the Yangtze River basin have the largest impact on daily cancelled trains. At the same time, floods in the Huaihe and Haihe river basins cause the largest number of detoured trains as well as associated increased time for the Chinese railway system compared with other basins.
At the national level, the average percentage of daily affected trains and passengers for the national system is approximately 2.7 %. The mean average increased time for detoured trains reaches approximately 5 h. At the provincial level, the provinces in central China have the highest risks, estimated to be 4.5 % relative to the number of the province's daily trains and more than 3.5 % relative to the number of the province's daily passengers. The high risk in terms of the total increased time is mostly distributed in east China, whereas the highest average increased time is distributed in western provinces, such as Xinjiang and Tibet provinces.
Using our current approach, the performance loss can be used as the start of the indirect risk assessment from the travel journey perspective. By combining the ticket prices and the operating cost per kilometre, the economic loss for the railway company can be calculated based on the affected trains and associated passengers (Lamb et al., 2019). As a key mode of transport for interregional trade, the failure of railway systems can produce large shocks for industries that depend on the supply that may come from flooded businesses. The risk values per province (such as expected daily cancelled trains) can be used as indicators to link with business disruptions. Future work can try to assess the shocks and indirect economic losses based on the input and output table and regional railway transportation performance decreased in our work.
| Variable | Description |
| T | Return period of T years |
| DT | The flood depth with return period of T years |
| gx, y | A grid cell with longitude x and latitude y |
| The flood depth of a flood event of grid cell gx, y with return period of T year | |
| P(DT) | The annual exceedance probability of flood depth DT |
| Pr(DT) | A quadratic, continuously differentiable function of P(DT) |
| Prx, y(DT) | A set of continuous inundation depth-exceedance probability functions for gx, y |
| Constant parameters in function Prx, y(DT) | |
| Bj | River basin j |
| Flood event i in river basin Bj | |
| A random number between 0 and 1 for flood event in basin Bj | |
| Wd | The failure threshold of the railway service after drainage; default value is 0.2 |
| WLx, y | The water level after drainage of grid cell gx, y |
| Wldx, y | The water level of the flood depth under design standard of grid cell gx, y |
| Dc | The drainage capacity rate of Chinese railway system; default value is 0.8 |
| Z(xy) | The failure condition of grid cell gx, y |
| lij | Rail segment between station i and station j |
| Fcij | Failure condition of component lij |
| The failure condition of railway segment lij under flood event e | |
| AFij | The annual failure probability of rail segment lij |
| E | The N-year flood event catalogue |
| NS | The original number of trains in the system |
| The number of running trains in the system after a flood event | |
| The number of daily affected trains under flood event e | |
| The number of daily cancelled trains under flood event e | |
| The number of daily detoured trains under flood event e | |
| CAi | The capacity of the ith train |
| The number of affected passengers | |
| The number of daily passengers influenced by cancelled trains under flood event e | |
| The number of daily passengers influenced by detoured trains under flood event e | |
| Ti | The original travelling time of the ith train |
| The running time of the ith train under flood event e | |
| The total increased time for detoured trains under flood event e | |
| The average increased time under flood event e | |
| ARs | The expected daily flood risk level to the railway system |
| Ve | Performance loss metric, including , , , , , , , and |
Table A1List of all assumptions made in this study and their range in the sensitivity analysis.
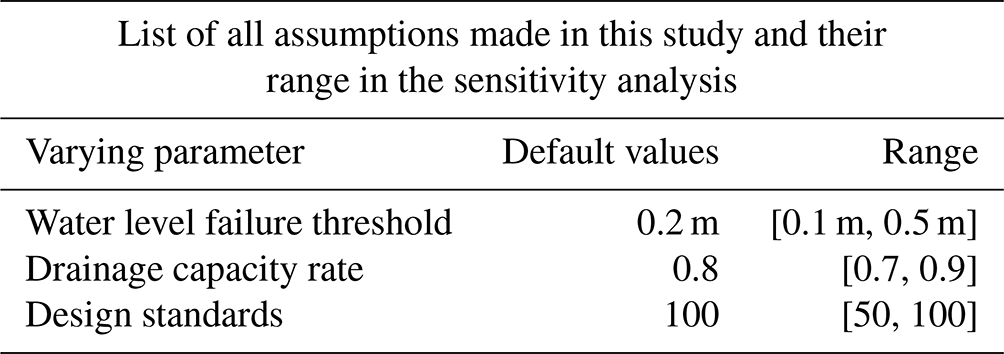
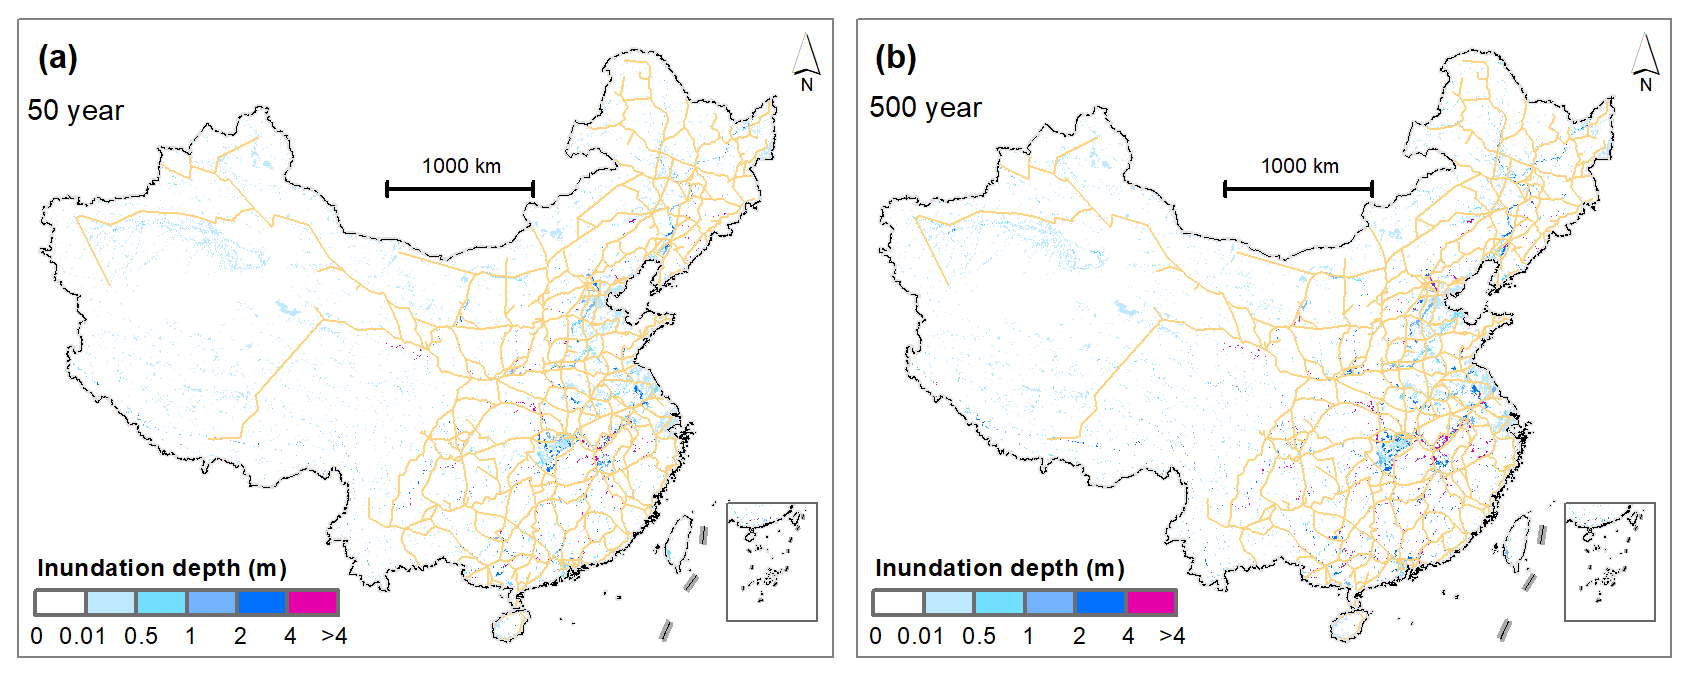
Figure A1(a) The 50-year flood and (b) the 500-year flood.
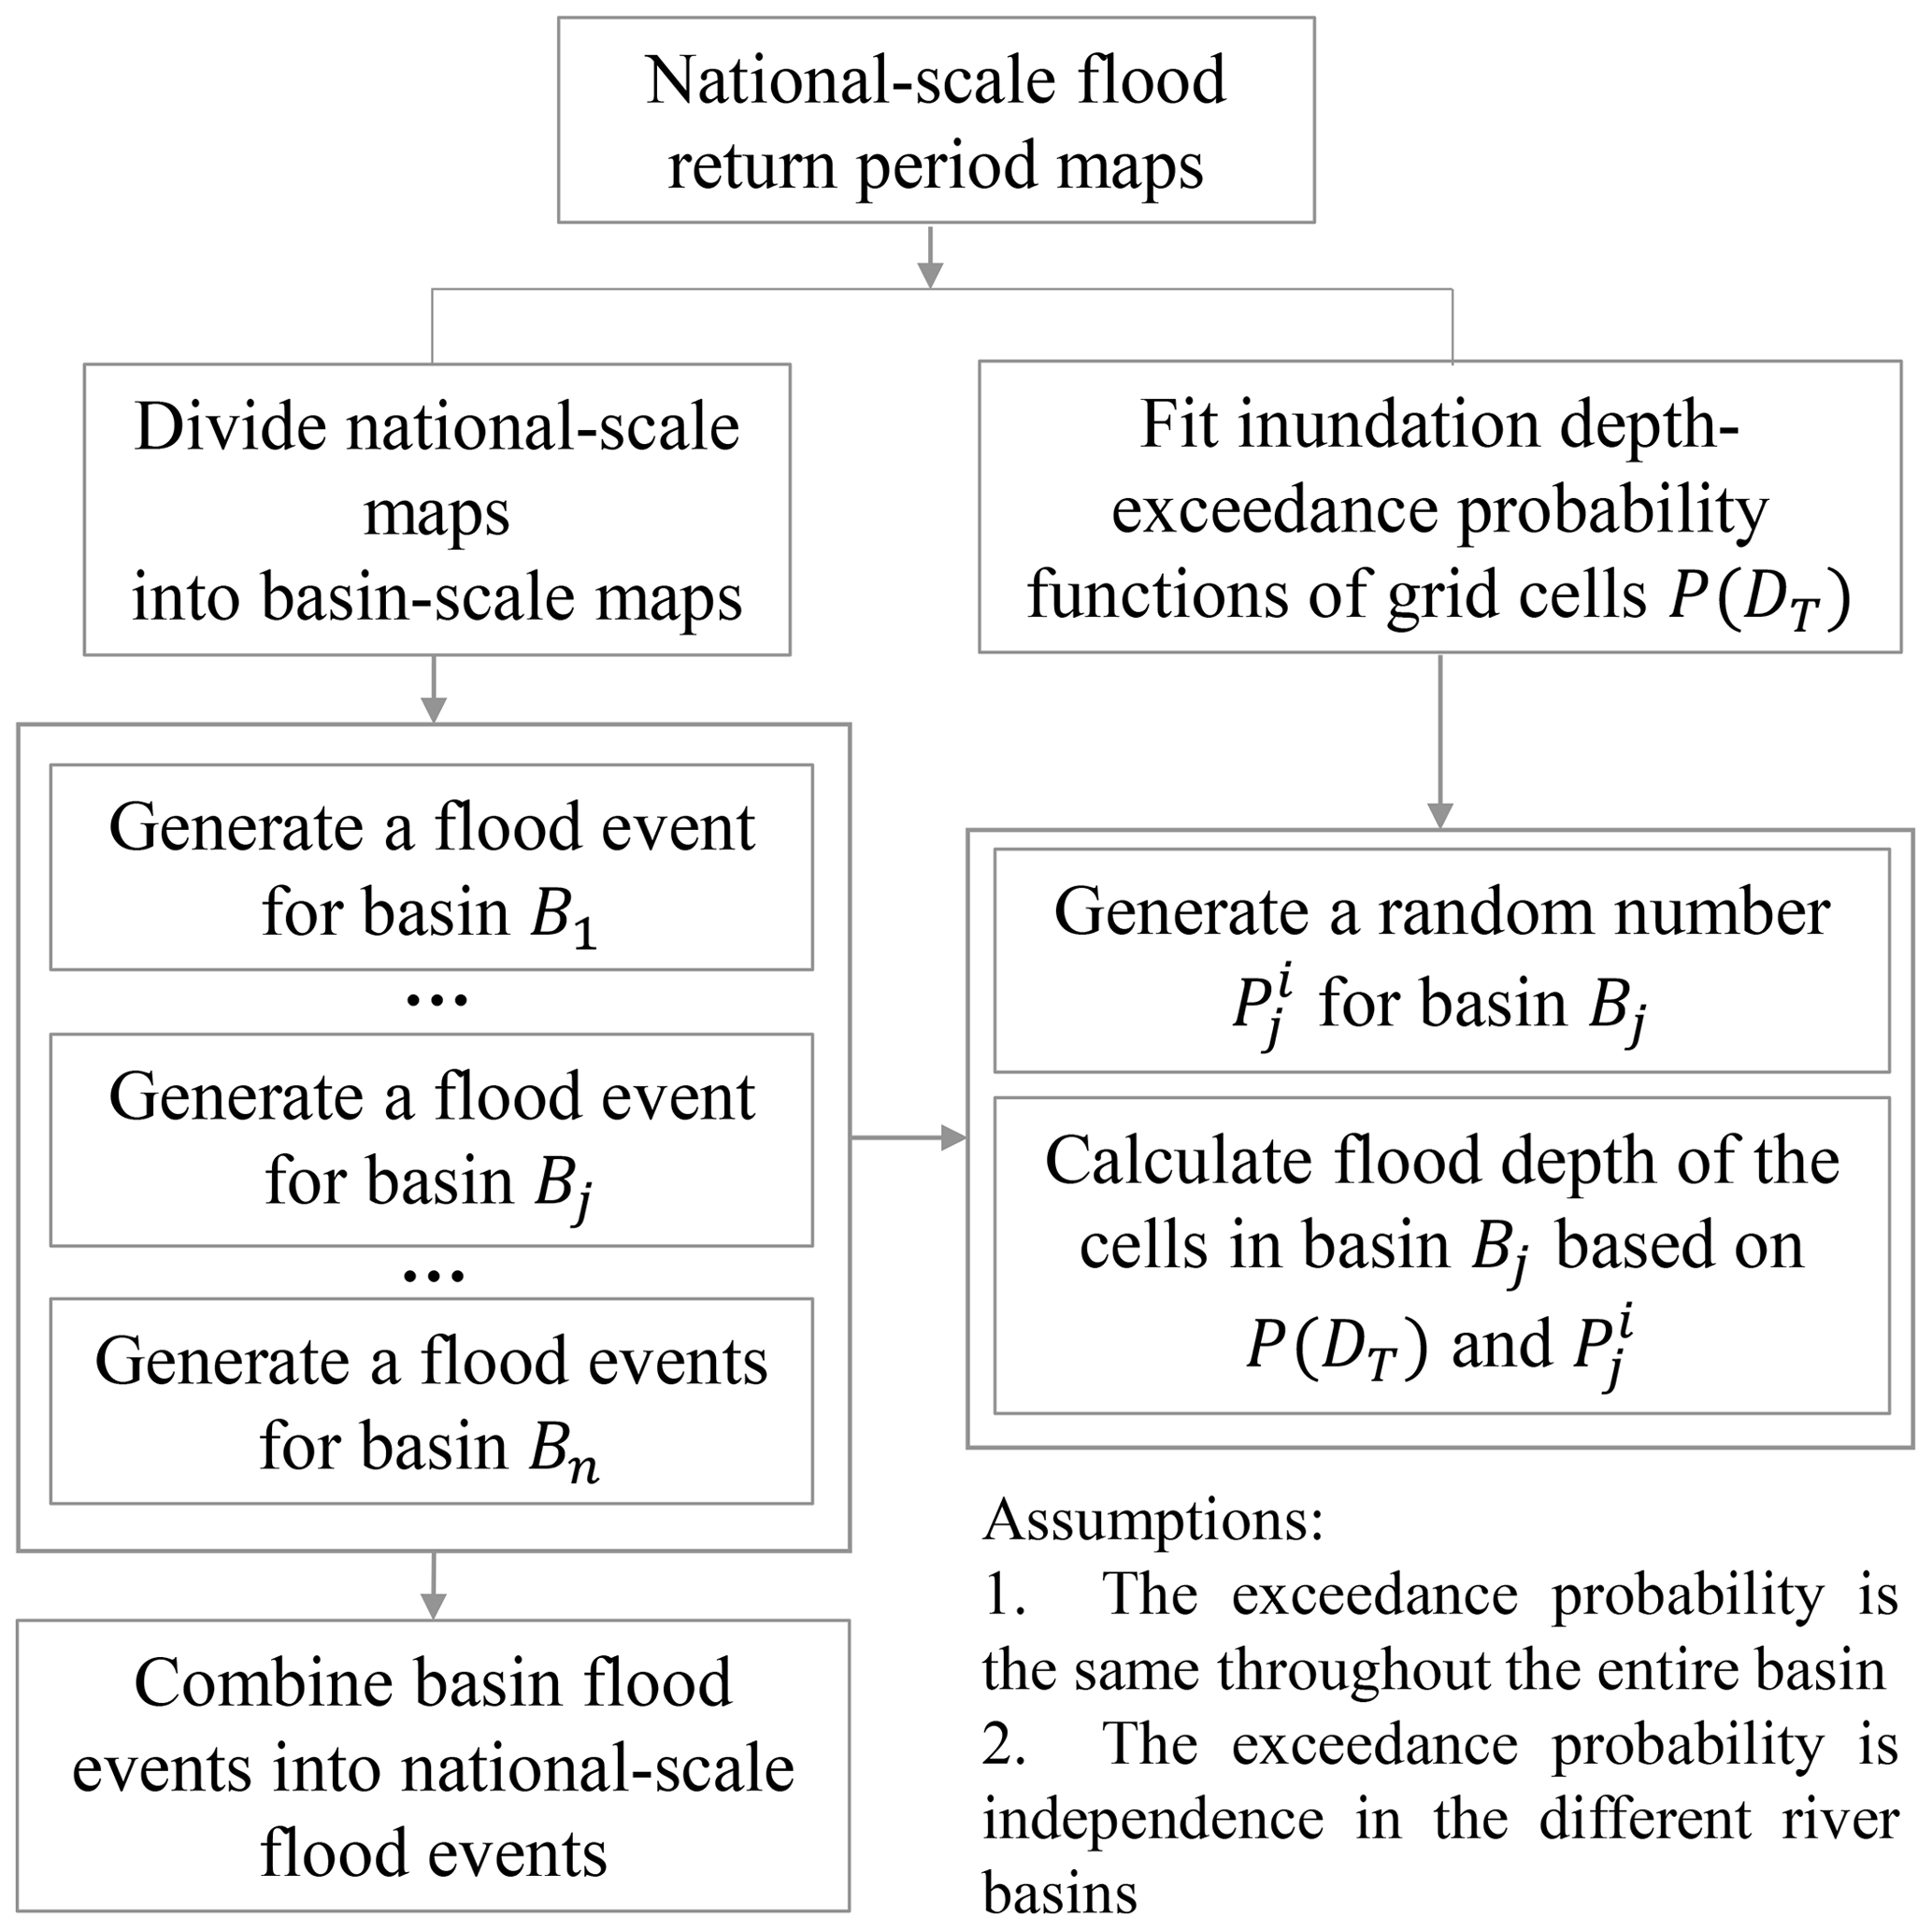
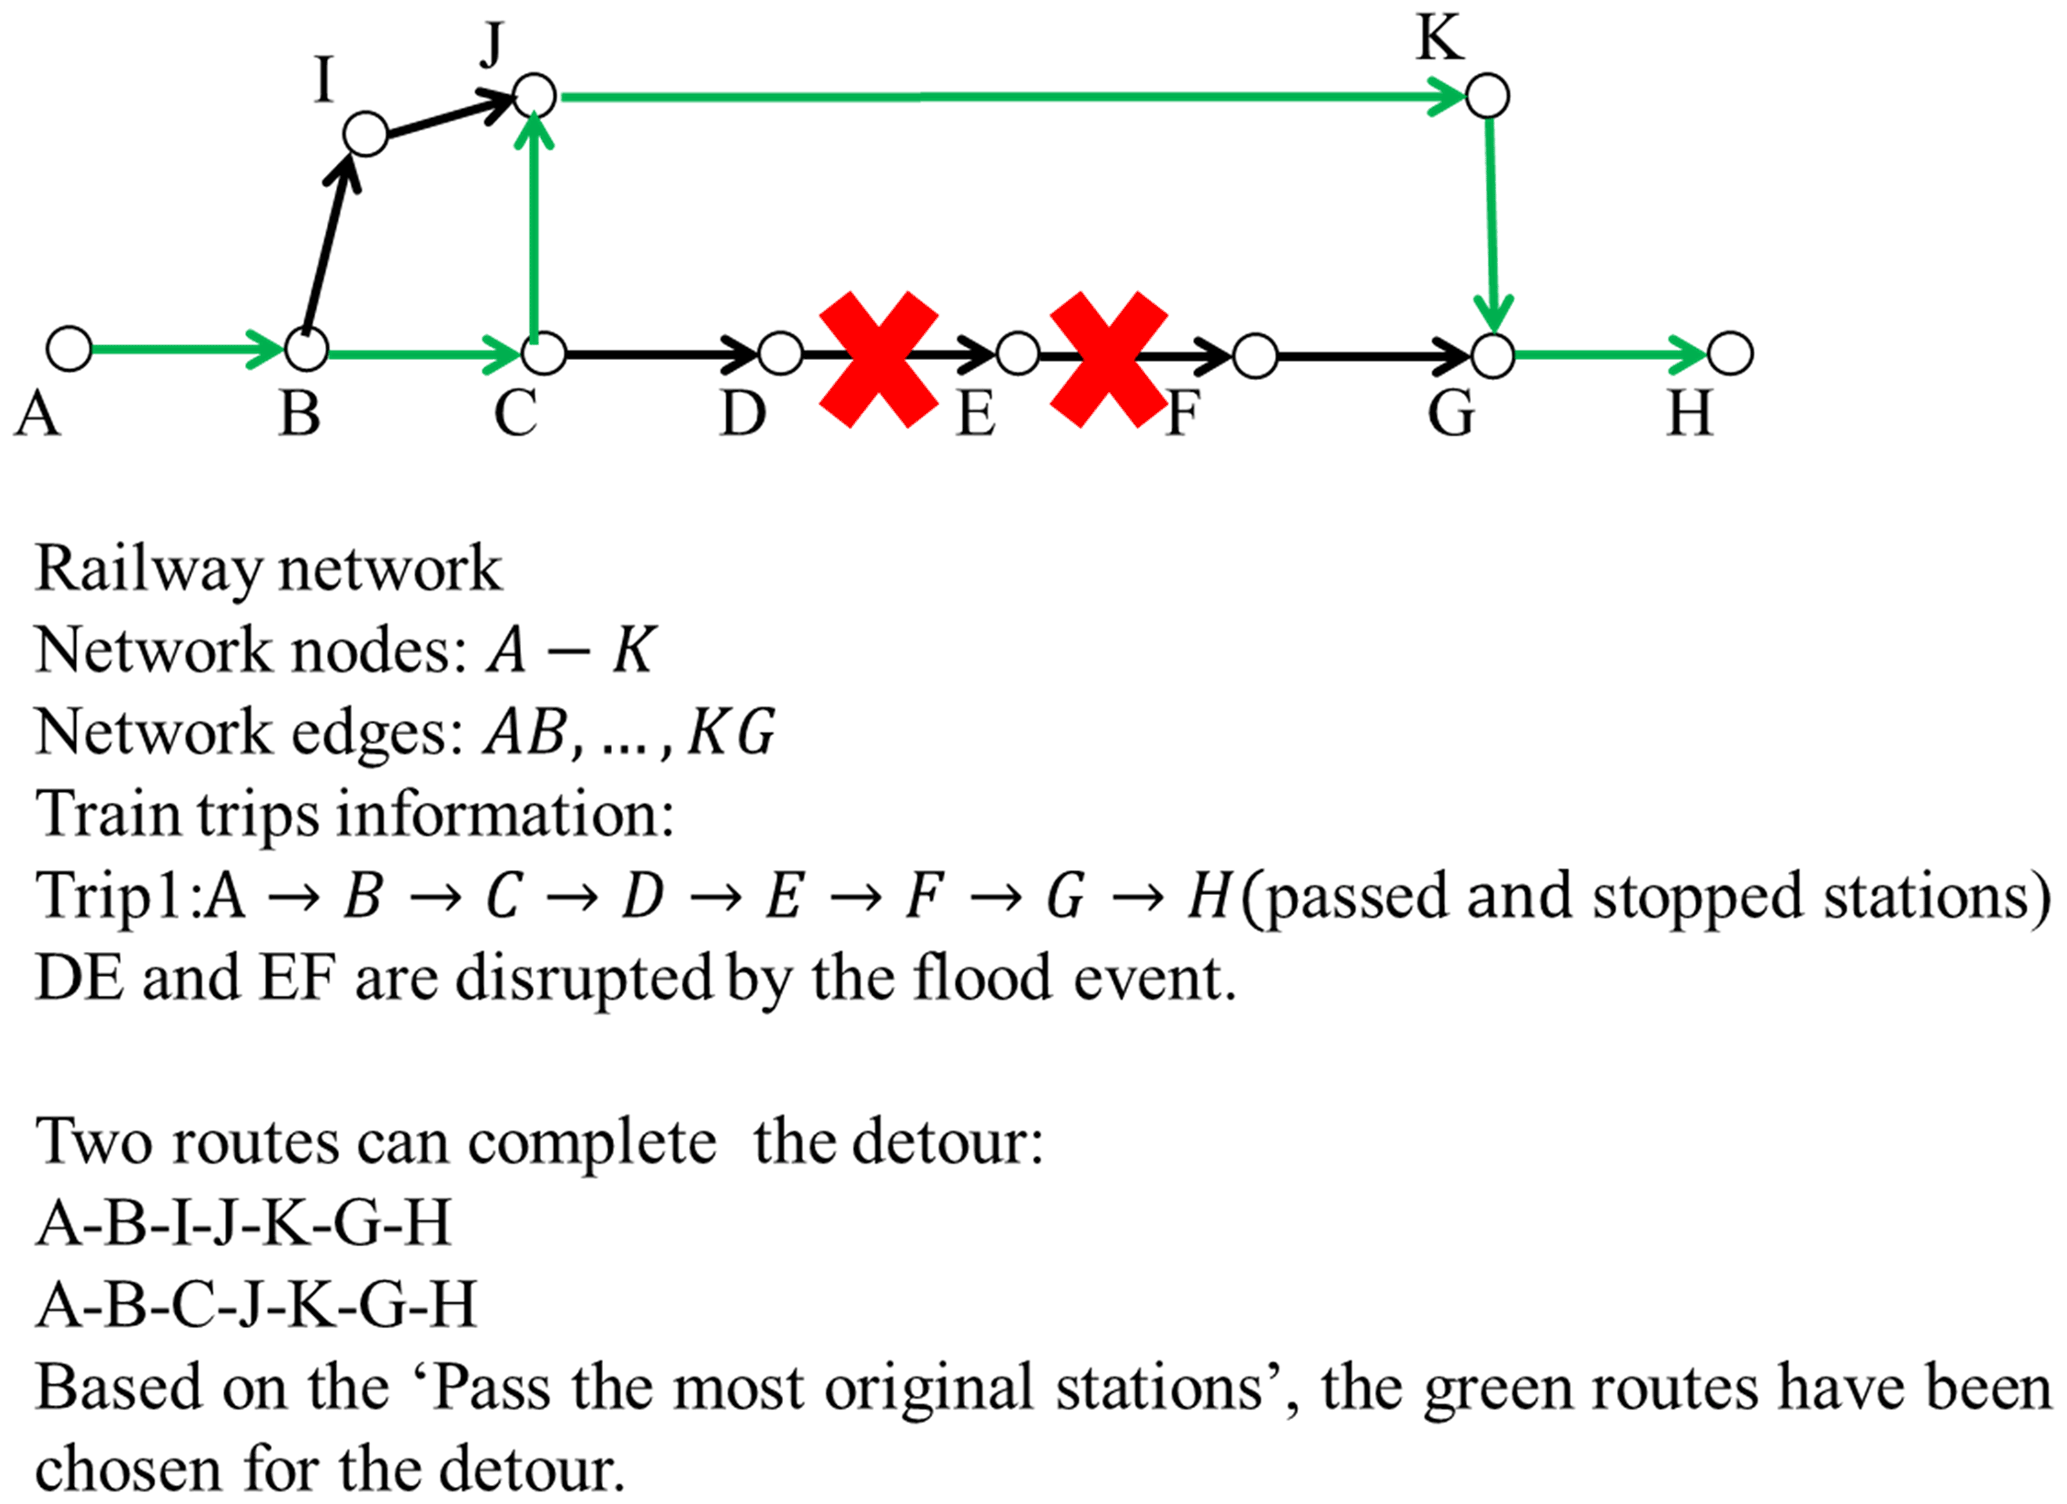
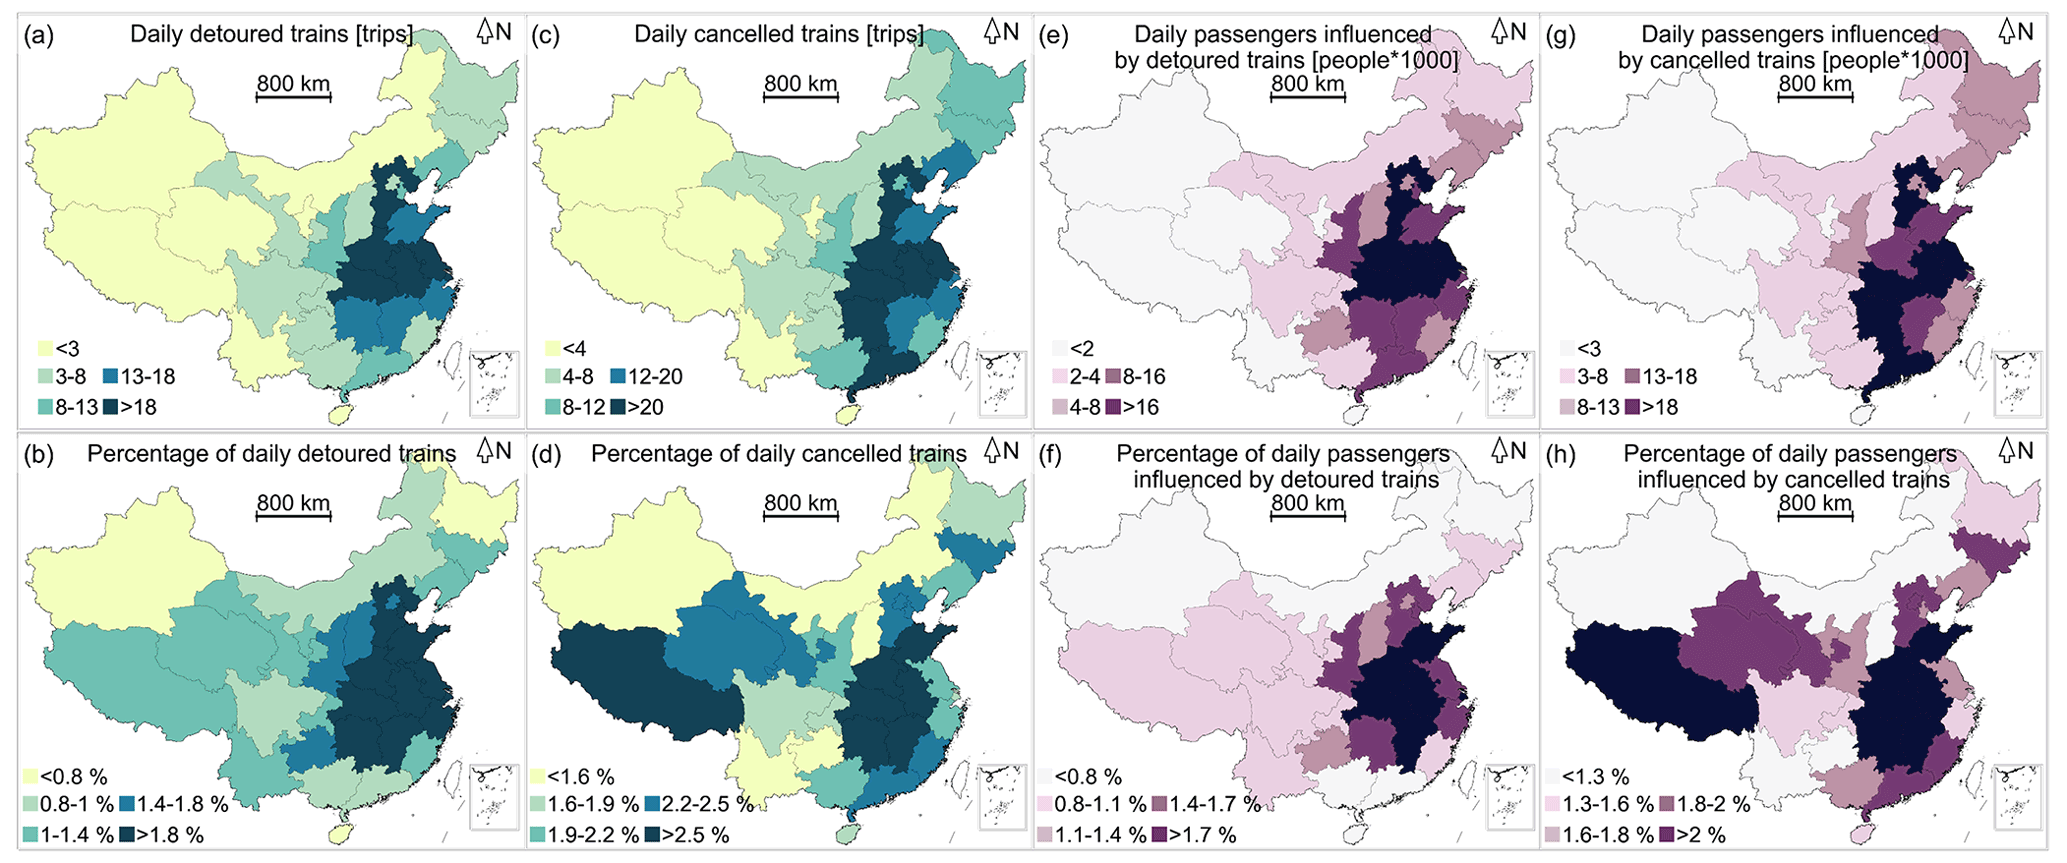
Figure A4Performance loss of the railway system per province. Panel (a) presents the daily detoured trains in absolute terms; (b) presents the daily detoured trains relative to the number of the province's daily trains; (c) presents the daily cancelled trains in absolute terms; (d) presents the daily cancelled trains relative to the number of the province's daily trains; (e) presents the daily passengers influenced by detoured trains in absolute terms; (f) presents the daily passengers influenced by detoured trains relative to the number of the province's daily trains; (g) presents the daily passengers influenced by cancelled trains in absolute terms; (h) presents the daily passengers influenced by cancelled trains relative to the number of the province's daily trains.
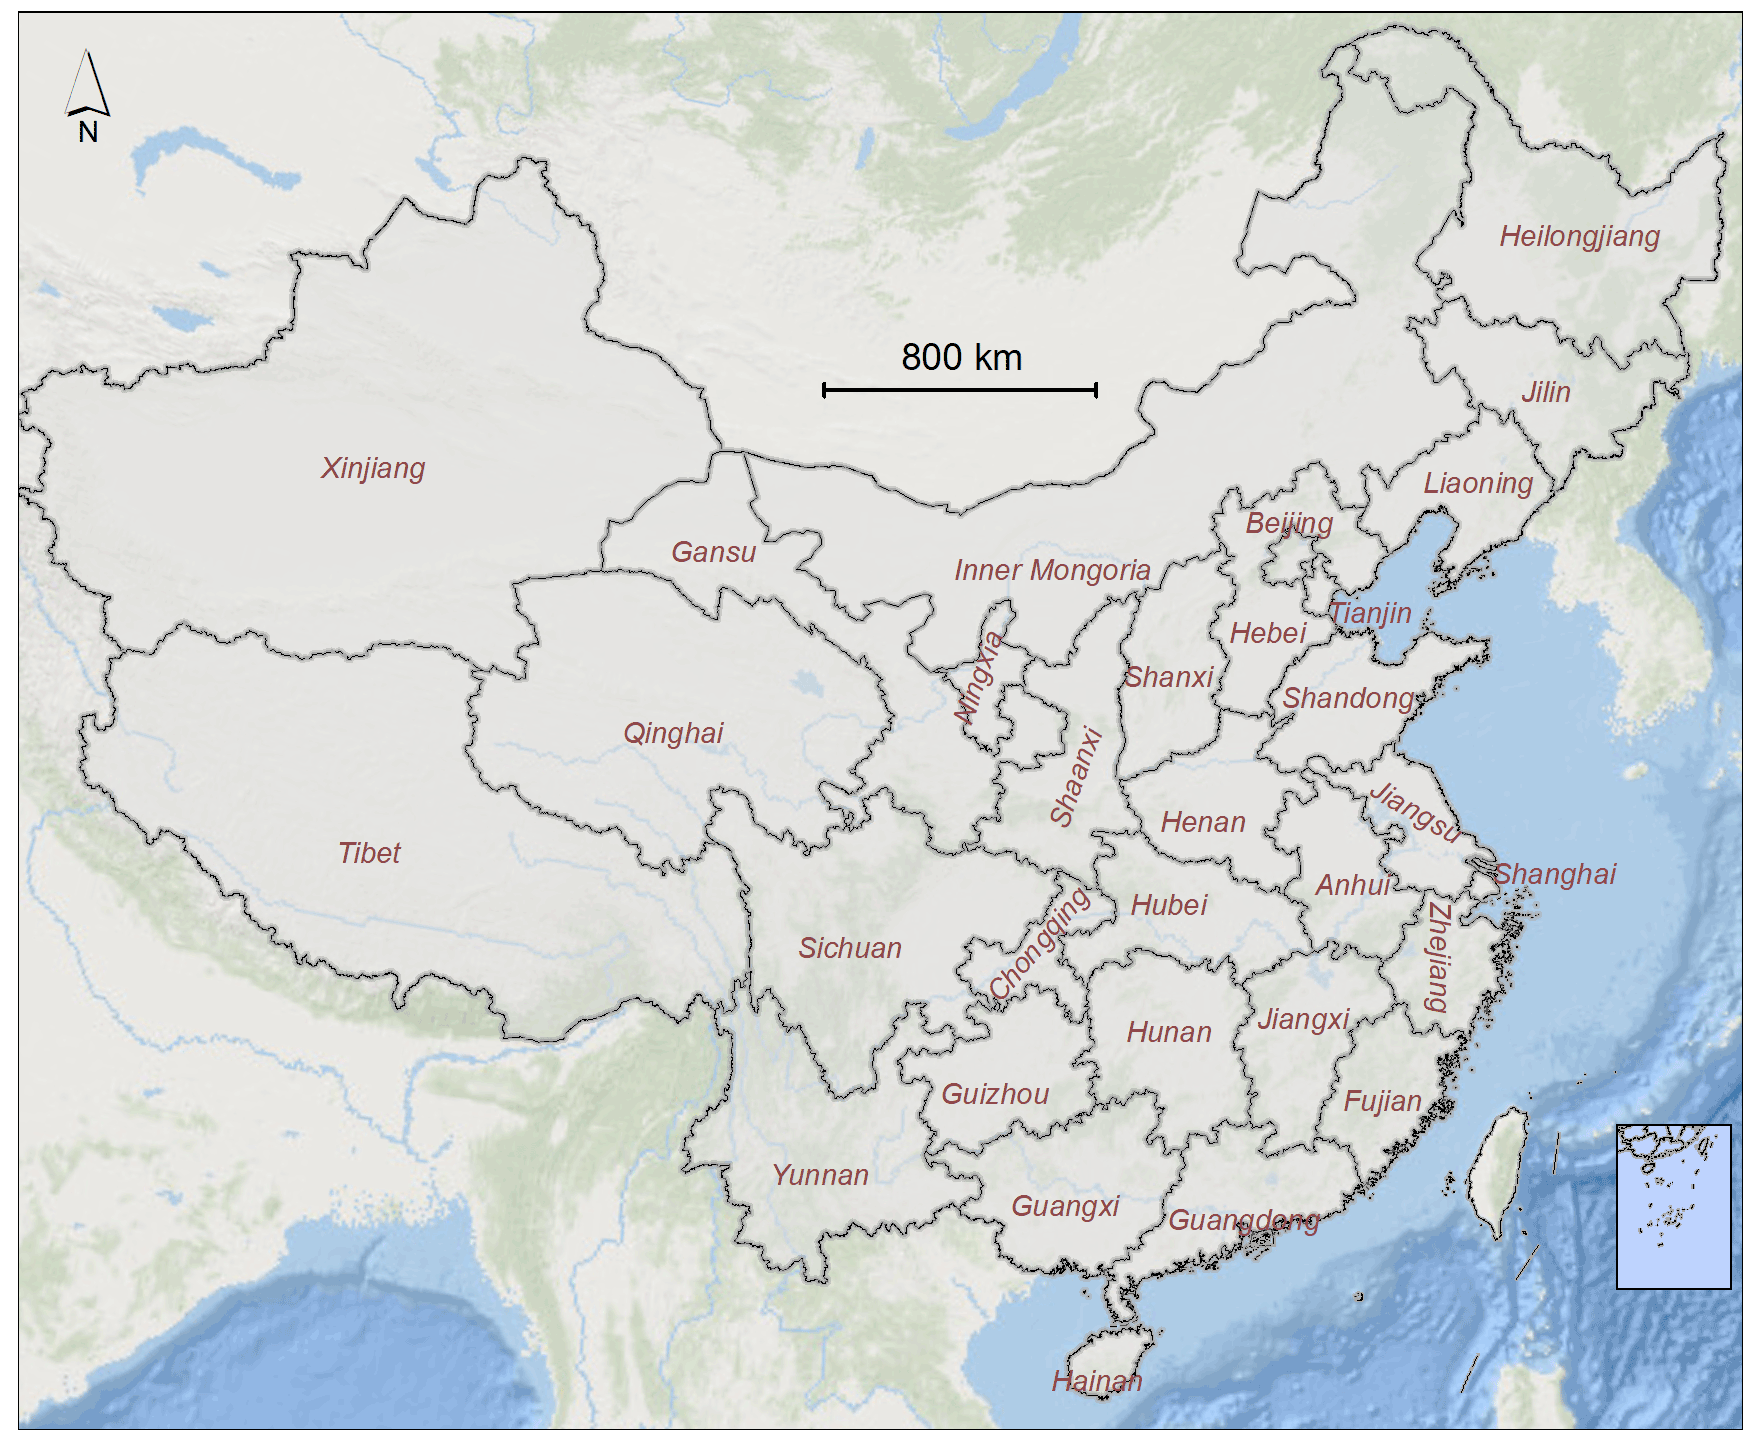
Figure A5Chinese province distribution map. The China Provincial Map layer comes from the Data Center for Resources and Environmental Sciences, Chinese Academy of Sciences, which is accessible from the Resource and Environment Data Cloud Platform (http://www.resdc.cn/, last access: 19 May 2020).
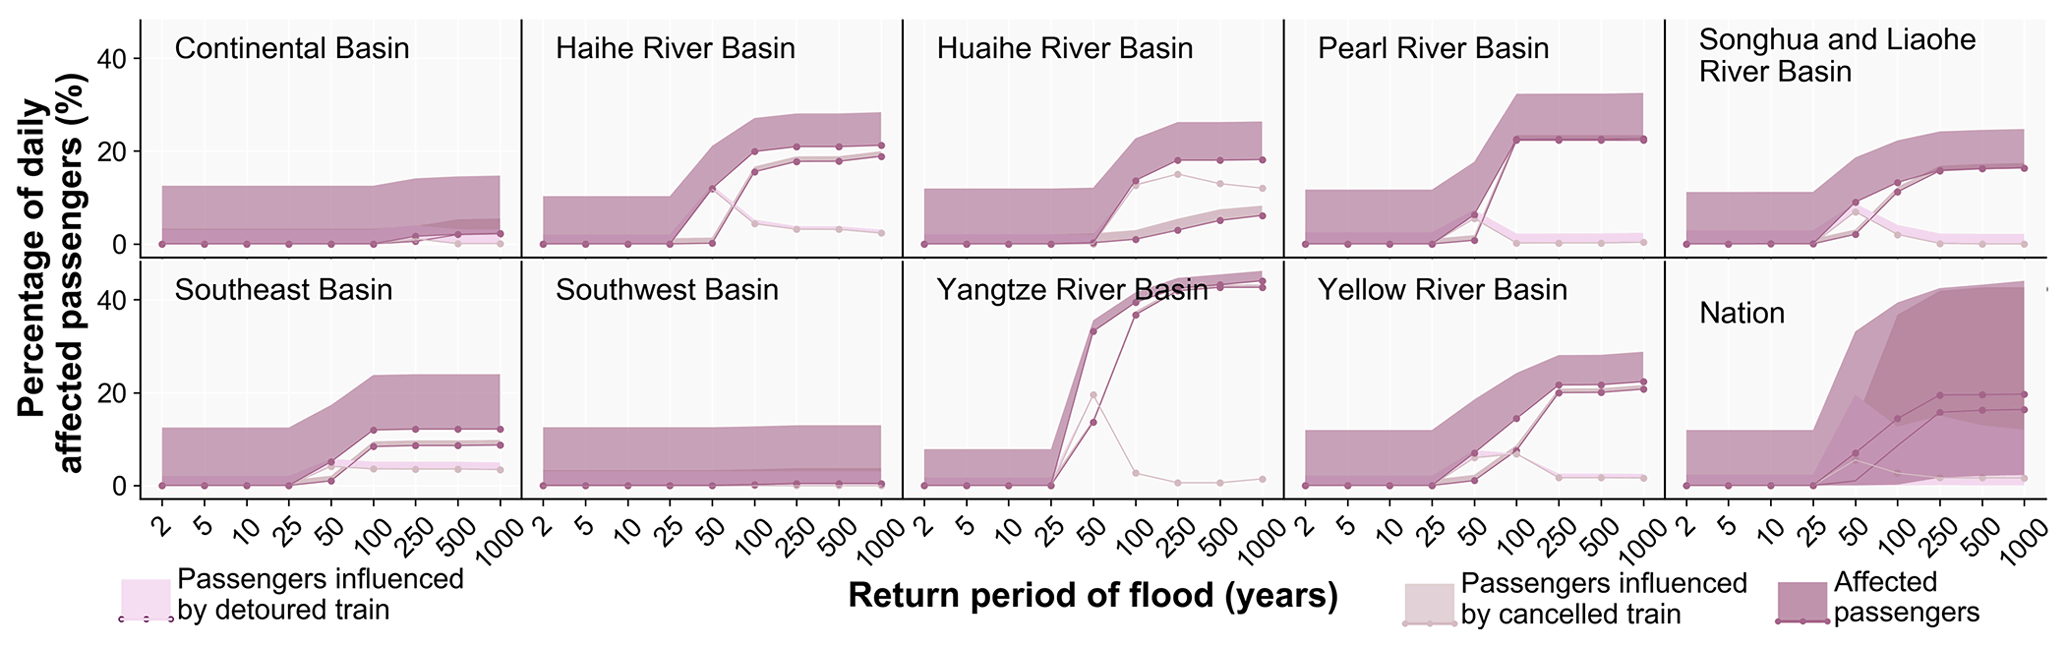
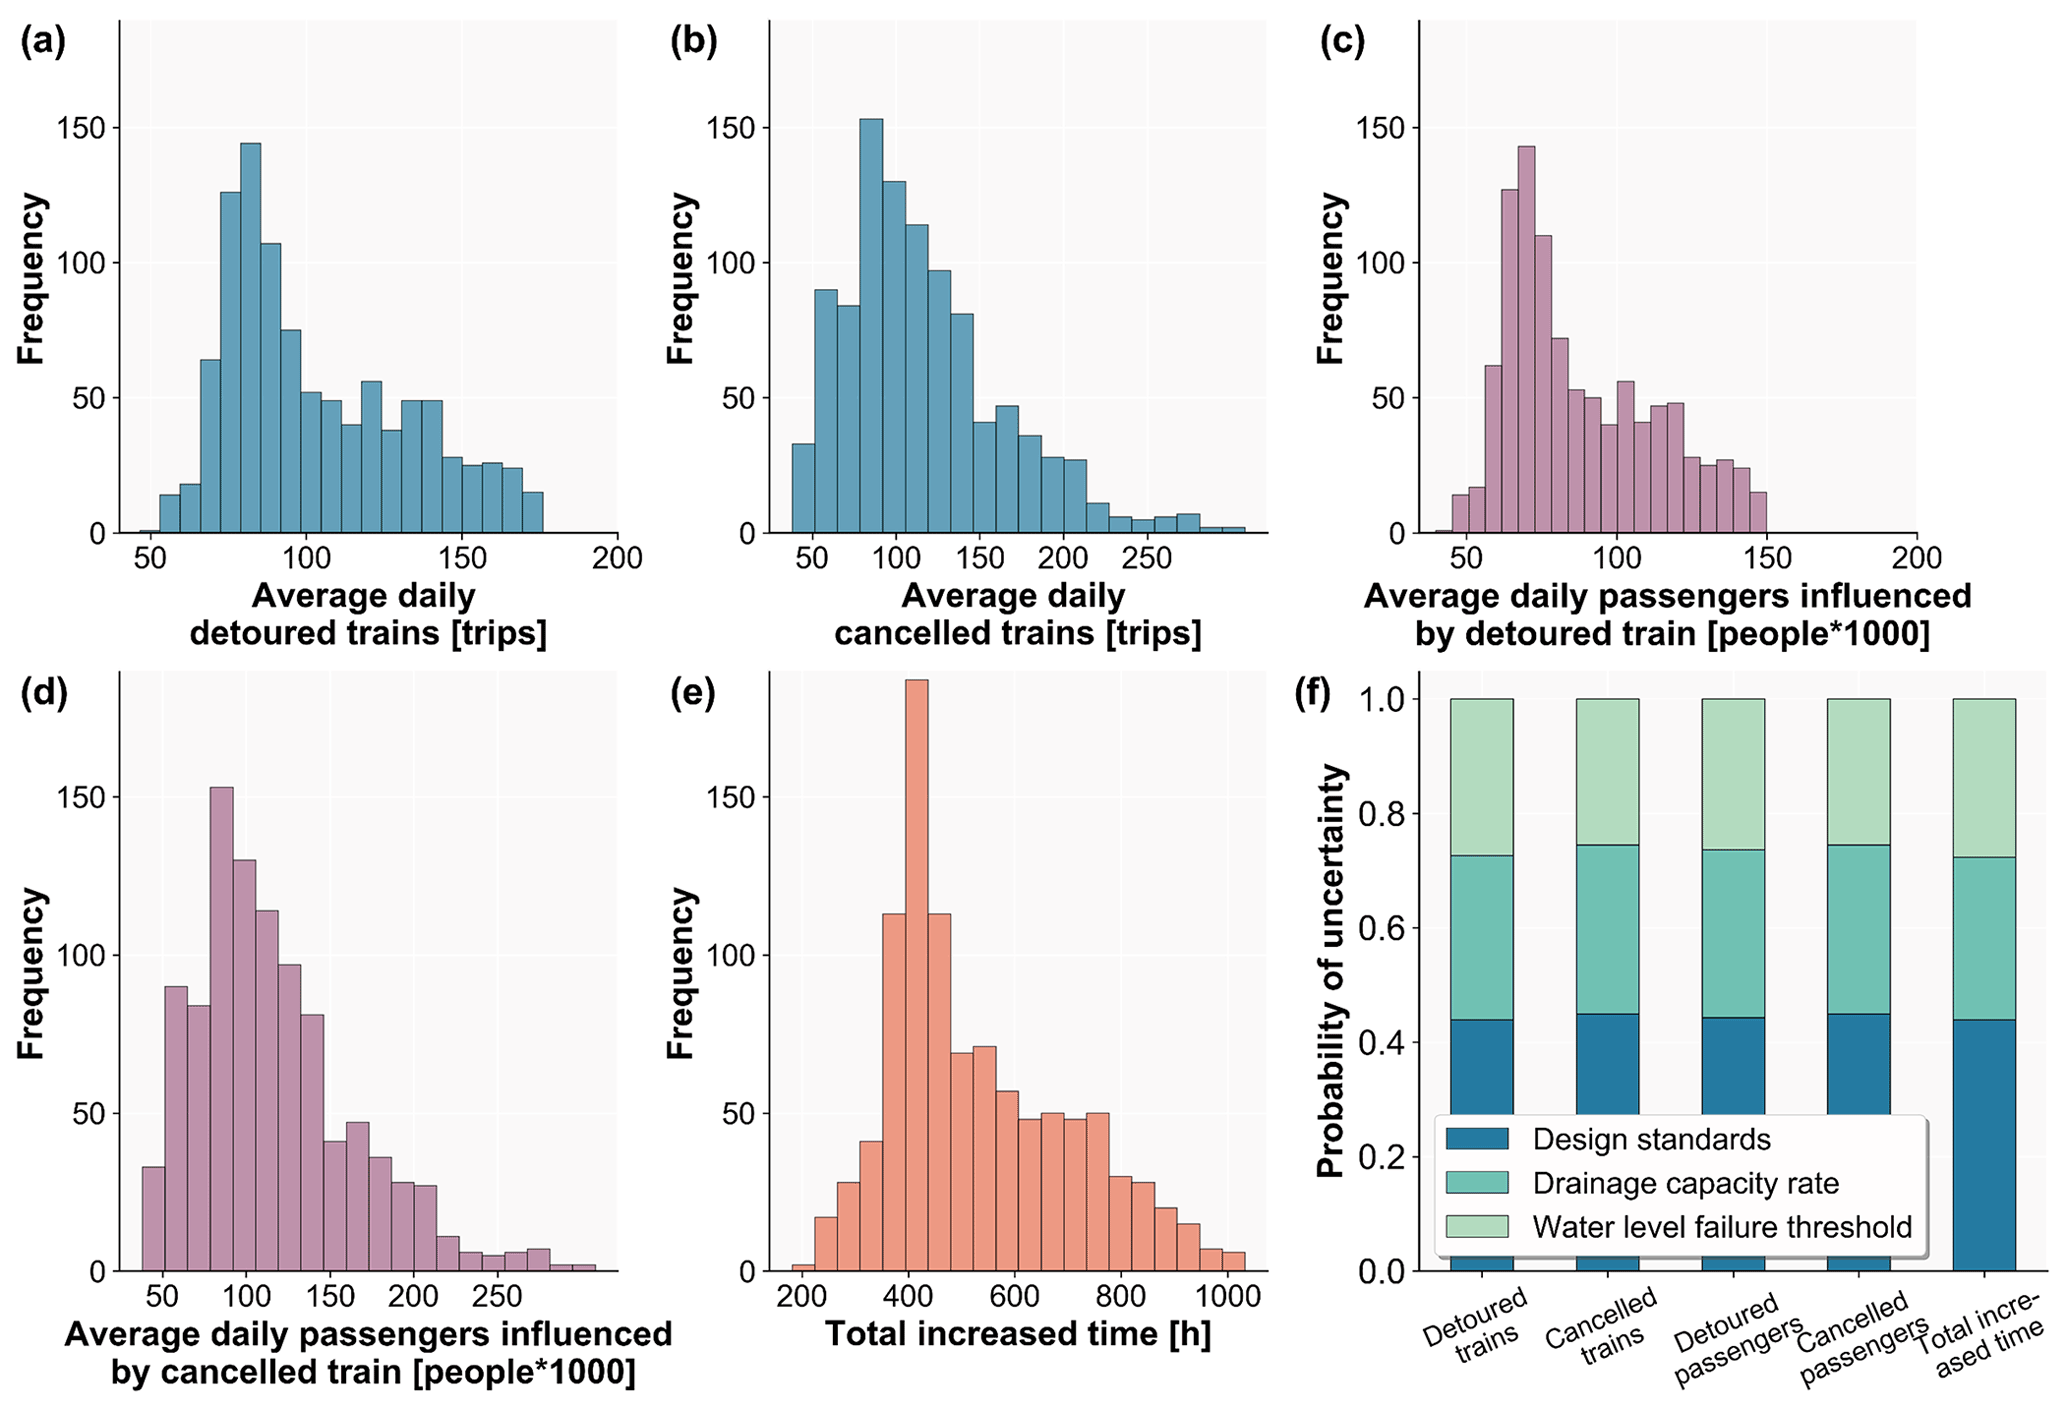
Figure A7Results of the uncertainty and sensitivity analyses for the performance metrics. (a) Average daily detoured trains; (b) average daily cancelled trains; (c) average daily passengers influenced by detoured trains; (d) average daily passengers influenced by cancelled trains; (e) total increased time; (f) the sensitivity results.
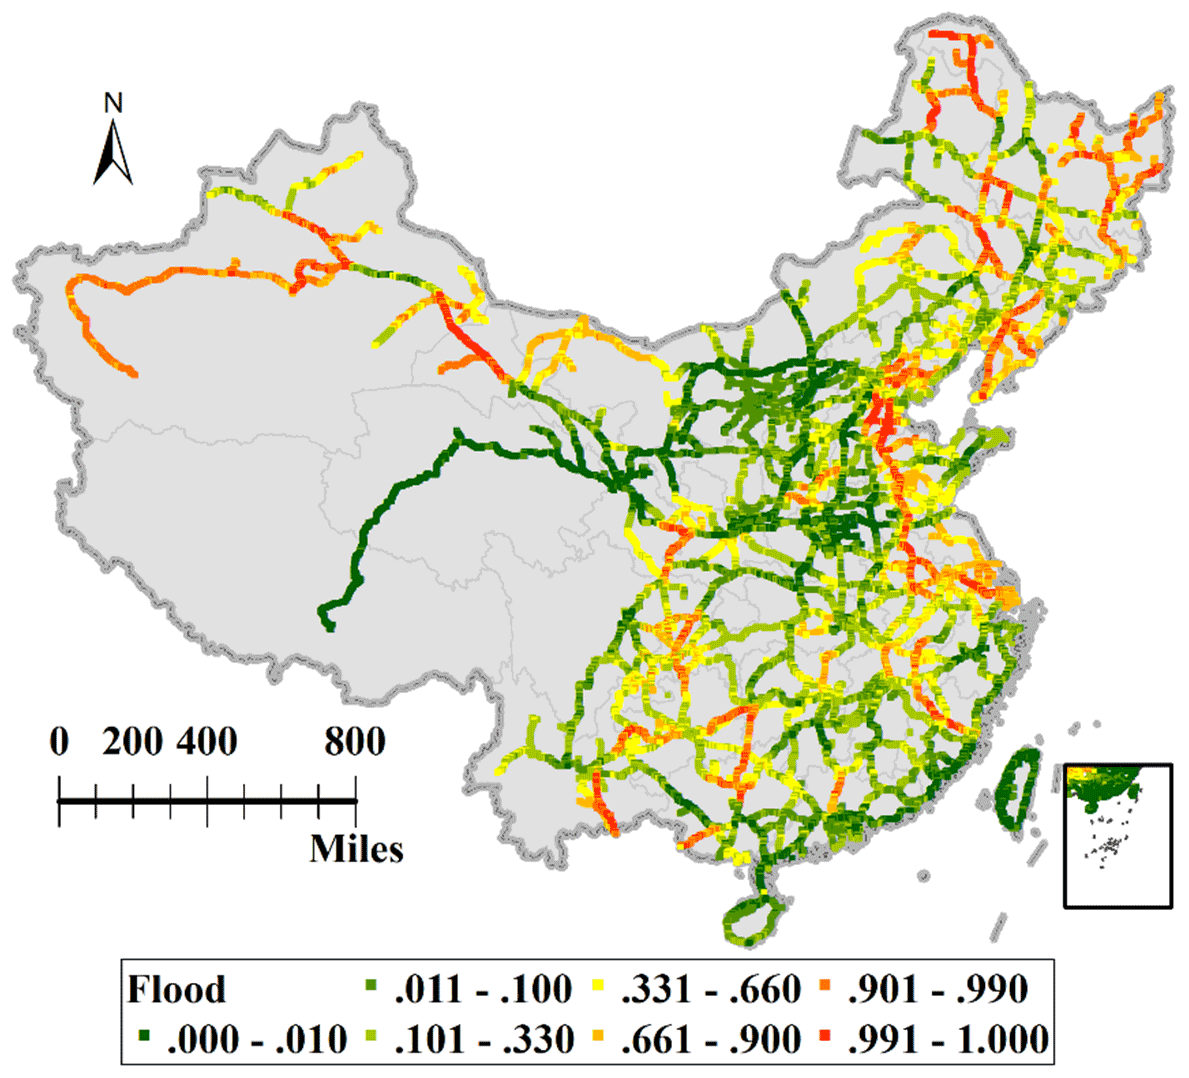
Figure A8Susceptibility map of the national railway network subjected to flood (source: Liu et al., 2018b).
Supporting data are accessible through the associated references in Table 1. The data in this study were analysed with the Python package, and the figures were created with ArcViewTM GIS and Python packages. All codes used in this work are available upon request.
KL and WZ developed the original idea and designed the analyses. PJW and EEK contributed to the study design. WZ, KL, and EEK conducted the analysis. WZ wrote the original manuscript, and KL, MW, PJW, and EEK provided comments and revised the manuscript. All the co-authors contributed to scientific interpretations of the results.
At least one of the (co-)authors is a member of the editorial board of Natural Hazards and Earth System Sciences. The peer-review process was guided by an independent editor, and the authors also have no other competing interests to declare.
Publisher's note: Copernicus Publications remains neutral with regard to jurisdictional claims in published maps and institutional affiliations.
This work was supported by the National Natural Science Foundation of China (grant number 41771538), and Philip J. Ward received funding from the Dutch Research Council (NWO), in the form of a VIDI grant (grant number 016.161.324). Elco E. Koks received funding from the Dutch Research Council (NWO), in the form of a VENI grant (grant number VI.Veni.194.033). The financial support is highly appreciated.
This research has been supported by the National Natural Science Foundation of China (grant no. 41771538), the Nederlandse Organisatie voor Wetenschappelijk Onderzoek (grant no. 016.161.324), and the Nederlandse Organisatie voor Wetenschappelijk Onderzoek (grant no. VI.Veni.194.033).
This paper was edited by Paolo Tarolli and reviewed by two anonymous referees.
Alfieri, L., Burek, P., Dutra, E., Krzeminski, B., Muraro, D., Thielen, J., and Pappenberger, F.: GloFAS – global ensemble streamflow forecasting and flood early warning, Hydrol. Earth Syst. Sci., 17, 1161–1175, https://doi.org/10.5194/hess-17-1161-2013, 2013.
Arnell, N. W. and Gosling, S. N.: The impacts of climate change on river flood risk at the global scale, Clim. Change, 134, 387–401, https://doi.org/10.1007/s10584-014-1084-5, 2016.
Baker, J. W.: An introduction to probabilistic seismic hazard analysis(PSHA), White Paper, Version 1.3, 2008, Stanford University, https://www.jackwbaker.com/Publications/Baker_(2008)_Intro_to_PSHA_v1_3.pdf (last access: 19 May 2020), 2008.
Becker, A. and Grünewald, U.: Flood Risk in Central Europe, Science, 300, 1099, https://doi.org/10.1126/science.1083624, 2003.
Beek, L. P. H. van and Bierkens, M. F. P.: The Global Hydrological Model PCR-GLOBWB: Conceptualization, Parameterization and Verification, Report Department of Physical Geography, Utrecht University, Utrecht, The Netherlands, http://vanbeek.geo.uu.nl/suppinfo/vanbeekbierkens2009.pdf (last access: 19 May 2020), 2008.
Beek, L. P. H. van, Wada, Y., and Bierkens, M. F. P.: Global monthly water stress: 1. Water balance and water availability, Water Resour. Res., 47, W07517, https://doi.org/10.1029/2010WR009791, 2011.
Benn, J.: Railway bridge failure during flooding in the UK and Ireland, Proc. Inst. Civ. Eng. Eng., 166, 163–170, 2013.
Chang, H., Lafrenz, M., Jung, I. W., Figliozzi, M., Platman, D., and Pederson, C.: Potential impacts of climate change on Flood-Induced Travel Disruptions: A Case Study of Portland, Oregon, USA, Ann. Assoc. Am. Geogr., 100, 938–952, https://doi.org/10.1080/00045608.2010.497110, 2010.
Chinese Railway Service Website: Train timetable data, https://www.12306.cn/index/, last access: 19 May 2020.
CRPH: High-speed railway emergency response plan, edited by: China railway Publishing House, Beijing, http://www.nra.gov.cn/xxgkml/xxgk/xxgkml/201908/P020190830510214110215.pdf (last access: 19 May 2020), 2012.
CRPH: Code for design of railway earth structure, edited by China railway Publishing House, Beijing, https://max.book118.com/html/2019/0930/6035141105002111.shtm (last access: 19 May 2020), 2016.
de Moel, H. and Aerts, J. C. J. H.: Effect of uncertainty in land use, damage models and inundation depth on flood damage estimates, Nat. Hazards, 58, 407–425, https://doi.org/10.1007/s11069-010-9675-6, 2011.
de Moel, H., Asselman, N. E. M., and Aerts, J. C. J. H.: Uncertainty and sensitivity analysis of coastal flood damage estimates in the west of the Netherlands, Nat. Hazards Earth Syst. Sci., 12, 1045–1058, https://doi.org/10.5194/nhess-12-1045-2012, 2012.
Dottori, F., Salamon, P., Bianchi, A., Alfieri, L., Hirpa, F. A., and Feyen, L.: Development and evaluation of a framework for global flood hazard mapping, Adv. Water Resour., 94, 87–102, https://doi.org/10.1016/j.advwatres.2016.05.002, 2016.
Editorial Board of China Railway Yearbook: China railway yearbook, China Railway Publishing House, Beijing, ISSN 1009-6957, 2001.
Editorial Board of China Railway Yearbook: China railway yearbook, China Railway Publishing House, Beijing, ISSN 1009-6957, 2002.
Editorial Board of China Railway Yearbook: China railway yearbook, China Railway Publishing House, Beijing, ISSN 1009-6957, 2003.
Editorial Board of China Railway Yearbook: China railway yearbook, China Railway Publishing House, Beijing, ISSN 1009-6957, 2004.
Editorial Board of China Railway Yearbook : China railway yearbook, China Railway Publishing House, Beijing , ISSN 1009-6957, 2005.
Editorial Board of China Railway Yearbook: China railway yearbook, China Railway Publishing House, Beijing, ISSN 1009-6957, 2006.
Editorial Board of China Railway Yearbook : China railway yearbook, China Railway Publishing House, Beijing, ISSN 1009-6957, 2007.
Editorial Board of China Railway Yearbook: China railway yearbook, China Railway Publishing House, Beijing, ISSN 1009-6957, 2008.
Editorial Board of China Railway Yearbook: China railway yearbook, China Railway Publishing House, Beijing, ISSN 1009-6957, 2009.
Editorial Board of China Railway Yearbook: China railway yearbook, China Railway Publishing House, Beijing, ISSN 1009-6957, 2010.
Editorial Board of China Railway Yearbook: China railway yearbook, China Railway Publishing House, Beijing, ISSN 1009-6957, 2011.
Editorial Board of China Railway Yearbook: China railway yearbook, China Railway Publishing House, Beijing, ISSN 1009-6957, 2012.
Editorial Board of China Railway Yearbook: China railway yearbook, China Railway Publishing House, Beijing, ISSN 1009-6957, 2013.
Editorial Board of China Railway Yearbook: China railway yearbook, China Railway Publishing House, Beijing, ISSN 1009-6957, 2014.
Editorial Board of China Railway Yearbook: China railway yearbook, China Railway Publishing House, Beijing, ISSN 1009-6957, 2015.
Editorial Board of China Railway Yearbook: China railway yearbook, China Railway Publishing House, Beijing, ISSN 1009-6957, 2016.
Editorial Board of China Railway Yearbook: China railway yearbook, China Railway Publishing House, Beijing, ISSN 1009-6957, 2017.
Espinet, X., Rozenberg, J., Ogita, K. S. R. S., Singh Rao, K., and Ogita, S.: Piloting the Use of Network Analysis and Decision-Making under Uncertainty in Transport Operations: Preparation and Appraisal of a Rural Roads Project in Mozambique under Changing Flood Risk and Other Deep Uncertainties, Policy Research Working Paper, No. 8490, World Bank, Washington, DC, © World Bank, https://openknowledge.worldbank.org/handle/10986/29943 (last access: 19 May 2020), 2018.
Fraiture, C.: Integrated water and food analysis at the global and basin level. An application of WATERSIM, Water Resour. Manag., 21, 185–198, https://doi.org/10.1007/978-1-4020-5591-1-12, 2007.
GFDRR: Tbilisi disaster needs assessment 2015, https://reliefweb.int/sites/reliefweb.int/files/resources/tbilisi_disaster_needs_assessment_2015.pdf (last access: 19 May 2020), 2015.
Gil, J. and Steinbach, P.: From flood risk to indirect flood impact: Evaluation of street network performance for effective management, response and repair, WIT Trans. Ecol. Environ., 118, 335–344, https://doi.org/10.2495/FRIAR080321, 2008.
Gong, M., Wang, Y., Wang, S., and Liu, W.: Enhancing robustness of interdependent network under recovery based on a two-layer-protection strategy, Sci. Rep., 7, 1–13, https://doi.org/10.1038/s41598-017-13063-2, 2017.
Haimes, Y. Y.: On the complex definition of risk: A systems-based approach, Risk Anal., 29, 1647–1654, https://doi.org/10.1111/j.1539-6924.2009.01310.x, 2009.
Hirabayashi, Y., Mahendran, R., Koirala, S., Konoshima, L., Yamazaki, D., Watanabe, S., Kim, H., and Kanae, S.: Global flood risk under climate change, Nat. Clim. Chang., 3, 816–821, https://doi.org/10.1038/nclimate1911, 2013.
Hong, L., Ouyang, M., Peeta, S., He, X., and Yan, Y.: Vulnerability assessment and mitigation for the Chinese railway system under floods, Reliab. Eng. Syst. Saf., 137, 58–68, https://doi.org/10.1016/j.ress.2014.12.013, 2015.
Horacio, J., Ollero, A., Noguera, I., and Fernández-Pasquier, V.: Flooding, channel dynamics and transverse infrastructure: a challenge for Middle Ebro river management, J. Maps, 15, 310–319, https://doi.org/10.1080/17445647.2019.1592719, 2019.
Janic, M. and Vleugel, J.: Estimating potential reductions in externalities from rail–road substitution in Trans-European freight transport corridors, Transp. Res. Part D Transp. Environ., 17, 154–160, https://doi.org/10.1016/j.trd.2011.09.015, 2012.
Jongman, B., Hochrainer-Stigler, S., Feyen, L., Aerts, J. C. J. H., Mechler, R., Botzen, W. J. W., Bouwer, L. M., Pflug, G., Rojas, R., and Ward, P. J.: Increasing stress on disaster-risk finance due to large floods, Nat. Clim. Chang., 4, 264–268, https://doi.org/10.1038/nclimate2124, 2014.
Kellermann, P., Schöbel, A., Kundela, G., and Thieken, A. H.: Estimating flood damage to railway infrastructure – the case study of the March River flood in 2006 at the Austrian Northern Railway, Nat. Hazards Earth Syst. Sci., 15, 2485–2496, https://doi.org/10.5194/nhess-15-2485-2015, 2015.
Kellermann, P., Schönberger, C., and Thieken, A. H.: Large-scale application of the flood damage model RAilway Infrastructure Loss (RAIL), Nat. Hazards Earth Syst. Sci., 16, 2357–2371, https://doi.org/10.5194/nhess-16-2357-2016, 2016.
Koks, E. E. and Haer, T.: A high-resolution wind damage model for Europe, Sci. Rep., 10, 1–11, https://doi.org/10.1038/s41598-020-63580-w, 2020.
Koks, E. E., Rozenberg, J., Zorn, C., Tariverdi, M., Vousdoukas, M., Fraser, S. A., Hall, J. W., and Hallegatte, S.: A global multi-hazard risk analysis of road and railway infrastructure assets, Nat. Commun., 10, 1–11, https://doi.org/10.1038/s41467-019-10442-3, 2019.
Kundzewicz, Z. W., Pińskwar, I., and Brakenridge, R.: Large floods in Europe, 1985–2009, Int. Assoc. Sci. Hydrol. Bull., 58, 1–7, https://doi.org/10.1080/02626667.2012.745082, 2013.
Lamb, R., Garside, P., Pant, R., and Hall, J. W.: A Probabilistic Model of the Economic Risk to Britain's Railway Network from Bridge Scour During Floods, Risk Anal., 39, 2457–2478, https://doi.org/10.1111/risa.13370, 2019.
Lavers, D. A., Allan, R. P., Villarini, G., Lloydhughes, B., Brayshaw, D. J., and Wade, A. J.: Future changes in atmospheric rivers and their implications for winter flooding in Britain, Environ. Res. Lett., 8, 34010, https://doi.org/10.1088/1748-9326/8/3/034010, 2013.
Liu, K., Wang, M., Cao, Y., Zhu, W., Wu, J., and Yan, X.: A comprehensive risk analysis of transportation networks affected by rainfall-Induced multihazards, Risk Anal., 38, 1618–1633, https://doi.org/10.1111/risa.12968, 2018a.
Liu, K., Wang, M., Cao, Y., Zhu, W., and Yang, G.: Susceptibility of existing and planned Chinese railway system subjected to rainfall-induced multi-hazards, Transp. Res. Part A Policy Pract., 117, 214–226, 2018b.
Lyu, H. M., Xu, Y. S., Cheng, W. C., and Arulrajah, A.: Flooding hazards across Southern China and prospective sustainability measures, Sustain., 10, 1–18, https://doi.org/10.3390/su10051682, 2018.
Marsden, M. J.: Quadratic spline interpolation, Bull. Am. Math. Soc., 80, 903–906, https://doi.org/10.1090/S0002-9904-1974-13566-4, 1974.
Meshram, S. G., Powar, P. L., and Meshram, C.: Comparison of cubic, quadratic, and quintic splines for soil erosion modeling, Appl. Water Sci., 8, 1–7, https://doi.org/10.1007/s13201-018-0807-6, 2018.
Metropolis, N.: The beginning of the Monte Carlo method, Los Alamos Science, (1987 Special Issue dedicated to Stanislaw Ulam), 1, 125–130, https://sgp.fas.org/othergov/doe/lanl/pubs/00326866.pdf (last access: 19 May 2020), 1987.
Moran, A. P., Thieken, A. H., Schöbel, A., and Rachoy, C.: Documentation of Flood Damage on Railway Infrastructure, in: Data and Mobility, edited by: Düh, J., Hufnagl, H., Juritsch, E., Pfliegl, R., Schimany, H.-K., and Schönegger, H., AISC 81, Heidelberg, 61–70, https://doi.org/10.1007/978-3-642-15503-1_6, 2010.
Newman, M. E.: Networks An Introduction, Oxford University Press, United States, https://doi.org/10.1093/acprof:oso/9780199206650.001.0001, 2010.
Nones, M. and Pescaroli, G.: Implications of cascading effects for the EU Floods Directive, Int. J. River Basin Manag., 14, 195–204, https://doi.org/10.1080/15715124.2016.1149074, 2016.
OpenStreetMap: Geographic railway system, https://www.openstreetmap.org/, last access: 19 May 2020.
Pregnolato, M., Ford, A., Wilkinson, S. M., and Dawson, R. J.: The impact of flooding on road transport: A depth-disruption function, Transp. Res. Part D Transp. Environ., 55, 67–81, https://doi.org/10.1016/j.trd.2017.06.020, 2017.
Prudhomme, C. and Genevier, M.: Can atmospheric circulation be linked to flooding in Europe?, Hydrol. Process., 25, 1180–1190, https://doi.org/10.1002/hyp.7879, 2011.
Resource and Environment Science and Data Center: River basin map, http://www.resdc.cn/, last access: 19 May 2020.
Reed, D. W.: A review of British railway bridge flood failures, Hydrol. Sci. Pract., 21st Century, I, 210–216, https://www.researchgate.net/profile/Duncan_Reed/publication/267254265_A_review_of_British_railway_bridge_flood_failures/links/5512efd60cf240060b2df24c.pdf (last access: 19 May 2020), 2004.
Rezvani, Z., Jansson, J., and Bodin, J.: Advances in consumer electric vehicle adoption research: A review and research agenda, Transp. Res. Part D Transp. Environ., 34, 122–136, https://doi.org/10.1016/j.trd.2014.10.010, 2015.
Rodrigue, J. P., Comtois, C., and Slack, B.: The geography of transport systems 4th edn., Taylor & Francis, https://doi.org/10.4324/9781315618159, 2016.
Rojas, R., Feyen, L., and Watkiss, P.: Climate change and river floods in the European Union: Socio-economic consequences and the costs and benefits of adaptation, Glob. Environ. Chang., 23, 1737–1751, https://doi.org/10.1016/J.GLOENVCHA.2013.08.006, 2013.
Sampson, C. C., Smith, A. M., Bates, P. D., Neal, J. C., Alfieri, L., and Freer, J. E.: A high-resolution global flood hazard model, Water Resour. Res., 51, 7785–7789, https://doi.org/10.1002/2015WR016954, 2015.
Samuels, P. and Gouldby, B.: Language of Risk – Project definitions, 2nd ed., FLOODsite, Wallingford, UK, https://repository.tudelft.nl/islandora/object/uuid:268e1ef4-7b45-4b4d-8504-13d2f252e4d9?collection=research (last access: 19 May 2020), 2009.
Sene, K.: Flood warning, forecasting and emergency response, Springer, Berlin, Heidelberg, https://doi.org/10.1007/978-3-540-77853-0, 2008.
Singh, P., Sinha, V. S. P., Vijhani, A., and Pahuja, N.: Vulnerability assessment of urban road network from urban flood, Int. J. Disaster Risk Reduct., 28, 237–250, https://doi.org/10.1016/j.ijdrr.2018.03.017, 2018.
Speight, L. J., Hall, J. W., and Kilsby, C. G.: A multi-scale framework for flood risk analysis at spatially distributed locations, J. Flood Risk Manag., 10, 124–137, https://doi.org/10.1111/jfr3.12175, 2017.
Sun, W. and Yuan, Y.-X.: Optimization theory and methods: nonlinear programming, edited by: Pardalos, P. M., Springer Science & Business Media, LLC, 233 Spring Street, New York, NY 10013, USA, ISBN 978-0-387-24975-9, 2006.
UNISDR: Global Assessment Report on Disaster Risk Reduction, Revealing Risk, Redefining Development, https://www.preventionweb.net/english/hyogo/gar/2011/en/home/foreword.html (last access: 19 May 2020), 2011.
Vandebogert, K.: Method of quadratic interpolation, 1–22, https://people.math.sc.edu/kellerlv/Quadratic_Interpolation.pdf (last access: 19 May 2020), 2017.
Ward, P. J., Jongman, B., Weiland, F. S., Bouwman, A., Van Beek, R., Bierkens, M. F. P., Ligtvoet, W., and Winsemius, H. C.: Assessing flood risk at the global scale: Model setup, results, and sensitivity, Environ. Res. Lett., 8, 044019, https://doi.org/10.1088/1748-9326/8/4/044019, 2013.
Ward, P. J., Jongman, B., Aerts, J. C. J. H., Bates, P. D., Botzen, W. J. W., DIaz Loaiza, A., Hallegatte, S., Kind, J. M., Kwadijk, J., Scussolini, P., and Winsemius, H. C.: A global framework for future costs and benefits of river-flood protection in urban areas, Nat. Clim. Chang., 7, 642–646, https://doi.org/10.1038/nclimate3350, 2017.
Wei, S., Yuan, J., Qiu, Y., Luan, X., Han, S., Zhou, W., and Xu, C.: Exploring the potential of open big data from ticketing websites to characterize travel patterns within the Chinese high-speed rail system, PLoS One, 12, 1–13, https://doi.org/10.1371/journal.pone.0178023, 2017.
Winsemius, H. C., Van Beek, L. P. H., Jongman, B., Ward, P. J., and Bouwman, A.: A framework for global river flood risk assessments, Hydrol. Earth Syst. Sci., 17, 1871–1892, https://doi.org/10.5194/hess-17-1871-2013, 2013.
Winsemius, H. C., Aerts, J. C. J. H., Van Beek, L. P. H., Bierkens, M. F. P., Bouwman, A., Jongman, B., Kwadijk, J. C. J., Ligtvoet, W., Lucas, P. L., Van Vuuren, D. P., and Ward, P. J.: Global drivers of future river flood risk, Nat. Clim. Chang., 6, 381–385, https://doi.org/10.1038/nclimate2893, 2016.
World Bank: GLOFRIS global fluvial flood hazard, https://datacatalog.worldbank.org/search/dataset/0038584, last access: 19 May 2020.
Wu, Q.: Risk analysis of seismic hazard correlation between nuclear power plants, in Risk Analysis Based on Data and Crisis Response Beyond Knowledge, edited by: Huang, C. and Nivolianitou, Z. S., 550–556, CRC Press, ISBN 9780429286346, 2019.
Yang, D., Pan, K., and Wang, S.: On service network improvement for shipping lines under the one belt one road initiative of China, Transp. Res. Part E Logist. Transp. Rev., 117, 82–95, https://doi.org/10.1016/j.tre.2017.07.003, 2018.
Zhu, W., Liu, K., Wang, M., and Koks, E. E.: Seismic Risk Assessment of the Railway Network of China's Mainland, Int. J. Disaster Risk Sci., 11, 452–465, https://doi.org/10.1007/s13753-020-00292-9, 2020.
Considering that the inundation depth-exceedance probability is from 0 to 1, when T=2-year event, the , and when T=5-year event, the . When we impose the 1-year event, the P=1, which can make the inundation depth-exceedance probability from 0 to 1.
As the depth of the 2-year event in GLOFRIS global fluvial flood hazard maps is equal to 0 m, we assume D1 is also equal to zero (i.e. 1-year event with a flood depth of 0 m).
The value and the concept of the drainage capacity rate are from Espinet et al. (2018), which is defined as the drainage capacity of embankment, bridge, and culvert. In this work, the value is 0.7 for bridges and culverts in Mozambique. Considering China is more developed than Mozambique, we assume the infrastructure in China has a higher drainage capacity, and a value of 0.8 is assigned.