the Creative Commons Attribution 4.0 License.
the Creative Commons Attribution 4.0 License.
 | 21 Apr 2022
Assessing the importance of conditioning factor selection in landslide susceptibility for the province of Belluno (region of Veneto, northeastern Italy)
Sansar Raj Meena
Silvia Puliero
Kushanav Bhuyan
Mario Floris
Filippo Catani
In the domain of landslide risk science, landslide susceptibility mapping (LSM) is very important, as it helps spatially identify potential landslide-prone regions. This study used a statistical ensemble model (frequency ratio and evidence belief function) and two machine learning (ML) models (random forest and XGBoost; eXtreme Gradient Boosting) for LSM in the province of Belluno (region of Veneto, northeastern Italy). The study investigated the importance of the conditioning factors in predicting landslide occurrences using the mentioned models. In this paper, we evaluated the importance of the conditioning factors in the overall prediction capabilities of the statistical and ML algorithms. By the trial-and-error method, we eliminated the least “important” features by using a common threshold of 0.30 for statistical and 0.03 for ML algorithms. Conclusively, we found that removing the least important features does not impact the overall accuracy of LSM for all three models. Based on the results of our study, the most commonly available features, for example, the topographic features, contributes to comparable results after removing the least important ones, namely the aspect plan and profile curvature, topographic wetness index (TWI), topographic roughness index (TRI), and normalized difference vegetation index (NDVI) in the case of the statistical model and the plan and profile curvature, TWI, and topographic position index (TPI) for ML algorithms. This confirms that the requirement for the important conditioning factor maps can be assessed based on the physiography of the region.
- Article
(4790 KB) - Full-text XML
- BibTeX
- EndNote


Landslides are one of the most frequently occurring natural disasters that cause significant human casualties and infrastructure destruction (Froude and Petley, 2018). Landslides are triggered by several natural and man-made events such as earthquakes, volcanic eruptions, heavy rains, extreme winds, and unsustainable construction activities such as unplanned settlement development and the cutting of roads along the slopes (Glade et al., 2006; van Westen et al., 2008). Extreme meteorological events such as the Vaia storm of 2018 triggered landslides and debris flow and destroyed critical infrastructures in the northern parts of Italy (Boretto et al., 2021). As reported by Gariano et al. (2021) in the 50 years between 1969 and 2018, landslides posed a severe threat to the Italian population. Approximately 1500 out of the 8100 municipalities in Italy have faced landslides with severe fatalities. Between the years of 1990 and 1999, 263 people were killed by landslides. Studies by Rossi et al. (2019) estimated that approximately 2500 people were killed between 1945 and 1990. Moreover, predictive modelling of the Italian population at risk of landslides (Rossi et al., 2019) shows a massive tendency of risk to the population with data acquired between 1861 and 2015, emphasizing the necessity for landslide risk studies.
Therefore, to assess landslide risk and to plan for risk mitigation measures, it is crucial to analyse the landslide susceptibility mapping (LSM). LSM is an essential tool that incorporates potential landslide locations (Senouci et al., 2021). The probability of a landslide occurring in a particular region owing to the effects of several causative factors is referred to as landslide susceptibility (Reichenbach et al., 2018). LSM is an essential step towards landslide risk management and helps in effective mapping of the spatial distribution of probable landslide manifestations (Dai et al., 2002). In the past, researchers have used a range of models to assess landslide susceptibility using technologies such as Earth observation (EO) and a geographic information system (GIS). The recognition and analysis of slope movements have been going on since the early 1970s (Brabb et al., 1972) and is still one of the most important components in performing LSM (Ercanoglu and Gokceoglu, 2002; Chacón et al., 2006; Guzzetti et al., 2006; Castellanos Abella and Van Westen, 2008; Floris et al., 2011; Catani et al., 2013; Pham et al., 2015; Reichenbach et al., 2018; Youssef and Pourghasemi, 2021; Liu et al., 2021).
Traditional methods such as the expert-based analytical hierarchy process (AHP), multi-variate statistics, and data-driven approaches have been employed for landslide susceptibility for many years, with satisfactory results (Pradhan, 2010; Castellanos Abella and Van Westen, 2008; Komac, 2006). A use case of such approaches is given by Floris et al. (2011), who apply traditional LSM methods (frequency ratio, FR) for mapping landslide susceptibility in a case study in the region of Veneto, Italy. Afterwards, with the development of new approaches, susceptibility modelling has advanced from traditional approaches. Presently, two approaches – (1) statistical and (2) machine learning – are practised for LSM for investigating the landslide predisposing factors and for mapping the geographical distribution of landslide processes. Reichenbach et al. (2018) classified landslide susceptibility models into six main groups: (1) classical statistics, (2) index-based, (3) machine learning, (4) multi-criteria analysis, (5) neural networks, and (6) others. Research by Reichenbach et al. (2018) also depicted that before 1995, only 5 models were used for LSM, but in recent times, an investigation of 19 other models was carried out, which yielded good results. More than 50 % of the methods consisting of the first five models mentioned above accounted for landslide susceptibility studies. Recent work by Stanley et al. (2021) emphasized the importance of data-driven methods in global LSM, which are trained to report landslide spatial occurrences between the periods of 2015 and 2018. The first version of the Landslide Hazard Assessment for Situational Awareness (LHASA) model from their work for NASA reported landslide occurrences with a decision tree model that first defines the intensity of 1 week of rainfall. LHASA version 2 used the data-driven model of XGBoost (eXtreme Gradient Boosting) by adding two dynamically varying factors: snow and soil moisture. However, despite advances in LSM, the importance of the conditioning factors in the prediction capability of a model is not discussed enough. The need for increasing our control over the model sensitivity to system parameters changes, including those induced by anthropogenic and climate-change dynamics, is becoming a key factor in the implementation of truly efficient LSM for risk mitigation purposes. The Vaia windstorm of 2018 (Forzieri et al., 2020), as a typical extreme weather event, may easily escape traditional statistical prediction schemes and represent, therefore, a challenging test for exploring the sensitivity of the various LSM models to changing factors and conditions.
One goal of this research is to look into the relative changes in LSM accuracy when the least “important” conditioning factors are removed. Feature selection in LSM is an approach in reducing landslide conditioning factors to improve model performance and reduce computational time. The purpose of this approach is to find the optimal set of conditioning factors that will provide the best fit for the model to yield higher accuracy as predictions. Micheletti et al. (2014) emphasized the importance of feature selection in LSM and discussed the use of machine learning (ML) models such as a support vector machine (SVM), random forest (RF), and AdaBoost (Adaptive Boosting) for LSM, as well as the significance of associated features within the confluence of the ML models for feature importance. However, their study did not consider geological and meteorological features like lithology, land use, and rainfall intensity for both LSM and feature selection. Studies by Liu et al. (2021) not only depicted the improvement in the predictive capability of the so-called feature selection machine learning (FS-ML) model but also remarked on the fact that the same conditioning factors may contribute differently in different ML models. In this study, we want to investigate the prediction capability of the model after removing conditioning factors as an approach to improve LSM accuracy in contrast to what has been done in studies like Liu et al. (2021), where they assess conditioning factor importance using approaches like multi-collinearity analysis and variance inflation factor before the prediction of the susceptibility. The identification of the most crucial features can help in monitoring the effect of extreme events (such as Vaia) on the changes in the evolution of landslide hazard.
We present a study from the province of Belluno (region of Veneto, northeastern Italy) with the comparison of the conditioning factor importance of statistical and ML models for LSM before the Vaia storm event. The results from LSM will be then validated using the IFFI (Inventory of Landslide Phenomena in Italy) landslide inventory data for testing the various models' prediction capability with/without certain factors. We also investigate whether many of the latter conditioning factors are crucial for LSM. As in many regions over the world, the same data or factor maps might not be available.
2.1 Study area
The area of the province of Belluno (region of Veneto, northeastern Italy) is part of the tectonic unit of the Southern Alps. The territory is 3672 km2 wide, stretching from north to south between the Dolomite Alps and the Venetian Prealps, with elevations ranging from 42 to 3325 m a.m.s.l. (above mean sea level). From a geological point of view, the Dolomite Alps comprise the Hercynian crystalline basement consisting of micaschists and phyllites intruded by the Permian ignimbrites (Doglioni, 1990; Schönborn, 1999). These Palaeozoic units are mainly outcropping in the northeastern and central-western sectors. The middle Upper Triassic includes carbonate, volcanic, and dolomitic formations. In particular, the Upper Triassic Main Dolomite covers 14 % of the whole province. Jurassic–Cretaceous limestone and marls are especially located between the Valsugana and Belluno thrusts (Sauro et al., 2013). Moreover, in the Belluno Valley and in the southern part of the area, Cenozoic sediments, i.e. flysch and molasse and Quaternary glacial, alluvial, and colluvial deposits, are largely present. Instead, the Venetian Prealps are characterized by Jurassic–Cretaceous sedimentary cover, such as layered limestones and dolomites with cherts (Compagnoni et al., 2005; Corò et al., 2015). Because of its morphological characteristics, the study area is affected by slope instability, which overlays an area of 165 km2 corresponding to 6 % of the province (Baglioni et al., 2006). Most of the landslides are located in the northwestern (upper basin of the Cordevole River) and southeastern (district of Alpago) sectors of the province (Fig. 1). The dominant landslide types are slides (47 %), rapid flows (20 %), slow flows (12 %), and shallow soil slips (7 %) (Iadanza et al., 2021). The climate of the province of Belluno is continental. The mean annual temperature recorded in the period 1961–1990 is 7 ∘C, and the mean precipitation is 1284 mm yr−1 (Desiato et al., 2005) with two peaks distributed in spring and autumn. In the last 27 years, temperature and rainfall intensity in the study area have increased due to climatic changes leading to more frequent meteorological conditions (ARPAV, 2021).
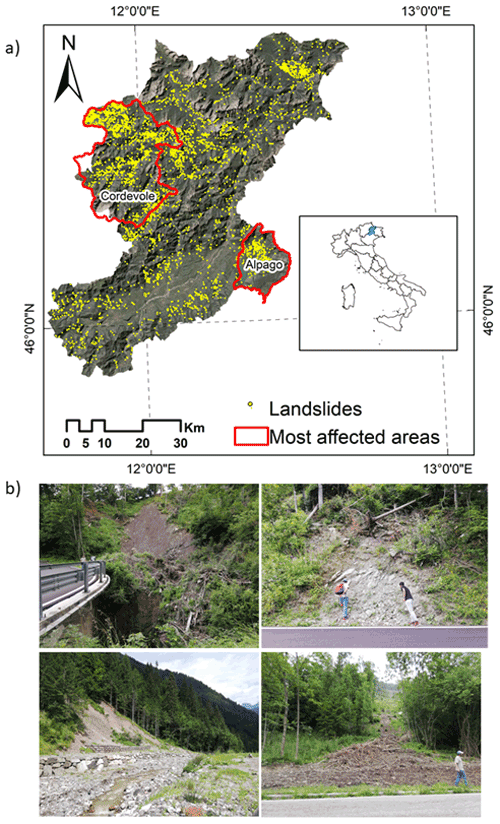
Figure 1(a) Location of the study area and landslides collected by the IFFI (Inventory of Landslide Phenomena in Italy) project. (b) Field photographs after the Vaia event.
2.2 Landslide inventory data
The Inventory of Landslide Phenomena in Italy (IFFI) conducted by the Italian Institute for Environmental Protection and Research (ISPRA) was used in this study (Trigila et al., 2010). The IFFI project was financed in 1997. Since 2005, the catalogue has been available online and consists of point features indicating the scarp of the landslides and polygon features delineating the instabilities. The archive stores the main attributes of the landslides, such as morphometry, type of movement, rate, involved material, induced damages, and mitigation measures. The inventory currently holds 620 808 landslides collected from historical documents, field surveys, and aerial photointerpretation, covering an area of 23 700 km2, which corresponds to the 7.9 % of the Italian territory (Trigila and Iadanza, 2018). In the province of Belluno, the IFFI inventory consists of 5934 data points about landslides that occurred before 2006 (Baglioni et al., 2006).
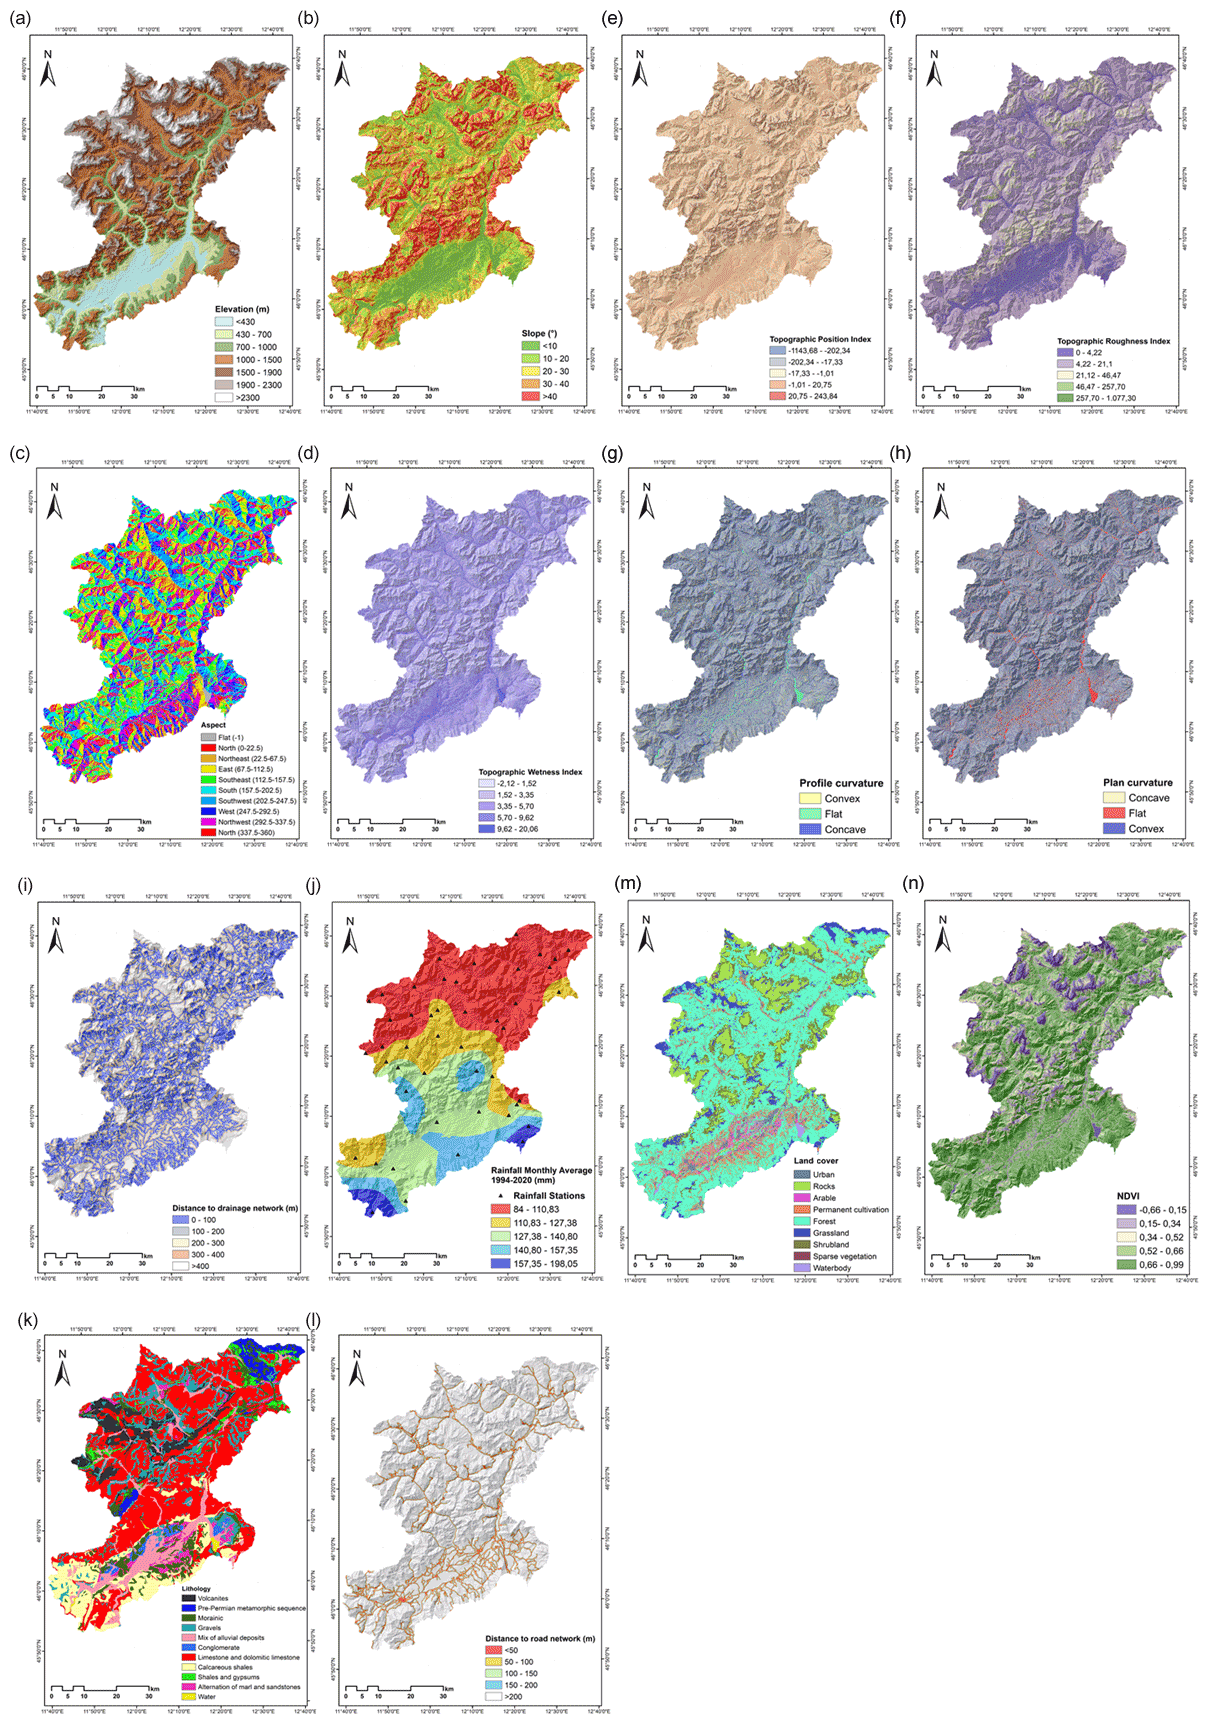
Figure 2Maps of the conditioning factors used in this study: (a) elevation, (b) slope, (c) aspect, (d) topographic wetness index, (e) topographic position index, (f) topographic roughness index, (g) profile curvature, (h) plane curvature, (i) distance to drainage networks, (j) rainfall monthly average (1994–2020; mm), (k) lithology, (l) distance to road network, (m) land cover, and (n) NDVI.
2.3 Landslide conditioning factors
Based on the regional environmental characteristics of the study area and the scientific literature, 14 landslide conditioning factors were selected, including (i) topographic factors such as elevation, slope angle, slope aspect, topographic wetness index (TWI), topographic position index (TPI), topographic roughness index (TRI), profile curvature, and plan curvature; (ii) hydrological factors (i.e. distance to drainage and mean monthly rainfall) and geological factors (lithology); (iii) anthropogenic factors (distance to roads); and (iv) environmental factors like the normalized difference vegetation index (NDVI) and land cover (see Fig. 2). A freely accessible digital elevation model (DEM) with a spatial resolution of 25 m downloaded from the cartographic portal of the region of Veneto (https://idt2.regione.veneto.it, last access: 9 April 2022) was used to derive the topographic layers. Refer to Table 1 for a detailed description of the conditioning factors. Land cover, lithology, road network, and drainage maps were downloaded from the same portal. Rainfall data were downloaded from the Regional Agency for Environmental Prevention and Protection of Veneto (ARPAV; https://www.arpa.veneto.it/, last access: 9 April 2022) web site. We resampled the conditioning factor maps to 25 m pixels in order to do the analysis.
Table 1Description of the conditioning factors for landslide occurrences.

We propose an approach that helps assess the importance of the conditioning factors, which can help improve the susceptibility results by removing the less important factors throughout the statistical and ML models. As stated previously, the study attempts to apply the sensitivity analysis to understand the relative importance of the conditioning factors as a preliminary step towards improving the landslide susceptibility prediction capability. In this study, LSM was obtained by the combination of the IFFI landslide inventory and the conditioning factors through statistical methods such as the evidence belief function (EBF) and ML models, i.e. random forest and XGBoost (Fig. 3). The successive sub-sections address the definitions of the statistical and ML models for LSM.
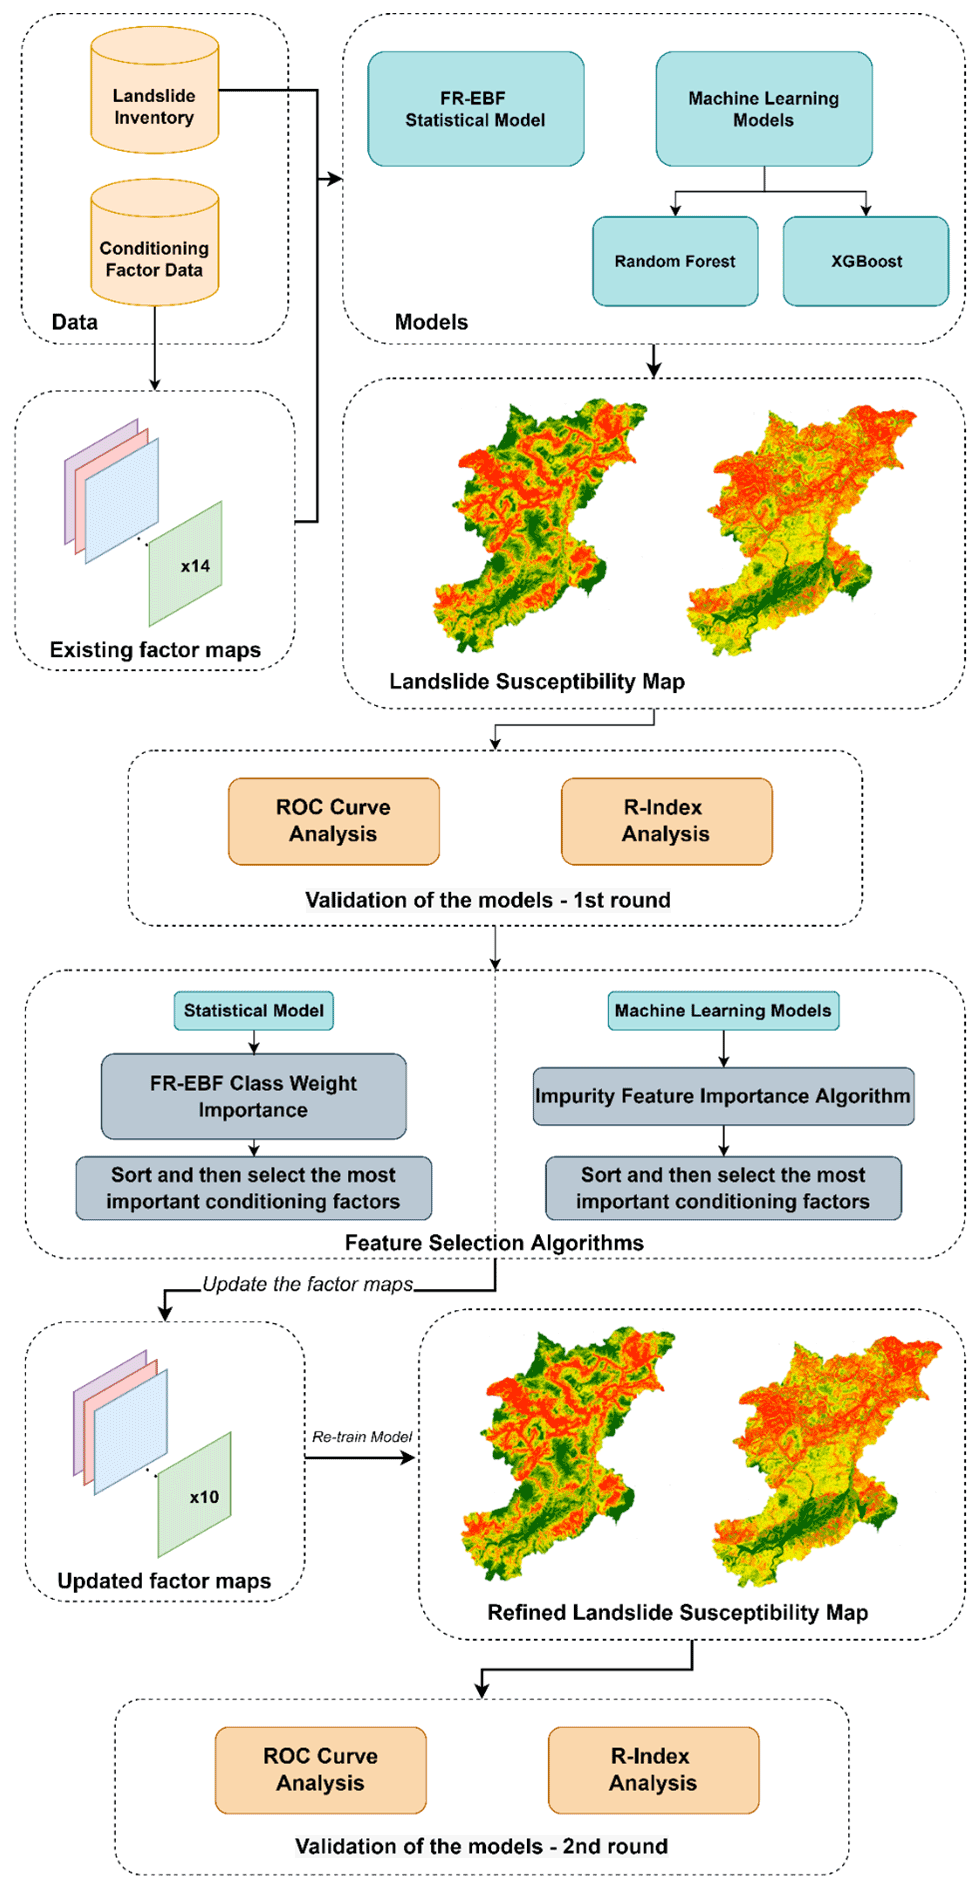
Figure 3Overview of the conceptual workflow of the methodology for landslide susceptibility assessment.
3.1 Statistical approach
Ensemble frequency ratio–evidence belief function
In landslide susceptibility studies, the frequency ratio (FR) model is often applied. This is an evaluation method which calculates the likelihood of landslide occurrence and non-occurrence for each conditioning factor (Lee, 2013; Mondal and Maiti, 2013; Shahabi et al., 2014). For each landslide conditioning factor, the FR is a probabilistic model based on observed correlations between landslide distribution and related parameters (Tay et al., 2014). The model depicts the relationship between spatial locations and the factors that determine the occurrence of landslides in a specific area. Spatial phenomenon and factor class correlation can be found through FR and is very helpful for geospatial analysis (Mahalingam et al., 2016; Meena and Gudiyangada Nachappa, 2019). Figure 3 gives an overview of the methodology employed in this study.
FR weights can be computed using the ratios of landslide inventory points of all classes within each factor. The landslide inventory points are then overlaid with the conditioning factors to obtain the area ratio for each factor class to the total area. The FR weights are then obtained by dividing the landslide occurrence ratio in a class by the area in that class (Demir et al., 2013).
Using Eq. (1), the landslide susceptibility index (LSI) was computed by summing the values of each factor ratio (Lee, 2013):
where LSI = (DEM ⋅ wi) + (slope ⋅ wi) + (aspect ⋅ wi) + (topographic wetness index ⋅ wi) + (topographic roughness index ⋅ wi) + (topographic position index ⋅ wi) + (distance to road ⋅ wi) + (distance to drainage ⋅ wi) + (land cover ⋅ wi) + (lithology ⋅ wi) + (NDVI ⋅ wi) + (rainfall ⋅ wi) + (profile curvature ⋅ wi) + (plain curvature ⋅ wi), where LSI is the landslide susceptibility index, FR is the frequency ratio of every factor type or class, and wi is the weight of each conditioning factor. The higher the LSI value is, the higher the susceptibility to landslides is.
We integrated the LSI results with EBF-derived predictor values. The EBF uses the conditioning factors defined by FR as the input data. Equation (2) was applied to the rating of every spatial factor.
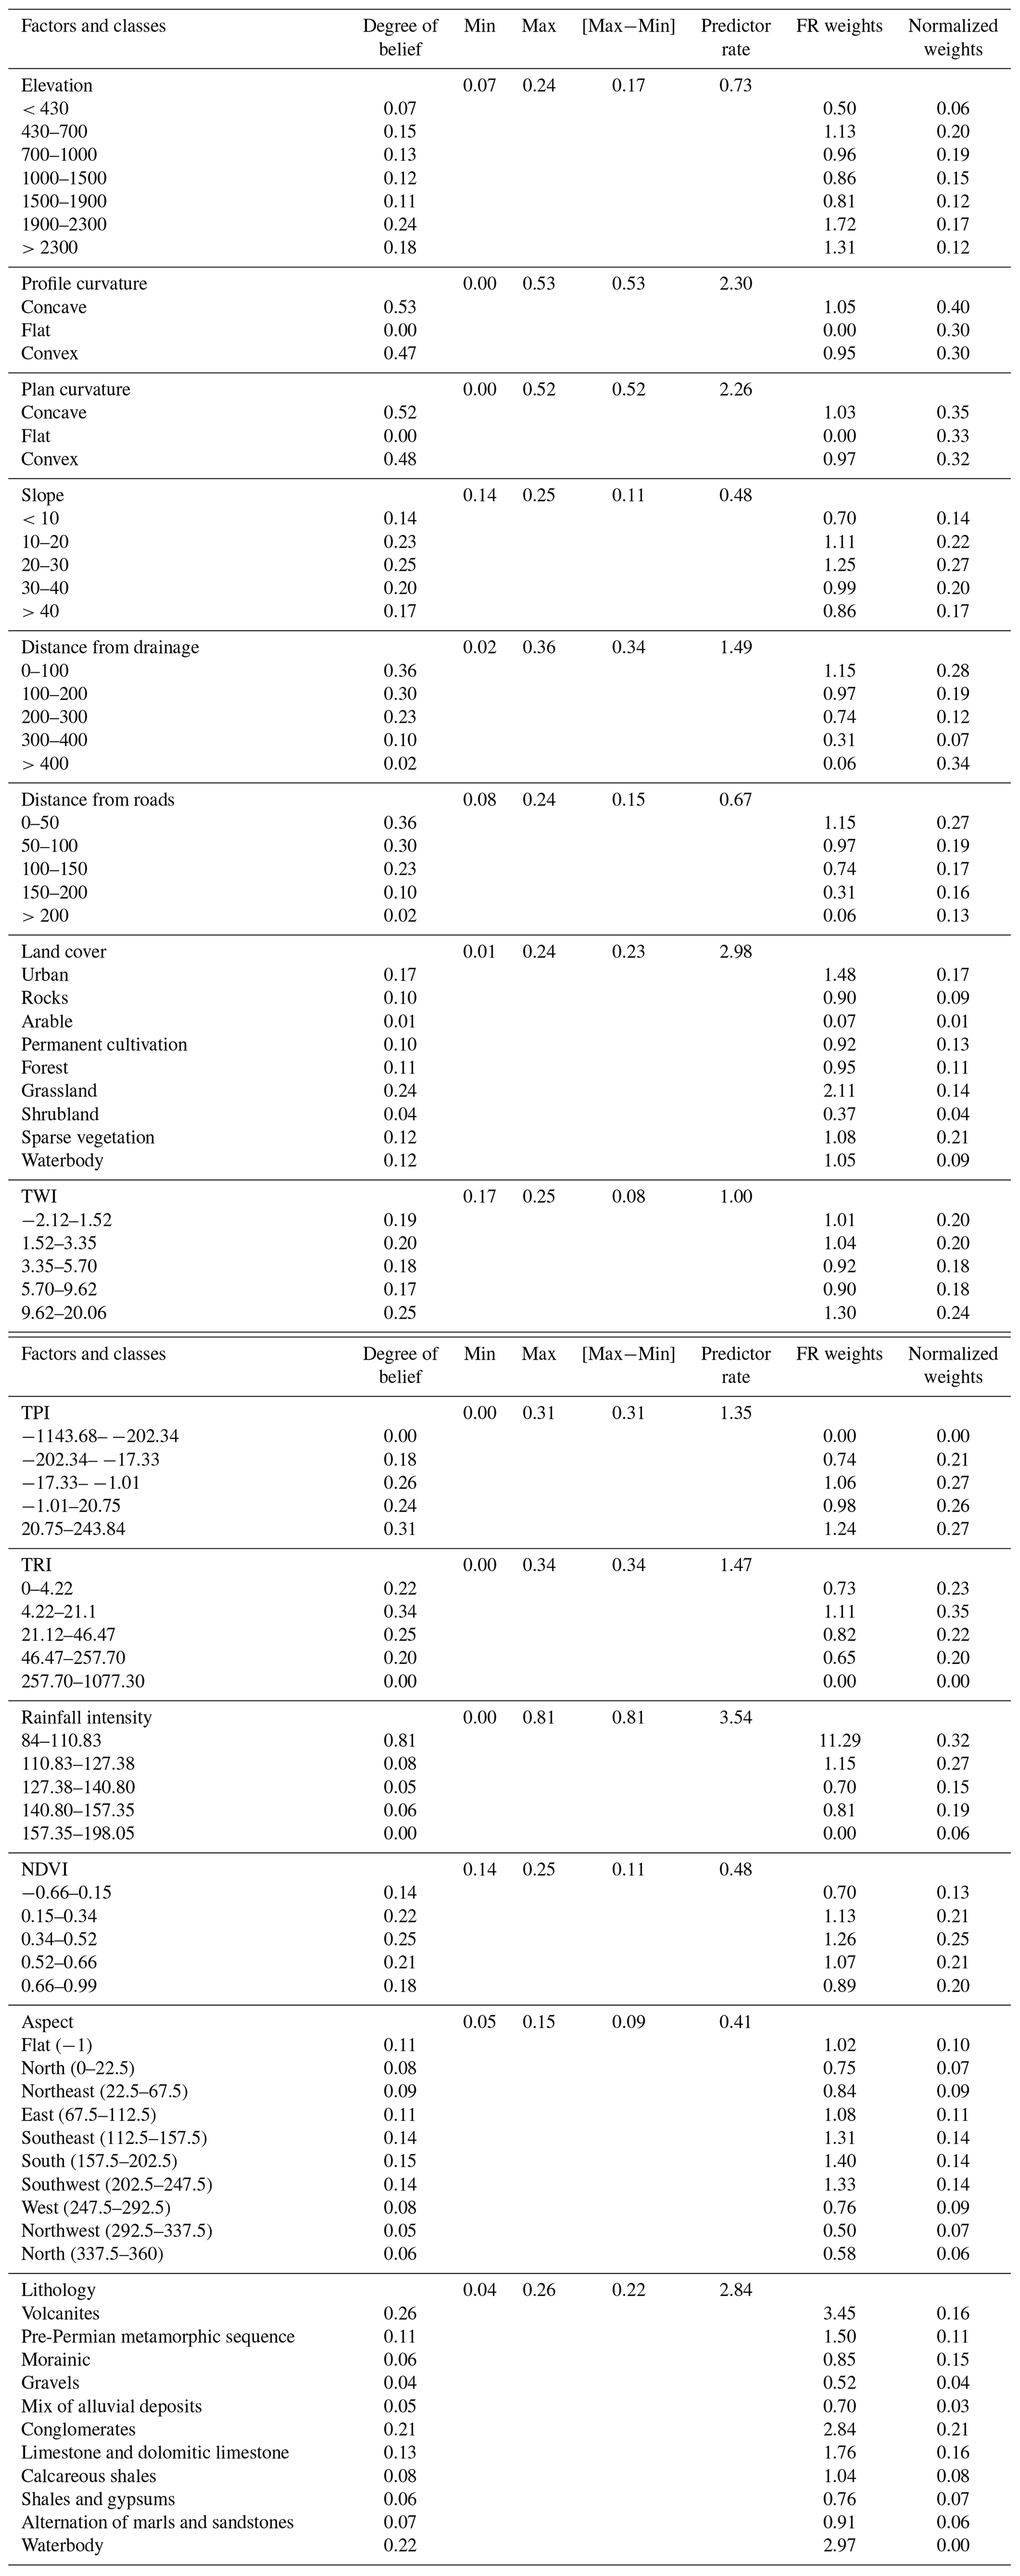
where SA is the indicator of spatial association between spatial factors and landslides, whereas PR is the prediction rate. The lowest absolute difference of all factors is divided by the computed absolute difference between the maximum and the minimum SA values (Table 2). Pairwise comparison of the PR values of the slope failure predictors yielded the pairwise rating matrix of the predictor rating. We used PR values for assigning weights of the factors for susceptibility analysis.
Table 2Frequency ratio values for spatial factors, class weighting, and EBF coefficients for the predictor rate (PR) based on degrees of spatial associations.
3.2 Machine learning models
3.2.1 Random forest model
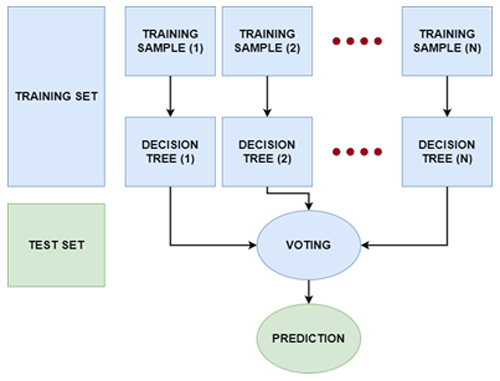
Random forest (RF) is based on the concept of the “wisdom of crowds”, where multiple decision trees, introduced by Breiman (2001), have been utilized in a number of remote sensing studies for a variety of applications (Melville et al., 2018). RF creates many deep decision trees using the training data, and it can overcome the overfitting problem mostly resulting from complex datasets better than other decision trees. Each RF decision tree gives a prediction, which is then weighted according to the value created from votes from each tree leading to generation of the susceptibility map (see Fig. 4). Since the RF has shown an impressive performance for classification purposes, it is regarded as one of the most efficient non-parametric ensemble models (Chen et al., 2017). Based on the advantages listed above, the RF model is used to assess landslide susceptibility. Landslide inventories along with the conditioning factors are divided into training and testing data as seen in Fig. 4. Using the bagging technique, the training data are divided into training subsets, generally about one-third of the total training samples. A decision tree is created for each subset based on the training subset defined in the first stage and, accordingly, votes as implemented that outputs the landslide susceptibility.
3.2.2 XGBoost model
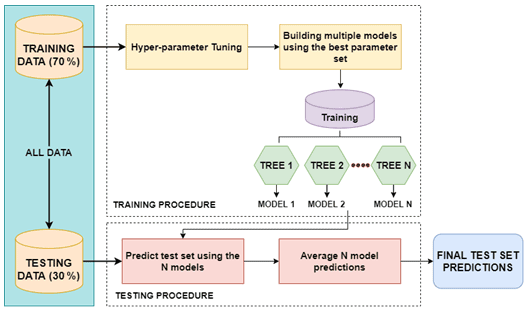
The XGBoost (eXtreme Gradient Boosting) ML model is an optimized gradient boosting algorithm that is designed for optimum speed and performance, and boosting ensembles are used to generate a prediction model (Sahin, 2020). The core idea of a boosting algorithm is to combine the weaker learners to improve accuracy (Can et al., 2021), meaning that different models with lower susceptibility accuracies are “boosted” by combining them to achieve an ensembled higher susceptibility accuracy. The model is known for its fast training speed for classification tasks. In the study, we use training parameters to adjust the XGBoost algorithm like the learning rate, subsample ratio, and maximum depth of the tree, among others. It uses boosting techniques to reduce overfitting problems to improve accuracy results (Fig. 5). The training data are divided into subsets which are then trained using a tree ensemble model. This means that every weight derived from each model training of landslide instances in the area is added and then predicted on the test set with the average landslide susceptibility scores of the ensemble models.
3.3 Feature selection algorithms
The goal of feature selection is to remove the least important conditioning factors in order to increase the generalizability in landslide prediction. This selection help eliminates the irrelevant (less important) conditioning factors to obtain optimal prediction accuracy (Micheletti et al., 2014). For the statistical model, we used class weights obtained from the frequency ratio and used them as input for generating the predictor rate from the FR–EBF (frequency ratio and evidence belief function) model which gives the final weights of the conditioning factors. So, we used the predictor rate weights to select the suitable features.
In terms of the feature importance for selecting the right set factors for both RF and XGBoost, we use the inbuilt impurity feature importance algorithm which is performed on the training set (refer to feature selection in Fig. 3). Based on the results of the feature selection algorithms for the conditioning factors for each model, the most important factors will be selected to investigate the improvement in model performance. With this, we can understand which of the conditioning factors played the most important roles in giving the highest accuracy for each ML model.
4.1 Statistical model
The class weights were derived from the data-driven FR model, and the final weights of the factors were derived by using the predictor rate from the evidence belief function given in Table 2. The class and factor weights were calculated using Eqs. (1) and (2). The final weights of landslide conditioning factors were calculated using an ensemble of FR–EBF and then utilized to create the final landslide susceptibility map. Because there is no common approach for identifying landslide susceptibility classes in the final LSM, we normalized the findings to 0 to 100 for uniformity and comparability. Using a quantile classification, which separates the values into groups with a random number of values, the resultant LSM classification was categorized in five classes: very low, low, moderate, high, and very high, as shown in Fig. 7 (Chung and Fabbri, 2003). This method of classification gives a better distribution of values in each class than common approaches such as natural breaks, which can result in certain classes having limited or excessive data.
In terms of the feature importance that we observe in Fig. 6 and Table 2 (normalized weights), based on the trial-and-error approach, factors (or features) under the threshold of 0.3 were discarded, as they did not make much of a difference in terms of predicting landslide occurrences in the study area. Therefore, five conditioning factors having coefficient values lower than 0.30 were dropped, and overall, the area under the curve (AUC) accuracy still remained similar to the original accuracy with the 14 factors.
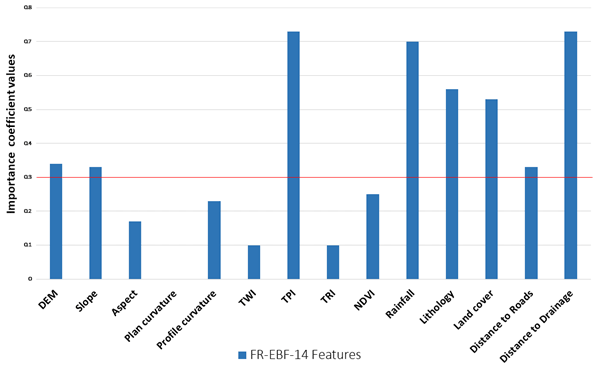
Figure 6Feature importance of the statistical model (horizontal red line shows 0.3 as the cut-off value).
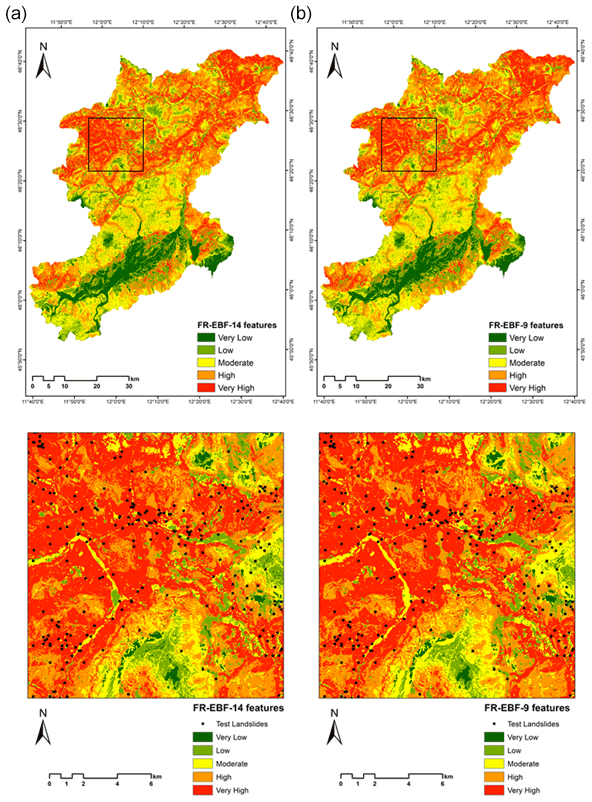
Figure 7Landslide susceptibility maps derived using the ensemble of FR–EBF approaches for (a) 14 landslide features and (b) 9 landslide features (black square represents the enlarged area).
4.2 Machine learning models
LSM was generated based on the conditioning factor data, where the model learnt the information from the feature maps, which helped identify areas of susceptibility. The final results of the ML models in generating LSM are given in Table 3. We observe that the AUC scores of RF are not much apart from the XGBoost model, indicating similar predictive skills of both the models. Visually the results show more susceptible areas near the landslide features (Figs. 8 and 9).
Table 3Overall table with AUC results for landslide susceptibility of Belluno.
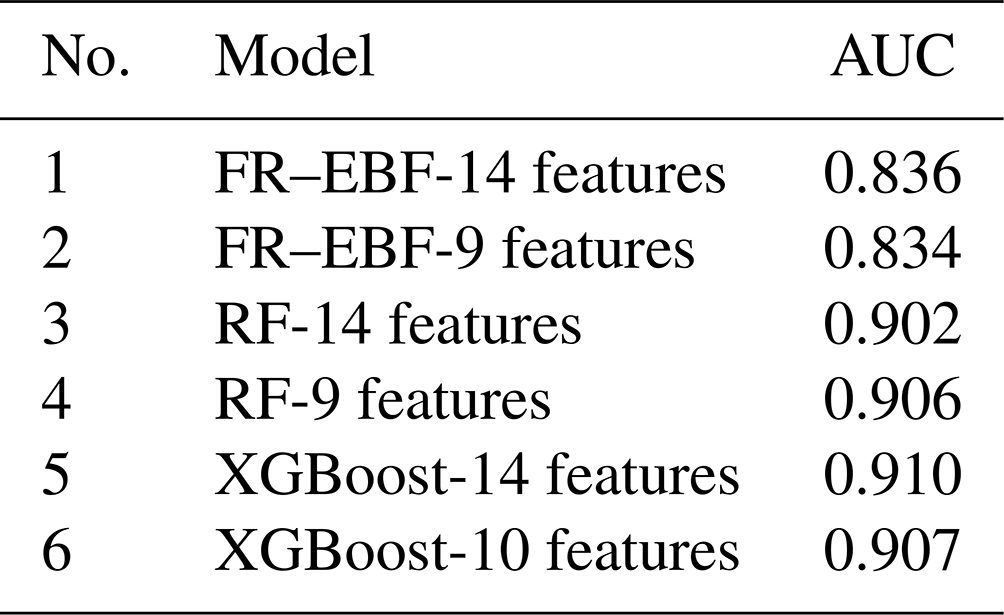

Figure 8LSMs derived using the random forest approach for (a) 14 landslide features and (b) 9 landslide features (black square represents the enlarged area).
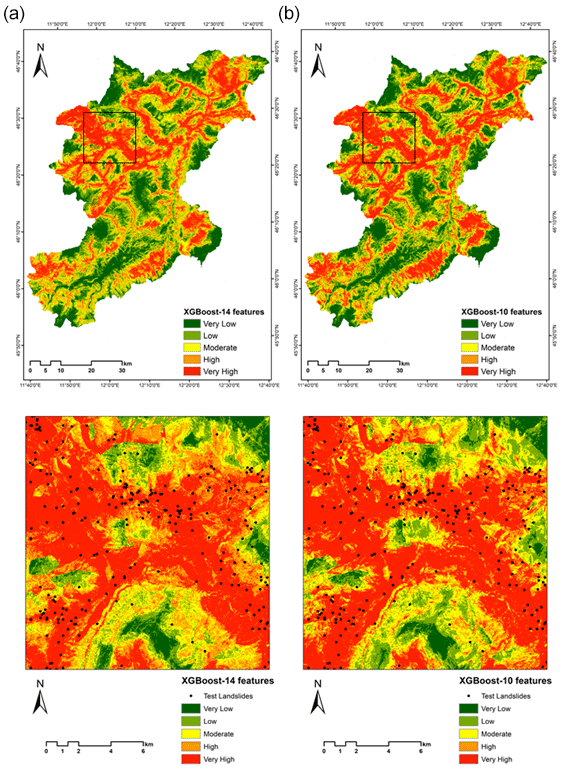
Figure 9LSMs derived using the XGBoost approach for (a) 14 landslide features and (b) 9 landslide features (black square represents the enlarged area).
The model performance in terms of the accuracy of the AUC is relatively similar to the results after eliminating the lower degree of feature importance for both RF and XGBoost. As discussed previously in Sect. 3.3, the feature importance for the ML models is carried out using the impurity feature importance algorithm that enables assessing the relative relevance of the conditioning factors in the optimal prediction of the landslides in terms of accuracy. As seen in Fig. 10, the factors of land cover, profile curvature, plan curvature, TWI, and TPI have the lowest values for the RF model. We examined various values as a cut-off for choosing the important conditioning factors, and after much trial and error, a value of 0.03 was chosen as the threshold. Any factors above this value were considered important factors for landslide susceptibility; hence, in Fig. 8, we see that the five factors mentioned above are removed, giving us an AUC of 0.906 as accuracy, which is better in AUC accuracy without removing the five factors (AUC of 0.902 as seen in Table 3).
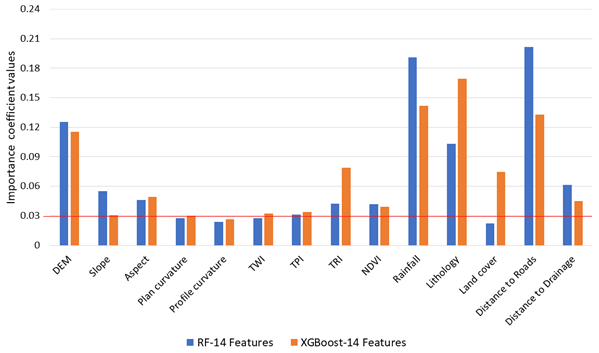
Figure 10Feature importance of the RF and XGBoost models (horizontal red line shows 0.3 as the cut-off value).
Similarly, the same was repeated for the XGBoost ML model, and referring to Table 3, despite removing the lower valued conditioning factors of profile curvature, TPI, and plan curvature, the AUC accuracy score was similar (Table 3). We observe that slope and distance to roads had a much bigger impact on the RF mode than the XGBoost model. On the other hand, lithology played a bigger role in estimating landslide occurrences in the XGBoost model. These observations indicate interesting results which will be discussed further in the Discussion section.
Accuracy assessment is crucial in producing quality LSMs for natural hazards where the information presented in the map is beneficial for planners (Goetz et al., 2015). A number of accuracy assessment approaches may be used to assess the quality of the LSMs. We compare the landslide inventory data to the resultant maps derived using the ensemble of FR–EBF and the machine learning RF and XGBoost models. The efficiency of any model for LSM is calculated by comparing the inventory data to the produced maps. This reflects whether the models in use can accurately forecast which areas are susceptible to landslides (Pourghasemi et al., 2018). The findings from the total landslide input events were tested using 30 % of the landslide occurrences. Testing for this study was done using the approaches of receiver operating characteristics (ROC) and relative landslide density (R index).
5.1 Receiver operating characteristics (ROCs)
The test dataset was used to corroborate the six resultant LSM maps from statistical and machine learning using the approach of receiver operating characteristics (ROCs). The ROC approach shows how to evaluate the true-positive rate (TPR) and false-positive rate (FPR) in the LSM maps (Ghorbanzadeh et al., 2018; Linden, 2006). TPRs are pixels that are correctly labelled as high susceptibility in the landslide validation data, whereas FPRs are pixels that are incorrectly labelled. ROC curves are created using TPRs versus FPRs. The accuracy of the generated LSMs is determined by the AUC. The AUC shows whether there were more correctly labelled pixels than incorrectly labelled pixels. Greater AUC values suggest a more accurate susceptibility map and vice versa. The susceptibility map is meaningful if the AUC values are close to unity or one. A map with a value of 0.5 is considered insignificant, since it was created by chance (Baird, 2013).
Figure 11 shows the accuracy values obtained using the ROC technique for the statistical approaches of FR–EBF and machine learning approaches of RF and XGBoost. XGBoost shows the highest accurate results with an AUC value of 0.910; RF has one of 0.906; and that of FR–EBF is 0.836 (refer to Table 3). These results are quite good, as they are closer to unity or one. The ensemble of FR–EBF shows lower AUC values than the machine-learning-based XGBoost and random forest. Machine learning results may differ because the models used landslide and non-landslide features as training data, whereas FR–EBF results are derived solely from landslide data. The results may differ depending on the geographical location and the selection of landslide conditioning factors.
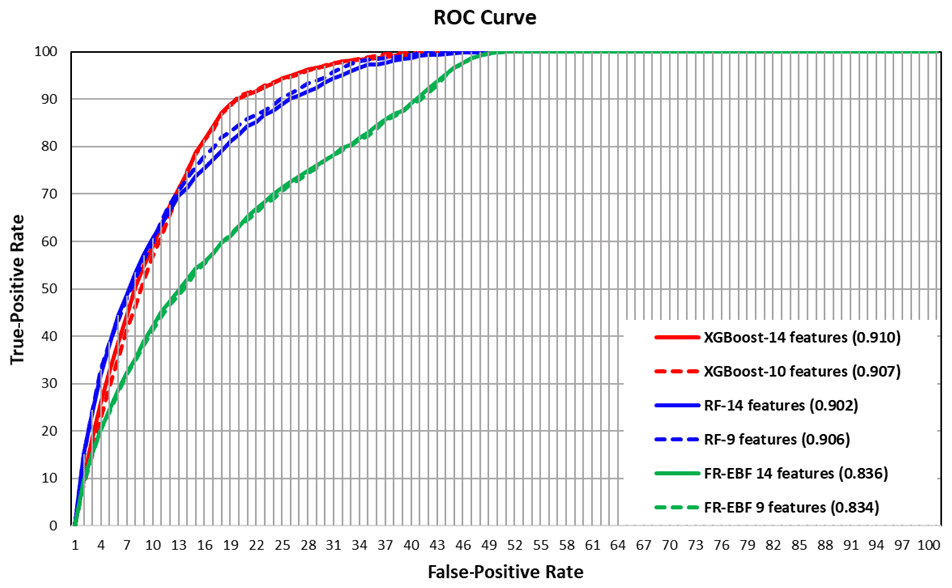
Figure 11Testing for the performance of the statistical and machine learning models for LSM in the province of Belluno, Italy.
5.2 Relative landslide density (R index)
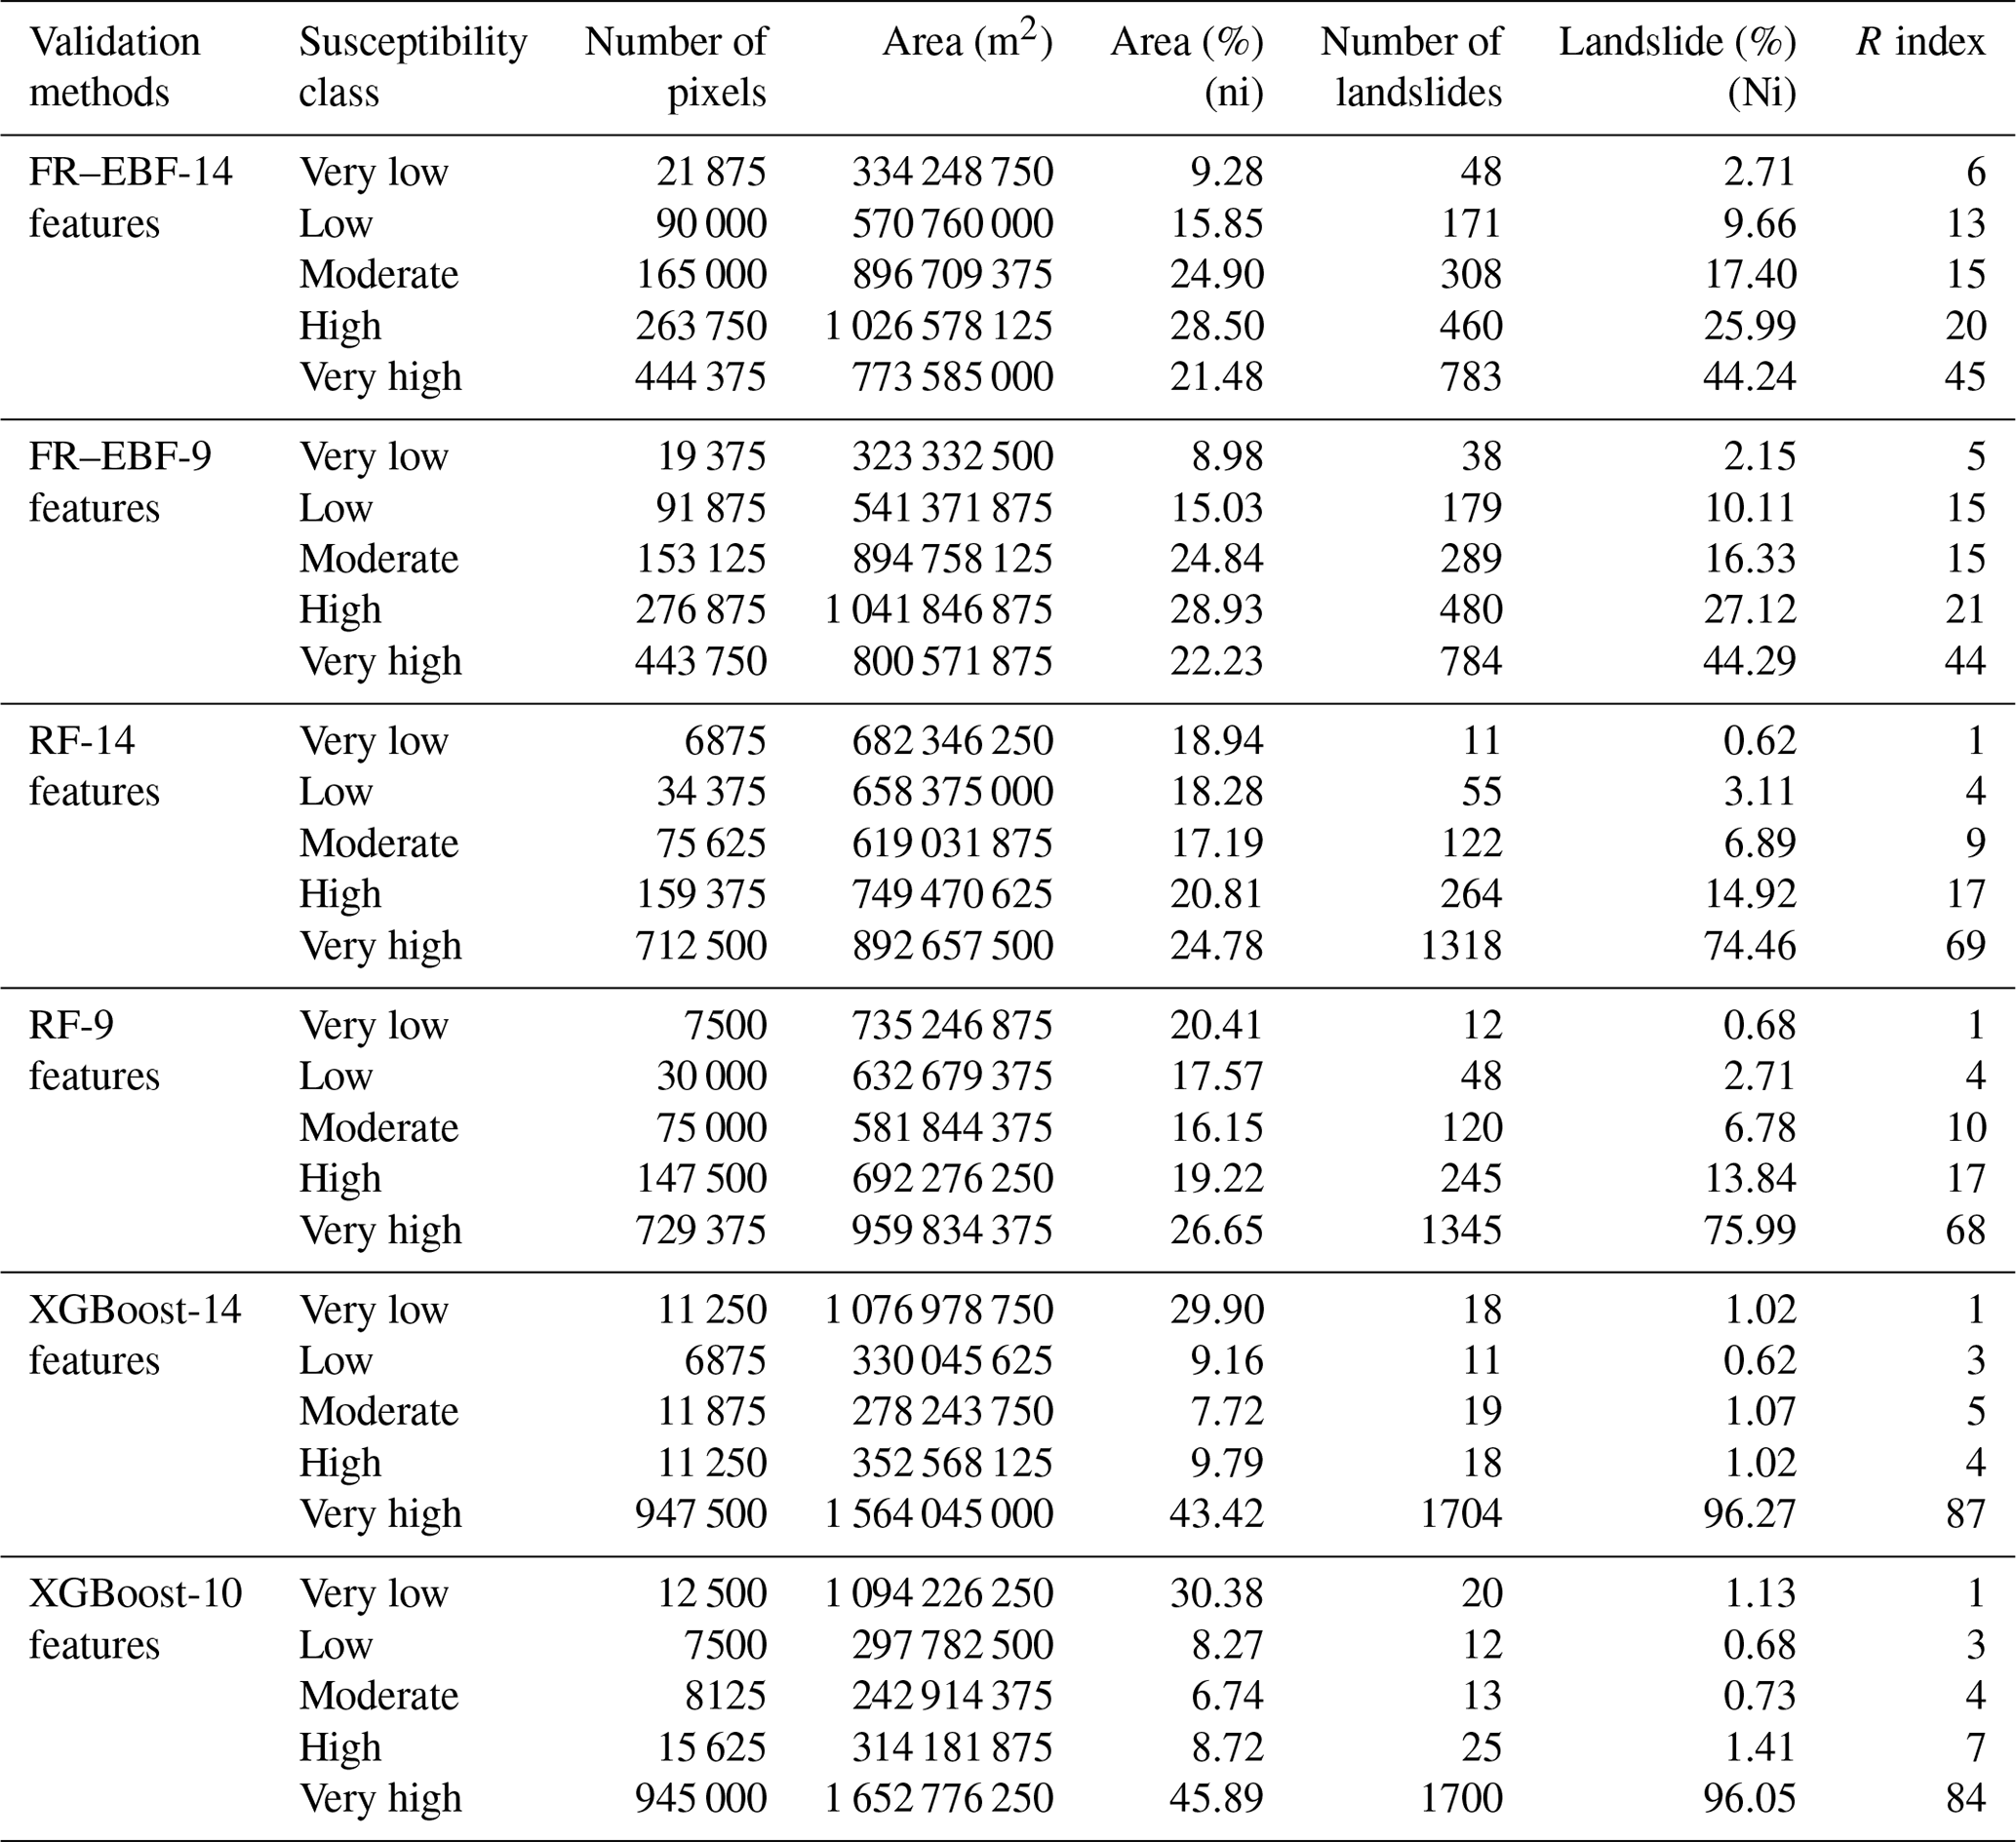
The relative landslide density index was also used to assess the accuracy of the LSM maps (R index). Equation (3) is used to get the R index:
where Ni is the percentage of landslides in each susceptibility class and ni is the percentage of area susceptible to landslides in each susceptibility class. Table 4 shows the quantile classification approach to classify the six landslide susceptibility maps into five susceptible classes. In comparison to the RF and FR–EBF models, the XGBoost model with 14 and 10 features has a higher R-index value for very high-susceptibility classes. The R-index findings show that FR–EBF has a better R-index value for the high-susceptibility class than XGBoost, which has the lowest R-index value for the high-susceptibility class. FR–EBF has a higher R-index value for the high-susceptibility class than the other three approaches. In addition, the R-index value of FR–EBF is higher for the very low-susceptibility class. Table 4 shows the R-index values for the susceptibility class in FR–EBF, RF, and XGBoost, as well as plots of the same in Fig. 12.
Table 4R indices for the FR–EBF, RF, and XGBoost models' landslide susceptibility mappings (LSMs).

Landslides are very dynamic in nature, meaning that their behaviour, movement, and spatial distribution change over space and time. Therefore, it is important to analyse the significance of the conditioning factors that lead to landslide occurrences. The relevance of the conditioning features for LSM is essential to realize which of the features had the biggest impact on the prediction of landslide occurrences. As not all conditioning factor maps be available globally, or sometimes even locally, due to reasons such as non-compliance in sharing data, data unavailability, and erroneous data structure, among others, it can be worthwhile to understand which of the available conditioning factors play an important role in LSM. For example, topographic features derived from digital elevation models such as elevation, slope, aspect, plan curvature, profile curvature, TWI, TPI, and TRI are available almost globally because of missions such as the Shuttle Radar Topography Mission (SRTM). Other features, such as distance to roads and drainage networks, that might have direct or indirect influence on the occurrence of landslides can also be easily accessed through numerous open-source platforms. However, conditioning factor maps of rainfall data derived from rain gauge stations are not easily accessible and available. In this study, we used 14 features for landslide susceptibility assessment and carried out the feature importance of the conditioning factors for the traditional statistical ensemble model of FR–EBF and machine learning models of RF and XGBoost. The feature selection approach from statistical model is dependent upon the landslide data and their relation to each feature and their classes. On the other hand, feature selection for machine learning models depends upon the landslide and non-landslide samples that are used to train the models. We used the inbuilt impurity feature importance algorithm to assess the importance of the features during the model training phases. Based on a literature review for this sort of study, there are no standard threshold values available for discarding or the selection of features for LSM. In this study, we used a trial-and-error approach to determine a threshold of 0.30 for the selection of conditioning factors used for landslide susceptibility for all the three models.
Feature importance algorithms used in this study are different; however there is similarity in the importance of the features in both statistical and machine learning algorithms (see Fig. 12).
As we look at Figs. 7–9 in the enlarged region, we observe that there are not many differences despite removing the least important features. The reason for such an observation can be linked to the lower impact of the least important factors on overall LSM results.
Furthermore, there are several factors that determine the importance of features for carrying out LSM such as the (1) completeness and quality of the landslide inventory dataset used for analysis and (2) mapping scale of the feature maps like land cover, lithology, or other geological features. If the spatial locations of landslides in an inventory do not represent the ground truth phenomenon, then there can be a negative impact of landslide input data on feature selection. The sampling methodology of landslide selection is important. There are various ways to use landslides in carrying out susceptibility assessment: many studies have used a 70–30 ratio, and others have used random sampling or k-fold sampling methods (Merghadi et al., 2018; Chen et al., 2018). One of the most important observations from this study was the reclusion of the least important factors in the context of LSM. The fact that despite the removal of certain conditioning factors, we still get very good results or comparable results after removing them, this observation explains that employing the important conditioning factors are enough for LSM.
The use of landslide samples along with non-landslide samples can affect the landslide feature importance, as can be seen in results in this study. In the case of the statistical model, one of the reasons for the lower AUC performance can be accredited to the absence of the non-landslide samples. As the model was trained without non-landslide samples and simply trained with only landslide samples, the model's ability to discriminate between the non-landslide and landslide pixels is affected, therefore, predicting landslide occurrences over non-landslide locations. Because of this reason, the statistical model exhibited a homogeneous distribution of predicted landslide pixels (see Fig. 7). We used landslides and non-landslide samples for training the ML models, which shows varying results from that of the statistical ensemble model (see Figs. 8 and 9). There is a more homogeneous distribution of landslide susceptibility classes in statistical model results, but it is evident from the machine learning results that the non-landslide samples have a greater impact on final landslide susceptibility results.
We also attempted to investigate the relative changes in the susceptibility after removing the least important factors based on the study from Xiao et al. (2020). We made difference maps by subtracting the susceptibility maps modelled with 14 conditioning factors with susceptibility maps after the removal of the conditioning factors. The differences are calculated as “FR–EBF 14-9”, “RF 14-9”, and “XG 14-10”. We wanted to assess if the obtained differences are random or follow a systematic pattern after removal of the factor maps. Because every susceptibility map's raster value is between 0 and 1, the comparison maps' values potentially vary from −1 to 1. The results of the differencing can be seen in Fig. 13, and it is very clear from difference maps for all the three models that there is a random pattern after the removal of the least important conditioning factors. The removed conditioning factors for each of the models are the following:
-
frequency ratio–evidence belief function – plan curvature, TRI, TWI, aspect, and profile curvature;
-
random forest – land cover, profile curvature, TWI, TPI, and plan curvature;
-
XGBoost – profile curvature, TWI, TPI, and plan curvature.
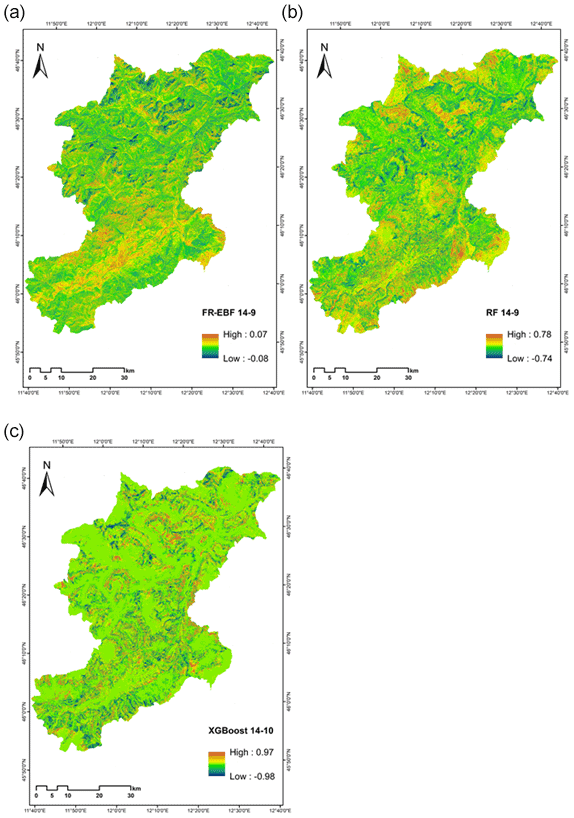
Figure 13(a–c) Three comparison maps (uniform legend: red–blue band from −1 to 1).
Conditioning factor importance for all the models was similar, such as for profile curvature, TWI, TPI, and plan curvature, which were among the least important factors for landslide susceptibility analysis in our study. The impact of these four factors on landslide susceptibility results was not much, as the ROC values and R-index values were not changed to a great extent. Also, the impact of the removal of these factors is very evident from the differencing maps shown in Fig. 13.
In the current state-of-the-art approaches for LSM, the contemporary literature puts an emphasis on different models for improving accuracy of landslide susceptibility against the test data. However, this study investigated how the conditioning factors affect the overall prediction of landslides in the context of the province of Belluno, northeastern Italy. An important aspect of this study was to identify whether removing the least important conditioning factors in the modelling process affects the performance in predicting new unknown landslides.
As understood, ML models require conditioning factors as input for LSM; however, investing on the importance of the features (conditioning factors) could possibly provide a better understanding of landslide occurrences with respect to the available conditioning factor maps for LSM. This study indicates that various models behave differently with different features, whereby the same features that are important in one instance of a particular model can be the least important in other models. Therefore, this study gives new insights into the use of already available conditioning factor maps, without exhausting resources for generating other conditioning factor maps that might not be available.
In this study we also concluded that the landslides and non-landslides samples impact the feature importance, especially in the ML models, and in contrast, the statistical model used only landslide samples. Therefore, it was found to be crucial in asserting a balance between the two data samples to avoid overfitting or underfitting. This study illustrates that feature selection is a very important step for carrying out LSMs. We found that there are differences in the final LSMs derived from the statistical and ML models, which are attributed to the above-mentioned sample selection techniques.
This research introduces the importance of post-training feature importance algorithms for LSM. This approach can also be used to assess the susceptibility of other natural disasters. The results can eventually comment on whether certain conditioning factors can be discarded while modelling landslide occurrences. In many parts of the globe, the availability of data is limited, and therefore, with the ability to model landslides without relying on the conventional factors, we can still predict landslides spatially over a given region. Although there are certain drawbacks like that (1) the same factor maps will not be available everywhere, (2) factors that are least important in one region might not repeat the same behaviour in other regions of the world, and (3) model capability changes with respect to different regions, the resulting susceptibility maps can still give quality information regarding local emergency relief measures, the planning of disaster risk reduction and mitigation, and the evaluation of potentially affected areas.
The codes of the models can be made available upon reasonable request from the corresponding author, Sansar Raj Meena, in order to avoid conflicts of interest in future publications.
The data that support the findings of this study are available from the corresponding author, Sansar Raj Meena, upon reasonable request.
In line with the CRediT (Contributor Roles Taxonomy) system, SRM, SP, KB, MF, and FC performed the roles of conceptualization, data curation, formal analysis, methodology, validation, visualization, writing of the original draft of the paper, and reviewing and editing of the paper.
At least one of the (co-)authors is a member of the editorial board of Natural Hazards and Earth System Sciences. The peer-review process was guided by an independent editor, and the authors have also no other competing interests to declare.
Publisher's note: Copernicus Publications remains neutral with regard to jurisdictional claims in published maps and institutional affiliations.
This research has been supported by the Regione del Veneto (VAIA-LAND project, 563 Research Unit UNIPD-GEO).
This paper was edited by Daniele Giordan and reviewed by three anonymous referees.
ARPAV: Cambiamenti climatici, per l'IPCC i tempi stringono, Il focus sul Veneto, https://www.arpa.veneto.it/temi-ambientali/meteo/riferimenti/documenti/documenti-meteo/IPCC E CAMBIAMENTI CLIMATICI IN VENETO.pdf (last access: 9 April 2022), 2021.
Baglioni, A., Tosoni, D., De Marco, P., and Arziliero, L.: Analisi del dissesto da frana in Veneto, ISPRA, https://www.isprambiente.gov.it/contentfiles/00003200/3228-capitolo-10-veneto.pdf (last access: 9 April 2022), 2006.
Baird, C.: Comparison of Risk Assessment Instruments in Juvenile Justice, NCCD, https://www.njjn.org/uploads/digital-library/NCCD_risk-assessment-comparison_August-2013.pdf (last access: 9 April 2022), 2013.
Boretto, G., Crema, S., Marchi, L., Monegato, G., Arziliero, L., and Cavalli, M.: Assessing the effect of the Vaia storm on sediment source areas and connectivity storm in the Liera catchment (Dolomites), in: EGU General Assembly 2021, online, 19–30 April 2021, EGU21-7643, https://doi.org/10.5194/egusphere-egu21-7643, 2021.
Brabb, E. E., Pampeyan, E. H., and Bonilla, M. G.: Landslide susceptibility in San Mateo County, California, Reston, VA, Report 360, https://doi.org/10.3133/mf360, 1972.
Breiman, L.: Random Forests, Mach. Learn., 45, 5–32, https://doi.org/10.1023/A:1010933404324, 2001.
Can, R., Kocaman, S., and Gokceoglu, C.: A Comprehensive Assessment of XGBoost Algorithm for Landslide Susceptibility Mapping in the Upper Basin of Ataturk Dam, Turkey, Appl. Sci., 11, 4993, 2021.
Castellanos Abella, E. A. and Van Westen, C. J.: Qualitative landslide susceptibility assessment by multicriteria analysis: A case study from San Antonio del Sur, Guantánamo, Cuba, Geomorphology, 94, 453–466, https://doi.org/10.1016/j.geomorph.2006.10.038, 2008.
Catani, F., Lagomarsino, D., Segoni, S., and Tofani, V.: Landslide susceptibility estimation by random forests technique: sensitivity and scaling issues, Nat. Hazards Earth Syst. Sci., 13, 2815–2831, https://doi.org/10.5194/nhess-13-2815-2013, 2013.
Chacón, J., Irigaray, C., Fernández, T., and El Hamdouni, R.: Engineering geology maps: landslides and geographical information systems, B. Eng. Geol. Environ., 65, 341–411, https://doi.org/10.1007/s10064-006-0064-z, 2006.
Chen, T., Trinder, J. C., and Niu, R.: Object-oriented landslide mapping using ZY-3 satellite imagery, random forest and mathematical morphology, for the Three-Gorges Reservoir, China, Remote Sens., 9, 333, 2017.
Chen, W., Peng, J. B., Hong, H. Y., Shahabi, H., Pradhan, B., Liu, J. Z., Zhu, A. X., Pei, X. J., and Duan, Z.: Landslide susceptibility modelling using GIS-based machine learning techniques for Chongren County, Jiangxi Province, China, Sci. Total Environ., 626, 1121–1135, https://doi.org/10.1016/j.scitotenv.2018.01.124, 2018.
Chung, C.-J. F. and Fabbri, A. G.: Validation of Spatial Prediction Models for Landslide Hazard Mapping, Nat. Hazards, 30, 451–472, https://doi.org/10.1023/B:NHAZ.0000007172.62651.2b, 2003.
Compagnoni, B., Galluzzo, F., Bonomo, R., and Tacchia, D.: Carta geologica d'Italia, Dipartimento difesa del suolo, APAT, Firenze, 2005.
Corò, D., Galgaro, A., Fontana, A., and Carton, A.: A regional rockfall database: the Eastern Alps test site, Environ. Earth Sci., 74, 1731–1742, https://doi.org/10.1007/s12665-015-4181-5, 2015.
Dahal, R. K., Hasegawa, S., Nonomura, A., Yamanaka, M., Masuda, T., and Nishino, K.: GIS-based weights-of-evidence modelling of rainfall-induced landslides in small catchments for landslide susceptibility mapping, Environ. Geol., 54, 311–324, https://doi.org/10.1007/s00254-007-0818-3, 2008.
Dai, F. C., Lee, C. F., and Ngai, Y. Y.: Landslide risk assessment and management: an overview, Eng. Geol., 64, 65–87, https://doi.org/10.1016/S0013-7952(01)00093-X, 2002.
Demir, G., Aytekin, M., Akgun, A., Ikizler, B., and Tatar, O.: A comparison of landslide susceptibility mapping of the eastern part of the North Anatolian Fault Zone (Turkey) by likelihood-frequency ratio and analytic hierarchy process methods, Nat. Hazards, 65, 1481–1506, 2013.
Desiato, F., Lena, F., Baffo, F., Suatoni, B., and Toreti, A.: Indicatori Del CLIMA in Italia Elaborati Attraverso Il Sistema SCIA, APAT, Rome, http://www.scia.isprambiente.it/wwwrootscia/Documentazione/Indicatori del clima in Italia.pdf (last access: 9 April 2022), 2005.
Doglioni, C.: Thrust tectonics examples from the Venetian Alps, Studi Geologici Camerti s.v., 117–129, http://193.204.8.201:8080/jspui/handle/1336/240 (last access: 9 April 2022), 1990.
Dunning, S., Massey, C., and Rosser, N.: Structural and geomorphological features of landslides in the Bhutan Himalaya derived from terrestrial laser scanning, Geomorphology, 103, 17–29, 2009.
Dury, G., Carson, M. A. and Kirkby, M. J.: Hillslope form and Process, Cambridge University Press, London, vii + 475 pp., https://doi.org/10.1016/0012-8252(72)90132-8), 1972.
Ercanoglu, M. and Gokceoglu, C.: Assessment of landslide susceptibility for a landslide-prone area (north of Yenice, NW Turkey) by fuzzy approach, Environ. Geol., 41, 720–730, https://doi.org/10.1007/s00254-001-0454-2, 2002.
Floris, M., Iafelice, M., Squarzoni, C., Zorzi, L., De Agostini, A., and Genevois, R.: Using online databases for landslide susceptibility assessment: an example from the Veneto Region (northeastern Italy), Nat. Hazards Earth Syst. Sci., 11, 1915–1925, https://doi.org/10.5194/nhess-11-1915-2011, 2011.
Forzieri, G., Pecchi, M., Girardello, M., Mauri, A., Klaus, M., Nikolov, C., Rüetschi, M., Gardiner, B., Tomaštík, J., Small, D., Nistor, C., Jonikavicius, D., Spinoni, J., Feyen, L., Giannetti, F., Comino, R., Wolynski, A., Pirotti, F., Maistrelli, F., Savulescu, I., Wurpillot-Lucas, S., Karlsson, S., Zieba-Kulawik, K., Strejczek-Jazwinska, P., Mokroš, M., Franz, S., Krejci, L., Haidu, I., Nilsson, M., Wezyk, P., Catani, F., Chen, Y.-Y., Luyssaert, S., Chirici, G., Cescatti, A., and Beck, P. S. A.: A spatially explicit database of wind disturbances in European forests over the period 2000–2018, Earth Syst. Sci. Data, 12, 257–276, https://doi.org/10.5194/essd-12-257-2020, 2020.
Froude, M. J. and Petley, D. N.: Global fatal landslide occurrence from 2004 to 2016, Nat. Hazards Earth Syst. Sci., 18, 2161–2181, https://doi.org/10.5194/nhess-18-2161-2018, 2018.
Gariano, S. L., Verini Supplizi, G., Ardizzone, F., Salvati, P., Bianchi, C., Morbidelli, R., and Saltalippi, C.: Long-term analysis of rainfall-induced landslides in Umbria, central Italy, Nat. Hazards, 106, 2207–2225, https://doi.org/10.1007/s11069-021-04539-6, 2021.
Ghorbanzadeh, O., Rostamzadeh, H., Blaschke, T., Gholaminia, K., and Aryal, J.: A new GIS-based data mining technique using an adaptive neuro-fuzzy inference system (ANFIS) and k-fold cross-validation approach for land subsidence susceptibility mapping, Nat. Hazards, 94, 497–517, https://doi.org/10.1007/s11069-018-3449-y, 2018.
Glade, T., Anderson, M. G., and Crozier, M. J.: Landslide hazard and risk, John Wiley & Sons, ISBN 0-471-48663-9,, 2006.
Goetz, J. N., Brenning, A., Petschko, H., and Leopold, P.: Evaluating machine learning and statistical prediction techniques for landslide susceptibility modeling, Comput. Geosci., 81, 1–11, https://doi.org/10.1016/j.cageo.2015.04.007, 2015.
Guzzetti, F., Reichenbach, P., Ardizzone, F., Cardinali, M., and Galli, M.: Estimating the quality of landslide susceptibility models, Geomorphology, 81, 166–184, https://doi.org/10.1016/j.geomorph.2006.04.007, 2006.
Huang, F., Chen, J., Du, Z., Yao, C., Huang, J., Jiang, Q., Chang, Z., and Li, S.: Landslide Susceptibility Prediction Considering Regional Soil Erosion Based on Machine-Learning Models, ISPRS Int. J. Geo-Inf., 9, 377, 2020.
Iadanza, C., Trigila, A., Starace, P., Dragoni, A., Biondo, T., and Roccisano, M.: IdroGEO: A Collaborative Web Mapping Application Based on REST API Services and Open Data on Landslides and Floods in Italy, ISPRS Int. J. Geo-Inf., 10, 89, 2021.
Komac, M.: A landslide susceptibility model using the Analytical Hierarchy Process method and multivariate statistics in perialpine Slovenia, Geomorphology, 74, 17–28, https://doi.org/10.1016/j.geomorph.2005.07.005, 2006.
Lee, S.: Landslide detection and susceptibility mapping in the Sagimakri area, Korea using KOMPSAT-1 and weight of evidence technique, Environ. Earth Sci., 70, 3197–3215, https://doi.org/10.1007/s12665-013-2385-0, 2013.
Linden, A.: Measuring diagnostic and predictive accuracy in disease management: an introduction to receiver operating characteristic (ROC) analysis, J. Eval. Clin. Pract., 12, 132–139, 2006.
Liu, L.-L., Yang, C., and Wang, X.-M.: Landslide susceptibility assessment using feature selection-based machine learning models, Geomech. Eng., 25, 1–16, 2021.
Mahalingam, R., Olsen, M. J., and O'Banion, M. S.: Evaluation of landslide susceptibility mapping techniques using lidar-derived conditioning factors (Oregon case study), Geomat. Nat. Hazards Risk, 7, 1884–1907, 2016.
Meena, S. R. and Gudiyangada Nachappa, T: Impact of spatial resolution of digital elevation model on landslide susceptibility mapping: a case study in Kullu Valley, Himalayas, Geosciences, 9, 360, https://doi.org/10.3390/geosciences9080360, 2019.
Melville, B., Lucieer, A., and Aryal, J.: Object-based random forest classification of Landsat ETM+ and WorldView-2 satellite imagery for mapping lowland native grassland communities in Tasmania, Australia, Int. J. Appl. Earth Obs., 66, 46–55, 2018.
Merghadi, A., Abderrahmane, B., and Tien Bui, D.: Landslide Susceptibility Assessment at Mila Basin (Algeria): A Comparative Assessment of Prediction Capability of Advanced Machine Learning Methods, ISPRS Int. J. Geo-Inf., 7, 268, https://doi.org/10.3390/ijgi7070268, 2018.
Meten, M., PrakashBhandary, N., and Yatabe, R.: Effect of Landslide Factor Combinations on the Prediction Accuracy of Landslide Susceptibility Maps in the Blue Nile Gorge of Central Ethiopia, Geoenvironmental Disasters, 2, 9, https://doi.org/10.1186/s40677-015-0016-7, 2015.
Micheletti, N., Foresti, L., Robert, S., Leuenberger, M., Pedrazzini, A., Jaboyedoff, M., and Kanevski, M.: Machine Learning Feature Selection Methods for Landslide Susceptibility Mapping, Math. Geosci., 46, 33–57, https://doi.org/10.1007/s11004-013-9511-0, 2014.
Mondal, S. and Maiti, R.: Integrating the analytical hierarchy process (AHP) and the frequency ratio (FR) model in landslide susceptibility mapping of Shiv-khola watershed, Darjeeling Himalaya, Int. J. Disast. Risk Sc., 4, 200–212, 2013.
Pham, B. T., Tien Bui, D., Pourghasemi, H. R., Indra, P., and Dholakia, M. B.: Landslide susceptibility assesssment in the Uttarakhand area (India) using GIS: a comparison study of prediction capability of naïve bayes, multilayer perceptron neural networks, and functional trees methods, Theor. Appl. Climatol., 128, 255–273, https://doi.org/10.1007/s00704-015-1702-9, 2015.
Pham, B. T., Tien Bui, D., and Prakash, I.: Bagging based Support Vector Machines for spatial prediction of landslides, Environ. Earth Sci., 77, 146, https://doi.org/10.1007/s12665-018-7268-y, 2018.
Pourghasemi, H. R., Pradhan, B., and Gokceoglu, C.: Application of fuzzy logic and analytical hierarchy process (AHP) to landslide susceptibility mapping at Haraz watershed, Iran, Nat. Hazards, 63, 965–996, 2012.
Pourghasemi, H. R., Yansari, Z., Panagos, P., and Pradhan, B.: Analysis and evaluation of landslide susceptibility: a review on articles published during 2005–2016 (periods of 2005–2012 and 2013–2016), Arab. J. Geosci., 11, 1–12, 2018.
Pradhan, B.: Landslide susceptibility mapping of a catchment area using frequency ratio, fuzzy logic and multivariate logistic regression approaches, J. Indian Soc. Remote, 38, 301–320, https://doi.org/10.1007/s12524-010-0020-z, 2010.
Raja, N. B., Çiçek, I., Türkoğlu, N., Aydin, O., and Kawasaki, A.: Landslide susceptibility mapping of the Sera River Basin using logistic regression model, Nat. Hazards, 85, 1323–1346, https://doi.org/10.1007/s11069-016-2591-7, 2017.
Reichenbach, P., Rossi, M., Malamud, B. D., Mihir, M., and Guzzetti, F.: A review of statistically-based landslide susceptibility models, Earth-Sci. Rev., 180, 60–91, https://doi.org/10.1016/j.earscirev.2018.03.001, 2018.
Riley, S. J., DeGloria, S. D., and Elliot, R.: Index that quantifies topographic heterogeneity, Intermountain Journal of Sciences, 5, 23–27, 1999.
Rossi, M., Guzzetti, F., Salvati, P., Donnini, M., Napolitano, E., and Bianchi, C.: A predictive model of societal landslide risk in Italy, Earth-Sci. Rev., 196, 102849, https://doi.org/10.1016/j.earscirev.2019.04.021, 2019.
Ruff, M. and Czurda, K.: Landslide susceptibility analysis with a heuristic approach in the Eastern Alps (Vorarlberg, Austria), Geomorphology, 94, 314–324, 2008.
Sahin, E. K.: Assessing the predictive capability of ensemble tree methods for landslide susceptibility mapping using XGBoost, gradient boosting machine, and random forest, SN Applied Sciences, 2, 1308, https://doi.org/10.1007/s42452-020-3060-1, 2020.
Sauro, F., Zampieri, D., and Filipponi, M.: Development of a deep karst system within a transpressional structure of the Dolomites in north-east Italy, Geomorphology, 184, 51–63, https://doi.org/10.1016/j.geomorph.2012.11.014, 2013.
Schönborn, G.: Balancing cross sections with kinematic constraints: The Dolomites (northern Italy), Tectonics, 18, 527–545, 1999.
Segoni, S., Pappafico, G., Luti, T., and Catani, F.: Landslide susceptibility assessment in complex geological settings: Sensitivity to geological information and insights on its parameterization, Landslides, 17, 2443–2453, 2020.
Senouci, R., Taibi, N.-E., Teodoro, A. C., Duarte, L., Mansour, H., and Yahia Meddah, R.: GIS-Based Expert Knowledge for Landslide Susceptibility Mapping (LSM): Case of Mostaganem Coast District, West of Algeria, Sustainability, 13, 630, 2021.
Shahabi, H. and Hashim, M.: Landslide susceptibility mapping using GIS-based statistical models and Remote sensing data in tropical environment, Sci. Rep., 5, 9899, 2015.
Shahabi, H., Khezri, S., Ahmad, B. B., and Hashim, M.: Landslide susceptibility mapping at central Zab basin, Iran: a comparison between analytical hierarchy process, frequency ratio and logistic regression models, Catena, 115, 55–70, 2014.
Stanley, T. A., Kirschbaum, D. B., Benz, G., Emberson, R. A., Amatya, P. M., Medwedeff, W., and Clark, M. K.: Data-Driven Landslide Nowcasting at the Global Scale, Front. Earth Sci., 9, 640043, https://doi.org/10.3389/feart.2021.640043, 2021.
Tay, L. T., Lateh, H., Hossain, M. K., and Kamil, A. A.: Landslide hazard mapping using a poisson distribution: a case study in Penang Island, Malaysia, in: Landslide science for a safer geoenvironment, Springer, Cham, 521–525, https://doi.org/10.5923/c.jce.201402.12, 2014.
Trigila, A. and Iadanza, C.: Landslides and floods in Italy: hazard and risk indicators – Summary Report 2018, ISPRA, ISBN 978-88-448-0901-0, 2018.
Trigila, A., Iadanza, C., and Spizzichino, D.: Quality assessment of the Italian Landslide Inventory using GIS processing, Landslides, 7, 455–470, https://doi.org/10.1007/s10346-010-0213-0, 2010.
van Westen, C. J., Castellanos, E., and Kuriakose, S. L.: Spatial data for landslide susceptibility, hazard, and vulnerability assessment: An overview, Eng. Geol., 102, 112–131, https://doi.org/10.1016/j.enggeo.2008.03.010, 2008.
Xiao, T., Segoni, S., Chen, L., Yin, K., and Casagli, N.: A step beyond landslide susceptibility maps: a simple method to investigate and explain the different outcomes obtained by different approaches, Landslides, 17, 627–640, 2020.
Youssef, A. M. and Pourghasemi, H. R.: Landslide susceptibility mapping using machine learning algorithms and comparison of their performance at Abha Basin, Asir Region, Saudi Arabia, Geosci. Front., 12, 639–655, https://doi.org/10.1016/j.gsf.2020.05.010, 2021.