the Creative Commons Attribution 4.0 License.
the Creative Commons Attribution 4.0 License.
Long-term hazard assessment of explosive eruptions at Jan Mayen (Norway) and implications for air traffic in the North Atlantic
Beatriz Martínez Montesinos
Sara Barsotti
Laura Sandri
Arnau Folch
Leonardo Mingari
Giovanni Macedonio
Antonio Costa
Volcanic eruptions are among the most jeopardizing natural events due to their potential impacts on life, assets, and the environment. In particular, atmospheric dispersal of volcanic tephra and aerosols during explosive eruptions poses a serious threat to life and has significant consequences for infrastructures and global aviation safety. The volcanic island of Jan Mayen, located in the North Atlantic under trans-continental air traffic routes, is considered the northernmost active volcanic area in the world with at least five eruptive periods recorded during the last 200 years. However, quantitative hazard assessments on the possible consequences for the air traffic of a future ash-forming eruption at Jan Mayen are nonexistent. This study presents the first comprehensive long-term volcanic hazard assessment for the volcanic island of Jan Mayen in terms of ash dispersal and concentration at different flight levels. In order to delve into the characterization and modeling of that potential impact, a probabilistic approach based on merging a large number of numerical simulations is adopted, varying the volcano's eruption source parameters (ESPs) and meteorological scenario. Each ESP value is randomly sampled following a continuous probability density function (PDF) based on the Jan Mayen geological record. Over 20 years of meteorological data is considered in order to explore the natural variability associated with weather conditions and is used to run thousands of simulations of the ash dispersal model FALL3D on a 2 km resolution grid. The simulated scenarios are combined to produce probability maps of airborne ash concentration, arrival time, and persistence of unfavorable conditions at flight levels 50 and 250 (FL050 and FL250). The resulting maps can serve as an aid during the development of civil protection strategies, to decision-makers and aviation stakeholders, in assessing and preventing the potential impact of a future ash-rich eruption at Jan Mayen.
- Article
(14680 KB) - Full-text XML
- BibTeX
- EndNote
Along with earthquakes, tsunamis, and weather extremes, explosive volcanic activity is among the most threatening natural hazards, with the potential to contribute to global warming and environmental changes (Ward, 2015). The impacts of volcanic emissions can extend over large distances from the source, posing a threat to human health and jeopardizing air navigation. Some recent examples of events leading to losses worth millions of US dollars due to air traffic disruption include the eruptions in Eyjafjallajökull (Iceland, 2010), Grímsvötn (Iceland, 2011), and Puyehue-Cordón Caulle (Chile, 2011) (Mazzocchi et al., 2010; Oxford-economics, 2010; Tesche et al., 2012; Karlsdóttir et al., 2012; Budd et al., 2011; Elissondo et al., 2016). These events were a stark reminder of the importance of volcanic hazard assessment and the related quantification of impacts of future eruptions, both essential tools to inform governments, aviation stakeholders, and society in general, contributing, in this way, to their preparedness. However, inferring what will be the impact of the next eruption is still a challenge for volcanologists, especially in the case of poorly characterized volcanoes. Classically, this can be done in two different ways: (1) by using the available information on the eruptive history of the volcano or (2) by using monitoring data and direct observations of the ongoing phenomena during a volcanic crises. The first case is what we call long-term hazard assessment, usually intended for cost–benefit analysis, long-term planning, and mitigation action design (Marzocchi et al., 2006), whereas the second one is a short-term hazard assessment that eventually would become a more deterministic forecasting tool for supporting the definition of emergency procedures.
In 2019, before the COVID-19 pandemic aviation break, Icelandic airports received around 8 million passengers (7 million international and 0.7 million domestic) on a total of 181 000 flights (Isavia, 2019). In turn, polar air traffic routes had shown a marked increase over the last few years, with a 15-fold increase between 2003 and 2015, reaching more than 14 000 flights a year from 2016 (NavCanada, 2017; Stewart-Green, 2016).
Although Jan Mayen (JM) volcano tephrochronology reveals at least eight eruptive periods over the last 600 years, five of them concentrated in the last 200 years (Gjerløw et al., 2016), the potential impact on air traffic following a future ash-forming eruption has never been assessed. According to Gjerløw et al. (2016), the most likely volcanism at JM is characterized by effusive Hawaiian to violent Strombolian eruptions and, to a lesser extent, by lava domes and Surtseyan eruptions. However, due to the possibility of magma interacting with seawater, snow, or ice, the likelihood of moderately to highly explosive eruptions is considerable. Historical distal records of trachytic tephra found in Ireland (Hunt, 2004) and basaltic tephra found in older sedimentary records in the North Atlantic (Lacasse and Garbe-Schönberg, 2001; Brendryen et al., 2010; Voelker and Haflidason, 2015) and in Greenland ice cores (Abbott and Davies, 2012) show the potential for producing Plinian explosive eruptions, whose size and frequency are, however, highly uncertain.
This paper presents the first comprehensive long-term probabilistic volcanic hazard assessment (PVHA) for the volcanic island JM focused on the potential impact of the airborne tephra concentration on Arctic and North Atlantic air routes. This is done by using the FALL3D model (Folch et al., 2009, 2020) to simulate the transport of ash clouds and their concentration at two relevant flight levels over a geographical area of approx 2000 km × 2000 km covering Iceland and the UK.
To account for the natural variability in volcanic eruption intensity, vent position, and wind field, two main steps have been followed as suggested in Sandri et al. (2016).
Firstly, based on field data, the possible eruptive classes for the JM volcano are identified and the probability density function (PDF) describing the relative probability of the different classes occurring is defined. For each class, a PDF for each eruptive parameter (such as eruption duration or total erupted mass) is defined in order to account for the natural variability in the eruption conditions. Then, by randomly sampling these PDFs, a large dataset of eruption source parameters (ESPs) to be used as model input is generated. A novel strategy is proposed to treat and describe the styles of pulsating eruptions, characterized by a series of discrete short-lived events followed by occasional interruption of tephra emission. Secondly, to fully explore the natural variability in the meteorological conditions, the numerical simulations have been randomly initialized within the period 1999–2020 (21 years). The meteorological data have been obtained from the ERA5 reanalysis dataset and FALL3D used to generate thousands of simulations per representative eruptive scenario. As a result, the following questions are answered:
-
What is the probability that, in the case of an eruption at JM, the ash cloud concentration will exceed the critical conditions for safe flights within a domain extending down to the UK airspace at 3, 6, 12, 18, and 24 h after the beginning of the eruption?
-
In the case of an eruption at JM, what is the probability that airports in Iceland and the UK will be affected by the presence of ash?
-
What is the probability of exceeding a predefined hazardous temporal persistence of unsafe flight conditions?
-
Which flight level (FL) is likely to be predominantly affected by critical concentrations of volcanic ash?
The rest of the paper is organized as follows: Sect. 2 provides a historical overview of the Holocene volcanic activity of the JM volcano. Section 3 describes the most likely eruptive classes based on the five known historical eruptions of JM, fits them into a PDF for the total erupted volume, addresses a novel strategy to treat them, and describes the styles of pulsating eruptions. Sections 4 and 5 present results and discussions. Finally, Sect. 6 concludes the study.
JM is a Norwegian volcanic island located in the North Atlantic Ocean at 71∘ N, 8∘ W around 600 km north of Iceland, in the Norwegian Greenland Sea (Fig. 1). According to Kandilarov et al. (2012) and Larsen et al. (2021), the Jan Mayen microcontinent (JMMC, Fig. 2a) is a structural entity enclosing the Jan Mayen Ridge (JMR) and the surrounding area, including the Jan Mayen Basin (JMB), the Jan Mayen Basin South (JMBS), the Jan Mayen Trough (JMT), and the Southern Ridge Complex (SRC) (see Fig. 2b). To the north, the JMMC is bordered by the Jan Mayen Fracture Zone (JMFZ) and the volcanic complex of Jan Mayen, while to the south, east, and west it is bordered by the NE coastal shelf of Iceland (NIS), the Norway Basin, and the Kolbeinsey Ridge (KBR) respectively (Fig. 2a). Although the historical activity reports at least five eruptive periods over the last 200 years (since the discovery of the island at the beginning of the 17th century) (Gjerløw et al., 2016), its Holocene eruptive history is basically unknown. In this sense, the eruptive history of JM comprises only a very few distal sediment cores as well as lava flows and tephra deposits from eruptions on the ice-free parts of the Beerenberg volcano. Distal records of trachytic tephra found in Ireland (Hunt, 2004) and basaltic tephra found in older sediment records in the North Atlantic (Lacasse and Garbe-Schönberg, 2001; Brendryen et al., 2010; Voelker and Haflidason, 2015) and in Greenland ice cores (Abbott and Davies, 2012) have shown the potential for explosive ash-forming eruptions, whose size, frequency, and potential impact are, however, uncertain. According to Imsland (1978), explosive hydromagmatic eruptions were common earlier in the history of JM. Nevertheless, as the island grew above sea level, such eruptions became less frequent and the volcanism essentially localized in two different regions: (1) the Beerenberg central volcano and its flank eruptions in the northeastern part (called Nord-Jan) and (2) the volcanic ridge extending from the middle to the southwestern part (called Midt-Jan and Sør-Jan respectively). On one hand, considering that the higher altitudes of the volcano are ice-covered and glacier tongues extend down to sea level at several locations, the Holocene eruptions from the summit crater are difficult to map, and no tephra layers have been positively linked to eruptions from the summit. Only a few land-based tephra records on the ice-free areas of Beerenberg have been mapped with some detail. Based on several sediment cores, Gjerløw et al. (2016) conclude that the Holocene volcanism on Beerenberg has been effusive or mildly explosive. As a result, the most common forms of recognized volcanic activity at Beerenberg are flank eruptions in the form of basaltic fissure and Strombolian to violent Strombolian eruptions. Eruption frequency is difficult to assess due to scarce reconstruction data. However, during historical times, the Beerenberg's eruption rate was around one eruption every 60–70 years, with eruptive phases lasting in the range of days to months. During the most recent effusive eruption in 1970, the largest known one during the Holocene, the volume of lava flows was at least 0.5 km3 dense rock equivalent (DRE) (Siggerud, 1972). On the other hand, volcanism on Midt-Jan and Sør-Jan represents mostly effusive eruptions characterized by scoria cones, shallow marine to coastal phreatomagmatic eruptions, coulees, and domes (Larsen and Guðmundsson, 2016; Gjerløw et al., 2015). The eruption frequency on this part of JM is also difficult to assess due to erosion and the superimposition of newer vents (possibly covering and removing older ones). However, considering visible evidence, the (under) estimated number of eruptions over the last 10 000 years is around 45, resulting in an eruption frequency of 1 eruption every 220 years. The duration of the eruptions from Midt-Jan and Sør-Jan is still unknown. The unrest episode recorded in 1732 (Eggøya, Midt-Jan), which led to the largest known explosive eruption, was a Surtseyan eruption that dispersed tephra over large parts of JM and the surrounding seas. The volume of tephra ranges between 0.3–0.4 km3 (Gjerløw et al., 2015).
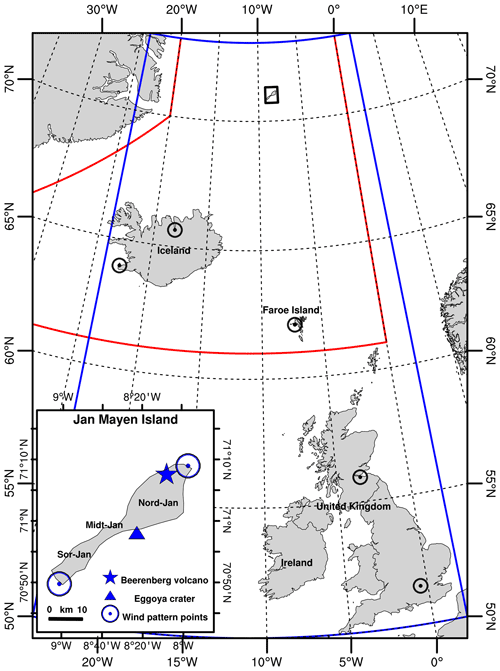
Figure 1JM location and computational domain for the JM PVHA including Iceland, Ireland, and the United Kingdom (blue box). The red contour shows the FIR (flight information region) for which the Icelandic Meteorological Office is responsible (for visualization purposes only). The blue star and triangle on the zoomed-in map indicate the location of the Beerenberg volcano and Eggøya crater (1732 Surtseyan eruption) respectively. The two blue circles show the two hypothetical vent locations in the wind profile analysis. Black circles correspond to Keflavik and Akureyri (Iceland), Vágar (Faroe Islands), Edinburgh (Scotland), and Heathrow (London, UK) airports. Nord-Jan, Midt-Jan, and Sør-Jan correspond to the three areas into which JM is classically divided.
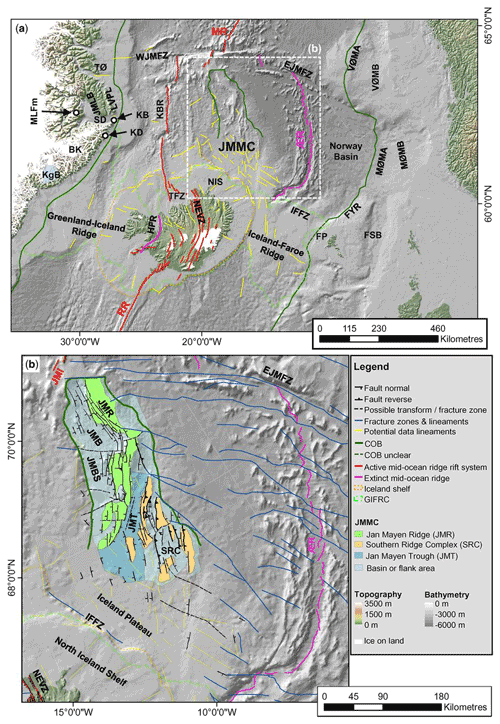
Figure 2Overview map (a) of the study area with the location of structural elements identified in potential field data. Structural elements map (b) for the Jan Mayen microcontinent (JMMC): mapped faults, fractures zones, and lineaments based on Peron-Pinvidic et al. (2012) and Gernigon et al. (2015). The background image is shaded bathymetry (IBCAO 3.0; Jakobsson et al., 2012; Amante and Eakins, 2009). Image retrieved from Blischke et al. (2017).
3.1 Eruption scenarios
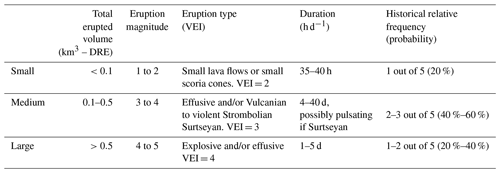
Despite the limitations of a complete geological record composed of both chronological and statistical data, the possible relative eruptive scenarios at JM are based on five known historical and prehistorical eruptions. According to the categorization proposed by Larsen and Guðmundsson (2016) and Gjerløw et al. (2016), eruption scenarios can be characterized by small (<0.1 km3), moderate (0.1–0.5 km3), and large (>0.5 km3) DRE volumes or magnitudes (see Table 1) (Pyle, 2015) and sub-Plinian eruptions.
-
Small eruptions are mostly effusive events characterized by small lava flows or small scoria cones, with erupted volumes ranging 107–108 m3 (total less than 0.1 km3 DRE), corresponding to eruption magnitudes of 1 to 2; hence the volcanic explosivity index (VEI) is 2 (Newhall and Self, 1982). Based on historical occurrences, this scenario can last for about 35–40 h.
-
Medium eruptions include subaerial, subglacial, and even Surtseyan eruptions depending on within which environment they occur. Subaerial eruptions would be mainly located on Beerenberg volcano, and they are expected to be effusive and/or Vulcanian to violent Strombolian. When effusive, medium eruptions are characterized by not only aa lavas but also pahoehoe flows. Surtseyan eruptions are expected to be located on JM and in the surrounding shallow part of the ocean. These eruptions consist of phreatomagmatic pulses, each of which, according to observations, can last for approximately 0.5–8 d, generate volcanic plumes between 3 and 11 km a.s.l. (above sea level), and have a range of total erupted volume of 108–108.7 m3 (0.1–0.5 km3 DRE), corresponding to eruption magnitudes 3 to 4, and VEI = 3. The total duration of the eruption is not well constrained, as it can last between approximately 4 d and 1 month. As a result, tephra-forming phases are expected, producing deposits more than 1 m thick within 5 km of the vent. The reference eruption for the Surtseyan type is the 1732 CE Eggøya eruption that produced at least 0.3–0.4 km3 of tephra (0.16–0.21 km3 DRE) (Gjerløw et al., 2015, 2016).
-
Large eruptions are expected to be initially subglacial and include moderate to sub-Plinian eruptions. During the opening phases, due to magma–ice interaction, the activity is explosive and characterized by plume heights reaching more than 10 km a.s.l. and a range of total erupted volume of 108.7–109 m3 (total volume emitted > 0.5 km3 DRE), corresponding to eruption magnitudes of 4 to 5, and VEI = 4. In this initial short-lasting explosive phase, a very small amount of tephra is expected to be ejected (approximately 5 % of the total erupted mass). The reference eruption for this type is the 1970 event that produced at least 0.5 km3 DRE (Siggerud, 1972). As the eruption proceeds, it becomes more effusive, lasting for 1–4 d.
-
Very large eruptions include sub-Plinian to Plinian eruptions characterized by column heights from 15 km to 25 km a.s.l. and a range of total erupted volume of 109–109.7 m3, hence with eruption magnitudes of 5 to 6, corresponding to sub-Plinian type I or VEI ≥ 5. According to Gjerløw et al. (2016), there is evidence in geological records (extending beyond the Holocene) of 10 tephra layers from sub-Plinian and/or Plinian events in 119 000 years. Because of this, we assign a subjective probability of 1 % to this class in the case of an eruption.
Table 1Possible relative eruption scenarios on JM. The categorization is based on the volume of tephra emitted in DRE. Data obtained from Larsen and Guðmundsson (2016) and Gjerløw et al. (2016). According to the geological record (extending beyond the Holocene), sub-Plinian/Plinian events are highly unlikely (1 %). Because of this, they are not included in this table.
3.2 Probabilistic hazard assessment approach
Until a few years ago, volcanic hazard assessment was largely based on the concept of the “eruptive scenario”, characterized by subjectively defined eruption conditions. Hazard was then quantified under the strong assumption that the next eruption from a given volcano would be similar to the selected “representative eruptive scenario” (Macedonio et al., 2008; Barsotti et al., 2018). However, when assuming a representative eruptive scenario, one is implicitly neglecting the large uncertainties (both aleatory and epistemic) in the parameters that define the scenario, also called “intra-size variability” (Woodhouse et al., 2015; Harvey et al., 2018). More recent approaches try to circumvent the effects of natural variability by averaging hundreds of simulations where eruption parameters are sampled within a broad set of eruptive conditions in the so-called “eruption range scenarios” (Bonadonna et al., 2005; Folch and Sulpizio, 2010; Prata et al., 2019). However, the use of a specific and limited range of eruption parameters continues to introduce a large bias and uncertainties into the description of potential eruptive processes. For this reason, more recent approaches are based on the concept of a continuum of possible combinations of eruptive parameters, which translates into exploring a large set (many thousands) of simulations as proposed by Sulpizio et al. (2012) and Sandri et al. (2016). Eruption parameters (e.g., total erupted mass, duration of the fallout phase, mass eruption rate, total grain size distribution) are defined and randomly sampled from specific probability distributions (Sandri et al., 2016). The processes for sampling and weighting possible statistical combinations of values for the volcanological parameters correspond to their probability of occurrence: this allows giving more/less weight to more/less likely combinations. In order to explore the intra-size variability, we proceed as in Sandri et al. (2016):
-
A very broad range of possible eruptive scenarios, characterized by the total erupted volume, are selected as explained in Sect. 3.1.
-
The total erupted volume is used to define the total erupted mass, the eruption magnitude, and the VEI.
-
The eruptive range is split into eruption classes linked to representative members (see Sect. 3.1), each characterized by an approximate conditional probability in the geological and historical record (see Table 1).
-
Over the total range of possible erupted volumes (approximately 107–1010 m3), up to six different truncated probability density functions (PDFs) are tested to describe the conditional probability of these four mutually exclusive classes: normal, exponential, log-logistic, lognormal, gamma, and Weibull. The best model is selected according to Akaike's information criterion (AIC) (Bozdogan, 1987; Akaike, 1998), where the relative goodness of fit of such PDFs (i.e., the likelihood of the catalog's frequencies of the different eruptive classes, under different PDFs) is compared, penalized by the number of parameters. The PDF with the lowest AIC is considered the best among all the specified ones. Indeed, the assumption of a common PDF for the total erupted volume across the different eruption classes allows smooth and coherent linking among them (Sandri et al., 2016). For JM, the Weibull PDF better fitted the expected frequencies on the sub-ranges for the four different eruption classes. This PDF has been used to assign a conditional probability of occurrence to each simulation as a function of the associated total erupted volume (see Fig. 3).
-
Considering the behavior of similar scenarios including wet plumes, for medium and large classes we account for ash aggregation assuming two different aggregate types characterized by densities in the range of 250 and 350 kg m−3 and diameters between 100 and 250 µm.
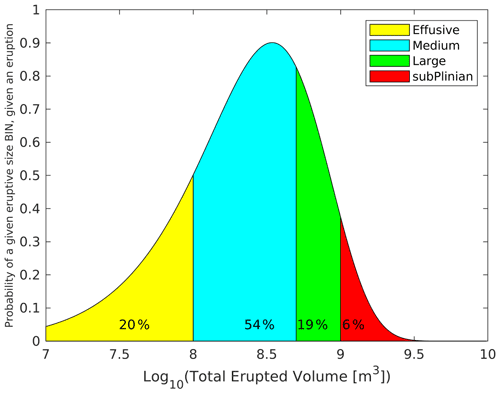
Figure 3Weibull PDF describing the conditional probability of different eruptive magnitudes in the case of an eruption at JM. The four colors cover the erupted volume ranges in the four “classical” eruption classes for JM, classically synthesized into four representative scenarios with a fixed mass, neglecting the variability in volume around these scenarios. The area under the different parts of the plot corresponds to the probability of an effusive, medium, large, and sub-Plinian class range eruption respectively, conditional to eruption occurrence. These values are in agreement with previous studies for JM (Larsen et al., 2017; Gjerløw et al., 2016).
3.3 Pulsating eruptions – modeling and strategy
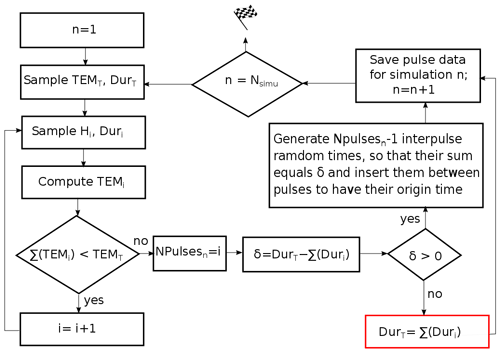
A novel strategy is proposed to describe the styles and model dispersal from pulsating eruptions (Surtseyan eruptions, belonging to the medium class in Table 1), characterized by a series of discrete short-lived events followed by occasional interruption of the emission of tephra. The strategy has been developed considering the ranges of all the ESPs described in Sect. 3.1. For each pulsating scenario, the ESPs associated with the column shape, total grain size distribution, and sphericity of tephra particles are also sampled from given PDFs. However, the difference is that column heights are not derived from the mass eruption rate but using the following approach (see Fig. 4).
-
Random sampling is undertaken of both the total erupted mass (TEMT) and the total duration of the eruption (DurT) considering values reflected in Sect. 3.1.
-
If the sum of masses erupted by all pulses does not equal or exceed the total erupted mass previously sampled, loop to the following:
-
Create the ith pulse, sampling randomly column height (Hi) and duration (Duri). The duration is sampled from a normal distribution consistent with the data reflected in Table 1. The column height is sampled from a triangular distribution with the lower limit at 3 km, peak at 6 km, and upper limit at 11 km a.s.l.
-
Compute the total erupted mass for such a pulse (TEMi) using the Mastin et al. (2009) relationship.
-
Compute ( (TEMi)), with n being the number of pulses generated so far.
-
If > 0.97 ⋅ TEMT and < TEMT, modify TEMi to obtain (TEMi) = TEMT, thereby avoiding small pulses. Compute the new column height (Hi) using Mastin et al. (2009).
-
Else, if total erupted mass obtained < TEMT, save the pulse. Otherwise, discard the pulse.
-
-
-
Compute the duration of the eruption as the sum of the duration of all the pulses . If , generate n−1 inter-pulses at a random time (Resi) so that their sum equals δ () and insert them between pulses. Otherwise, if , update DurT to equal . This case actually supposes a continuous eruption where each pulse occurs without a rest period.
3.4 Vent location sensitivity
Given the scales of JM and the considered domain, the effects of the uncertain vent location on the resulting long-range hazard assessment can be expected to be negligible. In order to check this assumption, we inspected how ERA5 wind profiles vary along the island by focusing on two vent locations at the NE (71.15∘ N, 7.95∘ W) and SW (70.82∘ N, 9.02∘ W) edges of the island, approximately 55 km apart (blue circles in Fig. 1 inset). At these locations we inspected the following:
-
Local wind profiles. Figure 5 shows vertical profiles of the wind speed and direction averaged for the whole month of December 2019. As observed, there are few differences in patterns between the two locations.
-
Annual wind profiles. Figure 6 shows the wind profiles averaged monthly for the year 2018. Once again, there are no differences between the two locations.
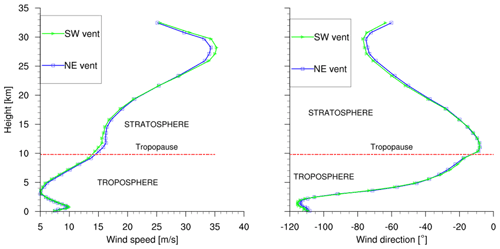
Figure 5Monthly averaged ERA5 wind profiles (speed and direction) at two different locations (NE and SW) of JM.
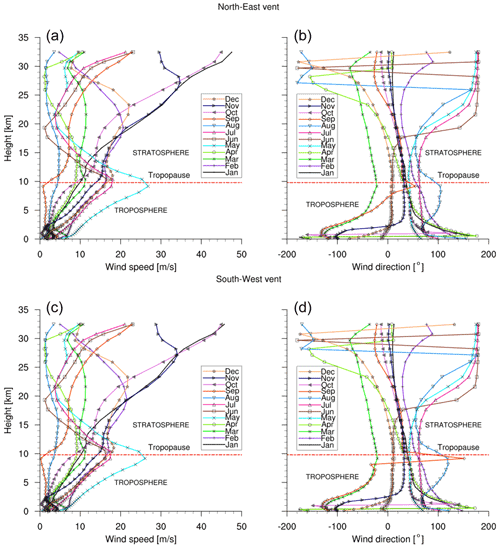
Figure 6Monthly comparison of the wind pattern computed in two different locations (NE and SW) for a whole year, 2018. (a, b) Wind patterns corresponding to the NE vent. (c, d) Wind patterns corresponding to the SW vent. Results were obtained by averaging 1 year of ERA5 data.
Considering the current limitation of both the grid resolution and the meteorological data resolution, the location of potential JM vents does not influence the ash dispersal pattern. As a result, we will not consider the uncertainty of the vent location and we assume a fixed vent in the middle of the island.
Hazard and probability maps (Elefante et al., 2010) are powerful tools to inform users about the spatial and temporal potential impact of specific volcanic phenomena. Commonly, they consist of exceedance probability curves, referred to as hazard curves (Hill et al., 2013). These hazard curves quantify, in a grid point of the target domain and within a specific time window (exposure time) (Budnitz et al., 1997), the exceedance probability of an intensity measure threshold for a specific phenomenon (e.g., tephra load at ground level or airborne tephra concentration).
Our objective is to show the usefulness of probabilistic volcanic hazard assessment in the framework of high-performance computing, evaluating the impact of low-probability but high-consequence events on air traffic (between Iceland and the UK; see Fig. 1) from a potential eruption at JM while quantifying how the ESPs and wind patterns (velocity and direction) influence hazard and probability maps of ash dispersal and airborne tephra concentration.
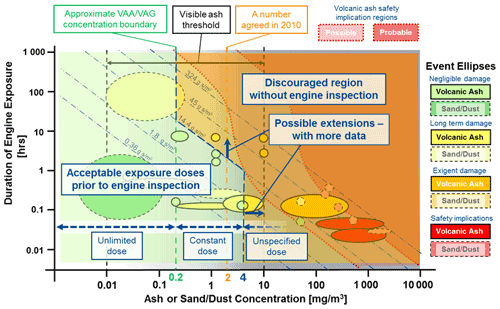
Figure 7Overview of volcanic ash or sand/dust impacts on jet engines. Modified from a Rolls-Royce review of aircraft encountering airborne particle clouds (Ellis et al., 2021; Clarkson et al., 2016).
Although our method allows analyzing any desired FL, in this work, only FL050 and FL250 (approx. 1.5 and 7.5 km a.s.l.) will be analyzed. Such FLs were selected considering standard cruise and maximum risk action altitudes like takeoff or landing. Finally, three selected ash concentration thresholds (0.2, 2, and 4 mg m−3) were selected based on the impacts of volcanic ash on jet engines summarized in Fig. 7 and the considerations included in the Volcanic Ash Contingency Plan published by the International Civil Aviation Organization (ICAO, 2021). As a result, we analyze the results using isolines at FL050 and FL250 for these three selected ash concentration thresholds through three different types of probabilistic map:
-
arrival time maps – the expected time required for the ash concentration to exceed 2 mg m−3 at FL050 with an exceedance probability of 5 %, between 0 and 48 h since the beginning of the eruption;
-
exceedance probability maps – reporting the probability of reaching ash concentration above a given threshold (0.2, 2, and 4 mg m−3) at FL050 and FL250 at some time from the onset of the eruption to up to 48 h after its end;
-
persistence maps – showing the fraction of hours (since the beginning of the eruption) during which the ash concentration exceeds a given threshold (0.2, 2, and 4 mg m−3) with a probability larger than 5 %.
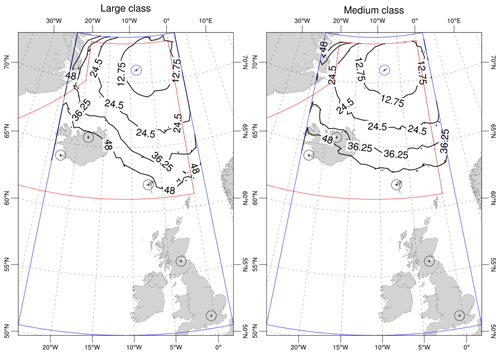
Figure 8The isolines show the arrival time in hours required for the ash concentration (at FL050) to exceed a threshold of 2 mg m−3 with an exceedance probability of 5 % between 0 and 48 h after the eruption. Black circles correspond to Keflavik and Akureyri (Iceland), Vágar (Faroe Islands), Edinburgh (Scotland), and Heathrow (London, UK) airports.
Figure 8 depicts the arrival time maps for large and medium eruptions respectively. The percent value in exceedance probability has been subjectively selected. However we highlight that our method allows a potential end-user to explore any value of exceedance probability: here, we only show the 5 % maps as an example.
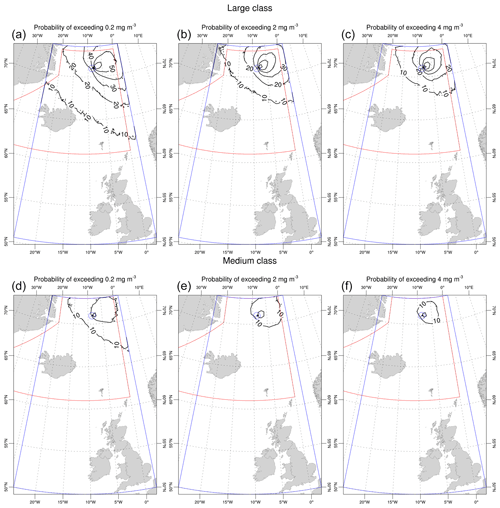
Figures 9 and D1 in Appendix D show the probability of reaching or exceeding ash concentration above 0.2, 2, and 4 mg m−3 at FL050 and FL250 at some time from the onset of the eruption to up to 48 h after its end for the large and medium eruptive classes respectively.
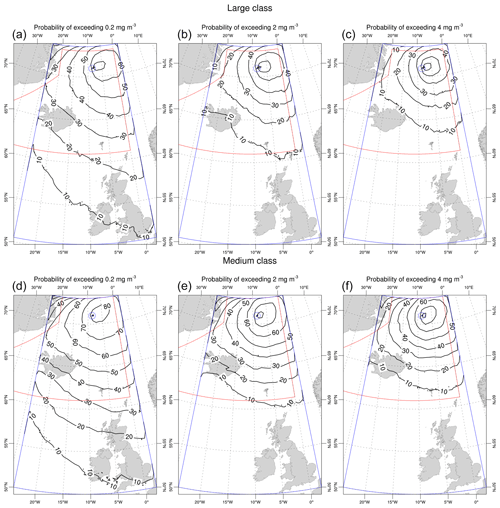
Figure 9Exceedance probability maps at FL050: the isolines show the probability of reaching an ash concentration above 0.2 mg m−3 (a, d), 2 mg m−3 (b, e), and 4 mg m−3 (c, f) at FL050 at some time from the onset of the eruption to up to 48 h after its end. The three upper plots apply to the large class and the three at the bottom to the medium one.
Thousands of eruptive scenarios have been simulated to reproduce and capture, in a probabilistic way, the variability in phenomena which can vary strongly in space and time. However, proper uncertainty quantification (UQ) is needed to quantify how reliable the prediction is. Such UQ can provide useful knowledge about the diversity of the dominant winds, the range in the airborne tephra concentration and its extent depending on the type of eruption, the ESPs related to the eruption size, and the feature of pulsating events for medium-size eruptions. As a consequence, the threat evaluation and the spatio-temporal analysis presented here could bring forth a more robust comprehensive hazard assessment.
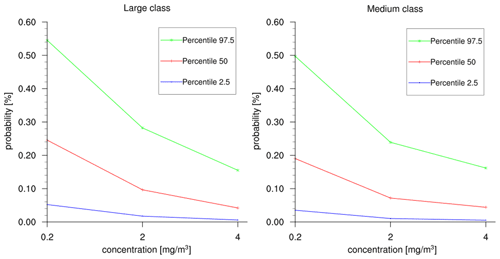
Kristiansen et al. (2012) concluded that the main source of epistemic/aleatory uncertainty in ash dispersal forecasts comes from the quantification of the eruption source term (eruption column height and emission rate). Here, we address the quantification of uncertainty over the airborne tephra concentration and its extent. To do that, we assess the 95 % confidence interval (i.e., range between the percentiles of 97.5 and 2.5) in the probability distributions describing the hazard curves for the concentration of tephra for each point in the domain. These probability distributions are deeply related to the number of simulations or scenarios used that model such concentrations; a detailed analysis of how the number of simulations affects the sensitivity of this uncertainty can be found in Appendix A.
Figure 10 shows different maps, at different levels of confidence, produced by cutting the point-wise hazard curves at different percentiles. They correspond to a 4D analysis where concentrations are the highest at any time from the onset of the eruption to up to 48 h after its end.
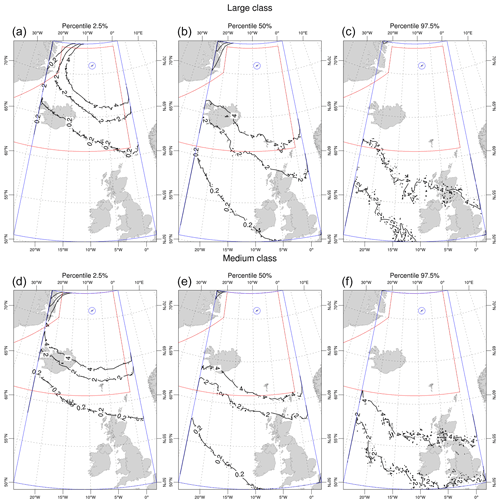
Figure 10Concentration extent hazard map at FL050: relative uncertainties related to airborne ash cloud concentrations above 0.2, 2, and 4 mg m−3 and extent. Each map corresponds to a different level of confidence, produced by cutting the point-wise hazard curves at different percentiles.
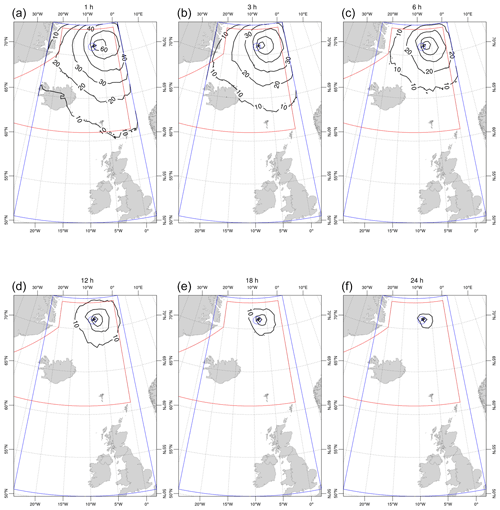
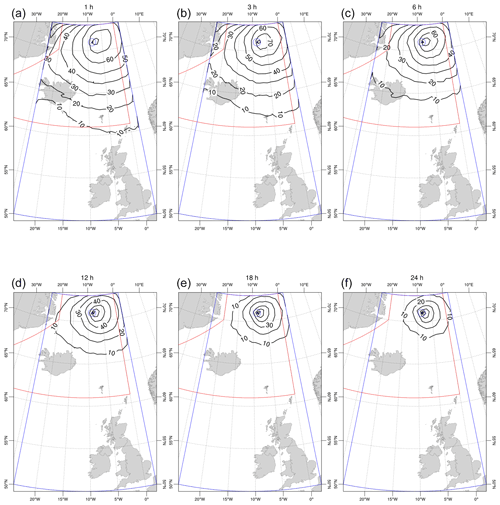
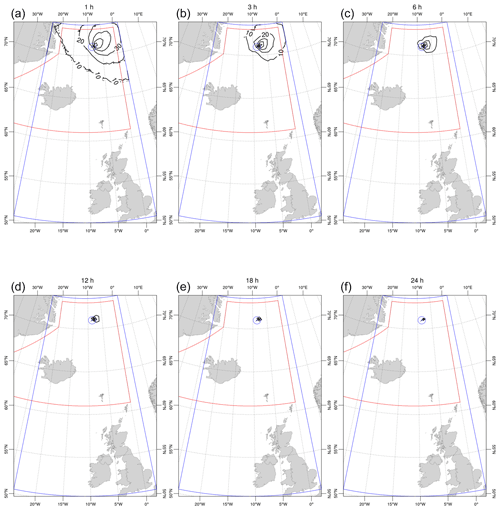
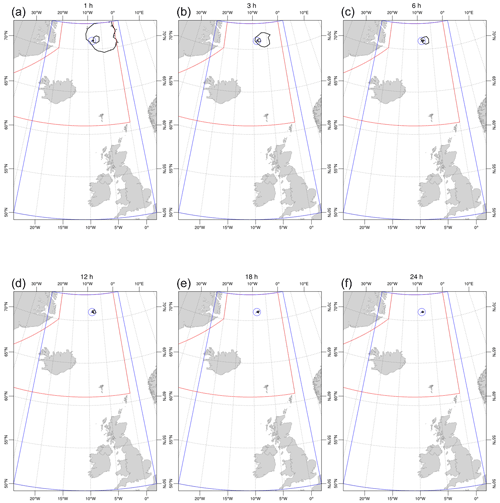
Figure 11 shows, from top left to bottom right, the probability of reaching or exceeding ash concentration above 2 mg m−3 at FL050 for more than 1, 3, 6, 12, 18, and 24 h respectively from the onset of a large eruption to up to 48 h after its end. Figure 12 shows the same but for the medium-size eruptions, and, in Appendix D, Figs. D2 and D3 display the same information as Figs. 11 and 12 but for FL250.
Results have been carried out considering the intrinsic limitations of the methodology (partially due to the scarcity of data related to complete geological records composed of both chronological and statistical data). This fact is important, as future advances in the geological catalog could have implications for future work assessing volcanic hazards and mitigating measures on JM.
5.1 Arrival time maps
As shown in Fig. 8, an ash-rich eruption originating from the JM volcano has the potential to affect the air traffic over Iceland after 36 h and, to some extent, the Faroe Islands or archipelago 48 h after the beginning of the eruption, with an exceedance probability of 5 %.
Table 2Airport locations, azimuth, and distance to JM. Locations are expressed in lat–long coordinates. Azimuth and distance correspond to the azimuth in degrees and the distance between JM and the different airports.
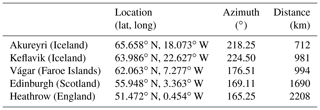
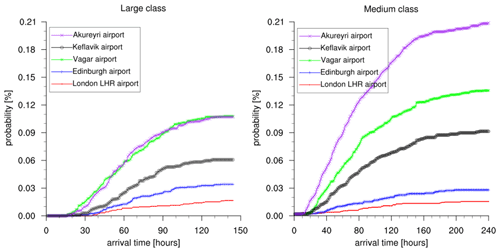
Figure 13 shows the evolution of the probability over time of ash concentration exceeding 2 mg m−3 at FL050 and the international airports of Keflavik and Akureyri (Iceland), Vágar (Faroe Islands), and Heathrow (London, UK) (see Table 2 for distance references). The probability at any airport is neglectable during the first hours (approx. 10 and 15 h for the medium and large classes respectively) and then increases until stabilizing after several days (approx. 7 and 5 d for the medium and large classes respectively). For both eruption classes, Vágar Airport has a higher probability of exceeding such a threshold than the other nearest airports such as Keflavik. This is due to a very marked difference in the wind patterns between the north-northeast and the west. At 48 h after the beginning of the eruption, only Akureyri Airport should exceed probabilities above 5 % to reach the concentration threshold of 2 mg m−3 for a medium-class eruption. No airport shows exceedance probabilities for such a critical threshold above 25 %.
5.2 Exceedance probability maps
Figures 9 and D1 in the Appendix D show substantially different results regarding ash concentration and extent for both eruption classes. Regarding concentrations, for the large class, values above 2 mg m−3 (reaching even 4 mg m−3, originally considered a no-fly zone) would affect part of the Icelandic FIR with exceedance probabilities between 10 % and 50 %. Instead, for the medium class, such concentrations would affect only low flight levels. Above FL250, moderate–higher probabilities are only found for polar routes. This is because the height of the eruptive column for medium-magnitude-class eruptions does not exceed 11 km (see Sect. 3.1). These results are in agreement with those shown in Fig. 10 (where maps, at different levels of confidence, were produced by cutting the hazard curves at distinct percentiles to depict the relative uncertainties related to airborne ash cloud concentrations and extent for both eruption classes at FL050).
Concerning the extent, at FL050, ash concentrations of up to 2 mg m−3 could reach almost the entire Icelandic FIR with probabilities between 10 % and 50 % for both eruption classes. This could threaten the vast majority of flights to and from northern routes. In contrast, at FL250, ash clouds would affect the northeast of Iceland for concentrations of up to 0.2 mg m−3 only when a large eruption occurs. Thus, we can conclude that for the medium class, only polar routes above FL250 would be threatened.
Finally, in a similar way to other types of analysis such as tephra ground load and probabilistic seismic hazard assessment, Fig. 14 provides a graphical representation of relative uncertainties related to airborne ash cloud concentrations above 0.2, 2, and 4 mg m−3 at FL050 at Keflavik Airport. This result, computed at each point of the target domain, could be eventually used as input for risk analysis such as for producing fragility curves and tolerance analysis and in general investigation of impact on infrastructure. In this view, it represents the most complete way to quantify hazard. Specifically, no dramatic differences are seen depending on the eruption size, and there is a non-negligible probability of overcoming the 2 mg m−3 threshold, even for low percentiles, given an eruption.
5.3 Persistence maps
According to Fig. 7, jet engines exposed to concentration conditions of up to 4 mg m−3 for more than 3 h would require inspection. This motivates the spatio-temporal analysis of persistent high-concentration scenarios. In terms of the ash cloud extent, results (Figs. 11 and 12) are slightly different: at FL050 a large part of the Icelandic FIR (reaching to some extent the Faroe Islands) with probabilities between 10 % and 50 % would be affected for both eruption classes for up to a total of 6 h after the beginning of the eruption. Instead, at FL250 (Figs. D2 and D3), such conditions would affect only high-latitude air routes (above 68∘ N).
For high-concentration scenarios lasting longer than 12 h, some differences between the eruption classes can be observed. At FL050, an ash cloud has probabilities lower than 10 % of reaching latitudes as low as 68 and 66∘ N for large and medium eruption respectively. These southernmost latitudes increase for higher persistence values, meaning that (obviously) only closer to the source may we get long-persisting clouds.
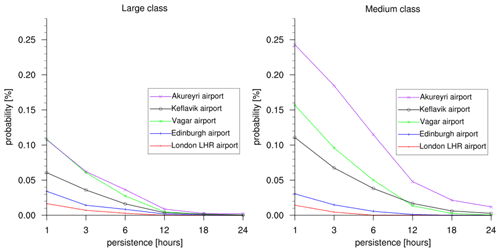
Finally, Fig. 15 presents a persistence analysis for the airports considered in this study, showing the exceedance probability of reaching ash concentration above the critical condition for maximum risk actions like takeoff or landing until 24 h after the beginning of the eruption. The most affected airports are Akureyri, Vágar, and Keflavik. London Heathrow (LHR) has very low probabilities (1.5 %–2 %) associated with 1 to 6 h of persistence scenarios until 48 h after the beginning of the eruption. Concerning the level of persistence, both eruption classes have similar behavior. Scenarios with persistence longer than 18 h are highly unlikely. However, when analyzing probabilities, the medium class reaches values twice as high as the large one. This observation can again be associated with their eruptive dynamic. The sustained injection of tephra into the atmosphere related to a series of discrete short-lived events increases the probability of prolonged high-concentration scenarios.
Despite the fact that the limitations of the geological records may constitute a bias for long-term volcanic hazard assessment, this work provides the first comprehensive analysis focused on the potential impact of airborne tephra concentration on Arctic and North Atlantic air routes due to an ash-forming eruption at Jan Mayen.
By looking at the field data, the possible eruptive classes for the JM volcano and their relative occurrence probability (expressed as probability density functions) have been identified. Here, medium to large eruptions (VEI of 3 to 4) are considered the most likely events, whereas Plinian eruptions are expected to occur with a probability of lower than 1 % (and for this reason they have not been considered in the analysis). A novel strategy to treat and describe the styles of pulsating eruptions (the case of the medium class), characterized by a series of discrete short-lived events followed by the occasional interruption of tephra emission, has been proposed. The natural variability in the eruption conditions for each possible eruptive class is described by different eruption source parameters. Such ESPs are randomly sampled from previously defined PDFs to generate a large dataset to be used as model input.
The results presented here are indicative of the potential impact of an eruption at JM in light of what is known about its previous eruptive activity. They could be used for land-use planning, defining mitigation actions, identification of vulnerable infrastructure, and cost–benefit analysis but not for emergency response.
Our results show that an ash-rich eruption originating from the JM volcano has the potential to affect air traffic over Iceland (after 36 h) and, to some extent, the Faroe Islands, after 48 h. Concerning airborne ash concentration and extent, for large eruptions, concentrations above 2 mg m−3 (even 4 mg m−3, originally considered a no-fly zone) would affect part of the Icelandic airspace (at different flight levels) with exceedance probabilities between 10 % and 50 % at some time from the onset of the eruption to up to 48 h after its end. For medium eruptions, these dangerous concentrations would affect only low flight levels (FL050). Above FL250 only polar routes would be affected.
When analyzing persisting concentration conditions where aircraft engines are exposed to a high concentration for more than 3 h, we conclude that at FL050 a large part of the Icelandic FIR (reaching to some extent the UK) would be affected for both medium and large eruption classes with probabilities between 5 % and 50 %. At FL250 such risky conditions would affect only high-latitude air routes (above 68∘ N).
Finally, we want to highlight the robustness of our PVHA in terms of uncertainty quantification, which should be routinely considered in all these kinds of studies.
This section provides an overview of the high-performance computing (HPC) environment used in this study and the setup process associated with the FALL3D model to simulate the eruptive scenarios. The most relevant settings to optimize the computational resources, as well as the simulation scheme followed, are described.
To account for the meteorological statistics in the simulation results of each eruptive class (large and medium), 1500 wind fields over the time period 1999–2020 were randomly sampled from the ECMWF ERA5 reanalysis dataset. Then, 1500 simulations (scenarios) combining meteorological conditions and ESPs for each class were run. Since the medium eruptive class is characterized by a series of discrete short-lived events, the total number of scenarios for this class was 3763. The total CPU–GPU hours used was 9.6 million, considering the architectures shown in Table C1 in Appendix C.
Figure A1 shows the variance of the tephra concentration at a given grid point with respect to the number of scenarios simulated. After 900 scenarios, the variance of the concentration begins to stabilize. This stabilization also suggests a reduction in uncertainty related to the intra-size variability in the eruptive scenarios themselves.
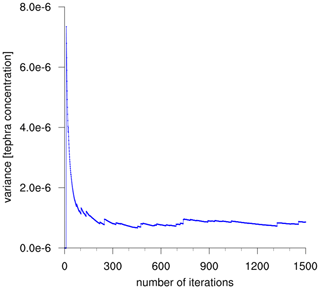
Figure A1Value of the variance of tephra concentration for a given grid point with respect to the number of scenarios simulated.
All the scenarios were run using the FALL3D-8.1 model (Folch et al., 2020) over a 2000 km × 2000 km domain between 50 and 73∘ N (latitude) and 2 and 24∘ W (longitude) with a resolution of about 2 km. Eruptive vents were placed at 70.98∘ N, 8.38∘ W and 71.10∘ N, 8.13∘ W respectively for medium and large eruptive classes.
Table B1PDFs and values ranges of the main eruptive parameters for JM. Bounds on mass eruption rate values are a consequence of the sampling procedure for total erupted volume (Fig. 3) and duration of the fallout phase described in the text. For the total grain size distribution, references were chosen from the 1732 Eggøya and 2004 Grímsvötn eruptions for medium and large classes respectively. Erupted volumes are between 0.1–0.5 and >0.5 km3 for medium and large class ranges.
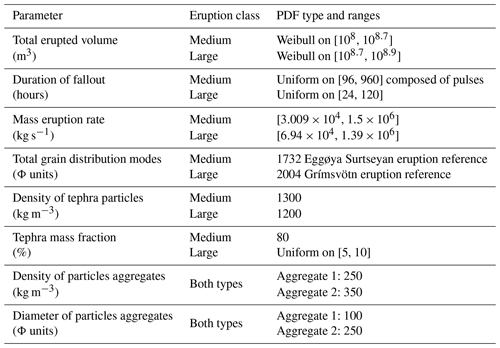
For each eruptive class, the PDFs describing each ESP were fixed following Sandri et al. (2016). It is important to note that this work only addressed the medium and large eruptive classes. Table B1 summarizes the PDFs and values ranges of the main ESP for JM. The sampling process can be described as follows:
-
Sample a value for the total erupted volume (or magnitude), duration of the fallout phase, column shape, and sphericity of tephra particles from their PDFs. The total erupted volume, expressed as DRE, is computed uniformly within a range of values (108–108.9 m3). In a second step, we weight each total eruption volume based on the Weibull distribution function previously defined (Fig. 2). In this way, the unlikely events are properly represented.
-
Compute the mass fraction (%) associated with tephra fallout concerning the total erupted mass according to the available estimations from field data analysis. For the medium eruptive class, the value of the mass fraction is fixed to 0.8, whereas for the large eruptive class it is randomly sampled from [0.05, 0.10].
-
Compute the mass eruption rate and the column heights from the total erupted volume sampled. The mass eruption rates range between 3.009×10⁴–1.5×10⁶ and 6.94×10⁴–1.39×10⁶ kg s−1 for the medium and large eruptive sizes respectively. The source term (vertical distribution of mass in the eruption column) is given by a Suzuki distribution (Suzuki, 1983) with the parameter A in the range of 3 to 4.5 and λ equal to 1.
-
Sample a time for the eruption start over a period of 21 years (1999–2020) considering the corresponding meteorological fields for the duration of the fallout phase and associate this randomly with a combination of the volcanological parameters. For this, ECMWF ERA5 reanalysis meteorological data have been used associated with the date and duration of the eruption. Modify FALL3D's input file with both meteorological and newly sampled data values.
-
Run FALL3D to obtain the tephra loading at different flight levels. The Ganser terminal velocity model (Ganser, 1993) and the CMAQ model parameterization for horizontal diffusion (Folch et al., 2009) were used as part of the model physics configuration.
-
Computet the outputs obtained from FALL3D. As a result, hazard and probabilistic maps describing the airborne ash concentration and time persistence at different flight levels on a large-scale and high-resolution domain are obtained.
Typical tephra particle densities and total grain size distributions were chosen to be consistent with previous values reported for the Eggøya (1790) and Grímsvötn (2004) eruptions for medium and large classes respectively. The type of aggregates was also chosen to be consistent with previous values reported for similar Surtseyan and phreatomagmatic eruptions.
Table C1Joliot-Curie supercomputer. Characteristics corresponding with the two partitions available in this study.

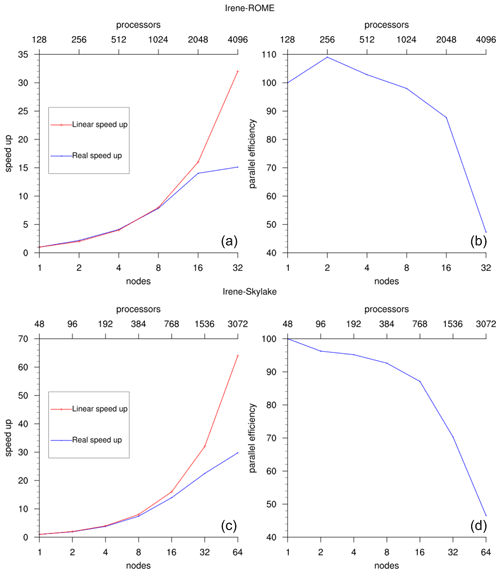
Figure C1Strong scalability analysis (time to solution). (a, b) Speedup and parallel efficiency analysis at Irene ROME (128 AMD processors per node). (c, d) Same for Irene Skylake (48 Skylake processors per node).
Experiments were run on Joliot-Curie, at Très Grand Centre de calcul du CEA (the French Alternative Energies and Atomic Energy Commission (CEA) – TGCC).
Considering that FALL3D-8.1 uses the Message Passing Interface (MPI) for 3D domain decomposition with freedom for the user to choose the number of processors along each spatial direction, to identify the optimal running configuration on Irene ROME and Irene Skylake, a few benchmark cases (with a grid size similar to that of the real benchmark ones, ∼50 million grid points, and 12 particle bins) were ran changing the configuration of nodes and cores used. Results are shown in Fig. C1.
As observed, for this particular grid size, parallel efficiencies are substantially better at Irene ROME, at >90 % with up to 2048 processors (16 nodes). At the Irene Skylake partition, parallel efficiencies already drop to ∼70 % with only 1036 processors (32 nodes). Scalability breaking at a larger number of processors occurs because the number of grid points per subdomain becomes less than the specified range in which communications start to overtake computations (a larger grid size would be needed to sustain speedup ratios that are close to optimal above 2048 processors). Then, considering the resolution of our domain (0.025∘) and the total grid points of ∼35 million (), we fixed the number of nodes to 16 and the number of cores to 768. This configuration allows decomposing the grid points into (X, Y, Z) subdomains of more than 30 points per spatial dimension. As a result, we increased the speedup 16-fold and the parallel efficiency was fixed to ∼90 %.
D1 Exceedance probability maps at FL250
Figure D1 shows the exceedance probability maps computed at FL250.
D2 Persistence maps at FL250
Figures D2 and D3 show the exceedance probability maps computed at FL250.
Scripts and codes cannot be shared at this stage.
SB, LS, AF, GM, and AC contributed to the conception and design of the study, analysis and/or interpretation of data, and drafting the manuscript. MT, BMM, and LM contributed to coding the scripts and software, analysis and/or interpretation of data, and drafting the manuscript.
At least one of the (co-)authors is a member of the editorial board of Natural Hazards and Earth System Sciences. The peer-review process was guided by an independent editor, and the authors also have no other competing interests to declare.
Publisher's note: Copernicus Publications remains neutral with regard to jurisdictional claims in published maps and institutional affiliations.
The research leading to these results has received funding from the European Union's Horizon 2020 research and innovation program under the ChEESE project, grant agreement no. 823844. We thank the multi-year PRACE Project Access “Volcanic ash hazard and forecast” (ID 2019215114).
This research has been supported by the European Commission's CORDIS (ChEESE (grant no. 823844)).
This paper was edited by Amy Donovan and reviewed by Keith Beven and one anonymous referee.
Abbott, P. M. and Davies, S. M.: Volcanism and the Greenland ice-cores: the tephra record, Earth-Sci. Rev., 115, 173–191, 2012. a, b
Akaike, H.: Information theory and an extension of the maximum likelihood principle, in: Selected papers of hirotugu akaike, Springer, 199–213, https://doi.org/10.1007/978-1-4612-1694-0_15, 1998. a
Amante, C. and Eakins, B. W.: ETOPO1 arc-minute global relief model: procedures, data sources and analysis, NOAA technical memorandum NESDIS NGDC-24, NOAA, https://doi.org/10.7289/V5C8276M, 2009. a
Barsotti, S., Di Rienzo, D. I., Thordarson, T., Björnsson, B. B., and Karlsdóttir, S.: Assessing impact to infrastructures due to tephra fallout from Öræfajökull volcano (Iceland) by using a scenario-based approach and a numerical model, Front. Earth Sci., 6, 196, https://doi.org/10.3389/feart.2018.00196, 2018. a
Blischke, A., Gaina, C., Hopper, J., Péron-Pinvidic, G., Brandsdóttir, B., Guarnieri, P., Erlendsson, Ö., and Gunnarsson, K.: The Jan Mayen microcontinent: an update of its architecture, structural development and role during the transition from the Ægir Ridge to the mid-oceanic Kolbeinsey Ridge, Geol. Soc. Lond. Spec. Publ., 447, 299–337, 2017. a
Bonadonna, C., Connor, C. B., Houghton, B., Connor, L., Byrne, M., Laing, A., and Hincks, T.: Probabilistic modeling of tephra dispersal: Hazard assessment of a multiphase rhyolitic eruption at Tarawera, New Zealand, J. Geophys. Res.-Solid, 110, B03203, https://doi.org/10.1029/2003JB002896, 2005. a
Bozdogan, H.: Model selection and Akaike's information criterion (AIC): The general theory and its analytical extensions, Psychometrika, 52, 345–370, 1987. a
Brendryen, J., Haflidason, H., and Sejrup, H. P.: Norwegian Sea tephrostratigraphy of marine isotope stages 4 and 5: prospects and problems for tephrochronology in the North Atlantic region, Quaternary Sci. Rev., 29, 847–864, 2010. a, b
Budd, L., Griggs, S., Howarth, D., and Ison, S.: A fiasco of volcanic proportions? Eyjafjallajökull and the closure of European airspace, Mobilities, 6, 31–40, 2011. a
Budnitz, R., Apostolakis, G., and Boore, D. M.: Recommendations for probabilistic seismic hazard analysis: guidance on uncertainty and use of experts, Tech. rep., Nuclear Regulatory Commission, Washington, DC, USA; Div. of Engineering Technology; Lawrence Livermore National Lab., CA, USA; Electric Power Research Inst., Palo Alto, CA, USA; USDOE, Washington, DC, USA, available at: https://www.nrc.gov/reading-rm/doc-collections/nuregs/contract/cr6372/vol1/index.html (last access: 24 January 2022), 1997. a
Clarkson, R. J., Majewicz, E. J., and Mack, P.: A re-evaluation of the 2010 quantitative understanding of the effects volcanic ash has on gas turbine engines, Proc. Inst. Mech. Eng. Pt. G, 230, 2274–2291, 2016. a
Elefante, L., Jalayer, F., Iervolino, I., and Manfredi, G.: Disaggregation-based response weighting scheme for seismic risk assessment of structures, Soil Dynam. Earthq. Eng., 30, 1513–1527, 2010. a
Elissondo, M., Baumann, V., Bonadonna, C., Pistolesi, M., Cioni, R., Bertagnini, A., Biass, S., Herrero, J.-C., and Gonzalez, R.: Chronology and impact of the 2011 Cordón Caulle eruption, Chile, Nat. Hazards Earth Syst. Sci., 16, 675–704, https://doi.org/10.5194/nhess-16-675-2016, 2016. a
Ellis, M., Bojdo, N., Filippone, A., and Clarkson, R.: Monte Carlo Predictions of Aero-Engine Performance Degradation Due to Particle Ingestion, Aerospace, 8, 146, https://doi.org/10.3390/aerospace8060146, 2021. a
Folch, A. and Sulpizio, R.: Evaluating long-range volcanic ash hazard using supercomputing facilities: application to Somma-Vesuvius (Italy), and consequences for civil aviation over the Central Mediterranean Area, Bull. Volcanol., 72, 1039–1059, 2010. a
Folch, A., Costa, A., and Macedonio, G.: FALL3D: A computational model for transport and deposition of volcanic ash, Comput. Geosci., 35, 1334–1342, 2009. a, b
Folch, A., Mingari, L., Gutierrez, N., Hanzich, M., Macedonio, G., and Costa, A.: FALL3D-8.0: a computational model for atmospheric transport and deposition of particles, aerosols and radionuclides – Part 1: Model physics and numerics, Geosci. Model Dev., 13, 1431–1458, https://doi.org/10.5194/gmd-13-1431-2020, 2020. a, b
Ganser, G. H.: A rational approach to drag prediction of spherical and nonspherical particles, Powder Technol., 77, 143–152, 1993. a
Gernigon, L., Blischke, A., Nasuti, A., and Sand, M.: Conjugate volcanic rifted margins, seafloor spreading, and microcontinent: Insights from new high-resolution aeromagnetic surveys in the Norway Basin, Tectonics, 34, 907–933, 2015. a
Gjerløw, E., Höskuldsson, A., and Pedersen, R.-B.: The 1732 Surtseyan eruption of Eggøya, Jan Mayen, North Atlantic: deposits, distribution, chemistry and chronology, Bull. Volcanol., 77, 1–21, 2015. a, b, c
Gjerløw, E., Haflidason, H., and Pedersen, R.: Holocene explosive volcanism of the Jan Mayen (island) volcanic province, North-Atlantic, J. Volcanol. Geoth. Res., 321, 31–43, 2016. a, b, c, d, e, f, g, h, i
Harvey, N. J., Huntley, N., Dacre, H. F., Goldstein, M., Thomson, D., and Webster, H.: Multi-level emulation of a volcanic ash transport and dispersion model to quantify sensitivity to uncertain parameters, Nat. Hazards Earth Syst. Sci., 18, 41–63, https://doi.org/10.5194/nhess-18-41-2018, 2018. a
Hill, L., Sparks, R., and Rougier, J.: Risk assessment and uncertainty in natural hazards, in: Risk and uncertainty assessment for natural hazards, edited by: Rougier, J. C., Sparks, R. S. J., and Hill, L. J., Cambridge University Press, 1–18, https://doi.org/10.1017/CBO9781139047562, 2013. a
Hunt, J. B.: Tephrostratigraphical evidence for the timing of Pleistocene explosive volcanism at Jan Mayen, J. Quaternary Sci., 19, 121–136, 2004. a, b
ICAO: Volcanic Ash Contingency Plan – European And North Atlantic Regions, available at: https://www.icao.int/EURNAT/EUR and NAT Documents/EUR+NAT VACP v2.0.1-Corrigendum.pdf (last access: 21 January 2022), 2021. a
Imsland, P.: The geology of the volcanic island Jan Mayen, Arctic Ocean, Nordic Volcanological Institute, available at: http://nordvulk.hi.is/sites/nordvulk.hi.is/files/NVI_Reports_pdf/nvi_report_7813_low_text.pdf (last access: 21 January 2022), 1978. a
Isavia: Annual report, available at: https://www.isavia.is/annualreport2019/economy/flight-statistics (last access: 21 January 2022), 2019. a
Jakobsson, M., Mayer, L., Coakley, B., Dowdeswell, J. A., Forbes, S., Fridman, B., Hodnesdal, H., Noormets, R., Pedersen, R., Rebesco, M., Schenke, H. W., Zarayskaya, Y., Accettella, D., Armstrong, A., Anderson, R. M., Bienhoff, P., Camerlenghi, A., Church, I., Edwards, M., Gardner, J. V., Hall, J. K., Hell, B., Hestvik, O., Kristoffersen, Y., Marcussen, C., Mohammad, R., Mosher, D., Nghiem, S. V., Pedrosa, M. T., Travaglini, P. G., and Weatheral, P.: The international bathymetric chart of the Arctic Ocean (IBCAO) version 3.0, Geophys. Res. Lett., 39, L12609, https://doi.org/10.1029/2012GL052219, 2012. a
Kandilarov, A., Mjelde, R., Pedersen, R.-B., Hellevang, B., Papenberg, C., Petersen, C.-J., Planert, L., and Flueh, E.: The northern boundary of the Jan Mayen microcontinent, North Atlantic determined from ocean bottom seismic, multichannel seismic, and gravity data, Mar. Geophys. Res., 33, 55–76, 2012. a
Karlsdóttir, S., Gylfason, Á. G., Höskuldsson, Á., Brandsdóttir, B., Ilyinskaya, E., Gudmundsson, M. T., Högnadóttir, Þ., and Þorkelsson, B.: The 2010 Eyjafjallajökull eruption, Iceland, Report to ICAO, p. 209, available at: https://www.vedur.is/media/vedurstofan/utgafa/skyrslur/2012/ICAOreport_web_lr.pdf (last access: 21 January 2022), 2012. a
Kristiansen, N., Stohl, A., Prata, A., Bukowiecki, N., Dacre, H., Eckhardt, S., Henne, S., Hort, M., Johnson, B., Marenco, F., Neininger, B., Reitebuch, O., Seibert, P., Thomson, D. J., Webster, H. N., and Weinzierl, B.: Performance assessment of a volcanic ash transport model mini-ensemble used for inverse modeling of the 2010 Eyjafjallajökull eruption, J. Geophys. Res.-Atmos., 117, D00U11, https://doi.org/10.1029/2011JD016844, 2012. a
Lacasse, C. and Garbe-Schönberg, C.-D.: Explosive silicic volcanism in Iceland and the Jan Mayen area during the last 6 Ma: sources and timing of major eruptions, J. Volcanol. Geoth. Res., 107, 113–147, 2001. a, b
Larsen, E., Lyså, A., Höskuldsson, Á., Davidsen, J. G., Nadeau, M. J., Power, M., Tassis, G., and Wastegård, S.: A dated volcano-tectonic deformation event in Jan Mayen causing landlocking of Arctic charr, J. Quaternary Sci., 36, 180–190, 2021. a
Larsen, G. and Guðmundsson, M. T.: Catalogue of Icelandic Volcanoes, available at: http://icelandicvolcanoes.is/?volcano=BEE (last access: 21 January 2022), 2016. a, b, c
Larsen, G., Gudmundsson, M., and Oladottir, B.: Catalogue of Icelandic Volcanoesn, Report, IMO, UI and CPD-NCIP, available at: http://icelandicvolcanoes.is/ (last access: 21 January 2022), 2017. a
Macedonio, G., Costa, A., and Folch, A.: Ash fallout scenarios at Vesuvius: numerical simulations and implications for hazard assessment, J. Volcanol. Geoth. Res., 178, 366–377, 2008. a
Marzocchi, W., Sandri, L., and Furlan, C.: A quantitative model for volcanic hazard assessment, Statistics in Volcanology, Special Publications of IAVCEI, 1, 31–37, 2006. a
Mastin, L. G., Guffanti, M., Servranckx, R., Webley, P., Barsotti, S., Dean, K., Durant, A., Ewert, J. W., Neri, A., Rose, W. I., Schneider, D., Siebert, L., Stunder, B., Swanson, G., Tupper, A., Volentik, A., and Waythomas, C. F.: A multidisciplinary effort to assign realistic source parameters to models of volcanic ash-cloud transport and dispersion during eruptions, J. Volcanol. Geoth. Res., 186, 10–21, 2009. a, b
Mazzocchi, M., Hansstein, F., and Ragona, M.: The 2010 volcanic ash cloud and its financial impact on the European airline industry, in: CESifo Forum, vol. 11, ifo Institut für Wirtschaftsforschung an der Universität München, München, 92–100, 2010. a
NavCanada: Polar routes – past, present and future, available at: https://www.navcanada.ca/en/news/blog/polar-routes--past-present-and-future.aspx (last access: 21 January 2022), 2017. a
Newhall, C. G. and Self, S.: The volcanic explosivity index (VEI) an estimate of explosive magnitude for historical volcanism, J. Geophys. Res.-Oceans, 87, 1231–1238, 1982. a
Oxford-economics: The economics impacts of air travel restrictions due to volcanic ash, available at: https://www.oxfordeconomics.com/my-oxford/projects/129051 (last access: 21 January 2022), 2010. a
Peron-Pinvidic, G., Gernigon, L., Gaina, C., and Ball, P.: Insights from the Jan Mayen system in the Norwegian–Greenland sea – I. Mapping of a microcontinent, Geophys. J. Int., 191, 385–412, 2012. a
Prata, A. T., Dacre, H. F., Irvine, E. A., Mathieu, E., Shine, K. P., and Clarkson, R. J.: Calculating and communicating ensemble-based volcanic ash dosage and concentration risk for aviation, Meteorol. Appl., 26, 253–266, 2019. a
Pyle, D. M.: Sizes of volcanic eruptions, in: The encyclopedia of volcanoes, Elsevier, 257–264, https://doi.org/10.1016/B978-0-12-385938-9.00013-4, 2015. a
Sandri, L., Costa, A., Selva, J., Tonini, R., Macedonio, G., Folch, A., and Sulpizio, R.: Beyond eruptive scenarios: assessing tephra fallout hazard from Neapolitan volcanoes, Scient. Rep., 6, 1–13, 2016. a, b, c, d, e, f
Siggerud, T.: The volcanic eruption on Jan Mayen 1970, Norsk Polarinstitutt Arbok, 1970, 5–18, available at: http://nnsn.geo.uib.no/eworkshop/uploads/Main/The-volcanic-eruption-on-Jan-Mayen-1970-by-Thor-Siggerud -AN_1970_2610.pdf (last access: 21 January 2022), 1972. a, b
Stewart-Green, C.: ANS Planning: NAV CANADA, available at: https://www.icao.int/NACC/Documents/Meetings/2016/ASBU/ASBUP12.pdf (last access: 21 January 2022), 2016. a
Sulpizio, R., Folch, A., Costa, A., Scaini, C., and Dellino, P.: Hazard assessment of far-range volcanic ash dispersal from a violent Strombolian eruption at Somma-Vesuvius volcano, Naples, Italy: implications on civil aviation, Bull. Volcanol., 74, 2205–2218, 2012. a
Suzuki, T.: A theoretical model for dispersion of tephra, Arc volcanism: physics and tectonics, in: Arc volcanism: physics and tectonics, vol. 95, p. 113, available at: https://pages.mtu.edu/~raman/papers2/Suzuki83.pdf (last access: 21 January 2022), 1983. a
Tesche, M., Glantz, P., Johansson, C., Norman, M., Hiebsch, A., Ansmann, A., Althausen, D., Engelmann, R., and Seifert, P.: Volcanic ash over Scandinavia originating from the Grímsvötn eruptions in May 2011, J. Geophys. Res.-Atmos., 117, D09201, https://doi.org/10.1029/2011JD017090, 2012. a
Voelker, A. H. and Haflidason, H.: Refining the Icelandic tephrachronology of the last glacial period–the deep-sea core PS2644 record from the southern Greenland Sea, Global Planet. Change, 131, 35–62, 2015. a, b
Ward, P. L.: What really causes global warming: greenhouse gases or ozone depletion?, Morgan James Publishing, ISBN 978-1-63047-799-8, ISBN 978-1-63047-798-1, 2015. a
Woodhouse, M. J., Hogg, A. J., Phillips, J. C., and Rougier, J. C.: Uncertainty analysis of a model of wind-blown volcanic plumes, Bull. Volcanol., 77, 1–28, 2015. a
- Abstract
- Introduction
- Jan Mayen volcanism
- Methodology
- Results – hazard maps and uncertainty quantification
- Discussion
- Conclusions
- Appendix A: Simulation setup
- Appendix B: Sampling and processing workflow
- Appendix C: Computational resource
- Appendix D: Complementary maps
- Code and data availability
- Author contributions
- Competing interests
- Disclaimer
- Acknowledgements
- Financial support
- Review statement
- References


