the Creative Commons Attribution 4.0 License.
the Creative Commons Attribution 4.0 License.
 | 30 Mar 2022
VADUGS: a neural network for the remote sensing of volcanic ash with MSG/SEVIRI trained with synthetic thermal satellite observations simulated with a radiative transfer model
Dennis Piontek
Stephan Kox
Marius Schmidl
Bernhard Mayer
Richard Müller
Margarita Vázquez-Navarro
Daniel M. Peters
Roy G. Grainger
Josef Gasteiger
Jayanta Kar
After the eruption of volcanoes around the world, monitoring of the dispersion of ash in the atmosphere is an important task for satellite remote sensing since ash represents a threat to air traffic. In this work we present a novel method, tailored for Eyjafjallajökull ash but applicable to other eruptions as well, that uses thermal observations of the SEVIRI imager aboard the geostationary Meteosat Second Generation satellite to detect ash clouds and determine their mass column concentration and top height during the day and night. This approach requires the compilation of an extensive data set of synthetic SEVIRI observations to train an artificial neural network. This is done by means of the RTSIM tool that combines atmospheric, surface and ash properties and runs automatically a large number of radiative transfer calculations for the entire SEVIRI disk. The resulting algorithm is called “VADUGS” (Volcanic Ash Detection Using Geostationary Satellites) and has been evaluated against independent radiative transfer simulations. VADUGS detects ash-contaminated pixels with a probability of detection of 0.84 and a false-alarm rate of 0.05. Ash column concentrations are provided by VADUGS with correlations up to 0.5, a scatter up to 0.6 g m−2 for concentrations smaller than 2.0 g m−2 and small overestimations in the range 5 %–50 % for moderate viewing angles 35–65∘, but up to 300 % for satellite viewing zenith angles close to 90 or 0∘. Ash top heights are mainly underestimated, with the smallest underestimation of −9 % for viewing zenith angles between 40 and 50∘. Absolute errors are smaller than 70 % and with high correlation coefficients of up to 0.7 for ash clouds with high mass column concentrations. A comparison with spaceborne lidar observations by CALIPSO/CALIOP confirms these results: For six overpasses over the ash cloud from the Puyehue-Cordón Caulle volcano in June 2011, VADUGS shows similar features as the corresponding lidar data, with a correlation coefficient of 0.49 and an overestimation of ash column concentration by 55 %, although still in the range of uncertainty of CALIOP. A comparison with another ash algorithm shows that both retrievals provide plausible detection results, with VADUGS being able to detect ash further away from the Eyjafjallajökull volcano, but sometimes missing the thick ash clouds close to the vent. VADUGS is run operationally at the German Weather Service and this application is also presented.
- Article
(10378 KB) - Full-text XML
- BibTeX
- EndNote


Volcanic ash is a threat to air traffic, as it can damage aircraft engines and lead to flame-outs, see, e.g. Miller and Casadevall (2000). The eruption of the volcano Eyjafjallajökull in 2010 had a huge impact on European air traffic causing a massive cancellation of flights (see e.g. Budd et al., 2011; Langmann et al., 2012). As a consequence, the interest in tracking volcanic ash clouds in case of a similar scenario increased. Satellite images are particularly useful in this context because of their large field of regard and often high temporal or spatial resolution. In particular, observations of the SEVIRI radiometer aboard Meteosat Second Generation (MSG) are very well suited due to its 12 spectral channels (four solar, seven thermal and a mixed channel) that scan the Earth from above the Equator every 15 min with a spatial sampling distance of 3 km at nadir. Various methods to detect volcanic ash plumes in satellite images have been developed in the past few years (Prata, 1989b; Francis et al., 2012; Mackie and Watson, 2014; Piscini et al., 2014; Guéhenneux et al., 2015; Gouhier et al., 2020, among others). Many of them exploit thermal observations since they provide both daytime and nighttime coverage and because they show a particular signature of many volcanic ash types, the “reverse” absorption feature (Wen and Rose, 1994; Pavolonis et al., 2006). It states that the brightness temperature (BT) difference BTD(λ1−λ2) between the SEVIRI channel centred at λ1=10.8 µm and the SEVIRI channel centred at 0 µm has the opposite sign as the same BTD for ice clouds, thus enabling the identification of volcanic ash-contaminated pixels.
Our approach focuses on the MSG/SEVIRI sensor and aims at gaining information about volcanic ash clouds through the application of an artificial neural network (NN). Before an NN based on the supervised learning approach can be used to solve this remote sensing problem, training data have to be provided for the learning phase during which the NN learns to approximate the desired volcanic ash properties from the given input data/satellite observations. For volcanic eruptions, there are no documented situations in which the actual three-dimensional (in space) or four-dimensional (in space and time) mass distribution of the volcanic aerosol is known. In situ measurements are rare, can probe only a limited part of the ash clouds at selected locations and at particular times, and are difficult to compare with passive satellite observations. Training data have been composed by combining satellite images with models/simulations/retrievals, e.g. Gray and Bennartz (2015, the polar orbiting MODIS reflectometer and HYSPLIT trajectories), Picchiani et al. (2011, MODIS and look-up tables), Piscini et al. (2014, MODIS and other retrievals), Zhu et al. (2020, SEVIRI and CALIOP lidar observations). As an alternative, simulated satellite data can be used. These consist of the simulated BTs that a satellite instrument viewing the Earth's atmosphere would measure in given situations with and without generic volcanic ash layers. Using these synthetic observations, a suitably designed NN can be applied to generalize the relationship between input (simulated satellite observations) and output (volcanic ash properties). After training, the NN should be able to derive the latter for a given set of measured BTs. This principle has been utilized for a retrieval of the mass column density and the cloud top height of volcanic ash. The resulting algorithm, called “VADUGS” (Volcanic Ash Detection Using Geostationary Satellites), is presented in this manuscript. It was developed in the aftermath of the impressive eruption of the Icelandic Eyjafjallajökull volcano in 2010 according to the experience gathered with ice clouds in Kox et al. (2014) and with particular focus on this eruption. It was developed for the investigation of the Eyjafjallajökull eruption and for the detection of future Eyjafjallajökull-like eruptions that might have similar impacts on air traffic over Europe to the 2010 event. It was first presented at the 2013 EUMETSAT Conference held in Vienna, Austria (Kox et al., 2013). Since 2015 VADUGS has been run operationally at the German Weather Service (Deutscher Wetterdienst, DWD, , ) and from 2016 to 2019 it provided satellite observations of volcanic ash for the EU Horizon 2020 project EUNADICS-AV (European Natural Airborne Disaster Information and Coordination System for Aviation, Brenot et al., 2021). VADUGS participated in two WMO intercomparison workshops for satellite products about volcanic ash in 2015 (Graf et al., 2015) and 2018 and its approach has been extended to Himawari-8 data (de Laat et al., 2020). VADUGS is also the basis for more advanced machine-learning algorithms for the detection of volcanic ash and the determination of its properties (Piontek et al., 2021c, b).
This article describes (a) a method to generate comprehensive realistic data sets of simulated thermal observations considering both liquid and ice water clouds as well as volcanic ash and (b) the development and performance of an NN trained using these synthetic data sets. In Sect. 2 the main concepts and ideas are introduced. The tool for the compilation of the simulated satellite observations is described in Sect. 3 and the resulting data set of synthetic observations is presented in Sect. 4. Section 4.2 and 4.3 explain the training of the NN retrieval and present some considerations about its application together with an illustration of the retrieval results for the Eyjafjallajökull May eruption phase. In Sect. 4.4 the validation against independent simulated observations and against spaceborne lidar measurements is shown, while the implementation at DWD is sketched in Sect. 5 before conclusions are drawn in Sect. 6.
The VADUGS retrieval algorithm has been developed closely following the experience gathered with ice clouds in Kox et al. (2014). There, ice clouds are identified in MSG/SEVIRI thermal observations by means of an NN that has been trained with collocated cloud products from the CALIOP lidar in space (Winker et al., 2009). However, as already explained in the Introduction, this approach cannot be directly applied to volcanic ash because volcanic ash observations in the field of regard of MSG/SEVIRI are limited to a few large eruptions (Eyjafjallajökull in 2010, Puyehue-Cordón Caulle in 2011) and some smaller eruptions (e.g. Grimsvötn 2011, Etna, Nabro 2011) for which no comprehensive data set is available containing both satellite observations and the corresponding ash properties that can be used to train an NN. Thus, the approach selected for volcanic ash makes use of the radiative transfer model libRadtran (Emde et al., 2016; Mayer and Kylling, 2005) to compute one-dimensional (1D) simulated satellite observations based on a data set of consistent but variable atmospheric properties, including ash layer height, geometrical thickness and mass concentration at different places inside the MSG/SEVIRI field of regard under realistic atmospheric conditions. For the derivation of top-of-atmosphere fluxes from MSG/SEVIRI observations, a similar approach (Vázquez-Navarro et al., 2013) has already proved to yield good results. Thus, in this study we combine the NN technique from Kox et al. (2014) with the radiative transfer approach from Vázquez-Navarro et al. (2013).
The goal of the VADUGS retrieval algorithm is the derivation of volcanic ash cover (VAC), volcanic ash top height (VATH) and volcanic ash mass column concentration (VAMC).
The main advantages of using simulated satellite observations for the training of a volcanic ash retrieval are that: (a) all atmospheric properties, including of course volcanic and liquid/ice cloud properties are exactly known; (b) the data set can cover the entire SEVIRI disk and all possible combinations of meteorological clouds, volcanic ash, time of the year/of the day and viewing geometries; (c) in principle, various ash types might be included. The main drawback is that radiative calculations, although realistic, might still not encompass the full complexity of real observations.
2.1 MSG/SEVIRI
Meteosat Second Generation (MSG) is a series of four satellites operated by EUMETSAT that became operational in 2004 and has continued operating to date. The satellites, MSG1 to MSG4, were renamed after launch as Meteosat-8 to Meteosat-11, respectively. Their main instrument is the Spinning Enhanced Visible and Infrared Imager (SEVIRI). This radiometer has 11 spectral channels from the visible to the infrared with a spatial sampling of 3 km at the subsatellite point and a broadband high-resolution visible (HRV) channel with a spatial sampling distance of 1 km at nadir. The thermal channels are centred at 6.2 and 7.3 µm (strong water vapour absorption), 8.7, 10.8 and 12.0 µm (window channels), as well as 9.7 µm (ozone absorption) and 13.4 µm (carbon dioxide absorption). The operational service provides full-disk Earth data every 15 min and the rapid scan service observes the upper part of the Earth disk with Europe and North Africa with a repetition time of 5 min. For the development of VADUGS, we concentrate on MSG2 (Meteosat-9), launched in 2005, since it was the prime Meteosat satellite from 2006 to 2013 and thus recorded the main volcanic eruptions mentioned earlier (Eyjafjallajökull, Grimsvötn, Puyehue).
2.2 VADUGS: an artificial neural network
An artificial NN (Rumelhart et al., 1986) consists of a set of neurons that exchange information with each other with the goal of deriving a set of output variables given a set of known input quantities. The technical implementation of the NN in this study follows very closely Kox et al. (2014), since the NN developed there proved to be highly effective in detecting ice clouds and in determining their properties.
The neurons in the NN are structured in three layers: (a) the input layer, (b) one hidden layer, and (c) the output layer. Correspondingly, neurons in these layers are called “input neurons”, “hidden neurons” and “output neurons”. Input neurons transport the information used for the detection of ash and the determination of its properties into the NN, i.e. each observation and ancillary data are assigned a single neuron. Output neurons contain the information about the desired ash properties, while the hidden neurons collect, combine and process data forwarded by the input neurons and fire the results to the output neurons, where the output quantities are produced. The number of hidden neurons is selected in analogy to the ice cloud retrieval COCS (Kox et al., 2014) that proved to yield accurate results for the remote sensing of ice clouds with the same spaceborne sensor MSG2/SEVIRI and with 10 input and two output variables. As in Kox et al. (2014), 600 neurons for the hidden layer have been adopted as a trade-off between accuracy and CPU time consumption. Similarly, VADUGS uses 17 input variables (see Sect. 4.2) and two output variables, VAMC and VATH. A feed-forward NN is implemented where all connections between neurons are in the forward direction (from input layer to output layer through the hidden layer), while connections within a layer or backward connections are forbidden. A numeric tunable weight is assigned to each neuron connection. Every neuron processes the output from all neurons in the preceding layer weighted with the corresponding connection weights through a non-linear activation function, the logistic function in our case. Thus, the NN can learn patterns and approximate functions in a sort of multi-dimensional non-linear fitting by means of a limited number of neurons. Training the NN determines the value of all the connection weights through the backpropagation technique. The input variables are fed into the NN, which computes a vector of output variables using its current weights. The total squared difference error between the estimated output and the corresponding vector of expected output is propagated backwards through the NN to update each weight using gradient descent in order to minimize the total error. The training stops when no reduction in the sum of the quadratic deviations is observed.
With this technique an exhaustive set of training examples containing both input and output variables must be available.
In this section the details of the radiative transfer calculations are explained.
3.1 Radiative transfer calculations
Accurate and realistic 1D simulations of the satellite observations with realistic and representative atmospheric conditions are crucial for the successful training of the NN and especially for its successful application to real data.
3.1.1 Scene selection
The MSG/SEVIRI grid consists of more than 13 million pixels, including space. In order to homogeneously cover the full Earth disk with a moderate amount of simulations and in view of the coarser spatial resolution of the atmospheric data from the European Centre for Medium-Range Weather Forecasts (ECMWF, see Sect. 3.1.2), the original satellite grid was reduced by a factor of 100 by selecting every 10th pixel in x and y direction. This results in a grid with 102 799 points that are homogeneously distributed over the SEVIRI disk. Therefore, these locations are not homogeneously distributed in the latitude–longitude space and the data density in the latitude–longitude space close to the subsatellite point is thus highest and decreases towards the edge of the Earth disk. Locations in this reduced geographical grid are selected randomly, ensuring that all positions are considered. Atmospheric and surface properties are then collected according to their geographic locations.
3.1.2 Atmospheric profiles of gases and clouds
ECMWF IFS (Integrated Forecast System) analysis data are used for the majority of the quantities, i.e. surface pressure, geopotential, land–sea mask, skin temperature, temperature, specific humidity, ozone mass mixing ratio, cloud cover, cloud liquid water content (LWC), and cloud ice water content (IWC). This enables the compilation of realistic atmospheric profiles at the given locations of the simulation (Sect. 3.1.1). Data are defined on a latitude–longitude grid covering the entire globe. Vertical variability from the surface up to the model top is considered with the full set of model levels. IFS data are available at different spatial and temporal resolutions depending on the user needs and model version; the data characteristics selected for VADUGS are illustrated in Sect. 4.2 for the present application.
The 1D vertical atmosphere structure is set up by calculating pressure, temperature, height, humidity and ozone for each atmospheric layer from ECMWF data for the selected simulation location and time. The barometric formula is applied to compute the respective height range. Water vapour and ozone stem from ECMWF.
Atmospheric gas absorption properties are computed through the low-resolution band models developed for the LOWTRAN 7 atmospheric transmission code (Pierluissi and Peng, 1985) that uses an exponential sum fit with a resolution of 20 cm−1. We implemented 15 spectral grid points for each MSG2/SEVIRI thermal channel (Sect. 2.1) under consideration of the corresponding spectral response function. The code was adopted from SBDART (Ricchiazzi and Gautier, 1998).
Cloud vertical profiles of liquid and ice water content are obtained from IFS and effective radii necessary for the radiative transfer model (Sect. 3.1.6) are parameterized. Based on these values, optical properties are then assigned to every cloud. This method is described in detail in Appendix A.
3.1.3 Atmospheric profiles of volcanic ash
Volcanic clouds as well as other airborne aerosols show variations in size, shape and composition (see e.g. Langmann, 2013) as a consequence of differing origin conditions and transport processes such as gravitational settling, wash-out, etc. In this study, volcanic ash is represented by a homogeneous layer with random values for its vertical position in the atmosphere, vertical extent, and homogeneous mass volume concentration. The assumption of airborne aerosol occurring in the form of one layer is common practice, see Lee et al. (e.g. 2014), although multiple layers are not uncommon in observations (e.g. Marenco et al., 2011; Schumann et al., 2011).
Top height is at most 18 km above the surface, vertical extent is limited to 2.5 km and volcanic ash bottom height is computed as top minus extent.
The refractive indices m of volcanic ash for Eyjafjallajökull are as described in Appendix B. Please note that this enables the retrieval to be tailored to this eruption; however, the validation in Sect. 4.4.4 shows that VADUGS provides VAMC with a similar accuracy also for the Puyehue-Cordón Caulle eruption in 2011, thus indicating that its applicability could be extended to other volcanoes. Nevertheless, the usage of refractive indices for Eyjafjallajökull represents a principle limitation of VADUGS, which has been addressed by its successor (see Sect. 6).
3.1.4 Surface properties
The relevant surface property needed for realistic radiative transfer simulations in the infrared spectral range is the surface emissivity. According to the time selected for the ECMWF profiles (Sect. 3.1.2), the suitable monthly data from the surface emissivity data set are selected to ensure consistency. For land pixels it is obtained from Seemann et al. (2008) for the year 2010, where monthly surface emissivity maps are available globally at 10 wavelengths located at 3.6, 4.3, 5.0, 5.8, 7.6, 8.3, 9.3, 10.8, 12.1, and 14.3 µm with 0.05∘ spatial resolution in latitude and longitude. The radiative transfer model interpolates linearly in between. For water pixels, a spectral and time constant value of 0.986 is used, corresponding, e.g. to the sea surface emissivity measured in Niclòs et al. (2005) for wind speeds of 5–10 m s−1 in the spectral range 8–14 µm encompassing all relevant SEVIRI channels for a viewing zenith angle of 25∘. The fact that monthly means are used for radiative transfer simulations on particular days at selected times of the day does not affect the quality of the resulting data set since it does not spoil the aim of producing realistic satellite observations.
3.1.5 Viewing geometry
The only relevant viewing geometry parameter in 1D thermal radiative transfer is the viewing zenith angle of the satellite (the position of the Sun is not relevant). Although we select fixed locations on the SEVIRI grid (Sect. 3.1.1), radiative transfer simulations are always run for a set of 41 cosines of the viewing zenith angles from 0.2 (corresponding to ∼78∘ viewing zenith angle) to 1.0 (nadir). This is done for three reasons: (a) we do not want the NN to learn fixed relationships between latitude and viewing zenith angle (for this reason latitude is also not an input variable of VADUGS, see Sect. 4.2); (b) the NN is given the chance to extract information about the transmissivity of the ash clouds as a function of viewing zenith angle from the input data; and (c) the resulting data set of simulated BTs will be filtered (Sect. 4.2) to keep only those that show a clear ash signal, which strongly reduces the number of ash-loaded pixels available for training. This is meant to compensate for the fact that this approach might also lead to a more difficult learning procedure since not all meteorological conditions are observed for all viewing angles.
3.1.6 Radiative transfer model
The software package libRadtran (Emde et al., 2016; Mayer and Kylling, 2005) is used to realistically simulate satellite radiances and to compute results of satellite measurements in the form of BTs. All radiative transfer simulations make use of a C version of the 1D solver DISORT (Stamnes et al., 1988; Buras et al., 2011) with 16 streams. Input data relevant to the radiative transfer model in the thermal range have been described in the previous sections: satellite zenith angle, surface properties such as temperature and surface emissivity, vertical profiles of temperature and gas concentrations, water and ice cloud properties such as height, water content, and particle effective radius, as well as aerosol layer properties such as height, aerosol optical properties, and mass concentration. Gas absorption is considered through LOWTRAN (see Sect. 3.1.2).
3.1.7 RTSIM
To manage and automate the generation of data sets, the programme RTSIM was developed. RTSIM is coded in Python 3 and based on a corresponding module providing classes and functions as an interface to the underlying database and the radiative transfer model. After start-up, all input data are accessed via its data management class. All environment parameters are prepared as input, and suitable configuration commands are passed to the radiative transfer model. RTSIM supports independent processing modules, which can be used simultaneously, as well as communication through client applications during runtime. The integrity of defined functions is checked by calling a module-based self-test, which in turn performs several unit tests. RTSIM has been designed to run radiative transfer calculations in parallel. It combines multi-threading with asynchronous handling of subprocesses in a scalable manner with respect to CPython's Global Interpreter Lock (GIL). For long-running subprocesses and a suitable number of available CPU cores, this can lead to a significant decrease in computation time. RAM drives are used to decrease I/O delays and thus decrease runtime. Results of radiative transfer simulations are stored in the output data set, together with all the information needed to determine the environment state including all aforementioned quantities for surface and atmosphere.
First, RTSIM randomly selects a day for the input atmospheric parameters (Sect. 3.1.2) and a SEVIRI grid point from the corresponding input file (Sect. 3.1.1). Its geographic coordinates are mapped by a nearest-neighbour algorithm to the ECMWF grid such that skin temperature, gas and cloud profiles can be extracted (Sect. 3.1.2). Optical properties are then assigned to the cloud layers (Sect. 3.1.6). Surface properties for the pixel location are extracted from the suitable emissivity file (Sect. 3.1.4) and a volcanic ash layer (Sect. 3.1.3) is added to the atmosphere. Finally, the entire set of 41 satellite zenith angles described in Sect. 3.1.5 is assigned to the simulation.
The radiative transfer solver is called two times (with and without ash profile) when the atmosphere (Sect. 3.1.2) does not contain clouds. When the atmosphere contains cloud layers, the radiative transfer solver is called four times (with and without ash profile for the atmosphere with and without clouds). If ice clouds are present, ice crystal habit is selected randomly but is the same for the two calculations with clouds (with and without ash). Every call to the radiative transfer solver produces seven thermal SEVIRI observations for the 41 viewing geometries.
This section describes the training data set used for the VADUGS implementation and the NN and its training.
4.1 The training data set
The training data set is compiled using the RTSIM tool (Sect. 3.1.7). To optimally cover different seasonal conditions, we select day 15, 12:00 UTC for 12 months from February 2010 to January 2011. This period of time encompasses the Eyjafjallajökull eruption, for which the algorithm was initially created, and consists of data from one single ECMWF IFS model version (cycle CY36R1, started end of January 2010). Spatial resolution amounts to 0.25∘ in latitude and longitude, while the vertical grid of atmospheric model levels encompasses 91 layers (ECMWF, 2010). Although only one time of the day is used, different local times can also be covered due to the fact that many viewing zenith angles are simulated for every atmospheric column. Furthermore, VADUGS only relies on thermal observations such that the position of the Sun above the horizon is not relevant. Nevertheless, nighttime variability of, e.g. surface properties such as temperature cannot be accounted for (this has been improved for the VADUGS successor).
Volcanic ash layers are selected in the following way. In 10 279 900 simulations, ash mass volume concentration is a random number between 0.001 and 10 g m−3, while an additional 1 200 000 simulations with mass volume concentration between 0.001 and 20 g m−3, 1 200 000 simulations with mass volume concentration between 0.05 and 2.15 g m−3 and 600 000 simulations with mass volume concentration between 0.001 and 1000 g m−3 are performed to stress on one hand medium-range concentrations and on the other hand also high concentration peaks. This makes a total of 13 279 900 atmospheric ash profiles used for the radiative transfer simulations.
Although the entire simulation data set provides a realistic and extensive basis for the training of an NN, three additional constraints are implemented to make sure that a clear relationship between input and output data is provided to the NN. Thus, the results of the simulations are filtered according to the following criteria:
If one of these conditions is fulfilled, the corresponding VAMC and VATH are set to zero. The first one aims at identifying only pixels that are distinct from ice clouds, whose typical signature in split window channels is a negative BTD(10.8–12.0) (e.g. Inoue, 1985), while the second and third condition exclude all low-level liquid water clouds (BTD(8.7–10.8) ≥ 0 K is typical for the ice phase, e.g. Baum et al., 2000). The training data set eventually contains 40 057 800 samples, 965 268 have non-zero VAMC and VATH, with a VAMC range from 0.12 mg m−2 to 2.446 kg m−2 and VATH from 22.2 m to 17.9 km. The histogram of VAMC, of VATH and their combined histograms are given in Fig. 1. It shows that VAMC centres on values lower than 5 g m−2 and VATH extends to 14 km in the majority of the cases. Moreover, one can distinguish between weak eruptions (VATH up to 5 km) and stronger eruptions with ash up to 14 km. Although the data set before the filtering covers all combinations of VAMC and VATH, the filtered data set is reduced in this respect such that VAMC > 6–7 g m−2 are not found at VATH greater than 7 km at most. This represents a limitation especially close to the vent of the volcano, but as seen in the validation against CALIOP (Sect. 4.4.4) the values of VAMC found there are well below these values of 6–7 g m−2. Thus, we think that in most situations this does not represent a strong limitation for VADUGS.
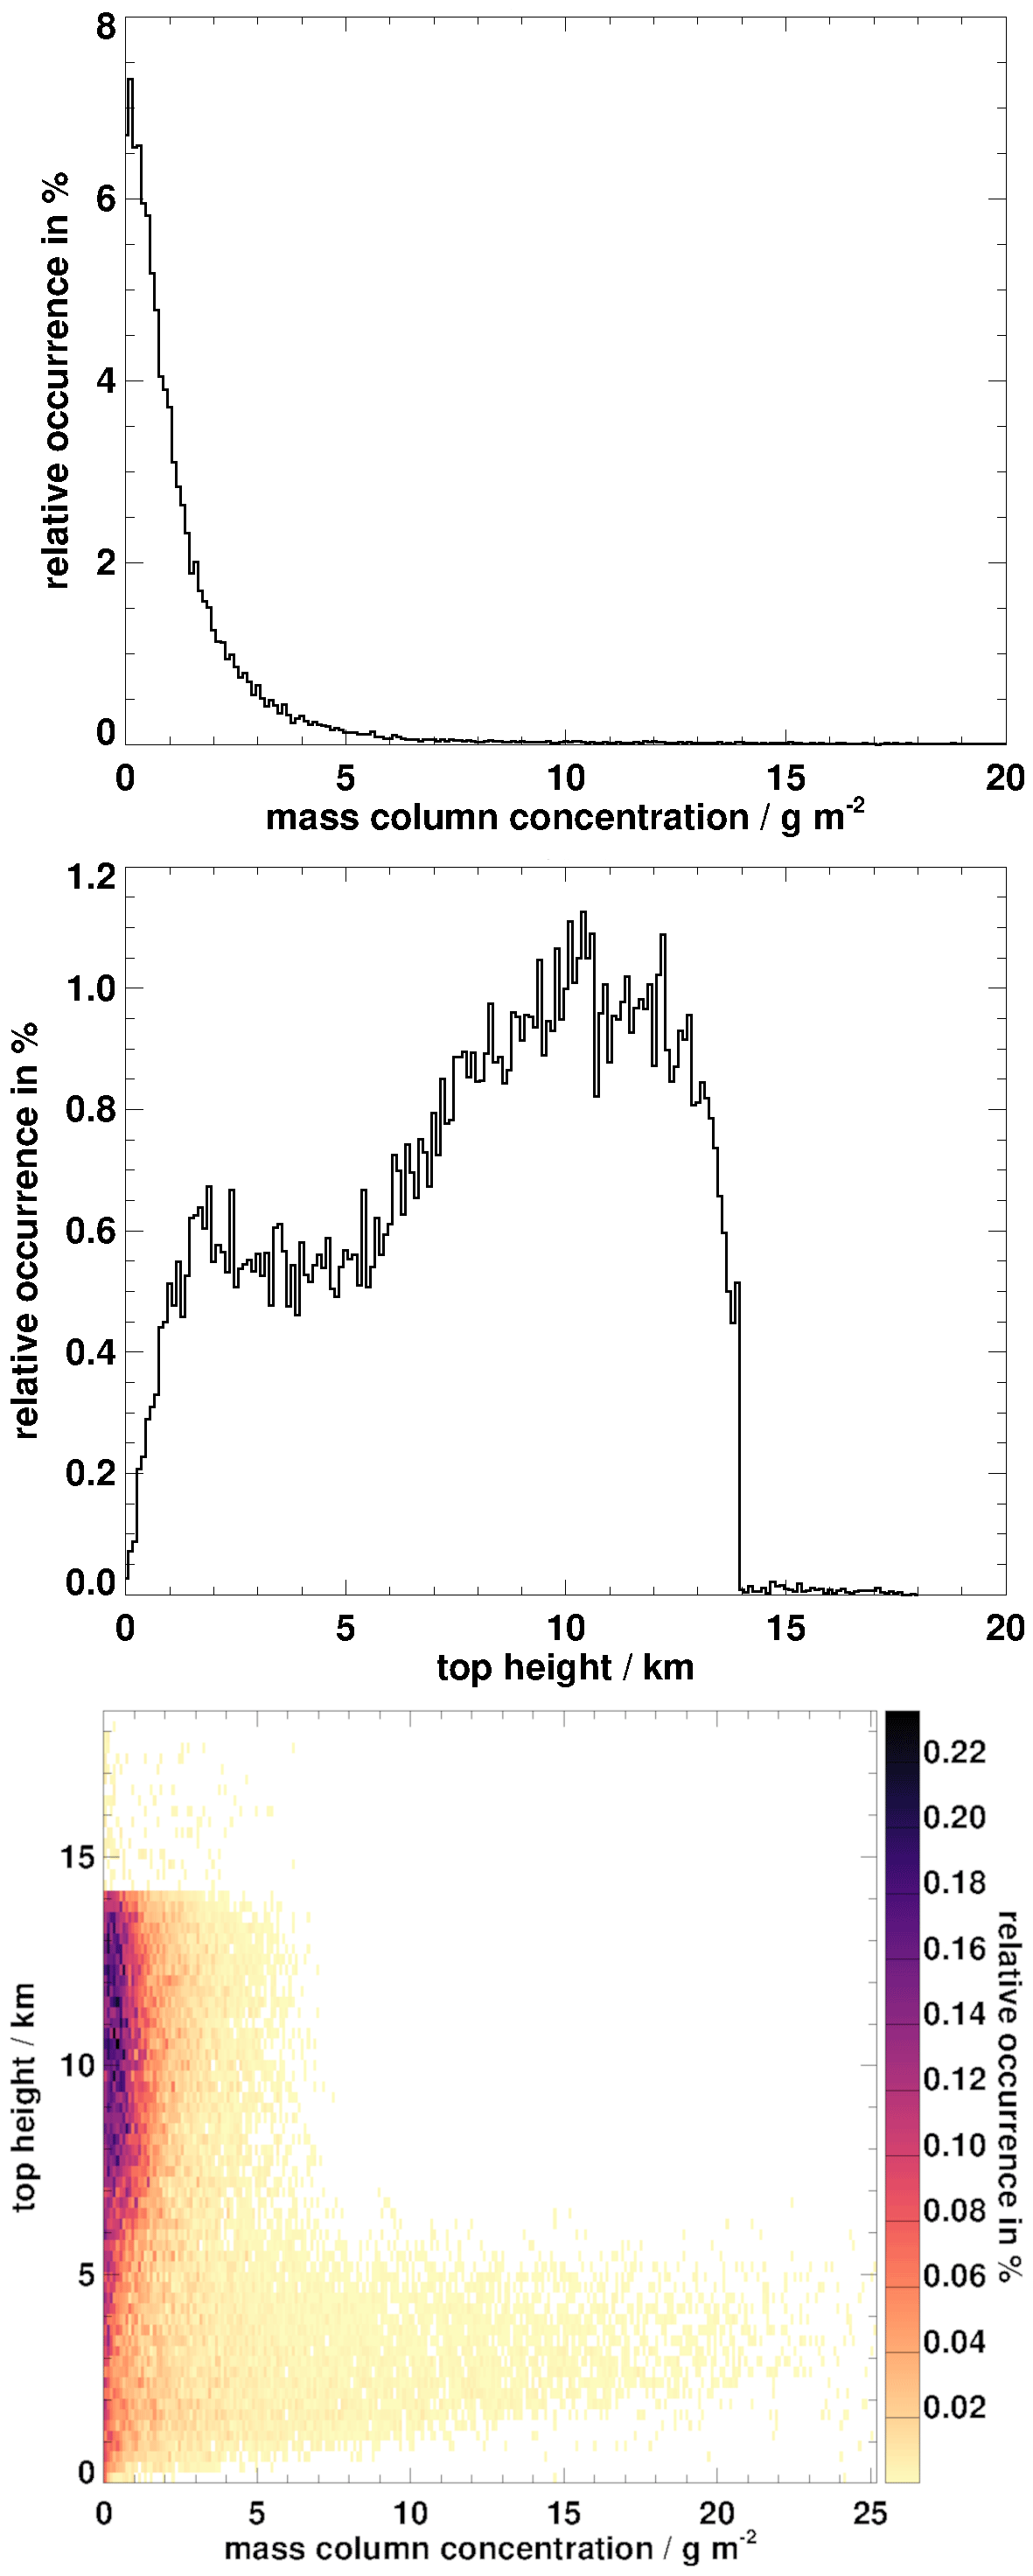
Figure 1Histogram of ash concentrations and top height in the input data set used for the calculation of the training data set.
The resulting BT differences, such as BTD(8.7–12.0) and BTD(10.8–12.0) in Fig. 2, for VAMC > 0 g m−2 show the expected behaviour, with negative values down to −25 K and a dependency on VAMC for VAMC smaller than approximately 5–6 g m−2. For higher VAMC, the BTD variations are much smaller, thus pointing to the physical limits of the passive thermal observations that reach saturation in this VAMC range. The dependency of BT at 10.8 µm on VAMC is shown in the lowest panel in Fig. 2: BT(10.8) varies from very low values close to 200 K up to 320 K, thus indicating that opaque ash layers are present at different heights. Large VAMC of > 5 g m−2 correspond to BTs between 260 and 280 K, thus corresponding to medium height levels up to approximately 5 km (see Fig. 1).
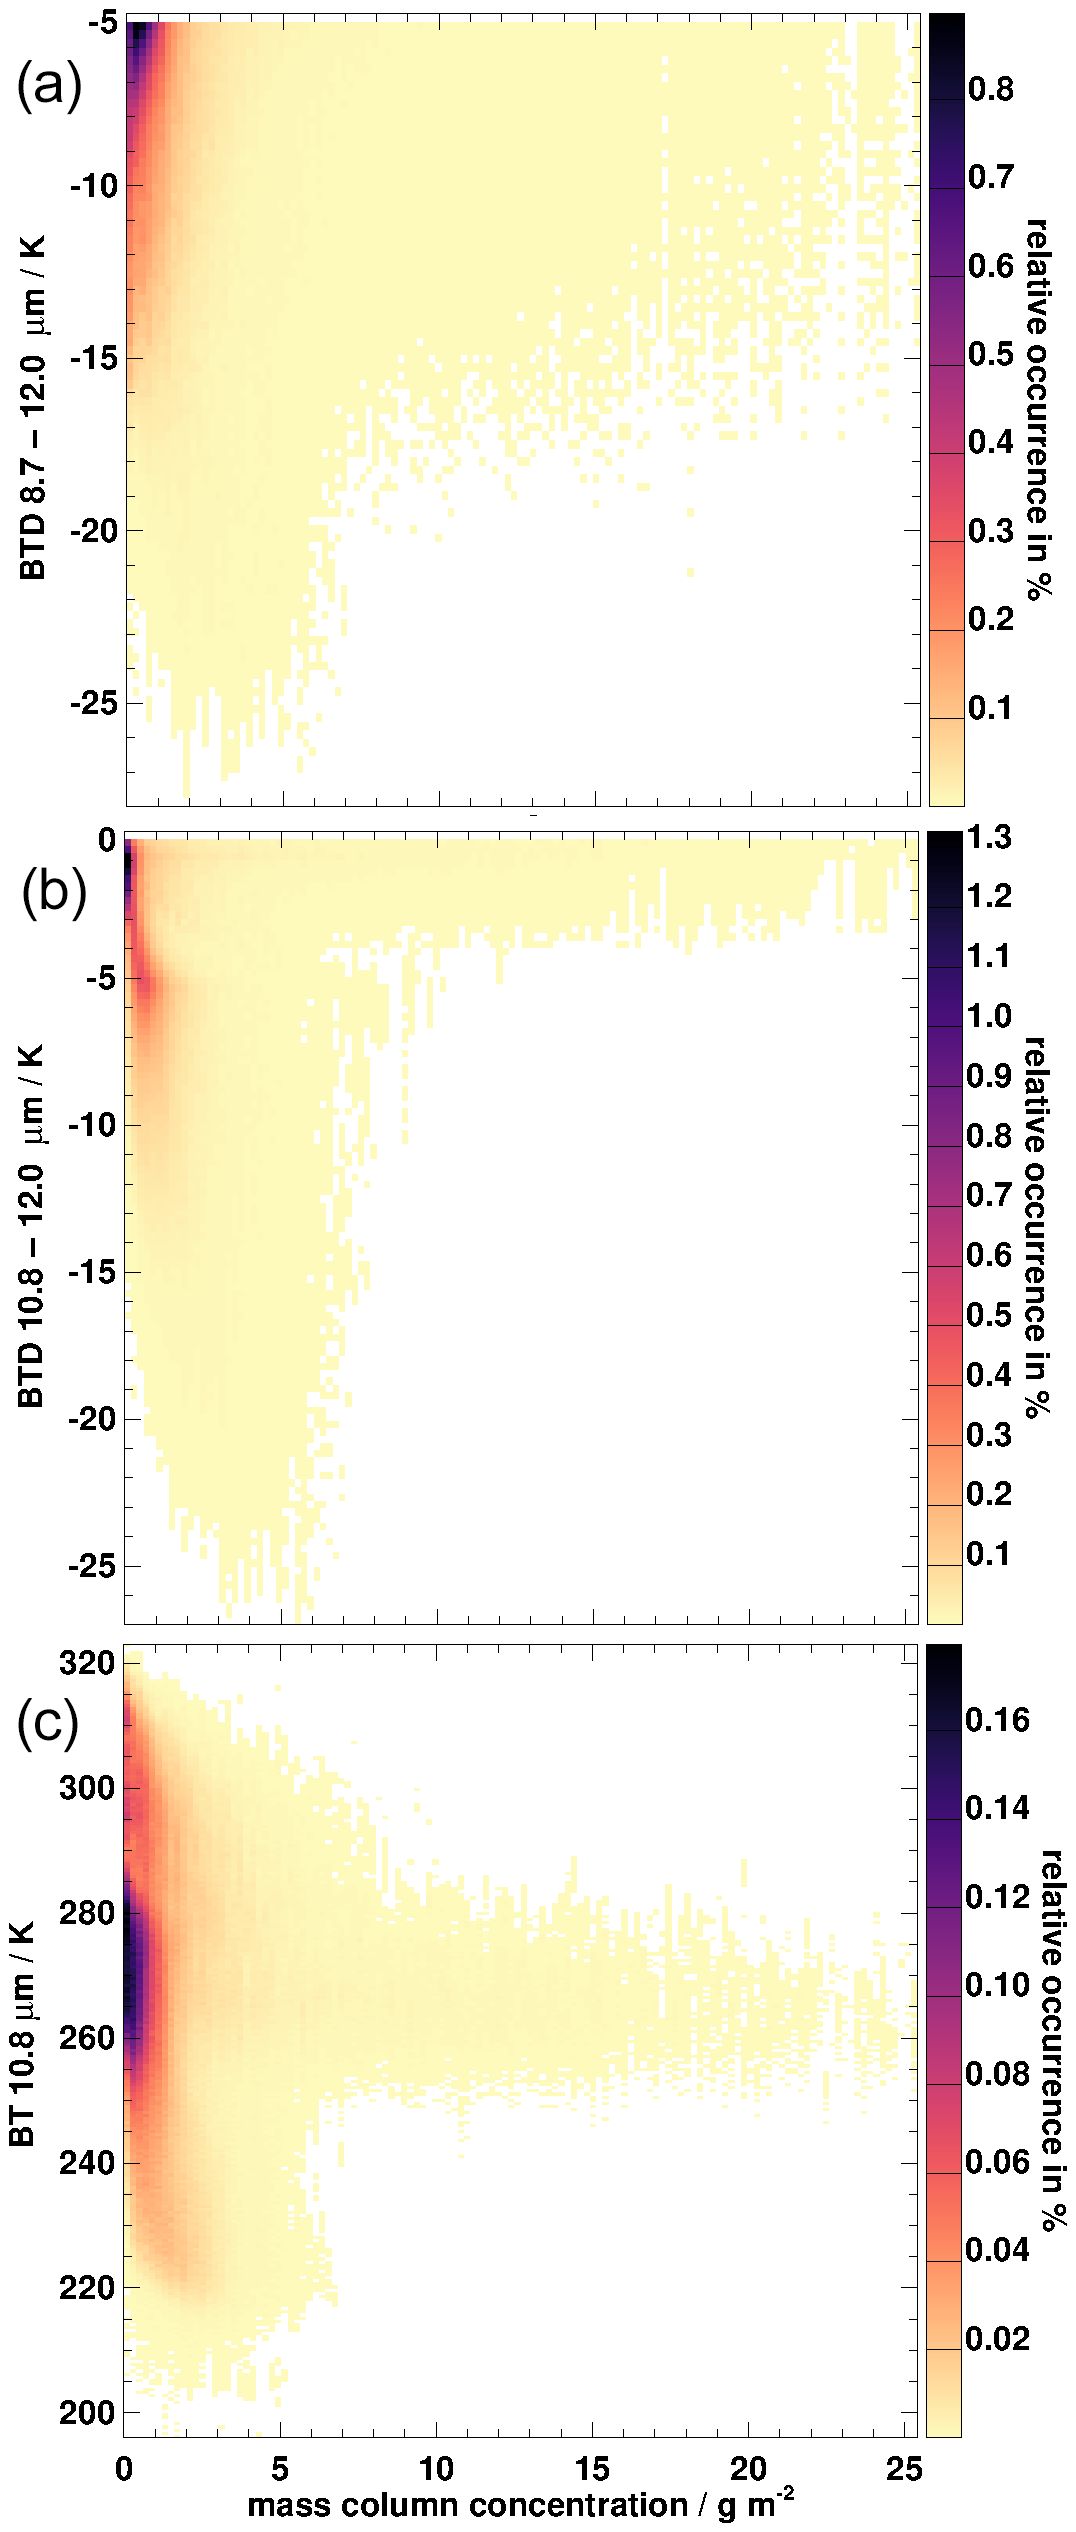
Figure 2Histogram of (a) BTD(8.7–12.0), (b) BTD(10.8–12.0) and (c) BT(10.8) for ash-contaminated simulations as a function of VAMC.
4.2 Training the neural network
The simulated observations presented in the previous section are used as input for the training of an NN. As input variables for the NN, the BTs from all seven thermal SEVIRI channels are selected together with a set of BT differences: BTD(8.7–9.7), BTD(8.7–10.8), BTD(8.7–12.0), BTD(8.7–13.4), BTD(9.7–12.0), BTD(9.7–13.4) and BTD(6.2–7.3). The BTDs containing window channels alone (8.7, 10.8 and 12.0 µm channels) are meant to yield the physics of thin layers in the atmosphere. Of course, other BTDs, e.g. the most widely used BTD(10.8–12), can be implicitly obtained by the NN through a combination of the available ones.
BTDs with the CO2 channel (centred at 13.4 µm) are supposed to transport direct information about ash layer height, since the vertical weighting function of this channel has a broad peak in the troposphere (and for this reason is used for CO2 slicing, see e.g. Menzel et al., 1983). Finally, BTDs with the ozone channel (centred at 9.7 µm) carry information about the ozone yearly cycle and its geographic distribution. Due to large possible variations in stratospheric ozone columns during the course of the year and to the considerable variability in surface temperatures, especially at high latitudes, this channel must be handled with care in order to prevent misdetections, as was for instance the case in Ewald et al. (2013) with respect to cirrus cloud detection. Although the NN is able to deduce relationships between input variables during training, the provision of BT differences is supposed to facilitate and speed up the learning process since these quantities explicitly contain the physics of the problem. However, the usage of an NN prevents us from defining a priori thresholds to the BTDs such as, e.g. in Yu et al. (2002) and Francis et al. (2012). Furthermore, skin temperature (from ECMWF, Sect. 3.1.2) together with a land/sea flag is selected as input in order to describe surface emission properties. Surface emissivity is neglected here since its variability is thought to be of secondary importance compared to surface temperature and because it is difficult to obtain daily/hourly values of this quantity, especially for a possible near real-time application. Finally, viewing zenith angle helps considering the slant path of radiation through the atmosphere. This makes a total of 17 input variables.
Output variables are, as already mentioned, VAMC and VATH (two output variables), the topology of the VADUGS NN and the backpropagation procedure that were presented in Sect. 2.2. The final training data set described previously is randomly mixed and fed into the NN.
4.3 Applying the neural network
For the application of the NN, BTs from all thermal channels are needed according to the previous section, but also a land/sea flag, that we consider fixed in time, and a viewing zenith angle map, which can also be considered as fixed if the spacecraft is located above 0∘ E over the Equator and fluctuations around this point are neglected. Nevertheless, skin temperature must still be provided. This quantity is extracted from ECMWF analysis data for the training (Sect. 3.1.2), but in principle it can be obtained from other sources as well. A short discussion about this aspect is given in Sect. 5.
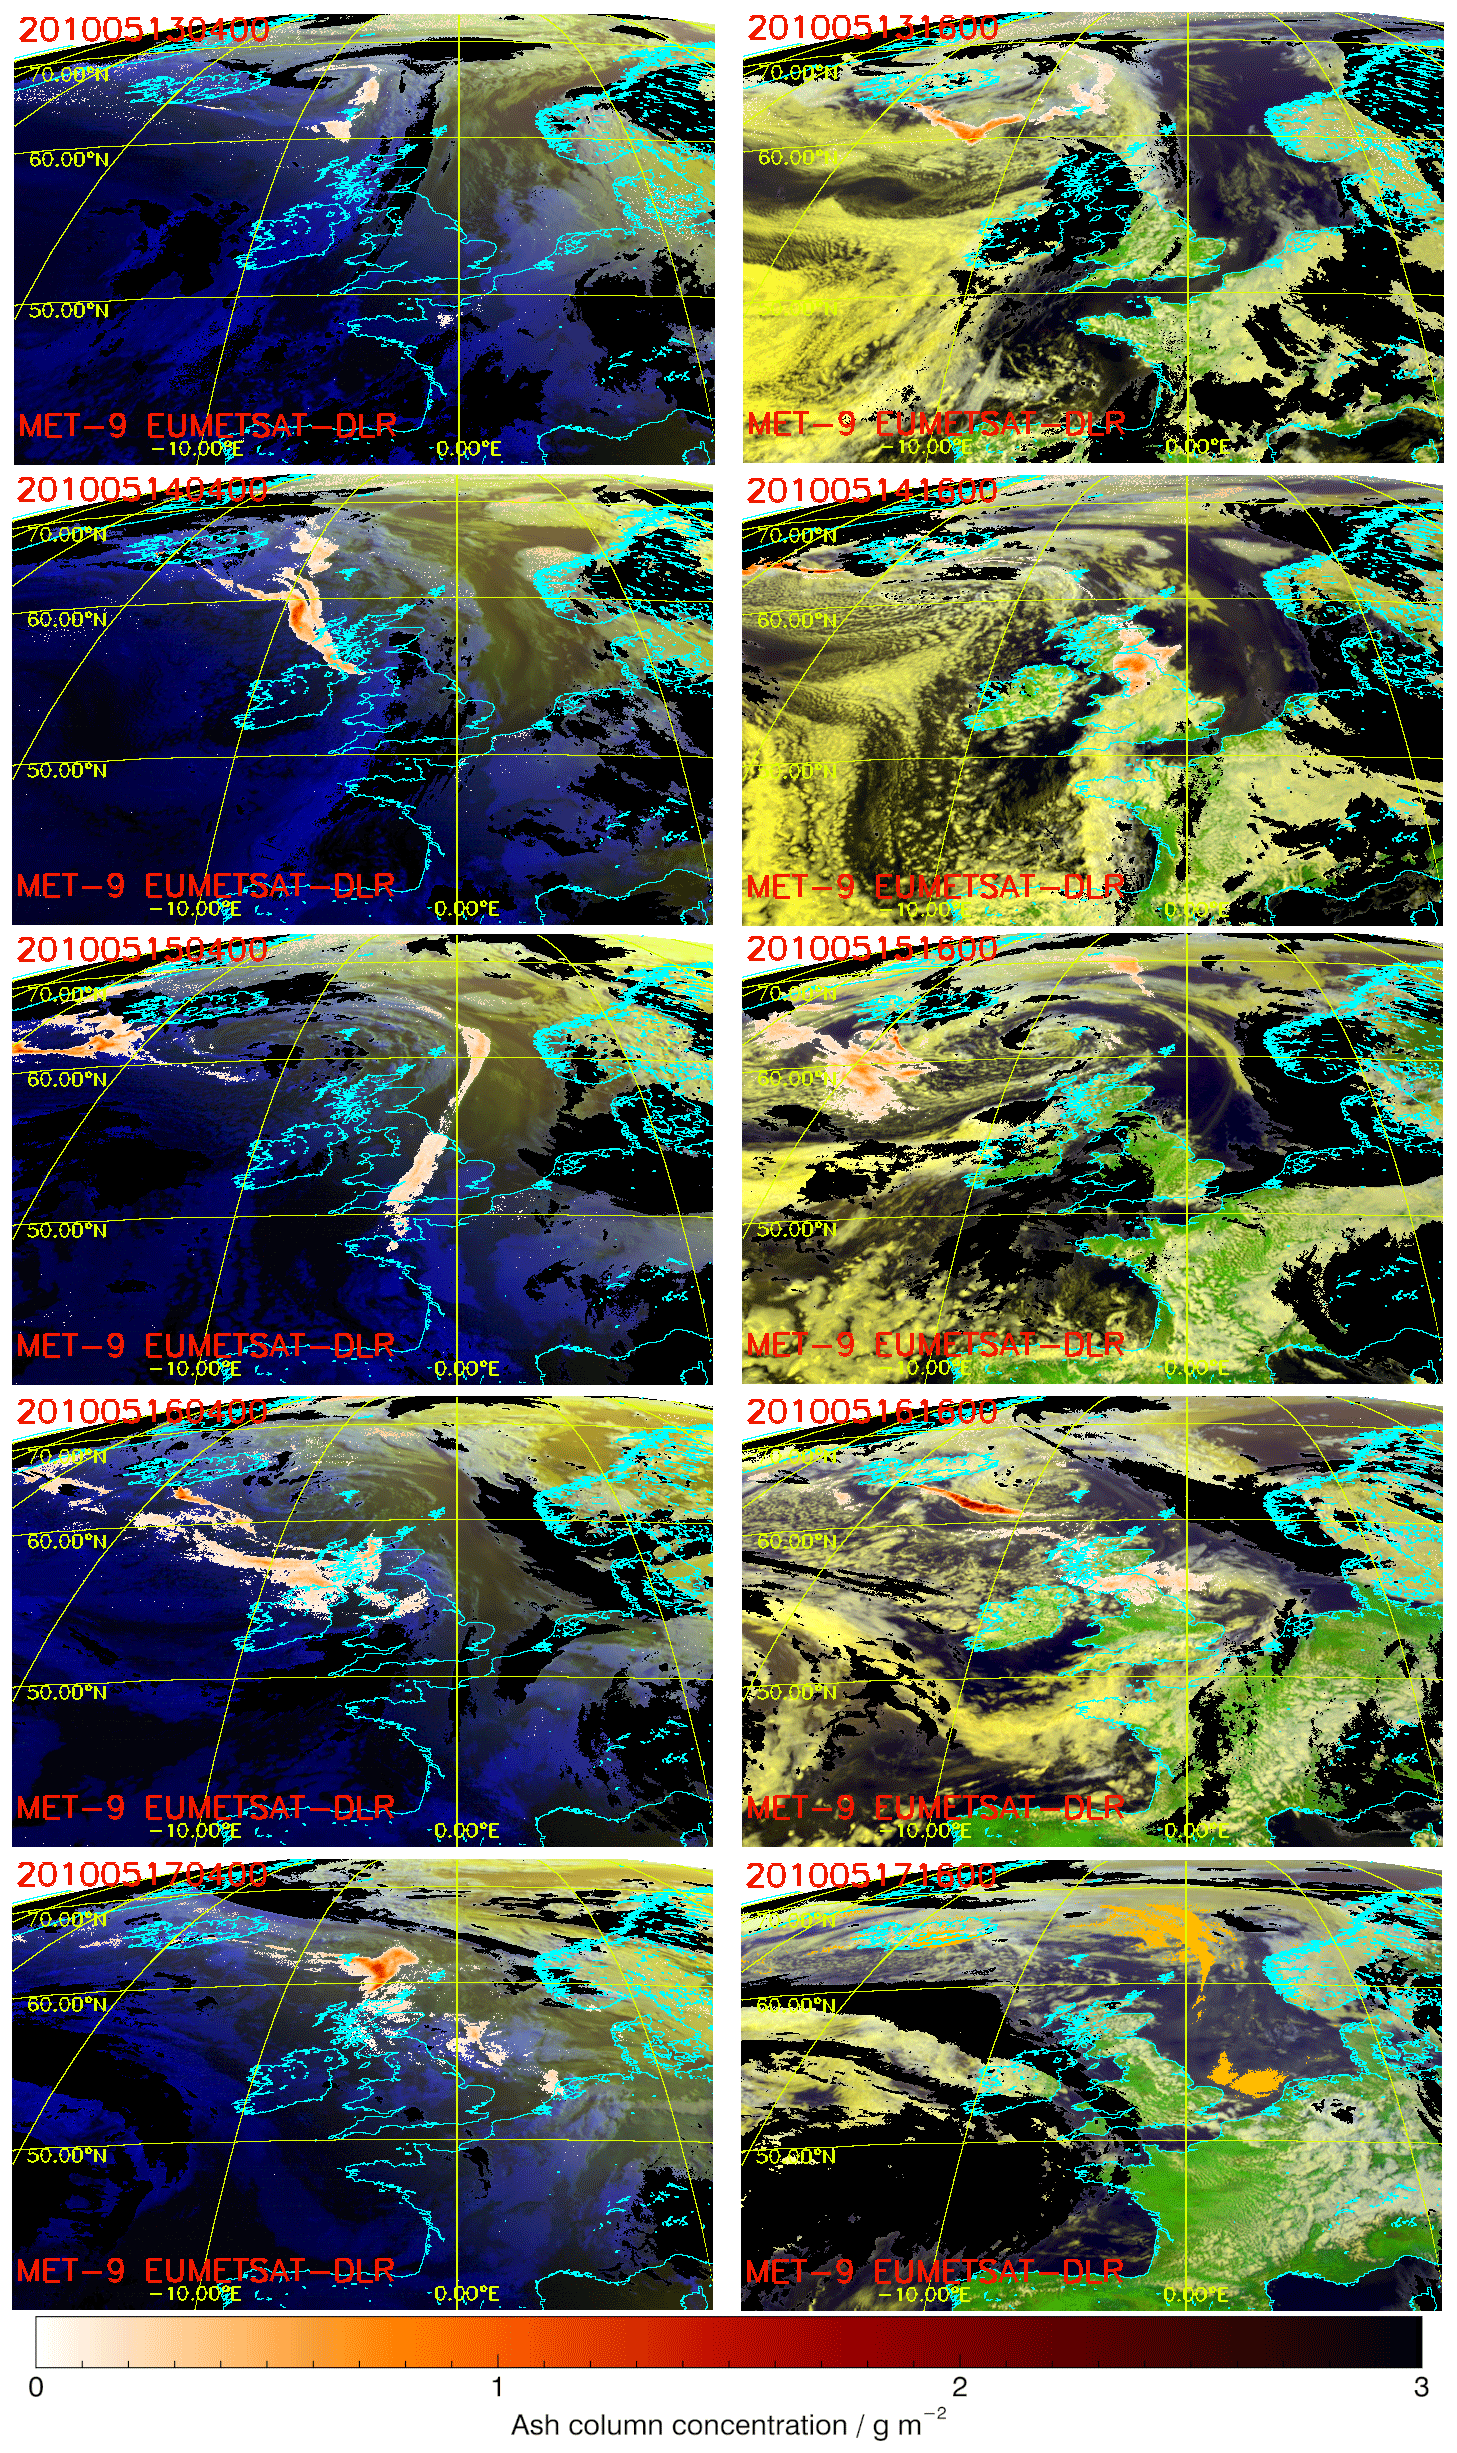
Figure 3False colour RGB images with VAMC as white–red cloud on top (0–3 g m−2) for the Eyjafjallajökull eruption in May 2010. Here, SEVIRI2 observations are shown between 13 May 2010 04:00 UTC and 17 May 2010 16:00 UTC in 12 h steps.
The output quantities are VAMC and VATH. The detection of ash contaminated pixels must be performed through VAMC and is discussed in detail in the next section. Here we show a sequence of false colour RGB pictures with VAMC overlays from 13 May 2010 04:00 UTC to 17 May 2010 16:00 UTC in 12 h steps (Fig. 3) during the third phase of the Eyjafjallajökull eruption (Langmann et al., 2012). The false colour RGBs are based on the SEVIRI2 solar channels centred at 0.6, 0.8 µm and the inverted thermal 10.8 µm channel. During nighttime, only temperature information is available such that blue shades are obtained, during daytime colours mimic true colour images. In all panels, black areas correspond to ice clouds as detected by the COCS algorithm (Kox et al., 2014): Here, no assertion about the presence of ash can be made. Red colours indicate VAMC from 0 to 3 g m−2 (see scale at the bottom), pixels with VAMC values lower than 0.05 g m−2 are treated as ash free. The region selected comprises Iceland in the north-west corner, Great Britain in the centre, Scandinavia in the north-east part and France–Germany–Denmark over central Europe. The VADUGS retrieval clearly shows the ash emitted by the Eyjafjallajökull volcano in the south of Iceland and how the ash cloud is transported by winds first towards the east (13 May 2010 04:00 UTC), then towards south-east. Through the use of thermal observations, ash information can be derived with the same accuracy during both day and night. The cloud reaches Great Britain on 14 May 2010 and is observable there for many hours, while the winds close to the volcano change and blow ash to the west along high latitudes. From 16 May 2010 the ash is carried again towards Great Britain, with some small patches reaching the continent. On 17 May 2010 16:00 UTC a relatively large ash cloud is located above the North Sea, where it was probed by both the UK FAAM aircraft (Marenco et al., 2011) and the German DLR Falcon (Schumann et al., 2011). In general, dark red colours are typical for the ash plume close to the vent indicating high ash concentrations, while the red colours become fainter further away from the volcano, as expected through sedimentation and/or interactions with water clouds. From time to time, single ash-contaminated pixels are found: In many cases, through the visual evaluation of the full 15 min temporal evolution of the ash, they can be ascribed to thin diluted ash cloud patches, in some cases they seem to be false alarms. Thus, the algorithm is able to detect the Eyjafjallajökull ash cloud for which it has been developed in a very plausible way.
4.4 Validation
Two approaches are selected for validation of the NN. First, the NN performance is evaluated against simulated observations to assess how well the retrieval has learned the relationships between input and output variables contained in the training data set. The second approach consists in the evaluation of the NN against CALIOP observations of volcanic ash to assess the quality of the retrieval in real situations. The metrics used for this are presented in Appendix C.
4.4.1 Simulated validation data set
A second data set is simulated along the lines of the training data set (Sect. 4.1). Since most of the input data samples are concentrated to VAMC ≤ 5 g m−2 and VATH ≤ 14 km, these limits are used for the compilation of the validation data set. Of course, the same ash optical properties are used and the ash layer extent reaches 2.5 km. Again, various mass concentration regimes are selected to compose the ash profiles: 0 mg m−3, 0.001 to 0.1 mg m−3, 0.1 to 0.2 mg m−3, 0.15 to 0.25 mg m−3, 0.2 to 0.3 mg m−3, 0.3 to 1 mg m−3, 1 to 2 mg m−3, 1.5 to 2.5 mg m−3, 2 to 3 mg m−3 and 3 to 10 mg m−3. For each ash profile, samples with and without volcanic ash/meteorological clouds are simulated in various height ranges (tops between 0.5 and 14 km), thus producing the gaps observed in Fig. 4. After application of the filter implemented in Sect. 4.1 with Eq. (1), the data set comprises 3 526 397 samples with 100 083 ash loaded samples (those plotted in Fig. 4). Most points accumulate to concentrations below 1 g m−2 and only few samples at higher concentrations.
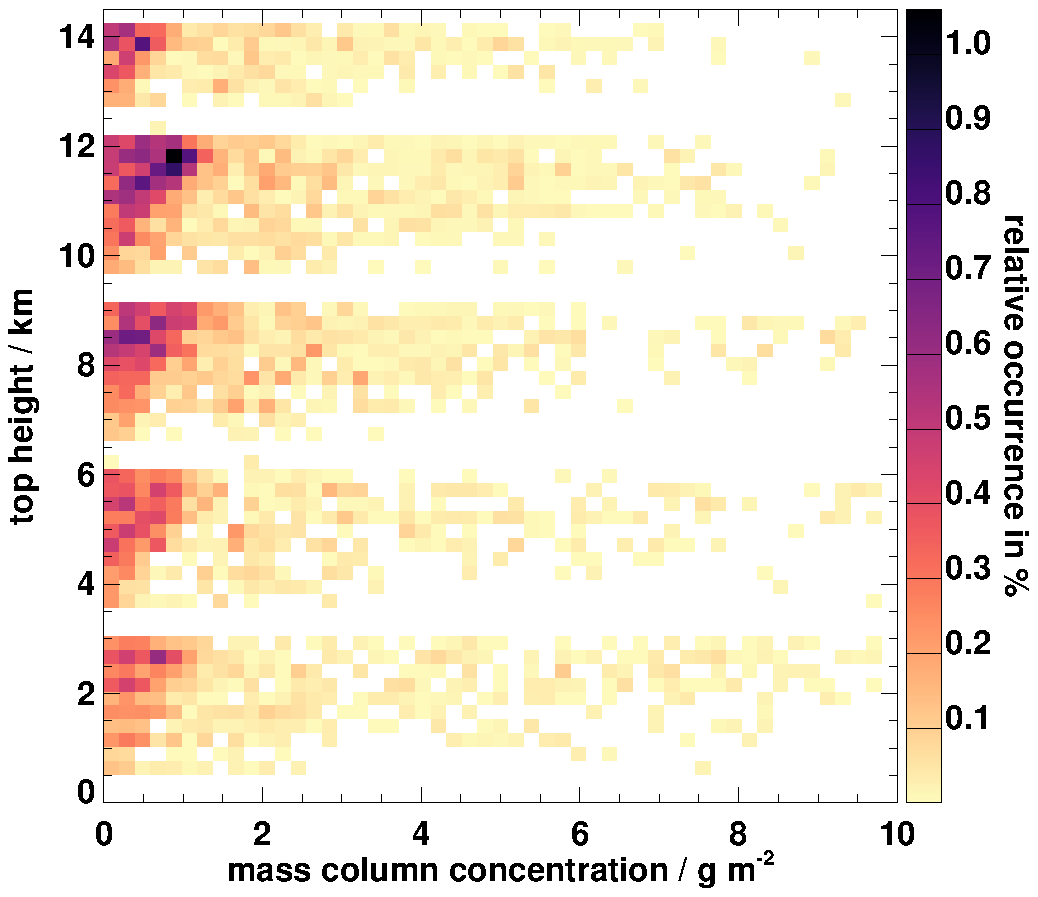
Figure 4Two-dimensional histogram of ash layer properties used as input for the calculation of the simulated validation data set.
4.4.2 Ash detection
The detection of volcanic ash clouds is performed by applying a threshold to the mass load retrieval.
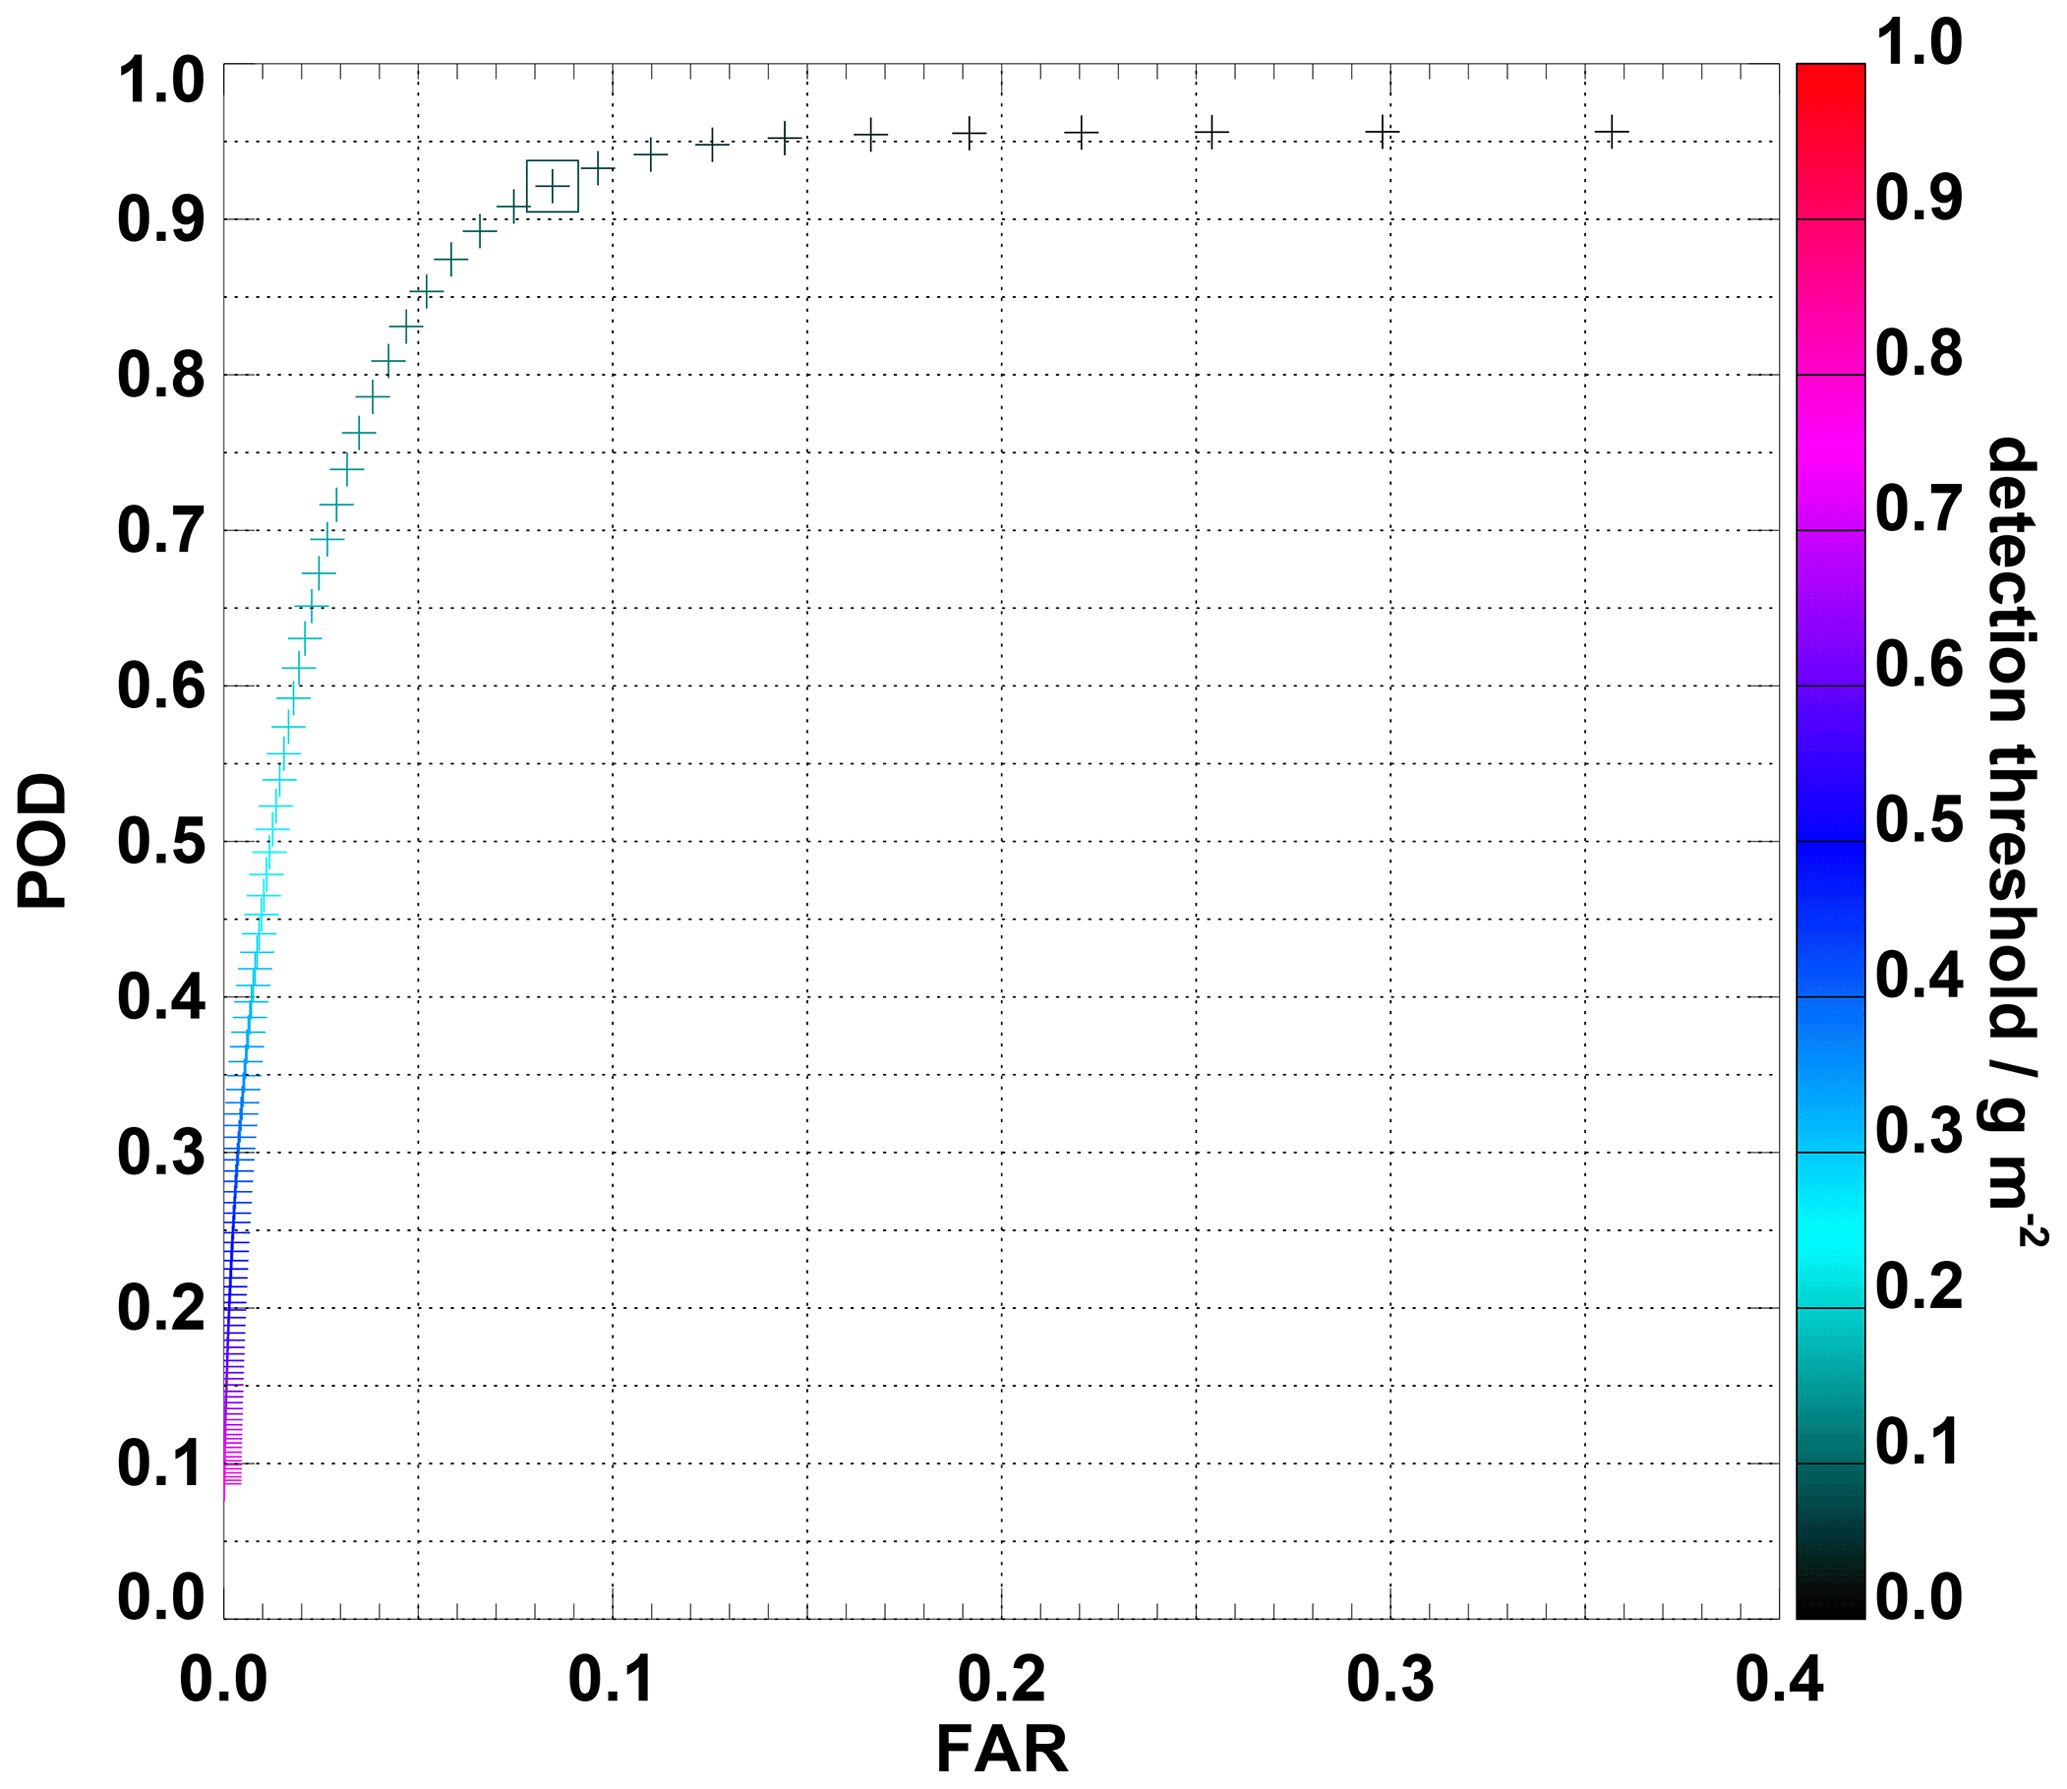
Figure 5Probability of detection (POD) against false-alarm rate (FAR) depending on the mass load threshold applied. The square marks the position corresponding to the threshold 0.1 g m−2.
Figure 5 shows the POD against the FAR for different thresholds (indicated by the colour bar). Considering all retrieval outputs with VAMC > 0 g m−2 results in a POD of 0.96 and an FAR of 0.36. Increasing the threshold value decreases both the POD and FAR. At first, the FAR decreases faster than the POD, and close to a threshold value of 0.1 g m−2 the POD starts to decrease faster as well. Thus, in the application of the VADUGS retrieval the threshold value of 0.1 g m−2 is selected as a trade-off between high POD and low FAR: Here, averaged over the entire validation data set, the POD amounts to 0.92 and the FAR to 0.08. For the threshold of 0.05 g m−2 used in Sects. 4.3 and 4.4.4, the POD amounts to 0.95 and the FAR to 0.17.
Although the POD and FAR values for a threshold of 0.1 g m−2 are very good, it should be noted that the validation data set is not well balanced with respect to ash-loaded and ash-free samples, since the latter make up a very large fraction of the data. In addition, many ash-free samples also show BTD(10.8–12.0) values close to 0 K. While negative BTDs are thought to stem mainly from ash clouds, some of them also contain meteorological clouds. Thus, to further simplify the task of the NN, we introduce an additional a priori filter:
Pixels satisfying this empirical condition are set to VAMC = 0 g m−2 and VATH is undefined. This condition applies to 2 789 235 samples of the validation data set, 2 777 879 of them being already ash free and 11 356 ash loaded, with ash column concentrations ranging from 0 to 5 g m−2. This ensures that 81.1 % of the ash-free samples are already correctly classified before the application of VADUGS, at the cost of 11.3 % of the ash-loaded samples being missed. With the help of this additional filtering, the overall POD sinks to 0.84 but the FAR also sinks to 0.05. Even if the gain in FAR (FAR measures how large fractions of the ash-free points are falsely classified as being ash, see Appendix C) is low, this can result in many pixels being misclassified as ash, which would artificially enlarge the area covered by ash that should be avoided by air traffic and is thus preferred to a larger POD. This filtering is always applied in the rest of the manuscript, and in all other applications as for instance at DWD (Sect. 5).
Finally, considering the POD as a function of true VAMC in Fig. 6 shows that VADUGS, even if the concentration threshold of 0.1 g m−2 is applied, is able to detect 60–70 % of the ash samples with true VAMC ≤ 0.1 g m−2. POD increases with VAMC and for VAMC = 0.5 g m−2 it already reaches its maximum around 90 %. On the other hand, a POD of 100 % is never reached, even for large VAMC, both because these cases might resemble thick (ash/meteorological) clouds or because they might be affected by the presence of water/ice clouds.
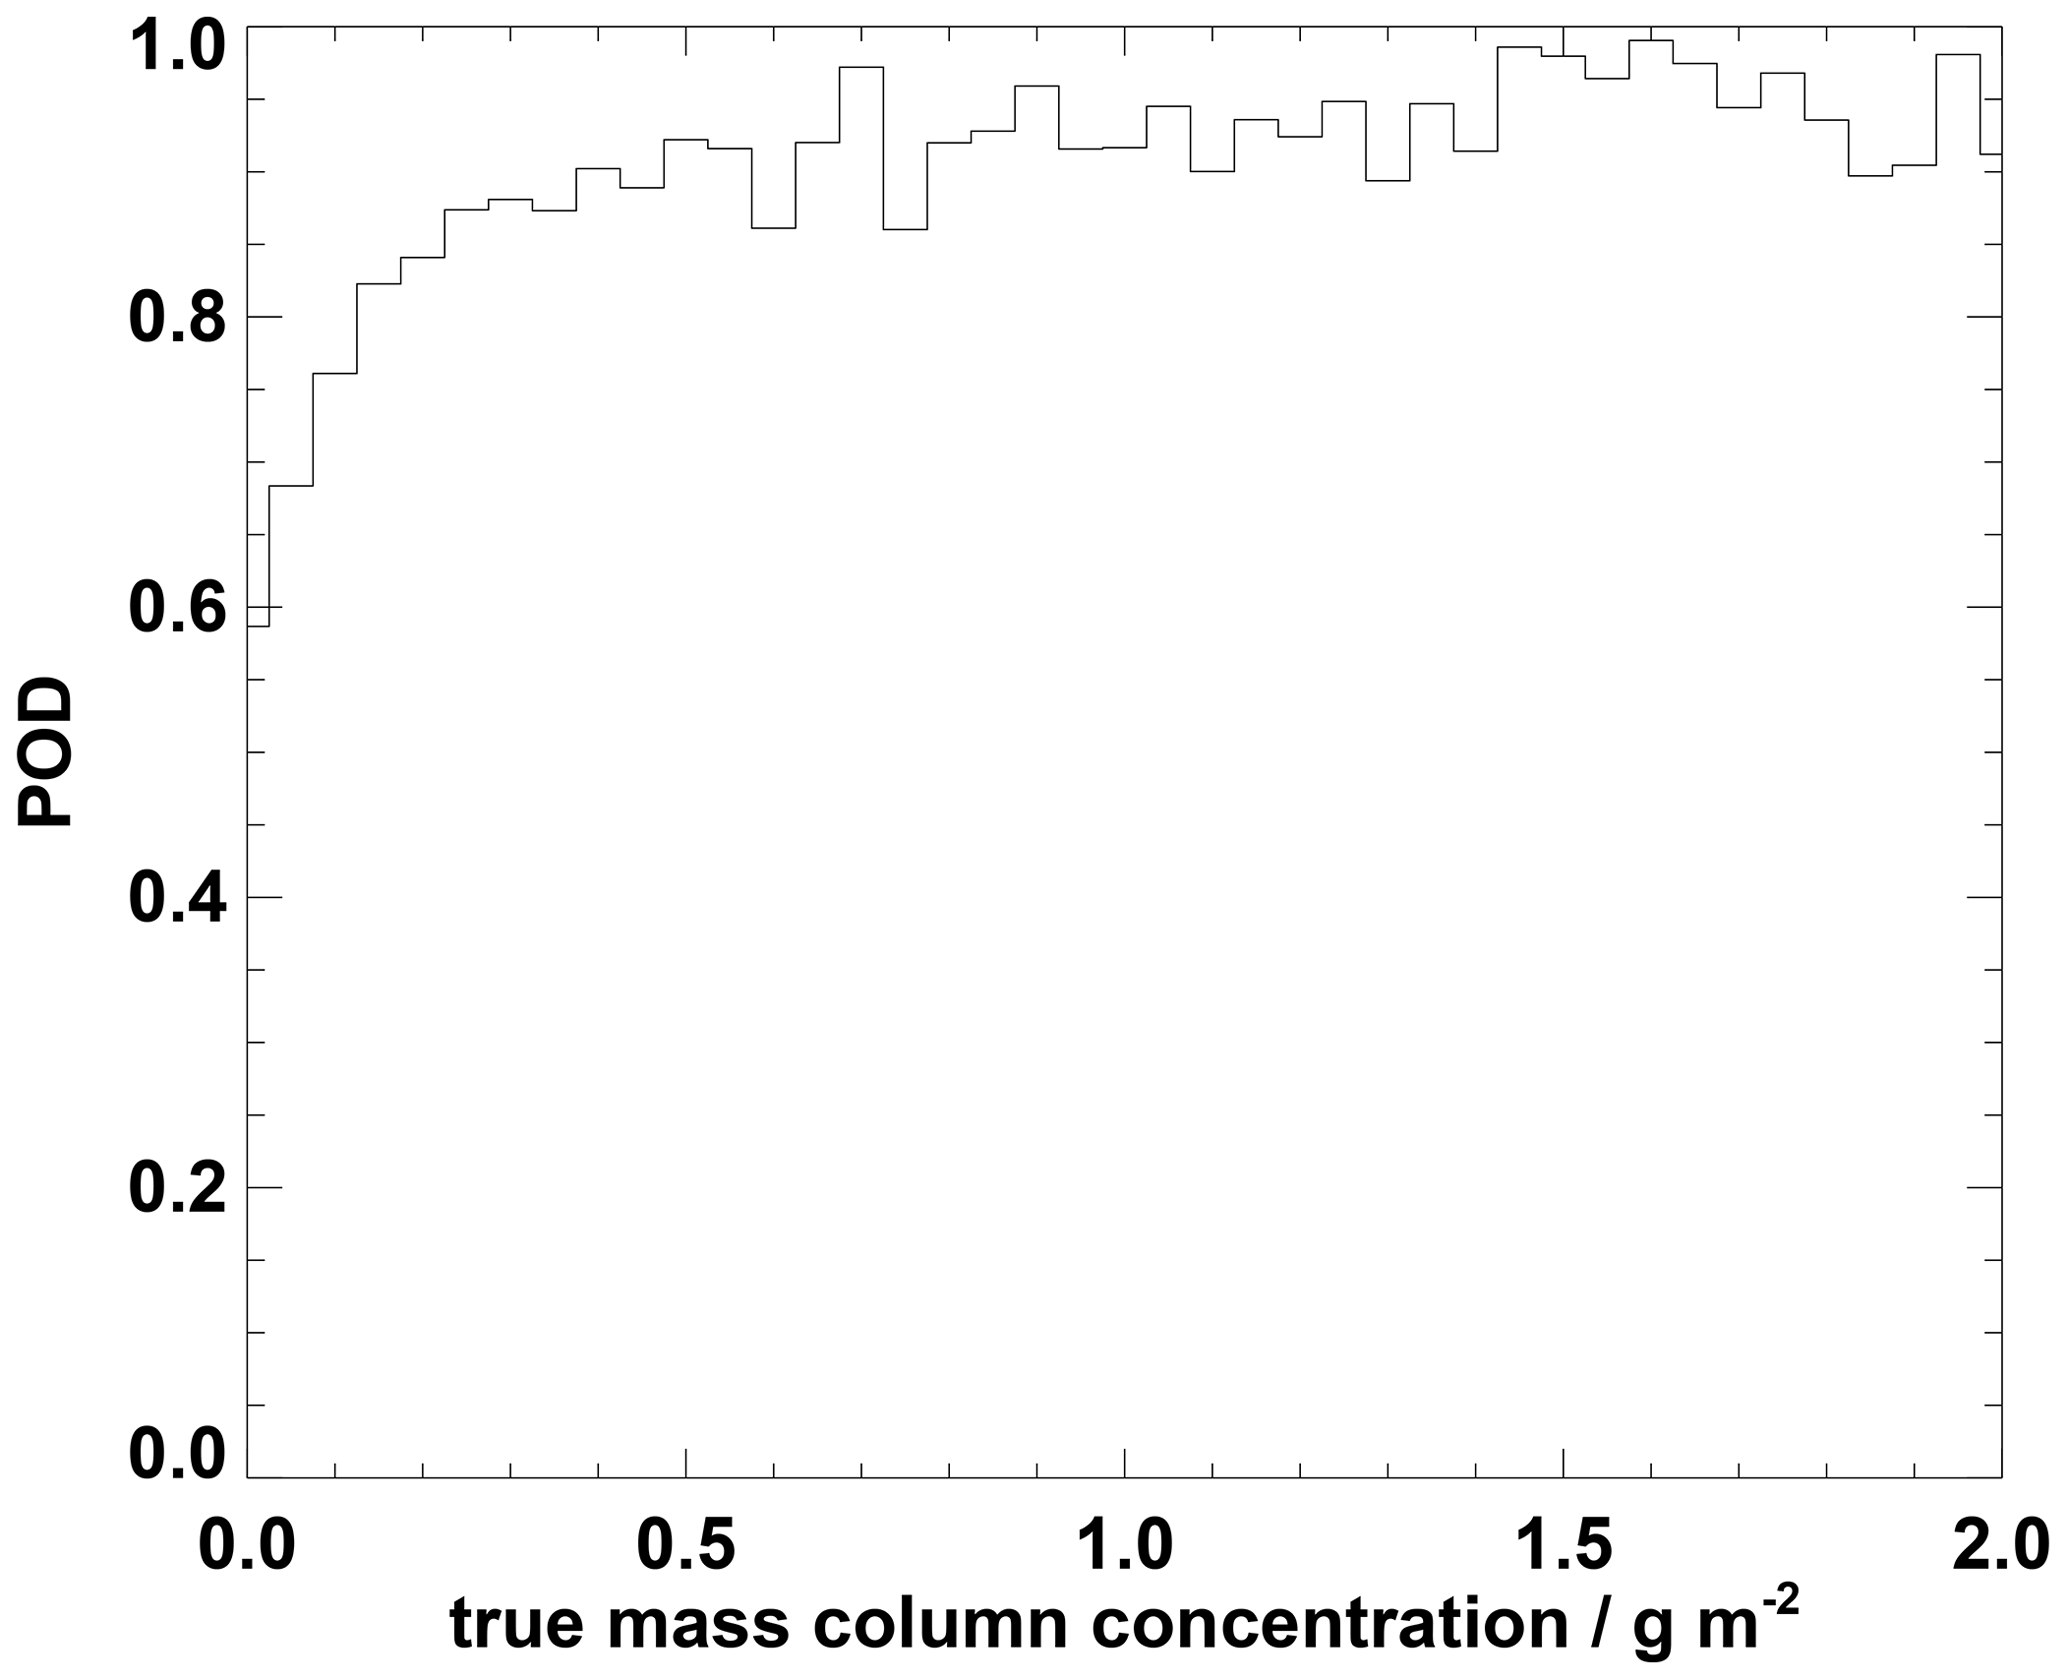
Figure 6Probability of detection (POD) as a function of mass load after the application of Eq. 4 and of a threshold of 0.1 g m−2 to the retrieved VAMC.
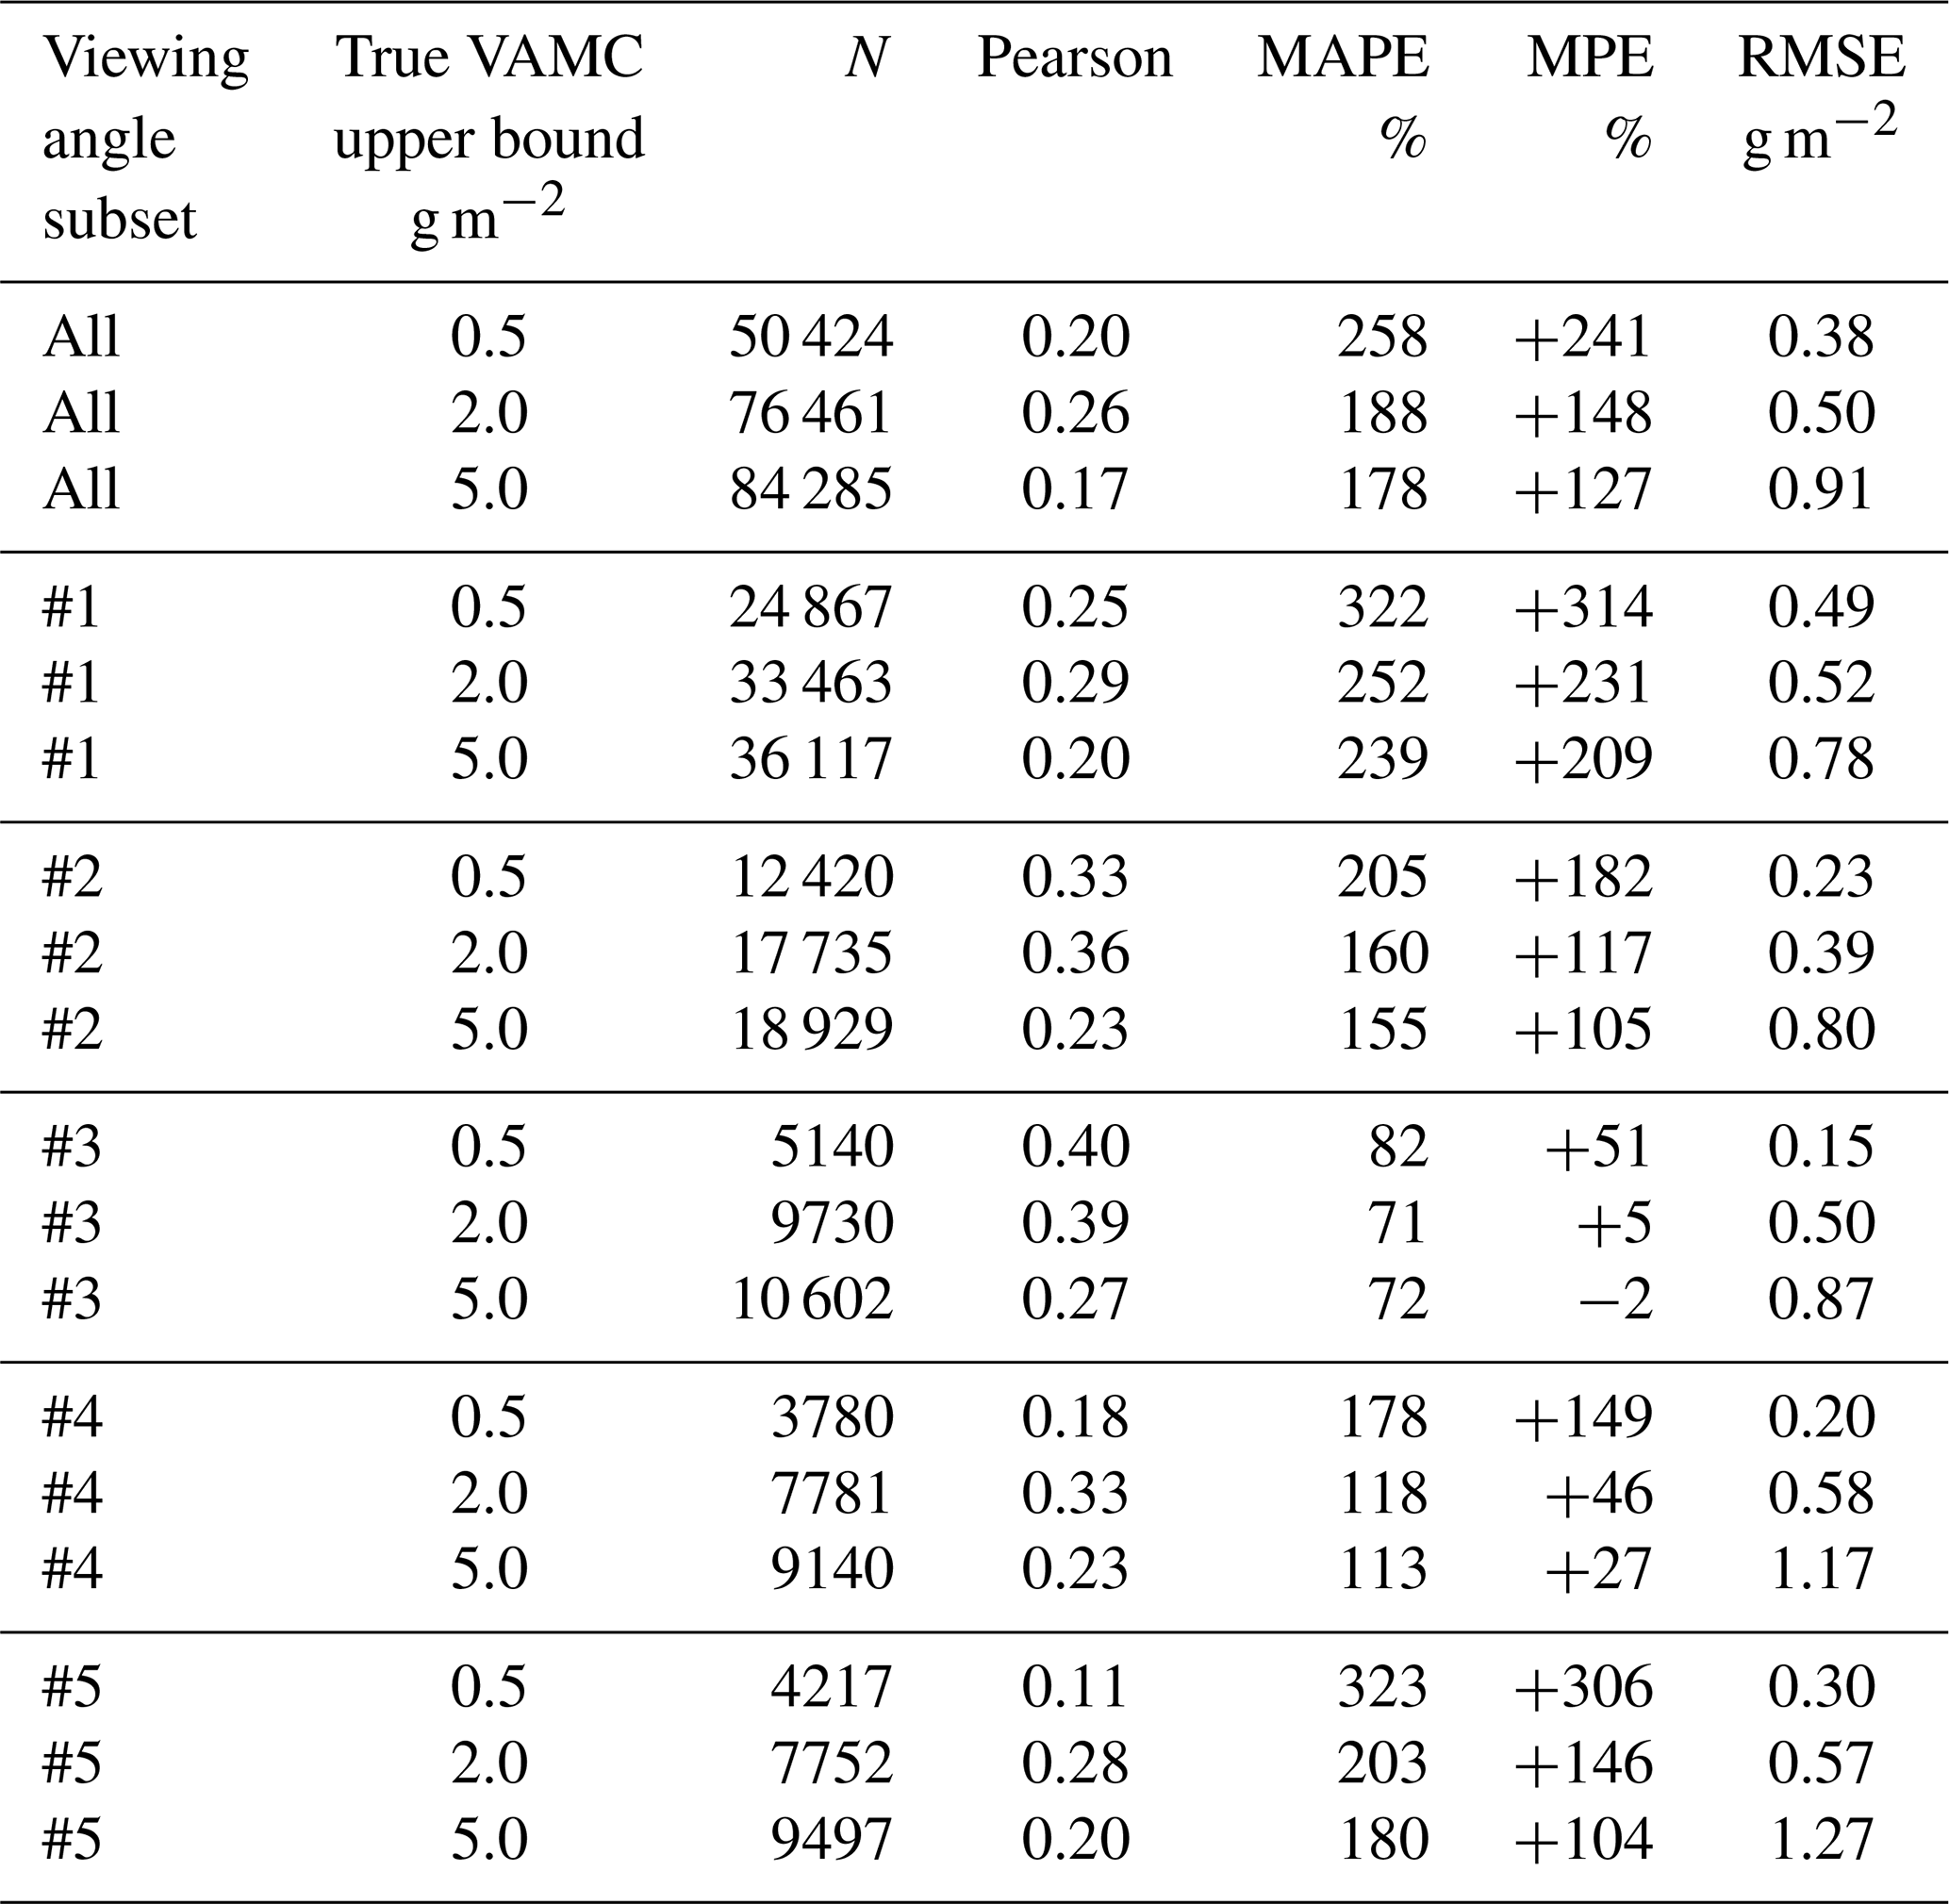
Table 1Statistical evaluation of VAMC from VADUGS against simulated observations (representing the truth).
4.4.3 Validation of ash concentration and height against simulated observations
For the validation of VAMC and VATH we consider only ash-laden samples as a function of μ=cos ϑ, the cosine of the satellite viewing zenith angle. Six subsets are defined, with all samples included in subset #0, samples with () in subset #1, () in subset #2, () in subset #3, () in subset #4 and () in subset #5. Results of this validation are summarized in Table 1 for three subgroups: where true VAMC is (a) smaller than 0.5 g m−2 (only thin ash layers) or (b) smaller than 2.0 g m−2 (thin and thick ash layers) or (c) smaller than 5.0 g m−2 (all simulated ash layers). The values for the last subgroup represent the full validation data set, which is first discussed in the next lines. Apart from the fact that the subsets contain different numbers of samples, as indicated by N, it is obvious that VADUGS results scatter considerably. The correlation between VADUGS and the simulated truth is not strong, with Pearson coefficients below 0.3. The best correlation is achieved for subset #3 (, ), with also the lowest MAPE and MPE of 72 % and −2 % respectively. For subset #4 (, ) MAPE and MPE are slightly larger (113 % and 27 % respectively). For very high viewing zenith angles (subset #1), deviations are very large (both MAPE and MPE > 200 %), while small viewing zenith angles produce a MAPE of 180 % and MPE of 104 %. Thus, VADUGS works best for moderate viewing zenith angles but always struggles with the determination of the correct VAMC, usually leading to an overestimation. Considering the first two subgroups (VAMC < 0.5 g m−2 and VAMC < 2.0 g m−2), we see that for thin ash (VAMC < 0.5 g m−2) uncertainties (MAPE, MPE) are largest, indicating that the determination of VAMC for thin ash layers is most difficult. In general, MAPE and MPE for VAMC < 2.0 g m−2 and VAMC < 5.0 g m−2 are comparable, with slightly better results for the latter. However, RMSE are (much) lower (between 0.39 and 0.58 g m−2) and the correlation coefficients are higher (up to 0.39) for VAMC < 2.0 g m−2, meaning that the most reliable results are for ash columns larger than 0.5 g m−2 and smaller than 2.0 g m−2. Again, subsets #3 and #4 are the ones with the lowest MAPE and MPE not only for the full data set but also for the other two VAMC subgroups. In subset #3 in particular, MPE is very close to zero (+5 % for VAMC < 2.0 g m−2).
Table 2Statistical evaluation of VATH from VADUGS against simulated observations (representing the truth).

Table 3Statistical evaluation of VATH from VADUGS against simulated observations (representing the truth) for VA with true VATH ≤ 12 km.
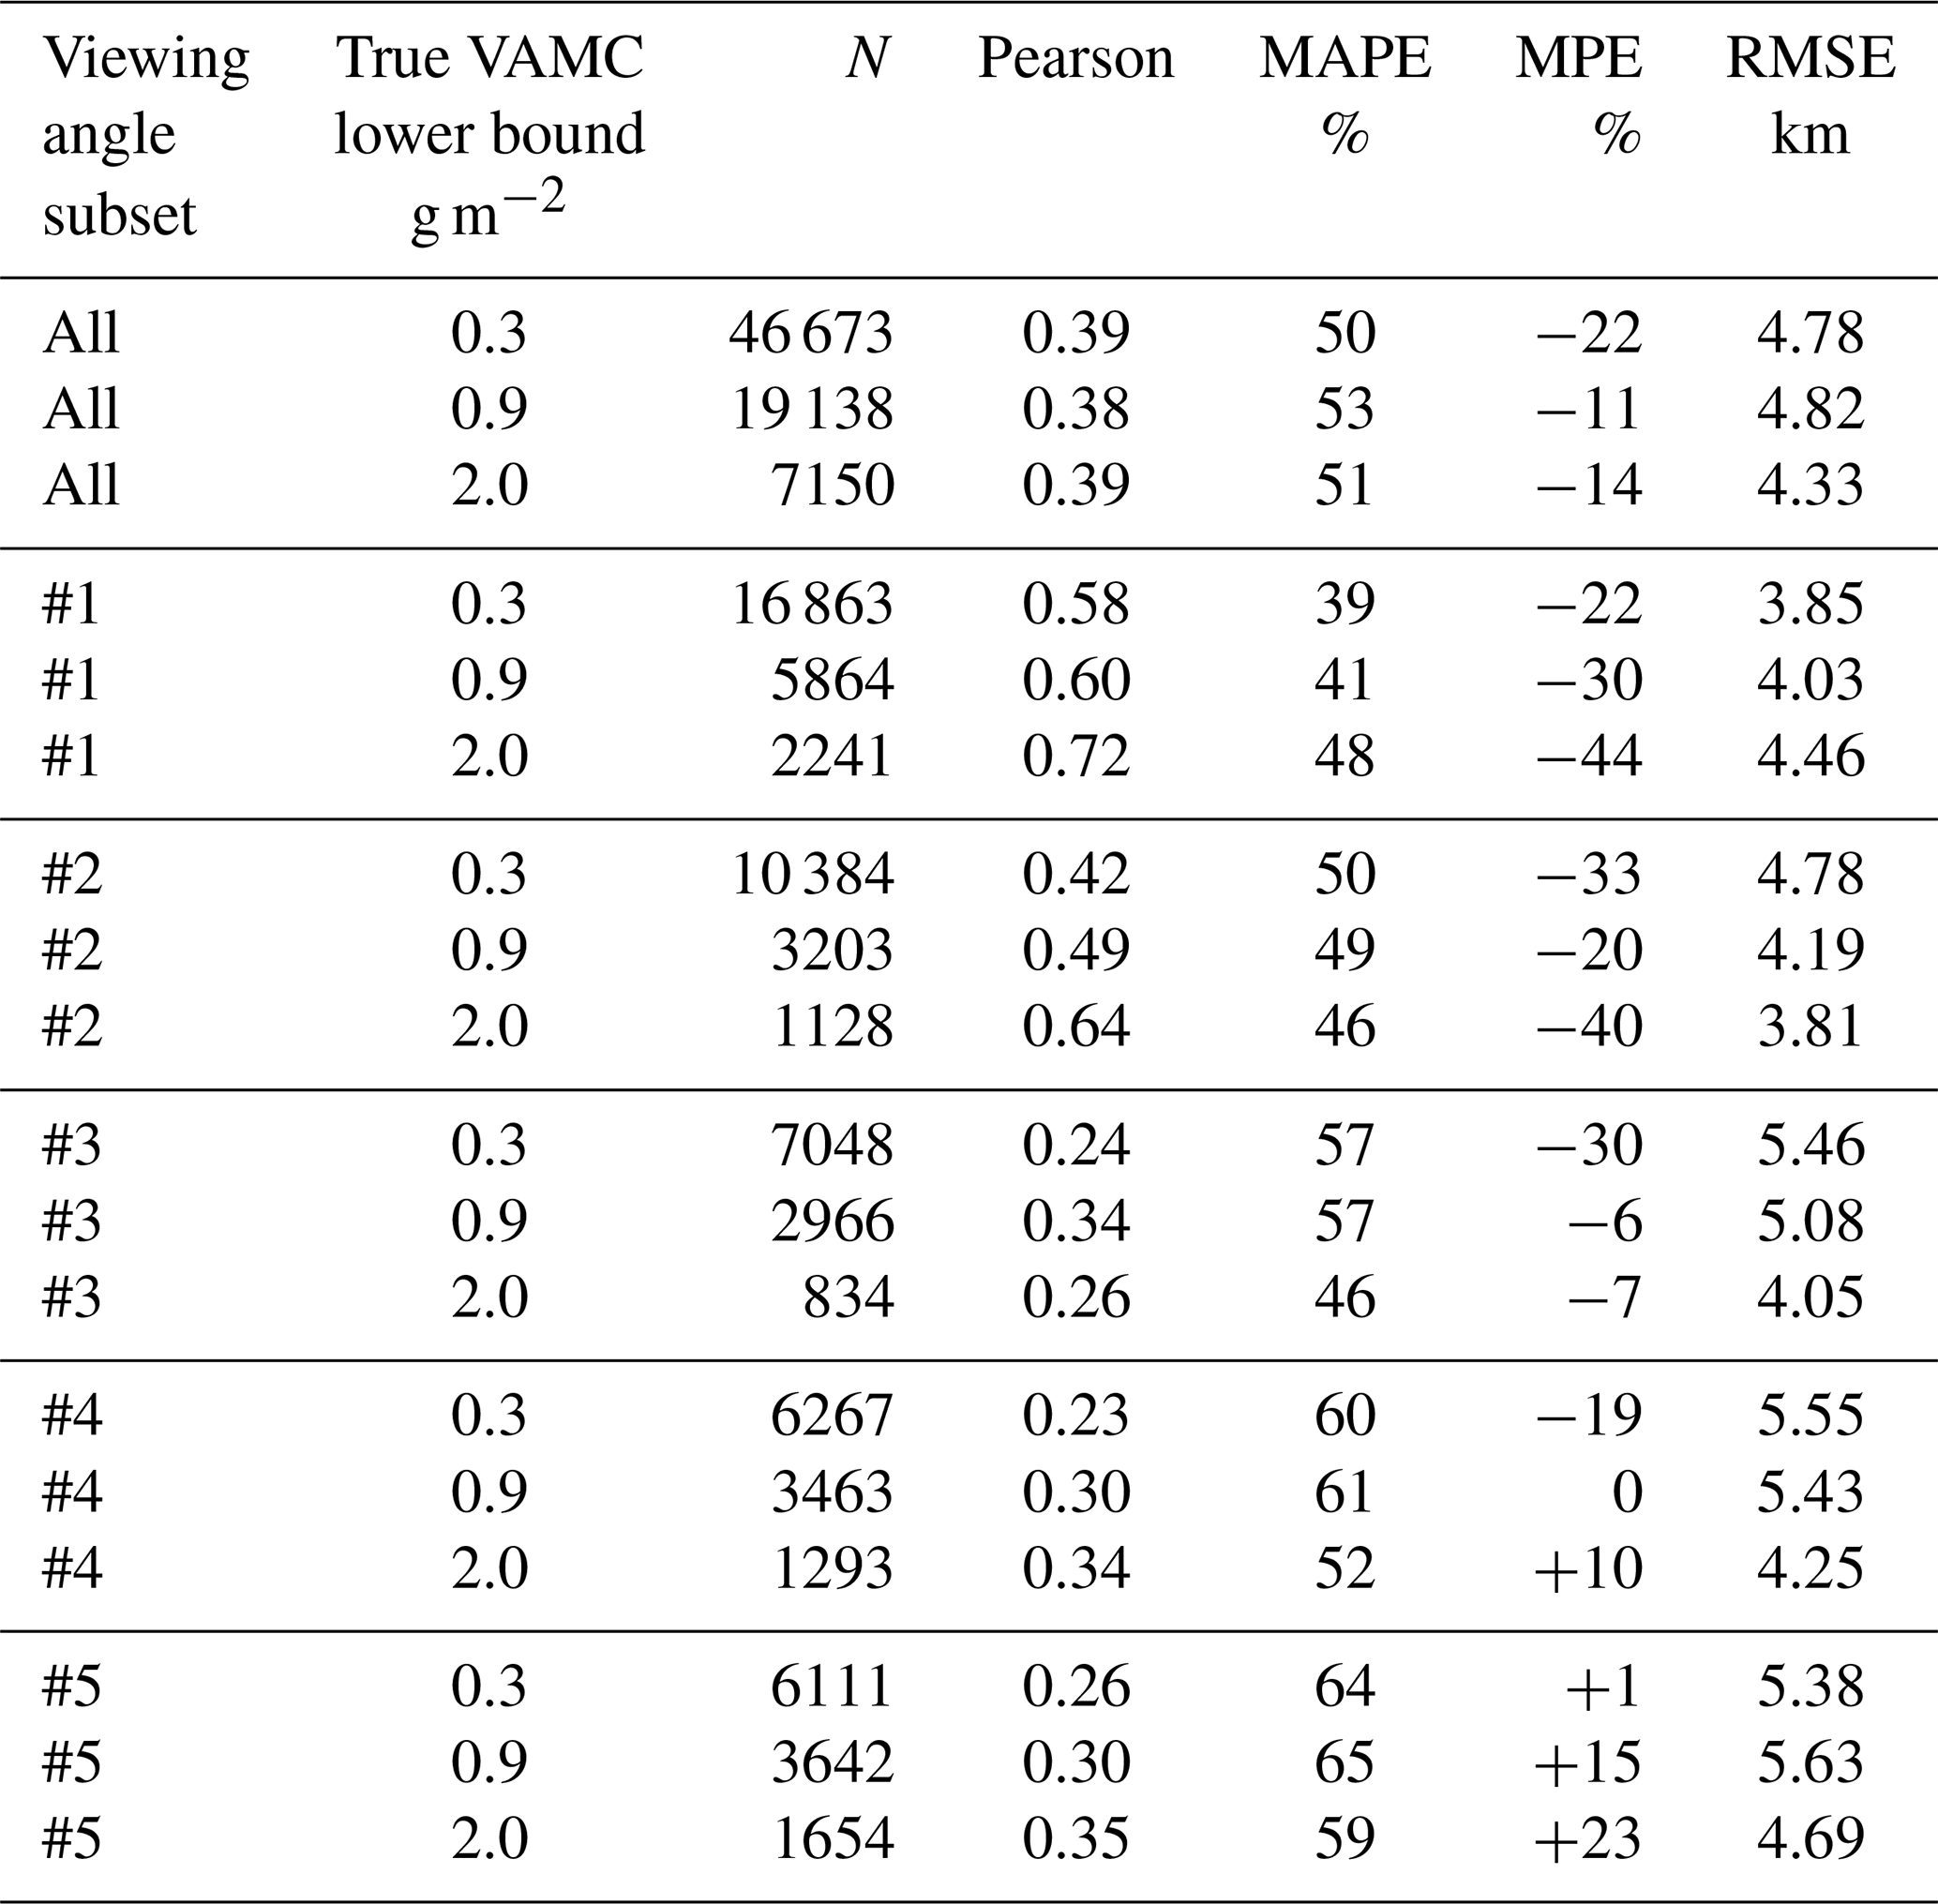
For VATH, validation results are collected in Table 2 where the dependency of the VADUGS errors on true VATH for three intervals – true VATH < 8, 12 and 14 km – is described. Again, we start the discussion with the last subgroup (VATH < 14 km) that contains the full validation data set. The general features correspond to those for VAMC. In particular, the large scatter of VADUGS values is evident, although correlation coefficients are higher for VATH (up to 0.54) than for VAMC. Similarly, MAPE and MPE values are lower than for VAMC: Considering all validation data, MAPE amounts to 54 % with an underestimation (MPE) by −34 %. Although in general VATH is underestimated by VADUGS (negative MPE), this effect is weakest (−11 %) for small viewing zenith angles (subset #5) but connected to a relatively high MAPE of 65 %. The smallest MAPE is for subset #1 (44 %), i.e. for large viewing zenith angles, where RMSE is also smallest (4.73 km) yet high. For subsets #2–#4, absolute error and underestimation are high (approximately 60 % and −40 %, respectively), with RMSE around 6 km, i.e. VADUGS provides a moderate sensitivity to VATH in these situations.
Comparing the three VATH intervals in Tab. 2 with each other, one can see that, apart from the dependency on the viewing zenith angle, the MAPE and MPE for all three VATH intervals are very similar for subsets #1 and #2. However, for subsets #2 to #5, in all three intervals, underestimation of VATH through VADUGS becomes less pronounced with decreasing viewing zenith angle, i.e. when going from subset #2 to #5, with the lowest underestimations for low ash clouds (VATH < 8 km). In subgroup #2, MPE for VATH < 8 km amounts to −42 %, to −25 % for subset #3, −9 % for subset #4 and +17 % for subset #5. In the three subsets #3–#5, the correlation is highest for the low VATH regime (Pearson coefficients between 0.28 and 0.33). Nevertheless, MAPE is always close to 60 % and reaches 70 % for subset #5.
Since thin ash clouds are difficult to detect and the determination of their properties is complex, we investigate the accuracy of VATH when VAMC is larger than 0.3, 0.9 and 2.0 g m−2 and VATH is below 12 km in Table 3. In almost all cases, Pearson correlation coefficients increase with increasing VAMC threshold, i.e. it is easier for VADUGS to assess VATH when the ash cloud is thick. For VAMC > 2.0 g m−2, correlation coefficients larger than 0.7 can be achieved. At the same time, MAPE lies between 46 % and 59 % and MPE between −44 % and +23 % for the clouds with VAMC > 2.0 g m−2. Furthermore, VATH is underestimated in subsets #1–#3 but overestimated in subset #4 and #5. However, for all viewing angle subsets and all VATH subgroups, MAPE is always relatively high between 40 % and 65 %.
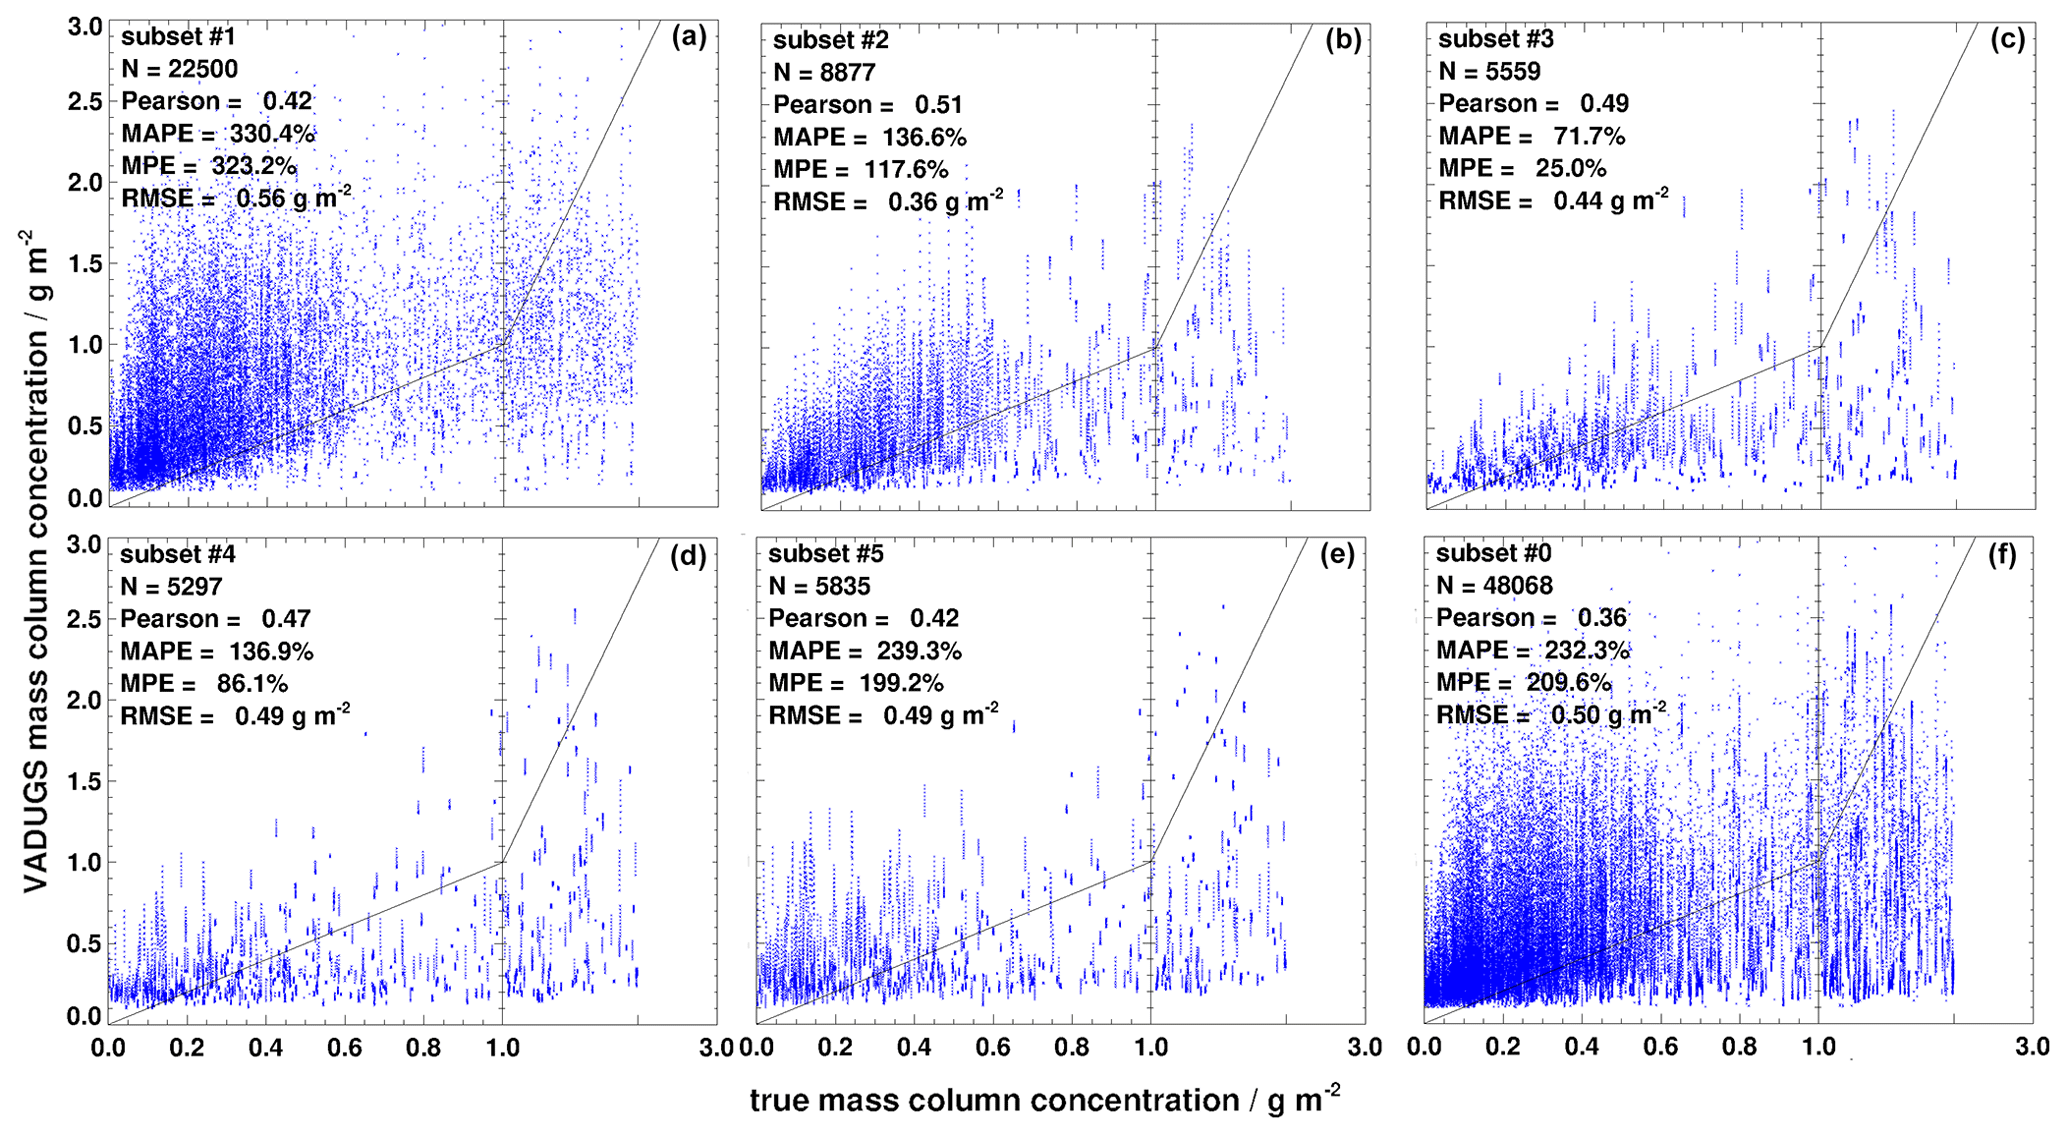
Figure 7(a)–(f) True against retrieved mass column concentration for the reduced simulated validation data set as a function of satellite viewing angle (subsets #1–#5). The solid black line shows the identity; for each data set the corresponding number of samples (N), the Pearson correlation coefficient, the root mean squared error (RMSE), the mean absolute percentage error (MAPE) and the mean percentage error (MPE) are given.
Generally, VADUGS struggles with the determination of the correct mass load and top height when applying it to observations filtered according to Eq. (1). However, with a more stringent filtering that identifies simulated ash-contaminated observations within the validation data set fulfilling
(that is meant to isolate cases where the ash signal is stronger in the simulated observations) and considering the findings above, VADUGS performs significantly better. Figure 7 shows scatter plots between true and retrieved VAMC for true VAMC in the range 0.0–2.0 g m−2 (see Table 1) for this reduced validation data set. Pearson coefficients are clearly higher than with the previous filtering, with values up to 0.51, but overestimation remains and leads to high MAPE and MPE, with subset #3 again having the smallest errors (MAPE = 72 %, MPE = 25 %). However, RMSE is in almost all cases smaller than in the general evaluation.

Figure 8(a)–(f) True against retrieved cloud top height for the reduced simulated validation data set as a function of satellite viewing angle (subsets #1–#5). The solid black line shows the identity; for each data set the corresponding number of samples (N), the Pearson correlation coefficient, the root mean squared error (RMSE), the mean absolute percentage error (MAPE) and the mean percentage error (MPE) are given.
Figure 8 shows scatter plots for the cloud top height retrieval when VAMC > 0.3 g m−2. Generally, VADUGS again underestimates top height, but to a smaller degree than with the previous filtering. At the same time, correlation coefficients reach 0.74 and RMSE is usually smaller. The best results are obtained for subset #1, i.e. for the smallest cosine viewing zenith angles.
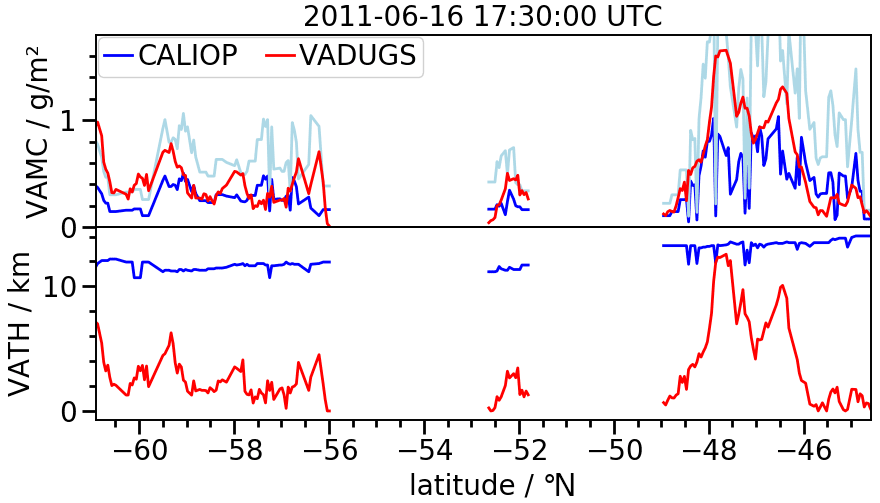
Figure 9VAMC and VATH of a Puyehue-Cordón Caulle volcanic ash cloud around 16 June 2011 17:30 UTC as retrieved by CALIOP (blue) and VADUGS (red); the upper uncertainty of the CALIOP-retrieved VAMC is shown in light-blue.
4.4.4 Validation of ash concentration and height against CALIOP observations
To validate VADUGS under real conditions, CALIPSO (Cloud-Aerosol Lidar and Infrared Pathfinder Satellite Observation, Winker et al., 2009) version 4.10 level 2 aerosol products including data on stratospheric ash layers (Kim et al., 2018) are used. They are obtained from CALIOP (Cloud-Aerosol Lidar with Orthogonal Polarization) retrievals. The final spatial resolution after processing is 5 km horizontally and 60 m vertically. Samples are discarded if the extinction quality control flag (qc) is neither 1 (indicating that the lidar ratio is directly retrieved from the data) nor 0 (initial lidar ratio leads to stable extinction retrievals). For the remaining samples, the optical depth at 532 nm due to volcanic ash is derived from the extinction profile using only the samples classified as ash. For samples with qc = 0, a correction is made to deal with the difference between the default lidar ratio of ash (44 sr) used in version 4.10 and that obtained from the direct (qc = 1) retrievals (58 sr). The mass loading is estimated from the optical depth using a mass extinction coefficient of 0.69 m2g m−1 (Gasteiger et al., 2011; Winker et al., 2012), whereas the highest ash layer determines the ash cloud height.
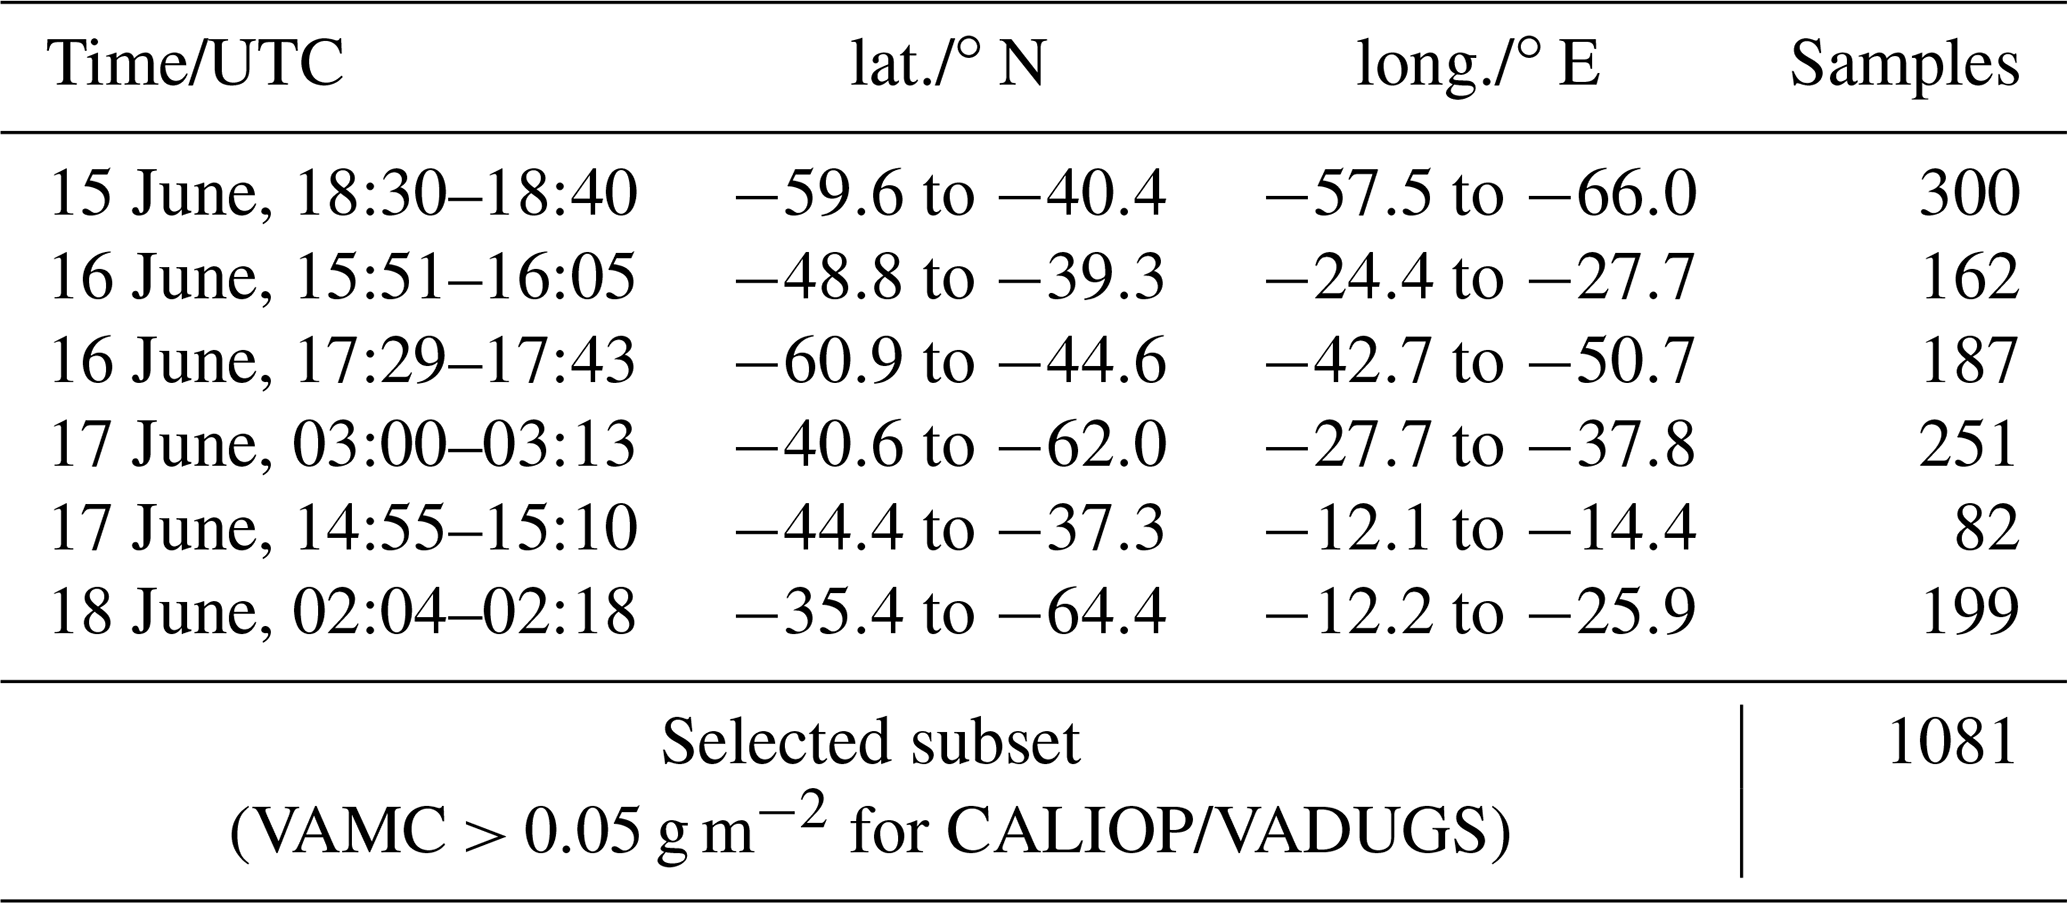
For the comparison, the Puyehue-Cordón Caulle eruption in 2011 is considered: Six daytime and nighttime orbits of CALIPSO over ash clouds in the southern Atlantic between 15 and 18 June 2011 are collected (Table 4). VAMC ranges between 0 and 1.7 g m−2 and VATH between 10 and 15 km. Figure 9 shows an example with the CALIPSO data (blue) plotted alongside the corresponding VADUGS retrievals (red); VAMC from CALIPSO has an uncertainty of a factor of ∼2 (light blue). Note that this reference data set is rather limited in the number of samples as well as in the variability of the observations, which are only of a single eruption, only above sea, can be assumed to have relatively similar atmospheric conditions, and with ash layers only above and around the tropopause. Nevertheless, this eruption represents a good test bed for VADUGS that has been developed for Eyjafjallajökull.
Table 4CALIOP measurements used for the statistical evaluation; all CALIPSO flyovers took place in June 2011.
The CALIOP retrievals are compared with VADUGS results for the temporally closest SEVIRI2 image. A parallax correction is applied to the latter such that the top of the ash layer is observed.
The example in Fig. 9 shows that the VAMC retrieval is generally in agreement considering the uncertainty of the CALIOP data; a tendency of VADUGS towards overestimations is evident, as discussed in the previous section. The cloud top derived by VADUGS is lower than the reference values when the ash layer is thin. A reasonable VATH retrieval is performed at one of the thicker parts of the observed ash cloud (at a latitude around −48∘ N). This behaviour basically confirms the analysis in the previous section based on simulated satellite observations.
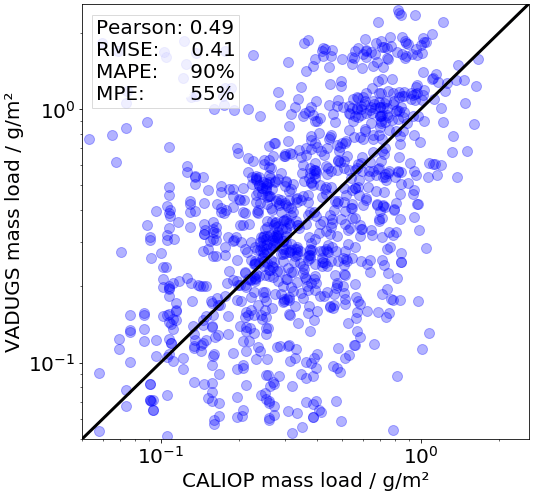
Only samples with VAMC retrieval larger than 0.05 g m−2 using both CALIOP and VADUGS are considered (i.e. the threshold on 0.1 g m−2 used before is lowered in order to increase the number of ash-contaminated pixels). The scatter plot in Fig. 10 compares the VAMC of the two retrievals. The measurement points are located around the identity, also expressed by a Pearson coefficient of 0.49, which is comparable to the correlation coefficients obtained in the analysis in the previous section. However, once again VADUGS tends to overestimate VAMC as can be seen from the positive MPE of 55 %. Generally, the MAPE is 90 %. Note that MAPE, MPE and Pearson coefficient are close to the values in Table 1 for subset #3 with an upper VAMC threshold of 0.5 g m−2.
The histogram in Fig. 11 shows the VATH distribution retrieved from CALIOP and VADUGS. The CALIOP measurements peak at around 12 to 13 km. The distribution of VADUGS-retrieved VATH peaks at 0 km and has a flank reaching 19 km, with a notable minor peak at about 9–12 km. Overall, 86 % of the retrieved VATHs are <8 km, and only 14 % are larger. This underlines the results of the example (Fig. 9) that VADUGS is able to retrieve the correct VATH for thick ash clouds, but generally underestimates it. However, one has also to consider here the fact that VATH determination above or close to the tropopause is particularly challenging due to the fact that the atmospheric temperature profile can be constant or increase with height, while below the tropopause, for which VADUGS has been mainly trained, temperature decreases with height. Note that the general overestimation of VAMC is again related to (or perhaps induced by) the underestimation of VATH.
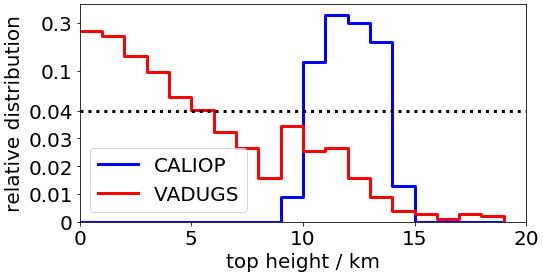
Figure 11CALIOP and VADUGS retrievals of VATH; the vertical line separates the linear lower part from the logarithmic upper part.
4.4.5 Comparison with a non-machine-learning-based volcanic ash retrieval
VADUGS is a machine-learning-based algorithm for the detection of volcanic ash and the derivation of its properties. Initially, volcanic ash detection was based on BT tests using fixed thresholds for all meteorological conditions. The use of NNs is intended to provide more flexibility in the application of the volcanic ash retrieval such that it is expected to easily adapt to the given atmospheric conditions (low-level clouds, water vapour, land/sea …). The goal of this section is to provide a qualitative comparison of VADUGS with a “standard” retrieval of volcanic ash to check this hypothesis. Among the retrievals available in the literature, we selected the 3-bands method (Guéhenneux et al., 2015) as it represents a strong improvement with respect to the 2-bands method first implemented by Prata (1989a, b) and because it is made available to the public through the web via the HOTVOLC real-time monitoring service (Gouhier et al., 2016) developed and managed by the Observatoire de Physique du Globe de Clermont-Ferrand (OPGC). Furthermore, it is easy to implement and has been shown to provide the main features of volcanic ash clouds although its improved version, the 5-bands method (Gouhier et al., 2020), provides both an improved POD and reduced FAR.
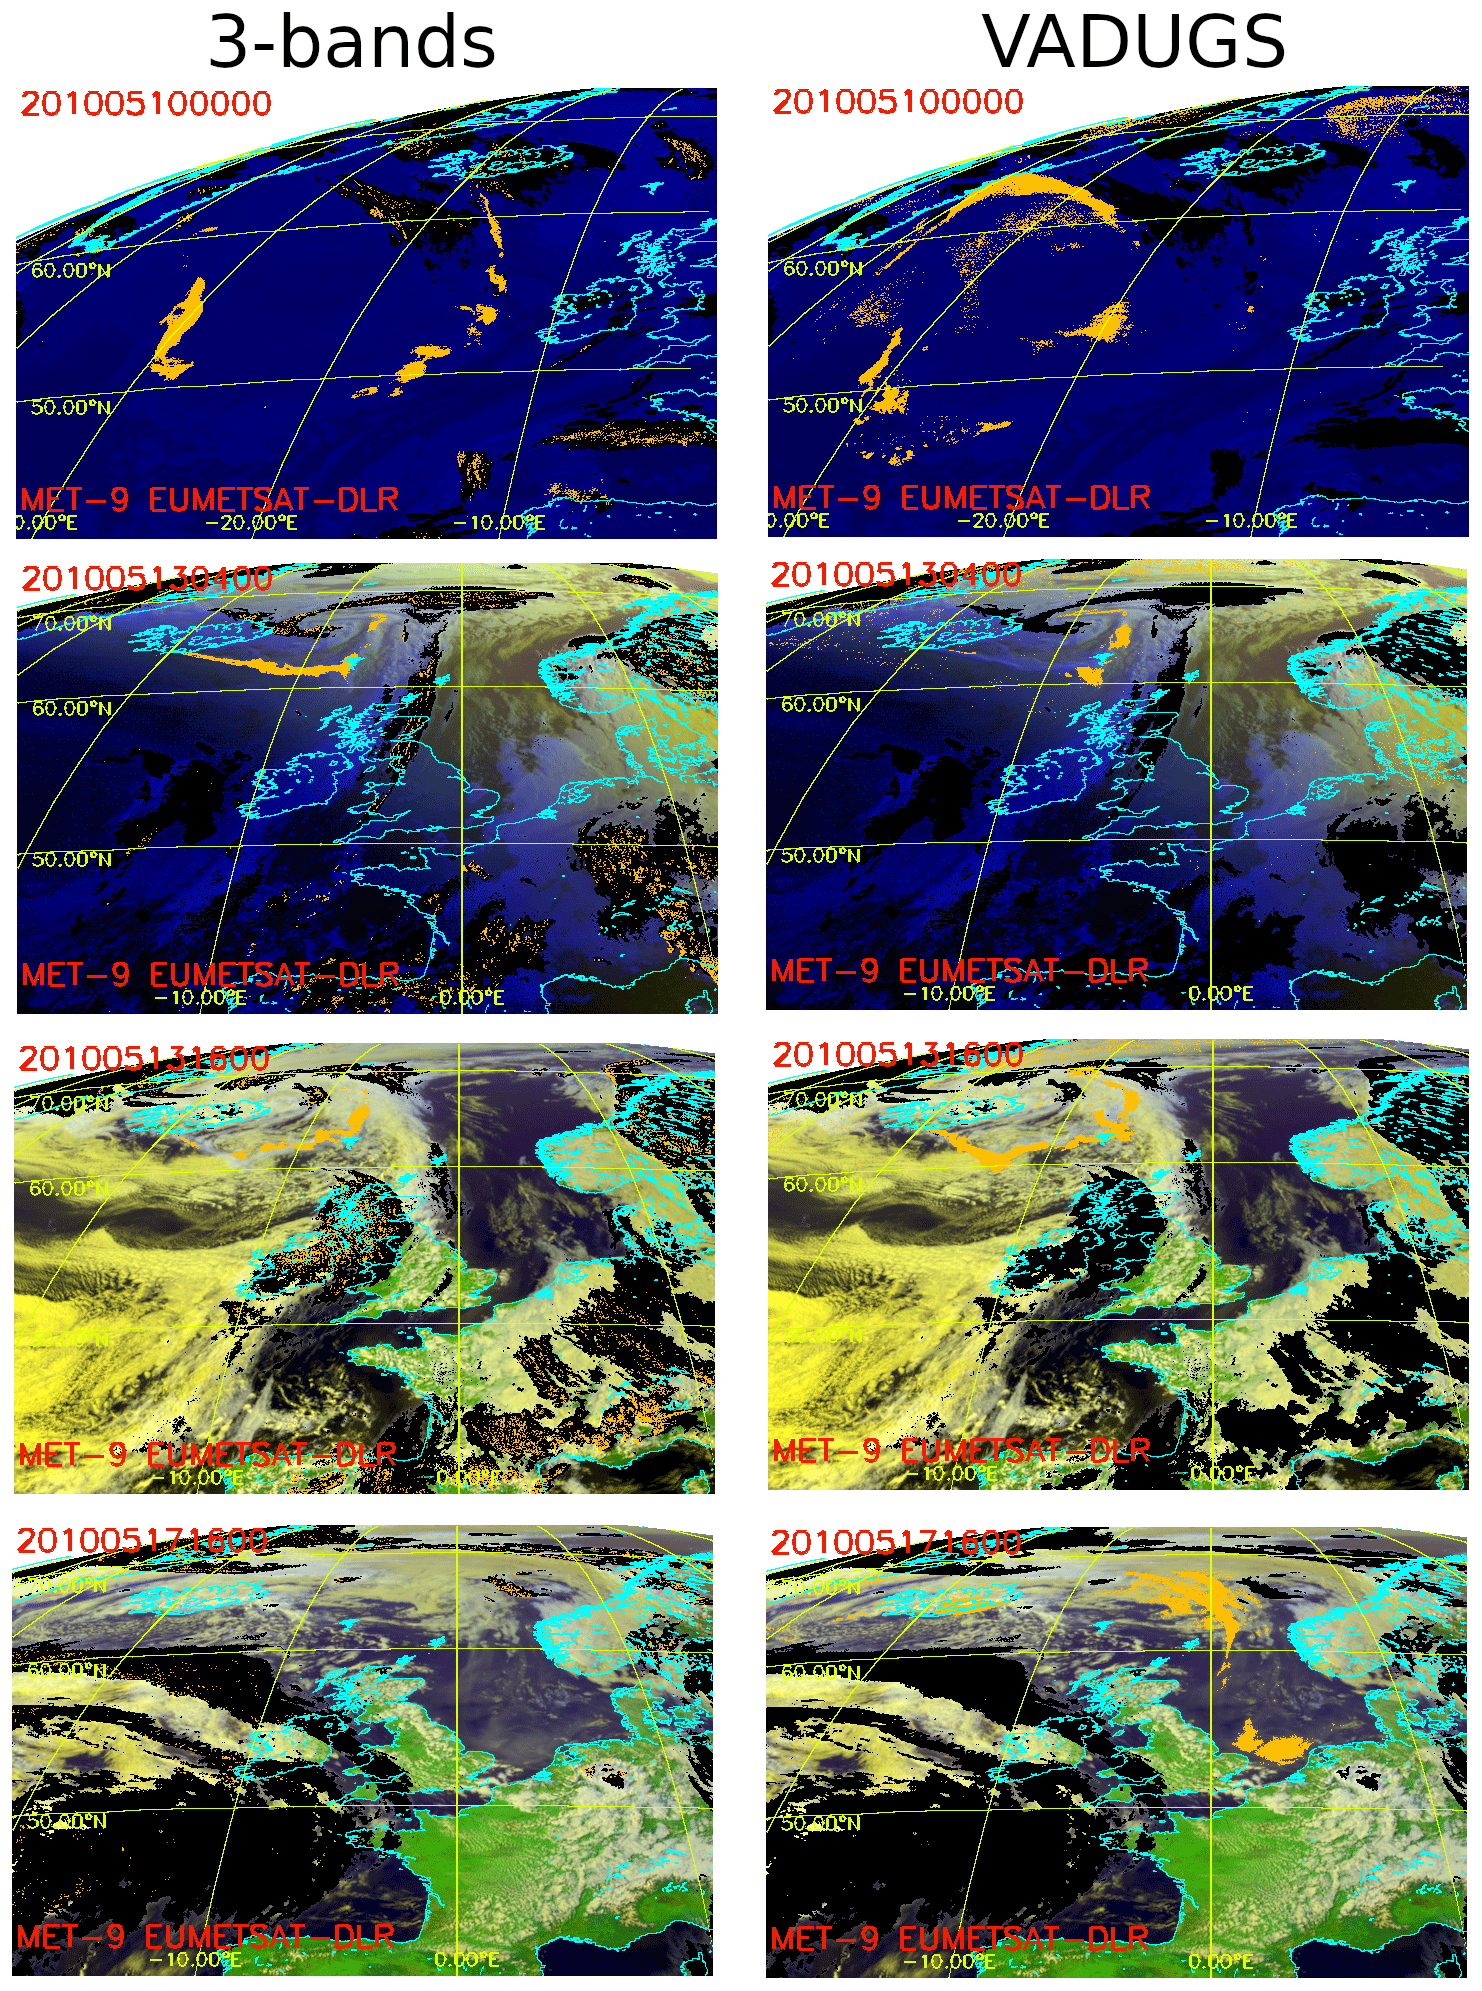
Figure 123-bands and VADUGS retrievals of volcanic ash cover for four scenes of the Eyjafjallajökull eruption. The left column shows 3-bands volcanic ash masks in orange on top of a false colour RGB image, the right column shows VADUGS results. Black areas indicate the presence of ice clouds as obtained from COCS (see Sect. 4.3); however, ash detections inside ice clouds are not masked out as in Fig. 3 but shown on top.
For the comparison we have selected four different scenes from the second phase of the Eyjafjallajökull eruption. The first scene is taken from Guéhenneux et al. (2015) (their Fig. 12), where on 10 May 2010 00:00 UTC volcanic ash is seen to drift from the vent of the volcano towards the west. In Fig. 12 the 3-bands result for this time nicely shows in particular ash freshly emitted by the volcano and blown by the wind towards the south as well as other ash spots that are heading towards Greenland. One can see that the 3-bands method seems to produce some scattered results inside ice clouds. While some of them are close to Iceland and might represent real ash-contaminated pixels, others (like those west of France) are probably false alarms. With the use of an ice mask, these pixels can easily be removed and do not represent a problem. The corresponding result from VADUGS (top right panel with the label 201005100000) misses the ash close to the vent and spots only few pixels west of Ireland. Instead, VADUGS observes more ash pixels further west close to −30∘ E +50∘ N, where 3-bands also observes an ash cloud. But VADUGS also retrieves more ash-contaminated pixels along the Greenland coast, an additional ash cloud around −20∘ E +55∘ N and scattered ash pixels between 50 and 60∘ N. Although it is not possible to assess which pixels are correctly classified as ash by the two retrievals without additional information, the temporal evolution of the ash distribution (not shown) indicates that the presence of ash in all these regions further away from the volcano is plausible and follows the general circulation patterns during the previous days.
The second day we selected is 13 May 2010, for which we present two slots 04:00 and 16:00 UTC (second and third row in Fig. 12), as in Fig. 3. In the early morning of 13 May (second row in Fig. 12), ash emitted from Eyjafjallajökull is blown towards the east until the Faroe Islands, where the ash cloud is then diverted to the north. Again, apart from some “noise” corresponding to ice clouds, the 3-bands method detects very nicely the ash plume between the volcano and the Faroe Islands, and also an ash cloud north of these. By comparison, VADUGS detects only a very small stripe of ash close to the vent, but then retrieves larger ash clouds close to the Faroe Islands and north of them. All these detections, for both 3-bands and VADUGS, are plausible and correspond to “smoke-like” structures in the RGB. In the afternoon (third row in Fig. 12), ash extends again from the volcano to the Faroe Islands, but it is first blown in south-east direction (down to 60∘ N) and to the north-east. Over the Faroe Islands, ash is driven to the north and then back to the west. This time, it is the 3-bands method that partly misses the ash plume close to the vent, while VADUGS observes an almost completely connected area of ash-contaminated pixels from Iceland to the Faroe Islands, and a larger ash region north of the Faroe Islands.
Finally, in the last row of Fig. 12, we show the ash distribution over Europe on 17 May 2010 at 16:00 UTC. In this case, the 3-bands method does not provide almost any ash pixels while VADUGS observes large regions of ash over the North Atlantic between approx. −10 and +5∘ E and +58 and +68∘ N. The presence of ash here is plausible according to, e.g. model simulations (see e.g. Fig. 10f in Plu et al., 2021). Furthermore, VADUGS retrieves two ash clouds over the North Sea, where on that day they were probed both by the UK FAAM aircraft (Marenco et al., 2011) and the DLR Falcon aircraft (Schumann et al., 2011).
In summary, both retrievals provide valuable results for the monitoring of volcanic ash, each one with its own strengths and deficiencies. While the 3-bands method seems to be able to detect ash clouds very close to the vent, where ash optical thickness is particularly high, in general VADUGS detects more ash further away from the volcano where optical thickness is assumed to be lower. However, exceptions exist – for instance the ash detected by the 3-bands method over the Atlantic south of Greenland on 10 May 2010 at 00:00 UTC or the ash directly observed leaving the volcano by VADUGS on 13 May 2010 at 16:00 UTC – and show that ash detection by passive sensors is a great challenge. In this sense, every ash cloud retrieval represents an additional piece of information that could and should be used in the context of early warning systems for aviation (e.g., Brenot et al., 2021).
VADUGS has been implemented at DWD and runs operationally . As in the example in Fig. 3, the ice cloud algorithm COCS (Kox et al., 2014) is first implemented to identify ice cloud pixels that may shade the ash from the satellite's view. This algorithm is currently being replaced by its successor (Strandgren et al., 2017). VADUGS and COCS are driven by a shell script, handling the input and output data and the call of the algorithms. The retrieval results are rasterized and saved as cf conform netcdf. The data transfer rate to the cockpits of aeroplanes is limited. Thus, the raster data are polygonized in order to keep the essential information but to reduce the size of the data to be transferred to the cockpit. The VADUGS results can be also visualized at the meteorological workplace of DWD and are therefore available for the forecasters at the central prediction centre and the regional aviation weather advice centres of DWD. ecFlow is used for the operational call and monitoring of the job. ecFlow is a workflow package which has been developed to run a large number of programmes in a controlled environment, providing restart and monitoring capabilities (via web page or email). It is used at DWD to run all operational suites on the high-performance computer. ecFlow is developed and maintained by ECMWF.
VADUGS has been trained with surface temperature from the IFS model operated by ECMWF (Sect. 3.1.2). However, for the operation at DWD, surface temperatures from the DWD weather model ICON (ICOsahedral Non-hydrostatic, Zängl et al., 2015) are used. Every model has its own spatial bias characteristics, depending beside other factors on the surface type. The operational verification at DWD indicates that differences in the surface temperature could be in the order of 1–2 K. Thus, a sensitivity study was performed in order to estimate the effect of uncertainties in surface temperature on the ash concentration and top height derived from VADUGS when surface temperatures increased by +1 or +2 K. Observations on 10 May 2010 during the Eyjafjallajökull eruption in the triangle enclosed by the Faroe Islands in the south, the Shetland Islands in the west and the northernmost tip of Great Britain were reprocessed for this purpose (Fig. 13, top). This day was characterized by a thick ash plume over the North Atlantic Ocean moving from the north-west to the south-east with small concentrations over the land surfaces. The differences in VAMC between the normal run and the run with surface temperatures increased by +1 and +2 K are about 0.015 g m−2 (<1 %) and 0.03 g m−2 (<3 %) for a +1 and +2 K increase in surface temperature (Fig. 13, centre and bottom). Considering the retrieval uncertainty (Sect. 4.4.3 and 4.4.4), these values are small. Thus, using ICON data should not pose a significant problem to the ash plume retrieval. However, close to the ash plume there are several isolated pixel clusters with differences up to 0.15 g m−2. The increase in surface temperature leads to a detection (or misdetection) of ash for pixels where the column concentration was close to but still below the detection limit of 0.1 g m−2 (Sect. 4.4.2). The top height shows no such effect (not shown): Differences in top height are not dramatic (<1 km) but still significant in the ash plume region. In summary, these findings indicate that using ICON instead of IFS as skin temperature source for VADUGS could slightly affect the results. Thus, even if it is preferred to use the same NWP model for the operation as used for the training of the NN, the usage of ICON skin temperatures does not seem to modify the shape and VAMC or VATH values in a way that can significantly modify its meaning for aviation-related services.
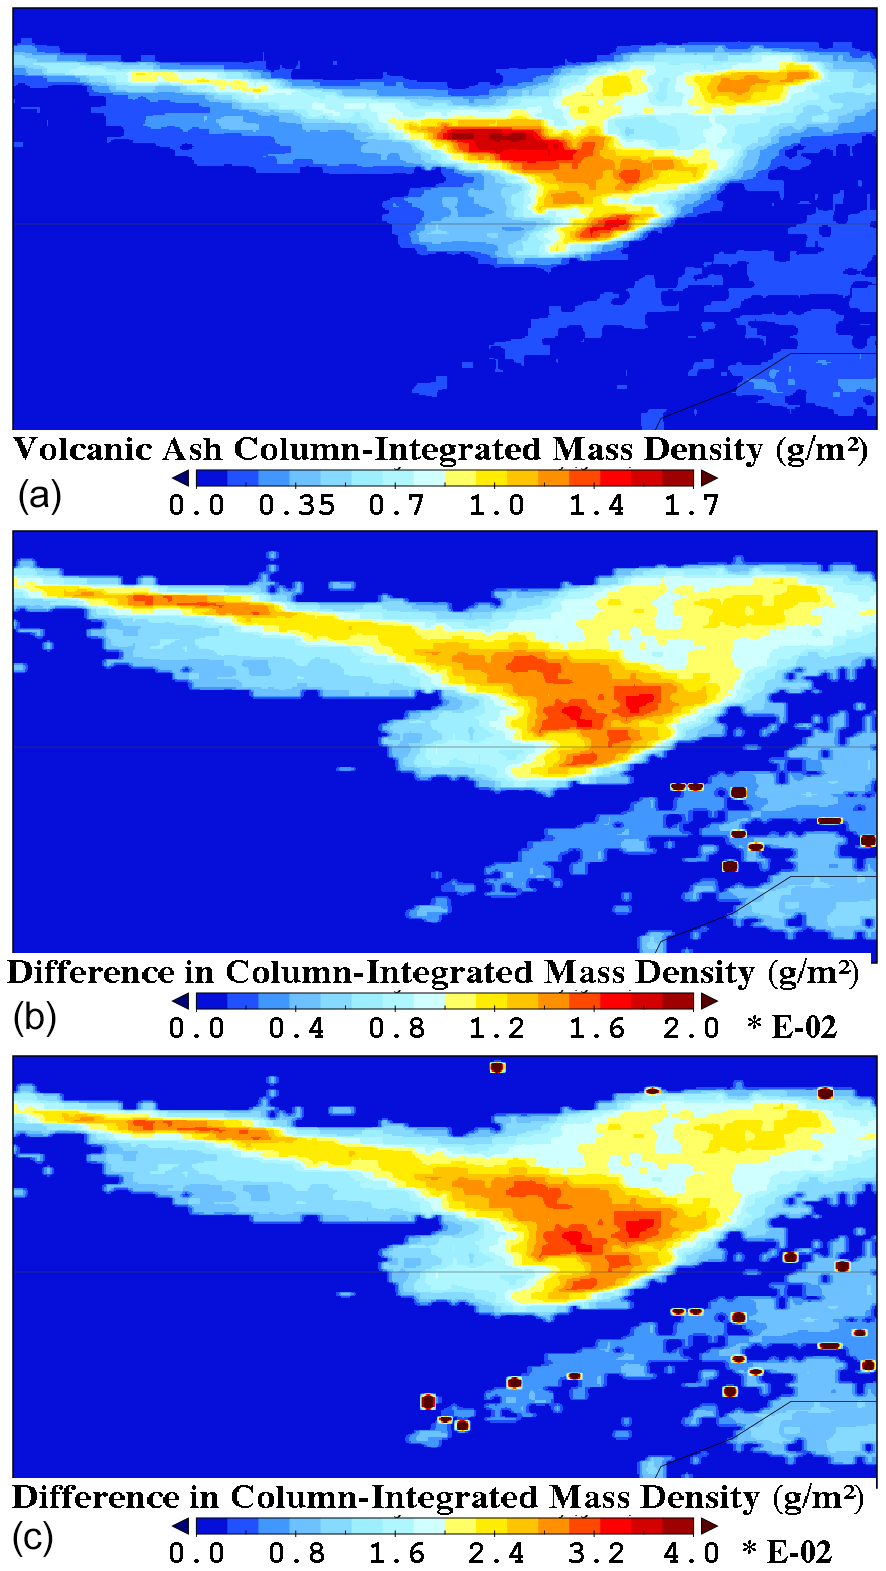
Figure 13(a) VAMC output over the ocean south-east of Iceland in the triangle enclosed by the Faroe Islands in the south, the Shetland Islands in the west and the northernmost tip of Great Britain for 17 May 2010 01:00 UTC from the operational DWD processing chain. (b) Difference in VAMC between the normal run and the run with surface temperatures increased by +1 K. (c) Same as in (b), but with a skin temperature increase by +2 K.
In the aftermath of the Eyjafjallajökull eruption in 2010 the VADUGS algorithm for the remote sensing of volcanic ash from thermal MSG/SEVIRI observations (Kox et al., 2013) was developed at the Deutsches Zentrum für Luft- und Raumfahrt (DLR, German Aerospace Centre) using a machine-learning approach based on a corresponding algorithm for ice cloud remote sensing (Kox et al., 2014). This paper illustrates the VADUGS development and assesses the performance of the current version that is run operationally at the Deutscher Wetterdienst (DWD, German Weather Service) since 2015.
Unlike other spaceborne ash retrievals, VADUGS is based on an NN trained with simulated thermal satellite observations. In this approach the true ash properties (ash mass column concentration and ash cloud top height) to be retrieved by the algorithm are known exactly and the geographic and temporal distribution of the ash observations can be selected arbitrarily to enable application of the method to the entire MSG disk at each time of the day and of the night, and during each month of the year. For the creation of the training data set, the tool RTSIM is implemented to automatically combine different surface and atmospheric quantities based on historical numerical weather model results and other data sets as inputs for the radiative transfer simulation code libRadtran. The latter then produces realistic thermal observations for various meteorological conditions with or without liquid and ice water clouds. RTSIM can be easily used and adapted to produce new additional training data sets in the future.
Ash detection is performed by setting a threshold to the retrieved mass column concentration: Pixels with BTD(10.8–12.0) ≤ −0.6 K (pre-filtering) and retrieved VAMC > 0.1 g m−2 are assumed to be ash contaminated. This results in a POD of 0.84 and an FAR of 0.05. Furthermore, VADUGS can detect 60–70 % of all ash-loaded samples with true VAMC smaller than 0.1 g m−2. However, VAMC from VADUGS scatters considerably and errors (MAPE) between approximately 80 % and 300 % are observed. Furthermore, the best results are obtained for moderate viewing zenith angles, corresponding to volcanic ash clouds in mid-latitudes. For VATH, a large scatter (3–5 km) is produced as well, although MAPE is always smaller than 70 % and MPE is even smaller (−10 % to −20 % for viewing zenith angles smaller than approximately 50∘). Usually, low ash clouds with true VATH < 8 km are retrieved with higher correlations and smaller underestimations of −9 % for viewing zenith angles between approximately 40 and 50∘. However, when VAMC is large (>2.0 g m−2), correlation usually increases for all clouds, thus enabling a better distinction between low and high ash clouds. This emerges also from the comparison with the spaceborne CALIOP lidar evaluated for the Puyehue-Cordón Caulle eruption in 2011. Here a reasonable correlation (0.49), MAPE (90 %), MPE (+55 %) and RMSE (0.41 g m−2) show that VADUGS is able to distinguish between thinner and thicker ash pixels although cloud top height is usually strongly underestimated. These results highlight the fact that the outcome of VADUGS depends on various factors and its accuracy can vary considerably. This can be observed also in the comparison with the standard 3-bands retrieval in Sect. 4.4.5, where both retrievals show different detection capabilities that are difficult to explain and have their origin in the complexity of the scenes observed. Furthermore, an additional comparison with airborne measurements by the FAAM (Facility for Airborne Atmospheric Measurements, United Kingdom) and DLR aircraft in the context of the evaluation of the improved version of VADUGS (see below) shows that in those cases on those particular days VAMC is underestimated by VADUGS (see Piontek et al., 2021a, , their Fig. 13). Other retrievals, like the one in Prata and Prata (2012), can show different performance on similar data (overestimation, see Table 1 in their paper, with respect to FAAM measurements on the same day but at later times as in Piontek et al. (2021a)). These findings point to the fact that remote sensing of volcanic ash is a serious challenge. Every retrieval has its own strengths and deficiencies and provides an additional piece of information on the way to a more reliable and efficient mitigation of aviation hazards.
In general, the application of an ice cloud retrieval as in, e.g. Kox et al. (2014) or Strandgren et al. (2017) is recommended in order to identify pixels where volcanic ash cannot be observed due to the presence of high clouds.
The principles of VADUGS can be applied for the creation of retrievals for other sensors with corresponding thermal channels, e.g. de Laat et al. (2020) adapted VADUGS to Himawari. Similar channels can also be found on the imager aboard GOES-R (Schmit et al., 2005), Fengyun-4A (Yang et al., 2016) or the upcoming Meteosat Third Generation spacecraft (e.g. Durand et al., 2015).
VADUGS is developed specifically for the Eyjafjallajökull 2010 eruption. This motivates the use of corresponding volcanic ash properties; specifically, only the refractive index of Eyjafjallajökull ash is applied. However, satellite retrievals are sensitive to the refractive index (Wen and Rose, 1994; Western et al., 2015; Ishimoto et al., 2022), which can vary significantly between different volcanos (Reed et al., 2018; Deguine et al., 2020). Just recently, methods to derive volcanic ash refractive indices of different ash types have been presented (Prata et al., 2019; Piontek et al., 2021c). Furthermore, ash microphysics (shape and size) also affects scattered and emitted radiation and can vary from one volcanic eruption to the other and also as a function of the distance from the source. Using the data set by Piontek et al. (2021c) constitutes a major improvement of the successor to VADUGS (Piontek et al., 2021b, a). The resulting retrieval also alleviates or eliminates other shortcomings of VADUGS mentioned in this paper, thus encompassing, for instance a larger temporal variability of atmospheric profiles and using more realistic radiative transfer simulations.
The operational application of VADUGS at DWD can thus provide airlines and other users with a useful spaceborne volcanic ash product that can be used to monitor volcanic ash evolution.
In IFS, a cloud-overlap algorithm computes the relative position of clouds across model levels and considers both cloud cover and cloud water content to realistically represent clouds on the spatial scale of the model (ca. 32 km for a spatial resolution of 0.25∘ in latitude and longitude). The maximum-random overlap assumption (Morcrette and Fouquart, 1986) used by ECMWF, particularly relevant for shortwave but also for longwave radiation, states that adjacent layers overlap maximally, while cloud layers separated by cloud-free layers overlap randomly. This procedure has to be translated into a 1D cloud structure (variability only in the vertical direction) since the 1D radiative transfer model can only handle cloud layers that are completely cloudy and because the spatial resolution of the satellite pixels (3 km at nadir, see Sect. 2.1) is a factor of 10 smaller than the model resolution. To this end, the layer-dependent cloud fraction is used to set up a random cloud structure consisting of 0 or more cloud layers, so that for each atmosphere layer a cloud fraction value of 0 or 1 is given. Adjacent cloudy layers are grouped and it is assumed that the cloud fractions overlap as much as possible in each group. The status of each layer is determined by the random position for an intersection through the corresponding group: All layers of the group are completely cloudy, if their cloud cover fraction exceeds the intersection position. Figure A1 shows an example for the determination of cloud layers. Two adjacent layers with cloud fractions of 37.5 % and 50 % make up the first cloud group. If the value of the intersection chosen at random is 25 %, marked with a bold vertical line, then both layers have a higher cloud cover value and therefore are cloudy, indicated by the bold layer number to the left. For the second group, with layers 5–8, three layers are cloudy for an intersection value of 50 %, while layer 10, being the only one in the third group, has a value of 18.75 % below an intersection value of 75 %.
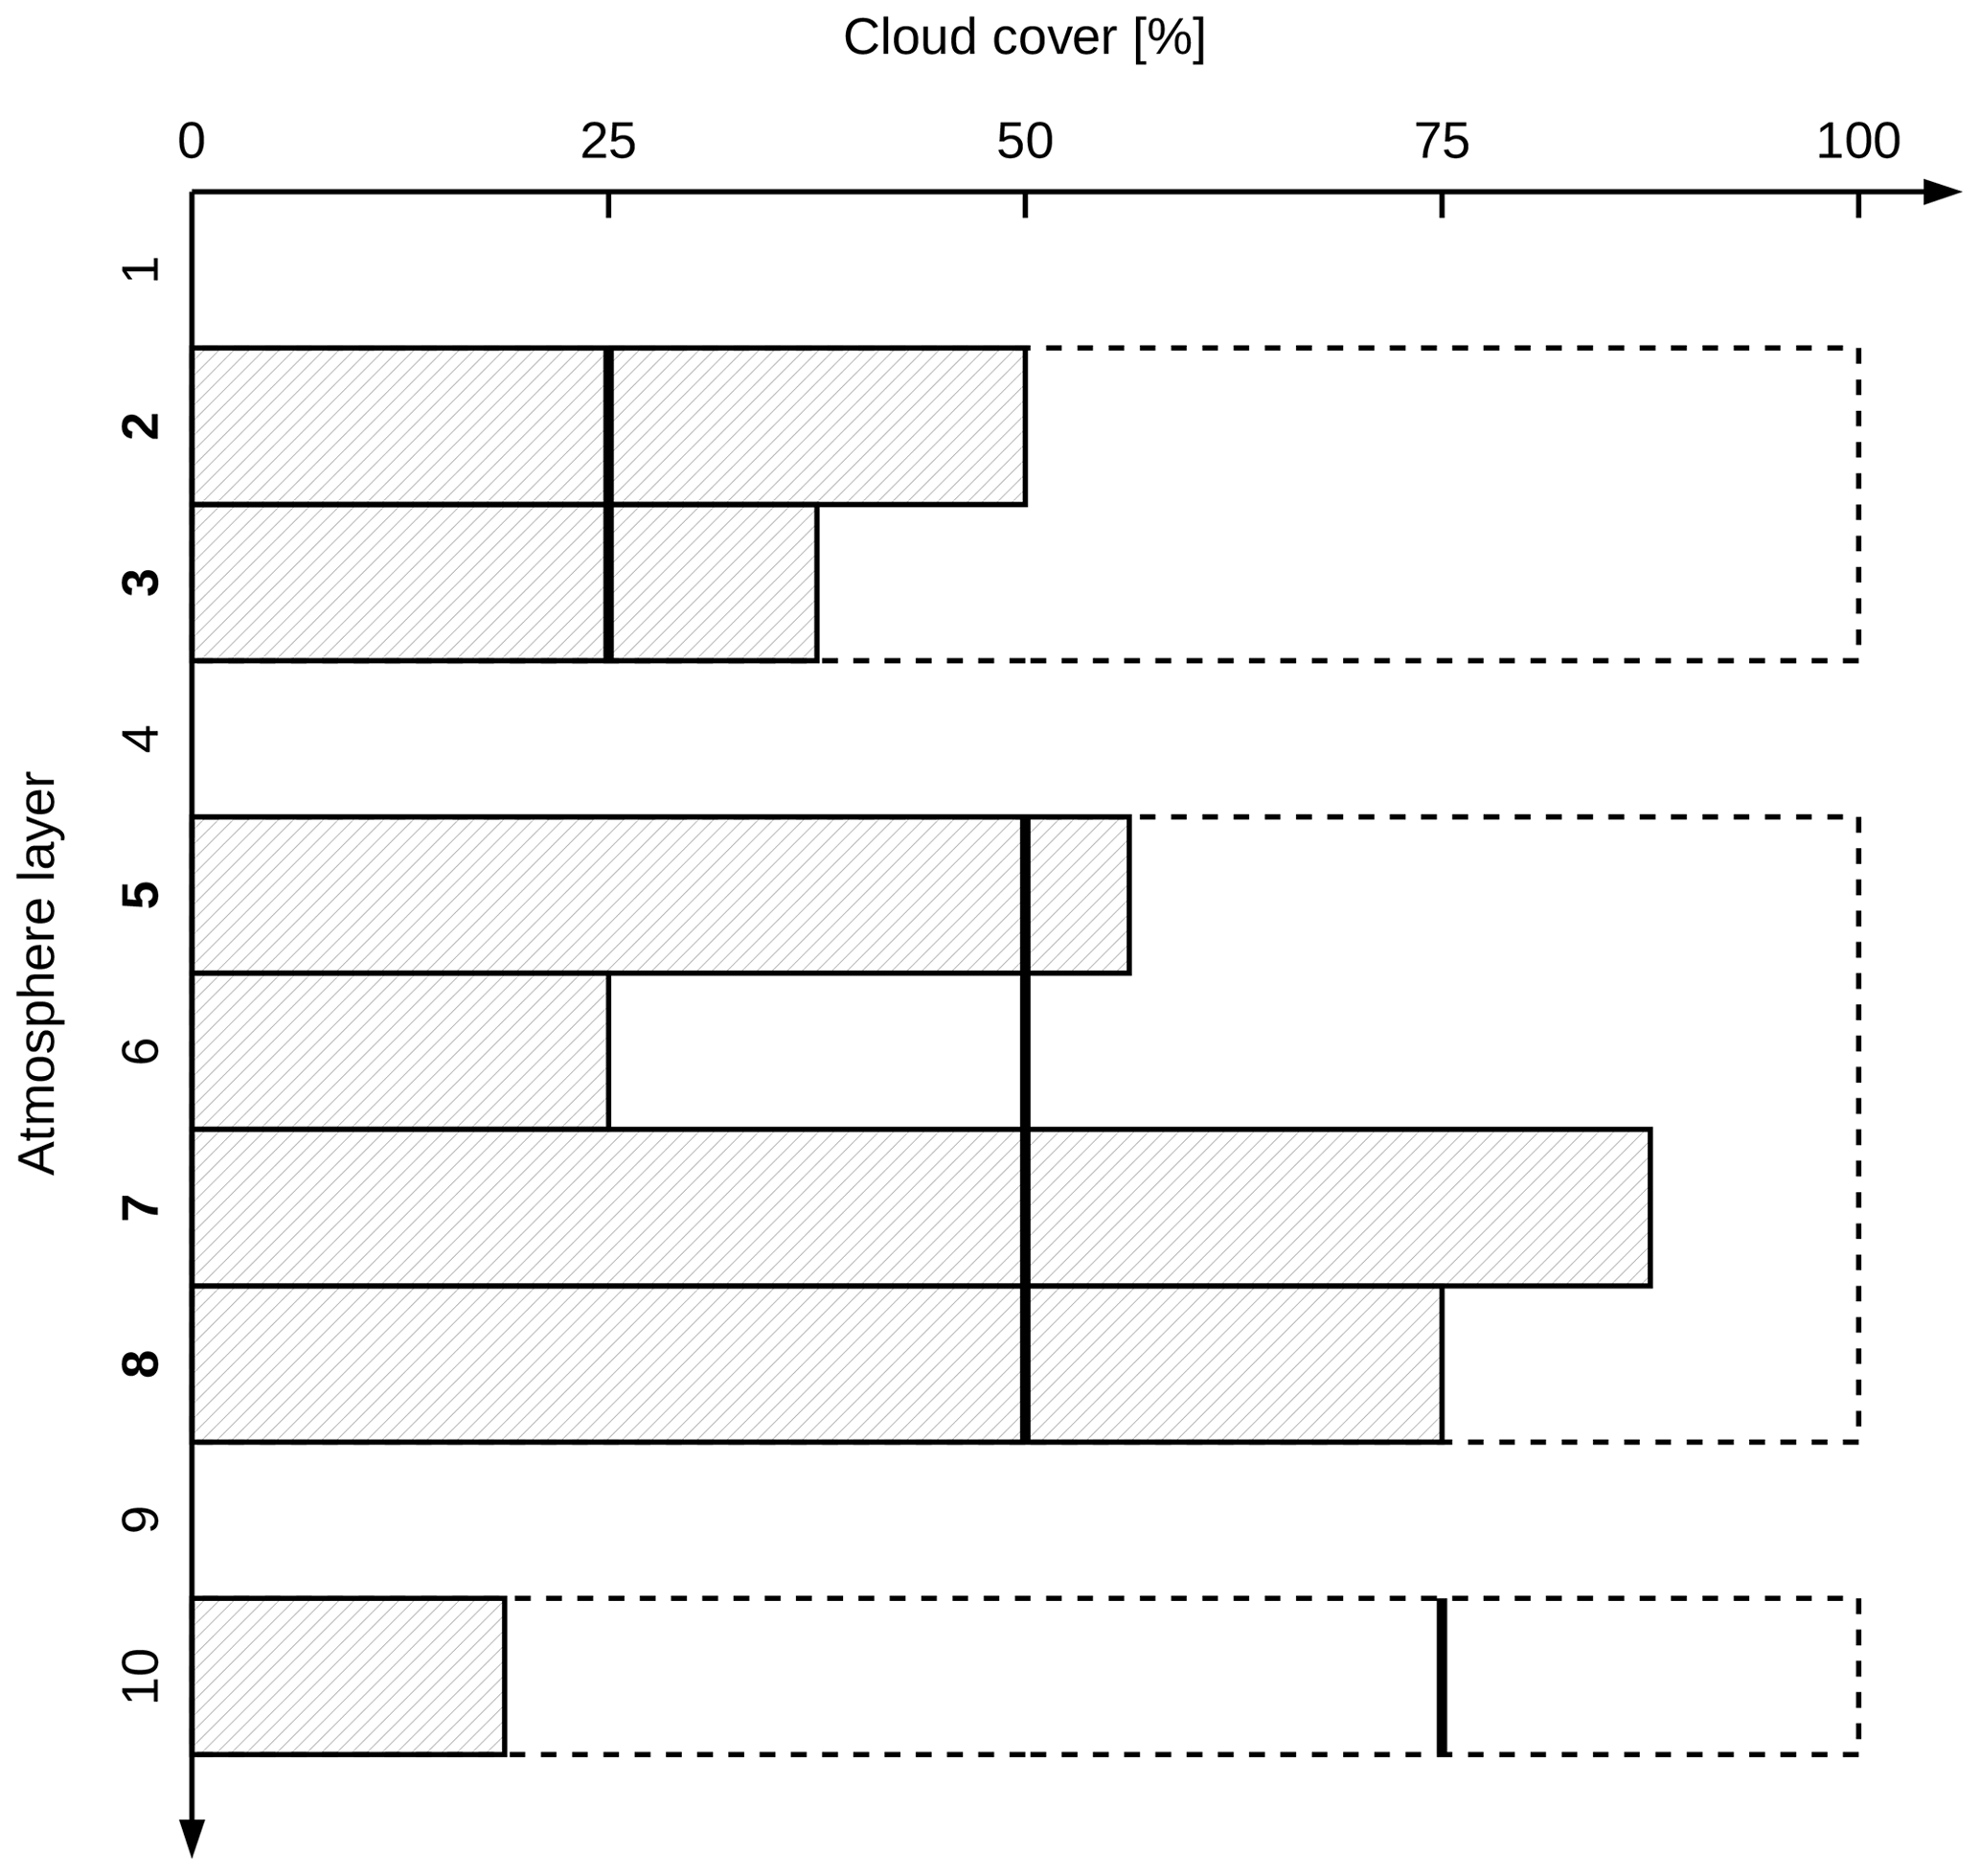
Figure A1Scheme illustrating determination of cloud layers. Shaded boxes with solid borders show cloud layers with cloud cover percentages given by their horizontal extent. Adjacent cloud layers are combined to groups outlined by broken borders. For each group a bold vertical line marks the intersection position used for layer determination. Atmosphere layer numbers in bold indicate intersected cloud layers, which generate a cloudy layer during the set-up.
Cloud effective radii for each cloud layer are computed using two different parameterizations, one for water clouds and one for ice clouds. The water cloud parameterization applied is described by Bugliaro et al. (2011):
For layer i, is the effective radius, cL,i the liquid water content, the droplet density, and kg m−3 the water density at 4 ∘C.
Effective radii for ice cloud layers are determined by the parameterization from Wyser (1998); McFarquhar et al. (2003):
Ti is the temperature and cI,i the ice water content. Typographical errors in the formulas of both publications were corrected.
To avoid the implementation of perfect clouds, noise is introduced by the multiplication of the effective radii with uniform random values between 0.9 and 1.1.
To determine the optical properties of water clouds, the parameterization by Hu and Stamnes (1993) is applied, with effective radius limit values of 2.5 and 60 µm. Optical properties of ice clouds are calculated using the parameterization of Yang et al. (2000); Key et al. (2002), extended by B. Mayer to cover the infrared spectral range (see Emde et al., 2016), for five ice particle habits (solid column, hollow column, aggregate, rosette-6, plate) encompassing the range of 2.85–108.10 µm. Ice crystal shapes are selected randomly.
The Earth Observation and Data group at the University of Oxford, and the STFC Rutherford Appleton Laboratory (RAL) Molecular Spectroscopy Facility (MSF), developed a set of analytical and experimental techniques to derive the refractive index from transmission spectra of laboratory aerosols. The method has been developed over many years; it has been applied to mimic polar stratospheric clouds (Bass, 2003), sea salt aerosols (Irshard et al., 2009), Saharan dust (Peters et al., 2007) and later by Reed et al. (2017, 2018) to volcanic ash. The Aerosol Refractive Index Archive containing these spectral refractive indices and other literature values can be found at http://eodg.atm.ox.ac.uk/ARIA/index.html (last access: 28 March 2022). A short description of this method used to generate the Eyjafjallajökull refractive index used in this paper follows, and more details can be found in the references. The fresh Eyjafjallajökull sample used was collected from the ground by Dr. Evgenia Ilysinkaya in Iceland on 17 April 2010 at 18:20 LT (local time) downwind and ∼6 km from the source. The sample is very fine as the eruption was phreatomagmatic at the time, and should be a good analogue to the long-range transported ash at around this time (see also details of the aerosol cell given in the next section).
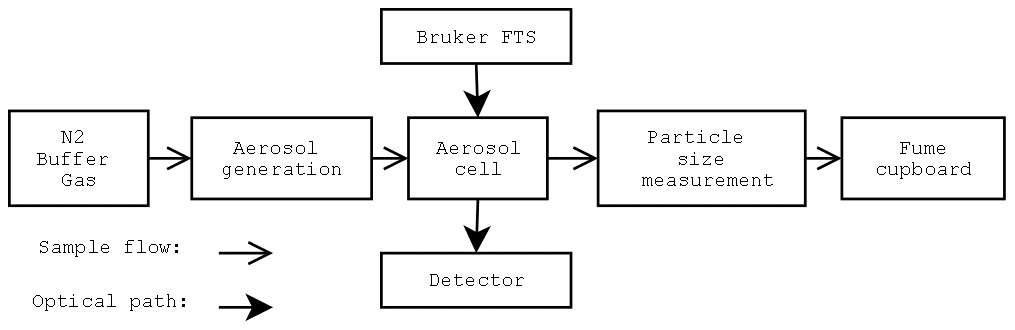
A brief overview of the main experimental components is given in Fig. B1. The ash sample is first dried to remove any excess water and transferred for dispersal in a flow of nitrogen buffer gas. The aerosol is then injected into the 75 L aerosol cell, and multi-pass optics are used to measure the optical transmission in the range 526–30 000 cm−1 with a Bruker FTS and detector with a 1.9 cm−1 resolution. A description of the aerosol cell can be found in McPheat et al. (2001), while the dispersal method that lofted the aerosol in the cell (particularly efficient for aerosol sizes smaller than 1 µm) is described in Reed et al. (2017). Aerosol size distributions are measured via different methods, an optical particle counter (radii 0.15–10 µm) and a scanning mobility particle sizer (radii 0.005–0.44 µm). For a detailed experimental description of the experiment, see Reed et al. (2017).
Gas absorption features in the infrared spectra are minimized by using a nitrogen buffer gas but some residual carbon dioxide and water lines still remain. These lines are removed by a line-by-line gas retrieval of the transmission spectra using the Reference Forward Model (RFM Dudhia, 2017), leaving the aerosol transmission signal.
In this experiment the forward model represents the aerosol cell transmission T(λ):
where β(λ) is the volume extinction coefficient, x the path length through the test cell at the wavelength λ. The extinction cross-section σext can be calculated, if we assume a particle scattering model and know the particle size distribution, from
where r is the particle radius, m(λ) the complex refractive index and n(r)dr the number of particles per unit volume between radii r and r+dr. A damped harmonic oscillator model is used to represent the complex refractive index m(λ). Information from the sizing instruments constrains the size distribution used in the model. The complex refractive index in Fig. B2, where the real and imaginary part, mr and mi, respectively, of the refractive indices are shown on top of the spectral response functions of MSG2/SEVIRI2, was retrieved from this model using the Levenberg–Marquardt method. Full details of the analysis method can be found in Thomas et al. (2005).
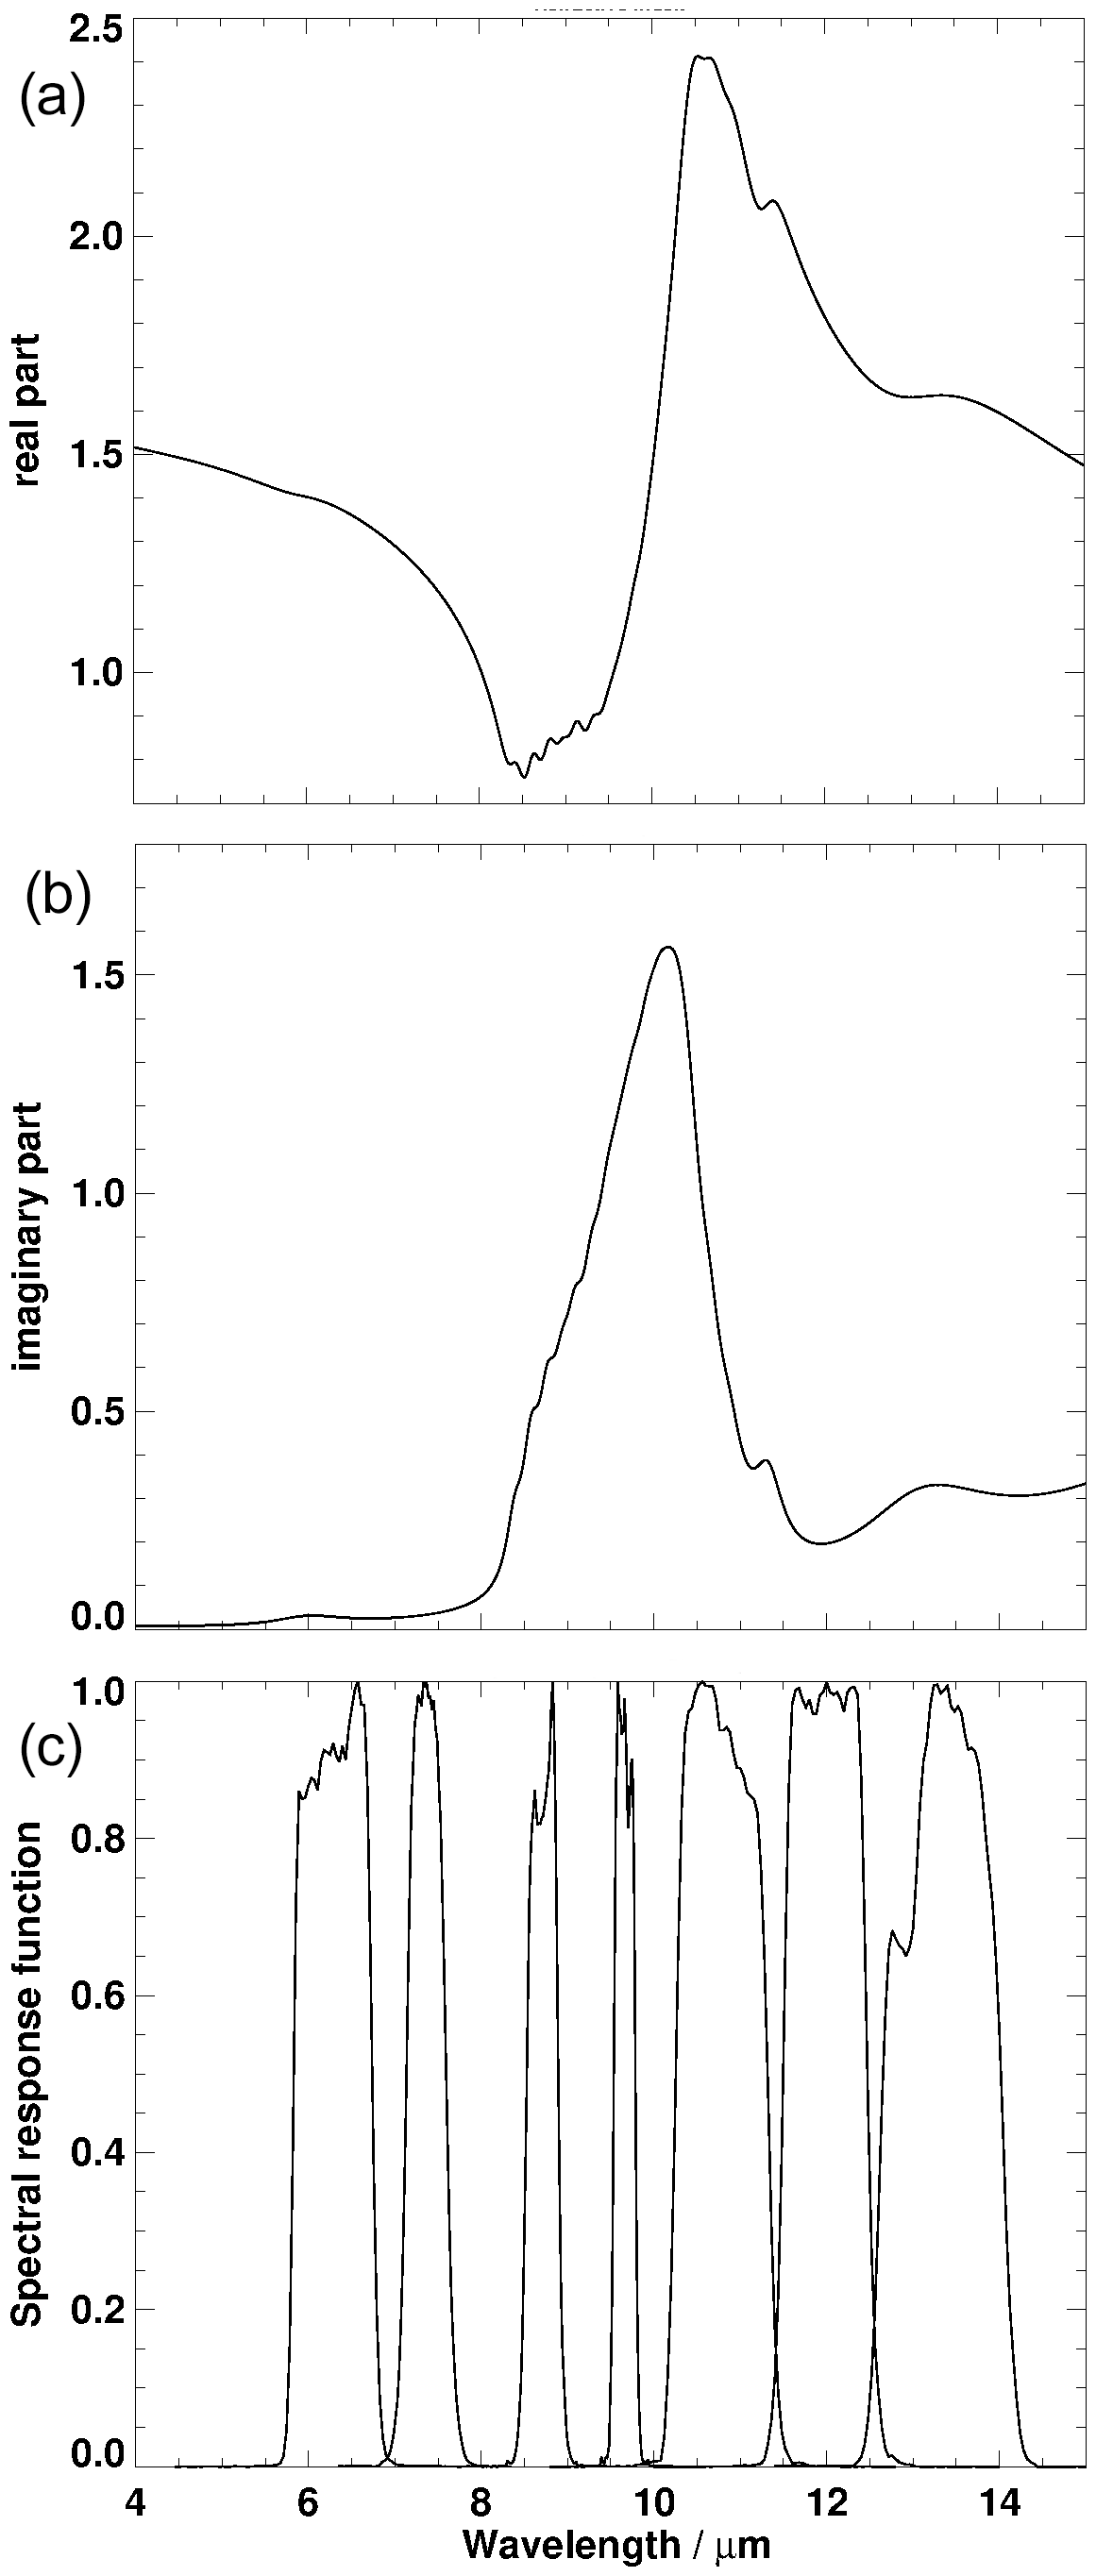
Figure B2Real and imaginary part of the refractive index m of Eyjafjallajökull ash ((a) and (b)) and spectral response functions of MSG2/SEVIRI2 (c).
The refractive indices of volcanic ash presented here are a preliminary version of the data used in Ball et al. (2015) and Reed et al. (2017, 2018) for Eyjafjallajökull ash. They assume the Mie theory. Latter results in the Rayleigh regime use the continuous distribution of ellipsoids (CDEs) to account for non-spherical effects. These provided a better fit to the measurements but were not available at the time of this work. It should be noted that while CDE may provide better results, there are differences between the refractive index values in current publications which have arisen from differences in ash sample, analysis technique and noise. In fact, mr from Reed et al. (2018) reaches below 1 as in the data set used here, but the minimum mr equals 1 for the measurement in Deguine et al. (2020). The maximum of mr remains smaller than 2 for Reed et al. (2018) but is as high as approximately 2.4 in Deguine et al. (2020), similarly to those used here. With respect to mi, the peak in Fig. B2 is lower than in the data given by Reed et al. (2018) and Deguine et al. (2020).
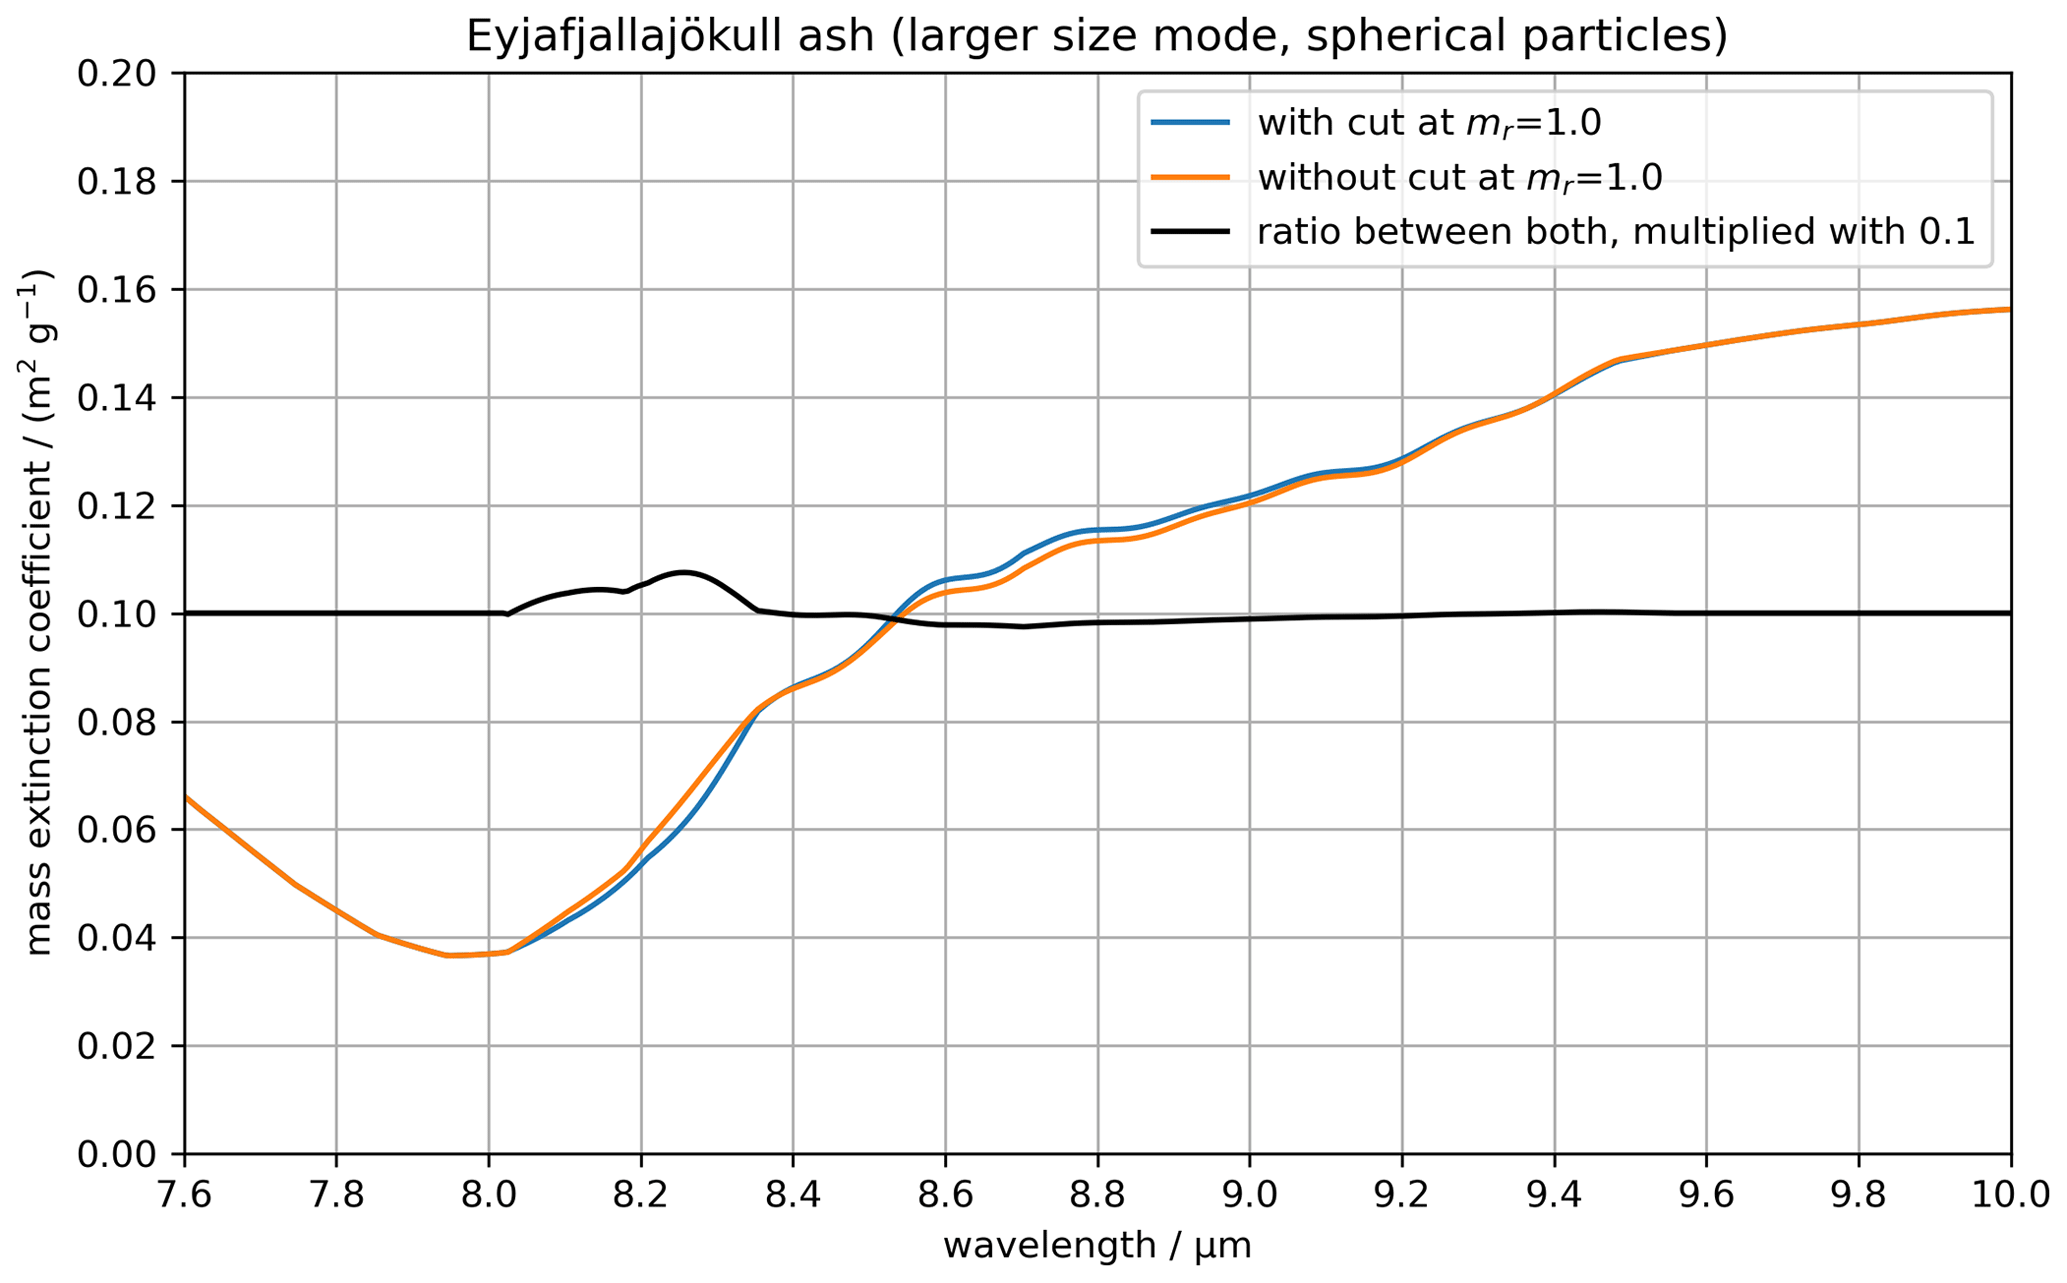
Figure B3Mass extinction coefficients for spherical particles with the original refractive index m from Fig. B2 (orange line) and with the same refractive index mr cut at 1 in the spectral region between 8 and 10 µm (blue line). The black line is the ratio between the orange and blue line and has been multiplied by 0.1, meaning that a value of 0.1 corresponds to exactly the same values in the two situations.
Considering the spectral response functions of MSG2/SEVIRI2, Fig. B2 shows the expected “reverse” absorption feature (Wen and Rose, 1994; Pavolonis et al., 2006) mentioned in the Introduction: Higher values of mi in the 10.8 µm channel with respect to the 12.0 µm channel indicate stronger absorption and thus smaller BTs in the first spectral interval than in the second one. It is also noteworthy that absorption is higher at 8.7 µm than at 12.0 µm and that the maximum absorption takes place very close to the peak of the ozone channel centred at 9.7 µm.
Optical properties are computed with an early version of MOPSMAP (Gasteiger and Wiegner, 2018) based on the T-matrix code of Mishchenko and Travis (1998) and the improved geometric optics method (IGOM) code by Yang et al. (2007). Since volcanic ash is usually aspherical (e.g. Riley et al., 2003), we assume prolate spheroids with a distribution of aspect ratios from 1.2 to 5 with a median value around 2.1. Furthermore, two logarithmic normal size distributions are assumed with a standard deviation of 2. The distributions extend from 0.08 to 12.1 µm and their mode radii equal 0.4 and 2 µm, respectively. The size distribution range is thus in good agreement with the literature (e.g. Chuan et al., 1981; Hobbs et al., 1981; Prata, 1989a; Turnbull et al., 2012). Mass density amounts to 2600 kg m−3 (e.g. Wilson et al., 2012). Since the IGOM code does not support refractive indices smaller than 1, the real part mr<1 of the refractive index had to be limited in the spectral range between approximately 8 and 10 μm to the supported range. In order to estimate the impact of this assumption on the computed extinction coefficients, two calculations, one with cut and one without, are performed for spherical particles. The result in Fig. B3 shows that only in the spectral range between 8 and 9.2 µm do differences exist. Thus, only the 8.7 µm channel is affected and in this sensor band the inaccuracy of the mass extinction coefficient amounts to 1 % at most.
The probability of detection (POD) and the false-alarm rate (FAR) are used as validation metrics to assess the accuracy of the detection performance of VADUGS, i.e. of VAC, while the mean percentage error (MPE) and mean absolute percentage error (MAPE) are used to measure the accuracy of VATH and VAMC. These metrics are used in the validation section (Sect. 4.4).
The POD measures how efficiently VADUGS detects volcanic ash. It is given by
where the number of true positives, NTP, are all points correctly classified as ash, and the number of false negatives, NFN, all missed ash clouds (see Table C1). The denominator, NTP+NFN, is thus the total number of points with ash clouds. The FAR measures how large fractions of the ash-free points are falsely classified as being ash by VADUGS. It is given by
where the number of false positives, NFP, are all points falsely classified as ash, i.e. the false alarms, and the number of true negatives, NTN, all points correctly identified as ash free. The denominator, NFP+NTN, is thus the total number of points with no ash clouds. The corresponding simulation data (Sect. 3.1.7) are used as a reference when calculating the POD and FAR. Table C1 clarifies the quantities used to calculate the POD and FAR.
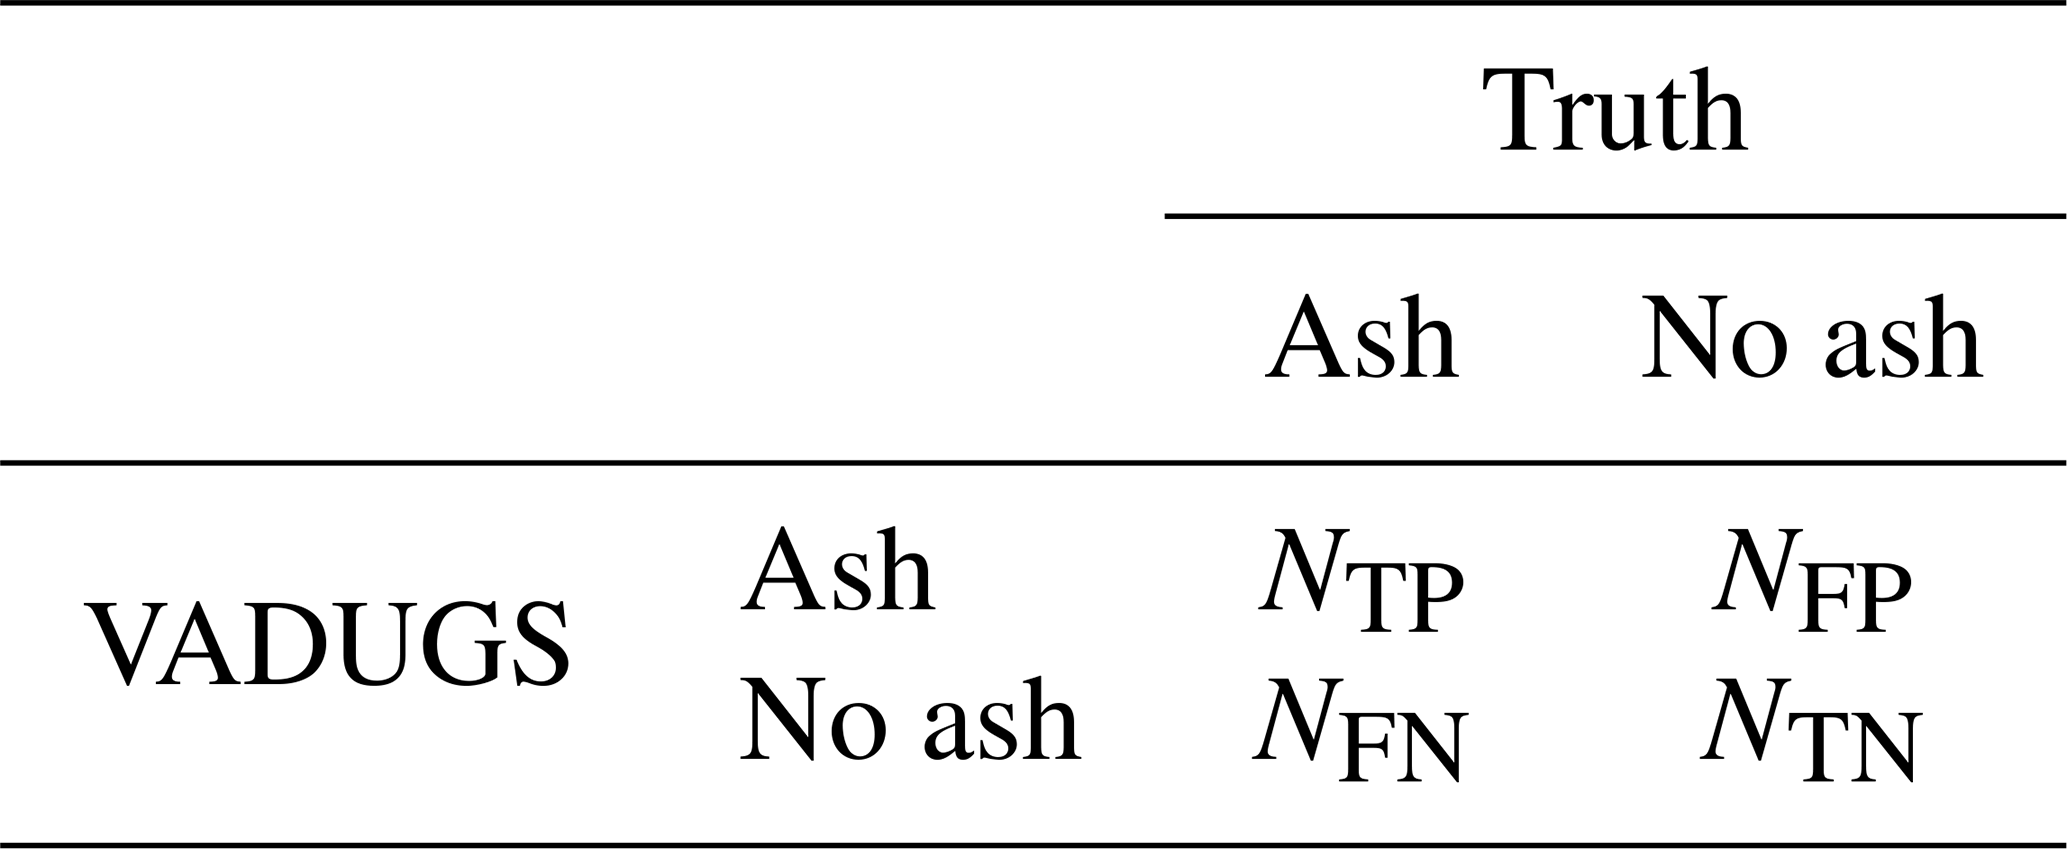
The MPE and MAPE are used to measure the accuracy of the retrieved ash quantities retrieval with respect to the truth. The MPE is given by
where T is the truth (Sect. 3.1.7, simulated observations), E the estimated value by VADUGS and N the number of simulations used. The MPE gives information on the direction of the deviations, i.e. whether VADUGS tends to overestimate or underestimate the values with respect to the simulated truth. The MAPE is given by
and gives information on the average magnitude of the errors relative to the expected truth values. A value of 0.0 % means no deviation from the truth and a perfect correlation.
Finally, the standard deviation (RMSE) of VADUGS with respect to the simulated truth is given by
Please contact the authors for the data used in this paper or for additional data processed with VADUGS.
LB and DP applied the retrieval, performed the validation and written most of the text. SK implemented the first version of VADUGS as an NN. MS developed RTSIM. MVN contributed to the installation of VADUGS and the ice cloud retrieval at DWD and investigated possibilities to improve the retrieval. BM developed libRadtran and supervised its application for RTSIM. RM implemented VADUGS at DWD and performed the skin temperature sensitivity study. DMP and RGG measured refractive indices of ash. JK prepared the CALIOP data for validation. JG computed optical properties of volcanic ash. All authors have contributed to the text.
The contact author has declared that neither they nor their co-authors have any competing interests.
Publisher's note: Copernicus Publications remains neutral with regard to jurisdictional claims in published maps and institutional affiliations.
We thank Hermann Mannstein (deceased) for his initial steps into machine learning in the early 2010s that led to various new satellite retrievals in the course of the years. We thank Kaspar Graf for his work with VADUGS and the establishment of VADUGS in the German community as a reliable volcanic ash algorithm. Jayanta Kar thanks Mark Vaughan for useful discussions on correcting the low bias from the default ash lidar ratios used in CALIOP version 4.10. We thank two anonymous reviewers for a stimulating discussion leading to an improved version of the paper. Luca Bugliaro, Dennis Piontek and Margarita Vázquez-Navarro were supported by the European Unions's Horizon 2020 research and innovation programme under grant agreement no. 723986 (EUNADICS-AV). Josef Gasteiger was funded by the European Research Council (ERC) under the European Union's Horizon 2020 research and innovation framework programme under grant agreement no. 640458 (A-LIFE).
This research has been supported by the Innovation and Networks Executive Agency (EUNADICS-AV, grant no. 723986) and the European Research Council, H2020 European Research Council (A-LIFE, grant no. 640458).
The article processing charges for this open-access publication were covered by the German Aerospace Center (DLR).
This paper was edited by Giovanni Macedonio and reviewed by two anonymous referees.
Ball, J., Reed, B., Grainger, R., Peters, D., Mather, T., and Pyle, D.: Measurements of the complex refractive index of volcanic ash at 450, 546.7, and 650 nm, J. Geophys. Res., 120, 7747–7757, https://doi.org/10.1002/2015JD023521, 2015. a
Bass, S. F.: Optical Properties of laboratory-generated polar stratospheric particles, PhD thesis, Oxford University, Oxford, http://eodg.atm.ox.ac.uk/eodg/theses/Bass.pdf (last access: 28 March 2022), 2003. a
Baum, B. A., Soulen, P. F., Strabala, K. I., King, M. D., Ackerman, S. A., Menzel, W. P., and Yang, P.: Remote sensing of cloud properties using MODIS airborne simulator imagery during SUCCESS: 2. Cloud thermodynamic phase, J. Geophys. Res.-Atmos., 105, 11781–11792, https://doi.org/10.1029/1999JD901090, 2000. a
Brenot, H., Theys, N., Clarisse, L., van Gent, J., Hurtmans, D. R., Vandenbussche, S., Papagiannopoulos, N., Mona, L., Virtanen, T., Uppstu, A., Sofiev, M., Bugliaro, L., Vázquez-Navarro, M., Hedelt, P., Parks, M. M., Barsotti, S., Coltelli, M., Moreland, W., Scollo, S., Salerno, G., Arnold-Arias, D., Hirtl, M., Peltonen, T., Lahtinen, J., Sievers, K., Lipok, F., Rüfenacht, R., Haefele, A., Hervo, M., Wagenaar, S., Som de Cerff, W., de Laat, J., Apituley, A., Stammes, P., Laffineur, Q., Delcloo, A., Lennart, R., Rokitansky, C.-H., Vargas, A., Kerschbaum, M., Resch, C., Zopp, R., Plu, M., Peuch, V.-H., Van Roozendael, M., and Wotawa, G.: EUNADICS-AV early warning system dedicated to supporting aviation in the case of a crisis from natural airborne hazards and radionuclide clouds, Nat. Hazards Earth Syst. Sci., 21, 3367–3405, https://doi.org/10.5194/nhess-21-3367-2021, 2021. a, b
Budd, L., Griggs, S., Howarth, D., and Ison, S.: A Fiasco of Volcanic Proportions? Eyjafjallajökull and the Closure of European Airspace, Mobilities, 6, 31–40, https://doi.org/10.1080/17450101.2011.532650, 2011. a
Bugliaro, L., Zinner, T., Keil, C., Mayer, B., Hollmann, R., Reuter, M., and Thomas, W.: Validation of Cloud Property Retrievals with Simulated Satellite Radiances: a Case Study for SEVIRI, Atmos. Chem. Phys., 11, 5603–5624, https://doi.org/10.5194/acp-11-5603-2011, 2011. a
Buras, R., Dowling, T., and Emde, C.: New Secondary-Scattering Correction in DISORT with Increased Efficiency for Forward Scattering, J. Quant. Spectrosc. Ra., 112, 2028–2034, 2011. a
Chuan, R. L., Woods, D. C., and McCormick, M. P.: Characterization of Aerosols from Eruptions of Mount St. Helens, Science, 211, 830–832, https://doi.org/10.1126/science.211.4484.830, 1981. a
Deguine, A., Petitprez, D., Clarisse, L., Gudmundsson, S., Outes, V., Villarosa, G., and Herbin, H.: Complex refractive index of volcanic ash aerosol in the infrared, visible, and ultraviolet, Appl. Optics, 59, 884–895, https://doi.org/10.1364/AO.59.000884, 2020. a, b, c, d
de Laat, A., Vazquez-Navarro, M., Theys, N., and Stammes, P.: Analysis of properties of the 19 February 2018 volcanic eruption of Mount Sinabung in S5P/TROPOMI and Himawari-8 satellite data, Nat. Hazards Earth Syst. Sci., 20, 1203–1217, https://doi.org/10.5194/nhess-20-1203-2020, 2020. a, b
Dudhia, A.: The reference forward model (RFM), J. Quant. Spectrosc. Ra., 186, 243–253, https://doi.org/10.1016/j.jqsrt.2016.06.018, 2017. a
Durand, Y., Hallibert, P., Wilson, M., Lekouara, M., Grabarnik, S., Aminou, D., Blythe, P., Napierala, B., Canaud, J.-L., Pigouche, O., Ouaknine, J., and Verez, B.: The flexible combined imager onboard MTG: from design to calibration, in: Sensors, Systems, and Next-Generation Satellites XIX, vol. 9639, edited by: Meynart, R., Neeck, S. P., and Shimoda, H., International Society for Optics and Photonics, SPIE, 1–14, https://doi.org/10.1117/12.2196644, 2015. a
DWD2015: Jahresbericht 2015: Flugwetterdienst, Deutscher Wetterdienst, https://www.dwd.de/DE/fachnutzer/luftfahrt/download/jahresberichte_flugwetterdienst/2015.pdf?__blob=publicationFile&v=3 (last access: 5 August 2021), 2015. a
ECMWF: IFS Documentation – CY36R1, European Centre for Medium-Range Weather Forecasts, https://www.ecmwf.int/en/elibrary/9233-ifs-documentation-cy36r1-part-iv-physical-processes (last access: 28 March 2022), 2010. a
Emde, C., Buras-Schnell, R., Kylling, A., Mayer, B., Gasteiger, J., Hamann, U., Kylling, J., Richter, B., Pause, C., Dowling, T., and Bugliaro, L.: The libRadtran Software Package for Radiative Transfer Calculations (Version 2.0.1), Geosci. Model Dev., 9, 1647–1672, https://doi.org/10.5194/gmd-9-1647-2016, 2016. a, b, c
Ewald, F., Bugliaro, L., Mannstein, H., and Mayer, B.: An improved cirrus detection algorithm MeCiDA2 for SEVIRI and its evaluation with MODIS, Atmos. Meas. Tech., 6, 309–322, https://doi.org/10.5194/amt-6-309-2013, 2013. a
Francis, P. N., Cooke, M. C., and Saunders, R. W.: Retrieval of Physical Properties of Volcanic Ash Using Meteosat: a Case Study From the 2010 Eyjafjallajökull Eruption, J. Geophys. Res., 117, D00U09, https://doi.org/10.1029/2011JD016788, 2012. a, b
Gasteiger, J. and Wiegner, M.: MOPSMAP v1.0: a versatile tool for the modeling of aerosol optical properties, Geosci. Model Dev., 11, 2739–2762, https://doi.org/10.5194/gmd-11-2739-2018, 2018. a
Gasteiger, J., Groß, S., Freudenthaler, V., and Wiegner, M.: Volcanic ash from Iceland over Munich: mass concentration retrieved from ground-based remote sensing measurements, Atmos. Chem. Phys., 11, 2209–2223, https://doi.org/10.5194/acp-11-2209-2011, 2011. a
Gouhier, M., Guéhenneux, Y., Labazuy, P., Cacault, P., Decriem, J., and Rivet, S.: HOTVOLC: a web-based monitoring system for volcanic hot spots, in: Detecting, Modelling and Responding to Effusive Eruptions, Geological Society of London, https://doi.org/10.1144/SP426.31, 2016. a
Gouhier, M., Deslandes, M., Guéhenneux, Y., Hereil, P., Cacault, P., and Josse, B.: Operational Response to Volcanic Ash Risks Using HOTVOLC Satellite-Based System and MOCAGE-Accident Model at the Toulouse VAAC, Atmosphere, 11, 864, https://doi.org/10.3390/atmos11080864, 2020. a, b
Graf, K., Kox, S., Schmidl, M., Gasteiger, J., and Buras, R.: The VADUGS algorithm, Volcanic Ash Detection using Geostationary Satellites, presentation at the WMO Intercomparison, in: Workshop, 29 June–2 July 2015, Madison, Wisconsin, USA, http://cimss.ssec.wisc.edu/meetings/vol_ash15/PDFs/20150630/Item2.10_20150630_WMO_Madison_Graf.pdf (last access: 1 August 2021), 2015. a
Gray, T. M. and Bennartz, R.: Automatic volcanic ash detection from MODIS observations using a back-propagation neural network, Atmos. Meas. Tech., 8, 5089–5097, https://doi.org/10.5194/amt-8-5089-2015, 2015. a
Guéhenneux, Y., Gouhier, M., and Labazuy, P.: Improved Space Borne Detection of Volcanic Ash for Real-Time Monitoring Using 3-Band Method, J. Volcanol. Geoth. Res., 293, 25–45, https://doi.org/10.1016/j.jvolgeores.2015.01.005, 2015. a, b, c
Hobbs, P. V., Radke, L. F., Eltgroth, M. W., and Hegg, D. A.: Airborne Studies of the Emissions from the Volcanic Eruptions of Mount St. Helens, Science, 211, 816–818, https://doi.org/10.1126/science.211.4484.816, 1981. a
Hu, Y. X. and Stamnes, K.: An Accurate Parameterization of the Radiative Properties of Water Clouds Suitable for Use in Climate Models, J. Climate, 6, 728–742, https://doi.org/10.1175/1520-0442(1993)006<0728:AAPOTR>2.0.CO;2, 1993. a
Inoue, T.: On the temperature and effective emissivity determination of semi-transparent cirrus clouds by bi-spectral measurements in the 10 µm window region, J. Meteorol. Soc. Jpn., 63, 88–99, 1985. a
Irshard, R., Grainger, R. G., Peters, D. M., and McPheat, R. A.: Laboratory measurements of the optical properties of sea salt aerosols, Atmos. Chem. Phys., 9, 221–223, https://doi.org/10.5194/acp-9-221-2009, 2009. a
Ishimoto, H., Hayashi, M., and Mano, Y.: Ash particle refractive index model for simulating the brightness temperature spectrum of volcanic ash clouds from satellite infrared sounder measurements, Atmos. Meas. Tech., 15, 435–458, https://doi.org/10.5194/amt-15-435-2022, 2022. a
Key, J., Yang, P., Baum, B., and Nasiri, S.: Parameterization of shortwave ice cloud optical properties for various particle habits, J. Geophys. Res., 107, AAC 7-1–AAC 7-10, https://doi.org/10.1029/2001JD000742, 2002. a
Kim, M.-H., Omar, A. H., Tackett, J. L., Vaughan, M. A., Winker, D. M., Trepte, C. R., Hu, Y., Liu, Z., Poole, L. R., Pitts, M. C., Kar, J., and Magill, B. E.: The CALIPSO version 4 automated aerosol classification and lidar ratio selection algorithm, Atmos. Meas. Tech., 11, 6107–6135, https://doi.org/10.5194/amt-11-6107-2018, 2018. a
Kox, S., Schmidl, M., Graf, K., Mannstein, H., Buras, R., and Gasteiger, J.: A new approach on the detection of volcanic ash clouds, in: Joint 2013 EUMETSAT Meteorological Satellite Conference and the 19th Satellite Meteorology, Oceanography and Climatology Conference of the American Meteorological Society, 10–16 September 2013, Vienna, Austria, https://www.eumetsat.int/2013-eumetsat-meteorological-satellite-conference (last access: 28 March 2022), 2013. a, b
Kox, S., Bugliaro, L., and Ostler, A.: Retrieval of cirrus cloud optical thickness and top altitude from geostationary remote sensing, Atmos. Meas. Tech., 7, 3233–3246, https://doi.org/10.5194/amt-7-3233-2014, 2014. a, b, c, d, e, f, g, h, i, j
Langmann, B.: Volcanic Ash versus Mineral Dust: Atmospheric Processing and Environmental and Climate Impacts, International Scholarly Research Notices, 2013, https://doi.org/10.1155/2013/245076, 2013. a
Langmann, B., Folch, A., Hensch, M., and Matthias, V.: Volcanic ash over Europe during the eruption of Eyjafjallajökull on Iceland, April–May 2010, Atmos. Environ., 48, 1–8, https://doi.org/10.1016/j.atmosenv.2011.03.054, 2012. a, b
Lee, K. H., Wong, M. S., Chung, S.-R., and Sohn, E.: Improved Volcanic Ash Detection Based on a Hybrid Reverse Absorption Technique, Atmos. Res., 143, 31–42, https://doi.org/10.1016/j.atmosres.2014.01.019, 2014. a
Mackie, S. and Watson, M.: Probabilistic Detection of Volcanic Ash Using a Bayesian Approach, J. Geophys. Res.-Atmos., 119, 2409–2428, https://doi.org/10.1002/2013JD021077, 2014. a
Marenco, F., Johnson, B., Turnbull, K., Newman, S., Haywood, J., Webster, H., and Ricketts, H.: Airborne lidar observations of the 2010 Eyjafjallajökull volcanic ash plume, J. Geophys. Res.-Atmos., 116, D00U05, https://doi.org/10.1029/2011JD016396, 2011. a, b, c
Mayer, B. and Kylling, A.: Technical note: The libRadtran software package for radiative transfer calculations – description and examples of use, Atmos. Chem. Phys., 5, 1855–1877, https://doi.org/10.5194/acp-5-1855-2005, 2005. a, b
McFarquhar, G. M., Iacobellis, S., and Somerville, R. C. J.: SCM Simulations of Tropical Ice Clouds Using Observationally Based Parameterizations of Microphysics, J. Climate, 16, 1643–1664, https://doi.org/10.1175/1520-0442(2003)016<1643:SSOTIC>2.0.CO;2, 2003. a
McPheat, R. A., Newnham, D. A., Williams, R. G., and Ballard, J.: Large-volume, coolable spectroscopic cell for aerosol studies, Appl. Optics, 40, 6581–6586, https://doi.org/10.1364/AO.40.006581, 2001. a
Menzel, W., Smith, W., and Stewart, T.: Improved cloud motion wind vector and altitude assignment using VAS, J. Appl. Meteorol., 22, 377–384, 1983. a
Miller, T. P. and Casadevall, T. J.: Volcanic Ash Hazards to Aviation, in: Encyclopedia of Volcanoes, edited by: Sigurdsson, H., Houghton, B., Rymer, H., Stix, J., and McNutt, S., Academic Press, 915–930, ISBN 9780126431407, 2000. a
Mishchenko, M. I. and Travis, L. D.: Capabilities and limitations of a current Fortran implementation of the T-Matrix method for randomly oriented, rotationally symmetric scatterers, J. Quant. Spectrosc. Ra., 60, 309–324, https://doi.org/10.1016/S0022-4073(98)00008-9, 1998. a
Morcrette, J.-J. and Fouquart, Y.: The Overlapping of Cloud Layers in Shortwave Radiation Parameterizations, J. Atmos. Sci., 43, 321–328, https://doi.org/10.1175/1520-0469(1986)043<0321:TOOCLI>2.0.CO;2, 1986. a
Niclòs, R., Valor, E., Caselles, V., Coll, C., and Sánchez, J. M.: In situ angular measurements of thermal infrared sea surface emissivity – Validation of models, Remote Sens. Environ., 94, 83–93, https://doi.org/10.1016/j.rse.2004.09.002, 2005. a
Pavolonis, M. J., Feltz, W. F., Heidinger, A. K., and Gallina, G. M.: A Daytime Complement to the Reverse Absorption Technique for Improved Automated Detection of Volcanic Ash, J. Atmos. Ocean. Tech., 23, 1422–1444, https://doi.org/10.1175/JTECH1926.1, 2006. a, b
Peters, D., Grainger, R., Thomas, G., and McPheat, R.: Laboratory measurements of the complex refractive index of Saharan dust aerosol, Geophys. Res. Abstr., 9, 04023, 1607-7962/gra/EGU2007-A-04023, 2007. a
Picchiani, M., Chini, M., Corradini, S., Merucci, L., Sellitto, P., Del Frate, F., and Stramondo, S.: Volcanic ash detection and retrievals using MODIS data by means of neural networks, Atmos. Meas. Techn., 4, 2619–2631, https://doi.org/10.5194/amt-4-2619-2011, 2011. a
Pierluissi, J. and Peng, G.-S.: New molecular transmission band models for LOWTRAN, Opt. Eng., 24, 541–547, 1985. a
Piontek, D., Bugliaro, L., Kar, J., Schumann, U., Marenco, F., Plu, M., and Voigt, C.: The New Volcanic Ash Satellite Retrieval VACOS Using MSG/SEVIRI and Artificial Neural Networks: 2. Validation, Remote Sens., 13, 3128, https://doi.org/10.3390/rs13163128, 2021a. a, b, c
Piontek, D., Bugliaro, L., Schmidl, M., Zhou, D. K., and Voigt, C.: The New Volcanic Ash Satellite Retrieval VACOS Using MSG/SEVIRI and Artificial Neural Networks: 1. Development, Remote Sens., 13, 3112, https://doi.org/10.3390/rs13163112, 2021b. a, b
Piontek, D., Hornby, A., Voigt, C., Bugliaro, L., and Gasteiger, J.: Determination of complex refractive indices and optical properties of volcanic ashes in the thermal infrared based on generic petrological compositions, J. Volcanol. Geoth. Rese., 411, 107174, https://doi.org/10.1016/j.jvolgeores.2021.107174, 2021c. a, b, c
Piscini, A., Picchiani, M., Chini, M., Corradini, S., Merucci, L., Frate, F. D., and Stramondo, S.: A Neural Network Approach for the Simultaneous Retrieval of Volcanic Ash Parameters and SO2 Using MODIS Data, Atmos. Meas. Tech., 7, 4023–4047, https://doi.org/10.5194/amt-7-4023-2014, 2014. a, b
Plu, M., Scherllin-Pirscher, B., Arnold Arias, D., Baro, R., Bigeard, G., Bugliaro, L., Carvalho, A., El Amraoui, L., Eschbacher, K., Hirtl, M., Maurer, C., Mulder, M. D., Piontek, D., Robertson, L., Rokitansky, C.-H., Zobl, F., and Zopp, R.: An ensemble of state-of-the-art ash dispersion models: towards probabilistic forecasts to increase the resilience of air traffic against volcanic eruptions, Nat. Hazards Earth Syst. Sci., 21, 2973–2992, https://doi.org/10.5194/nhess-21-2973-2021, 2021. a
Prata, A. J.: Infrared radiative transfer calculations for volcanic ash clouds, Geophys. Res. Lett., 16, 1293–1296, https://doi.org/10.1029/GL016i011p01293, 1989a. a, b
Prata, A. J.: Observations of volcanic ash clouds in the 10–12 µmm window using AVHRR/2 data, Int. J. Remote Sens., 10, 751–761, https://doi.org/10.1080/01431168908903916, 1989b. a, b
Prata, A. J. and Prata, A. T.: Eyjafjallajökull volcanic ash concentrations determined using Spin Enhanced Visible and Infrared Imager measurements, J. Geophys. Res.-Atmos., 117, D00U23, https://doi.org/10.1029/2011JD016800, 2012. a
Prata, G. S., Ventress, L. J., Carboni, E., Mather, T. A., Grainger, R. G., and Pyle, D. M.: A New Parameterization of Volcanic Ash Complex Refractive Index Based on NBO/T and SiO2 Content, J. Geophys. Res.-Atmos., 124, 1779–1797, https://doi.org/10.1029/2018JD028679, 2019. a
Reed, B., Peters, D., McPheat, R., Smith, A., and Grainger, R.: Mass extinction spectra and size distribution measurements of quartz and amorphous silica aerosol at 0.33–19 µm compared to modelled extinction using Mie, CDE, and T-matrix theories, J. Quant. Spectrosc. Ra., 199, 52–65, https://doi.org/10.1016/j.jqsrt.2017.05.011, 2017. a, b, c, d
Reed, B., Peters, D., McPheat, R., and Grainger, R.: The complex refractive index of volcanic ash aerosol retrieved from spectral mass extinction, J. Geophys. Res.-Atmos., 123, 1339–1350, https://doi.org/10.1002/2017JD027362, 2018. a, b, c, d, e, f
Ricchiazzi, P. and Gautier, C.: Investigation of the effect of surface heterogeneity and topography on the radiation environment of Palmer Station, Antarctica, with a hybrid 3-D radiative transfer model, J. Geophys. Res., 103, 6161–6178, 1998. a
Riley, C. M., Rose, W. I., and Bluth, G. J. .: Quantitative shape measurements of distal volcanic ash, J. Geophys. Res.-Solid, 108, 2504, https://doi.org/10.1029/2001JB000818, 2003. a
Rumelhart, D. E., Hinton, G. E., and Williams, R. J.: Learning Representations by Back-propagating Errors, Nature, 323, 533–536, https://doi.org/10.1038/323533a0, 1986. a
Schmit, T. J., Gunshor, M. M., Menzel, W. P., Gurka, J. J., Li, J., and Bachmeier, A. S.: Intorducing The Next-Generation Advanced Baseline Imager On GOES-R, B. Am. Meteorol. Soc., 86, 1079–1096, https://doi.org/10.1175/BAMS-86-8-1079, 2005. a
Schumann, U., Weinzierl, B., Reitebuch, O., Schlager, H., Minikin, A., Forster, C., Baumann, R., Sailer, T., Graf, K., Mannstein, H., Voigt, C., Rahm, S., Simmet, R., Scheibe, M., Lichtenstern, M., Stock, P., Rüba, H., Schäuble, D., Tafferner, A., Rautenhaus, M., Gerz, T., Ziereis, H., Krautstrunk, M., Mallaun, C., Gayet, J.-F., Lieke, K., Kandler, K., Ebert, M., Weinbruch, S., Stohl, A., Gasteiger, J., Groß, S., Freudenthaler, V., Wiegner, M., Ansmann, A., Tesche, M., Olafsson, H., and Sturm, K.: Airborne observations of the Eyjafjalla volcano ash cloud over Europe during air space closure in April and May 2010, Atmos. Chem. Phys., 11, 2245–2279, https://doi.org/10.5194/acp-11-2245-2011, 2011. a, b, c
Seemann, S., Borbas, E., Knuteson, R., Huang, H., Stephenson, G. R., and Huang, H.: Development of a Global Infrared Land Surface Emissivity Database for Application to Clear Sky Sounding Retrievals from Multispectral Satellite Radiance Measurements, J. Appl. Meteorol. Clim., 47, 108–123, https://doi.org/10.1175/2007JAMC1590.1, 2008. a
Stamnes, K., Tsay, S.-C., Wiscombe, W., and Jayaweera, K.: Numerically Stable Algorithm for Discrete-Ordinate-Method Radiative Transfer in Multiple Scattering and Emitting Layered Media, Appl. Optics, 27, 2502–2509, https://doi.org/10.1364/AO.27.002502, 1988. a
Strandgren, J., Bugliaro, L., Sehnke, F., and Schröder, L.: Cirrus cloud retrieval with MSG/SEVIRI using artificial neural networks, Atmos. Meas. Tech., 10, 3547–3573, https://doi.org/10.5194/amt-10-3547-2017, 2017. a, b
Thomas, G. E., Bass, S. F., Grainger, R. G., and Lambert, A.: Retrieval of aerosol refractive index from extinction spectra with a damped harmonic-oscillator band model, Appl. Optics, 44, 1332–1341, https://doi.org/10.1364/AO.44.001332, 2005. a
Turnbull, K., Johnson, B., Marenco, F., Haywood, J., Minikin, A., Weinzierl, B., Schlager, H., Schumann, U., Leadbetter, S., and Woolley, A.: A case study of observations of volcanic ash from the Eyjafjallajökull eruption: 1. In situ airborne observations, J. Geophys. Res.-Atmos., 117, D00U12, https://doi.org/10.1029/2011JD016688, 2012. a
Vázquez-Navarro, M., Mayer, B., and Mannstein, H.: A fast method for the retrieval of integrated longwave and shortwave top-of-atmosphere upwelling irradiances from MSG/SEVIRI (RRUMS), Atmo. Meas. Tech., 6, 2627–2640, https://doi.org/10.5194/amt-6-2627-2013, 2013. a, b
Wen, S. and Rose, W. I.: Retrieval of sizes and total masses of particles in volcanic clouds using AVHRR bands 4 and 5, J. Geophys. Res.-Atmos., 99, 5421–5431, https://doi.org/10.1029/93JD03340, 1994. a, b, c
Western, L. M., Watson, M. I., and Francis, P. N.: Uncertainty in two-channel infrared remote sensing retrievals of a well-characterised volcanic ash cloud, Bull. Volcanol., 77, 67, https://doi.org/10.1007/s00445-015-0950-y, 2015. a
Wilson, T. M., Stewart, C., Sword-Daniels, V., Leonard, G. S., Johnston, D. M., Cole, J. W., Wardman, J., Wilson, G., and Barnard, S. T.: Volcanic ash impacts on critical infrastructure, Phys. Chem. Earth Pt. A/B/C, 45–46, 5–23, https://doi.org/10.1016/j.pce.2011.06.006, 2012. a
Winker, D. M., Vaughan, M. A., Omar, A., Hu, Y., Powell, K. A., Liu, Z., Hunt, W. H., and Young, S. A.: Overview of the CALIPSO Mission and CALIOP Data Processing Algorithms, J. Atmos. Ocean. Tech., 26, 2310–2323, https://doi.org/10.1175/2009JTECHA1281.1, 2009. a, b
Winker, D. M., Liu, Z., Omar, A., Tackett, J., and Fairlie, D.: CALIOP observations of the transport of ash from the Eyjafjallajökull volcano in April 2010, J. Geophys. Res.-Atmos., 117, D00U15, https://doi.org/10.1029/2011JD016499, 2012. a
WMO2015: Meeting on the Intercomparison of Satellite-based Volcanic Ash Retrieval Algorithms, Final Report, World Meteorological Organization, Madison, WI, USA, 29 June–2 July 2015, https://web.archive.org/web/20171113102551/http://www.wmo.int/pages/prog/sat/documents/SCOPE-NWC-PP2_VAIntercompWSReport2015.pdf (last access: 5 August 2021), 2015. a
Wyser, K.: The Effective Radius in Ice Clouds, J. Climate, 11, 1793–1802, https://doi.org/10.1175/1520-0442(1998)011<1793:TERIIC>2.0.CO;2, 1998. a
Yang, J., Zhang, Z., Wei, C., Lu, F., and Guo, Q.: Introducing the new generation of Chinese geostationary weather satellites – FengYun 4 (FY-4), B. Am. Meteorol. Soc., 98, 1637–1658, https://doi.org/10.1175/BAMS-D-16-0065.1, 2016. a
Yang, P., Feng, Q., Hong, G., Kattawar, G. W., Wiscombe, W. J., Mishchenko, M. I., Dubovik, O., Laszlo, I., and Sokolik, I. N.: Modeling of the scattering and radiative properties of nonspherical dust-like aerosols, J. Aerosol Sci., 38, 995–1014, https://doi.org/10.1016/j.jaerosci.2007.07.001, 2007. a
Yang, S., Ricchiazzi, P., and Gautier, C.: Modified correlated k-distribution methods for remote sensing applications, J. Quant. Spectrosc. Ra., 64, 585–608, 2000. a
Yu, T., Rose, W. I., and Prata, A. J.: Atmospheric correction for satellite-based volcanic ash mapping and retrievals using “split window” IR data from GOES and AVHRR, J. Geophys. Res.-Atmos., 107, AAC 10-1–AAC 10-19, https://doi.org/10.1029/2001JD000706, 2002. a
Zängl, G., Reinert, D., Rípodas, P., and Baldauf, M.: The ICON (ICOsahedral Non-hydrostatic) modelling framework of DWD and MPI-M: Description of the non-hydrostatic dynamical core, Q. J. Roy. Meteorol. Soc., 141, 563–579, https://doi.org/10.1002/qj.2378, 2015. a
Zhu, W., Zhu, L., Li, J., and Sun, H.: Retrieving Volcanic Ash Top Height through Combined Polar Orbit Active and Geostationary Passive Remote Sensing Data, Remote Sens., 12, 953, https://doi.org/10.3390/rs12060953, 2020. a
- Abstract
- Introduction
- Approach
- Simulated satellite observations
- The VADUGS retrieval algorithm
- Implementation at DWD
- Conclusions
- Appendix A: Atmospheric profiles of clouds
- Appendix B: Refractive index and optical properties of volcanic ash
- Appendix C: Validation metrics
- Data availability
- Author contributions
- Competing interests
- Disclaimer
- Acknowledgements
- Financial support
- Review statement
- References