the Creative Commons Attribution 4.0 License.
the Creative Commons Attribution 4.0 License.
 | 09 Mar 2021
The impact of drought on soil moisture trends across Brazilian biomes
Flavio Lopes Ribeiro
Alma Vázquez-Lule
Ana Paula Cunha
Marcelo Zeri
Rodrigo Vargas
Over the past decade, Brazil has experienced severe droughts across its territory, with important implications for soil moisture dynamics. Soil moisture variability has a direct impact on agriculture, water security and ecosystem services. Nevertheless, there is currently little information on how soil moisture across different biomes responds to drought. In this study, we used satellite soil moisture data from the European Space Agency, from 2009 to 2015, to analyze differences in soil moisture responses to drought for each biome of Brazil: Amazon, Atlantic Forest, Caatinga, Cerrado, Pampa and Pantanal. We found an overall soil moisture decline of −0.5 % yr−1 (p<0.01) at the national level. At the biome level, Caatinga presented the most severe soil moisture decline (−4.4 % yr−1), whereas the Atlantic Forest and Cerrado biomes showed no significant trend. The Amazon biome showed no trend but had a sharp reduction of soil moisture from 2013 to 2015. In contrast, the Pampa and Pantanal biomes presented a positive trend (1.6 % yr−1 and 4.3 % yr−1, respectively). These trends are consistent with vegetation productivity trends across each biome. This information provides insights into drought risk reduction and soil conservation activities to minimize the impact of drought in the most vulnerable biomes. Furthermore, improving our understanding of soil moisture trends during periods of drought is crucial to enhance the national drought early warning system and develop customized strategies for adaptation to climate change in each biome.
- Article
(1712 KB) - Full-text XML
- BibTeX
- EndNote


Drought is a natural and human-induced hazard common to all climate zones in the world (Sheffield and Wood, 2008), generally referred to as a sustained occurrence of below-average water availability due to precipitation deficit and soil moisture decline (Magalhães, 2016). Precipitation deficit is the most studied driver of drought (Mishra and Singh, 2010; Smith, 2013; Villarreal et al., 2016) and has been furthering several drought indicators and models. However, precipitation-based indicators are limited in the assessment of social and environmental responses to the lack of rain and therefore not suitable for evaluating the impacts of drought when used alone. On the other hand, drought indicators based on soil moisture are not only key to understanding the physical mechanisms of drought but also useful for assessing how soil moisture decline can alter vegetation water availability and, consequently, agricultural production and ecosystem services (Smith, 2013; NWS, 2006).
When soil moisture declines below critical water stress thresholds, it reduces biomass production, soil respiration and the overall soil carbon balance (Bot and Benites, 2005; Vargas et al., 2018). Low carbon in soils (due to lower biological activity) reduces its structural integrity and increases the risk of soil erosion, contributing to river silting, ineffective runoff control and loss of soil nutrients (Al-Kaisi and Rattan, 2017). Soil moisture is also crucial for addressing the negative impacts of climate change in water and land resources (Bossio, 2017). Indeed, temporal variability of soil moisture in a given biome is an important variable for the characterization of the local climate (Legates et al., 2011) and a key indicator of changes in the biome's water cycle (Sheffield and Wood, 2008; Rossato et al., 2017).
In this study, we use satellite data from the European Space Agency (ESA) to analyze the impact of drought on soil moisture across all Brazilian biomes: Amazon, Atlantic Forest, Caatinga, Cerrado, Pampa and Pantanal. Considering that each biome has distinct climate, soil and vegetation characteristics, we hypothesize that they would respond differently to drought conditions (e.g., positive, negative or non-significant) and show up relevant information for drought management at national and regional levels.
In Brazil, most of the work on drought management has been focused in the semiarid region, well known for its recurrent problems with droughts and water scarcity (Fig. 1) and which predominates the Caatinga biome. However, droughts have been reported all over Brazil, affecting all other biomes as well. In the period selected for this study (i.e., 2009 to 2015), there was a high number of municipalities declaring emergency and even public calamity due to drought across the country (Cunha et al., 2019a), but the impacts on soil moisture at the national scale and how each biome responds to drought are still unknown.
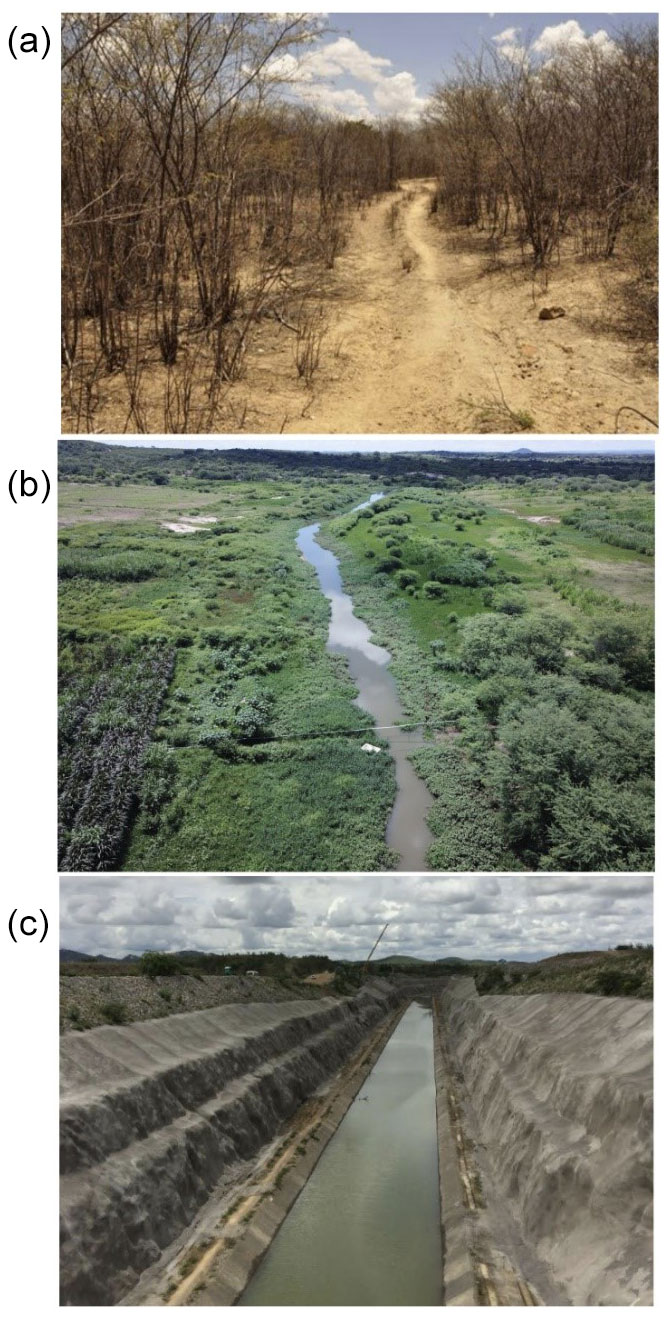
Figure 1A perspective of the Caatinga forest during the dry season at the ground level (a). A perspective of land use in the Caatinga biome during the wet season at the landscape level (b). An example of human intervention affecting the river course that has an impact on water availability across the region (c).
Due to climate change, extreme events such as drought are expected to become more intense and recurrent in some regions of Brazil. Therefore, integrating satellite soil moisture data into early warning systems could contribute to more efficient drought risk management and promote data-driven climate change adaptation.
Nevertheless, studies on soil moisture variation have been conducted at a stand scale due to challenges for measurements across spatial and temporal scales (Legates et al., 2011; Novick et al., 2016). As a consequence, the lack of soil moisture information could lead to inaccurate assessment of drought conditions, underestimation of drought impacts, and incomplete resilience and adaptation plans. As droughts become more frequent and intense, it is important to enable monitoring of soil moisture trends and communicate the results at different levels (e.g., municipal, state, national and regional) and across different perspectives (e.g., environmental, social and economic). At present, the most reliable source of soil moisture information at large scales (i.e., global-to-continental scales) is satellite remote sensing (i.e., https://smap.jpl.nasa.gov/, last access: 14 January 2021; http://www.esa-soilmoisture-cci.org/, last access: 15 January 2021), which provides soil moisture estimates for the first 0–5 cm of soil depth (Liu et al., 2011). Even though the first layer of soil is expected to be very dynamic because of its interaction with the atmosphere and because deeper layers still represent an important water storage, especially in the Amazon and Cerrado biomes, soil moisture in the first 5 cm is still a good predictor of land and atmosphere interactions. Analyzing a shallow soil layer can provide key information about the detection of soil aridity conditions that are directly related to the loss of soil biodiversity and, therefore, to soil productivity. Thus, soil moisture at the surface is directly affected by drought conditions and could be also used as an indicator (i.e., proxy) of the water contained at deeper layers. Since we cannot measure in situ soil moisture at high spatial resolution due to logistical constraints (i.e., because it is expensive or time consuming), we propose the use of multiple satellite remote sensing sensors (e.g., from ESA or NASA) as an alternative to obtain drought-relevant information on soil moisture at the national scale. The study period (2009–2015) was marked by successive droughts across Brazil, registered and confirmed by different monitoring instruments such as the Integrated Drought Index (IDI), which combines the Standardized Precipitation Index (SPI) and the Vegetation Health Index (VHI) (Cunha et al., 2019a, b), and municipal emergency declarations all over the country.
The purpose of this study is to show the advantages and disadvantages of integrating satellite soil moisture observations into drought monitoring across Brazil on a biome basis. We show the differential impact of drought on the soil moisture of different biomes at a national scale (using Brazil as a case study).
The main limitations are that satellite measurements of soil moisture provide indirect estimates of soil moisture across large areas of around >25 km grids and that these estimates are representative only in the topsoil (e.g., 0–5 cm) and unfortunately do not provide a direct metric of soil water storage. While soil moisture at the surface is a key indicator of soil and atmosphere interactions, topsoil moisture does not account entirely for the water used by plants to grow. The capacity of plants to grow can be measured also with satellite information in the form of primary productivity estimates (Li and Xiao, 2019). Therefore, we also explore the correspondence between satellite soil moisture and primary productivity trends for each biome in Brazil. Both soil moisture and vegetation productivity are ecosystem variables directly affected by drought conditions. Understanding how soil moisture and vegetation productivity in each biome is affected by drought conditions from different perspectives (in our case superficial soil moisture) is crucial to assessing their resilience. It is also important to provide evidence-based orientations to drought mitigation and soil conservation plans.
2.1 Study area
Brazil is the largest country in Latin America, with a total area of 8 456 510 km2, and is located between 05∘10′ N to 33∘44′ S (IBGE, 2017). The continental dimension of the country implies a complex spatial heterogeneity of environmental conditions resulting in six main biomes: Amazon, Atlantic Forest, Caatinga, Cerrado, Pampa and Pantanal (Fig. 3a).
The Amazon biome is mainly characterized by rainforest areas (Overbeck et al., 2015). It represents 49.5 % of Brazil's total area, or 4 196 943 km2 (IBGE, 2019). It has an equatorial climate, with temperatures between 22 and 28 ∘C, and has torrential rains distributed throughout the year. The geomorphology of the Amazon biome is quite diverse, presenting plateaus, plains and depressions. Soils are generally clayey and iron-rich and have a high soil organic carbon content. The Amazon biome is well known for its biodiversity and its large number of rivers and waterbodies, which account for the world's greatest surface green water reserves (IBGE, 2004).
The Atlantic Forest biome covers 13 % of the total area of Brazil (1 110 182 km2). It comprises an environmental heterogeneity that incorporates high elevations, valleys and plains. The Atlantic rainforest occupies the whole continental Atlantic coast of Brazil. This biome has a subtropical climate in the south and a tropical climate in central and northeastern portions. The Atlantic rainforest is characterized by heavy rainfall influenced by its proximity to the ocean and winds that blow inward over the continent (IBGE, 2004). Although it is just a small fraction of the size of the Amazon rainforest, the Atlantic Forest biome still harbors a range of biological diversity comparable to that of the Amazon biome (The Nature Conservancy, 2015), with high soil carbon reserves (Guevara et al., 2018). The Atlantic Forest biome is recognized as the most degraded biome of Brazil with only 12 % of the original biome preserved (SECOM, 2012).
The Caatinga biome is the driest of Brazil and comprises an area of 844 453 km2 stretching over nine federal states and covering nearly 10 % of the total area of Brazil (IBGE, 2019). A semiarid climate is predominant across this biome (BSh type) with an average annual rainfall below 800 mm (Alvares et al., 2013), but high temperatures influence high potential evapotranspiration rates that exceed 2500 mm yr−1 (Campos, 2006). Overall, the Caatinga biome is characterized by reduced water availability and a very limited storage capacity of rivers, which are mainly intermittent, with just a few exceptions that are perennial through streamflow regulating reservoirs during the dry season (CENAD, 2014). Caatinga soils are generally shallow (0–50 cm), with a bedrock that is commonly exposed to the surface, limiting water infiltration processes and the recharge of local aquifers (Cirilo, 2008).
The Cerrado biome is the second largest of Brazil and is characterized by large savannahs (Overbeck et al., 2015) covering 2 036 448 km2 and representing 23.3 % of the country (IBGE, 2019). It extends from the central south of Brazil to the northern coastal strip, interposing between the Amazon, Pantanal, Atlantic Forest and Caatinga biomes (IBGE, 2004). The dominant climate in the Cerrado biome is warm tropical subhumid, with only two distinct seasons, dry winters and wet summers with torrential rains (Overbeck et al., 2015). The annual precipitation in this region varies between 600 and 2200 mm, where the bordering areas with the Caatinga biome are the driest and the bordering areas with the Amazon rainforest are the wettest. Soils are diverse and include a variety of dystrophic (low inherent fertility and/or strongly weathered profile), acidic and aluminum-rich conditions. Currently, the Cerrado biome hosts the largest rural expansion in Brazil, resulting in environmental degradation, biodiversity loss, and soil erosion and limited water availability. It is classified as the most endangered savannah on the planet and one of the 34 global hotspots (Ioris et al., 2014).
The Pampa biome is located at the extreme south of Brazil and covers 2.1 % of Brazil's total area (176 496 km2). It is mainly characterized by grasslands and shrublands (Overbeck et al., 2015). The region has a wet subtropical climate, characterized by a rainy climate throughout the whole year, with hot summers and cold winters, where temperatures fall below freezing (IBGE, 2004). The Pampa biome comprises an environmental set of different lithology types and productive soils (e.g., carbon-rich), mainly under flat and smooth undulating terrain surfaces.
The Pantanal biome has the smallest territorial extension of Brazil, covering 1.8 % (150.355 km2) of the country's total area (IBGE, 2004). It is located at the left margin of the Paraguay River and is shared by Brazil, Bolivia and Paraguay.
The Pantanal biome is by a vast extent of poorly drained lowlands and experiences annual flooding from summer to fall months (January–May) (Assine and Soares, 2004). The climate of the Pantanal biome is hot and humid during the summer and cold and dry in winter (Ioris et al., 2014). Precipitation varies from 1000 to 1400 mm yr−1, and rains are predominant from November to April. Average annual temperature is 32 ∘C, but the dry season (May to October) has an average temperature of 21 ∘C, and it is not uncommon to have >100 d without rain (Ioris et al., 2014). In the last 2 decades, temperature in the Pantanal has consistently risen, and events more humid than normal and dryer than normal have both increased (Marengo et al., 2010).
2.2 Environmental variability of Brazilian biomes
We used 1×1 km environmental gridded data to characterize the environment variability of the biomes. Data were provided by http://worldgrids.org/ (last access: 13 August 208), an initiative of ISRIC – World Soil Information (International Soil Reference and Information Centre). This dataset compiled information from: (1) digital terrain analysis to represent topographic gradients, (2) gridded climatology products (e.g., precipitation and temperature), (3) remote sensing imagery to represent land cover and vegetation spatial variability, and (4) legacy soil or rock type maps. We used 110 layers derived from this dataset. A list of all available information contained in the worldgrids.org project is available in Reuter and Hengl (2012). We used multivariate statistics in the form of principal component analysis (PCA) to linearly decompose the worldgrids.org dataset and identify relationships among the major environmental characteristics of Brazilian biomes. PCA is an analysis where a group of potentially correlated variables are decomposed in orthogonal space and therefore uncorrelated principal components. PCA analysis is useful to reduce data dimensionality to avoid the potential effects of statistical redundancy (multicollinearity) in further interpretations. Here, we use the PCA as an exploratory technique to visualize, characterize and interpret the environmental variability of Brazil's biome and assume that environmental differences in the biomes could support the hypothesis of different soil moisture responses to drought.
2.3 Municipal emergency declarations due to drought across Brazil
Municipal emergency declarations (MEDs) are administrative tools to inform the federal government that the magnitude of a disaster has surpassed local public capacities to respond and manage the crisis. The recognition of MEDs by the federal government is based on field visits (when possible) and technical analysis of social, economic and climatological data that can support the petition. In the case of drought, data analysis is generally based on, but not limited to, private agricultural losses, level of local reservoirs and precipitation data combined. Once the federal government recognizes that there is indeed a disaster, it establishes a legal situation where federal funds can be used to assist the affected population and recover essential services disrupted by the disaster (National Secretary of Civil Defense and Protection of Brazil, 2017).
To determine drought distribution across the six Brazilian biomes, we retrieved official MEDs due to drought in Brazil from 2009 to 2015. This information is public and can be accessed on the website of the Ministry of National Integration of Brazil. First, we downloaded the historical series of MEDs in Brazil from 2009 to 2015. Then, we isolated the municipalities who declared emergency or public calamity due to drought from all other disasters. The last step was to cross these data with the boundaries of the six Brazilian biomes and discover the intensity and distribution of drought in each biome during the study period.
2.4 Soil moisture and primary productivity trends across Brazil
To analyze soil moisture trends during a period of successive droughts (2009–2015) across Brazilian biomes, we acquired remotely sensed soil moisture information from the European Space Agency (Liu et al., 2011). This soil moisture product has a daily temporal coverage from 1978 to 2016 and a spatial resolution of 0.25∘ ( km grids). To represent vegetation primary productivity we use estimates from the OCO-2-based (Orbiting Carbon Observatory 2) SIF product GOSIF (global Orbiting Carbon Observatory 2 Solar-Induced Fluorescence dataset; OCO-2 SIF) and linear relationships between SIF (solar-induced chlorophyll fluorescence) and GPP (gross primary production) used by Li and Xiao (2019) to map GPP globally at a 0.05∘ spatial resolution and 8 d time step. We calculated monthly averages from soil moisture and primary vegetation datasets for further statistical analysis using only information between 2009 and 2015. All available information was harmonized into a geographical information system using the same projection system and spatial integrity.
2.5 Data analysis
We based our statistical analysis on a regression matrix containing 10 000 representative random spatial locations (e.g., latitude and longitude) across the biomes of Brazil (Fig. 3b), which were selected using standard resampling techniques (i.e., bootstrapping). Over 30 % of the area of every biome is represented in the random selection. We randomize our statistical sampling with the ultimate goal of maximizing the accuracy of the results. We used a representative sample for improving the visualization of point clouds and a better understanding of differences on the five biomes in the statistical multivariate space. Finally, we extracted to these random points the environmental data and the values of the available satellite soil moisture and primary productivity time series.
To detect trends on satellite soil moisture and primary productivity time series during the study period, we used median-based linear models calculated for each point with available satellite data. These non-parametric analyzes are known as Theil–Sen regressions (Sen, 1968; Theil, 1992) with repeated medians (Siegel, 1982). This method uses a robust estimator for each point in time, where the slopes between it and the other points are calculated (resulting n−1 slopes), and then the median and the significance of the trend are reported.
The satellite soil moisture source has intrinsic quality limitations across areas where vegetation has more water than soil (McColl et al., 2017), including areas across the lower Amazon watershed, the Pantanal or Pampa biomes. For these areas we used the sparse points with available satellite soil moisture information and generated predictions of soil moisture trends based on geostatistical analyses, such as variogram fitting and ordinary Kriging modeling. Ordinary Kriging modeling assumes that the target variable (soil moisture trends) is controlled by a random field (the main reason why we base our analysis on a random-sampling strategy) that shows a quantifiable level of spatial structure and autocorrelation (Hiemstra et al., 2009). We performed an automatic variogram analysis to assess the spatial structure and autocorrelation of satellite soil moisture records. For the variogram analysis we computed the relationships between the distance of randomly distributed soil moisture observations and the accumulated variance of their respective values. We used the aforementioned relationships to predict the satellite soil moisture trend in areas where no data are available and also provided a spatially explicit measure of error following a geostatistical framework (Hiemstra et al., 2009; Llamas et al., 2020). In contrast, the primary productivity dataset used here has complete coverage across Brazil. We show both the interpolated maps of soil moisture trends and the trend map of the primary productivity of vegetation.
3.1 Drought in Brazil from 2009 to 2015
This analysis of municipal emergency declarations (MEDs) confirmed that the period from 2009 to 2015 was, indeed, marked by successive droughts countrywide (Fig. 2). During this period, Brazil had a total of 12 508 declarations of emergency or public calamity due to drought all over its territory (Ministry of National Integration of Brazil, 2018), which directly affected 33 million people and caused economic losses of around USD 6.5 billion (EM-DAT, 2018).
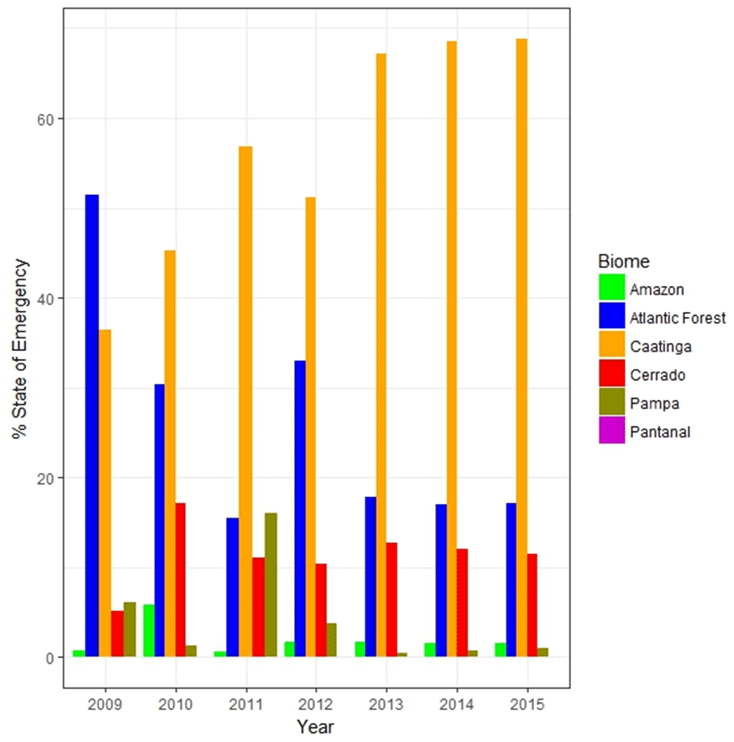
Figure 2Percentage of municipalities declaring emergency or public calamity due to drought in Brazil from 2009 to 2015.
Proportionally, the Caatinga biome had the most MEDs per municipality, followed by the Atlantic Forest, Cerrado, Pampa and Amazon biomes, respectively (Fig. 2). The only biome with no MEDs due to drought during this period is the Pantanal biome, which is a natural wetland that covers only 1.8 % of the national territory (Overbeck et al., 2015).
When considering climatological data from the Integrated Drought Index (IDI), which combines the Standardized Precipitation Index (SPI) and the Vegetation Health Index (VHI), Cunha et al. (2019a, b) discovered that since 1962, when drought events started to be recorded in Brazil, only between 2012 and 2014 droughts occurred concurrently in the six biomes of the country. The IDI also showed that the hydrological year of 2011/12 (October 2011 to September 2012) was the driest of the historical series, except in the southern region, where the Pampa biome is located. During the period of study (2009–2015), the most severe drought events occurred in the northeastern region (where the Caatinga biome predominates), in the central-western region (where the Cerrado biome predominates) and in the southeastern region (where there is a mix of the Cerrado and Atlantic Forest biomes). Even though the climatological data from the IDI show some inconsistencies with the MEDs per biome, in general terms, it reinforces that the study period was marked by simultaneous droughts across all biomes of Brazil.
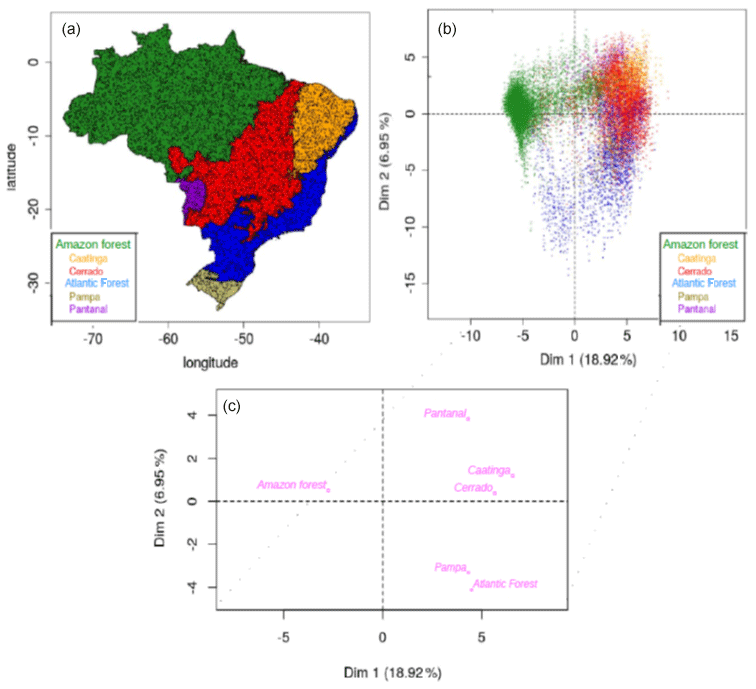
Figure 3(a) The six biomes of Brazil. (b) Plane of the first and second PCAs showing the orthogonal and environmental variability of Brazil's biomes and (c) clustering results showing the main values of each biome dataset and their proximity across the PC1 and PC2.
3.2 Environmental gridded information of Brazilian biomes
The environmental characterization of Brazilian biomes showed a clear differentiation of three major groups (Fig. 3a and b). These results support the expectation that drought would have a differential impact on soil moisture dynamics in each of the six biomes (see Sect. 3.3). This expectation is supported because each biome shows differences in the spatial configuration of environmental soil moisture drivers, as revealed by the PCA analysis (Fig. 3b) as described below.
From the 110 environmental layers of information we used to represent the major environmental conditions across Brazil (these covariates are described in previous work, Guevara et al., 2018), at least 50 principal components were needed to capture > 80 % of total variance. The first and second component explained >25 % of variability (Fig. 3b), and the variables that represented most of the variance in the first and second components were the digital elevation model (r=0.5) and the topographic wetness index (r=0.31), respectively. These two variables are directly related to the spatial variability of soil moisture dynamics as seen in other regional studies (Guevara and Vargas 2019). Across these principal components (i.e., PC1 and PC2; PCs), we found a clear separation of three major groups of data in the statistical space (Fig. 3c). The Amazon biome forms the largest group of values, followed by another group composed mainly of the Atlantic Forest and Pampa biomes. The Caatinga and Cerrado biomes form a third larger group, and the remaining Pantanal biome shows a close but independent variability (Fig. 3c). These groups are located in different quadrants of the plane between the first two PCs (Fig. 3c). Thus, these differences could influence soil moisture response in these major groups at the biome level.
3.3 Drought assessment: soil moisture trends across Brazilian biomes
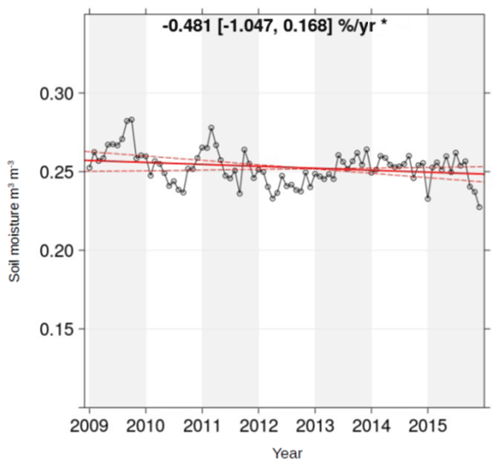
Our analysis of satellite soil moisture at the national level showed a soil moisture decline of −0.5 % yr−1 (p<0.1) in Brazil from 2009 to 2015 (Fig. 4).
When considering variations of soil moisture per biome, our data suggest that the largest soil moisture decline in Brazil was found in the Caatinga biome with a persistent negative trend – −4.4 % in soil moisture per year (p<0.001) – from 2009 to 2015 (Fig. 5a). In contrast, the Amazon, Cerrado and Atlantic Forest biomes showed no significant trend on soil moisture. The Pampa and Pantanal biomes showed a significant increase in soil moisture of 1.6 % yr−1 and 4.3 % yr−1 (p<0.001), respectively, during the same period (Fig. 5e and f). Thus, the combination of environmental variables and satellite soil moisture records was able to identify drought-dominated areas such as the Caatinga and Cerrado biomes from water-surplus-dominated areas, such as the Pantanal and Pampa biomes. These results are also useful to prevent agricultural risk from water failure (decline or surplus) and monitor important ecosystem services of large and more inaccessible areas such as the Amazon forest and the Cerrado biome (Fig. 3).
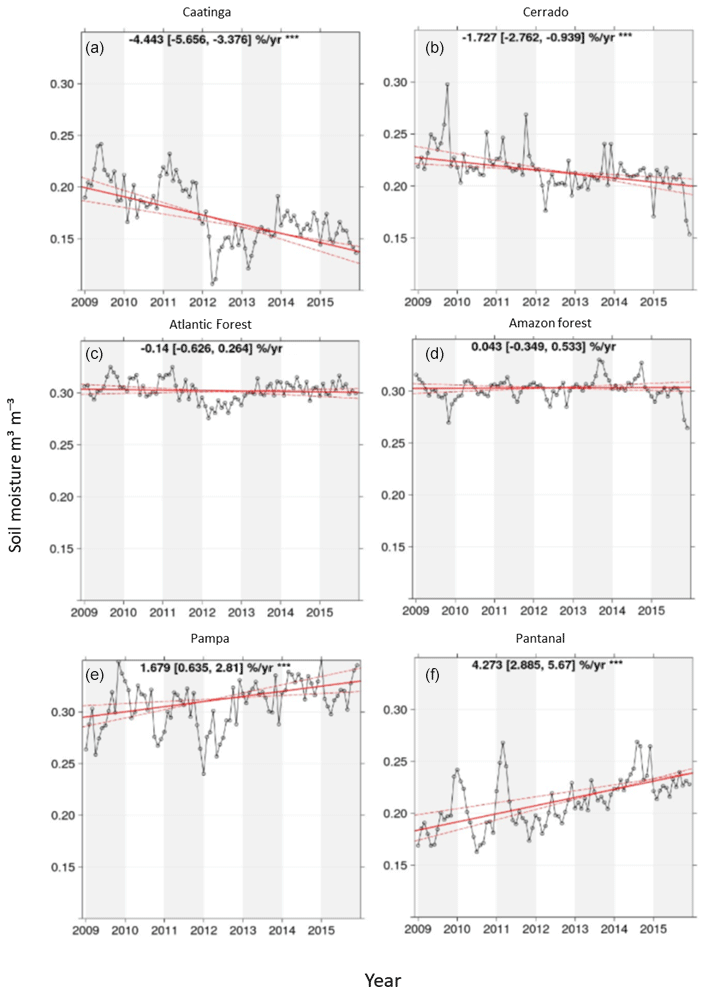
Figure 5Soil moisture trends across Brazil. (a) Caatinga (n=921), (b) Cerrado (n=2410), (c) Atlantic Forest (n=1394), (d) Amazon (n=4819), (e) Pampa (n=231) and (f) Pantanal (n=179). The values in every graph show the slope percentages of changes. Red solid lines show the mean trend, and red dashed lines show the standard deviation trend. (p<0.01).
A closer analysis of satellite soil moisture trend in the Caatinga biome shows that this biome did not fully recover from an accentuated soil moisture decrease in 2012 (Fig. 5a). After 2012, there was a slight recovery of soil moisture in 2013, yet a negative trend remains in the following years, most likely because the below-average annual precipitation from 2013 to 2015 (Cunha et al., 2019a) coupled with human activities commonly found within the boundaries of this biome such as deforestation, unsustainable irrigation and water abstraction (Medeiros, 2012; Travassos and De Souza, 2014). As highlighted by Cunha et al. (2015) intense drought events can reduce the vegetation resiliency, rendering plants more vulnerable to a recurring disturbance. Furthermore, the vegetation can be durably affected by a drought if the drought is preceded by another dry year that could substantially reduce gross primary productivity and other ecosystem processes (Vargas, 2012).
Consistent with previous studies (Zeri et al., 2018) precipitation data indicate that the years 2011, 2012, 2014 and 2015 have been drier as compared to the previous decades. Marengo et al. (2017) also confirmed that, from 2012 to 2015, drought affected hundreds of cities and rural areas with devastating impacts on the agricultural production and water supply. Regarding human activities, data from the National Institute for Space Research (INPE, 2018) reveals that 45 % of the Caatinga biome is degraded and that 7.2 % of its soil is already exposed. In addition, the Caatinga has been exposed to continuous land cover changes, and less than 1 % of the region is a strictly protected area (Leal et al., 2005; Kolker, 2013). Thus, our results (a) provide insights into identifying geographical areas that could be preserved due to their capacity for providing blue and green water and (b) could be part of a monitoring system for optimizing the limited water inputs and supply in this semiarid ecosystem (i.e., for agricultural planning).
Persistent and prolonged soil moisture decline could also negatively affect the Caatinga biome's biodiversity, one of the world's plant biodiversity centers (Leal et al., 2005). The vegetation and soils of the Caatinga biome are exposed to 8–10 dry months every year (Santos et al., 2014), and more than 90 % of the Caatinga biome is non-forest vegetation. Just ∼20 % of the biome has native vegetation, which is better adapted to support drought events and store higher amounts of water (Santos et al., 2014; Overbeck et al., 2015). Tomasella et al. (2018), using NDVI (Normalized Difference Vegetation Index) values for high density vegetation and bare soil, showed that recurrent droughts are accelerating the degradation and desertification processes in the Caatinga biome.
The combination of these regional factors together with the effect of teleconnections such as the ENSO (El Niño–Southern Oscillation) and other land atmosphere interactions (Kouadio et al., 2012) make the Caatinga biome in Brazil the most vulnerable biome to the recurrent droughts and consequently, prolonged soil moisture deficit condition (Marengo et al., 2017).
Therefore, we highlight the need to include urgent actions such as reforestation and efficient use of underground water into drought mitigation plans for this biome to reduce future soil moisture decline. It is noteworthily that this biome is already presenting agricultural deficits and desertification areas due to natural and anthropogenic phenomena (Nascimento and Alves, 2008; Sheffield and Wood, 2008; Medeiros, 2012; Travassos and De Souza, 2014). As an example, while studying the desertification process in part of the Caatinga biome, D'Souza et al. (2008) found high levels of social, economic and technological vulnerabilities which could be directly associated with removal of the natural vegetation covering and forest fires for subsistence agriculture. These human-induced changes on soil moisture in the Caatinga biome are also related to the occurrence of soil erosion and local desertification processes that influence low agricultural productivity due to diminishing soil moisture and quality of the soil (Nascimento and Alves, 2008).
The Atlantic Forest biome did not show significant positive or negative trends in soil moisture variation during the studied period. It registered, however, the greatest ups and downs in soil moisture from 2009 to 2015, with high peaks (2009, 2011 and 2013) followed by abrupt declines in a relatively short time period. After the most intense period of soil moisture decline in the Atlantic Forest biome (2009–2012), this biome quickly bounced back to previous levels of soil moisture, showing capacity to recover from intense soil moisture losses in less than 12 months.
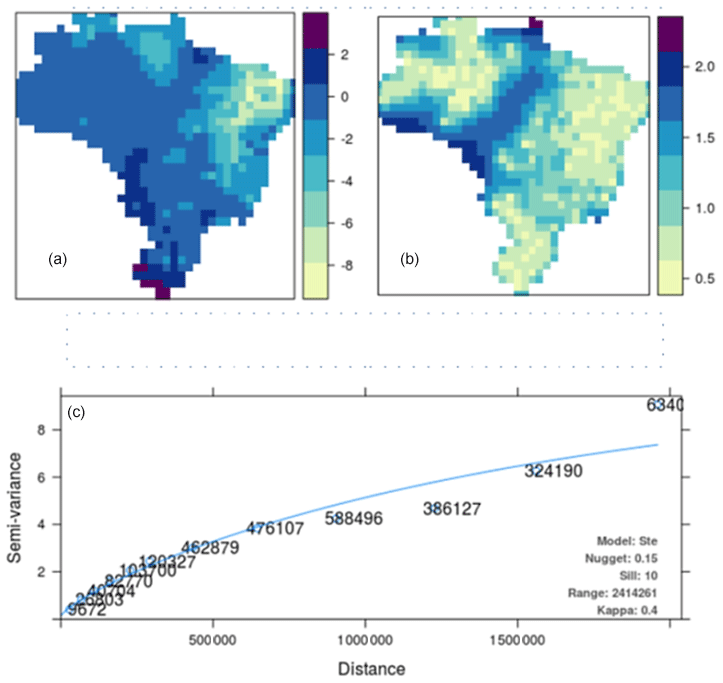
Figure 6Geostatistical analysis (ordinary Kriging modeling with automatic variogram fitting) of satellite soil moisture across Brazil from 2009 to 2015. (a) The trend prediction of soil moisture for 2009–2015. (b) The Kriging variance (error map). (c) Variogram fitting parameters and spatial autocorrelation model (blue line) supporting the soil moisture prediction. The numbers around the blue line are the pairs of points available for the interpolation at a specific distance (x axis).
The Amazon biome showed no significant trend of satellite soil moisture data during the analyzed period (Fig. 4d), probably due to data limitations (i.e., data gaps) associated with a lack of satellite-derived information (see “Methodology”). Field-based evidence collected by Anderson et al. (2018) showed a wide range of impacts of drought on the Amazon forest structure and functioning (e.g., widespread tree mortality and increased susceptibility to wildfires) in 2016 after the 2015 drought, which affected approximately 46 % of the Brazilian Amazon biome. However, considering the size and differences in topography in the Amazon biome, the eastern and western areas of the Amazon rainforest may respond differently to drought due to differences in climate conditions and therefore, different sensibility to soil moisture decline. The western portion of the Amazon biome shows higher soil moisture values (and potentially positive soil moisture trends) than the eastern region (Fig. 6a and b). This result is consistent with previous findings describing differences in drought response from eastern and western portions of this biome (Duffy et al., 2015), suggesting that soil moisture conservation plans and drought mitigation strategies in the Amazon biome should consider the heterogeneity of the region and the different soil moisture feedback from the eastern and western portions of this biome.
The Pampa biome showed a positive trend of ∼1.6 % yr−1 (p<0.001) during the analyzed period (Fig. 5e) but with three distinct periods. The year 2009 registered a recovery period of a positive soil moisture trend followed by a steady soil moisture decline until its lowest point in the beginning of 2012. Then, this biome started a consistent recovery process surpassing previous values of the soil moisture trend registered before 2013, showing great capacity to recover soil moisture after periods of drought. Cunha et al. (2019a) showed that in 2012 most of the southern region of Brazil presented drought conditions over an extensive area, with the highest intensity recorded in August 2012. This intense drought affected the water supply in the rural properties and the agricultural and livestock production.
Even though the Pampa biome has more than 60 % of its biome degraded, especially for cattle raising (Santos and Silva, 2012), our data show that it is gradually increasing soil moisture even during a period of successive droughts across Brazil. Literature on soil moisture of the Pampa biome characterizes this biome as highly vulnerable to water and wind erosion (Roesch et al., 2009), making it susceptible to soil moisture decline (Duffy et al., 2015). On the other hand, extended flat landscapes, like the Pampa biome, show low lateral water transport as a result of low surface runoff and slow groundwater fluxes, making this biome more suitable to accumulating surface water for long periods of time (Kuppel et al., 2015).
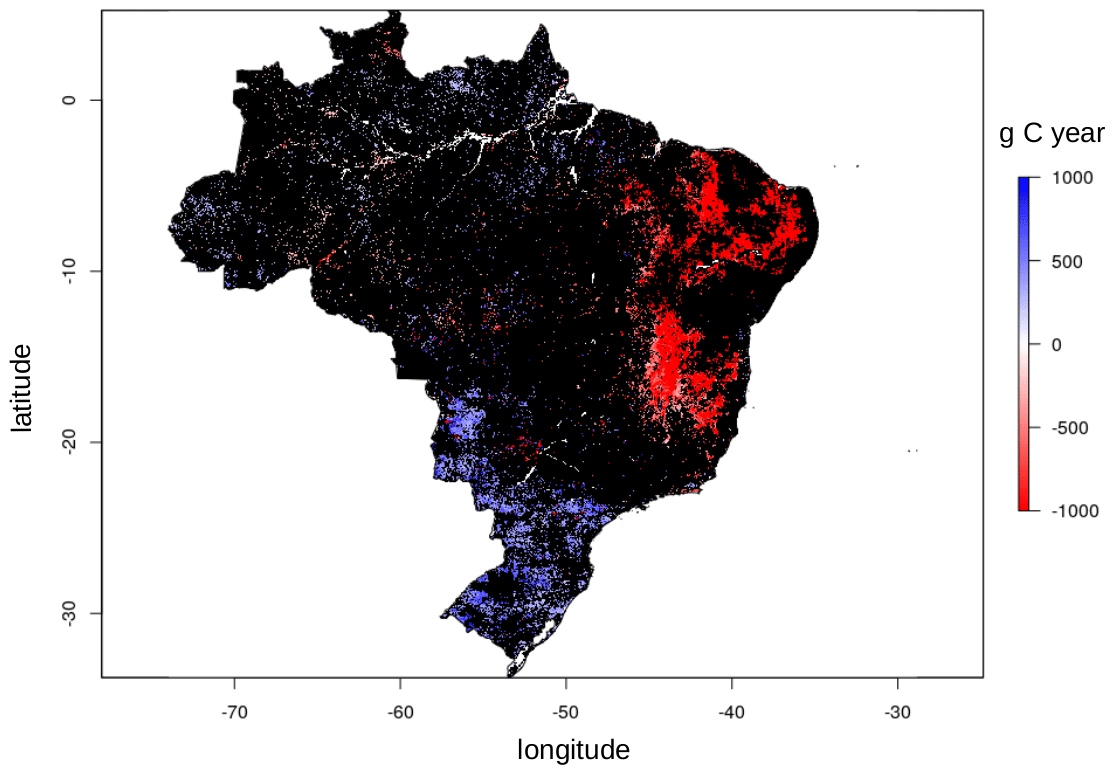
Figure 7Trends of primary productivity of vegetation based on the GOSIF dataset between 2009 and 2015. Areas in black are non-significant.
The Pantanal biome also showed a positive soil moisture trend of 4.3 % yr−1 (p<0.001) from 2009 to 2015, the highest positive trend among all biomes. From 2009 to 2011, there were two extreme events characterized by sudden soil moisture increases immediately followed by abrupt soil moisture declines. After these two extreme events, a more stable and consistent positive soil moisture trend was registered from 2011 to 2014. Even though there was a subtle decline in the soil moisture by the end of 2014, this biome kept an overall positive trend during 2015.
The Pantanal and Pampa biomes are both subhumid aeolian plains, which make them more susceptible to experiencing flood events covering a significant fraction of the landscape for months or even years (Kuppel et al., 2015). Even though our data seem congruent with inundations registered in the Pantanal biome in the beginning of 2011, when the soil moisture trend reached its highest point for the Pantanal biome during the studied period, it did not capture a reduction of 81 % of the total flooded area for the Pantanal biome in 2012, when there was a reduction of 18 % in annual precipitation (Moraes et al., 2013). In contrast, our data showed a consistent positive trend throughout 2012, even though all months of the wet season in 2012 had a decrease in precipitation ranging from −28.6 % in the beginning to −12.1 % in the end of the wet season (Moraes et al., 2013). These results suggest that, although the analyzed period is characterized by a sequence of dry spells across Brazil (Marengo et al, 2017), some areas such as the Pantanal region were able to accumulate soil moisture during that time.
Detecting an increase in soil moisture does not mean that these biomes should receive less attention to drought and soil conservation plans. From 2009 to 2015, the Pampa biome always had a representative municipality declaring emergency due to drought and has constantly reported economic losses in the agricultural sector. The Pantanal biome, during the same period, was not directly impacted by drought at the municipal level, but the highly positive soil moisture trend deserves further study to understand how it impacts the local ecosystem, as well as agricultural practices and cattle raising with the ultimate goal of improving food security across Brazil.
Our results support our main hypothesis as we have found evidence that each of the six Brazilian biomes registered different soil moisture feedbacks to drought during the analyzed period (2009–2015). In practical terms, it means that drought response and mitigation plans, as well as soil conservation strategies, should consider both differences among and within each biome of Brazil and concentrate efforts and resources on preserving or recovering the regions with greater susceptibility to lose soil moisture during periods of drought. Confirming the value of satellite soil moisture signals monitoring drought-related patterns, we observe the similar trends of soil moisture and the primary productivity of vegetation across Brazil.
3.4 Primary productivity trends across Brazil
We confirm the consistency of our results comparing trends of satellite soil moisture with trends calculated using the primary productivity (or GPP) datasets. Our results show that all biomes experienced positive and negative trends of vegetation productivity during the analyzed period of time (Fig. 7). We observe that the major surface of negative trends of primary productivity of vegetation is across the Caatinga biome and its intersection with both the Cerrado and Atlantic Forest biomes. The Pampa and Pantanal biomes are those with higher surfaces of positive primary productivity trends (Fig. 7).
These results are consistent with the soil moisture trends described for each biome (Fig. 5). The Caatinga biome had the highest soil moisture decline and highest primary productivity decline. The Cerrado and Atlantic Forest biomes also experienced decline in soil moisture and primary productivity. In contrast, the Pampa and Pantanal biomes experienced an increase in soil moisture levels and increase in primary productivity rates (Fig. 8). Changes in primary productivity across the Amazon forest were less evident or not significant. Our results support the use of satellite soil moisture and primary productivity trends as accurate indicators of drought conditions across Brazilian biomes.
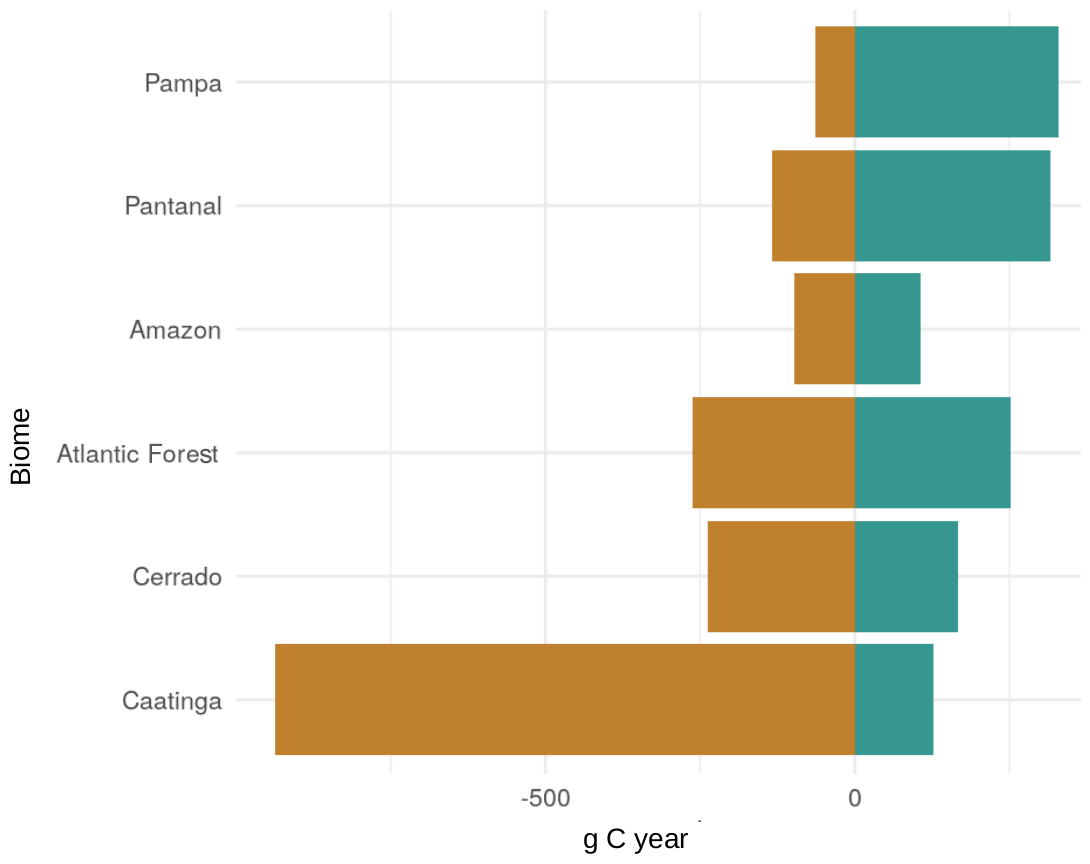
Figure 8Primary productivity trends across Brazilian biomes based on the GOSIF GPP product across the analyzed period of time (2009–2015).
The results of this research reveal an important environmental vulnerability to drought across Brazil. From 2009 to 2015, there was a national decline of soil moisture with a rate of 0.5 % yr−1. Among all six biomes, the Caatinga biome presented the most severe soil moisture decline (−4.4 % yr−1), suggesting a need for immediate local soil and water conservation activities. The Atlantic Forest and Cerrado biomes showed no significant soil moisture trends but should be closely monitored for their importance to national food and water security and environmental balance. The Amazon biome also showed no soil moisture trend but had a sharp reduction of soil moisture from 2013 to 2015. It is noteworthy that soil moisture from eastern and western portions of the Amazon biome may respond differently to drought. The western portion of the Amazon biome shows potentially more positive soil moisture trends than the eastern region. In contrast, the Pampa and Pantanal biomes presented a positive soil moisture trend (1.6 % yr−1 and 4.3 % yr−1, respectively), which should also be constantly monitored considering the susceptibility of these biomes to floods.
These results are consistent with primary productivity trends (Fig. 8), supporting the effectiveness of satellite soil moisture data to monitor drought impacts at a biome level. This study provides insights into the potential benefits of integrating satellite soil moisture data into drought monitoring and early warning systems and soil conservation plans at national and local levels.
All code is available at https://doi.org/10.5281/zenodo.4587957 (Guevara et al., 2021).
FLR and MG conceived the presented idea. FLR, MG, AVL and RV developed the theory and wrote the first version of the paper. MG performed the data analysis. APC and MZ verified the analytical methods and supervised the findings of this work. All authors discussed the results and contributed to the final version of the paper.
The authors declare that they have no conflict of interest.
Flavio Lopes Ribeiro acknowledges individual scholarship support from CNPq, the Science without Borders program of the Brazilian federal government. Mario Guevara and Alma Vázquez-Lule acknowledge individual fellowship support from CONACyT. Rodrigo Vargas acknowledges support from the National Science Foundation (CIF21 DIBBs; grant no. 1724843).
This paper was edited by Paolo Tarolli and reviewed by two anonymous referees.
Al-Kaisi, M. and Rattan, L.: Conservation Agriculture Systems to Mitigate Climate Variability Effects on Soil Health, in: Soil Health and Intensification of Agroecosytems, edited by: Al-Kaisi, M. and Lowery, B., Academic Press, 79–107, https://doi.org/10.1016/B978-0-12-805317-1.00004-X, 2017.
Alvares, C. A., Stape, J. L., Sentelhas, P. C., Gonçalves de Moraes, J. L., and Sparovek, G.: Köppen's climate classification map for Brazil, Meteorol. Z., 22, 711–728, https://doi.org/10.1127/0941-2948/2013/0507, 2013.
Anderson, L. O., Ribeiro Neto, G., Cunha, A. P., Fonseca, M. G., Mendes de Moura, Y., Dalagnol, R., Wagner, F. H., and Cruz de Aragão, L. E.: Vulnerability of Amazonian forests to repeated droughts, P. T. Roy. Soc. B, 373, 20170411, https://doi.org/10.1098/rstb.2017.0411, 2018.
Assine, M. L. and Soares, P. C.: Quaternary of the Pantanal, west-central Brazil, Quatern. Int., 114, 23–34, 2004.
Bossio, D.: Soil Management – A Foundational Strategy for Conservation, The Nature Conservancy, available at: https://global.nature.org/content/soil-management-a-foundational-strategy-for-conservation?src=social.nature.facebook.main (last access: 22 May 2020), 2017.
Bot, A. and Benites, J.: The importance of soil organic matter: key to drought-resistant soil and sustained food production, Food and Agriculture Organization of the United Nations, Rome, 2005.
Campos, J. N.: A gestão das águas e o desenvolvimento do Estado do Ceará: uma perspectiva histórica, Ano IV, Num. 9, T & C Amazônia, 2006.
CENAD – Centro Nacional de Gerenciamento de Desastres: Anuário Brasileiro de Desastres Naturais, Ministério da Integração Nacional and Secretaria Nacional de Proteção e Defesa Civil, Brasília, DF, 2014.
Cirilo, J. A.: Public water resources policy for the semi-arid region, Estududos Avançados. Revista USP, vol. 22, Universidade de São Paulo, São Paulo, SP, 61–82, ISSN 1806-9592, 2008.
Cunha, A. P. M. A., Alvalá, Regina C. S., Nobre, C. A., and Carvalho, M. A.: Monitoring vegetative drought dynamics in the Brazilian Semiarid Region, Agr. Forest Meteorol., 214–215, 494–505, 2015.
Cunha, A. P. M. A., Zeri, M., Deusdará Leal, K., Costa, L., Cuartas, L. A., Marengo, J. A., Tomasella, J., Vieira, R. M., Barbosa, A. A., Cunningham, C., Cal Garcia, J. V., Broedel, E., Alvalá, R., and Ribeiro-Neto, G.: Extreme Drought Events over Brazil from 2011 to 2019, Atmosphere, 10, 642 https://doi.org/10.3390/atmos10110642, 2019a.
Cunha, A. P. M. A., dos S. Alvalá, R. C., Cuartas, L. A., Marengo, J. A., Marchezini, V., Leal, K. R. D., Tomasella, J., Saito, S. M., Zeri, M., Munoz, V. A., Ribeiro-Neto, G., Seluchi, M. E., Cunningham, C., Costa, L. C. O., Zhang, R., and Moraes, O. L. L.: Brazilian Experience on the Development of Drought monitoring and Impact Assessment Systems, United Nations Office for Disaster Risk Reduction – UNDRR, 2019, Contributing paper to Global Assessment Report on Disaster Risk Reduction – GAR 2019, Geneva, Switzerland, 2019b.
D'Souza, R., Fernandes, M. F., and Barbosa, M.: Vulnerabilidades, semi-aridez e desertificação: cenários de riscos no Cariri Paraibano, OKARA, Geografia em debate, 2, 190–202, 2008.
Duffy, P. B., Brando, P., Asner, G. P., and Field, C. B.: Projections of future meteorological drought and wet periods in the Amazon, P. Natl. Acad. Sci. USA, 112, 13172–13177, https://doi.org/10.1073/pnas.1421010112, 2015.
EM-DAT: The Emergency Events Database Université Catholique de Louvain (UCL) – CRED, D. Guha-Sapir, Brussels, Belgium, available at: https://www.emdat.be/ (last access: 16 March 2020), 2018.
Guevara, M. and Vargas, R.: Downscaling satellite soil moisture using geomorphometry and machine learning, PloS One, 14, e0219639, https://doi.org/10.1371/journal.pone.0219639, 2019.
Guevara, M., Olmedo, G. F., Stell, E., Yigini, Y., Aguilar Duarte, Y., Arellano Hernández, C., Arévalo, G. E., Arroyo-Cruz, C. E., Bolivar, A., Bunning, S., Bustamante Cañas, N., Cruz-Gaistardo, C. O., Davila, F., Dell Acqua, M., Encina, A., Figueredo Tacona, H., Fontes, F., Hernández Herrera, J. A., Ibelles Navarro, A. R., Loayza, V., Manueles, A. M., Mendoza Jara, F., Olivera, C., Osorio Hermosilla, R., Pereira, G., Prieto, P., Ramos, I. A., Rey Brina, J. C., Rivera, R., Rodríguez-Rodríguez, J., Roopnarine, R., Rosales Ibarra, A., Rosales Riveiro, K. A., Schulz, G. A., Spence, A., Vasques, G. M., Vargas, R. R., and Vargas, R.: No silver bullet for digital soil mapping: country-specific soil organic carbon estimates across Latin America, SOIL, 4, 173–193, https://doi.org/10.5194/soil-4-173-2018, 2018.
Guevara, M., Ribeiro, F., Vázquez-Lule, A., Cunha, A., Zeri, M., and Vargas, R.: Code for The Impact of Drought on Soil Moisture Trends across Brazilian Biomes (Version v1.0), Zenodo, https://doi.org/10.5281/zenodo.4587957, 2021.
Hiemstra, P. H., Pebesma, E. J., Twenhöfel, C. J. W., and Heuvelink, G. B. M.: Real-time automatic interpolation of ambient gamma dose rates from the Dutch radioactivity monitoring network, Comput. Geosci., 35, 1711–1721, https://doi.org/10.1016/j.cageo.2008.10.011, 2009.
IBGE – Instituto Brasileiro de Geografia e Estatística: Mapa de Biomas e de Vegetação, available at: https://ww2.ibge.gov.br/home/presidencia/noticias/21052004biomashtml.shtm (last access: 20 August 2018), 2004.
IBGE – Instituto Brasileiro de Geografia e Estatística: Pesquisas, available at: https://cidades.ibge.gov.br/pesquisas (last access: 3 February 2020), 2017.
IBGE – Instituto Brasileiro de Geografia e Estatística: Biomas e sistema costeiro-marinho do Brasil, Rio de Janeiro, 2019.
INPE – National Institute of Spatial Research: INPE Nordeste mapeia desmatamento da Caatinga, available at: http://www.inpe.br/noticias/noticia.php?Cod_Noticia=3895, last access: 17 April 2018.
Ioris, A. A. R., Irigaray, C. T., and Girard, P.: Institutional responses to climate change: opportunities and barriers for adaptation in the Pantanal and the Upper Paraguay River Basin, Climatic Change, 127, 139–151, https://doi.org/10.1007/s10584-014-1134-z, 2014.
Kolker, E.: In praise of open research measures, Nature, 498, 170, https://doi.org/10.1038/498170b, 2013.
Kouadio, Y. K., Servain, J., Machado, L. A. T., and Lentini, C. A. D.: Heavy rainfall episodes in the eastern northeast brazil linked to large-scale ocean-atmosphere conditions in the tropical atlantic, Adv. Meteorol., 2012, 369567, https://doi.org/10.1155/2012/369567, 2012.
Kuppel, S., Houspanossian, J., Nosetto, M. D., and Jobbágy, E. G.: What does it take to flood the Pampas?: Lessons from a decade of strong hydrological fluctuations: Floods and the water cycle in the Pampas, Water Resour. Res., 51, 2937–2950, https://doi.org/10.1002/2015WR016966, 2015.
Leal, I. R., Da Silva, J. M. C., Tabarelli, M., and Lacher, T. E.: Changing the Course of Biodiversity Conservation in the Caatinga of Northeastern Brazil, Conserv. Biol., 19, 701–706, https://doi.org/10.1111/j.1523-1739.2005.00703.x, 2005.
Legates, D. R., Mahmood, R., Levia, D. F., DeLiberty, T. L., Quiring, S. M., Houser, C., and Nelson, F. E.: Soil moisture: A central and unifying theme in physical geography, Prog. Phys. Geogr,, 35, 65–86, https://doi.org/10.1177/0309133310386514, 2011.
Li, X. and Xiao, J.: A Global, 0.05-Degree Product of Solar-Induced Chlorophyll Fluorescence Derived from OCO-2, MODIS, and Reanalysis Data, Remote Sens., 11, 517, https://doi.org/10.3390/rs11050517, 2019.
Liu, Y. Y., Parinussa, R. M., Dorigo, W. A., De Jeu, R. A. M., Wagner, W., van Dijk, A. I. J. M., McCabe, M. F., and Evans, J. P.: Developing an improved soil moisture dataset by blending passive and active microwave satellite-based retrievals. Hydrol. Earth Syst. Sci., 15, 425–436, https://doi.org/10.5194/hess-15-425-2011, 2011.
Llamas, R. M., Guevara, M., Rorabaugh, D., Taufer, M., and Vargas, R.: Spatial Gap-Filling of ESA CCI Satellite-Derived Soil Moisture Based on Geostatistical Techniques and Multiple Regression, Remote Sens., 12, 665, https://doi.org/10.3390/rs12040665, 2020.
Magalhães, A.: Life and drought in Brazil. Drought in Brazil – Proactive Management and Policy, in: Drought and Water Crisis., Wilhite, D., CRC Press, Boca Raton, FL, 1–19, 2016.
Marengo, J., Tomasella, J., Alves, L., Soares, W., and Rodriguez, D.: The drought of 2010 in the context of historical droughts in the Amazon region, Geophys. Res. Lett., 38, L12703, https://doi.org/10.1029/2011GL047436, 2010.
Marengo, J., Alves, L., Alvala, R., Cunha, A., Brito, S., and Moraes, O.: Climatic characteristics of the 2010–2016 drought in the semiarid Northeast Brazil region, Anais da Academia Brasileira de Ciências (Annals of the Brazilian Academy of Sciences), 90, 1973–1985, https://doi.org/10.1590/0001-3765201720170206, 2017.
McColl, K. A., Alemohammad, S. H., Akbar, R., Konings, A. G., Yueh, S., and Entekhabi, D.: The global distribution and dynamics of surface soil moisture, Nat. Geosci., 10, 100–104, https://doi.org/10.1038/ngeo2868, 2017.
Medeiros, R. M.: Análise Hidroclimático do Município de Cabaceiras, PB, Revista Brasileira de Geografia Física, 17, 1174–1190, 2012.
Ministry of National Integration of Brazil: Reconhecimentos Realizados e Reconhecimentos Vigentes, available at: http://www.mi.gov.br/web/guest/reconhecimentos-realizados, last access: 24 March 2018.
Mishra, A. K. and Singh, V. P.: A review of drought concepts, J. Hydrol., 391, 202–216, https://doi.org/10.1016/j.jhydrol.2010.07.012, 2010.
Moraes, C., Pereira, G., an dCardozo, F.: Avaliação precipitação e sua influência sobre as áreas inundadas no Pantanal, in: Anais XVI Simpósio Brasileiro de Sensoriamento Remoto – SBSR, INPE, Foz do Iguaçu, PR, Brasil, 2013.
Nascimento, S. and Alves, J.: Ecoclimatologia do Cariri Paraibano, Revista Geográfica Acadêmica, 3, 28–41, 2008.
National Secretary of Civil Defense and Protection of Brazil: Relatório de Gestão: Exercício 2016, Ministério da Integração Nacional, Brasília, DF, Brazil, 2017.
Novick, K. A., Ficklin, D. L., Stoy, P. C., Williams, C. A., Bohrer, G., Oishi, A. C., and Phillips, R. P.: The increasing importance of atmospheric demand for ecosystem water and carbon fluxes, Nat. Clim. Change, 6, 1023–1027, https://doi.org/10.1038/nclimate3114, 2016.
NWS – National Weather Service: Drought: Public Fact Sheet, National Oceanic and Atmospheric Administration, available at: https://www.esrl.noaa.gov/gmd/obop/mlo/educationcenter/students/brochures and diagrams/noaa publications/Drought Fact Sheet.pdf (last access: 12 December 2019), 2006.
Overbeck, G. E., Vélez-Martin, E., Scarano, F. R., Lewinsohn, T. M., Fonseca, C. R., Meyer, S. T., and Pillar, V. D.: Conservation in Brazil needs to include non-forest ecosystems, Divers. Distrib., 21, 1455–1460, https://doi.org/10.1111/ddi.12380, 2015.
Reuter, H. I. and Hengl, T.: Global Soil Information Facilities-Component Worldgrids.org, in: EGU General Assembly Conference Abstracts, available at: https://www.researchgate.net/publication/233540147_Global_Soil_Information_Facilities-Component_Worldgrids_org (last access: 9 September 2018), 2012.
Roesch, L. F., Vieira, F., Pereira, V., Schünemann, A. L., Teixeira, I., Senna, A. J., and Stefenon, V. M.: The Brazilian Pampa: A Fragile Biome, Diversity, 1, 182–198, https://doi.org/10.3390/d1020182, 2009.
Rossato, L., Marengo, J. A., de Angelis, C. F., Pires, L. B. M., and Mendiondo, E. M.: Impact of soil moisture over Palmer Drought Severity Index and its future projections in Brazil, Revista Brasileira de Recursos Hídricos (Brazilian Journal of Water Resources), 22, 1–16, https://doi.org/10.1590/2318-0331.0117160045, 2017.
Santos, M. G., Oliveira, M. T., Figueiredo, K. V., Falcão, H. M., Arruda, E. C. P., Almeida-Cortez, J., Sampaio, E., Ometto, J., Menezes, R., Oliveira, A., Pompelli, M., and Antonino, A. C. D.: Caatinga, the Brazilian dry tropical forest: can it tolerate climate changes?, Theor. Exp. Plant Phys., 26, 83–99, https://doi.org/10.1007/s40626-014-0008-0, 2014.
Santos, S. and Silva, L. G.: Mapeamento por imagens de sensoriamento remoto evidencia o bioma Pampa brasileiro sob ameaça, Boletim de Geografia, 29, 49–57, https://doi.org/10.4025/bolgeogr.v29i2.12366, 2012.
SECOM – The Secretariat for Social Communication of the Presidency of Brazil: Biodiversity in Brazil, Secretariat for Social Communication of the Presidency of the Federative Republic of Brazil, in: United Nations Conference on Biological Diversity (COP11), Hyderabad, India, 2012.
Sen, P. K.: Estimates of the Regression Coefficient Based on Kendall's Tau, J. Am. Stat. Assoc., 63, 1379, https://doi.org/10.2307/2285891, 1968.
Sheffield, J. and Wood, E. F.: Global Trends and Variability in Soil Moisture and Drought Characteristics, 1950–2000, from Observation-Driven Simulations of the Terrestrial Hydrologic Cycle, J. Climate, 21, 432–458, 2008.
Siegel, A. F.: Robust Regression Using Repeated Medians, Biometrika, 69, 242, https://doi.org/10.2307/2335877, 1982.
Smith, K.: Hydrological Hazards. Environmental Hazards – Assessing Risk and Reducing Disaster, Routledge, New York, NY, 337–370, 2013.
Theil, H.: A Rank-Invariant Method of Linear and Polynomial Regression Analysis, in: Henri Theil's Contributions to Economics and Econometrics, vol. 23, edited by: Raj, B. and Koert, J., Springer Netherlands, Dordrecht, 345–381, https://doi.org/10.1007/978-94-011-2546-8_20, 1992.
The Nature Conservancy: The Atlantic Forest harbors a range of biological diversity similar to that of the Amazon, The Nature Conservancy, available at: https://www.nature.org/ourinitiatives/regions/latinamerica/brazil/placesweprotect/atlantic-forest.xml (last access: 22 February 2020), 2015.
Tomasella, J., Vieira, R., Barbosa, A., Rodriguez, D., Santana, M., and Sestini, M.: Desertification trends in the Northeast of Brazil over the period 2000–2016, Int. J. Appl. Earth Obs. Geoinf., 73, 197–206, 2018.
Travassos, I. S. and De Souza, B. I.: Os negócios da lenha: indústria, desmatamento e desertificação no Cariri paraibano, GEOUSP: Espaço e Tempo (Online), 18, 329, https://doi.org/10.11606/issn.2179-0892.geousp.2014.84536, 2014.
Vargas, R.: How a hurricane disturbance influences extreme CO2 fluxes and variance in a tropical forest, Environ. Res. Lett., 7, 035704, https://doi.org/10.1038/498170b, 2012.
Vargas, R., Sánchez-Cañete, P., Serrano-Ortiz, P., Curiel Yuste, J., Domingo, F., López-Ballesteros, A., and Oyonarte, C.: Hot-moments of soil CO2 efflux in a water-limited grassland, Soil Syst., 2, 47, https://doi.org/10.3390/soilsystems2030047, 2018.
Villarreal, S., Vargas, R., Yepez, E. A., Acosta, J. S., Castro, A., Escoto-Rodriguez, M., Lopez, E., Martínez-Osuna, J., Rodriguez, J. C., Smith, S. V., and Vivoni, E. R.: Contrasting precipitation seasonality influences evapotranspiration dynamics in water-limited shrublands, J. Geophys. Res.-Biogeo., 121, 494–508, 2016.
Zeri, M., S. Alvalá, R., Carneiro, R., Cunha-Zeri, G., Costa, J., Rossato Spatafora, L., Urbano, D., Vall-Llossera, M., and Marengo, J.: Tools for Communicating Agricultural Drought over the Brazilian Semiarid Using the Soil Moisture Index, Water, 10, 1421, https://doi.org/10.3390/w10101421, 2018.