the Creative Commons Attribution 4.0 License.
the Creative Commons Attribution 4.0 License.
 | 05 Feb 2021
A regional spatiotemporal analysis of large magnitude snow avalanches using tree rings
Jordy Hendrikx
Daniel Stahle
Gregory Pederson
Karl Birkeland
Daniel Fagre
Snow avalanches affect transportation corridors and settlements worldwide. In many mountainous regions, robust records of avalanche frequency and magnitude are sparse or non-existent. However, dendrochronological methods can be used to fill this gap and infer historical avalanche patterns. In this study, we developed a tree-ring-based avalanche chronology for large magnitude avalanche events (size ) using dendrochronological techniques for a portion of the US northern Rocky Mountains. We used a strategic sampling design to examine avalanche activity through time and across nested spatial scales (i.e., from individual paths, four distinct subregions, and the region). We analyzed 673 samples in total from 647 suitable trees collected from 12 avalanche paths from which 2134 growth disturbances were identified over the years 1636 to 2017 CE. Using existing indexing approaches, we developed a regional avalanche activity index to discriminate avalanche events from noise in the tree-ring record. Large magnitude avalanches, common across the region, occurred in 30 individual years and exhibited a median return interval of approximately 3 years (mean = 5.21 years). The median large magnitude avalanche return interval (3–8 years) and the total number of avalanche years (12–18) varies throughout the four subregions, suggesting the important influence of local terrain and weather factors. We tested subsampling routines for regional representation, finding that sampling 8 random paths out of a total of 12 avalanche paths in the region captures up to 83 % of the regional chronology, whereas four paths capture only 43 % to 73 %. The greatest value probability of detection for any given path in our dataset is 40 %, suggesting that sampling a single path would capture no more than 40 % of the regional avalanche activity. Results emphasize the importance of sample size, scale, and spatial extent when attempting to derive a regional large magnitude avalanche event chronology from tree-ring records.
- Article
(11599 KB) - Full-text XML
- BibTeX
- EndNote


1.1 Background
Snow avalanches are hazardous to human safety and infrastructure (Mock et al., 2016; Schweizer, 2003), as well as an important landscape disturbance affecting mountain ecosystems (Bebi et al., 2009). In the United States, an average of 27 people die in avalanche accidents each winter (CAIC, 2020). Avalanches, especially large magnitude events, also affect transportation corridors and settlements throughout the world. For example, avalanches impact numerous roadways and railroad corridors in the western United States (Armstrong, 1981; Hendrikx et al., 2014; Reardon et al., 2008). Consequently, understanding general avalanche processes and associated large magnitude avalanche return intervals (RIs) is critical for local and regional avalanche forecasters, transportation agencies, and land use planners.
Long-term, reliable, and consistent avalanche observation records are necessary for calculating avalanche return intervals which can be used in infrastructure planning and avalanche forecasting operations. However, such records are often sparse or non-existent in many mountainous regions, including areas with existing transportation corridors. Thus, inferring avalanche frequency requires the use of dendrochronological methods to document damaging events or geomorphic response within individual trees at individual path to regional scales. Even in regions with historical records, tree-ring dating methods can be used to extend or validate uncertain historical avalanche records, which has led to the broad implementation of these methods in mountainous regions throughout the world (e.g., Corona et al., 2012; Favillier et al., 2018; Schläppy et al., 2014).
Numerous studies reconstructed avalanche chronologies in the United States using tree-ring methods (Burrows and Burrows, 1976; Butler et al., 1987; Carrara, 1979; Hebertson and Jenkins, 2003; Potter, 1969; Rayback, 1998). Butler and Sawyer (2008) provided a review of current methodologies and types of tree-ring responses used in avalanche dendrochronological studies. Favillier et al. (2018) provided a more recent comprehensive graphical summary of dendrochronological avalanche studies throughout the world. Numerous studies used dendrochronological techniques to develop avalanche chronologies for remote regions without historical avalanche records or areas with inconsistent avalanche observations (Butler and Malanson, 1985a; Germain et al., 2009; Reardon et al., 2008; Šilhán and Tichavský, 2017; Voiculescu et al., 2016), and many studies used these techniques to examine avalanches across space and time (Table A1).
1.2 Framework and objectives
Tree-ring avalanche research is resource and time intensive. Like other scientific fields, it is not feasible to completely sample the variable of interest in infinite detail due to logistical and financial constraints (Skøien and Blöschl, 2006). Thus, a strategic spatial sampling method is necessary. Here, we strategically sampled 12 avalanche paths in four distinct subregions of the US northern Rocky Mountains of northwest Montana to examine spatial differences at a regional scale. The sampling strategy is based on the concept of scale triplet, which defines the spacing, extent, and support of our sampling scheme (Blöschl and Sivapalan, 1995). Incorporating the scale triplet concept helps us understand the nature of the problem, the scale at which measurements should be made, and how we can estimate the measurements across space. Often the scale at which samples are collected differs from the scale necessary for predictive purposes (Blöschl, 1999). For example, if we are interested in avalanche frequency relationships with regional climate patterns but tree-ring samples are collected at an avalanche path scale, then a network of sampled paths need to be spaced and aggregated across the core of the climatically similar region. In our study, the extent is the entire region and subregions, the spacing is the distance between avalanche paths and subregions, and the support is the size of the area being sampled. In addition, the process scale is the natural variability of avalanche frequency, the measurement scale is the tree-ring proxies used to represent avalanche occurrence on an annual temporal scale, and the model scale relates to aggregating all of the sample areas to derive a regional avalanche chronology.
We adopt the definition of Martin and Germain (2016) that large magnitude avalanches are events characterized by low and variable frequency with a high capacity for destruction. This generally translates to a size 3 or greater on the destructive classification scale – i.e., ability to bury or destroy a car, damage a truck, destroy a wood frame house, or break a few trees (Greene et al., 2016).
Understanding the spatiotemporal behavior of large magnitude avalanches on the regional scale will improve avalanche forecasting efforts, especially for operations involving avalanche terrain that impacts transportation corridors. Here, we aim to answer three specific questions.
-
What is the regional, subregional, and path-specific frequency of large magnitude avalanches in the US northern Rocky Mountains of northwest Montana?
-
How does the spatial extent of the study region affect the resulting avalanche chronology?
-
What is the probability of detecting regional avalanche activity by sampling different avalanche paths?
To our knowledge, this is the first study to look at how various spatial scales compare when reconstructing a regional avalanche chronology from dendrochronological data from a large dataset (N>600 samples). Further, we believe this is the first study that utilizes a regional dendrochronological record to derive return periods over a large (>3500 km2) spatial extent. Our hypothesis is that aggregating the paths into subregions and then again into a full region allows us to minimize the limitation of tree-ring avalanche chronologies underestimating avalanche years at these scales.
2.1 Study site
Our study site consists of 12 avalanche paths in the Rocky Mountains of northwest Montana, United States (Fig. 1 and Table 1). We sampled sets of three avalanche paths in four distinct subregions within three mountain ranges: the Whitefish Range (WF; Red Meadow Creek) and Swan Range (Swan; Lost Johnny Creek) in the Flathead National Forest and two subregions within the Lewis Range in Glacier National Park (GNP), Montana. The sites in GNP are along two major transportation corridors through the park: the Going-to-the-Sun Road (GTSR) and US Highway 2 in John F. Stevens (JFS) Canyon. These two areas were utilized for previous dendrochronological avalanche research (Butler and Malanson, 1985a, b; Butler and Sawyer, 2008; Reardon et al., 2008). A robust regional avalanche chronology reconstruction will help place the previous work in the context of the wider region. The other two sites, WF and Swan, are popular backcountry recreation areas with access via snow machine in the winter along a US Forest Service road. The avalanche paths in each subregion encompass a range of spatial extents from adjacent (i.e., <30 m apart) to ∼10 km apart. Overall, this study region provides an ideal natural setting for studying avalanches due to its geography, inclusion of transportation and recreation corridors potentially impacted by avalanches, relative accessibility, and no artificial avalanche hazard mitigation.
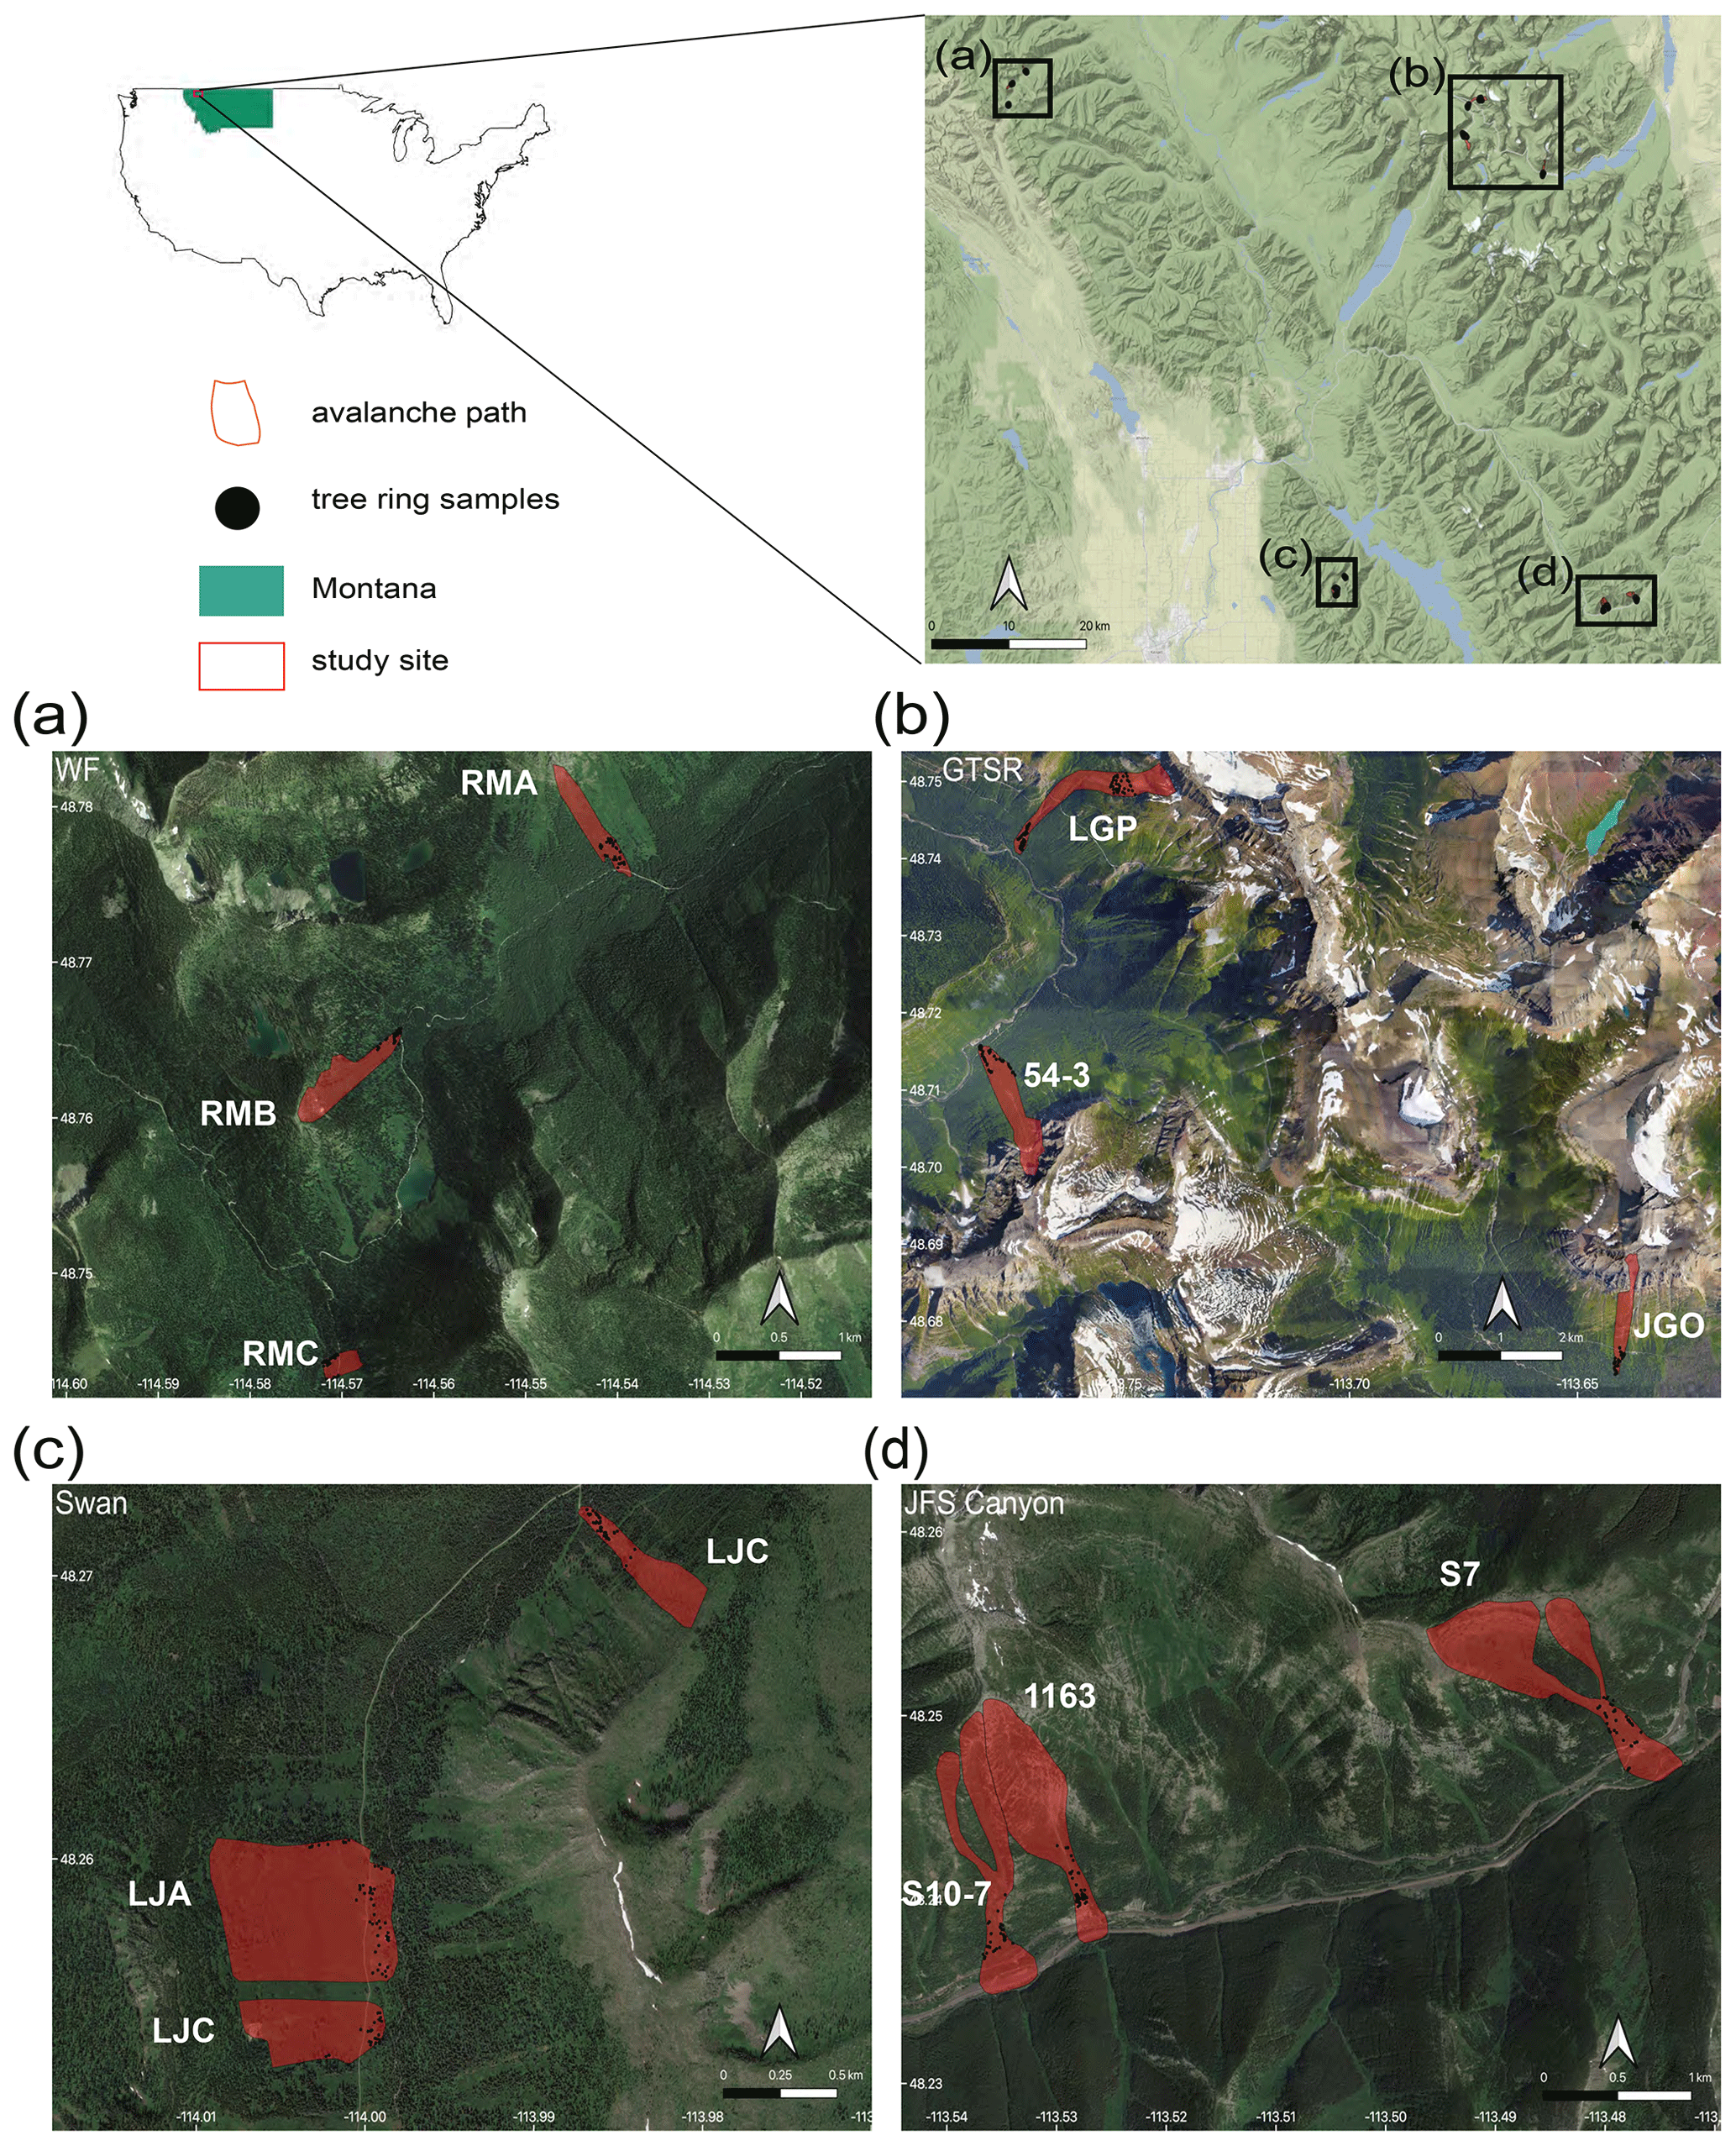
Figure 1Study site. The red rectangle in the state of Montana designates the general area of the four sampling sites. The sites are (a) Red Meadow, Whitefish Range (WF), (b) Going-to-the-Sun Road (GTSR), central GNP, (c) Lost Johnny Creek, northern Swan Range (Swan), and (d) John F. Stevens Canyon (JFS), southern GNP. Black dots represent sample locations. Abbreviated names of each path are in white text adjacent to red polygons (paths). Satellite and map imagery: © Google (2020). Maps produced using ggmap in R (Korpela et al., 2019).
Table 1Topographic characteristics of all avalanche paths. The * denotes two major starting zones for one runout in the Shed 10-7 and Shed 7 paths.
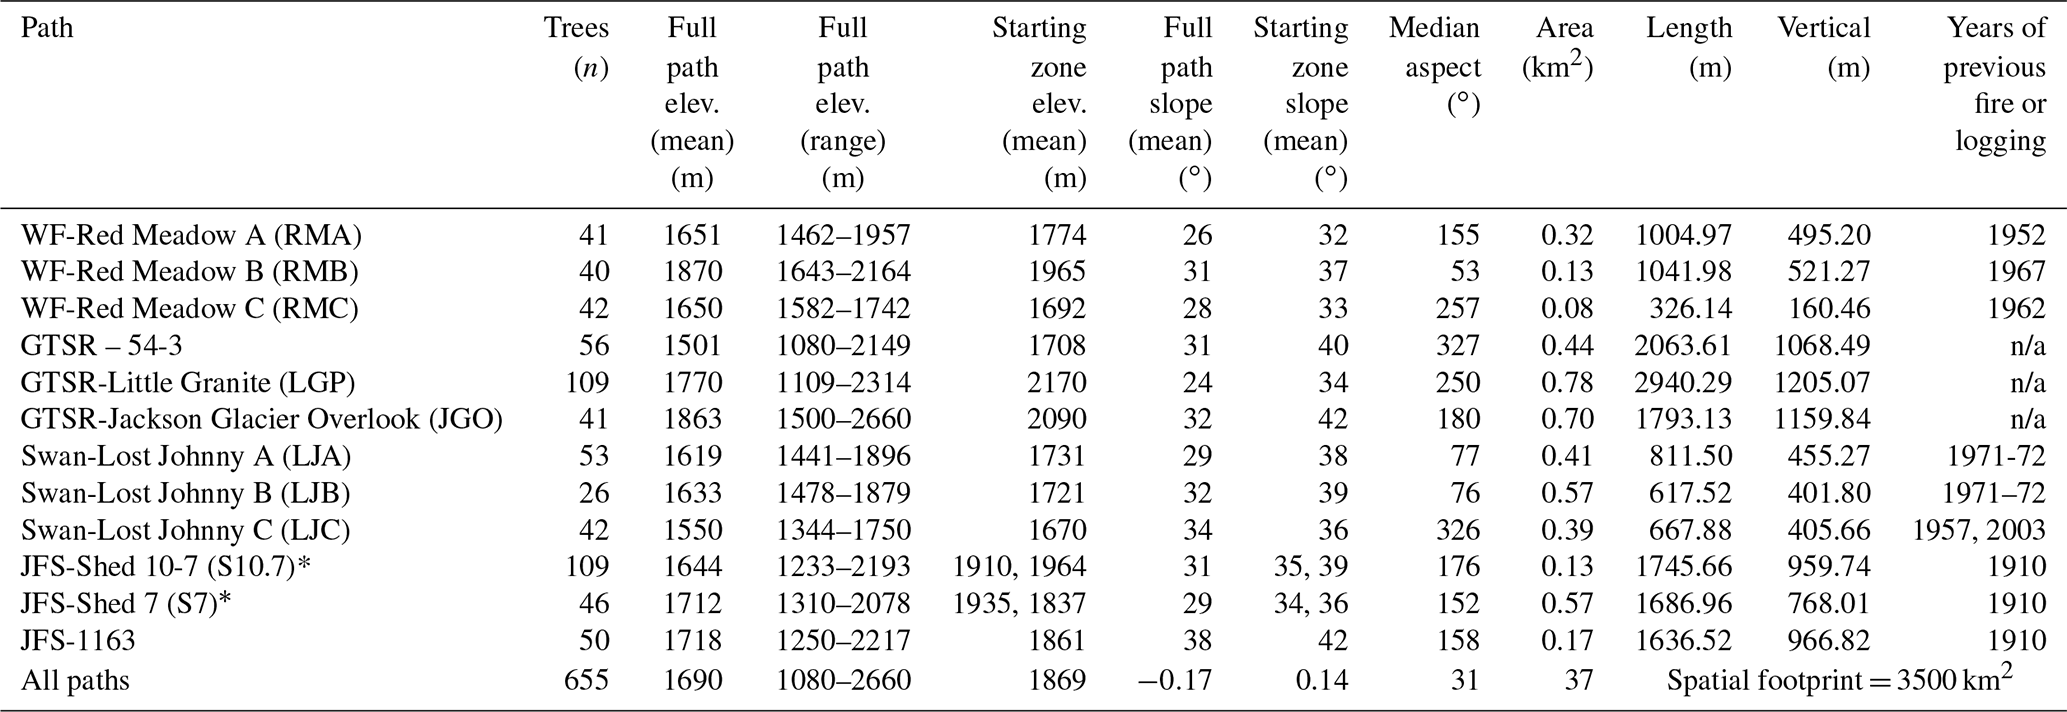
n/a stands for not applicable.
Northwest Montana's avalanche climate is classified as both a coastal transition and intermountain avalanche climate (Mock and Birkeland, 2000), but it can exhibit characteristics of both continental and coastal climates. The elevation of avalanche paths within the study sites range from approximately 1100 to 2700 m, and the starting zones of these paths are distributed among all aspects (Table 1).
We eliminated or minimized influence from exogenous disturbance factors such as logging and wildfire by referencing wildfire maps extending back to the mid-20th century. We selected sites undisturbed by wildfire since this time except for Lost Johnny Creek, which was purposeful as this area burned most recently in 2003. We also minimized the influence of logging by selecting sites not previously logged. Using historical logging parcel spatial data, we determined logging in some sites was limited to very small parcels adjacent to the farthest extent of the runout zones.
The historical observational record in this area is limited. In this study region, the Flathead Avalanche Center (FAC), a regional US Forest Service backcountry avalanche center, records all avalanches observed and reported to the center. However, not all avalanches are observed or reported given the approximately 3500 km2 advisory area. The Burlington Northern Santa Fe Railway (BNSF) avalanche safety program records most avalanches observed in John F. Stevens Canyon in southern Glacier National Park where there is 16 km of rail line with over 40 avalanche paths. However, systematic operational observations only began in 2005. Observations prior to this time are inconsistent, though large magnitude avalanches were mostly recorded. Reardon et al. (2008) developed as complete a record as possible from the Department of Transportation and railroad company records, National Park Service ranger logs, and popular media archives. In this subregion, avalanche mitigation is conducted on an infrequent and inconsistent basis in emergency situations, which is typically only once a year, if at all. Thus, the record approximates a natural avalanche record. We compared the reconstructed avalanche chronology of the JFS subregion to the historical record of large magnitude years for qualitative purposes. A quantitative comparison would not be reflective of the true reliability of tree-ring methods because of the incomplete historical record.
2.2 Sample collection and processing
Our sampling strategy targeted an even number of samples collected from both lateral trimlines at varying elevations and trees located in the main lower track and runout zone of the selected avalanche paths. This adequately captured trees that were destroyed and transported, as well as those that remained in place. The definition of a large magnitude avalanche in this study refers to avalanches of approximately size D3 or greater (Greene et al., 2016) that may not run the full length of the avalanche path. We sampled spatial extents within each avalanche path that are representative of runout extents ≥ size D3 avalanches. We also used recent (within the previous 10 years) observed large magnitude avalanche activity in these paths to constrain our sampling.
The sample size for avalanche reconstruction using tree-ring data requires careful consideration. Butler and Sawyer (2008) suggested that a few damaged trees may be sufficient for avalanche chronologies, but larger target sample sizes increase the probability of detecting avalanche events (Corona et al., 2012). Germain et al. (2010) examined cumulative distribution functions of avalanche chronologies and reported only slight increases in the probability of extending chronologies with a sample size greater than 40. This also depends on the available length of record within a given avalanche path. Thus, given the large spatial footprint (∼3500 km2) of this study and feasibility of such a large sample size, we sampled between 26–109 samples per avalanche path resulting in 655 trees (Table 1). Eight trees were unsuitable for analysis, leaving us with 673 samples in total from 647 trees. Of the 673 samples in total, we collected 614 cross sections and 59 cores. Shed 10.7 (S10.7) path was the focus of previous work (Reardon et al., 2008), and the dendrochronological record extends up to 2005 (n=109 trees). Little Granite Path (LGP) was collected in the summer of 2009 (n=109 trees). We sampled the remaining 10 paths (437 of the 655 trees in total) in the summer of 2017.
We collected three types of samples: (1) cross sections from dead trees, (2) cross sections from the dead leaders of avalanche-damaged but still living trees, and (3) cores from living trees. We predominantly used cross sections in this study for a more robust analysis as events can potentially be missed or incorrectly identified in cores. We emphasized the selection of trees with obvious external scars and considered location, size, and potential age of tree samples. A limitation of all avalanche dendrochronology studies is that large magnitude events cause extensive damage and high tree mortality, thereby reducing subsequent potential tree-ring records.
We sampled stem cross sections at the location of an external scar or just above the root buttress from downed or standing and dead trees and from stems of trees topped by avalanche damage. We extracted tree-ring core samples from living trees with obvious scarring or flagging along the avalanche path margins and runout zone using a 5 mm diameter increment borer. We collected a minimum of two and up to four core samples per tree (two in the uphill-downhill direction and two perpendicular to the slope). We photographed each sample at each location and recorded species, Global Positioning System (GPS) coordinates (accuracy 1–3 m), amount of scarring on the cambium of the tree, relative location of the tree in the path, and upslope direction (Peitzsch et al., 2019). We also recorded location characteristics that identified the tree to be in place versus transported from its original growth position (i.e., presence or absence of roots attached to the ground or the distance from an obvious excavated area where the tree was uprooted).
To prevent radial cracking and further rot, we dried and stabilized the cross sections with a canvas backing. We sanded samples using a progressively finer grit of sandpaper to expose the anatomy of each growth ring and used the visual skeleton plot method to account for missing and false rings and for accurate calendar year dating (Stokes and Smiley, 1996). We assessed cross-dating calendar year accuracy of each sample and statistically verified dating against measured samples taken from trees within the gallery forest outside the avalanche path and from preexisting regional chronologies (Table A2) (NOAA, 2018) using the dating quality-control software COFECHA (Grissino-Mayer, 2001; Holmes, 1983). For further details on cross-dating methods and accuracy calculation for this dataset, see Peitzsch et al. (2019).
2.3 Avalanche event identification
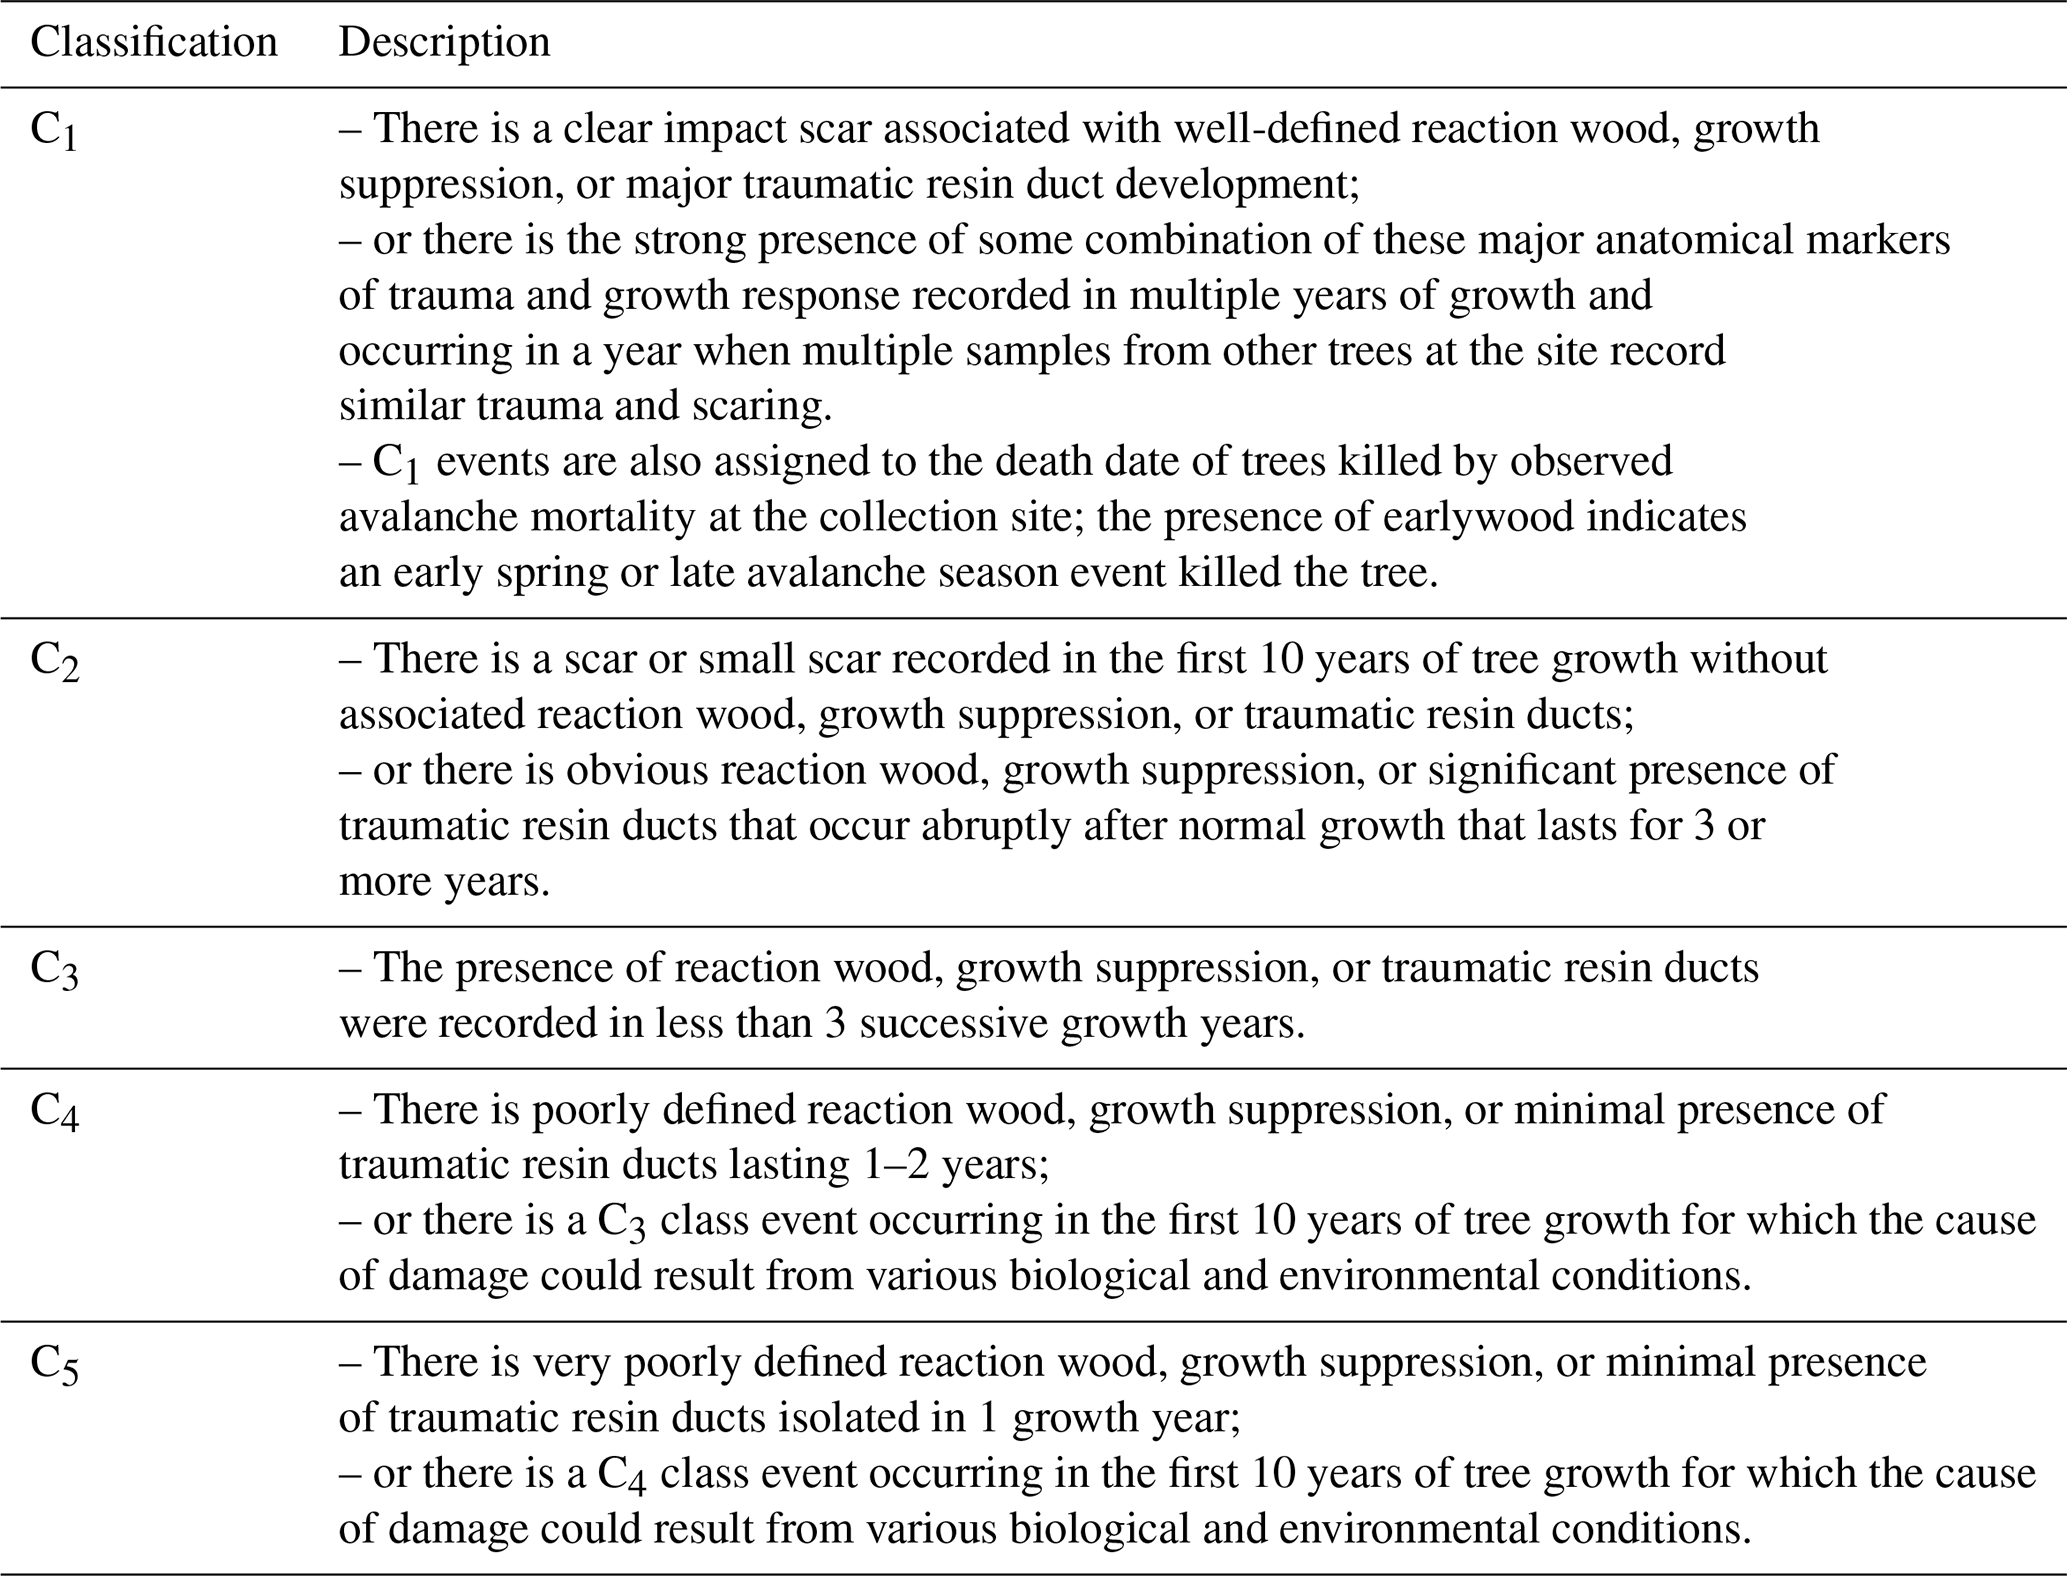
We analyzed samples for signs of traumatic impact events (hereafter “responses”) likely caused by snow avalanches. We adapted a classification system from previous dendrogeomorphological studies to qualitatively rank the trauma severity and tree growth response from avalanche impacts using numerical scores ranked 1 through 5 (Reardon et al., 2008). This classification scheme identified more prominent avalanche damage responses with higher-quality scores and allowed us to remain consistent with previous work (Corona et al., 2012; Favillier et al., 2018) (Table 2). To compare our ability to capture avalanche/trauma events using cores versus those captured using cross sections, we sampled a subset (n=40) of the cross sections by analyzing four 5 mm wide rectangles to mimic a core sample from an increment borer. The four subsamples on each cross section were made perpendicular to one another (i.e., 90∘) based on the first sample taken from the uphill direction of each stem to replicate common field sampling methods. We then summarized results from the four subsamples for each tree by taking the highest response score for each growth year. Finally, we compared the number, quality response category, and calendar year of the avalanche/trauma events derived from the core subsamples to those identified from the full cross sections.
Table 2Avalanche impact trauma classification ratings for which C1 represents the strongest and easily detectable trauma and C5 represents subtle and difficult-to-detect trauma.
2.4 Chronology and return period calculation
To generate avalanche event chronologies and estimate return periods for each path and for the entire study site, we utilized R statistical software and the package slideRun, an extension of the burnR library for forest fire history data (Malevich et al., 2018). We calculated the age of each tree sampled and the number of responses per year in each avalanche path and computed descriptive statistics for the entire dataset. Estimates of avalanche path return intervals should be viewed as maximum return interval values due to the successive loss of samples and decreasing sample number back through time.
We used a multistep process to reconstruct avalanche chronologies on three different spatial scales: individual paths, four subregions, and the entire region. We also calculated a regional avalanche activity index (RAAI) (Fig. 2). The process involved first calculating the ratio of trees exhibiting growth disturbances (GDs) over the number of samples alive in year t to provide the index It (Shroder, 1978):
where R is the number of trees recording a GD in year t with At representing the number of trees alive in our samples in year t.
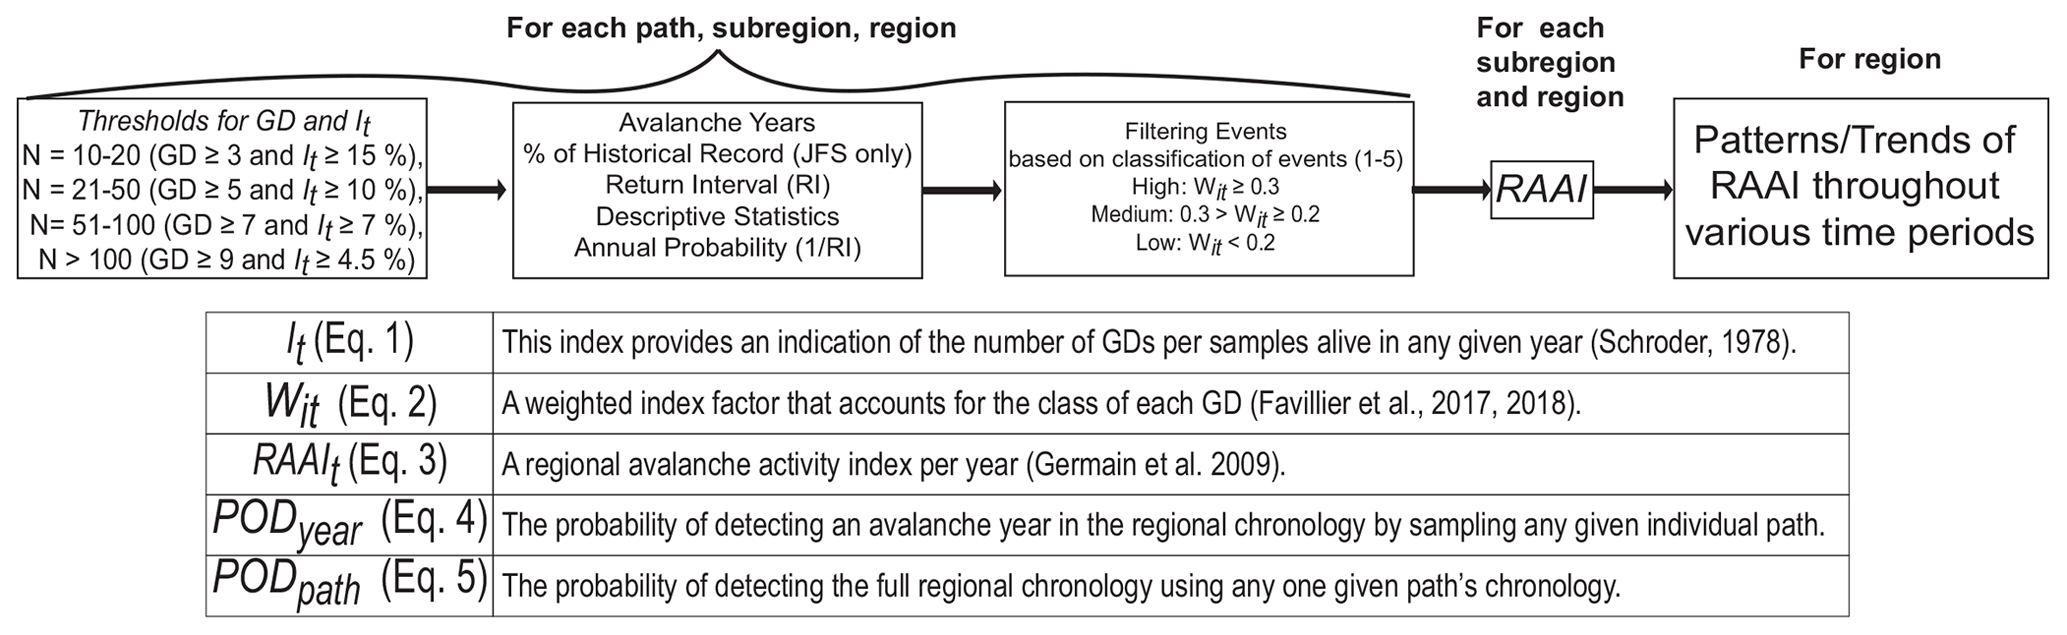
Figure 2General workflow of analytical methods to reconstruct regional avalanche chronology, regional avalanche activity index, and the probability of detection. N is sample size. GD is growth disturbances. It is index of ratio of responses to trees alive. RI is return interval. Wit is weighted index as per Favillier (2017, 2018). RAAI is regional avalanche activity index as per Germain et al. (2009). POD is probability of detection. See Eqs. (1)–(5) for details.
We then used double thresholds to estimate the minimum absolute number of GD and a minimum percentage of samples exhibiting GDs per year (It) based on sample size (N) following thresholds established by Corona et al. (2012) and Favillier et al. (2018): N=10–20 (GD ≥ 3 and It≥15 %), N=21–50 (GD ≥ 5 and It≥10 %), N=51–100 (GD ≥ 7 and It≥7 %), and N>100 (GD ≥ 9 and It≥4.5 %).
We then used the chronologies derived from this process to calculate a weighted index factor (Wit). We used this established threshold approach since it has been broadly employed in the literature and allows for the comparability of our avalanche chronology to results reported in other studies. We adapted previous equations of a weighted response index (Kogelnig-Mayer et al., 2011) to our five-scale ranking quality classification to derive the Wit:
where the sum of trees with scars or injuries (C1–C5) were multiplied by a factor of 7, 5, 3, 1, and 1, respectively (Kogelnig-Mayer et al., 2011).
Next, we classified Wit into high, medium, and low confidence events using the thresholds detailed in Favillier et al. (2018), in which high is Wit≥0.3, medium is , and low is Wit<0.2. This provided another step discriminating the avalanche response from noise. We included all events with medium to high confidence in the next analysis. We then estimated the number of avalanche years, descriptive statistics for return intervals (RIs), and the annual probability (RI) for each path, subregion, and region. We use these RI values which were determined after filtering events throughout the study. We then compared return intervals for all individual paths and subregions using analysis of variance (ANOVA) and Tukey's Honest Significant Difference (HSD) (Ott and Longnecker, 2016). In the final step of RI analysis, we subset the period of record for each path from 1967 to 2017 to compare RIs from this condensed time series to the full period of record for each path.
Next, we compared the number of avalanche years and return periods identified in the full regional chronology to subsets of the region to determine the number of paths required to replicate a full 12-path regional chronology. We assessed the full chronology against a subsampling of 11 paths in total by sequentially removing the 3 paths with the greatest sample size. We then randomly sampled two paths from each subregion for a total subsample of eight paths, followed by generating a subsample of four paths by choosing the path in each subregion with the greatest sample size. Finally, we selected a random sample of one path from each subregion to compare against a total of four single path subsamples.
2.5 Regional avalanche activity index and probability of detection
Next, we used the It statistic from each path to calculate a regional avalanche activity index (RAAI) for the subregions and overall region (Germain et al., 2009). The RAAI for each year across the subregions and region provides a more comprehensive assessment of avalanche activity within the spatial extent. For each year t, we calculated RAAI:
where I is the index factor as per Eq. (1) for a given avalanche path for year t and P is the number of paths that could potentially record an avalanche for year t. For the calculation of the overall RAAI, we required each path to retain a minimum sample size of ≥10 trees with a minimum number of three paths for year t and a minimum of one path from each subregion. We performed a sensitivity test to establish the minimum number of paths necessary to calculate an RAAI value for any given year.
We also calculated the probability of detecting an avalanche year identified in the regional chronology as if any given individual path was sampled. The probability of detection for a given year (PODyear) is defined as
where a is the number of individual avalanche paths that identify any given avalanche year in the regional chronology and b is the total number of avalanche paths (n=12). We calculated PODyear for every year in the regional avalanche chronology. We then compared the PODyear of individual paths to the number of active avalanche paths as defined in Eq. (3).
We also calculated the probability of detection for each path for the period of record (PODpath):
where c is the number of years identified in any given path that is included in the regional chronology and d is the number of years in the regional chronology that are not identified in the chronology for the given path.
2.6 Geomorphological characteristics
Using a 10 m digital elevation model (DEM), we calculated a number of geomorphological characteristics for each path, including mean elevation (m; full path and starting zone), elevation range (m), eastness (sin(aspect)) and northness (cos(aspect)) (radians), slope (degrees; full path and starting zone), curvature (index (0–1); profile and planform), roughness (index; full path and starting zone), perimeter (km2), area (km2), length (m), and vertical distance from starting zone to runout zone (m). We also calculated the mean of these characteristics for all paths in the region. The geomorphological characteristics allowed for a determination of the representativeness of the region as a whole (i.e., are the paths similar across the region?), as well as a comparison of the return interval for each path relative to these characteristics. Finally, we estimated the potential relationship between path length, starting zone slope angle, the number of avalanche years, and median return interval for each individual path using the Pearson correlation coefficient.

Figure 3Histograms of (a) number of classification of responses (number above bar represents proportion), (b) sample age (red line represents mean age), and (c) collected species. For the species, ABLA is Abies Lasciocarpa, PCEN is Picea engelmannii, PSME is Pseudotsuga menziesii, THPL is Thuja plicata, PICO is Pinus contorta, POTR is Populus tremuloides, LARIX is Larix Mill., BETULA is Betula L., and POBA is Populus balsamifera.
We collected a total of 673 samples from 647 suitable trees impacted or killed by avalanches (trees: n=531 dead; n=116 living) in the full 12-path regional avalanche collection. Of those 673 samples, 614 were cross sections (91 %) and 59 were cores (9 %). Within these samples, we identified 2134 GDs, of which 1279 were classified as C1 and C2 (60 %) (Fig. 3a). Scars were the dominant input type of GDs classified as C1, and reaction wood comprised the majority of GDs classified as C2, C3, and C4 (Table A3). The oldest individual tree sampled was 367 years, and the mean age of all samples was 73 years (Fig. 3c). The period of record of sampled trees extended from 1636 to 2017 CE. The most common species in our dataset was Abies lasciocarpa (ABLA; subalpine fir) (46 %), followed by Pseudotsuga menziesii (PSME; Douglas fir) (37 %) and Picea engelmannii (PCEN; Engelmann spruce) (14 %) (Fig. 3d). The oldest GD response dates to the year 1655. In the entire dataset, the 5 years with the greatest number of raw GD responses were 2002 (165 responses), 2014 (151 responses), 1990 (93 responses), 1993 (90 responses), and 1982 (75 responses).
3.1 Avalanche event detection: cores versus cross sections
The avalanche response subset analysis that compared results as if samples were from cores versus full cross sections showed that core samples alone would have missed numerous avalanche events and generated a greater proportion of low-quality growth disturbance classifications (Fig. 4). For the subset of 40 samples analyzed as cores, we identified only 124 of 191 (65 %) GDs in total. Of the 67 GDs that we would have missed just by using cores, 24 were classified as C1 quality events, 24 were C2, 14 were C3, 3 were C4, and 2 were C5 (Table A4).
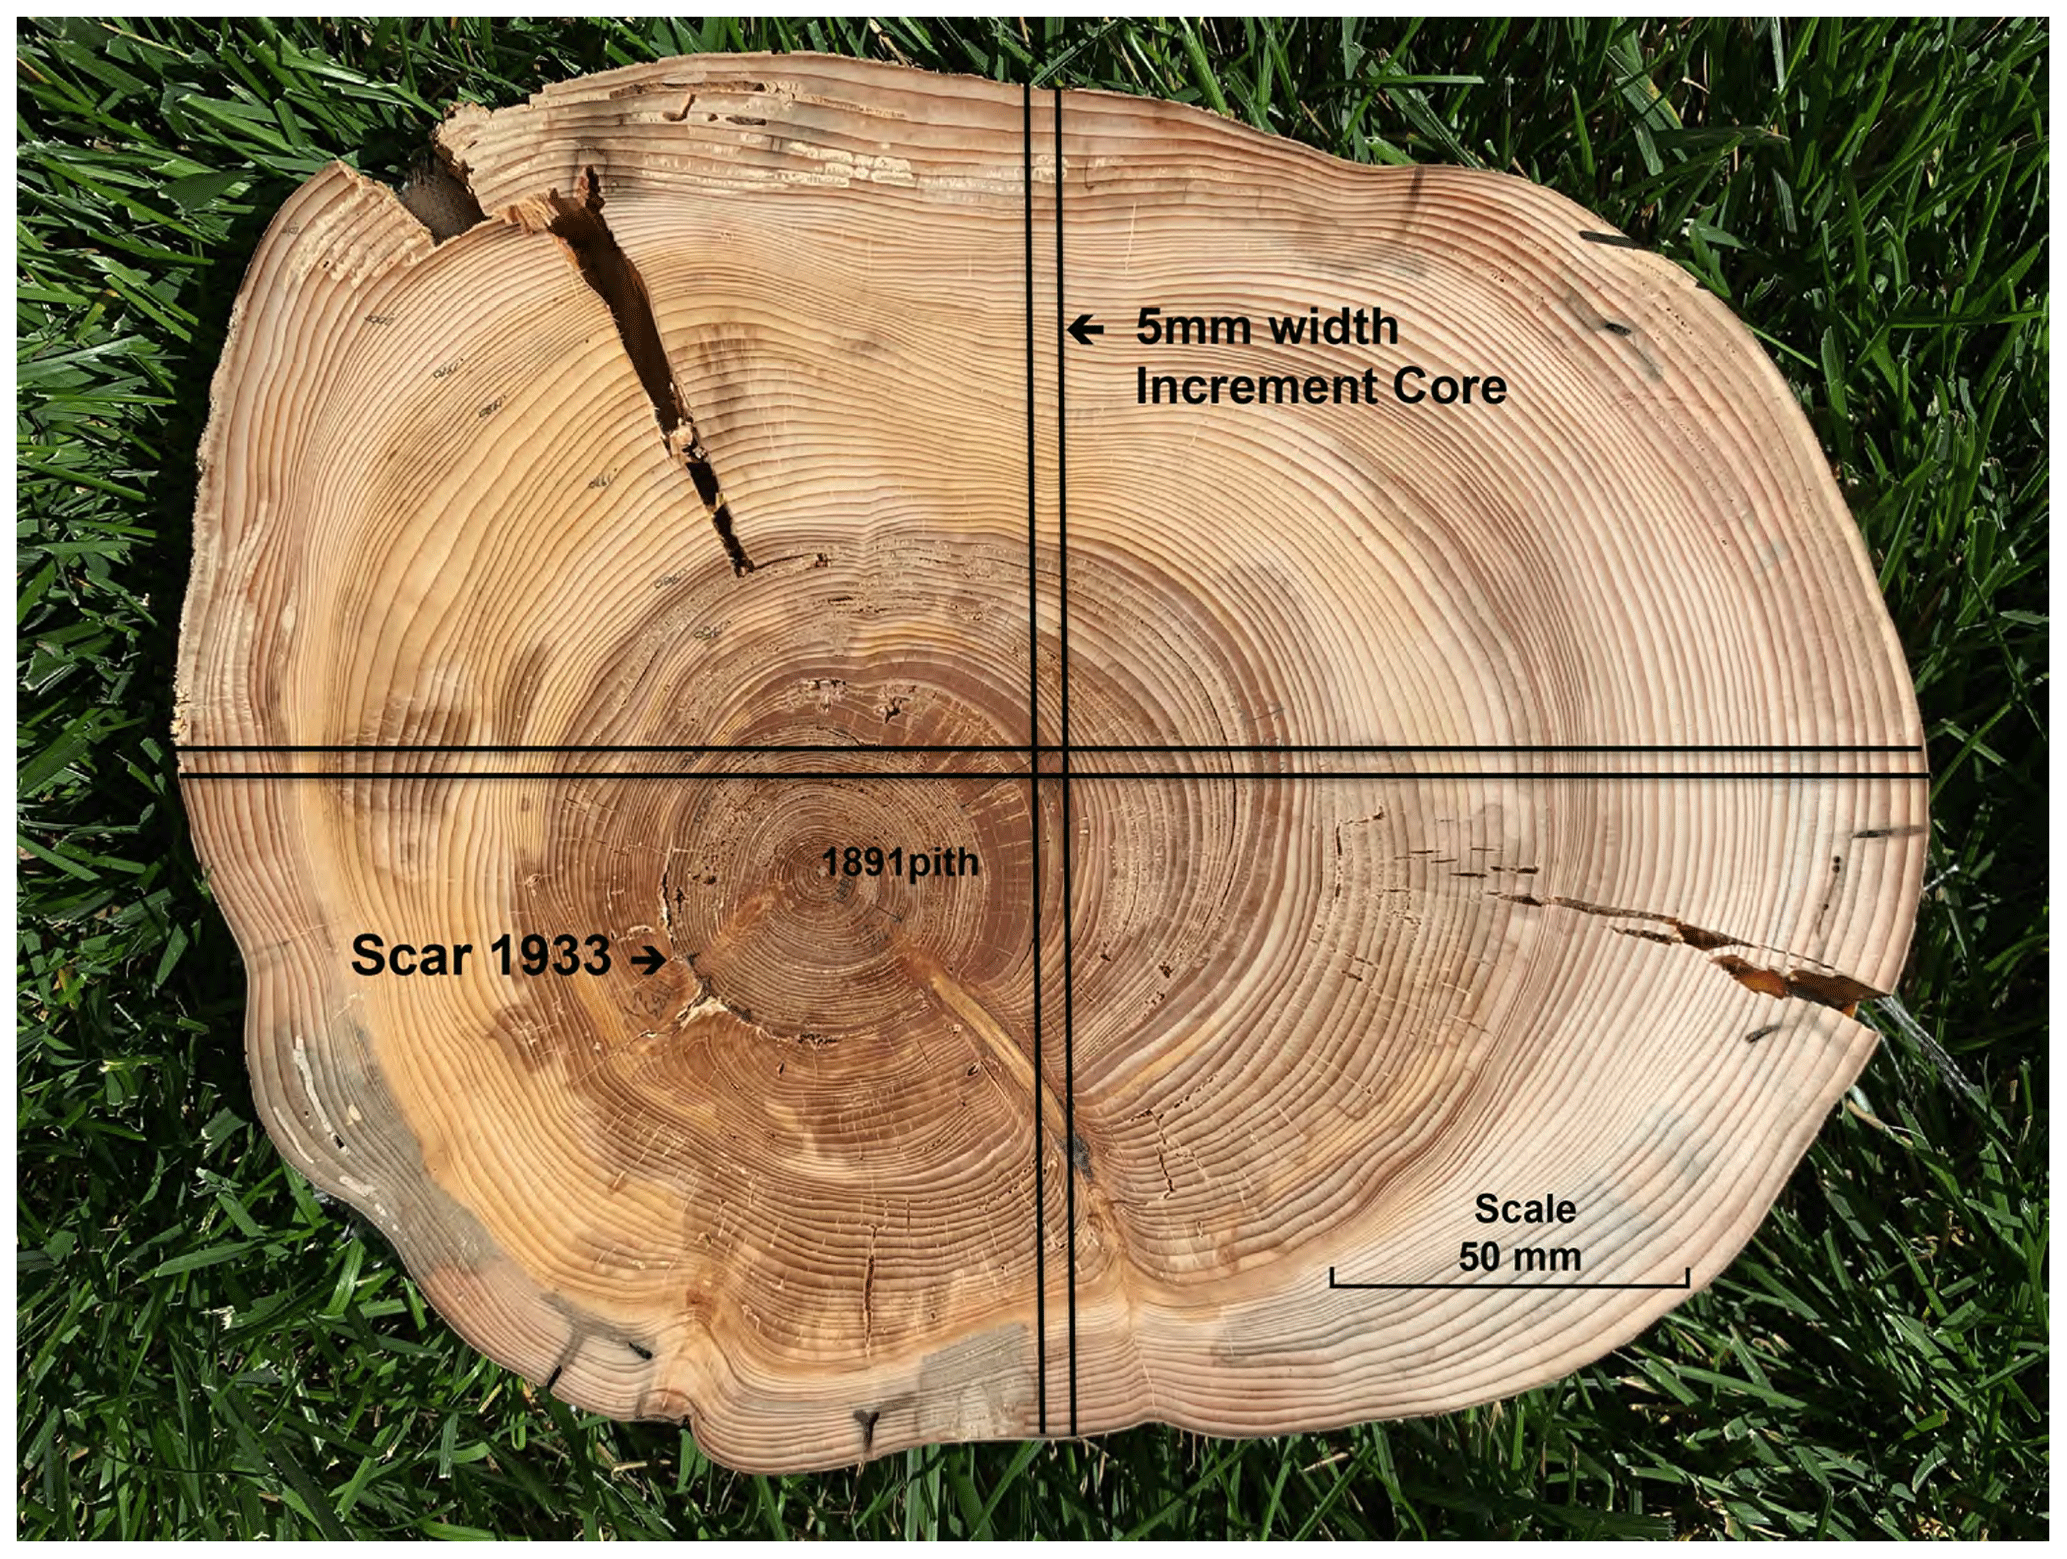
Figure 4Example of cross section sample where four cores taken uphill, downhill, and perpendicular (2) would have missed at least one scar (1933) and potentially the pith of the tree. The black lines indicate the potential cores using a 5 mm width increment borer. Note the scale on lower right of sample.
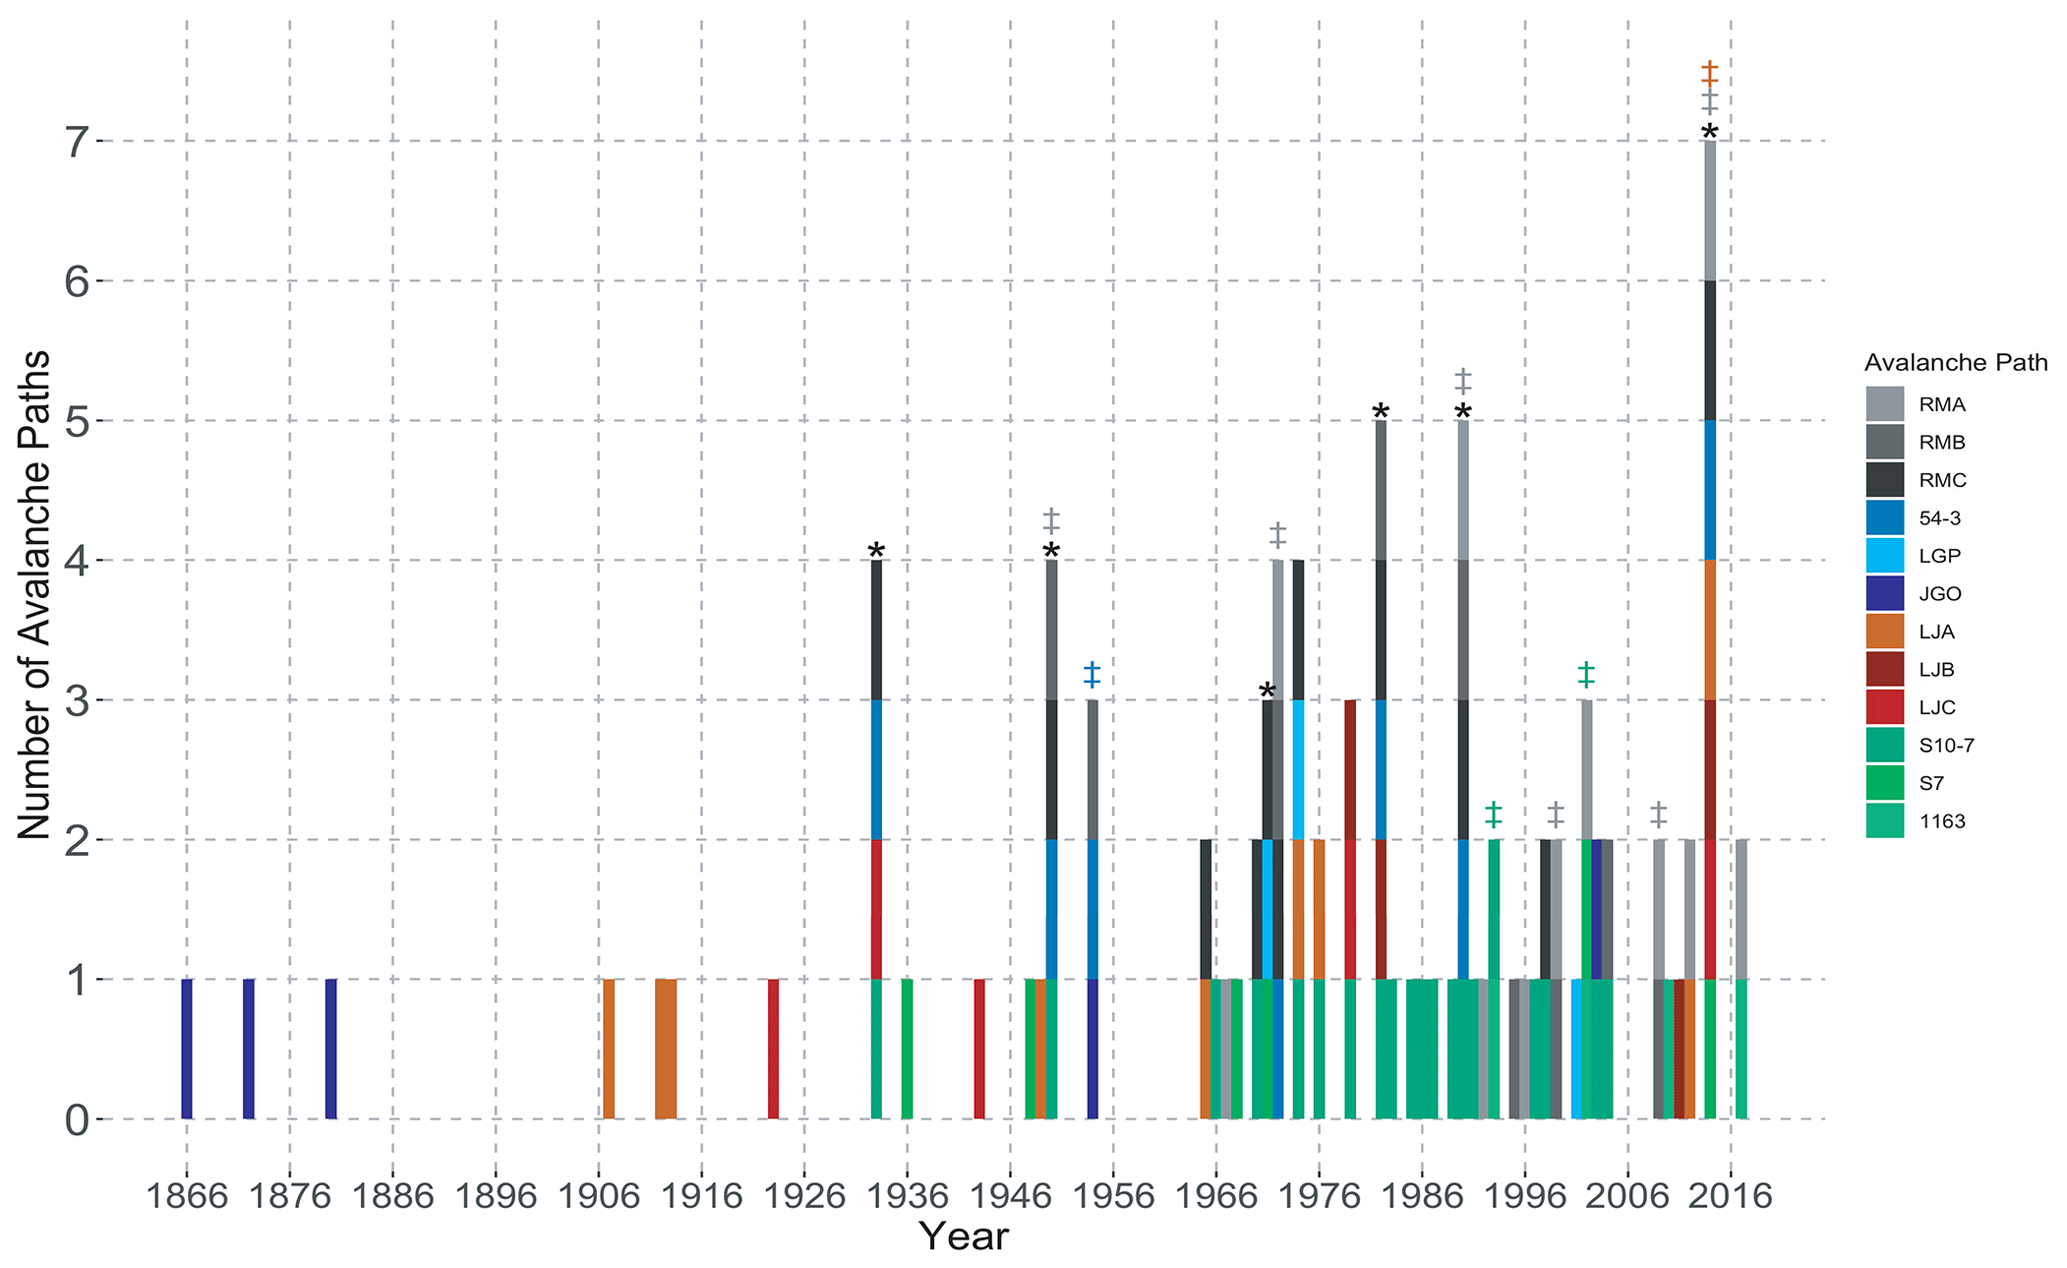
Figure 5Number of individual avalanche paths in which an avalanche event occurred in any given year. Avalanche years with ‡ (gray is WF, dark blue is GTSR, orange is Swan, green is JFS) indicate years identified in at least two avalanche paths in the subregion. The * represents avalanche years in common in at least one path from at least three of the four subregions.
3.2 Individual path chronologies
There were 49 avalanche events identified from GD responses across all 12 individual paths in the study region. The avalanche years most common throughout all of the individual path chronologies were 2014 (seven paths), 1982 and 1990 (five paths), and 1933, 1950, 1972, and 1974 (four paths) (Fig. 5 and Table 3). We identified the year with the greatest number of individual GD responses (2002) in three paths – two from JFS subregion and one in the WF subregion. There was no clear pattern of similarly identified years from paths physically closer in proximity to each other. However, paths within the WF subregion produced the most similar number of large magnitude avalanche years. When we applied the Wit process step, the number of identified avalanche years did not change for any individual avalanche path compared to the application of the double threshold method alone. This highlights the number of responses classified as C1 and C2 (high quality) in our dataset.
Table 3Avalanche chronologies and return interval (RI) statistics of all 12 avalanche paths in the region. Avalanche years in bold indicate years identified in at least two avalanche paths in the subregion. Underlined avalanche years indicate years in common in at least one path from at least three of the four subregions, RI refers to the probability of an avalanche occurring in that avalanche path in any given year, and σ refers to the standard deviation of the RI. The period of record (POR) for each path represents the earliest inner year to the most recent outer year of all raw samples in the path. The RI was calculated on the return interval of avalanche years.
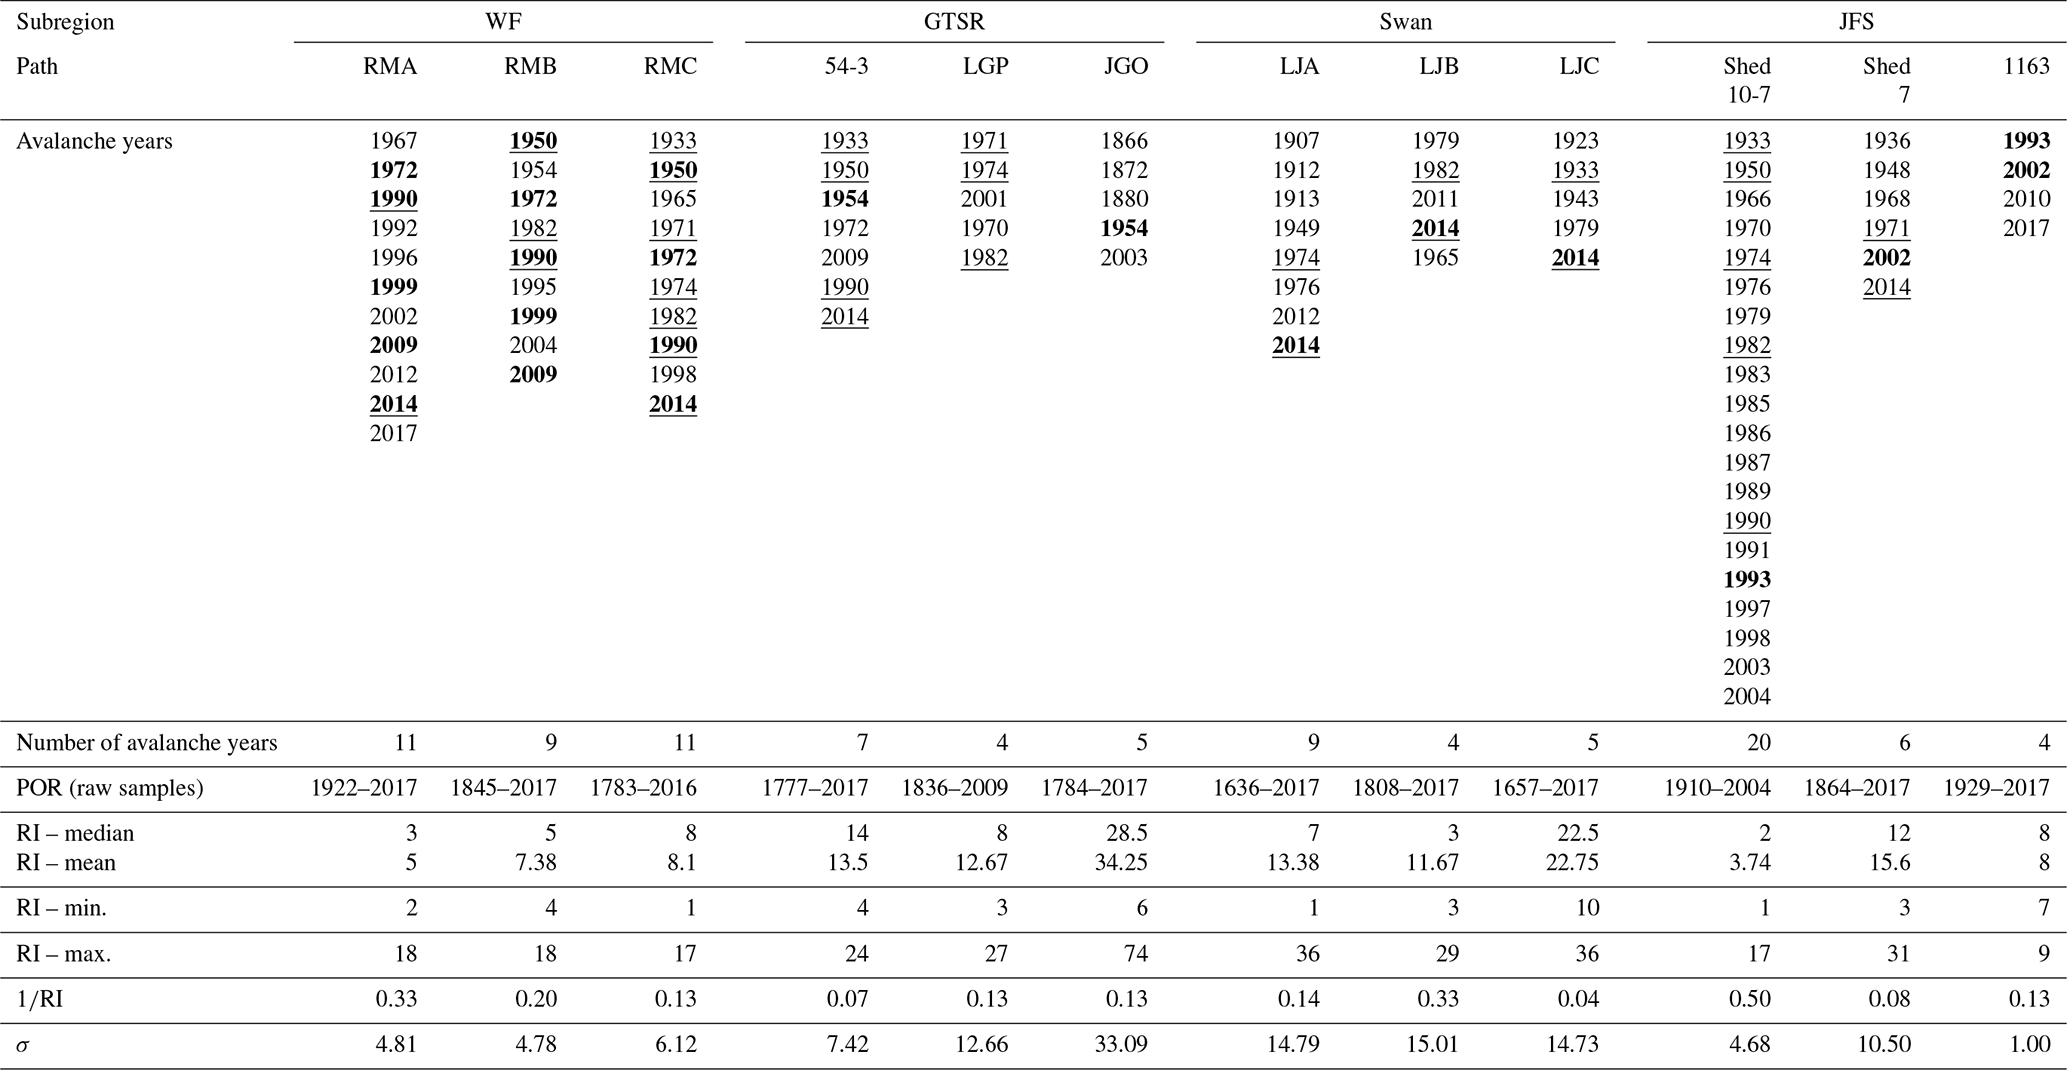
Across all individual paths, the median estimated return interval was 8 years with a range of 2 to 28.5 (Fig. 6). Hereafter return intervals indicate median return intervals unless specified. JGO, located in the GTSR subregion, exhibited the greatest spread in estimated return intervals, followed by LJB. The avalanche paths within the WF subregion had the most similar return intervals of any of the subregions. The return interval for JGO differed significantly from several other paths: RMA, RMB, RMC, and Shed 10-7 (p≤0.01). However, when we relax a strict cutoff of p=0.05, the return interval from JGO also differed from 1163 (p=0.07) and LJA (p=0.08). Similarly, the return interval for Shed 10-7 differed from LJC (p=0.07). In assessing the potential geomorphic controls on return interval, path length was the only significantly correlated characteristic (r=0.65, p=0.02; Fig. A1).
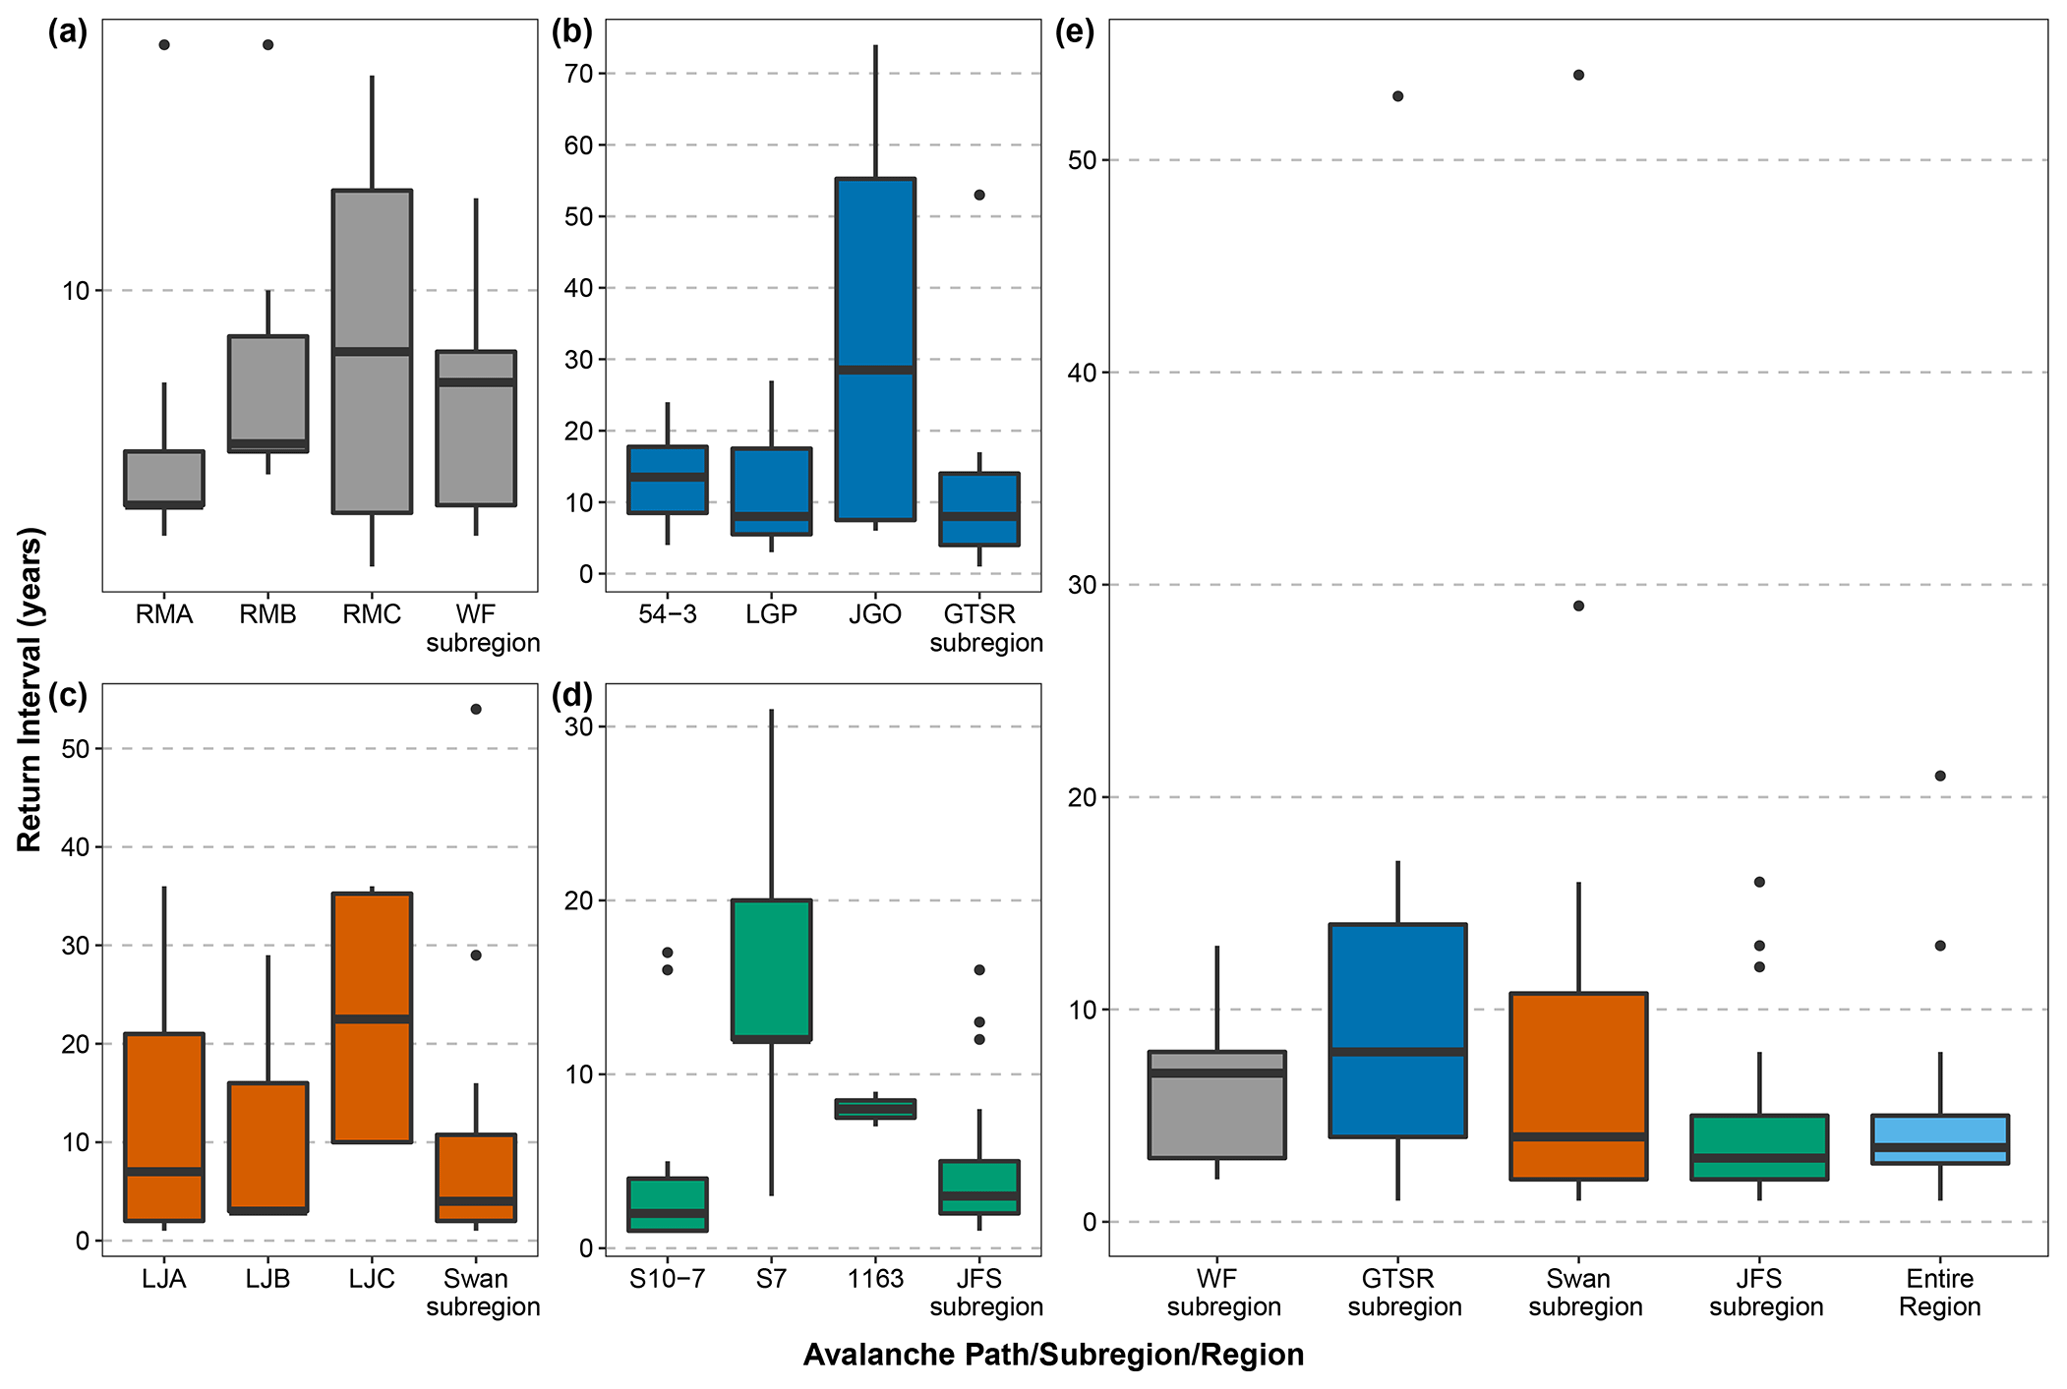
Figure 6Boxplot of return intervals for individual avalanche paths in each subregion: (a) WF, (b) GTSR, (c) Swan, and (d) JFS. Panel (e) shows the boxplots of return intervals for the subregions and the overall region.
We subset the period of record for each path from 1967 to 2017 and compared RI values to the full record. In this subset, nine paths exhibit no change in RI values when compared to the full record. In one path, 54-3, RI values decreased from 14 to 10 years. We observed larger changes in the other two paths: the JGO path had only 1 avalanche year recorded (down from 5 years), and the median RI in LJC changed from 22.5 to 35 years. If we removed 54-3, JGO, and LJC for this comparison, the records from the subset period of record are similar to the complete records for the other paths in the study.
3.3 Subregion chronologies
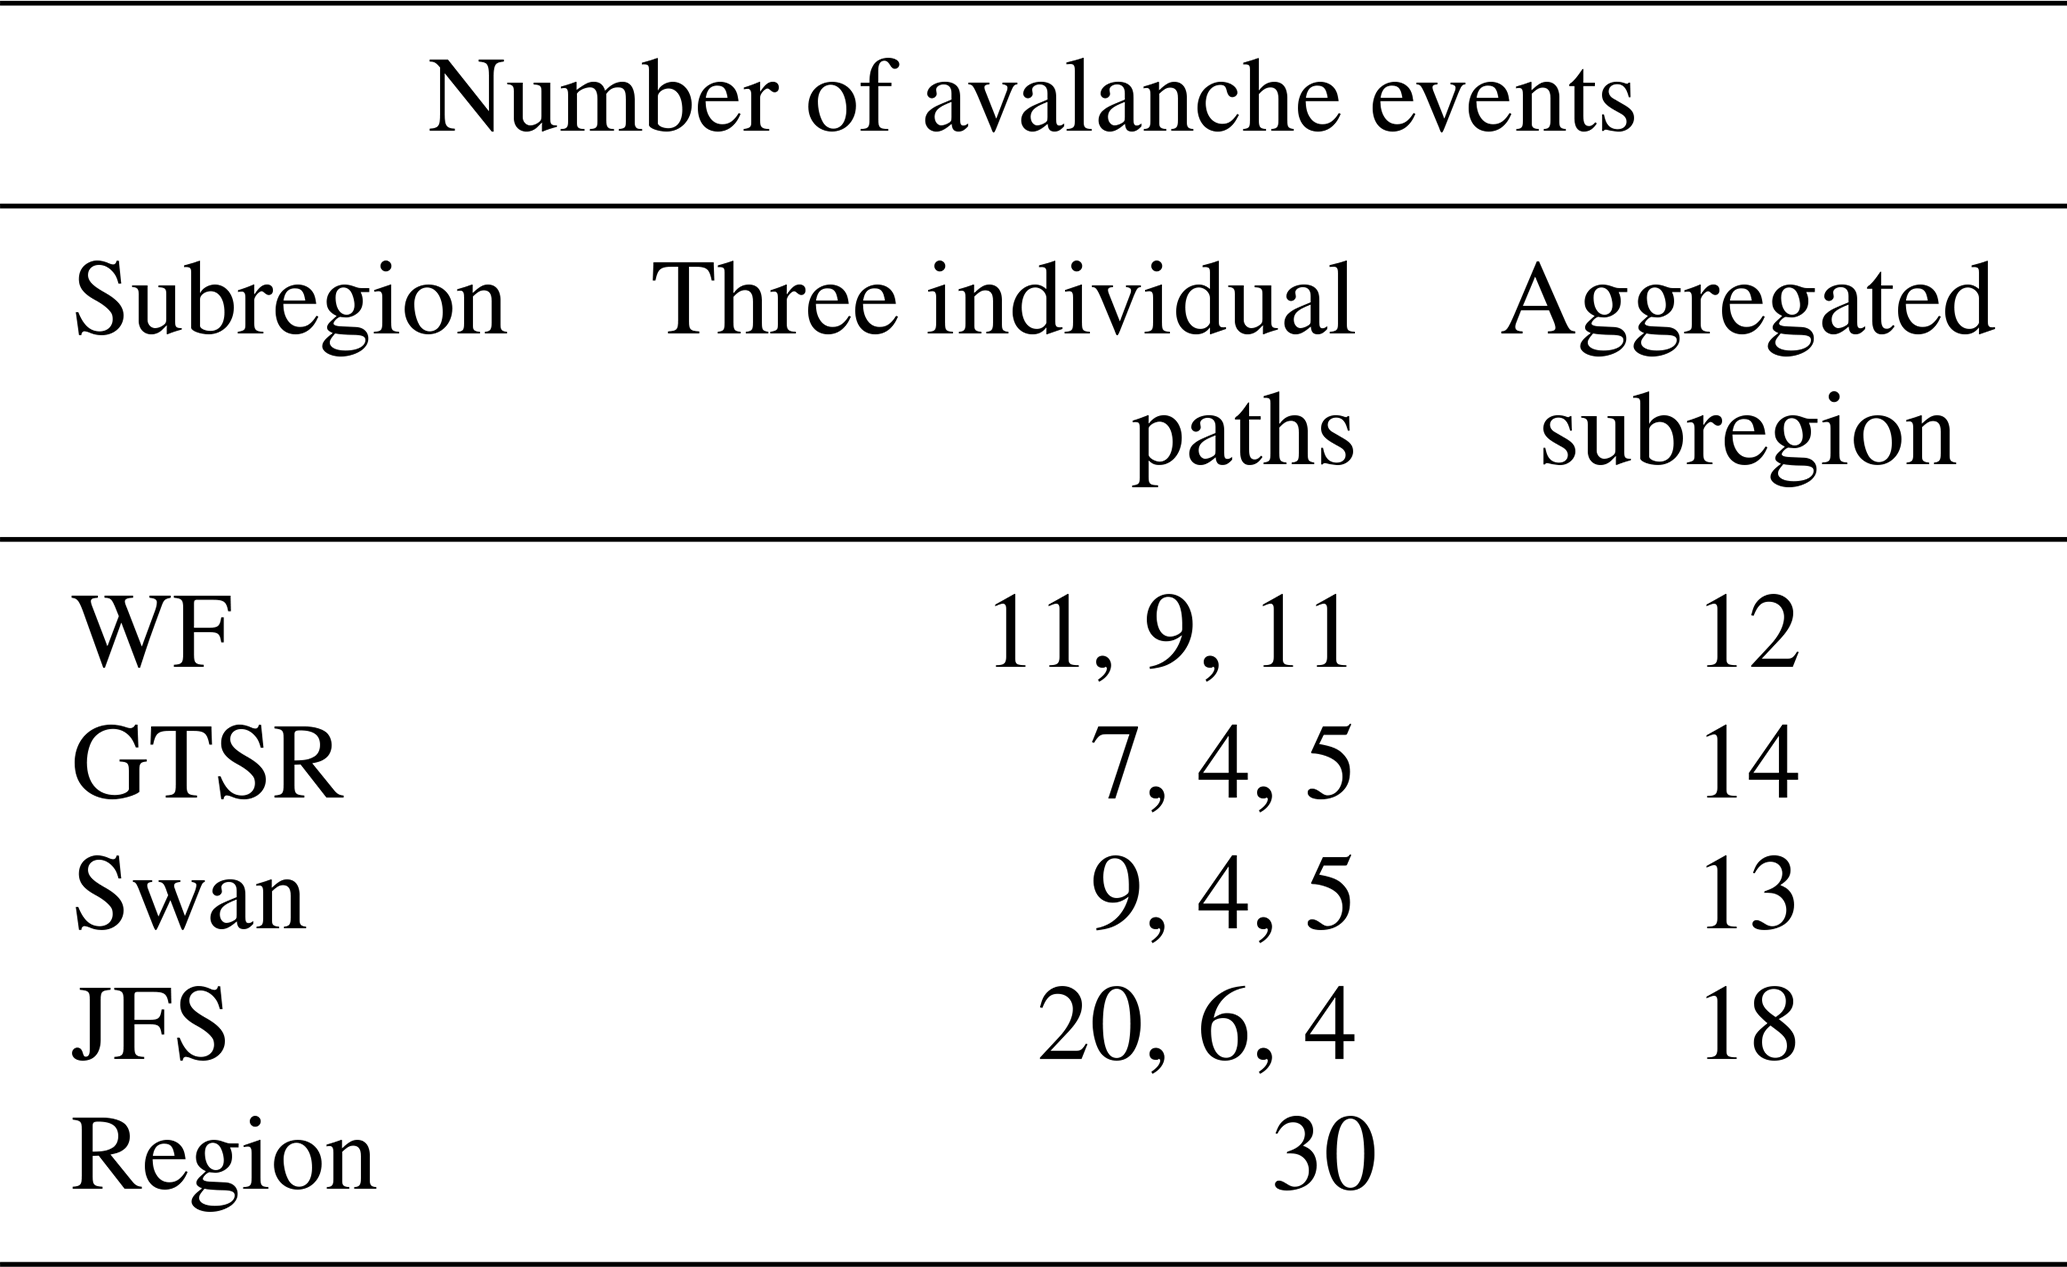
When the paths were aggregated into subregions (three paths per subregion) the median return periods for each subregion were similar and all less than 10 years (Fig. 6e and Table 4). The number of avalanche years for all of the subregions ranges from 12 to 18 with the greatest number of identified years in the JFS subregion and the fewest in the WF subregion. The JFS subregion has the shortest median return interval, followed by the Swan, WF, and GTSR subregions. The number of avalanche years for each aggregated subregion is greater than the number of avalanche years for any individual path within each subregion except for the JFS subregion where 18 avalanche years were identified but Shed 10-7 totaled 20 avalanche years (Table 5).
Table 4Avalanche chronologies and return interval (RI) statistics of all four subregions; RI refers to the probability of an avalanche occurring in that avalanche path in any given year, and σ refers to the standard deviation of the RI.

Table 5Number of avalanche events for each subregion, the mean of three individual paths in each region, and the overall aggregated region.
In terms of commonality of years between the subregions, 1982 is the only year identified in all of the four subregions (Fig. 7). Avalanche years commonly identified in three subregions are 1933, 1950, 1954, 1974, and 2014. We identified the JFS subregion as having the greatest number of years exclusive to that subregion (10 years). The WF subregion shared the greatest number of years with other regions (11 years), followed by JFS (9 years), GTSR (8 years), and the Swan (7 years). In the only available comparison with an incomplete and limited historical record, the individual reconstructed avalanche chronologies of paths in the JFS subregion captured 10 %–50 % of the recorded large magnitude events over the years 1908 to 2017.

Figure 7Venn diagram of avalanche years common between subregions. Overlapping areas of each ellipse indicate years in common with each subregion.
3.4 Regional chronology and RAAI
We identified 30 avalanche years in the overall region and a median return interval of 3 years (Table 5). The number of samples increases through time to a peak during 2005, and as expected, the number of GDs also increases through time (Fig. 8a). The Wit index also increases particularly from the year 2000 onward with the largest spikes in 2014 and 2017 (Fig. 8b). The regional assessment of avalanche years identified fewer years (n=30) than the simple aggregation of all unique avalanche years identified in the individual paths (n=49) (Table A2).
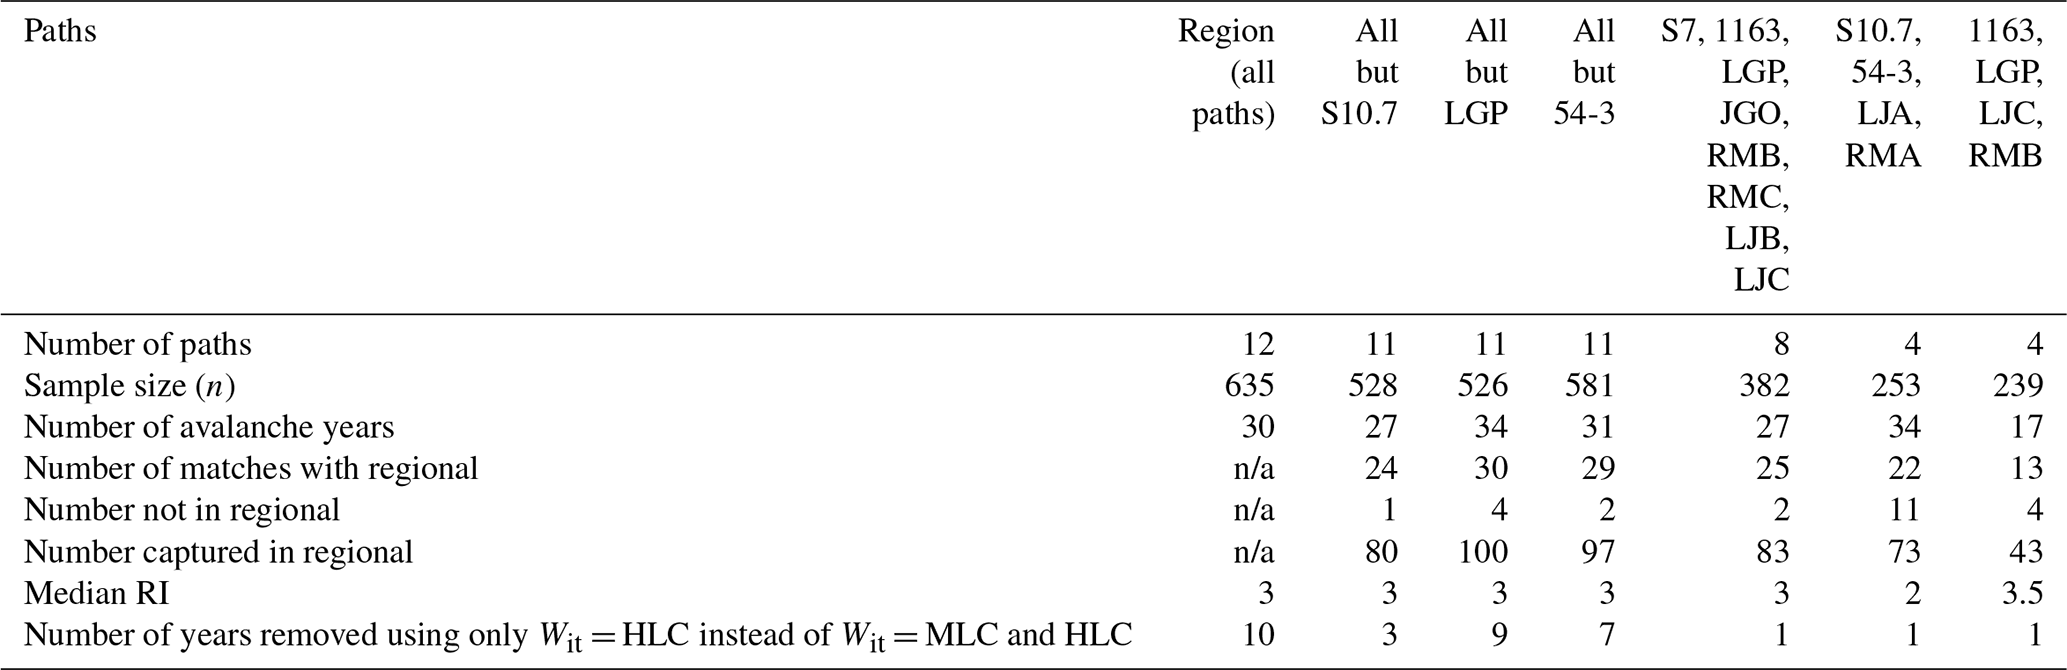
Table 6Comparison of the number of avalanche years and return intervals (RIs) when including all 12 paths in the region to using a combination of fewer paths to define the region. HLC signifies a high level of confidence and MLC a medium level of confidence as per Favillier et al. (2017, 2018). “Number not in regional” refers to avalanche years identified in that particular combination of paths but not identified in the regional record.
n/a stands for not applicable.
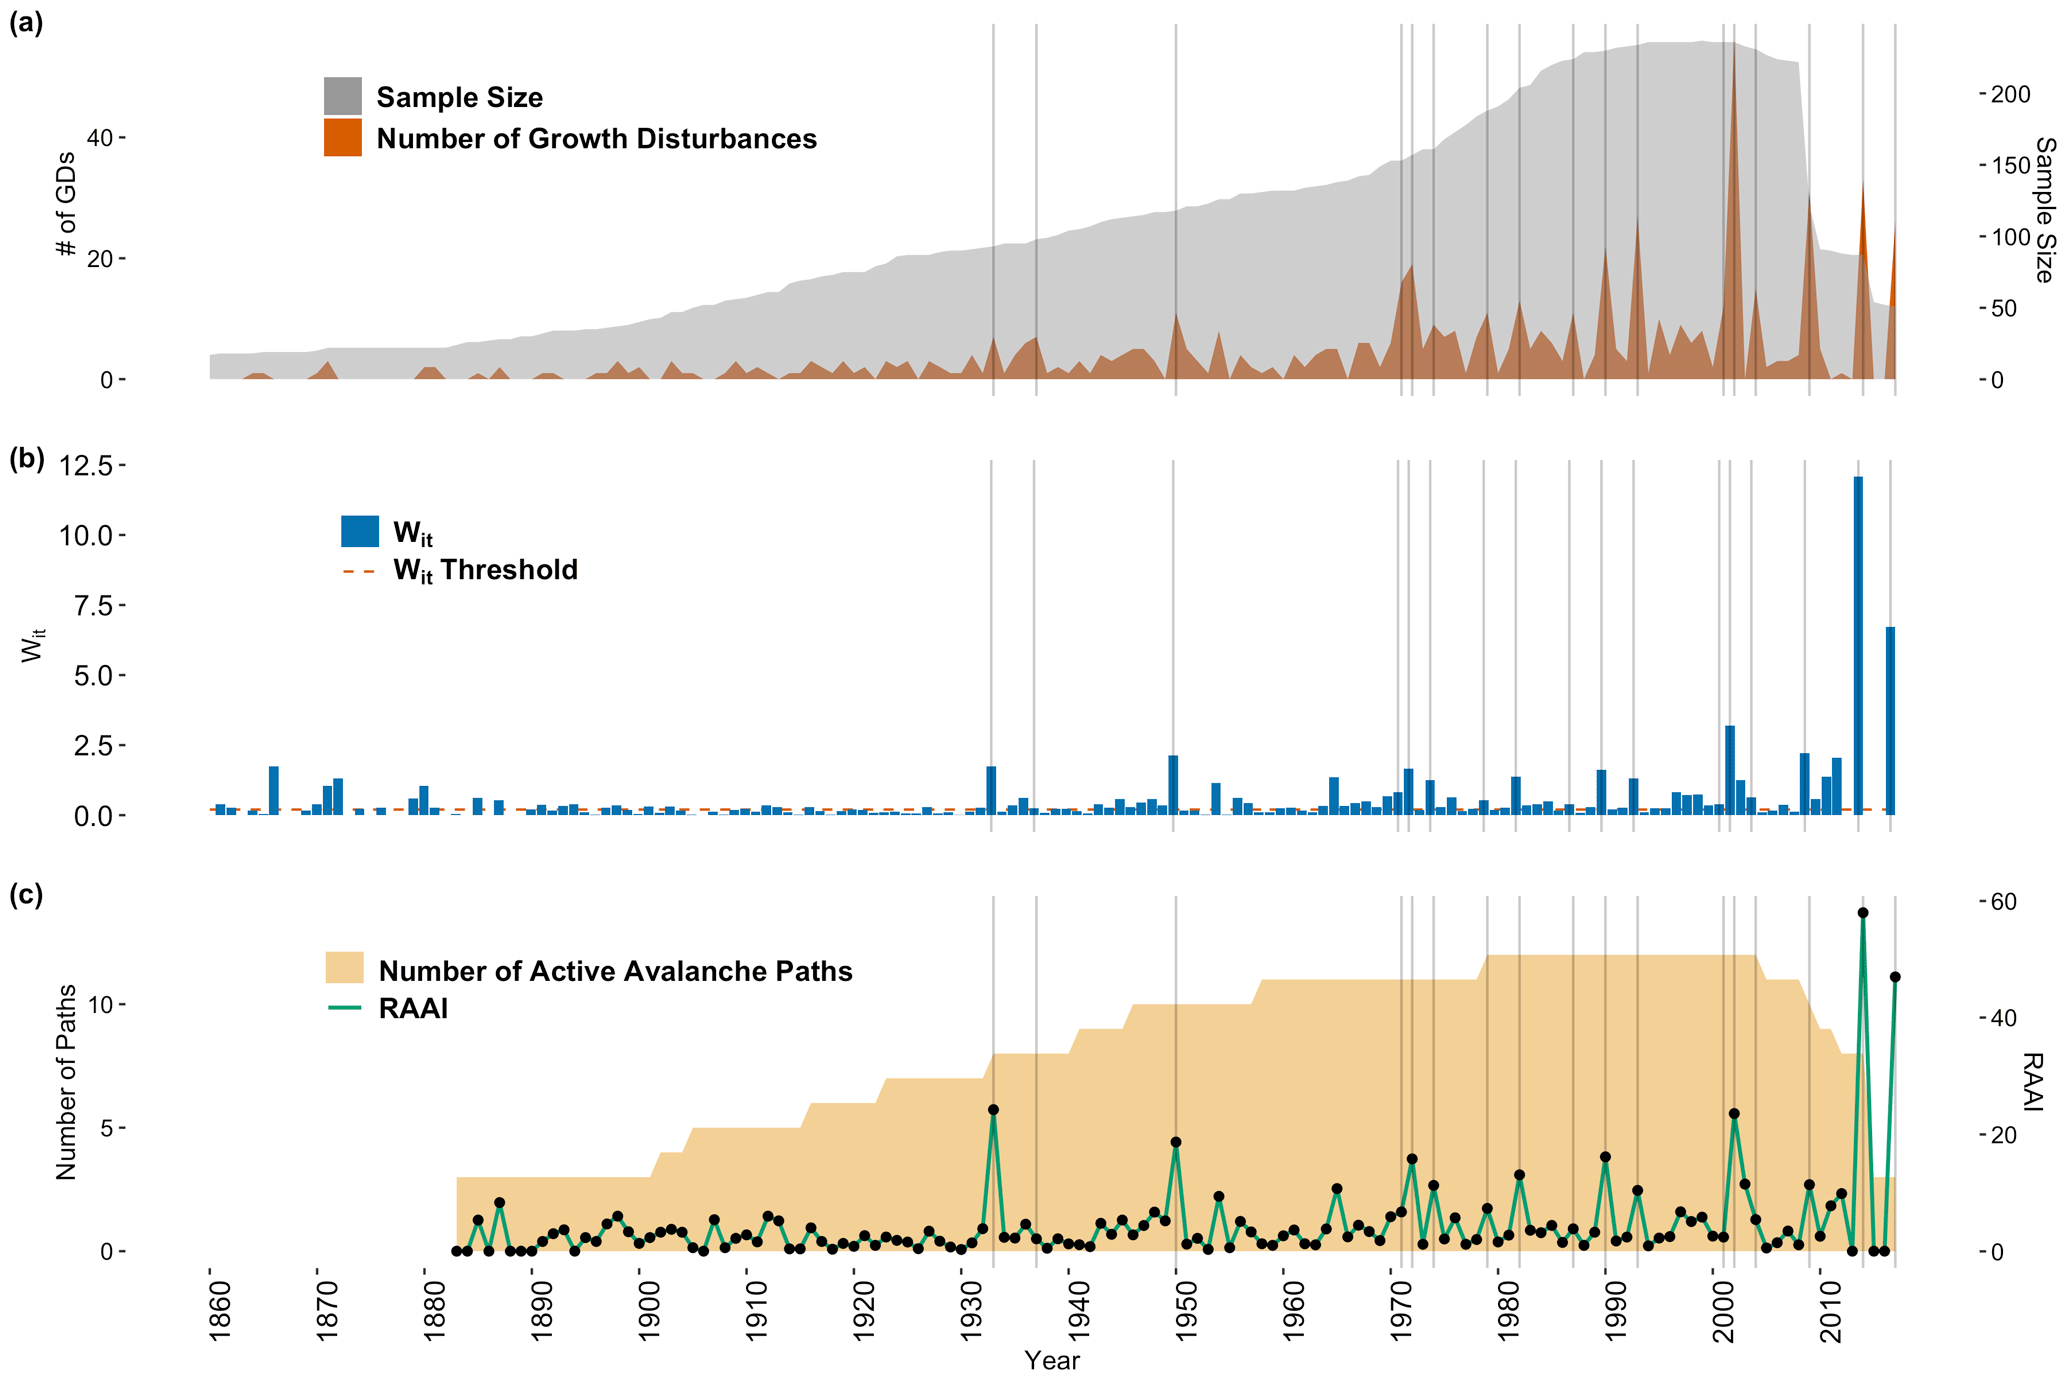
Figure 8(a) The number of samples (gray shaded area) increases through time, but the number of responses (dark orange shaded area) varies. Note that sample size is on a secondary (right) y axis. (b) The Wit, a weighted index factor that accounts for the class of each growth disturbance, threshold (0.2; dashed red line) provides a means of discriminating between high and low confidence signals in the tree-ring record. (c) The regional avalanche activity index (RAAI) (green line, black points) is a measure of regional avalanche activity based on the It, the ratio of trees exhibiting growth disturbances over the number of samples alive in year t, of each path and the number of active avalanche paths (yellow shaded area). Note RAAI is on a secondary (right) y axis.
When we included all paths but S10.7 (one of two paths with the greatest sample size), we captured 80 % of all avalanche years and added 1 new year to the chronology (Table 6). When we removed LGP (the other path with the greatest size of sampled trees), we still captured all of the years in the regional chronology but introduced 4 new years into the chronology for a total of 34 years. A random sample of 8 (2 from each subregion) of the 12 avalanche paths captured 83 % of the years in the chronology and identified 2 new avalanche years. Finally, when using only one path from each subregion with the largest sample size (Shed 10-7, 54-3, LJA, and RMA), we captured 73 % of the avalanche years identified in the full regional chronology. When using a random sample of one path from each subregion (1163, LGP, LJC, RMB), we captured only 43 % of the years included in the regional chronology of all 12 paths. The RAAI is insensitive (no significant difference, p>0.05) to the number of paths when tested using a minimum number of paths recording an avalanche in year t. The years with the largest RAAI are 2014 and 2017, followed by 2002, 1950, and 1933 (Fig. 8c).
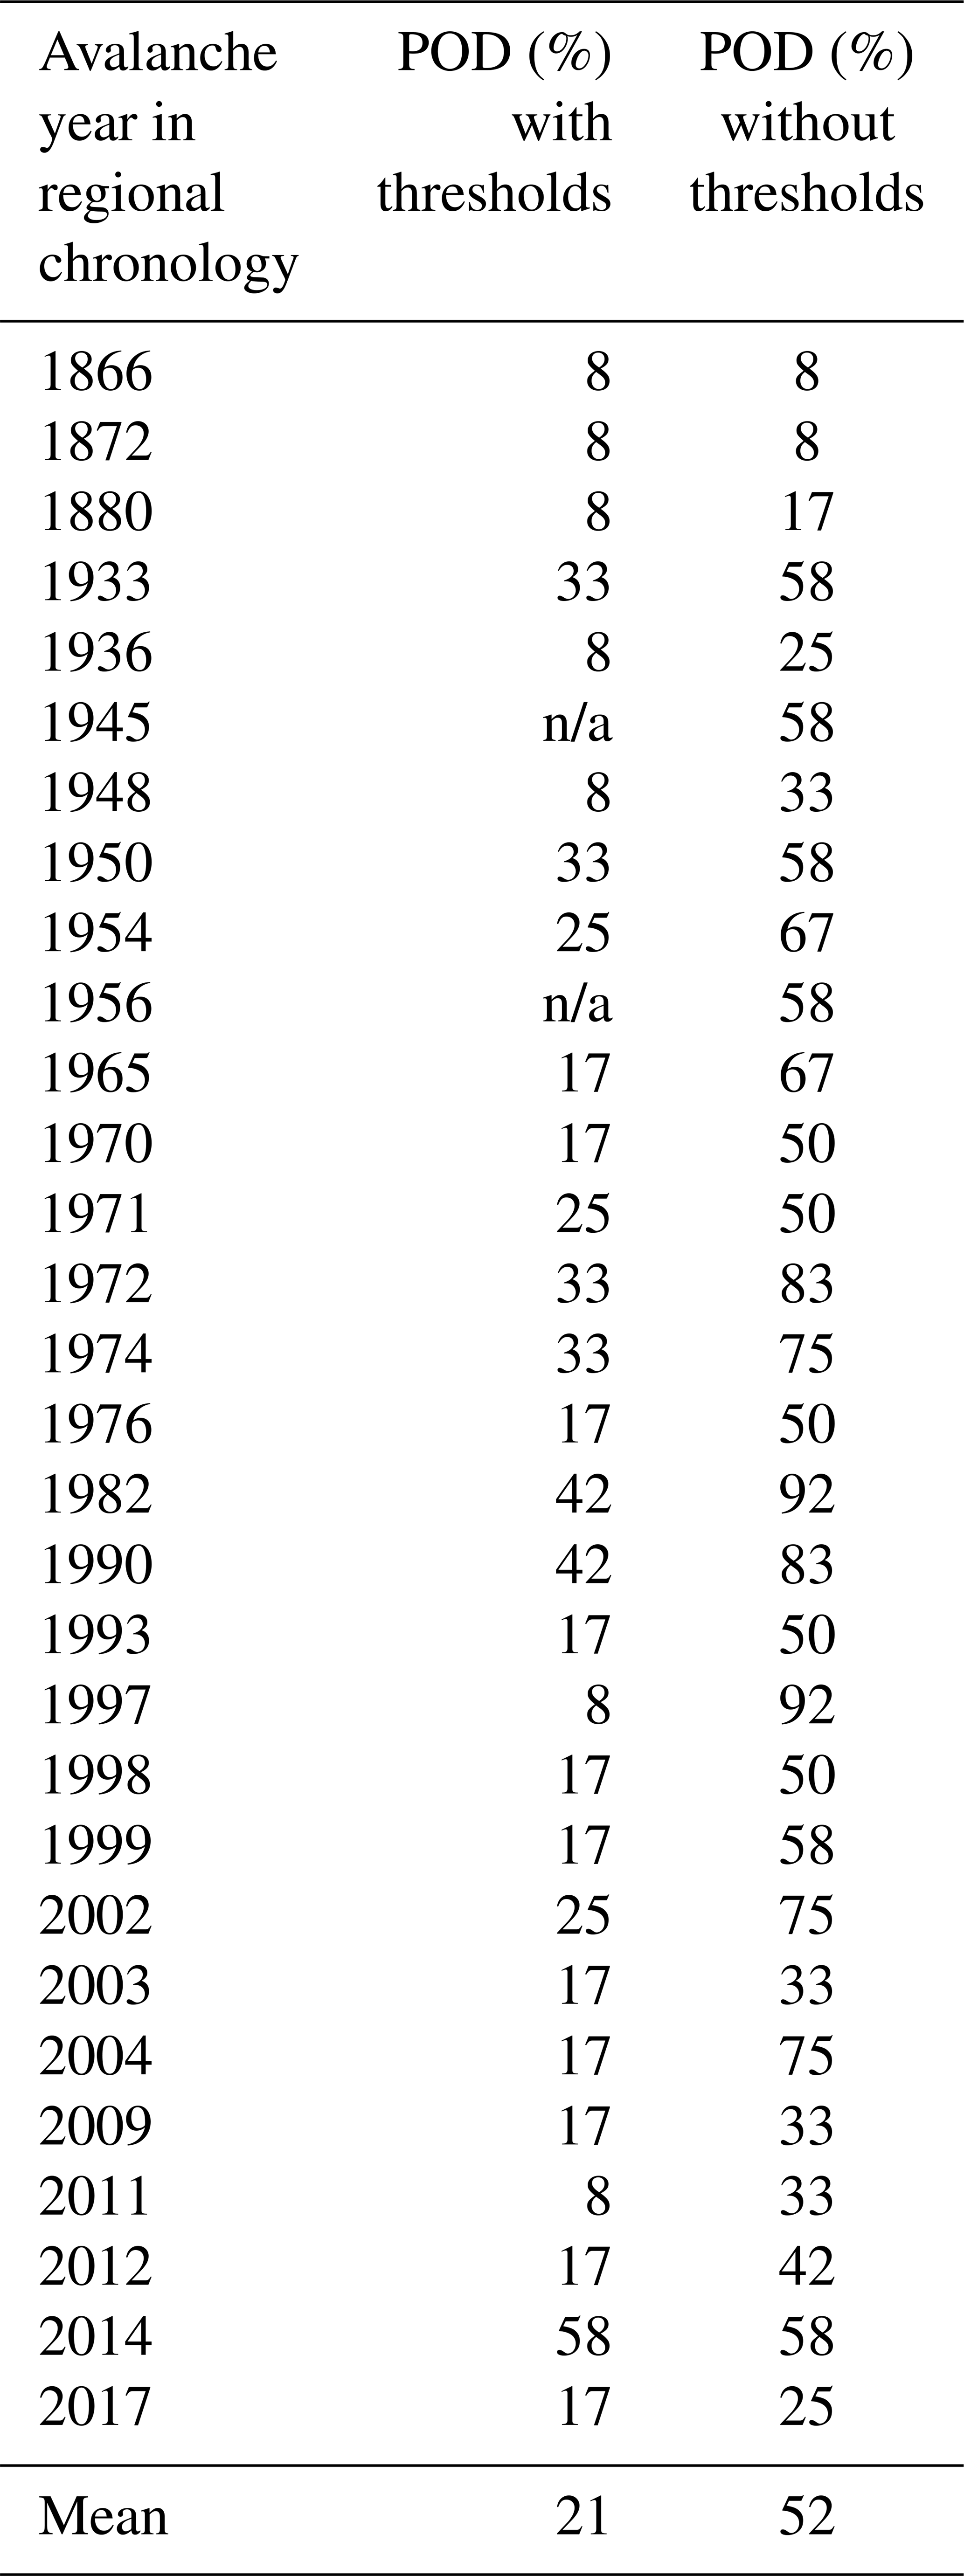
The probability of detection for the avalanche years (PODyear) identified in the regional chronology ranged from 8 % to 58 % when we examined individual paths (Table 7). The year with the highest POD was 2014. The mean POD for all years was 21 %. When we examined avalanche paths that exhibited at least one GD during the avalanche years identified in the regional chronologies (i.e., no thresholds used), the POD is generally greater.
Table 7Probability of detection (PODyear). Avalanche years identified in the regional chronology and associated POD by analyzing individual paths with and without growth disturbances (GDs), sample size, and Wit thresholds.
n/a stands for not applicable.
Finally, the probability of capturing all of the avalanche years identified in the regional chronology by each individual path ranges from 7 % to 40 % (Table 8). The greatest PODpath value from any given path is S10.7 (POD=40 %) in the JFS subregion, followed by RMC in the Whitefish subregion (POD=37 %). In general, the paths within the Whitefish subregion capture the regional chronology most consistently.
Table 8Probability of detection of each individual path (PODpath) to the regional avalanche chronology.
The processing and analysis of 673 samples spanning a large spatial extent allowed us to create a robust regional large magnitude avalanche chronology reconstructed using dendrochronological methods. Cross sections provided a more robust and complete GD and avalanche chronology compared to a subsample generated from cores alone. Due to the reduced information value of working only with cores, Favillier et al. (2017) included a discriminatory step in their methods to distinguish avalanche signals in the tree-ring record from exogenous factors, such as abnormal climate signals or response to insect disturbance. By using cross sections to develop our avalanche chronologies, we were able to view the entire ring growth and potential disturbance around the circumference of the tree as opposed to the limited view provided by cores. This allowed us to place GD signals in the context of both climate and insect disturbances without the need for this processing step. We do not discount any studies that use cores for reconstructing avalanche chronologies and understand there are sampling limitations from environmental and policy perspectives in different regions, as well as financial and processing constraints. However, we are suggesting that if the ability to collect cross sections exists, then it is advantageous to collect them.
We targeted sample collection in the runout zones and along the trim line where large magnitude avalanches occurred in recent years. At several sites, we collected samples at the upper extent of the runout zones (S10.7, Shed 7, and 1163). Thus, some additional noise in the final chronology for those specific paths could be due to more frequent small magnitude avalanches. Though the oldest individual trees extended as far back as the mid-17th century, the application of the double thresholds processing steps restricted individual avalanche path chronology lengths since the minimum GD threshold requirements were not met. It is difficult to place confidence in these older recorded events due to the decreasing evidence back in time inherent in avalanche path tree-ring studies. Therefore, we chose to examine more recent time periods dictated by the avalanche years identified through the double threshold methods.
All of the paths in the study are capable of producing large magnitude avalanches with path lengths greater than 100 m (typical length for avalanche destructive size 2, D2), and all but RMC have a typical path length of close to or greater than 1000 m (for avalanche destructive size 3, D3) (Greene et al., 2016). As Corona et al. (2012) noted, the avalanche event must be large enough to create an impact on the tree, and size D2 or greater will be evident from the tree-ring record (Reardon et al., 2008). However, the successive damage and removal of trees from events sized D2 or greater also impacts the future potential to record subsequent events of similar magnitude. In other words, if a large magnitude avalanche removes a large swath of trees in 1 year, then there are fewer trees available to record a slightly smaller magnitude avalanche in subsequent years. Therefore, dendrochronology methods inherently underestimate avalanche events by up to 60 % (Corona et al., 2012).
4.1 Regional sampling strategy
By examining three different spatial scales (individual path, subregion, and region), we produced a large magnitude avalanche chronology for the region captured in a small subset of the total number of paths across the large region. Accordingly, this sampling strategy may also alleviate the issue of recording large magnitude avalanches within a region in the successive years following a major destructive avalanche event that removed a large number of trees within specific paths but not others. Overall, a regional sampling strategy enables us to capture large magnitude avalanche events over a broad spatial extent, which is useful for regional avalanche forecasting operations and future climate association analysis. This strategy also allows us to understand large magnitude avalanche activity at scales smaller than the regional scale.
4.2 Chronologies for individual paths and subregions
We applied the Wit threshold specifically to weight higher-quality responses. The number of identified avalanche years does not change for any individual avalanche path when we applied the Wit process. This lack of change suggests that many of the responses in our samples were ranked as high quality (i.e., C1 and C2). The high quality of responses can be attributed to the use of cross sections which allowed for a more complete depiction and assessment of the tree-ring signal (Carrara, 1979). Scarring comprised the majority of C1 samples, and evidence of scarring in lower-quality classification was due to other types of small cambial tissue scars that could not be confidently classified as avalanche damage. The reaction wood in C1 GDs was associated with obvious avalanche scars in the same year.
We developed avalanche chronologies for 12 individual avalanche paths. The path with the greatest number of identified avalanche years, S10.7, contains two major starting zones that are both steeper (35 and 39∘) than Shed 7, which also contains two separate starting zones. Reardon et al. (2008) collected a substantial number of samples at higher elevations in the S10.7 avalanche path. However, the location data for these samples were not available. Many of those samples were the living stumps that captured smaller annual events. This is likely the root of the difference between S10.7 and the other paths in this study and the reason this path contains the largest numbers of avalanche years in this analysis.
The range of return intervals across all paths (2–28.5 years) is similar to those reported for 12 avalanche paths across a smaller spatial extent in the Chic-Choc Mountains of Québec, Canada (2–22.8 years) (Germain et al., 2009). Although the authors in that study used a different avalanche response index, their study still suggests considerable variation in avalanche frequency across avalanche paths within a region.
The results from examining return intervals during a truncated period from 1967 to 2017 across all paths illustrate that several of the individual path return interval results should be treated with caution (e.g., JGO, LJC, and 54-3). The difference in minimum and maximum return interval values is a function of a decreasing sample size back in time. The minimum return interval values in many of the paths are concentrated during recent periods. This is a limitation of using dendrochronology to estimate return intervals. Comparing avalanche return intervals across individual paths should also be treated with caution given the variable nature of sample availability across paths. This variability across individual paths further provides reasons to evaluate the number of paths necessary to create a regional avalanche chronology from tree rings. Most of the paths have a reasonable record over this truncated period and also highlight the importance of strategic sampling in numerous avalanche paths. While dendrochronology underestimates avalanche activity, we show that sampling enough paths across a region provides a reasonable estimate of avalanche activity at this scale.
JGO contains the maximum return interval for any path in the study, and the return intervals are significantly different from numerous other paths. A lack of recording data after one large avalanche event could easily skew this value. To understand if this value is accurate, we would have to sample adjacent tracks to determine if the return intervals are similar or not. An appropriate sample base without large temporal gaps is necessary to fully provide an accurate estimate of return intervals within a single avalanche path. While the sample size is sufficient for this individual path, the results should be treated with caution due to the temporal gaps. In other words, the large return interval values may reflect the irregular preservation of evidence for large avalanches as opposed to an accurate estimate of return intervals. Therefore, we cannot fully explain the large maximum return interval for this path.
The return intervals for LJC in the Swan subregion were the greatest in this subregion, and this is likely due to wildfire activity in this path in 2003. LJC was heavily burned, and this created a steep slope with few trees that was once moderately to heavily forested. Substantial anchoring and snowfall interception likely created an avalanche path that did not have many large magnitude avalanches for decades since slope forestation plays a substantial role in runout distance and avalanche frequency in forested areas (Teich et al., 2012). In addition, wildfires in 1910 burned a majority of the JFS subregion as well, and the higher frequency of avalanche years recorded between 1910 and 1940 in S10.7 suggests wildfire impacts may also be a contributor to the high frequency of avalanche events in that location (Reardon et al., 2008). Additionally, the fire in LJC may also have removed evidence of previous avalanche activity.
Our results also suggest that return interval increases as path length increases, though the sample size for this correlation analysis on individual paths is small (n=12). This result is likely because only very large magnitude avalanches affect the far extent of the runout of the paths. This finding differs from a group of avalanche paths in Rogers Pass, British Columbia, Canada, where path length was not significantly correlated with avalanche frequency (Smith and McClung, 1997). However, that study used all observed avalanches, including artillery-initiated avalanches, as opposed to a tree-ring reconstructed dataset.
The greatest number of identified avalanche years is in the JFS subregion. The avalanche paths in this subregion are all southerly or southeasterly facing, whereas the other subregions span a greater range of aspects. This narrow range of aspect may cause a bias toward overrepresentation of those aspects compared to the inclusion of other aspects in other subregions.
The differences between individual avalanche paths, as well as subregions, are likely due to localized terrain and weather/climate factors and the interaction of the two (Chesley-Preston, 2010), as well as local avalanche, forest stand, and fire history. For example, Birkeland (2001) demonstrated significant variability in slope stability across a small mountain range dependent upon terrain and weather. Slope stability and subsequent large magnitude avalanching are likely to be highly heterogeneous not only across the subregion but across a large region. This is also consistent with findings by Schweizer et al. (2003) that suggest substantial differences in stability between subregions despite the presence of widespread weak layers. Finally, climate drives weather but is not a first-order effect on avalanche occurrence in any one given avalanche path. In this study, we derived a regional avalanche chronology to provide a spatial scale that aligns more with the spatial scale of climate drivers than any one individual path. These are relationships that should be examined in future work.
4.3 Regional chronologies and RAAI
The regional chronology we developed through the use of tree-ring analysis on collections made across 12 avalanche paths suggests, unsurprisingly, that the inclusion of more avalanche paths across a large spatial extent produces a more robust identification of major avalanche winters. When we aggregate all 12 paths together and apply thresholds to discriminate the signal from the noise, we identified 30 avalanche years throughout the region. This type of analysis allows us to place each avalanche year in the context of the region or the full extent of the scale triplet rather than simply collating all major avalanche winters identified in each individual path or subregion. However, we also account for the support and spacing by including adjacent avalanche paths within a subregion and multiple subregions throughout the region. This sampling strategy combined with the large sample size collected throughout the region allowed for a robust assessment of a regional avalanche chronology derived from tree-ring records.
We tested the sensitivity of the term regional by removing specific and random paths. Our results suggest that removing paths from this structure, and subsequently compromising the sampling strategy, introduces noise. By reducing the sample size, we reduce the ability of the thresholds to filter out noise, thereby increasing the actual number of avalanche years in the region. However, the sample size reduction also reduces the number of identified avalanche winters common to the full 12 path regional record (Table 6). Our results emphasize the importance of sampling more paths spread throughout the region of interest, as well as a large dataset across the spatial extent.
Avalanche path selection is clearly important when trying to assess avalanche frequency (de Bouchard d'Aubeterre et al., 2019). The importance of path selection is supported by our results suggesting that S10.7 is more influential than any other path in our study (Table 6), which is also illustrated by the large number of avalanche years detected in S10.7 due to increased sampling in the track. However, by selecting multiple paths representative of the range of geomorphic and potentially influential local weather controls throughout the region, we are able to provide a reasonable assessment of regional avalanche activity in areas without historical records. By quantifying the sensitivity of the number of avalanche paths within a given region, we illustrate that sampling a greater number of avalanche paths dramatically increases the probability of identifying more avalanche years and increases the ability to reconstruct major widespread avalanche events. However, as previously noted, dendrochronological techniques tend to underestimate avalanche frequency, which implies that caution should be used when interpreting a regional avalanche signal using this technique, particularly as sample numbers and qualities (e.g., cores versus cross sections) decline.
Interestingly, the difference in median return interval throughout the “region” using 12 paths compared to using 4 or 8 paths changes only slightly, suggesting that fewer paths are still able to represent the major avalanche return intervals across a region. However, choosing fewer paths appears to introduce more noise and therefore fewer years identified than a regional chronology with more avalanche paths.
The RAAI provides a measure of avalanche activity scaled to the number of active avalanche paths across the region through time, but RAAI is limited by the decreasing sample size back in time. The years with the greatest RAAI value coincide with substantial activity provided in the historical record, as well as previous dendrochronological studies from the JFS subregion (Butler and Malanson, 1985a, b; Reardon et al., 2008). The winter of 1932–33 was characterized by heavy snowfall and persistent cold temperatures leading to extensive avalanche activity that destroyed roadway infrastructure in the JFS subregion, 1950 saw a nearly month-long closure of US Highway 2 due to avalanche activity, and in 2002, an avalanche caused a train derailment. While these are all confined to the JFS subregion, with the exception of 2002, they are also years shared by at least two other subregions.
We examined the probability of detecting an avalanche year throughout the region by sampling any one given path. In 7 of 30 years, the PODyear is only 8 %, and in all but 3 years, the PODyear is less than 40 %. The low POD values are distributed throughout the time series, suggesting decreasing sample size back in time and the number of active avalanche paths are not influential factors. The POD is likely reflective of the spatial variability in large magnitude avalanche occurrence across a region. It also aligns with the observational findings of Mears (1992). During a major storm in 1986 throughout much of the western United States that deposited 30–60 cm of snow water equivalent, Mears (1992) reported that in the area around Gothic, Colorado, less than 40 % of avalanche paths produced avalanches and less than 10 % produced avalanches approaching the 100-year return interval. This finding also supports the wide variability in avalanche years between subregions recorded in our tree-ring record. Additionally, some of the avalanches in a given year may not be large enough to be reflected in the tree-ring record. Therefore, low values of PODpath when considering only one avalanche path and identifying only 1 common year of large magnitude avalanche activity (1982) amongst the subregions through dendrochronology are not surprising. The WF subregion captured the regional chronology most consistently because of the similar and consistent records within the subregion. Paths with at least one GD (i.e., without applying thresholds) during avalanche years identified in the regional chronology exhibit a greater PODpath, but this greater PODpath comes at the expense of introducing more noise if we were to simply use one scar per path to define an avalanche event.
Our results also suggest that our sampling design using scale triplet increases the probability of detecting avalanche activity across an entire region. We note that we are only able to scale our probability calculations to our dataset with a limited historical observational record. However, our results illustrate the importance of sampling more paths if the goal is to reconstruct a regional chronology. In our dataset, the greatest value of PODpath is 40 %, suggesting that if by chance we sampled this path, we would have captured the regional avalanche activity 40 % of the time.
4.4 Limitations
Overall, our results suggest that sampling one path, or multiple paths in one subregion, is insufficient to extrapolate avalanche activity beyond those paths. Multiple paths nested within subregions are necessary to glean information regarding avalanche activity throughout those subregions, as well as the overall region. Our study is still limited by the underrepresentation inherent in dendrochronological techniques for identifying all avalanche events. While we analyzed 673 samples over the extent of the region, some of the paths in our study had relatively small sample sizes per individual path as compared to recent suggestions (Corona et al., 2012). This may have influenced the number of avalanche years identified and subsequent return intervals per individual path. However, we attempted to limit the influence of sample size by using full cross sections from trees, robust and critical identification of responses in the tree rings, and appropriate established threshold techniques.
We also recognize that sampling more avalanche paths in our region would certainly provide a more robust regional avalanche chronology, but time, cost, and resource constraints required an optimized strategy. Finally, our study would undoubtedly have benefited from a longer and more accurate historical record for comparisons and for the verification of the tree-ring record in all of the subregions. Overall, our study illustrates the importance of considering spatial scale and extent when designing, and making inferences from, regional avalanche studies using tree-ring records.
We developed a large magnitude avalanche chronology using dendrochronological techniques for a region in the northern US Rocky Mountains. Implementing a strategic sampling design allowed us to examine avalanche activity through time in single avalanche paths, four subregions, and throughout the region. By analyzing 673 samples from 12 avalanche paths, we identified 30 years with large magnitude events across the region and a median return interval of ∼3 years (from 1866 to 2017). The large magnitude avalanche return interval and number of avalanche years vary throughout the subregions, suggesting the importance of local terrain and weather factors. Our work emphasizes the importance of sample size, scale, and spatial extent when attempting to derive a regional large magnitude avalanche chronology from tree-ring records. In our dataset, the greatest value of PODpath is 40 %, suggesting that if we sampled only this path, we would have captured the regional avalanche activity 40 % of the time. This clearly demonstrates that a single path cannot provide a reliable regional avalanche chronology. Specifically, our results emphasize the importance of (1) sampling more paths spread throughout the region of interest, (2) collecting a large number of cross sections relative to cores, and (3) generating a large dataset that scales to the appropriate spatial extent. Future work should include conducting a similar study with a number of paths in the same subregions for verification or in an area with a more robust regional historical record for verification.
Table A1List of previous avalanche dendrochronological studies with more than one avalanche path to place our regional work in context with other regional/multiple path studies. Number of samples, paths, growth disturbances (GDs), and spatial extent (linear distance between most distant avalanche paths in study area) are included. For spatial extent, NA is reported in studies in which spatial extent is not reported or could not be inferred from maps in the published work. When spatial extent is not reported directly in previous work, it is estimated by using maps from the published work and satellite imagery. We included only the initial studies using a dataset with more than one avalanche path. For example, if a study used the same dataset again in subsequent work, we did not include it.
Table A2Regional chronologies from the International Tree-Ring Database (ITRDB) used for cross dating.

Table A3Proportion of input types (tree-ring signals) to each growth disturbance (GD) class. Note that there could be multiple input types for each class. Termination of growth indicates that the tree was killed in that year and that it coincides with the historical avalanche record. Some of the termination of growth samples have earlywood if the avalanche occurred in the late winter or early spring. Refer to Table 3 for definitions of classes.
Table A4Summary data of subset of samples (n=40) used to estimate number of GDs potentially missed if cores were analyzed instead of the entire cross section.
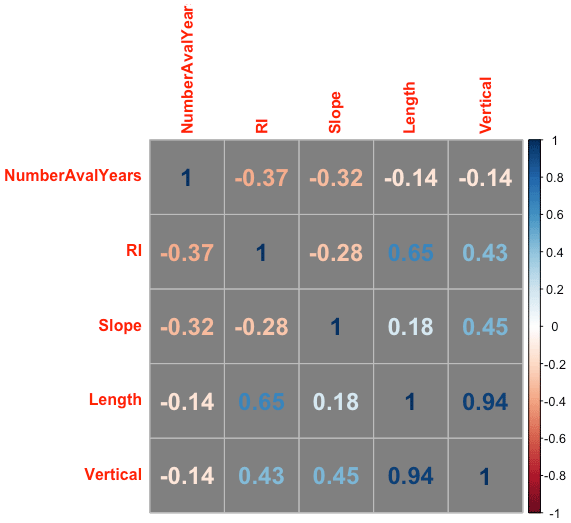
Figure A1Correlation matrix (Pearson correlation coefficients) of the number of avalanche years, return interval (RI), starting zone slope angle (Slope), and path length (Length). Statistical significance is p<0.05. See source data in Table 1.
Table A5Avalanche years identified in the regional analysis (Region; n=29) and avalanche years identified in one or more paths in the individual avalanche path analysis (Paths unique years; n=49). Years in bold indicate years in common between the two sets (n=27).

Data for this work can be found in the ScienceBase repository: https://doi.org/10.5066/P9TLHZAI (Peitzsch et al., 2019).
EP was responsible for the study conception and design, data collection, analysis, and writing. JH contributed to the development of the study design, methods, editing, and writing. DS was responsible for data collection, tree-ring processing and analysis, and writing. GP, KB, and DF contributed to the study design, editing, and writing.
The authors declare that they have no conflict of interest.
Any use of trade, firm, or product names is for descriptive purposes only and does not imply endorsement by the US government.
We extend gratitude to Adam Clark for his substantial data collection efforts and Zach Miller for his assistance processing samples. This work is part of the US Geological Survey Land Resources Western Mountain Initiative project.
This paper was edited by Pascal Haegeli and reviewed by Adrien Favillier and Brian Luckman.
Armstrong, B. R.: A quantitative analysis of avalanche hazard on U.S. Highway 550, southwestern Colorado, in: Proceedings of the Western Snow Conference, 14–16 April 2017, St. George, Utah, 95–104, 1981.
Ballesteros-Canovas, J. A., Trappmann, D., Madrigal-Gonzalez, J., Eckert, N., and Stoffel, M.: Climate warming enhances snow avalanche risk in the Western Himalayas, Proc. Natl. Acad. Sci. USA, 115, 3410–3415, https://doi.org/10.1073/pnas.1716913115, 2018.
Bebi, P., Kulakowski, D., and Rixen, C.: Snow avalanche disturbances in forest ecosystems-State of research and implications for management, Forest Ecol. Manage., 257, 1883–1892, https://doi.org/10.1016/j.foreco.2009.01.050, 2009.
Birkeland, K. W.: Spatial patterns of snow stability throughout a small mountain range, J. Glaciol., 47, 176–186, https://doi.org/10.3189/172756501781832250, 2001.
Blöschl, G.: Scaling issues in snow hydrology, Hydrol. Process., 13, 2149–2175, https://doi.org/10.1002/(SICI)1099-1085(199910)13:14/15<2149::AID-HYP847>3.0.CO;2-8, 1999.
Blöschl, G. and Sivapalan, M.: Scale issues in hydrological modelling: A review, Hydrol. Process., 9, 251–290, https://doi.org/10.1002/hyp.3360090305, 1995.
Bryant, C. L., Butler, D. R., and Vitek, J. D.: A statistical analysis of tree-ring dating in conjunction with snow avalanches – comparison of on-path versus off-path responses, Environ. Geol. Water Sci., 14, 53–59, https://doi.org/10.1007/BF01740585, 1989.
Burrows, C. J. and Burrows, V. L.: Procedures for the study of snow avalanche chronology using growth layers of woody plants, Occasional Paper No. 23, Institute of Arctic and Alpine Research, University of Colorado, Boulder, CO, 56 pp., 1976.
Butler, D. R.: Snow avalanche path terrain and vegetation, Glacier National Park, Montana, Arct. Alp. Res., 11, 17–32, https://doi.org/10.2307/1550456, 1979.
Butler, D. R. and Malanson, G. P.: A history of high-magnitude snow avalanches, southern Glacier National Park, Montana, U.S.A., Mt. Res. Dev., 5, 175–182, https://doi.org/10.2307/3673256, 1985a.
Butler, D. R. and Malanson, G. P.: A reconstruction of snow-avalanche characteristics in Montana, U.S.A., using vegetative indicators, J. Glaciol., 31, 185–187, https://doi.org/10.3189/S0022143000006444, 1985b.
Butler, D. R. and Sawyer, C. F.: Dendrogeomorphology and high-magnitude snow avalanches: a review and case study, Nat. Hazards Earth Syst. Sci., 8, 303–309, https://doi.org/10.5194/nhess-8-303-2008, 2008.
Butler, D. R., Malanson, G. P., and Oelfke, J. G.: Tree-ring analysis and natural hazard chronologies: minimum sample sizes and index values, Prof. Geogr., 39, 41–47, https://doi.org/10.1111/j.0033-0124.1987.00041.x, 1987.
Carrara, P. E.: The determination of snow avalanche frequency through tree-ring analysis and historical records, Geol. Soc. Am. Bull., 90, 773–780, https://doi.org/10.1130/0016-7606(1979)90<773:TDOSAF>2.0.CO;2, 1979.
Casteller, A., Stoeckli, V., Villalba, R., and Mayer, A. C.: An evaluation of dendroecological indicators of snow avalanches in the Swiss Alps, Arct. Antarct. Alp. Res., 39, 218–228, https://doi.org/10.1657/1523-0430(2007)39[218:AEODIO]2.0.CO;2, 2007.
Casteller, A., Villalba, R., Araneo, D., and Stöckli, V.: Reconstructing temporal patterns of snow avalanches at Lago del Desierto, southern Patagonian Andes, Cold Reg. Sci. Technol., 67, 68–78, https://doi.org/10.1016/j.coldregions.2011.02.001, 2011.
Chesley-Preston, T.: Patterns of natural avalanche activity associated with new snow water equivalence and upper atmospheric wind direction and speed in the mountains surrounding Gothic, Colorado, Master of Science, Department of Earth Sciences, Montana State University, Bozeman, Montana, 75 pp., 2010.
Colorado Avalanche Information Center: Statistics and Reporting, available at: http://avalanche.state.co.us/accidents/statistics-and-reporting/, last access: 8 June 2020.
Corona, C., Lopez Saez, J., Stoffel, M., Bonnefoy, M., Richard, D., Astrade, L., and Berger, F.: How much of the real avalanche activity can be captured with tree rings? An evaluation of classic dendrogeomorphic approaches and comparison with historical archives, Cold Reg. Sci. Technol., 74–75, 31–42, https://doi.org/10.1016/j.coldregions.2012.01.003, 2012.
de Bouchard d'Aubeterre, G., Favillier, A., Mainieri, R., Lopez Saez, J., Eckert, N., Saulnier, M., Peiry, J. L., Stoffel, M., and Corona, C.: Tree-ring reconstruction of snow avalanche activity: Does avalanche path selection matter?, Sci. Total Environ., 684, 496–508, https://doi.org/10.1016/j.scitotenv.2019.05.194, 2019.
Dube, S., Filion, L., and Hetu, B.: Tree-Ring Reconstruction of High-Magnitude Snow Avalanches in the Northern Gaspe Peninsula, Quebec, Canada, Arct. Antarct. Alp. Res., 36, 555–564, https://doi.org/10.1657/1523-0430(2004)036[0555:TROHSA]2.0.CO;2, 2004.
Favillier, A., Guillet, S., Morel, P., Corona, C., Lopez Saez, J., Eckert, N., Ballesteros Cánovas, J. A., Peiry, J.-L., and Stoffel, M.: Disentangling the impacts of exogenous disturbances on forest stands to assess multi-centennial tree-ring reconstructions of avalanche activity in the upper Goms Valley (Canton of Valais, Switzerland), Quatern. Geochronol., 42, 89–104, https://doi.org/10.1016/j.quageo.2017.09.001, 2017.
Favillier, A., Guillet, S., Trappmann, D., Morel, P., Lopez-Saez, J., Eckert, N., Zenhäusern, G., Peiry, J.-L., Stoffel, M., and Corona, C.: Spatio-temporal maps of past avalanche events derived from tree-ring analysis: A case study in the Zermatt valley (Valais, Switzerland), Cold Reg. Sci. Technol., 154, 9–22, https://doi.org/10.1016/j.coldregions.2018.06.004, 2018.
Germain, D., Filion, L., and Hétu, B.: Snow avalanche activity after fire and logging disturbances, northern Gaspé Peninsula, Quebec, Canada, Can. J. Earth Sci., 42, 2103–2116, https://doi.org/10.1139/e05-087, 2005.
Germain, D., Filion, L., and Hétu, B.: Snow avalanche regime and climatic conditions in the Chic-Choc Range, eastern Canada, Climatic Change, 92, 141–167, https://doi.org/10.1007/s10584-008-9439-4, 2009.
Germain, D., Hétu, B., and Filion, L.: Tree-ring based reconstruction of past snow avalanche events and risk assessment in Northern Gaspé Peninsula (Québec, Canada), in: Tree Rings and Natural Hazards – A State-of-the-Art, Advances in Global Change Research, edited by: Stoffel, M., Bollschweiler, M., Butler, D. R., and Luckman, B. H., Springer, London, 51–73, 2010.
Google: Imagery of study area, northwest Montana], using R statistical package ggmap, available at: https://cran.r-project.org/web/packages/ggmap/ggmap.pdf, last access: 4 February 2020.
Gratton, M., Germain, D., and Boucher, É.: Meteorological triggering scenarios of tree-ring-based snow avalanche occurrence on scree slopes in a maritime climate, Eastern Canada, Phys. Geogr., 41, 3–20, https://doi.org/10.1080/02723646.2019.1573622, 2019.
Greene, E., Birkeland, K. W., Elder, K., McCammon, I., Staples, M., and Sharaf, D.: Snow, weather, and avalanches: Observation guidelines for avalanche programs in the United States, 3rd Edn., American Avalanche Association, Victor, ID, 104 pp., 2016.
Grissino-Mayer, H.: Evaluating crossdating accuracy: A manual and tutorial for the computer program COFECHA, Tree-Ring Res., 57, 205–221, 2001.
Hebertson, E. G. and Jenkins, M. J.: Historic climate factors associated with major avalanche years on the Wasatch Plateau, Utah, Cold Reg. Sci. Technol., 37, 315–332, https://doi.org/10.1016/S0165-232x(03)00073-9, 2003.
Hendrikx, J., Murphy, M., and Onslow, T.: Classification trees as a tool for operational avalanche forecasting on the Seward Highway, Alaska, Cold Reg. Sci. Technol., 97, 113–120, https://doi.org/10.1016/j.coldregions.2013.08.009, 2014.
Holmes, R. L.: Analysis of tree rings and fire scars to establish fire history, Tree-Ring Bull., 43, 51–67, 1983.
Kogelnig-Mayer, B., Stoffel, M., Schneuwly-Bollschweiler, M., Hübl, J., and Rudolf-Miklau, F.: Possibilities and Limitations of Dendrogeomorphic Time-Series Reconstructions on Sites Influenced by Debris Flows and Frequent Snow Avalanche Activity, Arct. Antarct. Alp. Res., 43, 649–658, https://doi.org/10.1657/1938-4246-43.4.649, 2011.
Korpela, M., Wickham, H., Jackson, S.: ggmap v3.0.0 – Spatial Visualization with ggplot2, available at: https://github.com/dkahle/ggmap (last access: 21 July 2020), 2019.
Köse, N., Aydın, A., Akkemik, Ü., Yurtseven, H., and Güner, T.: Using tree-ring signals and numerical model to identify the snow avalanche tracks in Kastamonu, Turkey, Nat. Hazards, 54, 435–449, https://doi.org/10.1007/s11069-009-9477-x, 2010.
Malevich, S. B., Guiterman, C. H., and Margolis, E. Q.: burnr: Fire history analysis and graphics in R, Dendrochronologia, 49, 9–15, https://doi.org/10.1016/j.dendro.2018.02.005, 2018.
Martin, J. P. and Germain, D.: Dendrogeomorphic reconstruction of snow avalanche regime and triggering weather conditions: A classification tree model approach, Prog. Phys. Geogr., 40, 1–22, https://doi.org/10.1177/0309133315625863, 2016.
Mears, A. I.: Snow-Avalanche Hazard Analysis for Land-use Planning and Engineering, Colorado Geological Survey Bulletin 49, Colorado Geological Survey, Colorado, 55 pp., 1992.
Meseşan, F., Gavrilă, I. G., and Pop, O. T.: Calculating snow-avalanche return period from tree-ring data, Nat. Hazards, 94, 1081–1098, https://doi.org/10.1007/s11069-018-3457-y, 2018.
Mock, C. J. and Birkeland, K. W.: Snow avalanche climatology of the western United States mountain ranges, B. Am. Meteorol. Soc., 81, 2367–2392, https://doi.org/10.1175/1520-0477(2000)081<2367:SACOTW>2.3.CO;2, 2000.
Mock, C. J., Carter, K. C., and Birkeland, K. W.: Some Perspectives on Avalanche Climatology, Ann. Am. Assoc. Geogr., 107, 299–308, https://doi.org/10.1080/24694452.2016.1203285, 2016.
Muntán, E., Garcia, C., Oller, P., Marti, G., Garcia, A., and Gutierrez, E.: Reconstructing snow avalanches in the Southeastern Pyrenees, Nat. Hazards Earth Syst. Sci., 9, 1599–1612, https://doi.org/10.5194/nhess-9-1599-2009, 2009.
NOAA – National Centers for Environmental Information: ITRDB – International Tree Ring Data Bank, available at, available at: https://www.ncdc.noaa.gov/data-access/paleoclimatology-data/datasets/tree-ring, last access: 1 March 2018.
Ott, R. L. and Longnecker, M. T.: An Introduction to Statistical Methods and Data Analysis, 7th Edn., Cengage Learning, Boston, MA, 1296 pp., 2016.
Peitzsch, E. H., Stahle, D. K., Fagre, D. B., Clark, A. M., Pederson, G. T., Hendrikx, J., and Birkeland, K. W.: Tree ring dataset for a regional avalanche chronology in northwest Montana, 1636–2017, US Geological Survey, US Geological Survey data release, https://doi.org/10.5066/P9TLHZAI, 2019.
Pop, O. T., Munteanu, A., Flaviu, M., Gavrilă, I.-G., Timofte, C., and Holobâcă, I.-H.: Tree-ring-based reconstruction of high-magnitude snow avalanches in Piatra Craiului Mountains (Southern Carpathians, Romania), Geograf. Ann. A, 100, 99–115, https://doi.org/10.1080/04353676.2017.1405715, 2018.
Potter, N.: Tree-ring dating of snow avalanche tracks and the geomorphic activity of avalanches, Northern Absaroka Mountains, Wyoming, Geol. S. Am. S., 123, 141–165, 1969.
Rayback, S. A.: A dendrogeomorphological analysis of snow avalanches in the Colorado Front Range, USA, Phys. Geogr., 19, 502–515, https://doi.org/10.1080/02723646.1998.10642664, 1998.
Reardon, B. A., Pederson, G. T., Caruso, C. J., and Fagre, D. B.: Spatial reconstructions and comparisons of historic snow avalanche frequency and extent using tree rings in Glacier National Park, Montana, U.S.A., Arct. Antarct. Alp. Res., 40, 148–160, https://doi.org/10.1657/1523-0430(06-069)[REARDON]2.0.CO;2, 2008.
Schläppy, R., Jomelli, V., Grancher, D., Stoffel, M., Corona, C., Brunstein, D., Eckert, N., and Deschatres, M.: A New Tree-Ring-Based, Semi-Quantitative Approach for the Determination of Snow Avalanche Events: use of Classification Trees for Validation, Arct. Antarct. Alp. Res., 45, 383–395, https://doi.org/10.1657/1938-4246-45.3.383, 2013.
Schläppy, R., Eckert, N., Jomelli, V., Stoffel, M., Grancher, D., Brunstein, D., Naaim, M., and Deschatres, M.: Validation of extreme snow avalanches and related return periods derived from a statistical-dynamical model using tree-ring techniques, Cold Reg. Sci. Technol., 99, 12–26, https://doi.org/10.1016/j.coldregions.2013.12.001, 2014.
Schläppy, R., Jomelli, V., Eckert, N., Stoffel, M., Grancher, D., Brunstein, D., Corona, C., and Deschatres, M.: Can we infer avalanche–climate relations using tree-ring data? Case studies in the French Alps, Reg. Environ. Change, 16, 629–642, https://doi.org/10.1007/s10113-015-0823-0, 2015.
Schweizer, J.: Snow avalanche formation, Rev. Geophys., 41, 1016–1041, https://doi.org/10.1029/2002rg000123, 2003.
Schweizer, J., Kronholm, K., and Wiesinger, T.: Verification of regional snowpack stability and avalanche danger, Cold Reg. Sci. Technol., 37, 277–288, https://doi.org/10.1016/s0165-232x(03)00070-3, 2003.
Shroder, J. F.: Dendrogeomorphological analysis of mass movement on Table Cliffs Plateau, Utah, Quatern. Res., 9, 168–185, https://doi.org/10.1016/0033-5894(78)90065-0, 1978.
Šilhán, K. and Tichavský, R.: Snow avalanche and debris flow activity in the High Tatras Mountains: New data from using dendrogeomorphic survey, Cold Reg. Sci. Technol., 134, 45–53, https://doi.org/10.1016/j.coldregions.2016.12.002, 2017.
Skøien, J. O. and Blöschl, G.: Sampling scale effects in random fields and implications for environmental monitoring, Environ. Monit. Assess., 114, 521–552, https://doi.org/10.1007/s10661-006-4939-z, 2006.
Smith, L.: Indication of snow avalanche periodicity through interpretation of vegetation patterns in the North Cascades, Washington, in: Methods of Avalanche Control on Washington Mountain Highways: Third Annual Report, Washington State Highway Commission Department of Highways, Olympia, Washington, USA, 187 pp., 1973.
Smith, M. J. and McClung, D. M.: Avalanche frequency and terrain characteristics at Rogers' pass, British Columbia, Canada, J. Glaciol., 43, 165–171, https://doi.org/10.3189/S0022143000002926, 1997.
Stokes, M. A. and Smiley, T. L.: An Introduction to Tree-Ring Dating, The University of Arizona Press, Tucson, 1996.
Teich, M., Bartelt, P., Grêt-Regamey, A., and Bebi, P.: Snow Avalanches in Forested Terrain: Influence of Forest Parameters, Topography, and Avalanche Characteristics on Runout Distance, Arct. Antarct. Alp. Res., 44, 509–519, https://doi.org/10.1657/1938-4246-44.4.509, 2012.
Voiculescu, M., Onaca, A., and Chiroiu, P.: Dendrogeomorphic reconstruction of past snow avalanche events in Bâlea glacial valley – Făgăraş massif (Southern Carpathians), Romanian Carpathians, Quatern. Int., 415, 286–302, https://doi.org/10.1016/j.quaint.2015.11.115, 2016.