the Creative Commons Attribution 4.0 License.
the Creative Commons Attribution 4.0 License.
 | 18 Oct 2021
Evaluating integrated water management strategies to inform hydrological drought mitigation
John P. Bloomfield
Anne F. Van Loon
Margaret Garcia
Benedikt Heudorfer
Joshua Larsen
David M. Hannah
Managing water–human systems during water shortages or droughts is key to avoid the overexploitation of water resources and, in particular, groundwater. Groundwater is a crucial water resource during droughts as it sustains both environmental and anthropogenic water demand. Drought management is often guided by drought policies, to avoid crisis management, and actively introduced management strategies. However, the impact of drought management strategies on hydrological droughts is rarely assessed. In this study, we present a newly developed socio-hydrological model, simulating the relation between water availability and managed water use over 3 decades. Thereby, we aim to assess the impact of drought policies on both baseflow and groundwater droughts. We tested this model in an idealised virtual catchment based on climate data, water resource management practices and drought policies in England. The model includes surface water storage (reservoir), groundwater storage for a range of hydrogeological conditions and optional imported surface water or groundwater. These modelled water sources can all be used to satisfy anthropogenic and environmental water demand. We tested the following four aspects of drought management strategies: (1) increased water supply, (2) restricted water demand, (3) conjunctive water use and (4) maintained environmental flow requirements by restricting groundwater abstractions. These four strategies were evaluated in separate and combined scenarios. Results show mitigated droughts for both baseflow and groundwater droughts in scenarios applying conjunctive use, particularly in systems with small groundwater storage. In systems with large groundwater storage, maintaining environmental flows reduces hydrological droughts most. Scenarios increasing water supply or restricting water demand have an opposing effect on hydrological droughts, although these scenarios are in balance when combined at the same time. Most combined scenarios reduce the severity and occurrence of hydrological droughts, given an incremental dependency on imported water that satisfies up to a third of the total anthropogenic water demand. The necessity for importing water shows the considerable pressure on water resources, and the delicate balance of water–human systems during droughts calls for short-term and long-term sustainability targets within drought policies.
- Article
(6477 KB) - Full-text XML
- BibTeX
- EndNote


Groundwater (GW) plays a key role in sustaining natural and anthropogenic water demand during meteorological droughts (De Graaf et al., 2019; Siebert et al., 2010; Döll et al., 2012). Meteorological droughts, defined as periods of sustained dry weather (Mishra and Singh, 2010), reduce water availability in soil moisture, surface water (SW) and, eventually, groundwater. Due to the natural delay in groundwater recharge, it may take weeks, months or even years before a precipitation deficit propagates through the hydrological cycle, reducing groundwater storage levels (Tallaksen and Van Lanen, 2004; Van Lanen, 2006). This natural delay results in groundwater storage being available for longer compared to surface water, resulting in sustained and complemented water demand during meteorological droughts (Taylor et al., 2013; Cuthbert et al., 2019). Increased groundwater use may also result in aggravated streamflow droughts, which is a deficit in discharge or reservoir storage (Mishra and Singh, 2010; Wada et al., 2013; Wanders and Wada, 2015). Deficits in groundwater, caused by either low or absent recharge or increased groundwater use, result in groundwater drought, which is defined as a below-normal groundwater levels (Yevjevich, 1967; Tallaksen and Van Lanen, 2004). Despite the important role of groundwater storage availability during droughts, the question remains of how groundwater storage can be managed best and whether drought management strategies can meet both environmental and anthropogenic water demand (White et al., 2019).
When national or regional drought policies are in place, water management during meteorological and/or hydrological droughts is guided to structure the drought response and create drought resilience (Wilhite et al., 2014). Drought policies vary in their structure, by focusing on (different) water users, and their implementation, which may be apparent in the drought definition, monitoring systems, risk management plans and evaluation (Wilhite et al., 2014; De Stefano et al., 2015; Urquijo et al., 2017). Studies aiming to compare drought policies often address these facets in a qualitative manner, for example, when comparing Australia and the USA (White et al., 2001; Botterill and Hayes, 2012), different USA states (Fu et al., 2013) and European countries (De Stefano et al., 2015; Urquijo et al., 2017; Özerol, 2019). However, few of these drought policies are assessed in terms of their effectiveness (Urquijo et al., 2017; Wilhite et al., 2014). In Europe, drought polices or drought management plans are evaluated as part of the Water Framework Directive (WFD; EU Directive, 2000), and member states are encouraged to move from crisis management towards proactive management of droughts (Howarth, 2018). However, implemented drought policies vary (De Stefano et al., 2015; Urquijo et al., 2017), and currently, there is no consistent methodology to assess drought policies with respect to their impact on water resources or hydrological droughts.
Methodologies to investigate interactions between water resource availability and drought management often use socio-hydrological models to capture both hydrological and anthropogenic responses in time (Sivapalan et al., 2012; Di Baldassarre et al., 2015). Studies that use socio-hydrological models often focus on one specific measure of a drought policy. For example, studies focused on maintaining environmental flow requirements (Klaar et al., 2014), increased or altered groundwater use (Martínez-Santos et al., 2008; Apruv et al., 2017), restrictions on water demand (White et al., 2019), conjunctive (or integrated) use of water resources (Huggins et al., 2018), management regulations of reservoir storage (Di Baldassarre et al., 2018; Garcia et al., 2020; Dobson et al., 2020) or creating awareness of water shortage during a meteorological drought (Garcia and Islam, 2019; Gonzales and Ajami, 2017). Jaeger et al. (2019) were the first to model a set of drought policy measures aiming to conserve water. However, drought policy measures, either separately or combined, were found to have less impact on streamflow droughts compared to timely reservoir regulations. Alternative water sources, such as groundwater, were not considered.
Given the increasing dependency on groundwater storage during meteorological droughts (Aeschbach-Hertig and Gleeson, 2012; Taylor et al., 2013; Cuthbert et al., 2019), drought policy modelling should include both surface water and groundwater to reflect the additional complexity of different or possibly contrasting groundwater storage availability within or between water management regions. In natural systems, the temporal variation in groundwater storage and the aquifer-dependent delay between precipitation and groundwater storage and baseflow results in contrasting baseflow and groundwater drought characteristics (Peters et al., 2006; Van Lanen et al., 2013; Bloomfield and Marchant, 2013). These contrasting hydrological drought characteristics change when impacted by (un)managed groundwater use (Tijdeman et al., 2018; Wendt et al., 2020), and overall drought resilience reduces when groundwater use exceeds sustainable limits (Custodio, 2002; Custodio et al., 2019). On the other hand, targeted management strategies can also ease pressure on groundwater systems (Klaar et al., 2014; White et al., 2019) and encourage integrated water use aiming to increase drought resilience (Huggins et al., 2018; Scanlon et al., 2016; Jakeman et al., 2016), highlighting their potential within drought policies.
This study aims to assess the impact of drought policies on hydrological droughts and water resource availability for a range of hydrogeological conditions. These conditions refer to the availability of groundwater storage in a (virtual) catchment that is modelled for groundwater systems with overall large, medium and small groundwater availability. Hydrological droughts refer to both baseflow and groundwater, which might be either human-modified or human-induced droughts (Van Loon et al., 2016), as a consequence of water management (baseline) or drought management strategies, which are introduced either in separate or combined drought management strategies in an idealised socio-hydrological model. This socio-hydrological model represents an idealised hydrological system that includes a surface water reservoir, a groundwater module with either large, medium or small groundwater storage availability and an option to import surface water to meet either anthropogenic or environmental water demand.
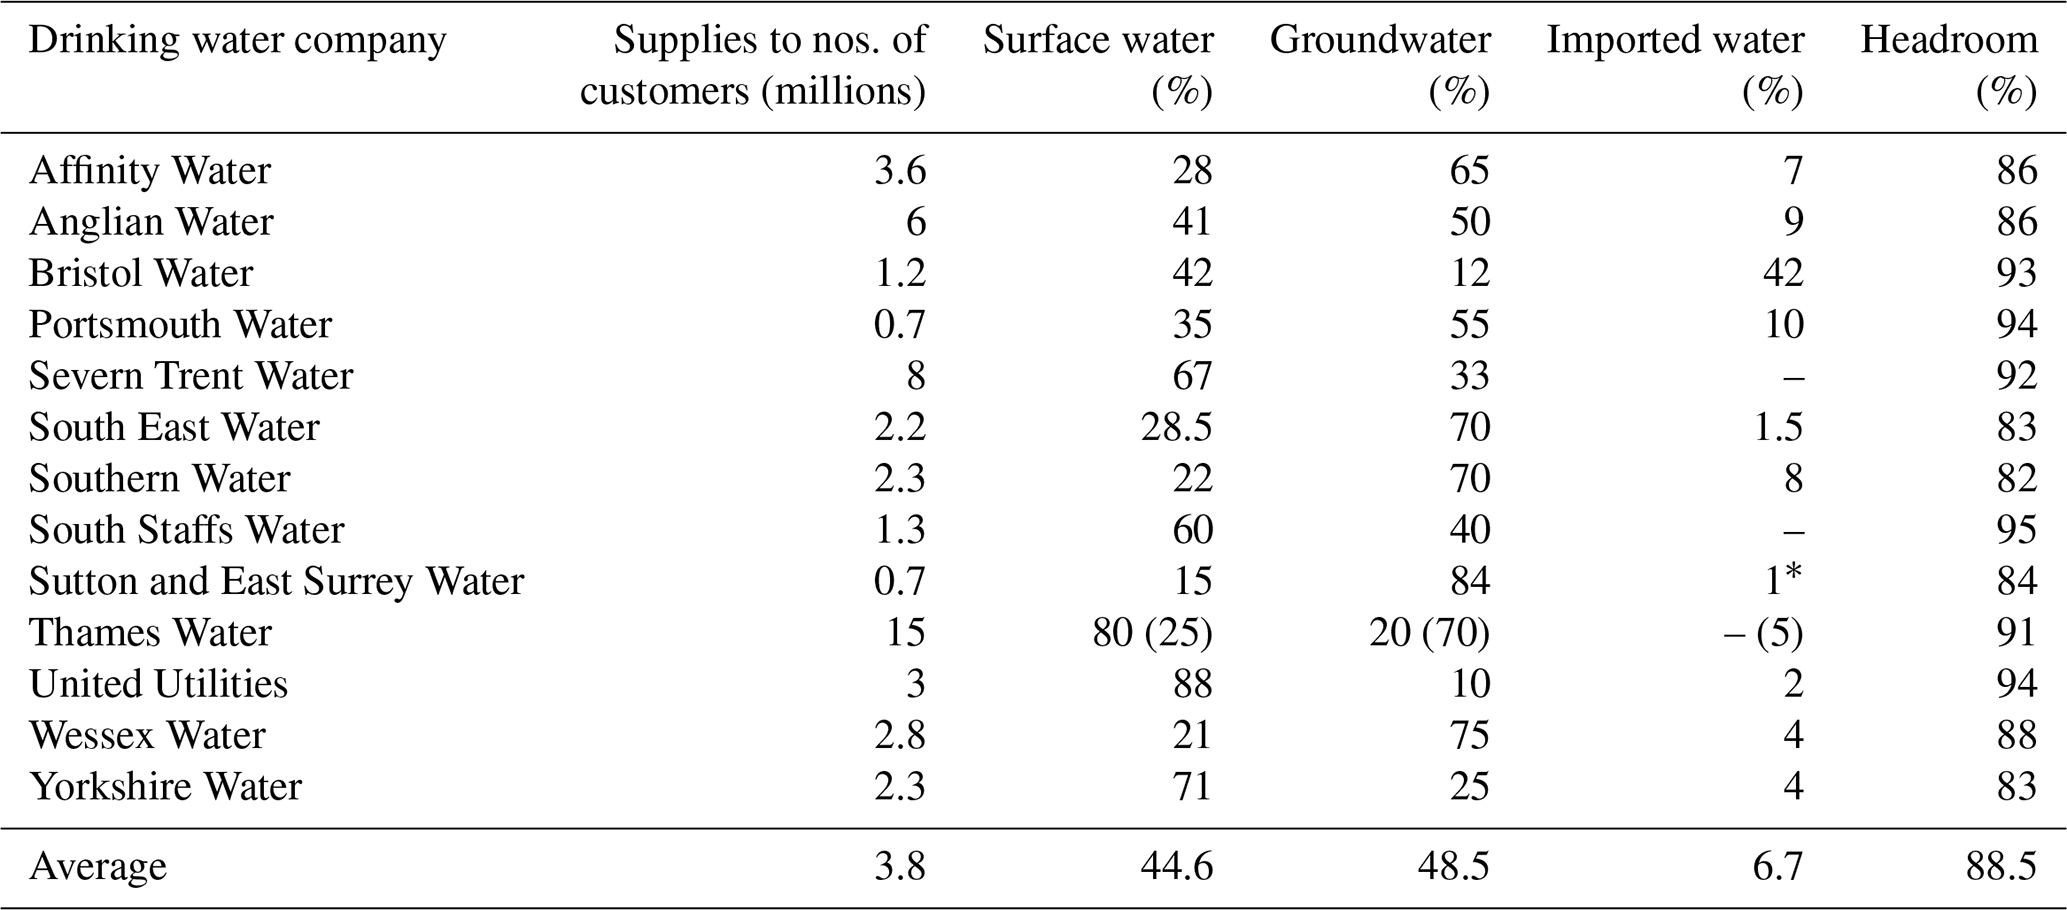
To test and develop the socio-hydrological model, England is used as a case study considering the publicly available information on surface water and groundwater allocations during normal and drought conditions. Since 2003, water allocations have been based on a catchment water balance approach as WFD standards were integrated in national water policies (Environment Agency, 2016; Howarth, 2018). Drinking water supply is the largest water user, comprising 55 % of the water demand on average and up to 90 % in some densely populated regions (data from 2000–2015, published by Environment Agency (2019a); Fig. A1). The privatised drinking water supply sector consists of 18 drinking water companies that provide drinking water in England (Ohdedar, 2017; Ofwat, 2020). A total of 13 out of the 18 companies use both surface water and groundwater, for which water resource and drought management plans were used to inform baseline conditions and drought management scenarios (see Sect. 3.2 and Table A1 for more details).
Water resource management plans show that the source of water supply varies, depending on the regional variability in surface water and groundwater availability. For example, in regions with large groundwater storage availability, water supply might rely more on groundwater compared to regions with smaller groundwater storage availability. In England, this regional variability is reflected in the share of either surface water or groundwater for the 13 drinking water companies (Table A1). In addition to locally available water, water transfers between drinking water companies are regularly used to overcome seasonal or annual shortages. These transfers also ease pressure on water resources and act as emergency supply during droughts (Dobson et al., 2020). The overall pressure on water resources in the case study is considerable. During normal conditions, the allocated water represents, on average, 88.5 % of the long-term available water that might increase during periods of high water demand or droughts (Table A1; Environment Agency, 2019b). Not surprisingly, drought management plans are mandatory for drinking water companies to guide their drought response. These plans are publicly available and often updated. The most recent plans were used in this study (see Table A2 for references to regional drought management plans).
Drought management plans consist of the following five main components: (1) drought definition, (2) warning system based on drought trigger levels, (3) demand management, (4) supply management and (5) evaluation of drought events (summarised in Table 1). Drought definitions and trigger levels are used to distinguish mild from severe drought events and activate management strategies with increasing severity (Table 1). These drought trigger levels are often based on deficits in monthly, seasonal or total precipitation in the winter months (also called dry winters in drought management plans) which form the main groundwater recharge period in the UK. Water levels in rivers, reservoirs and selected groundwater boreholes are also used as drought triggers when, for example, flow or storage levels are falling low. Drought management plans list various demand-related and supply-related drought management strategies that are activated for certain drought severity stages (see Table 1). The most commonly applied strategies were implemented in the model (when permitted by the model set-up) using the average effect of these measures, as reported in the drought management plans.
Table 1Recent drought management plans of 13 drinking water companies with staged drought management strategies according to drought trigger levels (see Table A2 for references to the drought plans). Average drought trigger levels are shown (range shown after semicolon) based on drought plans with trigger levels under 100 years for initial drought stages. Demand management and water supply strategies are shown per drought severity stage with modelled impact in fourth and seventh columns, respectively. Note that model scenarios are based on averaged reported effects when estimated (range of expected/reported impact is given in parenthesis). Surface water and groundwater are abbreviated as SW and GW, respectively, for readability.

The drought policies were modelled in a socio-hydrological model that consists of a water balance model with water demand components. The water balance model is driven by daily climate data that were selected to include the four most recent national hydrological drought events (Barker et al., 2019), resulting in a period of investigation from 1980 to 2017. Based on this investigation period, a 5-year spin-up period was used to determine the initial conditions that included water demand but no (drought) management strategies. Natural (no water demand) model runs were used for reference purposes only (see the time series in Fig. A3).
Hydrological drought characteristics were calculated from the generated baseflow and groundwater level time series by applying a variable 80th percentile, corresponding to a “once every 5 years drought” (Yevjevich, 1967; Tallaksen and Van Lanen, 2004; Mishra and Singh, 2010). This drought threshold was calculated from the baseline scenario that was applied to drought management scenarios to evaluate the drought impact. In the sensitivity analysis, where alternative storage outflow parameters were tested, new drought thresholds were calculated taking the 80th percentile of each baseline run (baseflow and groundwater storage time series) with an alternative parameter. Similar to the main analysis, the impact of drought management strategies is computed from this baseline and new drought threshold.
3.1 Socio-hydrological model
The socio-hydrological follows a standard conceptual water balance model with additional water demand components (Fig. 1). The water balance model was based on the previously described lumped hydrological model of (Van Lanen et al., 2013), who modified the standard HBV model structure (Bergström, 1976) to model hydrological droughts globally. We extended this hydrological drought model with three different groundwater storage options in the groundwater module, introduced a term for environmental water demand, represented by the ecological minimum flow, and defined anthropogenic water demand that could be altered following a drought management plan. The model is driven by forcing data that was selected to be representative for the case study (England), and management settings and scenarios were likewise based on a range of water management and drought management plans converted to relative setting to be applied in the socio-hydrological model. In sum, the socio-hydrological model is thus driven by England's climate data that drive the daily soil moisture balance, generating runoff and groundwater recharge. Runoff is directly routed to the surface water reservoir. Groundwater recharge is either stored or discharged, depending on the groundwater storage option in the groundwater module. Water demand is met using a fraction of stored surface water and/or groundwater that can be imported externally in the model when storage is depleted. Drought management scenarios can alter the fraction of water demand and source of water supply that has an impact on hydrological droughts and water resource availability.

Figure 1Socio-hydrological model consisting of a soil moisture balance driven by precipitation (P in millimetres per day; hereafter mm d−1) and potential evaporation (PET in mm d−1), a surface water reservoir storing runoff (Qr in mm d−1) and a groundwater module that consists of three groundwater system options (large, medium and small groundwater availability) driven by groundwater recharge (Rch in mm d−1). These three groundwater systems represent large, medium and small groundwater availability, modelled by a power law, bypass and two parallel reservoir storages, respectively (see Sect. 3.2 for details). Anthropogenic water demand is met by reservoir abstractions (Ares in mm d−1) and groundwater abstractions (Agw in mm d−1), both in striped dark red arrows. Natural water demand is represented by ecological flow requirements (Qeco in mm d−1; dotted green arrow) and abstracted as part of the baseflow (Qb in mm d−1). Remaining baseflow is routed to the reservoir (Qout). Additional water is imported in the model when reservoir or groundwater storage is insufficient (Qimp and GSimp, both in mm d−1). Drought management scenarios apply to the surface water reservoir, groundwater module and environmental and anthropogenic water demand (all model components in the thick black box).
3.2 Model components
The first model component is the soil moisture balance, which is represented by a medium soil (light silty loam soil – soil II). The daily soil moisture balance (SS for daily time steps t in millimetres; hereafter mm) is determined by incoming precipitation (P in millimetres per day; hereafter mm d−1), actual evaporation (ETa in mm d−1) that was calculated from potential evaporation (PET in mm d−1), overland flow or runoff (Qr in mm d−1) and groundwater recharge (Rch in mm d−1; Van Lanen et al., 2013).
ETa was taken equal to PET when SSt is between field capacity (SSFC) and critical soil moisture content (SSCR), assuming that well-watered grass would, in this case, transpire at the potential rate. ETa was reduced for drier soils with a factor , and below wilting point (SSWP), ETa was assumed to be zero (Van Lanen et al., 2013). Qr occurs when the soil reaches field capacity (168.9 mm) and when it is raining on very dry soil (below critical moisture content of 95.2 mm).
Rch is calculated from the daily soil moisture content, depending on the soil moisture retention shape parameter (b=3 in average conditions; Seibert, 2000) and the unsaturated hydraulic conductivity of soil II (kFC; Van Lanen et al., 2013; Tanji and Kielen, 2002; Eq. 3).
The average annual runoff and groundwater recharge generated by the soil moisture balance also defines the total available water for anthropogenic water demand (ADem in mm d−1), following the water resource management plans in the case study area. Allocated ADem is defined as a fraction (fdem) of the long-term average of annual runoff and groundwater recharge that is divided equally over the days of the year (Eq. 4). fdem is defined by the proportional water use as reported by drinking water companies (see Sect. 3.3 and Table A1 for more details).
The second model component is a surface water reservoir storing runoff and baseflow (Fig. 1). Stored water (in mm) is used to meet the surface water demand, which is 44.6 % of allocated water in the baseline and variable in the drought management scenarios. Maximum reservoir storage is set to 1 year of winter recharge, defined as the long-term total precipitation in the period from December to February. Excess reservoir storage (Qout in mm d−1) leaves the model and is not used to meet surface water demand. When storage declines, additional (unlimited) surface water (Qimp in mm d−1) is imported in the baseline scenario. In drought management scenarios, reservoir storage is refilled when storage levels are below 25 %, representing the regular water transfers as part of the drought management strategies (see Table 1; also described in Dobson et al., 2020).
The third model component is the groundwater module storing groundwater recharge (GS in mm) and generating baseflow (Qb in mm d−1). The groundwater module has three different parallel options for groundwater storage availability, representing different hydrogeological conditions. The first option is named the large groundwater storage system, which refers to overall large groundwater availability as typically found in karstic groundwater systems (Stoelzle et al., 2015; Hartmann et al., 2014). The second option in the groundwater module is the medium groundwater storage system, which refers to medium groundwater availability, as can be found in porous aquifers (Allen et al., 1997; Bloomfield and Marchant, 2013; Stoelzle et al., 2015). The last option is small groundwater storage system, which refers to small groundwater availability typically found in shallow or weathered fractured aquifers (Allen et al., 1997; Stoelzle et al., 2015). These three parallel options are modelled using different model structures corresponding to a typical karstic, porous and fractured groundwater outflow release (Stoelzle et al., 2015). Modelled storage outflow parameters (s in d−1, days, in Table 2) are based on average characteristics found in England's karstic, porous and fractured aquifers (Allen et al., 1997) and the tested parameters by Stoelzle et al. (2015). These two ranges of relevant storage outflow parameters resulted in a mean s parameter for the main result section, with a large range tested in the sensitivity analysis.
The large groundwater storage system was modelled by a nonlinear power law (Eq. 5) representing the nonlinear groundwater release in karstic aquifers (Wittenberg, 2003; Stoelzle et al., 2015). The nonlinearity of outflow release was taken as 0.5 (B in Eq. 5), allowing some turbulent flow that is typical for unconfined karstic aquifers (Wittenberg, 2003).
The medium groundwater storage system is represented by a linear storage reservoir with an additional bypass component (D; Eq. 6) that corresponds to the typical slow porous flow with possible leakage in England's Permo-Triassic sandstone aquifers (Shepley et al., 2008; Allen et al., 1997). Possible leakage of the groundwater recharge represents 10 %, based on the tested range (0.07–0.12) by Stoelzle et al. (2015) and indicated with the coloured arrow in Fig. 1.
The small groundwater storage system is represented by two parallel linear storage reservoirs (Eq. 7) referring to weathered, fractured aquifers with variable storage outflow release (Stoelzle et al., 2015; Allen et al., 1997). When applying this option in the groundwater module, total groundwater storage is a sum of both parallel storage reservoirs with different s parameter values for which recharge and water demand are equally divided.
Groundwater abstractions (Agw in mm d−1) were taken from the daily groundwater storage balance, resulting in different time series for baseflow and groundwater storage for the three groundwater systems. From the generated baseflow, the ecological minimum flow (Qeco mm d−1) is first withdrawn to allocate water for the environmental water demand. The remainder of the baseflow is routed to the reservoir and is available for anthropogenic surface water demand (Ares). This implies that, on days when baseflow is less than or equal to Qeco, no baseflow is routed to the reservoir, and all available water is allocated for environmental water demand, even though this might be less than the environmental flow requirements. Maintaining environmental flow requirements is only applied in some drought management scenarios in which groundwater demand is restricted when flows fall below the ecological flow threshold. If the groundwater storage is depleted, additional (unlimited) groundwater storage (GSimp in mm d−1 ) is imported to meet the groundwater demand that is additional to the water balance. In reality, additional groundwater would come from deeper or connected aquifer sections that would extend the groundwater abstractions beyond the surface water catchment boundaries.
Stoelzle et al. (2014)Allen et al. (1997)Table 2Groundwater storage outflow s values (in days; hereafter d−1) for the three groundwater options in the groundwater module. The first row shows s values used by Stoelzle et al. (2015), the second row shows representative s values for England based on Allen et al. (1997) and the third row presents the modelled (mean) s values for the three groundwater options in Eqs. (5)–(7). In the sensitivity analysis, a range of s values was calculated (last row). For the low storage system, only s1 was changed in the sensitivity analysis. The response time (in d) is shown for the modelled s values in parenthesis.

3.3 Data
Climate data for the hydrological model were selected to represent the average climate conditions in England, providing an estimate for precipitation (P) and reference potential evaporation (PET). Therefore, a regionally weighted precipitation product was selected (at a daily timescale; Alexander and Jones, 2001). In the absence of a regional (weighted) product for PET, a centroid location was selected to extracted daily time series from the (gridded) CHESS data set of Robinson et al., 2016.
Water resource management plans were used to determine long-term (2000–2015) water demand and water availability for a normal year (Environment Agency, 2019b). These documented water demand volumes were converted into a percentage (water use divided by available water) representing water allocation per drinking water company (see Table A1). This water allocation percentage is also called headroom by drinking water companies, as it indicates remaining room given the long-term water availability and allocated water use. Between the drinking water companies, water allocation varied between 82 % and 95 % (Table A1) with an average of 88.5 %, which was used in the main analysis to define the total anthropogenic water demand as a fraction of the long-term available water (fdem in Eq. 4). The range of higher/lower water allocation was further explored in the sensitivity analysis by increasing/decreasing the water allocation by 5 % (to 93.5 % and 83.5 %, respectively). The proportions of surface water and groundwater allocation also varied between companies, and an average was used for surface water (44.6 %) and groundwater (48.5 %) demand. The remaining water demand (6.9 %) was provided by imported water, representing water transfers between companies during normal conditions and during droughts (Dobson et al., 2020). Considering the large range of surface water and groundwater demand between the companies (15 %–88 % and 10 %–84 %, respectively), alternative proportions of surface water and groundwater demand were tested in the scenarios.
Data from the regionally averaged drought management plans were used to define drought trigger levels and activate drought management strategies related to the indicated drought severity by trigger levels (Table 1). Modelled trigger levels were based on averaged reported levels for precipitation anomalies (in the monthly standardised precipitation index, SPI). This average excludes extremely low SPI values (SPI < −2.32) or long return periods (100–150 years) reported for initial drought stages. Trigger levels are applied to precipitation (in SPI) and converted to percentiles for a streamflow and groundwater level time series, as is common for drinking water companies. For example, the first category of drought management strategies can be activated due to an anomaly in precipitation, where surface water or groundwater falls below the trigger level corresponding to a 1 in 8.5 years drought event (SPI < −1.18). Different trigger levels are applied to reservoir storage levels that are kept relatively full, with a 30–60 d emergency storage. Reservoir trigger levels in the first drought category typically start from 80 % to 60 % of reservoir storage, the second category from 60 % to 30 % and the last category from 30 % to 12 %. These percentages are converted to reservoir trigger levels of 75 %, 50 % and 25 %.
Based on the listed drought management strategies, four scenarios were developed to test the first four separate strategies (Table 3). The first scenario focuses on water supply and includes an increase in water supply for both surface water and groundwater based on the reported range in Table 1. The second scenario focused on restricting water demand and reducing surface water and groundwater demand based on reported (achieved or modelled) water demand reductions (Table 1). The third scenario introduced conjunctive water use as a drought management strategy that integrates surface water and groundwater demand. In this scenario, the daily water demand is provided by either water source, depending on the highest available storage. The fourth scenario meets ecological flow requirements that aim to maintain baseflow in connected streams by reducing groundwater abstractions (also known as hands-off flow; Environment Agency, 2019c). This scenario is relevant to drinking water companies, using both surface water and groundwater, that might apply for drought permits to reduce ecological flows during severe droughts (Environment Agency, 2016). In this scenario, the ecological minimum flow (represented by environmental water demand), is maintained by restricting the groundwater demand when baseflow falls below the seasonal ecological minimum flow threshold (80th percentile, based on monthly data). In addition to these four separate drought management strategy scenarios, two combined scenarios were tested to investigate the combined effect of the gradual increase/decrease in water demand with either conjunctive use (scenario of combined 1–2–3) or maintaining the ecological flow (scenario of combined 1–2–4).
Table 3Description of rules applicable to the four separate drought management strategy scenarios. Note that staged drought management strategies under the first (water supply) and second (restricted use) scenarios are activated by drought trigger levels. The third and fourth scenarios are active throughout the modelling period. Modelled scenarios are based on (averaged) documented drought management strategies (see Table 1 for details).

Applicable at all times: surface water import when reservoir levels fall below 25 %.
The results are presented in four sections, starting with baseline conditions for the three modelled hydrogeological conditions. Next, drought management scenarios are presented, and their impact on hydrological droughts is shown relative to the baseline. The sensitivity analysis with alternative groundwater outflow parameters and baseline water demand is presented last.
4.1 Baseline
In the baseline scenario, the soil moisture balance shows inter-annual variations, but no systematic wetting or drying, as the total water balance is close to zero (18 mm) for 37 years (see Fig. A2). Periods of below-normal precipitation resulting in reduced groundwater recharge and runoff are visible in spring 1989, 1991–1992, 1996–1997, 2003–2004, 2005–2006, 2010–2012 and June 2017. These periods are colour-coded according to drought definitions in Table 1 and in Fig. 2. Periods of above-normal precipitation are noted in 1991, 2001 and 2012, resulting in a saturated soil with excess runoff generation instead of recharge.
Reservoir storage in the baseline follows the inter-annual variability in runoff and baseflow that is generated by the groundwater module (Fig. 2). Reservoir storage is lowest in the large groundwater storage system (mean – 16 %; range 0 %–89 %). In the medium and small groundwater storage systems, surface water storage levels are higher with, on average, 36 % and 66 % reservoir storage, respectively. Excess surface water storage (Qout) represents a small proportion of surface water demand in the large and medium groundwater system (2 % and 5 %) compared to 22 % in the small groundwater system, suggesting larger reservoir storage might avoid the low reservoir levels that occur during mild droughts in the baseline. When reservoir storage declines, additional surface water is imported to meet the daily surface water demand. This additional import represents 8.1 %, 1.7 % and 0.3 % of the total water demand for the large, medium and small groundwater storage systems, respectively (Fig. 3). The proportions of additional surface water imports are considered within the range of common import/export of surface water in England (see Table A1).
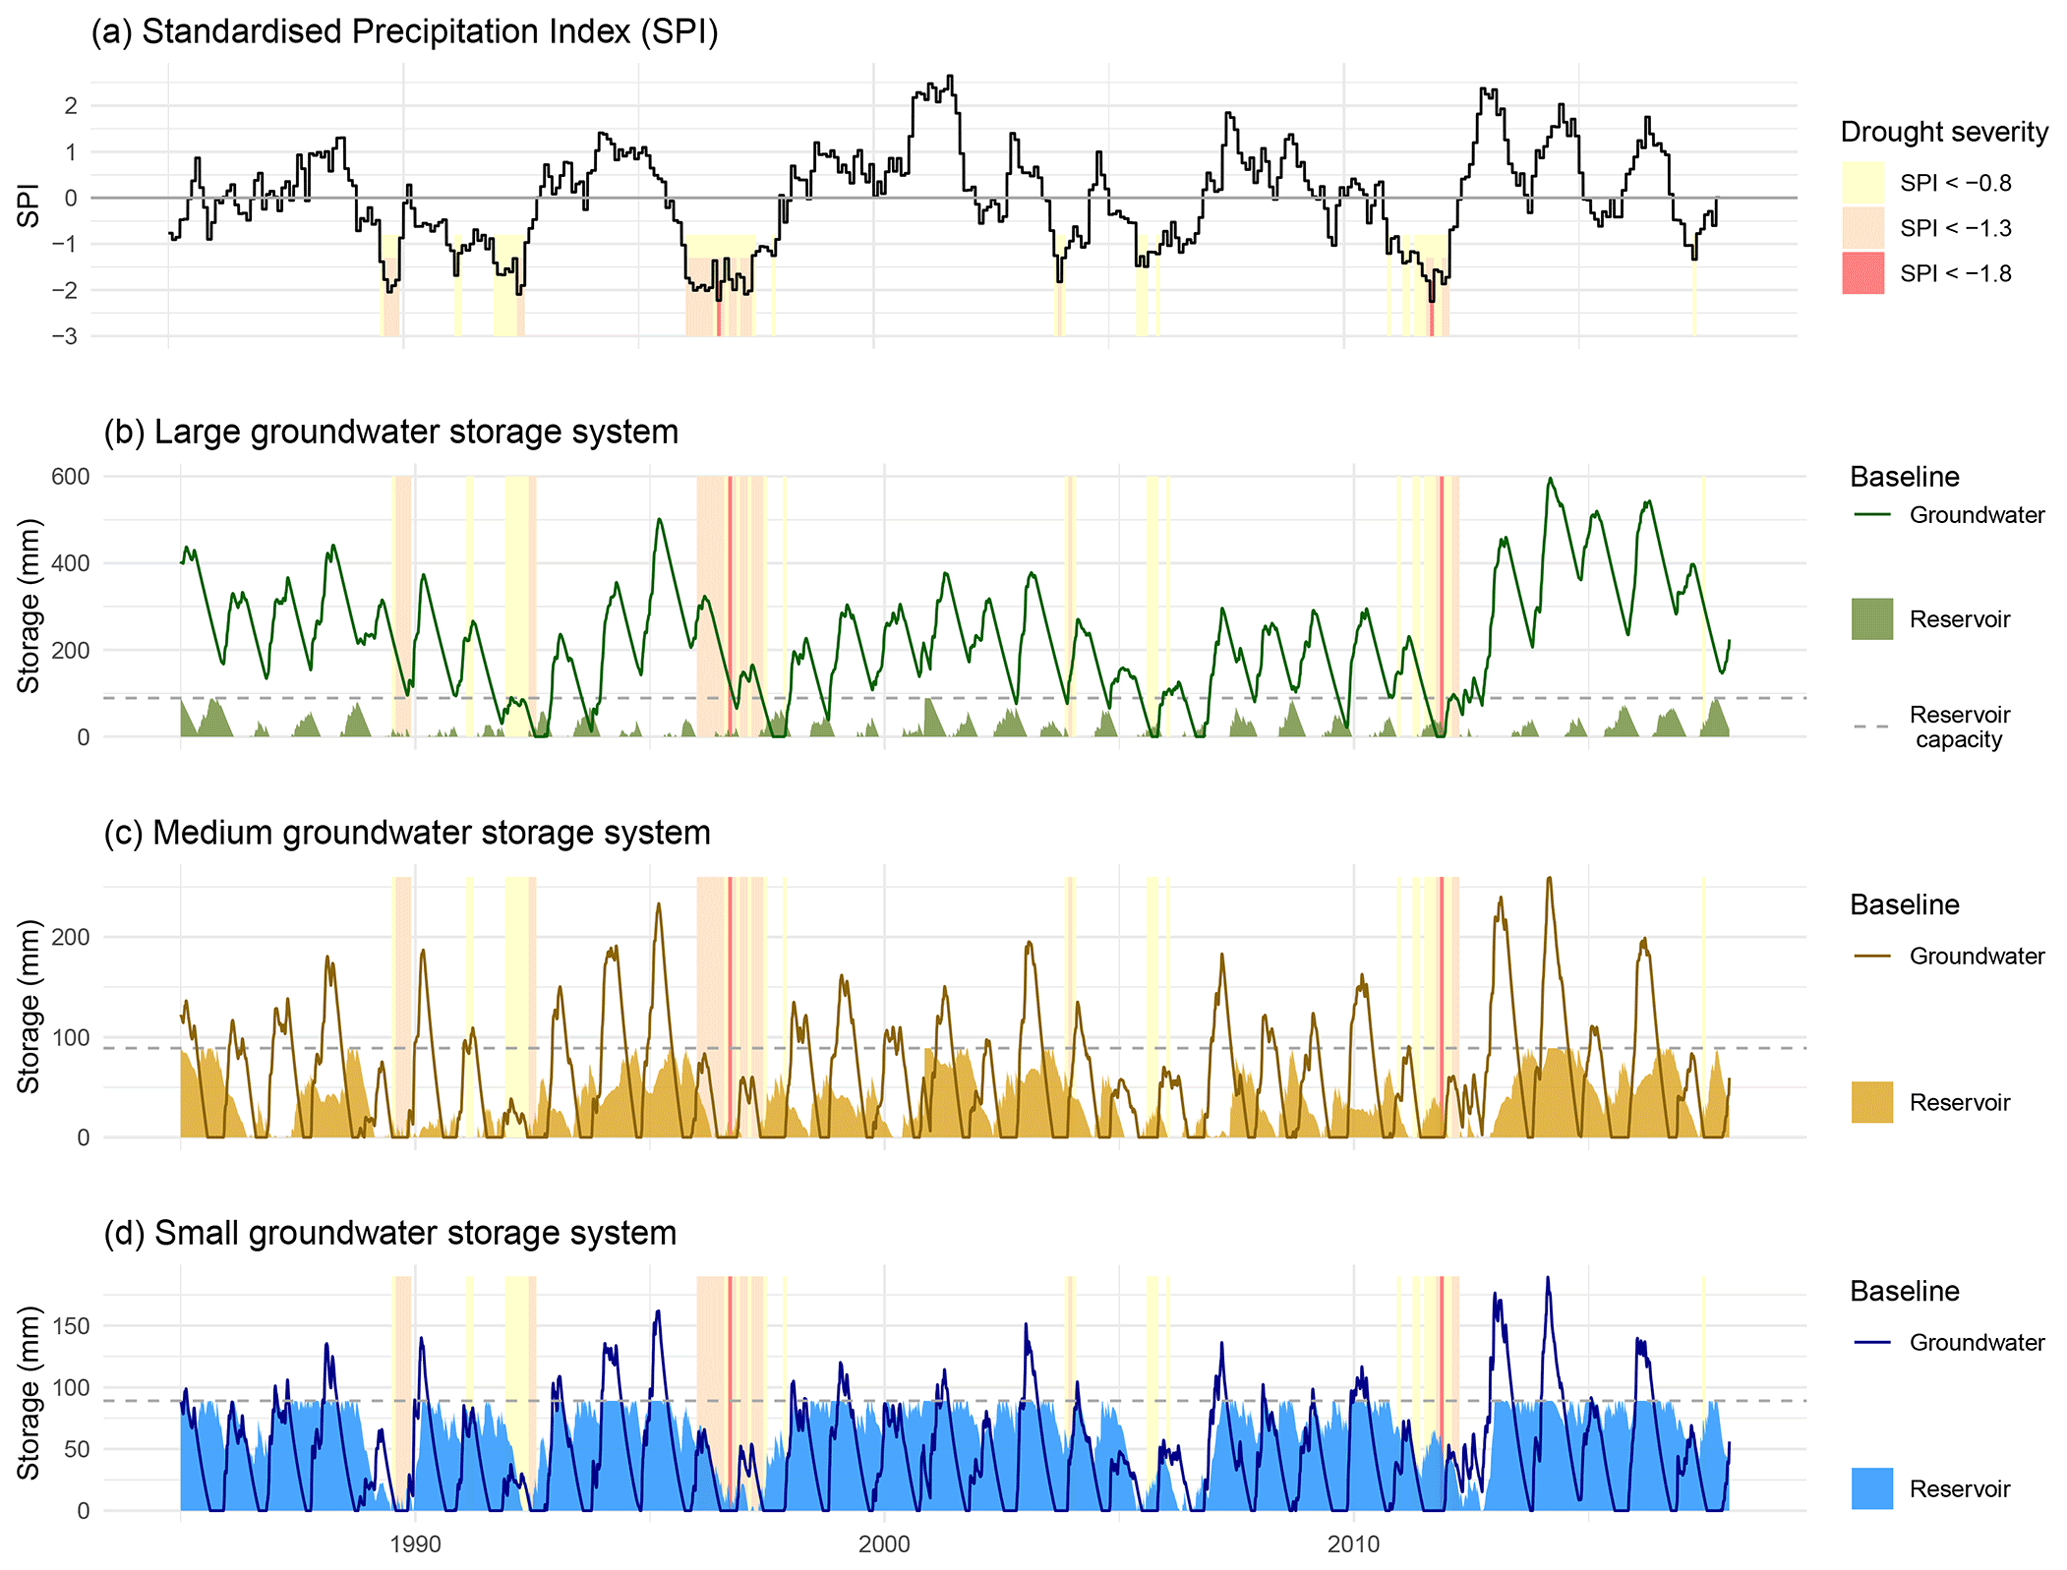
Figure 2Panel (a) shows the standardised precipitation index (SPI) for regionally averaged monthly precipitation. Drought severity is indicated in three colours according to the three drought stages in the drought management plans (Table 1). Panels (b–d) show daily baseline conditions for reservoir storage and groundwater availability for large (green), medium (gold) and small (blue) groundwater storage systems. Note that y axes are different for the three systems. Reservoir capacity is defined as the total long-term winter precipitation and, therefore, constant in the three systems.
Groundwater storage availability is highest in the large groundwater storage system and smaller for the other two systems (medium and small groundwater storage systems; Fig. 2). Groundwater storage in the large storage system shows a slower decline and, therefore, buffers more mild meteorological droughts compared to the other two systems for which groundwater storage declines rapidly in summer months, resulting in lower baseflow and ecological flow requirements in these systems. These results are similar for alternative storage discharge parameters (Fig. A5), suggesting that the difference is inherit to the different model structures. Compared to scenarios without water demand (Fig. A3), groundwater storage and baseflow are much lower, showing the pressure on groundwater systems given the current anthropogenic groundwater demand. The required additional groundwater imported to meet the daily groundwater abstractions represents a relatively small proportion of the total water demand (1 %) in the large groundwater storage system. In the medium and small systems, this share is larger (11 % and 17 %, respectively; see Fig. 3). Considering the similarity in results for the medium and small groundwater storage systems in surface water and groundwater availability, results for the drought management scenarios are only shown for the large and small groundwater storage systems.
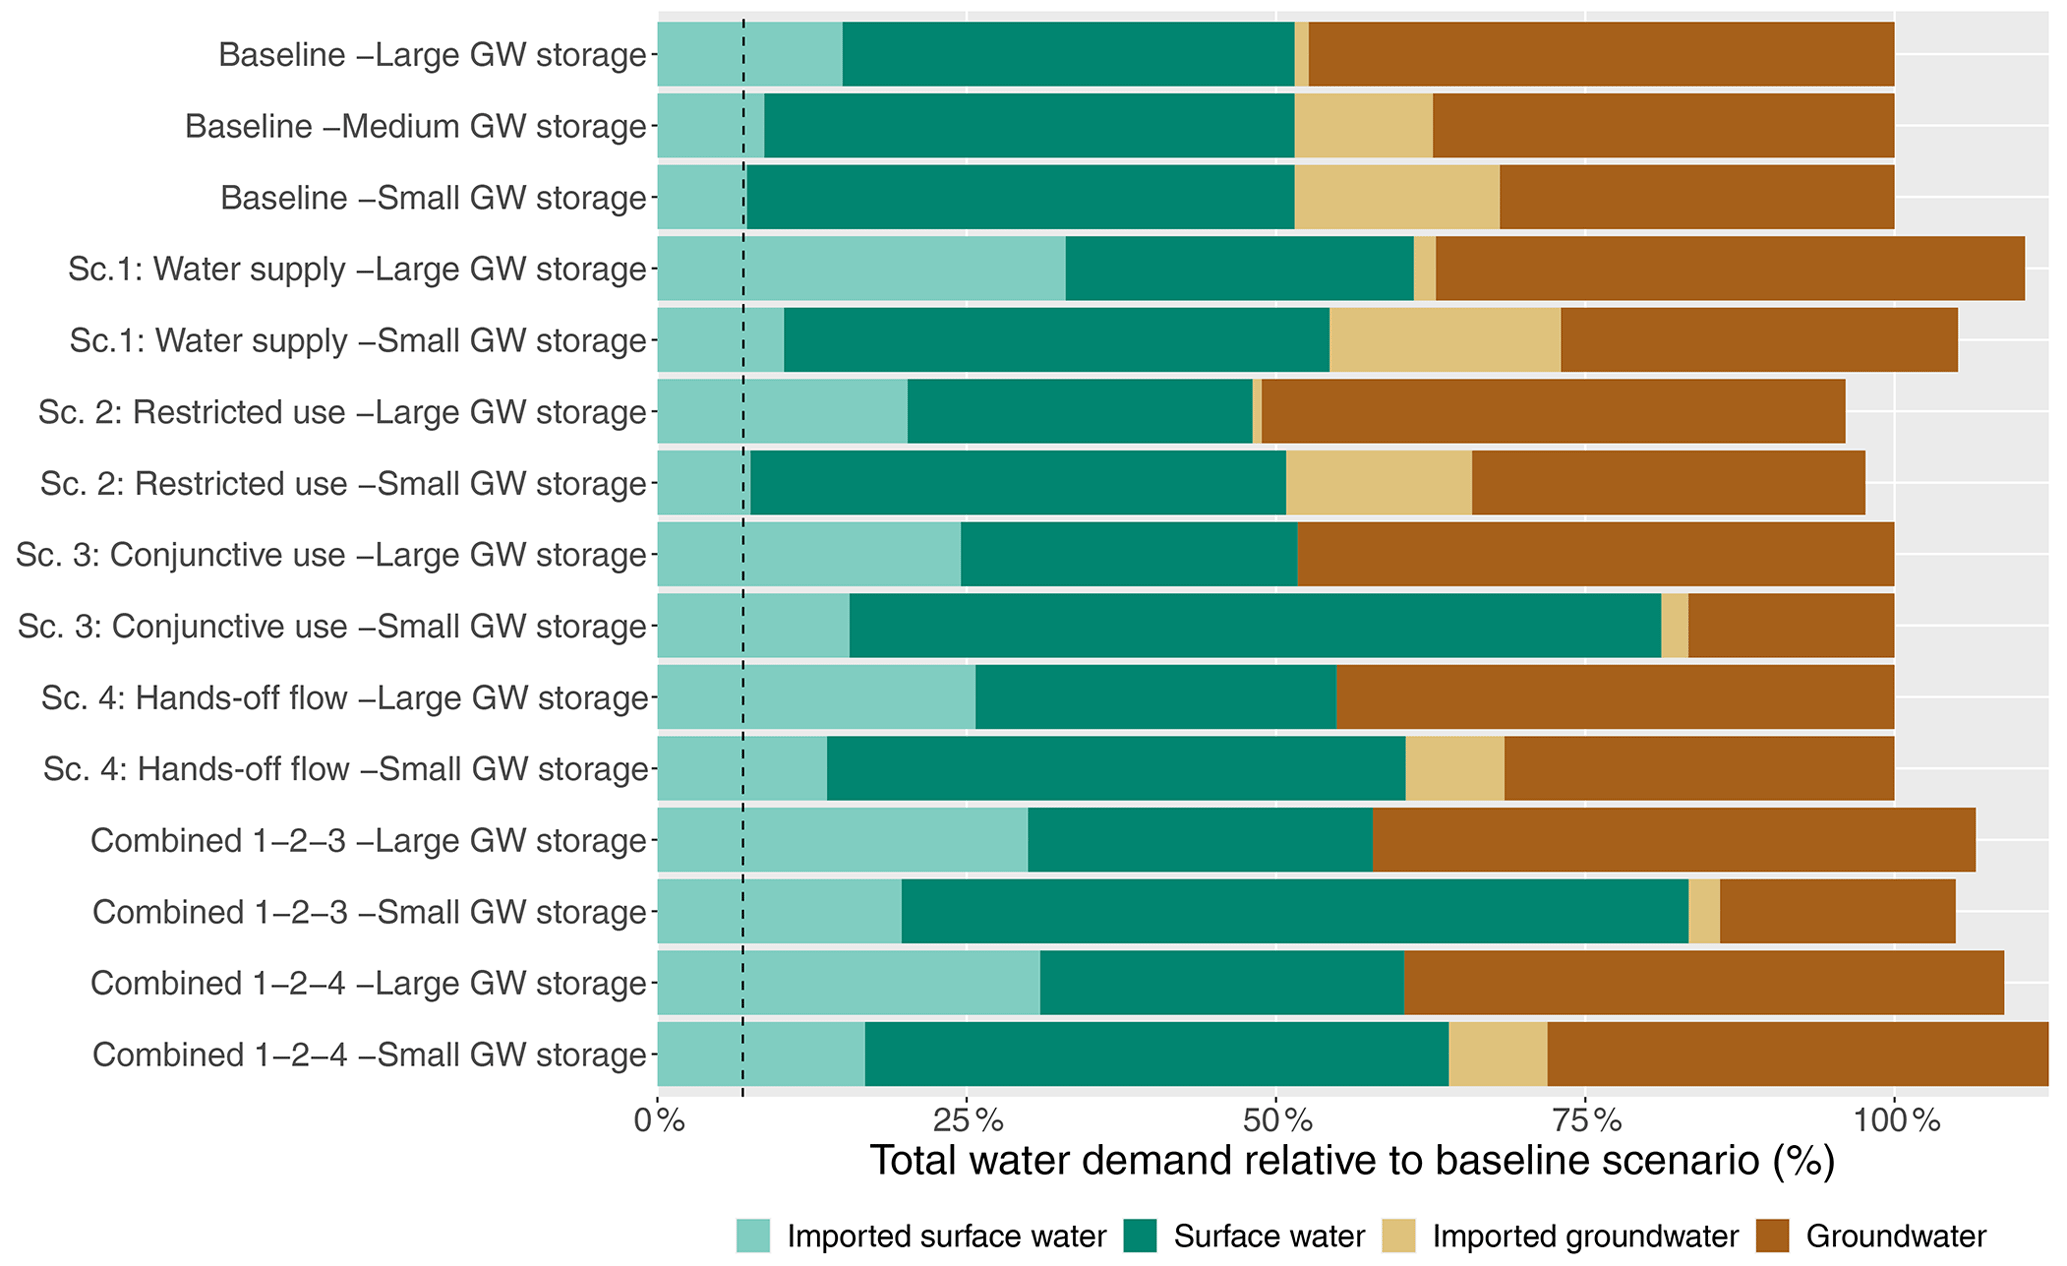
Figure 3Total water demand for the baseline scenario for the three groundwater storage systems (rows 1–3). Total water demand is met by a combination of surface water (imported and in the reservoir) and groundwater (imported and locally available). The constant surface water import of 6.9 % of the total anthropogenic water demand is indicated by the dotted vertical line. Separate drought management scenarios (rows 4–11) and combined scenarios (12–15) are shown for the large and small groundwater storage systems only. Note that total water demand in scenarios can be different to the baseline conditions due to the drought management strategies, and that 100 % refers to the total water demand in the baseline. The names of groundwater storage systems are abbreviated as small, medium or large GW storage for readability.
4.2 Drought management scenarios
Out of the four drought management scenarios, conjunctive use of surface water and groundwater has the largest impact on surface water and groundwater availability in the large and small groundwater storage system (Fig. 4). Results of the medium groundwater storage system are not shown as the results are very similar to the small groundwater storage system. In the conjunctive use scenario, surface water and groundwater use are integrated to meet the overall water demand, resulting in flexible water demand. In the small groundwater storage system, reservoir storage is used more intensively, representing 65.6 % of total water demand (Fig. 3). Applying conjunctive water use increases groundwater storage as groundwater use decreases to 17 %, resulting in a 50 % increase in baseflow compared to the baseline. In the large groundwater storage system, surface water and groundwater use change mainly in timing and show a minimal change in proportional surface water and groundwater use compared to the baseline (Fig. 3). Baseflow remains high, similar to the baseline, although groundwater storage reduces slightly (Fig. 4). Additional groundwater import reduces to a minimum in both systems, although this comes at the expense of imported surface water, which increases by 9.6 % and 8.3 % to 24.5 % and 15.5 % in the large and small groundwater storage systems, respectively (Fig. 3).
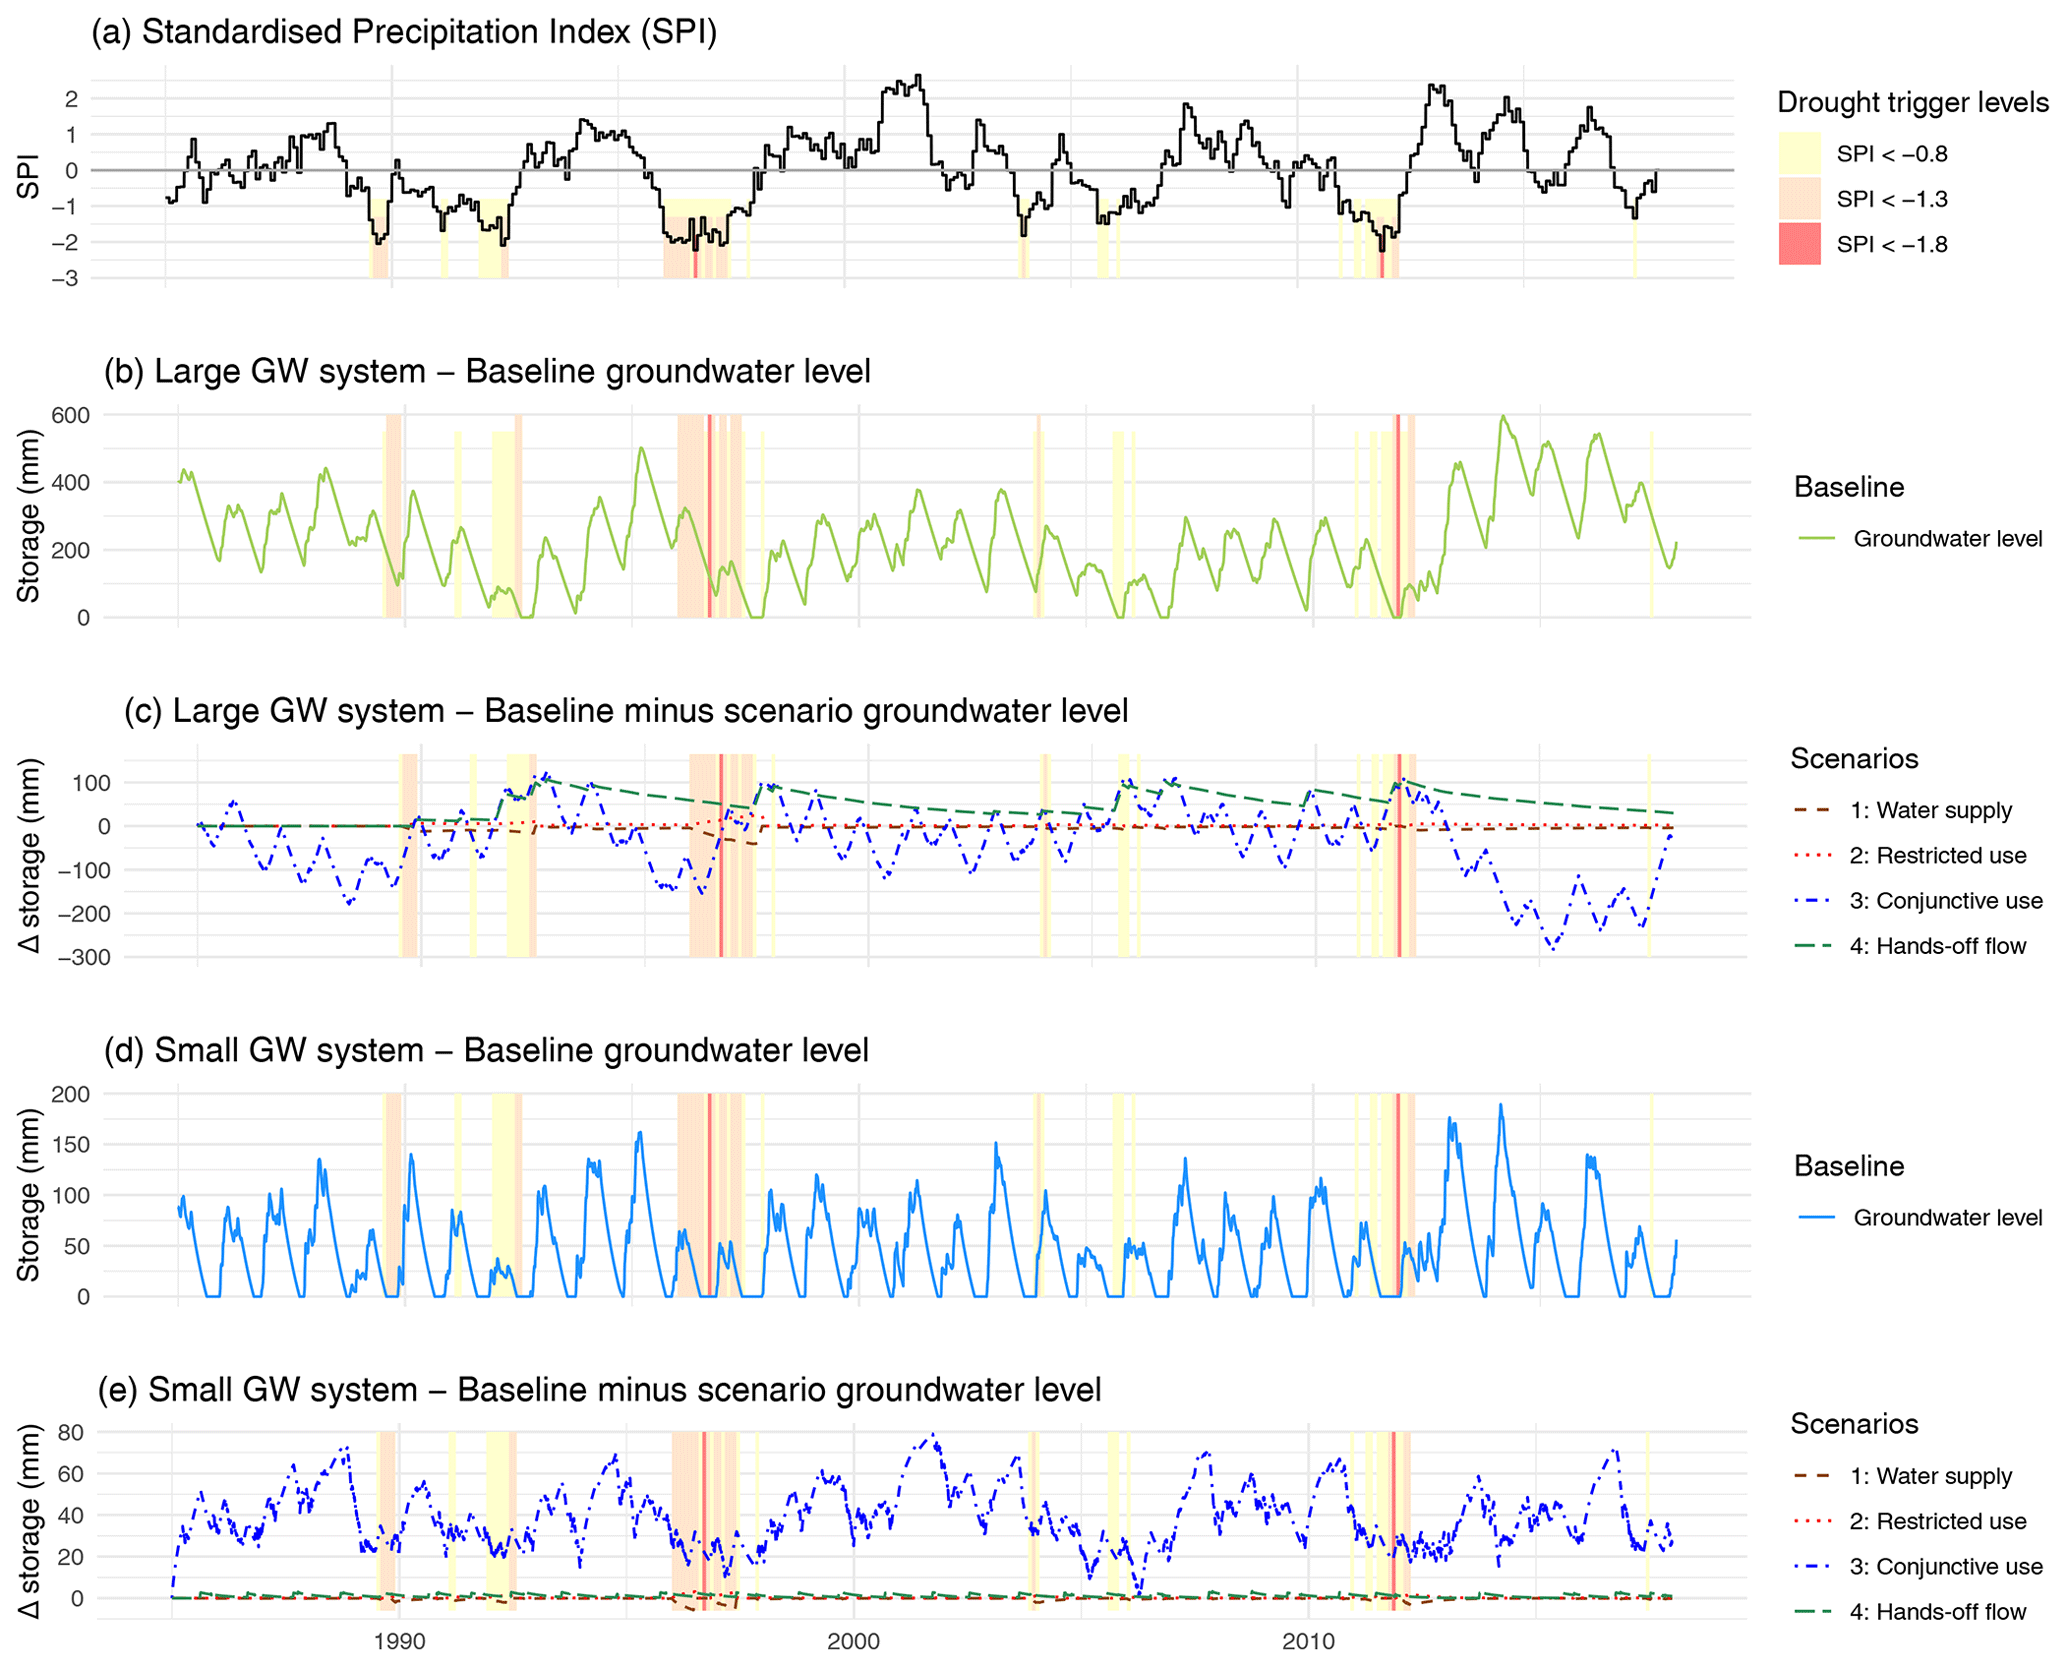
Figure 4Impact on groundwater storage following from the four separate drought management scenarios. Coloured surfaces match the increasing severity of meteorological droughts (related to trigger levels; see Table 1). Baseline conditions for large and small groundwater storage systems are shown in panels (b) and (d). Panels (c, e) show the impact on storage (baseline minus scenario). Applied rules for the four separate drought management strategies are presented in Table 2.
Second to the conjunctive use scenario, the fourth scenario, hands-off flow, also has substantial impact on the large groundwater storage system, resulting in higher groundwater storage and baseflow (on average 14 %; groundwater time series are shown in Fig. 4). The restrictive use of groundwater to maintain ecological minimum flow requirements results in a continuous increase in groundwater storage in the large storage system, compared to periodic increases in storage in the small storage system. The periodically increasing groundwater storage results in a small increase in baseflow (on average 1 %), suggesting that this scenario has much less impact on the small groundwater storage system. With the restricted use of groundwater, surface water demand increases 2.2 % to meet the anthropogenic water demand. Consequently, imported surface water increases by 6.5 % in the small storage system. In the large storage system, reservoir storage is already optimised and a larger proportion of imported surface water (additional 10.7 %) is used to meet the remaining anthropogenic water demand (Fig. 3).
The first two scenarios introduce drought mitigation strategies during meteorological droughts that result in periodic increases/decreases in surface water and groundwater storage (Fig. 4). The first scenario that increases water supply during droughts results in small storage deficits that recover after the drought events. The second scenario introduces reductions in water demand and shows a similar, but opposite, pattern with increasing groundwater storage during most severe meteorological droughts caused by the severe restrictions on water demand. Compared to the baseline, water restrictions in the second scenario reduce the overall water demand slightly for large and small storage systems (96 % and 98 %, respectively; Fig. 3). The impact of the first scenario (increased water supply) is larger, as the total water demand exceeds the baseline water demand by 11 % and 5 %, respectively, for large and small groundwater storage systems due to increased surface water import (Fig. 3).
The two combined drought management scenarios show an overall increase in baseflow and groundwater storage. Combining conjunctive use with scenarios 1 and 2 (combined 1–2–3 scenario) increases groundwater storage in the small groundwater system and results in a higher baseflow of 42 % on average. Groundwater storage reduces slightly in the large storage system, but baseflow remains high. For the large storage system in particular, combining hands-off flow with scenarios 1 and 2 (combined 1–2–4 scenario) increases baseflow up to 14 %, compared to only a 1 % increase in the storage small system. Both combined scenarios result in a slightly higher total water demand compared to baseline due to increased water supply during droughts in scenario 1. However, the total water demand is lower compared to scenario 1, implying that water demand restrictions (scenario 2) compensate for additional water supply during droughts. The use of imported groundwater reduces in both combined scenarios, but the dependency on imported surface water increases, which is related to import of surface water as reservoir levels fall below 25 % (Table 3). This is because reservoir triggers are activated during most meteorological droughts by importing surface water to complement low reservoir levels (see the time series of reservoir levels in Fig. A4).
4.3 Impact on hydrological droughts
In the baseline, there is a large difference in hydrological drought characteristics between the two groundwater storage systems (Table 4). Baseline conditions show longer baseflow and groundwater droughts (on average 333 and 344 d) in the large groundwater storage system compared to shorter hydrological droughts in the small storage system (66 and 88 d for baseflow and groundwater). Alternative storage discharge parameters, including longer response times (Table 2), result in a slight increase in average drought duration and a particularly large increase in maximum drought duration (Fig. A6). The drought intensity of shorter hydrological droughts is remarkably high in the small groundwater storage system, resulting in no flow or extremely low storage levels, with a rapid recovery during winter months and an overall flashy time series for both baseflow and groundwater (Fig. 5). When winter recharge is low, high drought intensities are found compared to hydrological drought intensity of the large groundwater storage system. Due to the higher storage component, precipitation deficits have a longer propagation with consequently fewer, more intense hydrological droughts. The small groundwater storage system is on the other end of the spectrum, with double the number of groundwater droughts compared to meteorological droughts. Given the different drought characteristics in the large and small groundwater storage systems, the impact of drought management strategies (separately or combined) is also variable and sensitive to the primary groundwater storage availability.
Table 4Hydrological drought duration, maximum intensity and drought frequency for the large and small groundwater storage systems. Mean hydrological (baseflow and groundwater) droughts are presented for baseline, combined 1–2–3 and combined 1–2–4 scenarios. See Table 3 for specific drought strategies in these scenarios. Groundwater storage time series and groundwater droughts are shown in Fig. 5.
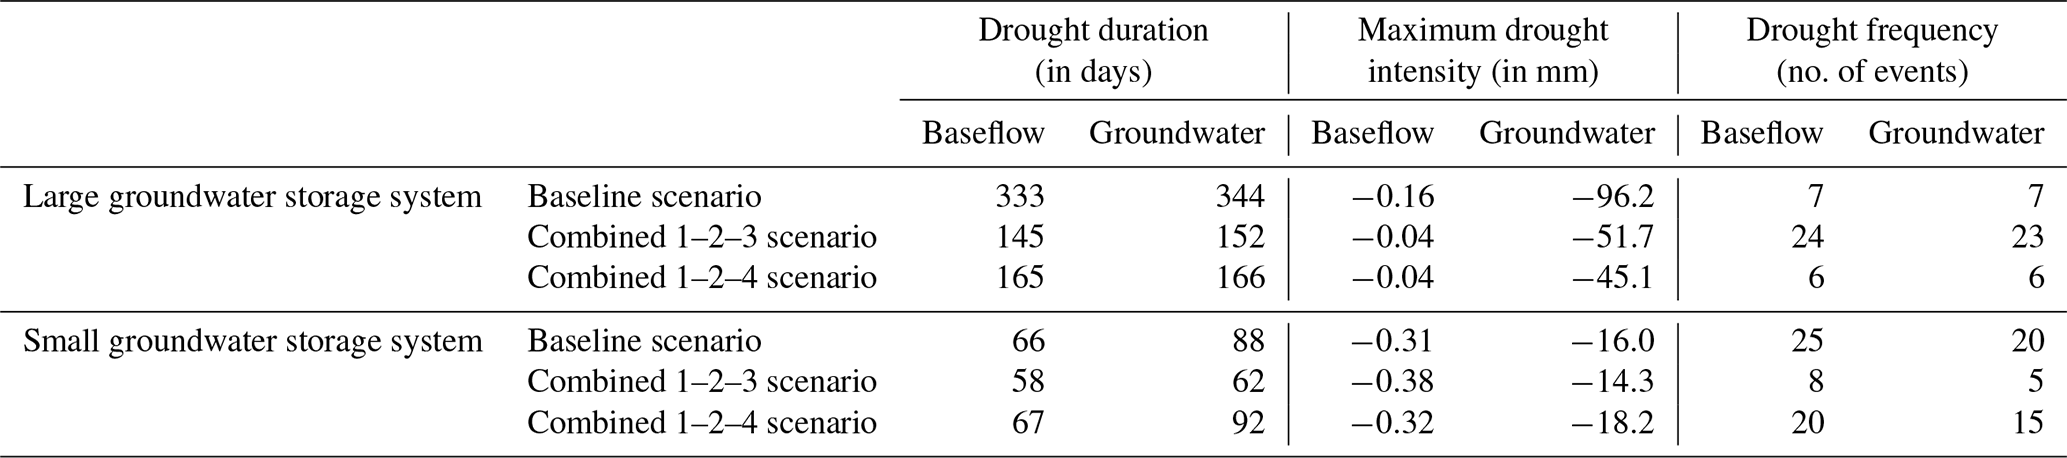
In the combined scenario including conjunctive use (combined 1–2–3), groundwater droughts are shorter in both systems compared to baseline conditions (Table 4). Hydrological drought intensities reduce in the large groundwater storage system, compared to a slight increase in baseflow droughts in the small storage system. Drought frequencies of both baseflow and groundwater show a sharp contrast between the two systems, as drought frequency increases from 7 events to 24 and 23 for baseflow and groundwater in the large storage system, compared to a reduction in hydrological droughts in the small storage system. Groundwater time series in the small storage system in Fig. 5 show that short groundwater droughts are alleviated, and remaining events are of a shorter duration and reduced intensity. However, in the large storage system, hydrological drought frequency increases, and when longer response times are modelled, drought duration increases too (Fig. A6). Drought events occur without initial precipitation deficits, which might be related to the altered reservoir and groundwater abstractions.
The combined scenario including hands-off flow (combined 1–2–4) also shows mixed impacts on hydrological droughts in the two systems. In the large groundwater storage system, drought intensity and duration reduce on average compared to baseline conditions (Table 4). This result is consistent for alternative storage discharge parameters (Fig. A6). Time series show alleviated groundwater droughts in 1993 and 2009 (Fig. 5). In the small storage system, however, the impact of the 1–2–4 combined scenario is much lower, with a slight reduction in drought intensity and duration. This is not surprising considering the overall low ecological minimum flow and, respectively, limited impact with introducing groundwater use restrictions.

Figure 5Hydrological droughts shown for the baseline scenario and the six tested drought management scenarios (four separate scenarios and two combined scenarios). In panels (a) and (c), time series of groundwater level variation in the two groundwater storage systems (large and small) are shown for both baseline (black) and combined scenarios (combined 1–2–3 in dotted blue and combined 1–2–4 in striped red). Baseline drought events are marked in grey, following the drought threshold (grey striped). Coloured surfaces indicate mild, moderate and severe meteorological droughts (measured in SPI), following definitions in Table 1 and the colour scale of Fig. 2. In panels (b) and (d), groundwater drought occurrence and maximum intensity is shown for drought management scenarios for both catchments. Note that the coloured maximum drought intensity scale is the same for both catchments, with red being the most severe and blue representing least intense droughts.
4.4 Sensitivity analysis
The sensitivity analysis aims to test mean parameter values in the context of a larger relevant range, as reported in the case study. First, the groundwater storage outflow parameter is tested using the reported mean characteristics for karstic, porous and fractured aquifers in England (Allen et al., 1997) and the tested parameters in Stoelzle et al. (2015) (also see Table 2). The second parameter test examines the large range of overall water demand based on the reported range by drinking water companies (Table A1). Other parameters in the water balance model were not changed from the previously tested hydrological drought model by Van Lanen et al. (2013).
4.4.1 Groundwater storage outflow parameters
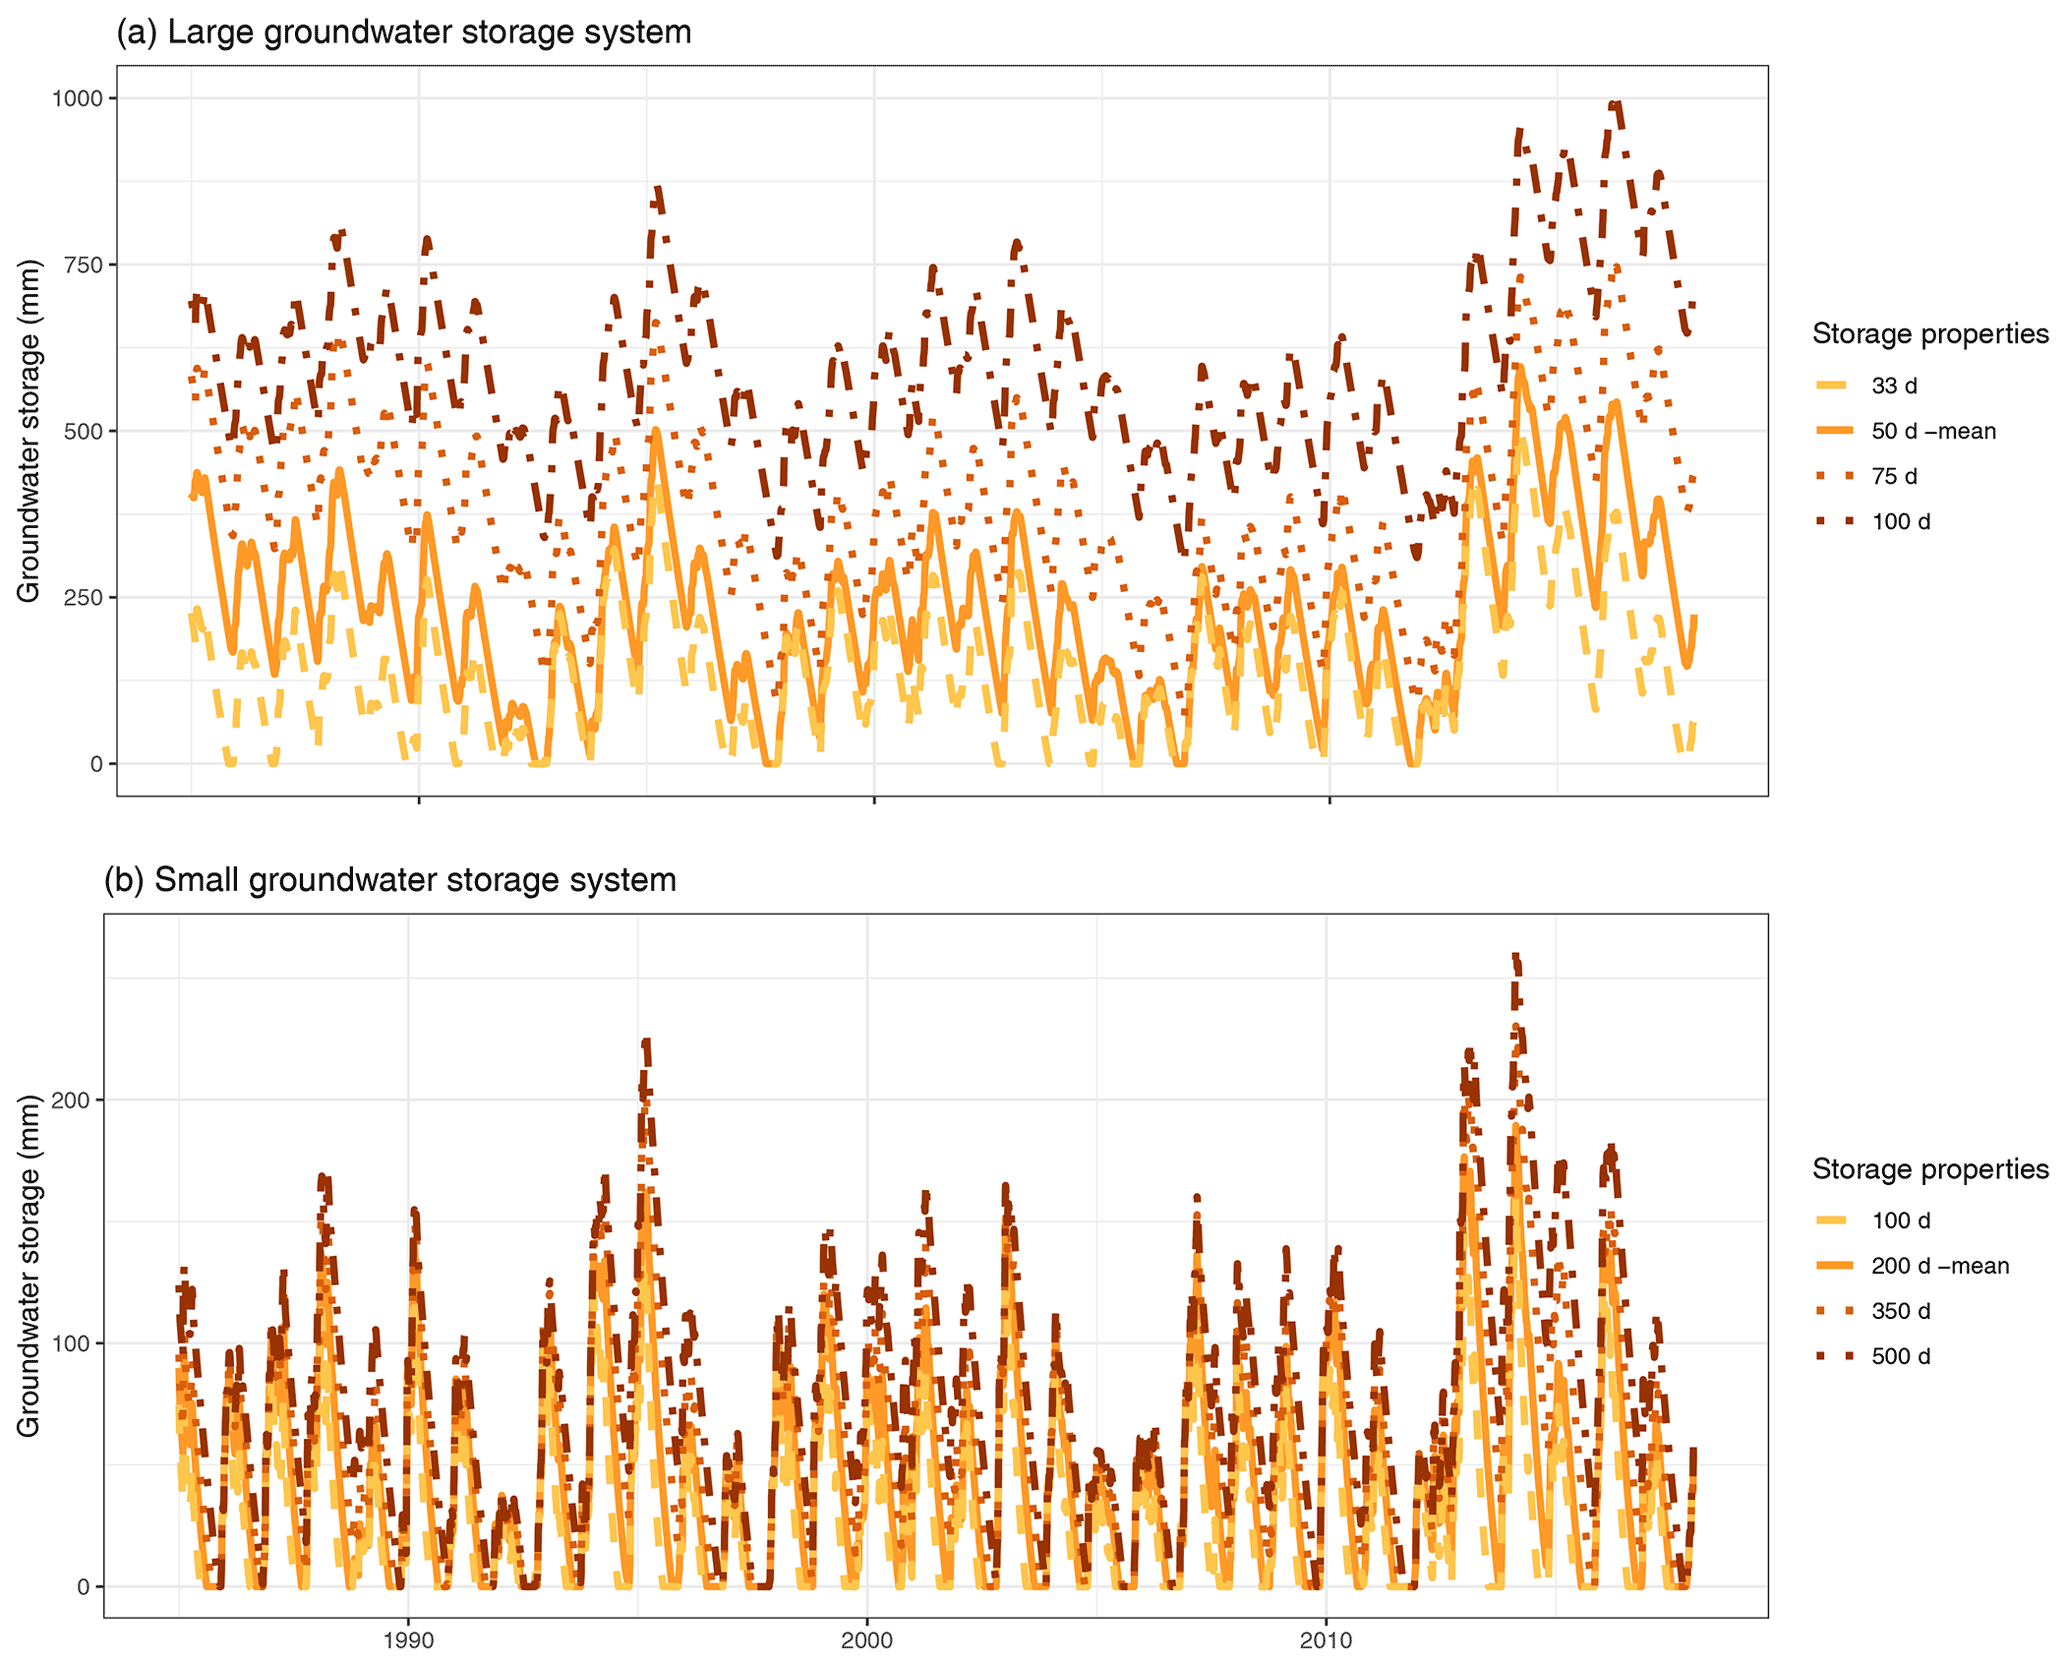
Sensitivity tests show that the absolute groundwater storage in the large groundwater storage system is highly sensitive compared to the small groundwater storage system (time series are shown in Fig. A5). However, this sensitivity has limited consequences for hydrological droughts in the large groundwater system, as drought duration and intensity increase slightly for each drought event (Fig. 6). In the small groundwater system, hydrological drought duration nearly doubles when modelling longer response times (smaller storage outflow parameters). Maximum hydrological drought duration increase from 137 d (baseflow) and 237 d (groundwater) to 273 and 455 d, respectively. These droughts also increase slightly in intensity but much less compared to the drought duration (Fig. 6).
When running the drought management scenarios (combined scenarios only) with these different groundwater storage outflow parameters, a reduction in the overall hydrological drought intensity and duration is evident for most scenarios (see Fig. A6). The combined scenario 1–2–4 (including maintaining the ecological minimum flow) reduces the hydrological drought duration for all groundwater storage outflow parameters, even for longer response times (smaller storage outflow parameters) in the two different groundwater storage systems (Fig. A6). The combined scenario 1–2–3 (including conjunctive use) results in longer, but less severe, droughts, particularly for increased storage parameters in the small groundwater storage system. In the large groundwater system, groundwater drought duration increases dramatically with the highest groundwater storage parameter, as groundwater storage declines in this scenario and falls below the drought threshold, resulting in a depleted system with an exceptionally long drought.
4.4.2 Overall water demand
Altering the overall water demand by 5 % shows the sensitivity to increasing pressure on water resources, resulting in lengthened droughts in the large groundwater storage system and an increase in surface water import. When increasing the water demand (from 88.5 % to 93.5 %), hydrological drought duration in the large groundwater storage system lengthens up to 866 or 867 d for baseflow and groundwater, respectively (Fig. 6). This nearly doubles the hydrological drought duration in the baseline (Table 4). Increased water demand also results in additional shorter events that increase the drought frequency. Reducing water demand by 5 % results in fewer severe droughts (Fig. 6). This drought alleviation would, however, require a permanent cut in the water consumption in addition to the introduced water restrictions during drought events. The small groundwater storage system is much less sensitive to increasing/decreasing water demand, as drought duration and severity are similar to the baseline. However, drought characteristics might not show the impact of altered water demand, as these tests mainly change the proportion of imported groundwater and surface water.
When testing the total water demand with the combined scenarios, the primary finding is an increase in imported surface water and groundwater. Both combined drought scenarios reduce hydrological droughts successfully (Fig. A7), although this comes at the cost of increased surface water and groundwater imports. For example, increased water demand (93.5 %) in the large groundwater storage system with the combined 1–2–4 scenario reduces maximum hydrological drought duration from 866 and 867 to 308 and 309 d for baseflow and groundwater, respectively (Fig. A7). This drought alleviation comes with an increase in imported surface water representing up to 30 % of the total increased water demand. Reduced water demand (83.5 %) results in shorter droughts of maximum 218 d, with slightly less surface water import (27 % of total water demand). These increased percentages of imported surface water show the pressure on water resources and the true cost of reducing hydrological droughts in combined drought management scenarios.

Figure 6Impact of increased/decreased modelled storage outflow parameters and increased/decreased water demand on groundwater drought characteristics (drought duration and maximum intensity). The range and reference for tested groundwater storage outflow parameters can be found in Table 2. The range of documented water allocation of the selected drinking water companies can be found in Table A1. (a, b) Drought characteristics of the large groundwater storage system. (c, d) Drought characteristics for the small groundwater storage system. Drought impacts following mean values for storage outflow parameters and water allocation are shown in squares (all panels).
5.1 Model
In this study, the impact of drought management strategies on hydrological droughts was investigated using a socio-hydrological model for a range of hydrogeological conditions. Comparing different drought management strategies in a quantitative manner, as presented here, complements qualitative comparisons of previous studies (White et al., 2001; Wilhite et al., 2014; Urquijo et al., 2017). Some of the tested strategies have been assessed separately, as studies focused on either water demand (Low et al., 2015; Maggioni, 2015; Gonzales and Ajami, 2017; Hayden and Tsvetanov, 2019), adaptive water management (Thomas, 2019; White et al., 2019) or conjunctive use combined with managed aquifer recharge to increase drought resilience (Scanlon et al., 2016; Alam et al., 2020). Jaeger et al. (2019) and Dobson et al. (2020) show that combined drought policy interventions mitigated streamflow droughts by altering reservoir storage regulations and transfers. Results in this study agree with these findings showing reduced baseflow droughts in combined and separate drought management scenarios, but important differences are found between the tested hydrogeological conditions. When integrating both reservoir and groundwater storage by applying conjunctive use in a system with small groundwater storage availability, baseflow increases and hydrological droughts reduce. This comes, however, at the expense of additional surface water import that fulfils storage deficits in groundwater. Even though water is regularly transferred between water companies (Dobson et al., 2020), percentages exceeding 10 % of the total water demand are uncommon (see Table A1 for normal conditions). In a system with large groundwater storage availability, conjunctive use reduces the intensity of hydrological droughts, but restricted groundwater use during low flow periods proves to be most effective in reducing hydrological droughts when additional surface water imports are available.
The different responses to drought management strategies are also related to the different drought characteristics of the large and small groundwater storage systems. These hydrogeological conditions show a positive relation between drought duration and groundwater storage outflow properties, confirming earlier studies in natural settings using a virtual model (Van Lanen et al., 2013; Van Loon et al., 2014) and a spatially distributed model (Carlier et al., 2019). Hydrological droughts in the large groundwater storage system are longer and have a longer drought recovery. In the small groundwater storage system, mostly short climate-controlled droughts are observed, a result which was also found by Stoelzle et al. (2015). Both baseflow and groundwater droughts have a short response time and limited lengthening of hydrological droughts even when the pressure on the water resources increases. These findings match observations made across England's aquifers that are characterised by a small or large groundwater storage availability (Bloomfield and Marchant, 2013; Bloomfield et al., 2015).
5.2 Impact of drought management strategies on hydrological droughts
Out of the four separate drought management strategies, conjunctive use is most effective in easing pressure on water resources resulting in reduced hydrological droughts, increased baseflow and groundwater storage, particularly in the small groundwater storage system. Scenarios show the potential of integrating both water resources as a management strategy, resulting in increased drought resilience (Scanlon et al., 2016; Noorduijn et al., 2019; Holley et al., 2016). However, conjunctive use does not create water but optimises storage use, particularly in catchments with large reservoir storage (Bredehoeft, 2011). Flexible use of surface water and groundwater aligns the timing problem between water demand and availability (Taylor et al., 2013; Cuthbert et al., 2019). It should also be noted that conjunctive use could also alter the river regime (not tested due to model set-up), resulting in adverse impacts on ecohydrology (Rolls et al., 2012). We observed altered groundwater storage patterns in the large groundwater storage system, resulting in lower groundwater storage with more frequent, but less intense, hydrological droughts with potentially severe consequences for longer meteorological droughts. This was also found by Shepley et al. (2009), who found that groundwater levels fell due to increased groundwater use in England's conjunctive use system. Optimising the timing of surface water and groundwater use seems key for a successful conjunctive system, although the required flexibility might have practical limitations for water managers (Bredehoeft, 2011). For example, water use licenses are often set to a specific water source, and re-allocation of water licenses can be difficult, which limits the implementation of conjunctive use (Holley et al., 2016). However, a degree of flexibility can be achieved when water management units are large enough to contain multiple source-specific licenses (Shepley et al., 2009; Fowler et al., 2007; Thorne et al., 2003).
Maintaining the ecological minimum flow requirements is also very effective in mitigating hydrological droughts, particularly in the large groundwater storage system. This confirms earlier findings focusing on the protection of ecosystems using trigger-level regulations (Werner et al., 2011; Noorduijn et al., 2019). Crucial to the success is the integration of surface water and groundwater use to maintain low flows (Howarth, 2018). However, results show that impact of restricting groundwater use during low flows relies on the defined trigger level (defined ecological minimum flow) and baseflow component, as protecting the minimum flow might not preserve natural or undisturbed river flows (Howarth, 2018). When increasing storage outflow parameters in the sensitivity analysis and, thereby, increasing the baseflow component, the impact of restricting groundwater use increases. Crucially, hydrological droughts aggravate when the ecological minimum flow is neglected and groundwater use reduces the environmental flow (Gleeson and Richter, 2018; De Graaf et al., 2019). These crucial sensitivities to different groundwater storage outflow parameters show the value of conceptual socio-hydrological modelling, the outcomes of which could be used in the discussion regarding the protection of groundwater-dependant ecosystems and the status of protected water bodies (Ohdedar, 2017; Howarth, 2018).
Combined drought management strategies primarily show the impact of conjunctive use and restricted groundwater use in both systems. The impact of drought mitigation scenarios 1 and 2 (increased water supply and restricted water demand) is mostly noticeable during extreme drought conditions when water demand reduces more than water supply increases. In most extreme drought conditions, water demand reduces by 36 %, which is similar to the extreme water reductions realised in Melbourne, Australia, during the Millennium Drought (Low et al., 2015) but not as low as water restrictions enforced in some parts of Cape Town, South Africa, during the Day Zero crisis (Rodina, 2019; Garcia et al., 2020).
When introducing a permanent increase in water demand (+5 %), the effect on water resources is evident as hydrological droughts increase disproportionally in duration, and the required additional surface water is imported to meet the anthropogenic water demand. Further research is required to assess if these volumes of imported water are obtainable during droughts, especially considering the scale of drought events and potentially limited water availability at regional or even national scales.
Alternatively, catchment-specific modelling could investigate if storing more surface water during winter in, for example, a small groundwater system, would aid in meeting the higher surface water demand in summer (Peñuela et al., 2020; Delaney et al., 2020) or allow for additional groundwater recharge (He et al., 2021). Reducing water demand (−5 %) results in shorter hydrological droughts and less imported water, but realising a permanent reduction in water demand can come at high costs for both drinking water providers and/or water users and might not always be successful (Low et al., 2015; Gonzales and Ajami, 2017; Muller, 2018; Caball and Malekpour, 2019; Simpson et al., 2019). Generating more awareness and reducing water demand prior to the actual water shortage might also result in better adaptive management of water resources (Garcia et al., 2016; Noorduijn et al., 2019; Garcia et al., 2020; Thomann et al., 2020).
5.3 Model limitations
Limitations of the conceptual socio-hydrological model are related to the overall drawbacks of using a lumped and idealised hydrological model. When determining water availability for specific regions in England, the model runs should be revised using less generic, locally relevant climate data. Moreover, given the range in local water resource availability and drought management practices (Tables 1 and A1), current generic water resource management settings in the baseline might not represent all local water management strategies. Water resource availability in this model is based on annual available surface water and groundwater, implying that actual surface water storage and groundwater storage might be larger than shown here.
The lumped model structure reduced the testing of some drought management strategies that would require a spatially distributed model. Out of the listed strategies (Table 1), four drought scenarios were tested in this study. Other measures, such as river augmentation (groundwater abstraction to supplement river flow or maintain ecological minimum flows during drought), reduction in pressure on the water network and the reuse of urban wastewater could not be modelled. A spatially distributed set-up could further the current analysis, as the spatial impact of increased abstractions to the stream could not be included (Gleeson and Richter, 2018), which would be relevant for estimating the regional impact on hydrological droughts of scenarios applying conjunctive use or maintaining ecological flow requirements. The latter scenarios represent only restricting groundwater abstractions to meet environmental flow requirements that could be extended to a combination of reservoir releases and groundwater restrictions, depending on relevant catchment characteristics (Environment Agency, 2019c). A spatially distributed model set-up would also improve the representation of groundwater storage, as lateral groundwater flow is excluded in the lumped model set-up. Inflow from deeper aquifer layers is limited to the imported groundwater component in the model.
If more water demand or water management data were available, current assumptions could be improved. For example, the static water demand could be substituted by a dynamic water demand component or increased awareness of water stress (Garcia et al., 2016) if this were supported by water resource or drought management plans. Conjunctive use scenarios could also benefit from additional information regarding general water management practices, as practical constraints to flexible water storage can limit the effectiveness of conjunctive use (Holley et al., 2016).
This study presents a socio-hydrological model that was used to evaluate the impact of water demand and drought management strategies on hydrological droughts. In the socio-hydrological model, different groundwater storage availability was modelled revealing different drought characteristics and impact of integrated drought management strategies on hydrological droughts. Baseline conditions show that hydrological droughts occurred frequently and were mostly climate-driven, although amplified by water use in the system with small groundwater storage availability. External water imports were necessary to meet water demand periodically. The system with large groundwater storage availability has a larger inter-annual groundwater storage compared to the small groundwater storage system resulting in fewer, but more intense hydrological droughts amplified by water use.
Introducing integrated drought management strategies to the different groundwater storage systems relieved both streamflow and groundwater droughts in nearly all scenarios. Most hydrological droughts are alleviated when applying conjunctive use and maintaining the ecological flow requirements by restricting groundwater use. The conjunctive use scenario allowed a more optimal use of reservoir storage and delayed response of groundwater storage resulting in reduced and sometimes alleviated streamflow droughts in the small and large groundwater storage systems. These findings encourage further exploration of conjunctive use as a drought mitigation strategy, particularly in small groundwater storage systems. The impact the restricted groundwater use to maintain ecological flow requirements (hands-off flow) was found sensitive to the baseflow component, as hydrological droughts are effectively reduced under a range of storage outflow parameters and when overall water demand increased/decreased.
The novelty of this study lies in the introduction of the socio-hydrological model to assess of the impact of integrated drought management strategies on both streamflow and groundwater droughts. Results show how strategies as conjunctive use and maintaining ecological flow requirements reduce and alleviate hydrological droughts. The low sensitivity of these drought management strategies to different hydrogeological conditions highlights the wide applicability of results and gives confidence in the tested combined and separate scenarios. However, the considerable pressure on water resources is evident when the overall water demand increased, as drought duration increases disproportionally and additional surface water is required to meet the anthropogenic water demand. Further conceptual modelling could investigate the introduced dependency on imported water with these drought management strategies. The necessity for importing water shows the considerable pressure on water resources and the delicate balance of water–human systems during droughts that calls for sustainability targets within drought policies.
A1 Water use and sources of water supply for drinking water companies in England
Table A1Summary of characteristics of the drinking water companies that use both surface water and groundwater in England. The drinking water companies of South West Water and Northumbrian Water have therefore been excluded from this overview. Data of latest water resource management plans have been used (see Table A2 for sources). Imported and exported percentages are marked with an asterisk when the source was undefined (or potentially mixed). Thames Water values are shown for both London and outer areas in parenthesis. Headroom is calculated by taking the reported baseline conditions of demand and supply (dated in 2019–2020) and comparing these values with published data of the Environment Agency (2019b).
A2 Drought management plans of drinking water companies
Table A2Locations of the drought management plans of 13 drinking water companies in England. All drought management plans are publicly available (see the second column). The most recent date of the report (updated every 2–5 years) is shown in third column, with the last access date for all links given below the table.
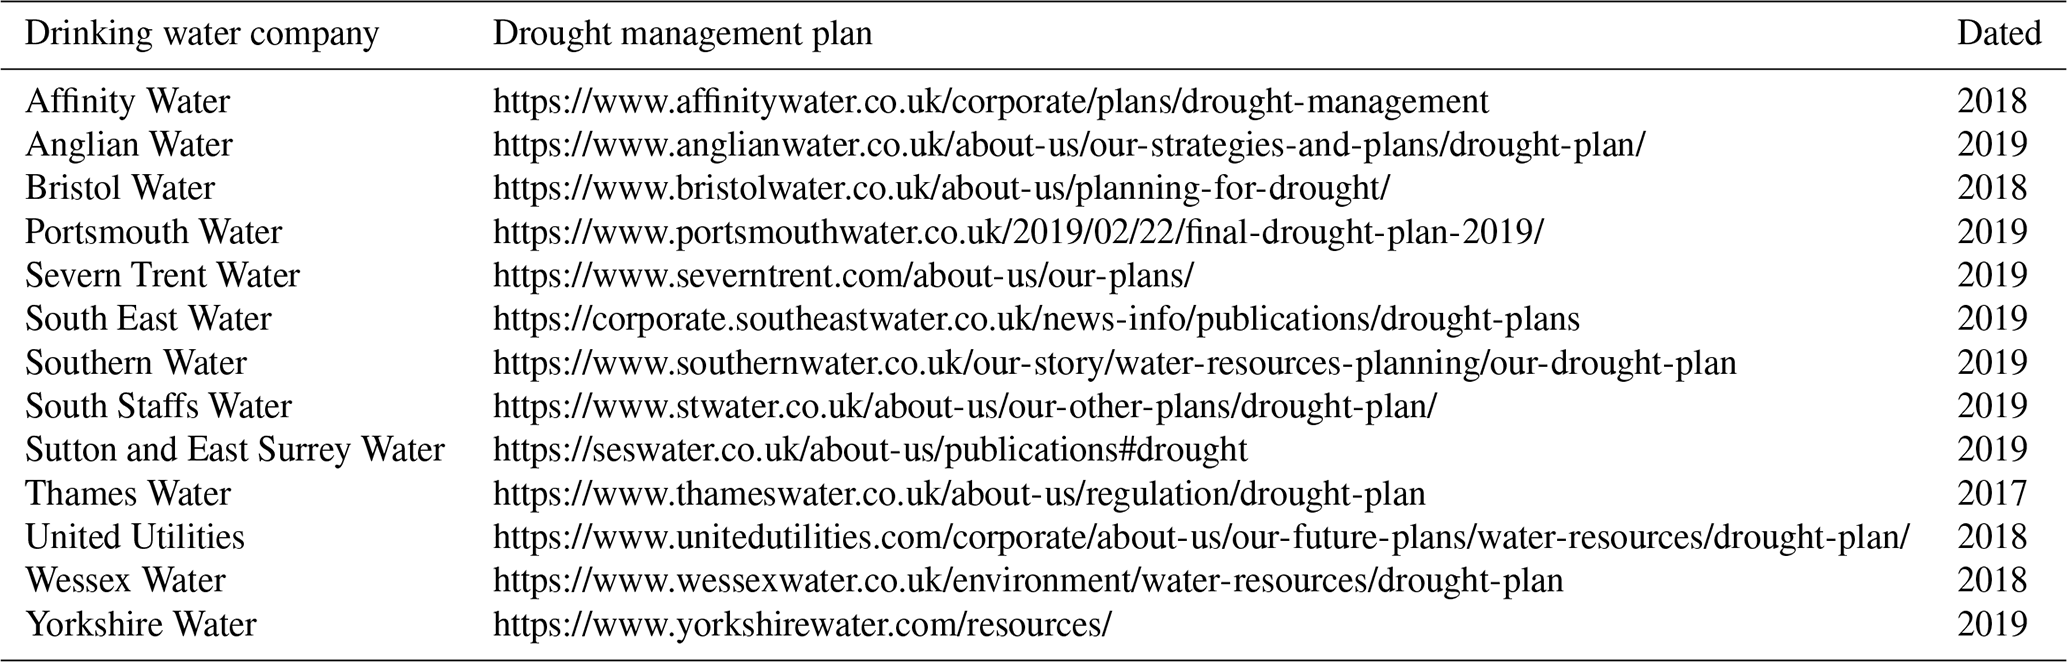
The date of last access is 2 September 2020 for all links in this table.
A3 Main water users in England
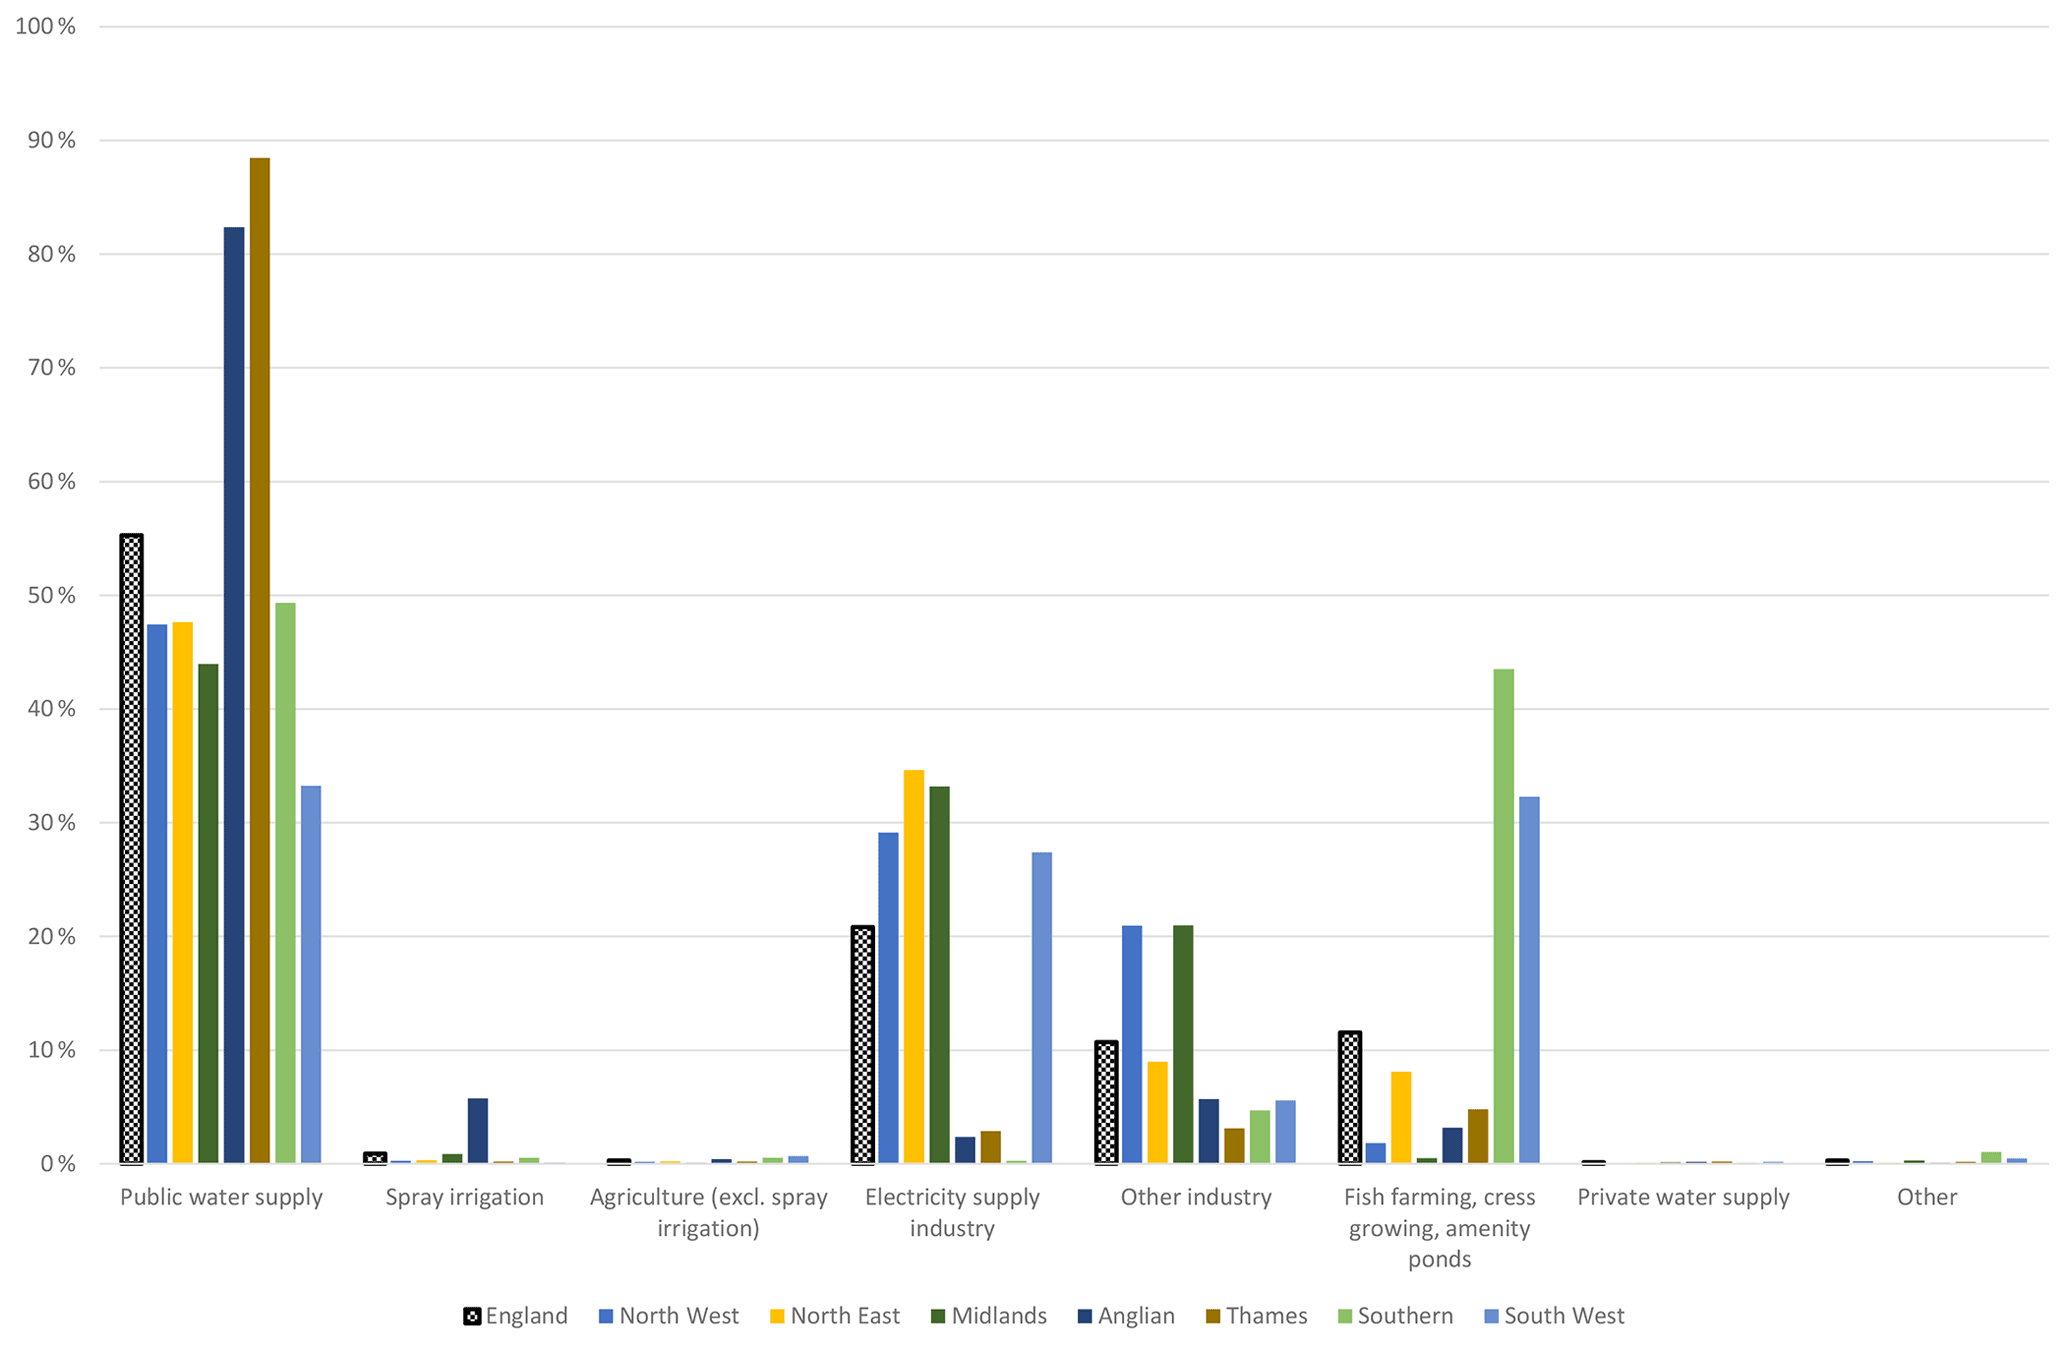
Figure A1Regionally averaged water users in England (dotted black and white bar) by allocated surface water and groundwater licenses (data from 2000–2015; Environment Agency, 2019b). Regional water use is shown in coloured bars. Data can be found at https://www.gov.uk/government/statistical-data-sets/env15-water-abstraction-tables (last access: 2 September 2020).
A4 Inter-annual variation in soil moisture balance in lumped parameter model
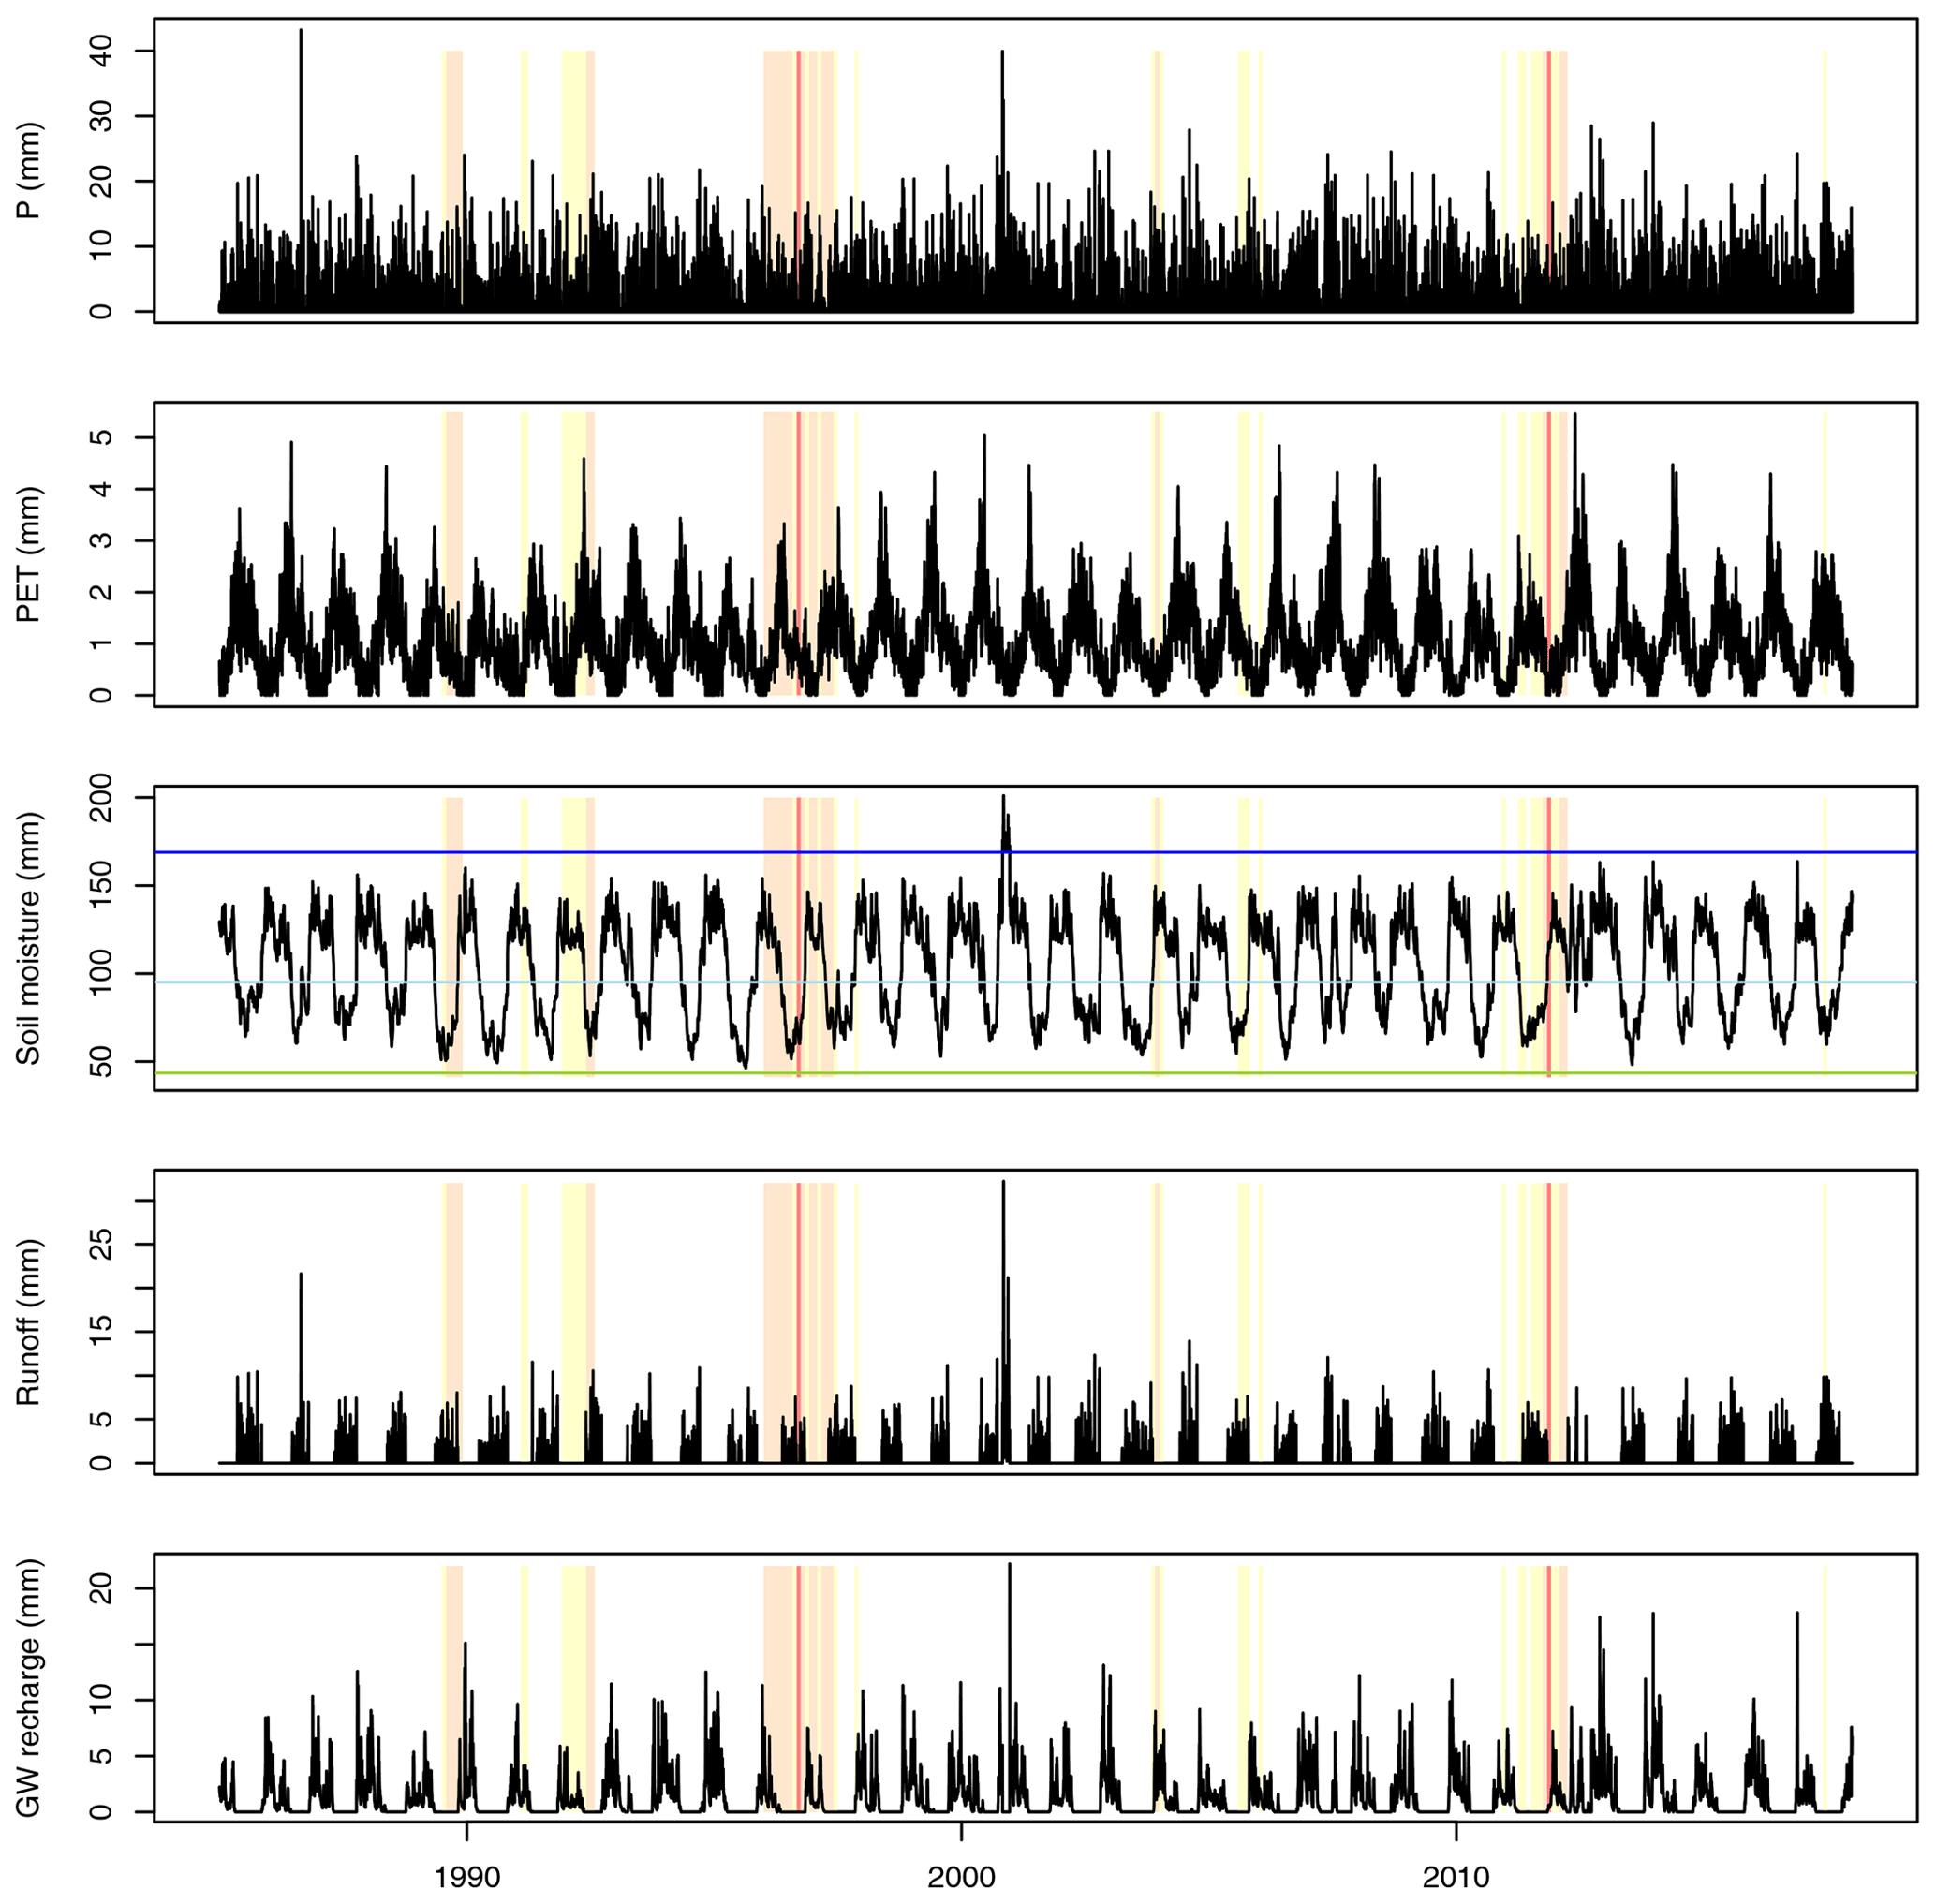
Figure A2Inter-annual variation in the soil moisture balance in the socio-hydrological model. The five panels show long-term time series of precipitation, actual evapotranspiration, soil moisture, runoff and groundwater recharge (all in millimetres). In the soil moisture panel, soil moisture levels for field capacity, critical moisture content and wilting point are indicated in dark blue, light blue and green, respectively. Meteorological droughts are indicated in yellow, orange and red for mild, moderate and severe droughts, respectively (similar to Fig. 2).
A5 Natural and human-influenced groundwater storage dynamics (1985–2017)
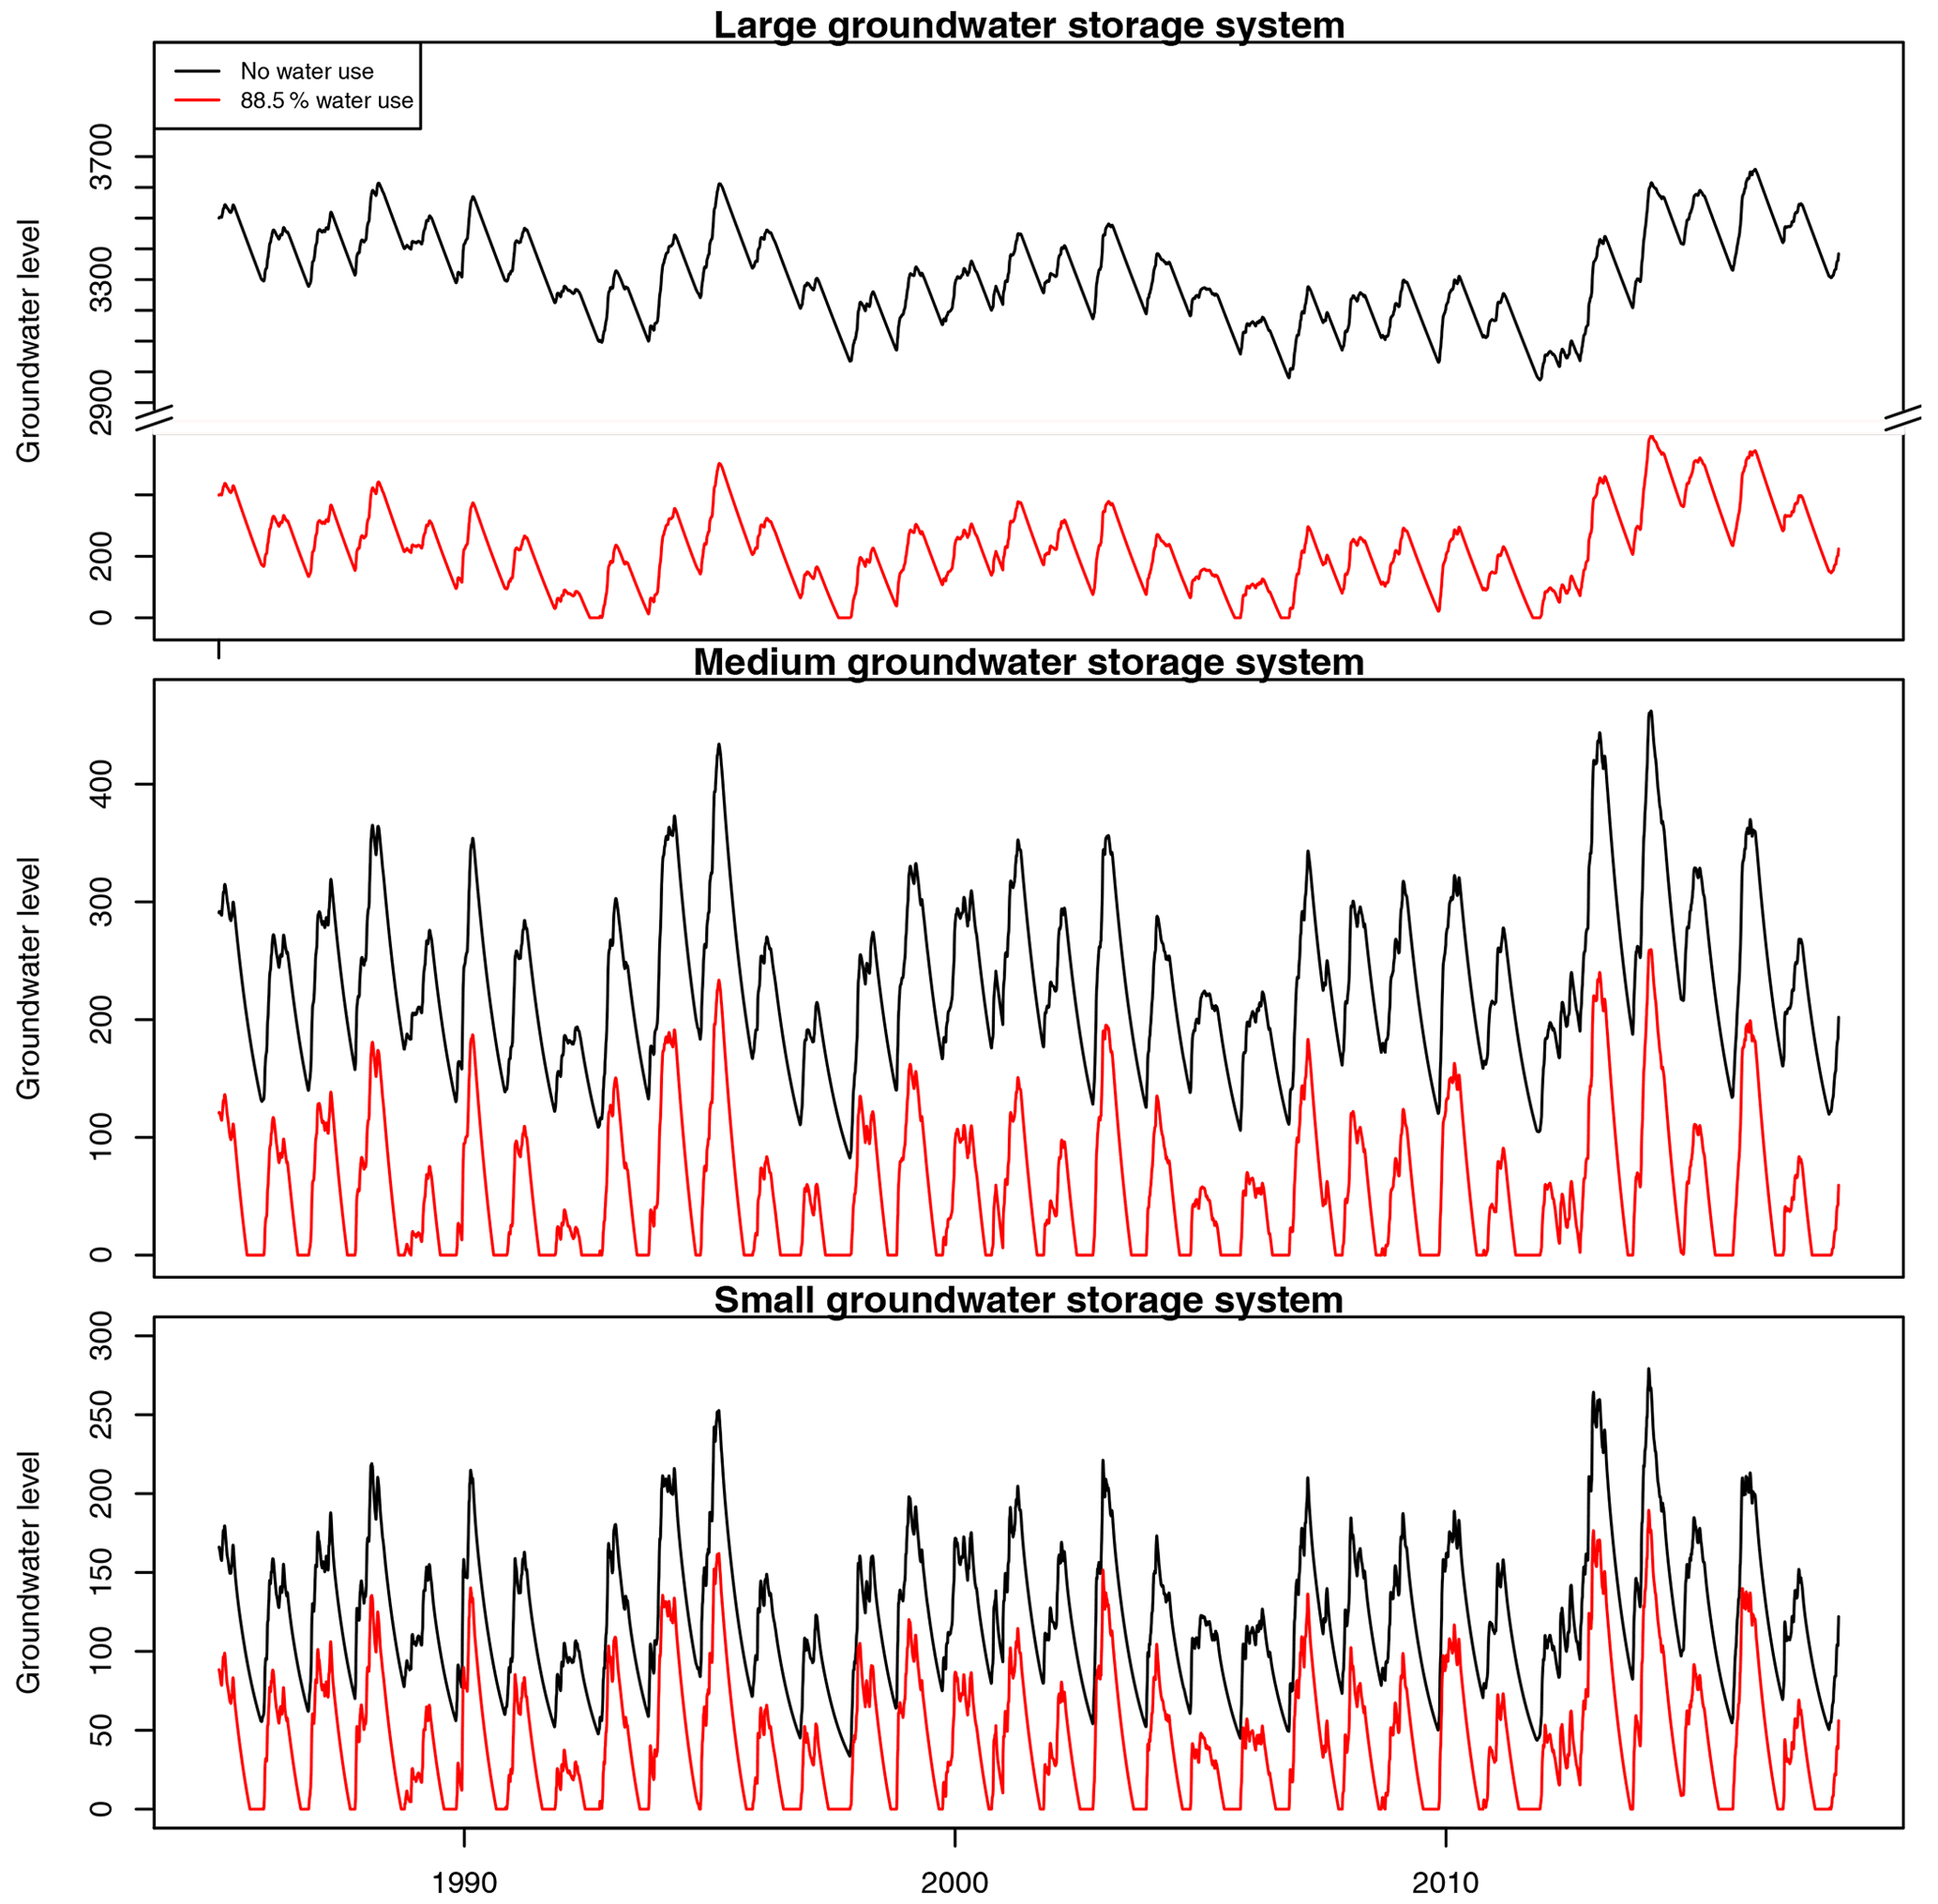
Figure A3Natural (in black) and human-influenced (in red) conditions of groundwater storage levels in time (1985–2017). The three panels show modelled systems with large, medium and small groundwater storage availability. Note that y axes are different due to the large variation in groundwater storage for each system.
A6 Surface water storage with combined scenario in the large groundwater storage system and small storage system
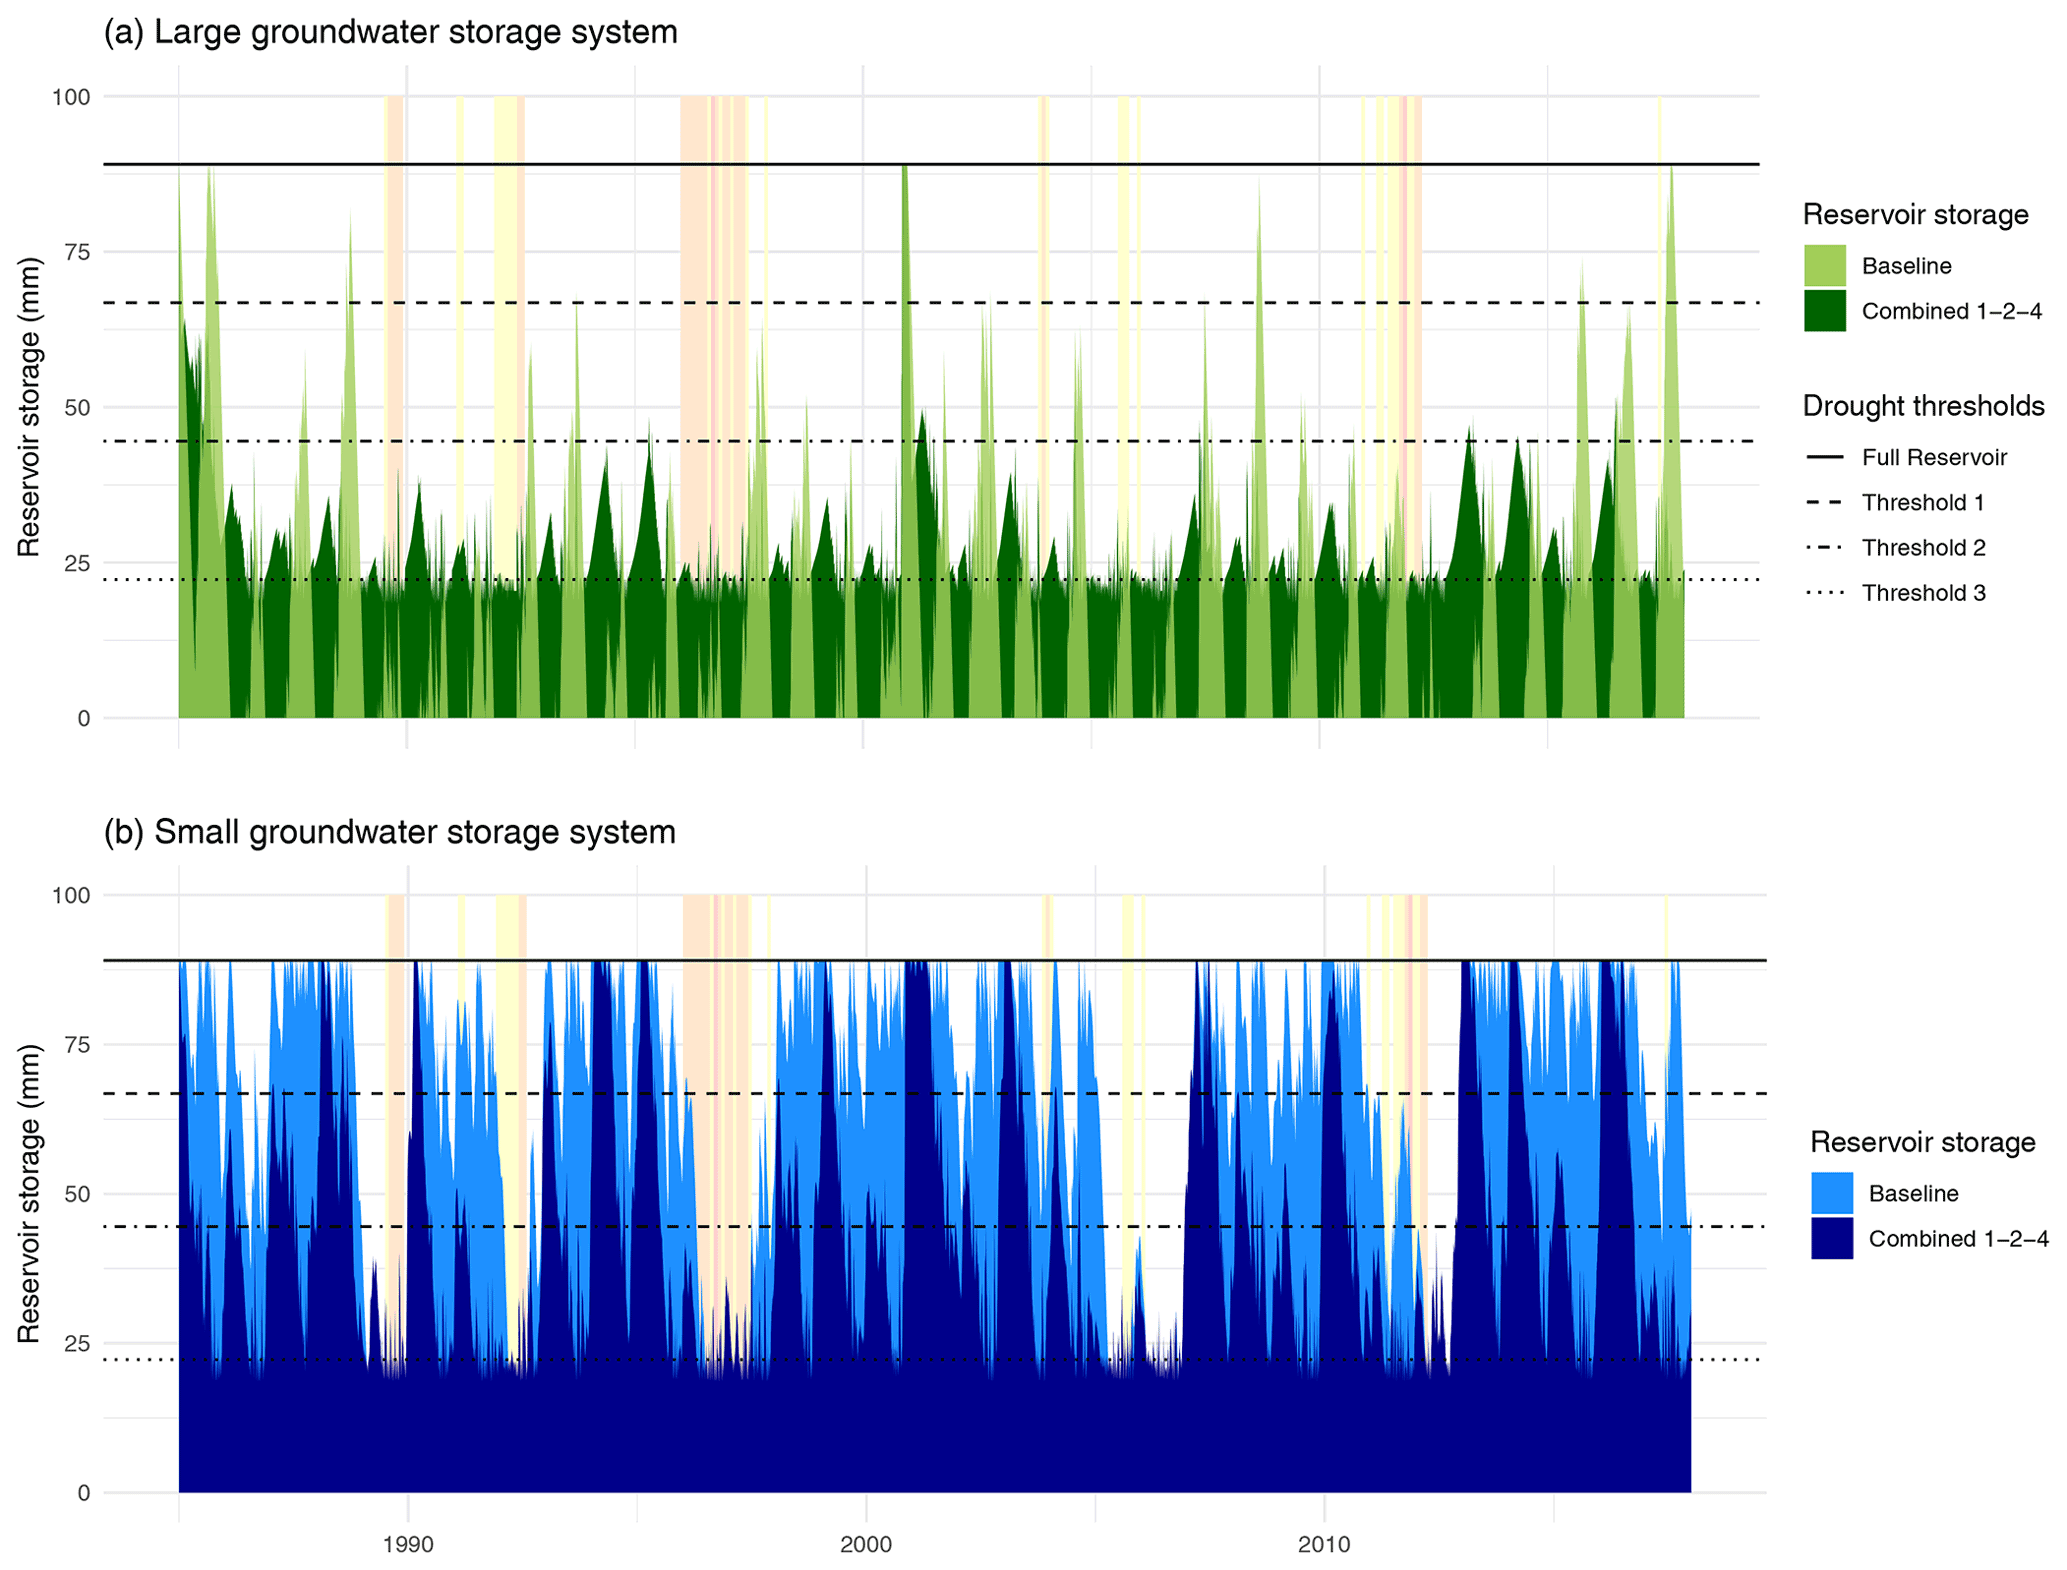
Figure A4Surface reservoir storage in the baseline scenario (no drought measures applied) for large groundwater storage catchment (panel (a); light green) and small groundwater storage catchment (panel (b); light blue). Darker green and blue colours indicate the difference in surface water storage as the reservoir is fuller/emptier with the combined scenario (1–2–4; including hands-off flow). Coloured surfaces indicate below-normal periods in precipitation (measured in SPI), following Fig. 2. Drought thresholds for the surface water reservoir follow the documented range for trigger levels (see Tables 1 and 3).
A7 Baseline conditions for groundwater storage under a range of storage outflow parameters
A8 Groundwater drought duration and severity for baseline and combined scenarios applying a range of groundwater storage outflow parameters
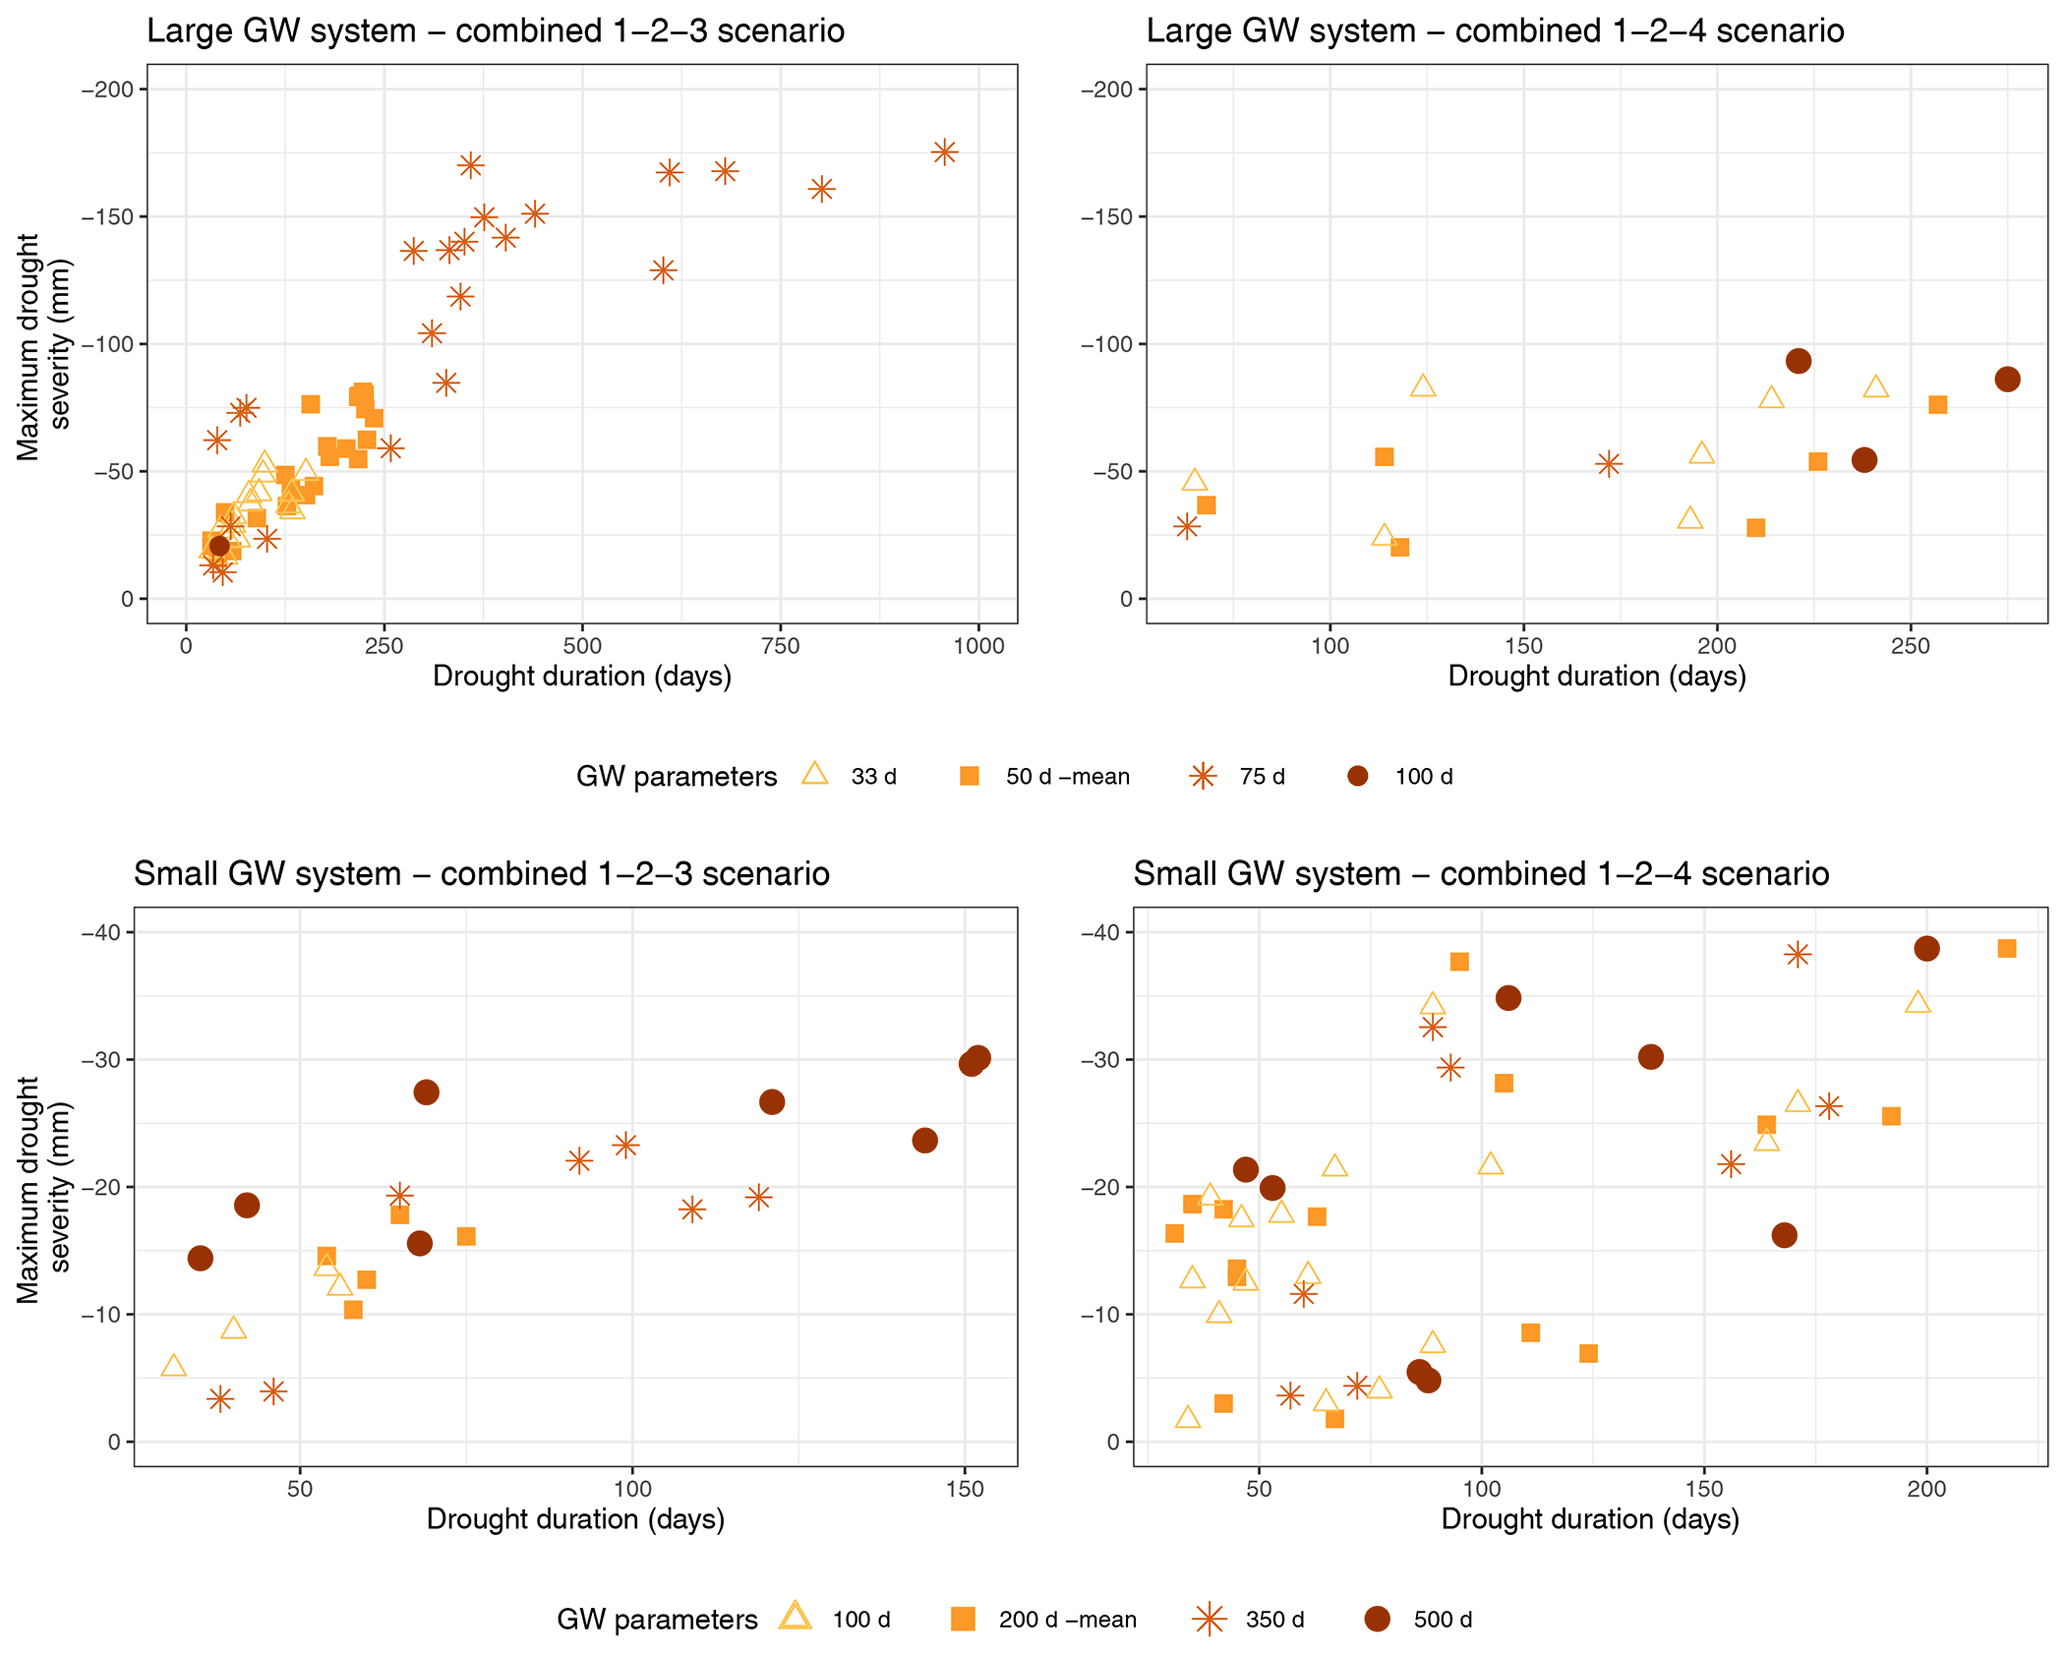
Figure A6Groundwater drought duration and severity for the two combined scenarios (1–2–3 and 1–2–4) in the large and small groundwater storage systems for different groundwater storage outflow parameters (abbreviated as GW parameters). The full range of groundwater storage outflow parameters is presented in Table 2. One outlier (a drought of 11 528 d) is omitted from the groundwater drought scenarios in the large GW system with the 1–2–3 scenario. In this extreme case, two droughts occur, i.e. one of 42 d (shown in figure) and one that lasts for the remaining modelling period (11 528 d). Note that y axes are kept constant for the large and small groundwater storage systems, and the x axes vary due to the large range in drought duration in the scenarios.
A9 Groundwater drought duration and severity for baseline and combined scenarios applying an increase (93 %) and decrease (83.5 %) in overall water allocation.
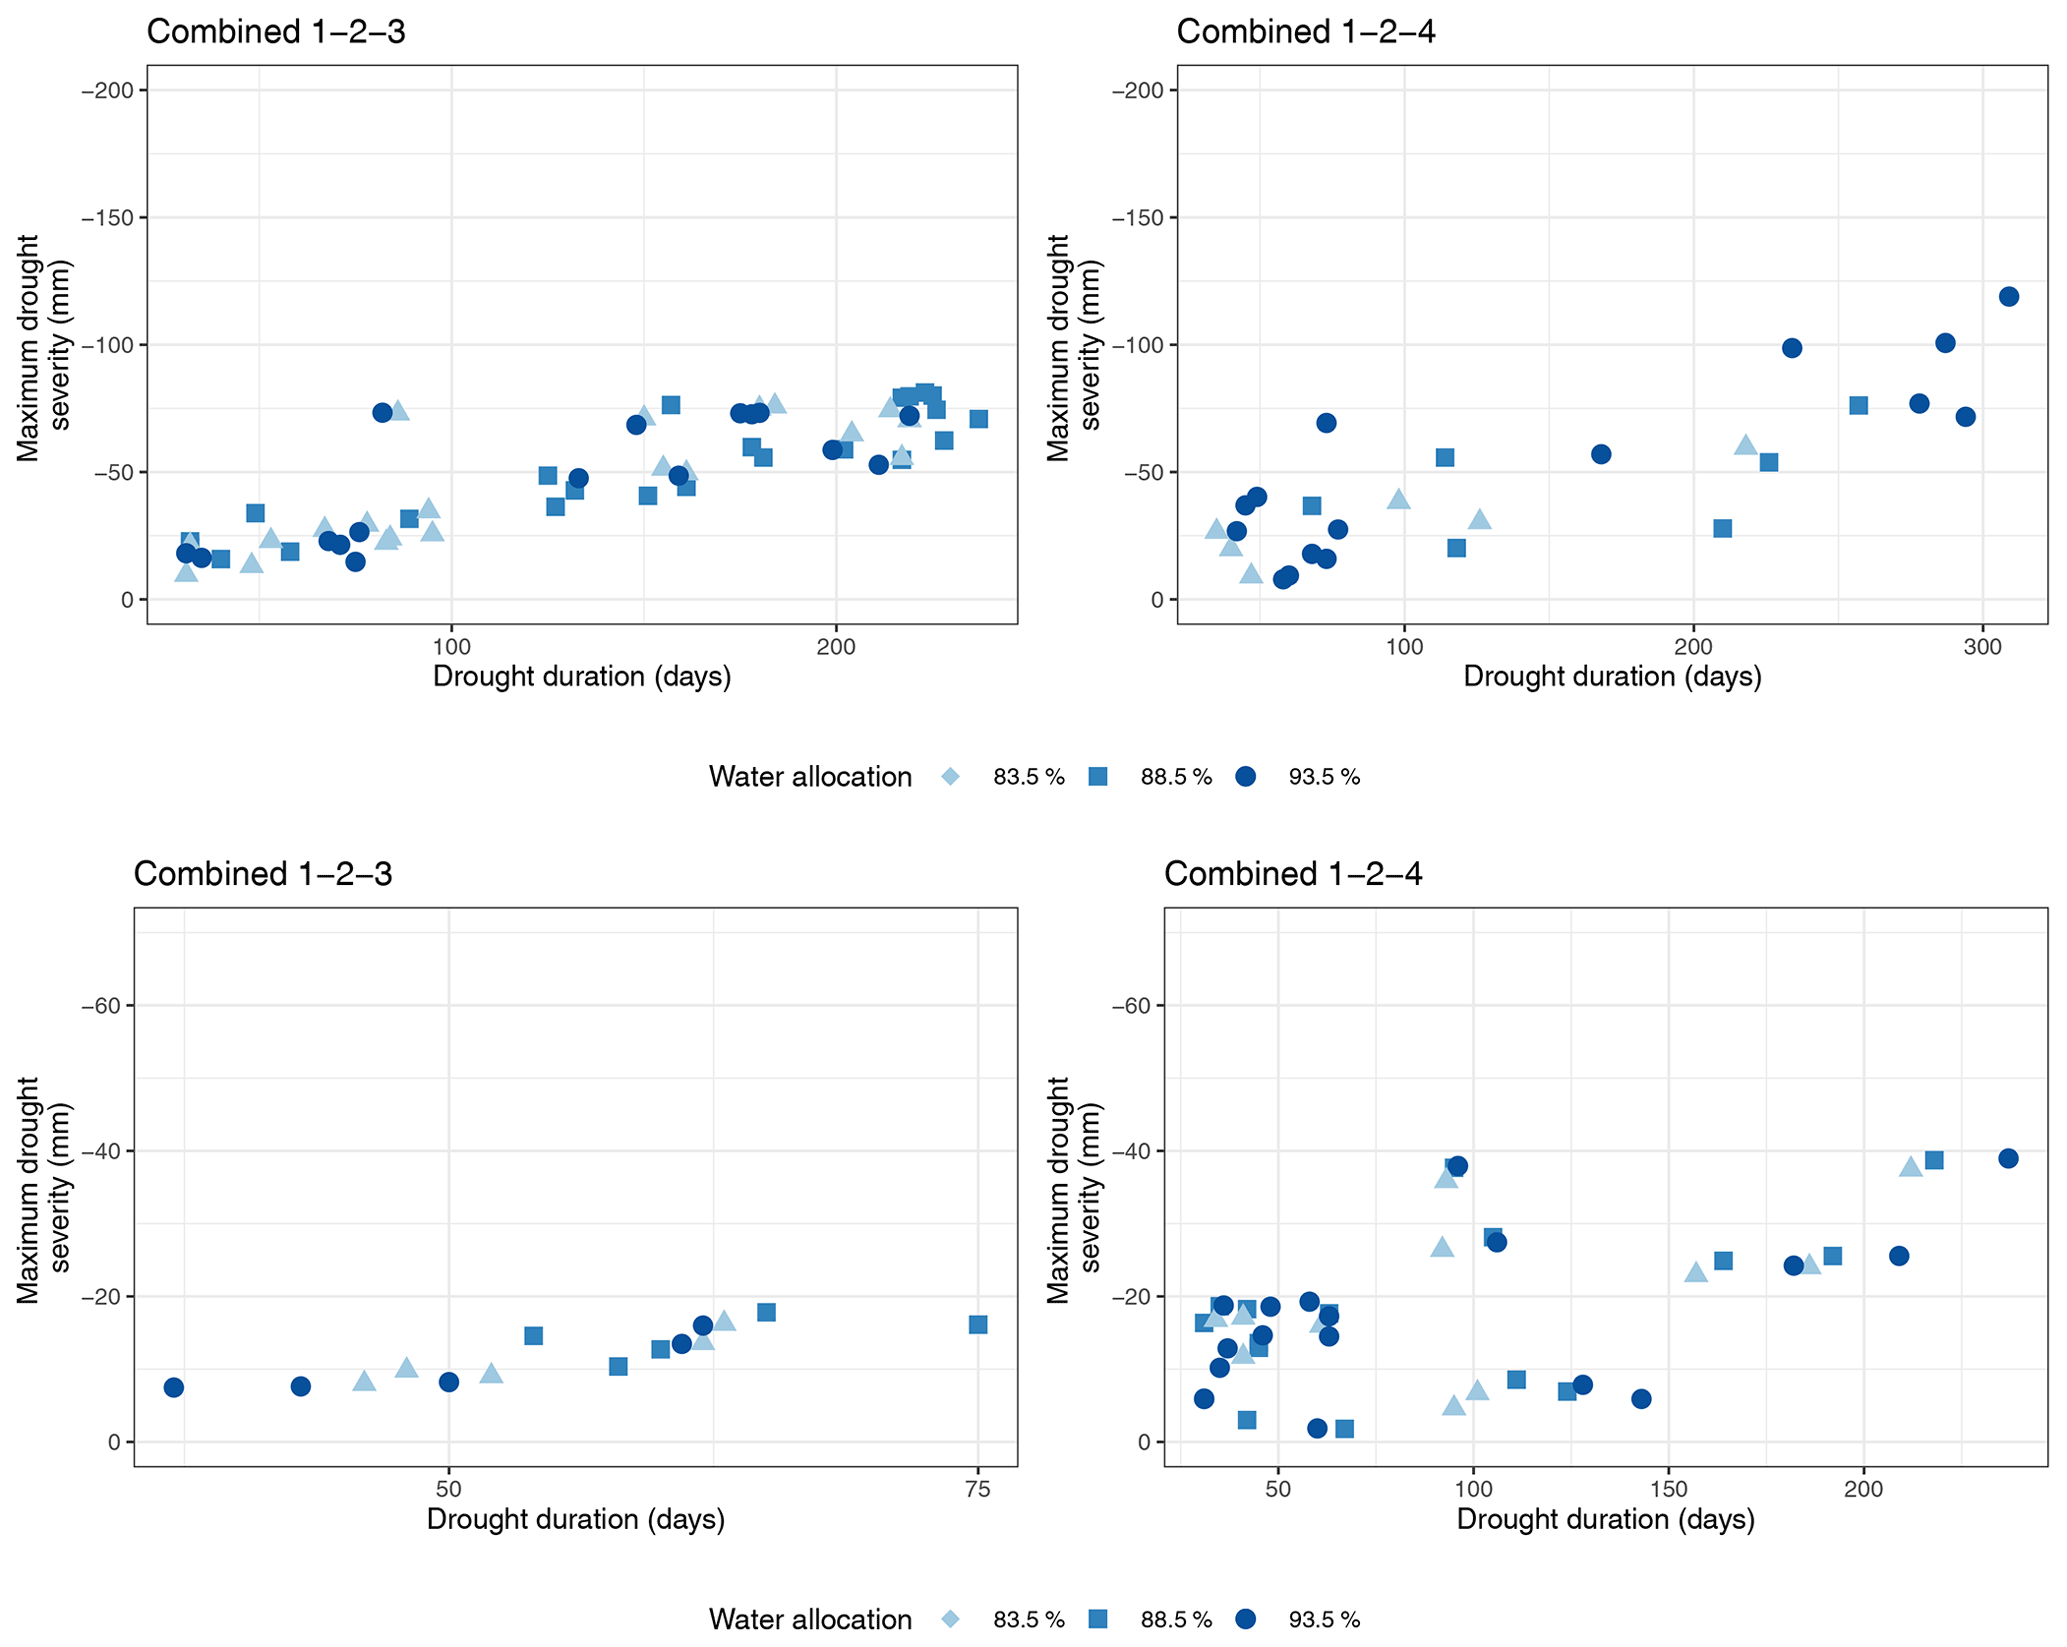
Figure A7Groundwater drought duration and severity for two combined scenarios (1–2–3 and 1–2–4) in the large and small groundwater storage systems. These tests are part of the sensitivity analysis for which the proportional water allocation was increased and decreased by 5 %.
The code used in this paper is available on request.
Input data for the case study are freely available. Regionally averaged precipitation data can be found on the Met Office Hadley Centre website (https://www.metoffice.gov.uk/hadobs/hadukp/data/download.html, last access: 9 October 2021) (Alexander and Jones, 2001). Spatially distributed data can be found at the UK water resources portal (https://nrfa.ceh.ac.uk/content/uk-water-resources-portal, last access: 9 October 2021) (UK Water Resources Portal, 2021). Information about water resource and drought management plans is also publicly available, and used plans are listed in Table A2.
DEW designed and conducted the research in collaboration with MG and BH, supervised by AFVL, JPB and DMH. DEW wrote the paper, with input from all co-authors. The final version has been approved by all co-authors.
The contact author has declared that neither they nor their co-authors have any competing interests.
Publisher’s note: Copernicus Publications remains neutral with regard to jurisdictional claims in published maps and institutional affiliations.
This article is part of the special issue “Drought vulnerability, risk, and impact assessments: bridging the science-policy gap”. It is a result of the EGU General Assembly 2020, 3–8 May 2020.
This paper has been initiated and developed as part of the IAHS Panta Rhei “Drought in the Anthropocene” working group. We also acknowledge helpful discussions with Kerstin Stahl, Chris Jackson and Natalie Kieboom. We would like to thank the reviewers for their constructive feedback on the manuscript. Doris E. Wendt thanks the support of CENTA NERC studentship (grant no. NE/lL002493/1), BGS (grant no. GA/16S/023) and the NERC COVID-19 doctoral extension to complete this work. This work also contributes to the objectives of the NERC-funded “Groundwater Drought Initiative” (grant no. NE/R004994/1). John P. Bloomfield publishes with the permission of the executive director of the British Geological Survey (NERC/UKRI).
This research has been supported by the UK Research and Innovation (grant nos. NE/lL002493/1 and NE/R004994/1) and the British Geological Survey (grant no. GA/16S/023).
This paper was edited by Veit Blauhut and reviewed by two anonymous referees.
Aeschbach-Hertig, W. and Gleeson, T.: Regional strategies for the accelerating global problem of groundwater depletion, Nat. Geosci., 5, 853–861, 2012. a
Alam, S., Gebremichael, M., Li, R., Dozier, J., and Lettenmaier, D. P.: Can Managed Aquifer Recharge mitigate the groundwater overdraft in California’s Central Valley?, Water Resour. Res., 56, e2020WR027244, https://doi.org/10.1029/2020wr027244, 2020. a
Alexander, L. and Jones, P.: Updated precipitation series for the UK and discussion of recent extremes, Atmos. Sci. Lett., 1, 142–150, 2001. a, b
Allen, D. J., Brewerton, L. J., Coleby, L. M., Gibbs, B. R., Lewis, M. A., MacDonald, A. M., Wagstaff, S. J., and Williams, A. T.: The physical properties of major aquifers in England and Wales, Technical Report WD/97/34, British Geological Survey, 312 pp., 1997. a, b, c, d, e, f, g, h
Apruv, T., Sivapalan, M., and Cai, X.: Understanding the Role of CLimate Characteristics in Drought propagation, Water Resour. Res., 53, 9304–9329, 2017. a
Barker, L. J., Hannaford, J., Parry, S., Smith, K. A., Tanguy, M., and Prudhomme, C.: Historic hydrological droughts 1891–2015: systematic characterisation for a diverse set of catchments across the UK, Hydrol. Earth Syst. Sci., 23, 4583–4602, https://doi.org/10.5194/hess-23-4583-2019, 2019. a
Bergström, S.: Development and application of a conceptual runoff model for Scandinavian catchments, RHO, Hydrol. Oceanogr., 7, Report RHO 7, SMHI, Norrkoping, Sweden, ISSN 0347-7827, 1976. a
Bloomfield, J. P. and Marchant, B. P.: Analysis of groundwater drought building on the standardised precipitation index approach, Hydrol. Earth Syst. Sci., 17, 4769–4787, https://doi.org/10.5194/hess-17-4769-2013, 2013. a, b, c
Bloomfield, J. P., Marchant, B. P., Bricker, S. H., and Morgan, R. B.: Regional analysis of groundwater droughts using hydrograph classification, Hydrol. Earth Syst. Sci., 19, 4327–4344, https://doi.org/10.5194/hess-19-4327-2015, 2015. a
Botterill, L. C. and Hayes, M. J.: Drought triggers and declarations: science and policy considerations for drought risk management, Nat. Hazards, 64, 139–151, https://doi.org/10.1007/s11069-012-0231-4, 2012. a
Bredehoeft, J.: Hydrologic Trade-Offs in Conjunctive Use Management, Groundwater, 49, 468–475, https://doi.org/10.1111/j.1745-6584.2010.00762.x, 2011. a, b
Caball, R. and Malekpour, S.: Decision making under crisis: Lessons from the Millennium Drought in Australia, Int. J. Disast. Risk Re., 34, 387–396, https://doi.org/10.1016/j.ijdrr.2018.12.008, 2019. a
Carlier, C., Wirth, S. B., Cochand, F., Hunkeler, D., and Brunner, P.: Exploring Geological and Topographical Controls on Low Flows with Hydrogeological Models, Groundwater, 57, 48–62, 2019. a
Custodio, E.: Aquifer overexploitation: what does it mean?, Hydrogeol. J., 10, 254–277, https://doi.org/10.1007/s10040-002-0188-6, 2002. a
Custodio, E., Sahuquillo, A., and Albiac, J.: Sustainability of intensive groundwater development: experience in Spain, Sustainable Water Resources Management, 5, 11–26, https://doi.org/10.1007/s40899-017-0105-8, 2019. a
Cuthbert, M. O., Gleeson, T., Moosdorf, N., Befus, K. M., Schneider, A., Hartmann, J., and Lehner, B.: Global patterns and dynamics of climate-groundwater interactions, Nat. Clim. Change, 9, 137–141, https://doi.org/10.1038/s41558-018-0386-4, 2019. a, b, c
De Graaf, I. E., Gleeson, T., van Beek, L. R., Sutanudjaja, E. H., and Bierkens, M. F.: Environmental flow limits to global groundwater pumping, Nature, 574, 90–94, 2019. a, b
De Stefano, L., Urquijo, J., Kampragkou, E., and Assimacopoulos, D.: Lessons learnt from the analysis of past drought management practices in selected European regions: experience to guide future policies, European Water, 49, 107–117, 2015. a, b, c
Delaney, C. J., Hartman, R. K., Mendoza, J., Dettinger, M., Delle Monache, L., Jasperse, J., Ralph, F. M., Talbot, C., Brown, J., Reynolds, D., and Evett, S.: Forecast Informed Reservoir Operations Using Ensemble Streamflow Predictions for a Multipurpose Reservoir in Northern California, Water Resour. Res., 56, e2019WR026604, https://doi.org/10.1029/2019WR026604, 2020. a
Di Baldassarre, G., Viglione, A., Carr, G., Kuil, L., Yan, K., Brandimarte, L., and Bloschl, G.: Debates- Perspectives on socio-hydrology: Capturing feedbacks between physical and social processes, Water Resour. Res., 51, 4770–4781, https://doi.org/10.1002/2014WR016416, 2015. a
Di Baldassarre, G., Wanders, N., AghaKouchak, A., Kuil, L., Rangecroft, S., Veldkamp, T. I. E., Garcia, M., van Oel, P. R., Breinl, K., and Van Loon, A. F.: Water shortages worsened by reservoir effects, Nature Sustainability, 1, 617–622, https://doi.org/10.1038/s41893-018-0159-0, 2018. a
Dobson, B., Coxon, G., Freer, J., Gavin, H., Mortazavi-Naeini, M., and Hall, J. W.: The Spatial Dynamics of Droughts and Water Scarcity in England and Wales, Water Resour. Res., 56, e2020WR027187, https://doi.org/10.1029/2020WR027187, 2020. a, b, c, d, e, f
Döll, P., Hoffmann-Dobrev, H., Portmann, F., Siebert, S., Eicker, A., Rodell, M., Strassberg, G., and Scanlon, B.: Impact of water withdrawals from groundwater and surface water on continental water storage variations, J. Geodynam., 59, 143–156, https://doi.org/10.1016/j.jog.2011.05.001, 2012. a
Environment Agency: Managing water abstraction, Tech. Rep. 5, EA, Bristol, 2016. a, b
Environment Agency: ENV15 – Water abstraction tables for England, available at: https://www.gov.uk/government/statistical-data-sets/env15-water-abstraction-tables (last access: 27 August 2020), 2019a. a
Environment Agency: Revised Draft Water Resources Management Plan 2019 Supply-Demand Data at Company Level 2020/21 to 2044/45, available at: https://data.gov.uk/dataset/fb38a40c-ebc1-4e6e-912c-bb47a76f6149/revised-draft-water-resources-management-plan-2019-supply-demand-data-at-company-level-2020-21-to-2044-45#licence-info (last access: 5 October 2020), 2019b. a, b, c, d
Environment Agency: 2021 River Basin Management Plan – water levels and flows challenge, resreport, Environment Agency, available at: https://consult.environment-agency.gov.uk/++preview++/environment-and-business/challenges-and-choices/user_uploads/the-economics-of-managing-water-rbmp-2021.pdf (last access: 26 August 2021), 2019c. a, b
EU Directive: 60/EC (2000) Directive of the European Parliament and of the Council establishing a framework for the Community action in the field of water policy. The European parliament and the Council of the European Union, Official Journal (OJ L 327), 2000. a
Fowler, H. J., Kilsby, C. G., and Stunell, J.: Modelling the impacts of projected future climate change on water resources in north-west England, Hydrol. Earth Syst. Sci., 11, 1115–1126, https://doi.org/10.5194/hess-11-1115-2007, 2007. a
Fu, X., Svoboda, M., Tang, Z., Dai, Z., and Wu, J.: An overview of US state drought plans: crisis or risk management?, Nat. Hazards, 69, 1607–1627, https://doi.org/10.1007/s11069-013-0766-z, 2013. a
Garcia, M. and Islam, S.: The role of external and emergent drivers of water use change in Las Vegas, Urban Water J., 15, 888–898, https://doi.org/10.1080/1573062X.2019.1581232, 2019. a
Garcia, M., Portney, K., and Islam, S.: A question driven socio-hydrological modeling process, Hydrol. Earth Syst. Sci., 20, 73–92, https://doi.org/10.5194/hess-20-73-2016, 2016. a, b
Garcia, M., Ridolfi, E., and Di Baldassarre, G.: The interplay between reservoir storage and operating rules under evolving conditions, J. Hydrol., 590, 125270, https://doi.org/10.1016/j.jhydrol.2020.125270, 2020. a, b, c
Gleeson, T. and Richter, B.: How much groundwater can we pump and protect environmental flows through time? Presumptive standards for conjunctive management of aquifers and rivers, River Res. Appl., 34, 83–92, https://doi.org/10.1002/rra.3185, 2018. a, b
Gonzales, P. and Ajami, N.: Social and Structural Patterns of Drought-Related Water Conservation and Rebound, Water Resour. Res., 53, 10619–10634, https://doi.org/10.1002/2017WR021852, 2017. a, b, c
Hartmann, A., Goldscheider, N., Wagener, T., Lange, J., and Weiler, M.: Karst water resources in a changing world: Review of hydrological modeling approaches, Rev. Geophys., 52, 218–242, https://doi.org/10.1002/2013RG000443, 2014. a
Hayden, H. and Tsvetanov, T.: The Effectiveness of Urban Irrigation Day Restrictions in California, Water Economics and Policy, 5, 1950001, https://doi.org/10.1142/S2382624X19500012, 2019. a
He, X., Bryant, B. P., Moran, T., Mach, K. J., Wei, Z., and Freyberg, D. L.: Climate-informed hydrologic modeling and policy typology to guide managed aquifer recharge, Science Advances, 7, 1–12, https://doi.org/10.1126/sciadv.abe6025, 2021. a
Holley, C., Sinclair, D., Lopez-Gunn, E., and Schlager, E.: Conjunctive management through collective action, in: Integrated groundwater management, Springer, Cham, 229–252, https://doi.org/10.1007/978-3-319-23576-9_9, 2016. a, b, c
Howarth, W.: Going with the flow: Integrated Water Resources Management, the EU Water Framework Directive and ecological flows, Leg. Stud., 38, 298–319, https://doi.org/10.1017/lst.2017.13, 2018. a, b, c, d, e
Huggins, X., Gleeson, T., Eckstrand, H., and Kerr, B.: Streamflow Depletion Modeling: Methods for an Adaptable and Conjunctive Water Management Decision Support Tool, J. Am. Water Resour. As., 54, 1024–1038, https://doi.org/10.1111/1752-1688.12659, 2018. a, b
Jaeger, W. K., Amos, A., Conklin, D. R., Langpap, C., Moore, K., and Plantinga, A. J.: Scope and limitations of drought management within complex human-natural systems, Nature Sustainability, 2, 710–717, https://doi.org/10.1038/s41893-019-0326-y, 2019. a, b
Jakeman, A., Barreteau, O., Hunt, R., Rinaudo, J., and Ross, A.: Integrated groundwater management: concepts, approaches and challenges, Springer International Publishing AG, Switzerland, https://doi.org/10.1007/978-3-319-23576-9, 2016. a
Klaar, M. J., Dunbar, M. J., Warren, M., and Soley, R.: Developing hydroecological models to inform environmental flow standards: a case study from England, WIREs Water, 1, 207–217, https://doi.org/10.1002/wat2.1012, 2014. a, b
Low, K. G., Grant, S. B., Hamilton, A. J., Gan, K., Saphores, J.-D., Arora, M., and Feldman, D. L.: Fighting drought with innovation: Melbourne's response to the Millennium Drought in Southeast Australia, WIREs Water, 2, 315–328, https://doi.org/10.1002/wat2.1087, 2015. a, b, c
Maggioni, E.: Water demand management in times of drought: What matters for water conservation, Water Resour. Res., 51, 125–139, https://doi.org/10.1002/2014WR016301, 2015. a
Martínez-Santos, P., Llamas, M. R., and Martínez-Alfaro, P. E.: Vulnerability assessment of groundwater resources: A modelling-based approach to the Mancha Occidental aquifer, Spain, Environ. Modell. Softw., 23, 1145–1162, https://doi.org/10.1016/j.envsoft.2007.12.003, 2008. a
Mishra, A. K. and Singh, V. P.: A review of drought concepts, J. Hydrol., 391, 202–216, https://doi.org/10.1016/j.jhydrol.2010.07.012, 2010. a, b, c
Muller, M.: Cape Town's drought: don't blame climate change., Nature, 559, 174–176, 2018. a
Noorduijn, S. L., Cook, P. G., Simmons, C. T., and Richardson, S. B.: Protecting groundwater levels and ecosystems with simple management approaches, Hydrogeol. J., 27, 225–237, https://doi.org/10.1007/s10040-018-1849-4, 2019. a, b, c
Ofwat: Water companies in England and Wales, available at: https://www.ofwat.gov.uk/households/your-water-company/map/, last access: 2 September 2020. a
Ohdedar, B.: Groundwater law, abstraction, and responding to climate change: assessing recent law reforms in British Columbia and England, Water Int., 42, 691–708, https://doi.org/10.1080/02508060.2017.1351059, 2017. a, b
Özerol, G.: National and Local Actors of Drought Governance in Europe, chap. 12, John Wiley & Sons, Ltd, Chichester, UK, 171–188, https://doi.org/10.1002/9781119383567.ch12, 2019. a
Peñuela, A., Hutton, C., and Pianosi, F.: Assessing the value of seasonal hydrological forecasts for improving water resource management: insights from a pilot application in the UK, Hydrol. Earth Syst. Sci., 24, 6059–6073, https://doi.org/10.5194/hess-24-6059-2020, 2020. a
Peters, E., Bier, G., Van Lanen, H. A. J., and Torfs, P. J. J. F.: Propagation and spatial distribution of drought in a groundwater catchment, J. Hydrol., 321, 257–275, https://doi.org/10.1016/j.jhydrol.2005.08.004, 2006. a
Robinson, E., Blyth, E., Clark, D., Comyn-Platt, E., Finch, J., and Rudd, A.: Climate hydrology and ecology research support system potential evapotranspiration dataset for Great Britain (1961–2015) [data set], https://doi.org/10.5285/8baf805d-39ce-4dac-b224-c926ada353b7, 2016. a
Rodina, L.: Water resilience lessons from Cape Town's water crisis, WIREs Water, 6, e1376, https://doi.org/10.1002/wat2.1376, 2019. a
Rolls, R. J., Leigh, C., and Sheldon, F.: Mechanistic effects of low-flow hydrology on riverine ecosystems: ecological principles and consequences of alteration, Freshw. Sci., 31, 1163–1186, https://doi.org/10.1899/12-002.1, 2012. a
Scanlon, B. R., Reedy, R. C., Faunt, C. C., Pool, D., and Uhlman, K.: Enhancing drought resilience with conjunctive use and managed aquifer recharge in California and Arizona, Environ. Res. Lett., 11, 035013, https://doi.org/10.1088/1748-9326/11/3/035013, 2016. a, b, c
Seibert, J.: Multi-criteria calibration of a conceptual runoff model using a genetic algorithm, Hydrol. Earth Syst. Sci., 4, 215–224, https://doi.org/10.5194/hess-4-215-2000, 2000. a
Shepley, M., Pearson, A., Smith, G., and Banton, C.: The impacts of coal mining subsidence on groundwater resources management of the East Midlands Permo-Triassic Sandstone aquifer, England, Q. J. Eng. Geol. Hydroge., 41, 425–438, https://doi.org/10.1144/1470-9236/07-210, 2008. a
Shepley, M., Streetly, M., Voyce, K., and Bamford, F.: Management of stream compensation for a large conjunctive use scheme, Shropshire, UK, Water Environ. J., 23, 263–271, https://doi.org/10.1111/j.1747-6593.2008.00158.x, 2009. a, b
Siebert, S., Burke, J., Faures, J. M., Frenken, K., Hoogeveen, J., Döll, P., and Portmann, F. T.: Groundwater use for irrigation – a global inventory, Hydrol. Earth Syst. Sci., 14, 1863–1880, https://doi.org/10.5194/hess-14-1863-2010, 2010. a
Simpson, N. P., Simpson, K. J., Shearing, C. D., and Cirolia, L. R.: Municipal finance and resilience lessons for urban infrastructure management: a case study from the Cape Town drought, International Journal of Urban Sustainable Development, 11, 257–276, https://doi.org/10.1080/19463138.2019.1642203, 2019. a
Sivapalan, M., Savenije, H. H. G., and Blöschl, G.: Socio-hydrology: A new science of people and water, Hydrol. Process., 26, 1270–1276, https://doi.org/10.1002/hyp.8426, 2012. a
Stoelzle, M., Stahl, K., Morhard, A., and Weiler, M.: Streamflow sensitivity to drought scenarios in catchments with different geology, Geophys. Res. Lett., 41, 6174–6183, https://doi.org/10.1002/2014GL061344, 2014. a
Stoelzle, M., Weiler, M., Stahl, K., Morhard, A., and Schuetz, T.: Is there a superior conceptual groundwater model structure for baseflow simulation?, Hydrol. Process., 29, 1301–1313, 2015. a, b, c, d, e, f, g, h, i, j, k
Tallaksen, L. M. and Van Lanen, H. A. J.: Hydrological drought: processes and estimation methods for streamflow and groundwater, vol. 48, Elsevier, Amsterdam, 2004. a, b, c
Tanji, K. K. and Kielen, N. C.: Agricultural drainage water management in arid and semi-arid areas, FAO Irrigation and Drainage paper 61, FAO, Rome, 2002, a
Taylor, R. G., Scanlon, B., Doell, P., Rodell, M., van Beek, R., Wada, Y., Longuevergne, L., Leblanc, M., Famiglietti, J. S., Edmunds, M., Konikow, L., Green, T. R., Chen, J., Taniguchi, M., Bierkens, M. F. P., MacDonald, A., Fan, Y., Maxwell, R. M., Yechieli, Y., Gurdak, J. J., Allen, D. M., Shamsudduha, M., Hiscock, K., Yeh, P. J. F., Holman, I., and Treidel, H.: Ground water and climate change, Nat. Clim. Change, 3, 322–329, https://doi.org/10.1038/NCLIMATE1744, 2013. a, b, c
Thomann, J. A., Werner, A. D., Irvine, D. J., and Currell, M. J.: Adaptive management in groundwater planning and development: A review of theory and applications, J. Hydrol., 586, 124871, https://doi.org/10.1016/j.jhydrol.2020.124871, 2020. a
Thomas, B. F.: Sustainability indices to evaluate groundwater adaptive management: a case study in California (USA) for the Sustainable Groundwater Management Act, Hydrogeol. J., 27, 239–248, https://doi.org/10.1007/s10040-018-1863-6, 2019. a
Thorne, J. M., Savic, D. A., and Weston, A.: Optimised Conjunctive Control Rules for a System of Water Supply Sources: Roadford Reservoir System (U.K.), Water Resour. Manag., 17, 183–196, https://doi.org/10.1023/A:1024157210054, 2003. a
Tijdeman, E., Hannaford, J., and Stahl, K.: Human influences on streamflow drought characteristics in England and Wales, Hydrol. Earth Syst. Sci., 22, 1051–1064, https://doi.org/10.5194/hess-22-1051-2018, 2018. a
UK Water Resources Portal: https://nrfa.ceh.ac.uk/content/uk-water-resources-portal, last access: 9 October 2021. a
Urquijo, J., Pereira, D., Dias, S., and De Stefano, L.: A methodology to assess drought management as applied to six European case studies, Int. J. Water Resour. D., 33, 246–269, https://doi.org/10.1080/07900627.2016.1174106, 2017. a, b, c, d, e
Van Lanen, H. A. J.: Drought propagation through the hydrological cycle, vol. 308, Havana, Cuba, available at: https://iahs.info/uploads/dms/13647.26-122-127-67-308-Lanen-van.pdf (last access: 9 October 2021), 2006. a
Van Lanen, H. A. J., Wanders, N., Tallaksen, L. M., and Van Loon, A. F.: Hydrological drought across the world: impact of climate and physical catchment structure, Hydrol. Earth Syst. Sci., 17, 1715–1732, https://doi.org/10.5194/hess-17-1715-2013, 2013. a, b, c, d, e, f, g
Van Loon, A. F., Tijdeman, E., Wanders, N., Van Lanen, H. A. J., Teuling, A. J., and Uijlenhoet, R.: How climate seasonality modifies drought duration and deficit, J. Geophys. Res.-Atmos., 119, 4640–4656, https://doi.org/10.1002/2013JD020383, 2014. a
Van Loon, A. F., Stahl, K., Di Baldassarre, G., Clark, J., Rangecroft, S., Wanders, N., Gleeson, T., Van Dijk, A. I. J. M., Tallaksen, L. M., Hannaford, J., Uijlenhoet, R., Teuling, A. J., Hannah, D. M., Sheffield, J., Svoboda, M., Verbeiren, B., Wagener, T., and Van Lanen, H. A. J.: Drought in a human-modified world: reframing drought definitions, understanding, and analysis approaches, Hydrol. Earth Syst. Sci., 20, 3631–3650, https://doi.org/10.5194/hess-20-3631-2016, 2016. a
Wada, Y., van Beek, L. P. H., Wanders, N., and Bierkens, M. F. P.: Human water consumption intensifies hydrological drought worldwide, Environ. Res. Lett., 8, 034036, https://doi.org/10.1088/1748-9326/8/3/034036, 2013. a
Wanders, N. and Wada, Y.: Human and climate impacts on the 21st century hydrological drought, J. Hydrol., 526, 208–220, https://doi.org/10.1016/j.jhydrol.2014.10.047, 2015. a
Wendt, D. E., Van Loon, A. F., Bloomfield, J. P., and Hannah, D. M.: Asymmetric impact of groundwater use on groundwater droughts, Hydrol. Earth Syst. Sci., 24, 4853–4868, https://doi.org/10.5194/hess-24-4853-2020, 2020. a
Werner, A. D., Alcoe, D. W., Ordens, C. M., Hutson, J. L., Ward, J. D., and Simmons, C. T.: Current Practice and Future Challenges in Coastal Aquifer Management: Flux-Based and Trigger-Level Approaches with Application to an Australian Case Study, Water Resour. Manag., 25, 1831–1853, https://doi.org/10.1007/s11269-011-9777-2, 2011. a
White, D. H., Wilhite, D. A., O'Meagher, B., and Hammer, G. L.: Highlights of Drought Policy and Related Science in Australia and the U.S.A., Water Int., 26, 349–357, https://doi.org/10.1080/02508060108686927, 2001. a, b
White, E. K., Costelloe, J., Peterson, T. J., Western, A. W., and Carrara, E.: Do groundwater management plans work? Modelling the effectiveness of groundwater management scenarios, Hydrogeol. J., 27, 2447–2470, https://doi.org/10.1007/s10040-019-02004-0, 2019. a, b, c, d
Wilhite, D. A., Sivakumar, M. V., and Pulwarty, R.: Managing drought risk in a changing climate: The role of national drought policy, Weather and Climate Extremes, 3, 4–13, https://doi.org/10.1016/j.wace.2014.01.002, 2014. a, b, c, d
Wittenberg, H.: Effects of season and man-made changes on baseflow and flow recession: case studies, Hydrol. Process., 17, 2113–2123, https://doi.org/10.1002/hyp.1324, 2003. a, b
Yevjevich, V. M.: An objective approach to definitions and investigations of continental hydrologic droughts, Hydrology papers no. 23, Colorado State University, Fort Collins, Colorado, 1967. a, b