the Creative Commons Attribution 4.0 License.
the Creative Commons Attribution 4.0 License.
 | 26 Aug 2021
Variability in lightning hazard over Indian region with respect to El Niño–Southern Oscillation (ENSO) phases
Avaronthan Veettil Sreenath
Sukumarapillai Abhilash
Pattathil Vijaykumar
The El Niño–Southern Oscillation (ENSO) modulates the lightning flash density (LFD) variability over India during premonsoon, monsoon and postmonsoon seasons. This study intends to shed light on the impact of ENSO phases on the LFD over the Indian subcontinent using the data obtained from Optical Transient Detector (OTD) and Lightning Imaging Sensors (LIS) onboard the Tropical Rainfall Measuring Mission (TRMM) satellite. Results suggest the LFD over northeast India (NEI) and southern peninsular India (SPI) strengthened (weakened) during the warm (cold) phase of ENSO in the premonsoon season. During monsoon season, NNWI (north of northwest India) shows above (below) normal LFD in the cold (warm) ENSO phase. It is striking to note that there are three hot spots of LFD over the Indian land region which became more prominent during the monsoon seasons of the last decade. A widespread increase in LFD is observed all over India during the warm phase of ENSO in the postmonsoon season. A robust rise in graupel/snow concentration is found during the postmonsoon season over SPI in the ENSO warm phase, with the lowest fluctuations over the NEI and NNWI regions. The subtropical westerly jet stream is shifted south in association with the warm phase, accompanied by an increase in geopotential height (GPH) all over India for the same period. This exciting remark may explain the indirect influences of ENSO's warm phase on LFD during the postmonsoon season by pushing the mean position of the subtropical westerly towards southern latitudes. However, the marked increase in LFD is confined mostly over the NNWI in the cold ENSO phase.
- Article
(6260 KB) - Full-text XML
- BibTeX
- EndNote


Lightning is a tremendous and inescapable atmospheric hazard that humankind has encountered throughout history (Cooray et al., 2007; Mills et al., 2010). The number of casualties underlines lightning hazards as a devastating phenomenon, with an annual death rate of 2234 from 2001 to 2014 over India (Selvi and Rajapandian, 2016). Singh and Singh (2015) documented the yearly number of lightning fatalities and lightning flashes in India from 1998 to 2005, and they find that the fatalities increase coherently with the lightning flash rate. Lightning strikes over the plain terrains are observed to be less as compared to the hilly regions. Due to the former's high population density, even lesser lightning flashes take many people's lives due to high chances of being struck by lightning (Yadava et al., 2020).
The El Niño–Southern Oscillation (ENSO) is a naturally occurring planetary-scale phenomenon related to the variations in sea surface temperatures over the tropical Pacific Ocean, strongly influencing the number of flashes and average flash rate (Kumar and Kamra, 2012). It is one of the most dynamic climatic variability modes, characterized by three phases, namely El Niño (warm), La Niña (cold) and neutral. The ENSO is a crucial player in the transport of heat, moisture and momentum and modulates the frequency, intensity and location of deep convection and the associated lightning activity (Williams, 1992; Kulkarni and Siingh, 2014). Higher lightning flash density (LFD) areas are located away from the Equator during the warm phase and coincide with regions of anomalous jet stream circulation enhanced by the meridional heat transport (Chronis et al., 2008). Kandalgaonkar et al. (2010) reported that lightning activity during the El Niño year of 2002 increased by 18 % over the Indian land region compared to the La Niña years during 1998–2011. On a global scale, lightning activity shows strong regional preference during different ENSO phases.
The changes in the lower and upper air circulations associated with different ENSO phases have been found to influence the storm frequency and intensity (Yang et al., 2002; Hsu and Wallace, 1976), which in turn affect the lightning activity (Goodman et al., 2000). Kent et al. (1995) observed that ENSO could dictate the clouds' distribution over the tropics and subtropics. Owing to the presence of anomalous subsidence over the western Pacific and adjacent landmass, deep convective clouds are inhibited; hence the rainfall is less during the warm phase (Cess et al., 2001). A southward/eastward shift in the global lightning activity is visible during the warm phase, and the latitudes corresponding to the descending limb of the Hadley circulation exhibit the most significant contrast of LFD between the warm and cold phase of the ENSO (Sátori et al., 2009).
Generally, lightning activity is tuned by the clouds growing deep into the atmosphere. The deep convective cores present over India's east coast during the premonsoon season shift to the foothills of the western Himalayas during the monsoon (Romatschke et al., 2010). Cecil et al. (2014) documented that India's offshore regions and the maritime continent are prone to deep convection. The vertical growth of cloud systems is amplified by the intense updraught, promoting ice crystals and supercooled liquid (mixed phase) inside the convective system. The interaction between these hydrometeors is mainly responsible for the electrification inside the cloud (Takahashi et al., 1999; Williams, 2001). The atmosphere's dynamic and thermodynamic states also modulate the lightning activity over a region (Williams, 1992; Zipser, 1994; Petersen et al., 1996; Rosenfeld, 1999). Topography is identified as being another critical participant in developing deep convective clouds, and it impacts the distribution of lightning activity (Kilinc and Beringer, 2007). Earlier studies have observed that elevated landmass favours the development of deep convective clouds (Zipser et al., 2006; Houze et al., 2007; Rasmussen and Houze Jr., 2011), thereby leading to higher LFD. In addition, aerosols are also considered a contributor for making a decisive role in generating lightning flashes. Higher aerosol loading increases the available liquid water in the mixed-phase condition, which is an essential factor for cloud electrification and lightning activity (Williams et al., 2002). Venevsky (2014) reported a significant correlation between lightning and the concentration of annually averaged cloud condensation nuclei over both land and ocean.
The awareness of lightning safety among the public is relatively low. The present study aims to provide vital information to the public on the risky lightning periods over the Indian subcontinent and how the large-scale phenomenon, ENSO, is influencing the same periods. We are detailing the modulation of LFD under different ENSO phases with the help of a vertical profile of hydrometeors (graupel and snow) inside the cloud systems and related atmospheric dynamics during premonsoon (March–May), monsoon (June–September) and postmonsoon (October–December) seasons in India. The rest of the paper is organized as follows. Section 2 provides descriptions of the data and methodology employed in this study. Section 3 presents the results, followed by Sect. 3.1, which depicts the composite analysis of LFD for premonsoon, monsoon and postmonsoon seasons corresponding to the three ENSO phases. The remaining subsections of Sect. 3 (3.2, 3.3 and 3.4) portray the composite analysis of anomalous LFD during the different seasons and the significance of vertical cloud structure and associated dynamics in regulating their distribution. Finally, the conclusions of this work are given in Sect. 4.
The Lightning Imaging Sensor (LIS) was an instrument on board the Tropical Rainfall Measuring Mission (TRMM) satellite launched in December 1997. This instrument senses lightning flashes across the global tropics and subtropics (Goodman et al., 2007). The Optical Transient Detector (OTD) was the predecessor of LIS, launched with the MicroLab-1 satellite. Combined OTD + LIS monthly averaged flash density expressed as flashes per square kilometre per day (), available from http://ghrc.nsstc.nasa.gov/ (last access: 23 August 2021), is used in this work. These products compute mean LFD by accumulating the total number of flashes observed and the entire observation duration for each grid box () from the thousands of individual satellite orbits. The lightning climatology derived from OTD/LIS (Cecil et al., 2014) provides a unique observational basis for the global flash distribution in monthly time series (Kamra and Athira, 2016), seasonal cycles (Christian et al., 2003) or diurnal cycles (Blakeslee et al., 2014). To produce the low-resolution monthly time series (LRMTS) data, LIS and OTD flash density and view times are smoothed precisely and are extracted for the middle day of each month (Cecil et al., 2014). The LFD in an LRMTS has slightly over 3 months of temporal smoothing and spatial smoothing (Cecil et al., 2014). The data sets are described in greater detail in a paper by Cecil et al. (2014).
The LFD data are available starting from July 1995 only. So, the premonsoon season in our work starts in 1996 (March–May) and ends in 2013 (March–May). Due to data unavailability, the first monsoon season includes only 3 months (July, August and September 1995). This particular season terminates in 2013 (June, July, August and September). On the other hand, the postmonsoon season is prepared from 1995 (October–December) to 2013 (October–December). The LFD anomaly in this study indicates the difference between the composite of LFD during a particular ENSO phase in a specific season and the composite of LFD during all the three ENSO phases in that specific season. e.g., LFD anomaly during premonsoon during La Niña = (composite of LFD during La Niña in premonsoon) − (composite of LFD during all the three ENSO phases in premonsoon). The anomalies of all other parameters used in this study are calculated using the same method.
With the aid of TRMM 3A12 data, the cloud structure is examined by evaluating the vertical profiles of hydrometeors (graupel and snow) and latent heat release during different phases of ENSO. The data set has a spatial resolution of , available from January 1998 to December 2013. It has 28 vertical levels, which start from 0.5 km, and each level is separated by 0.5 km. These parameters are averaged for the premonsoon, monsoon and postmonsoon season from 1998 to 2013 with respect to the La Niña, El Niño and neutral phases of ENSO over northeast India (NEI; 85–95∘ E, 20–30∘ N), north of northwest India (NNWI; 25–40∘ N, 65–80∘ E) and southern peninsular India (SPI; 5–15∘ N, 75–80∘ E) and are used in this work.
Finally, the modulation of geopotential height (GPH) at 500 hPa, wind at 200 hPa and specific humidity (SH) at 300 hPa are also examined with the ENSO phases from July 1995 to December 2013. The above parameters are obtained from the National Centers for Environmental Prediction (NCEP) and National Center for Atmospheric Research (NCAR) reanalysis data with a similar spatial and temporal resolution to LFD. The Oceanic Niño Index (ONI) is the standard used to identify different phases of ENSO. The average value of ONI is determined during premonsoon, monsoon and postmonsoon season by using Hadley Centre Global Sea Ice and Sea Surface Temperature (HadISST) data and is detailed in Table 1. If the ONI value is above (below) +0.5 ∘C (−0.5 ∘C), it is taken as the warm (cold) phase, and the neutral phase corresponding to the ONI index lies between −0.5 and +0.5 ∘C.
Table 1ONI during the premonsoon, monsoon and postmonsoon season in India from 1995 to 2013. The bold, italics and bold italic values denote El Niño, La Niña, and neutral phases of ENSO, respectively.
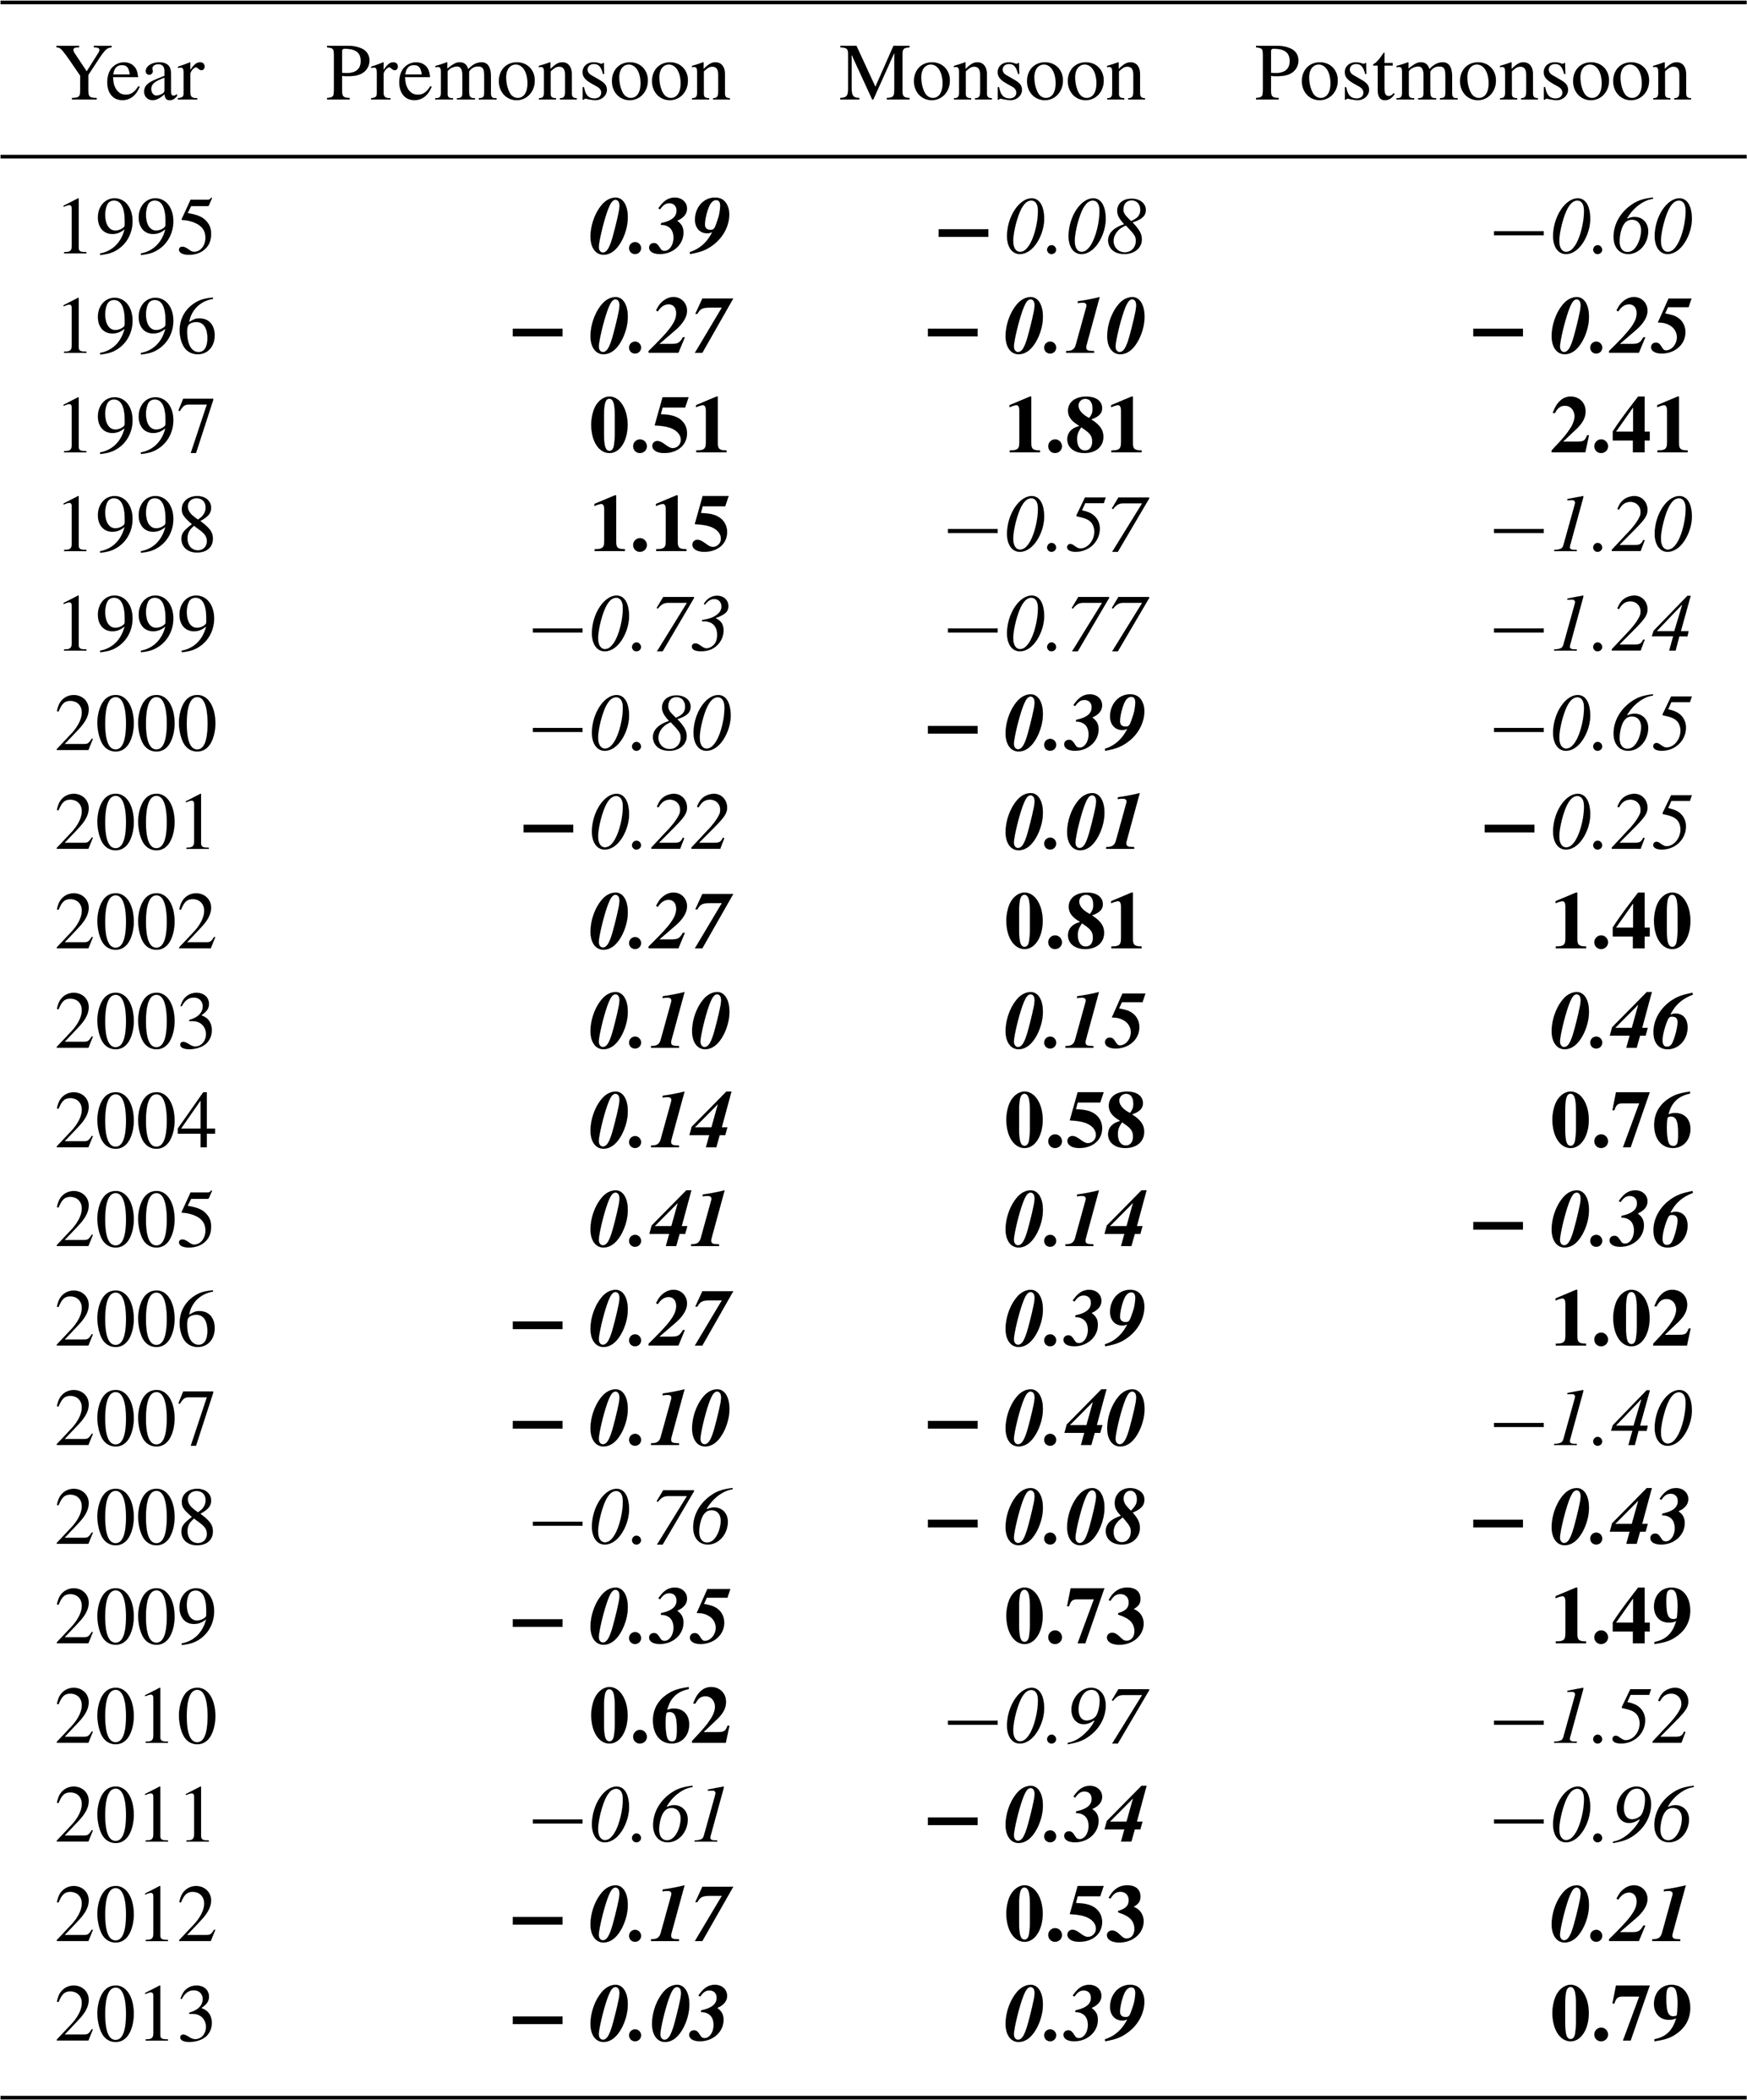
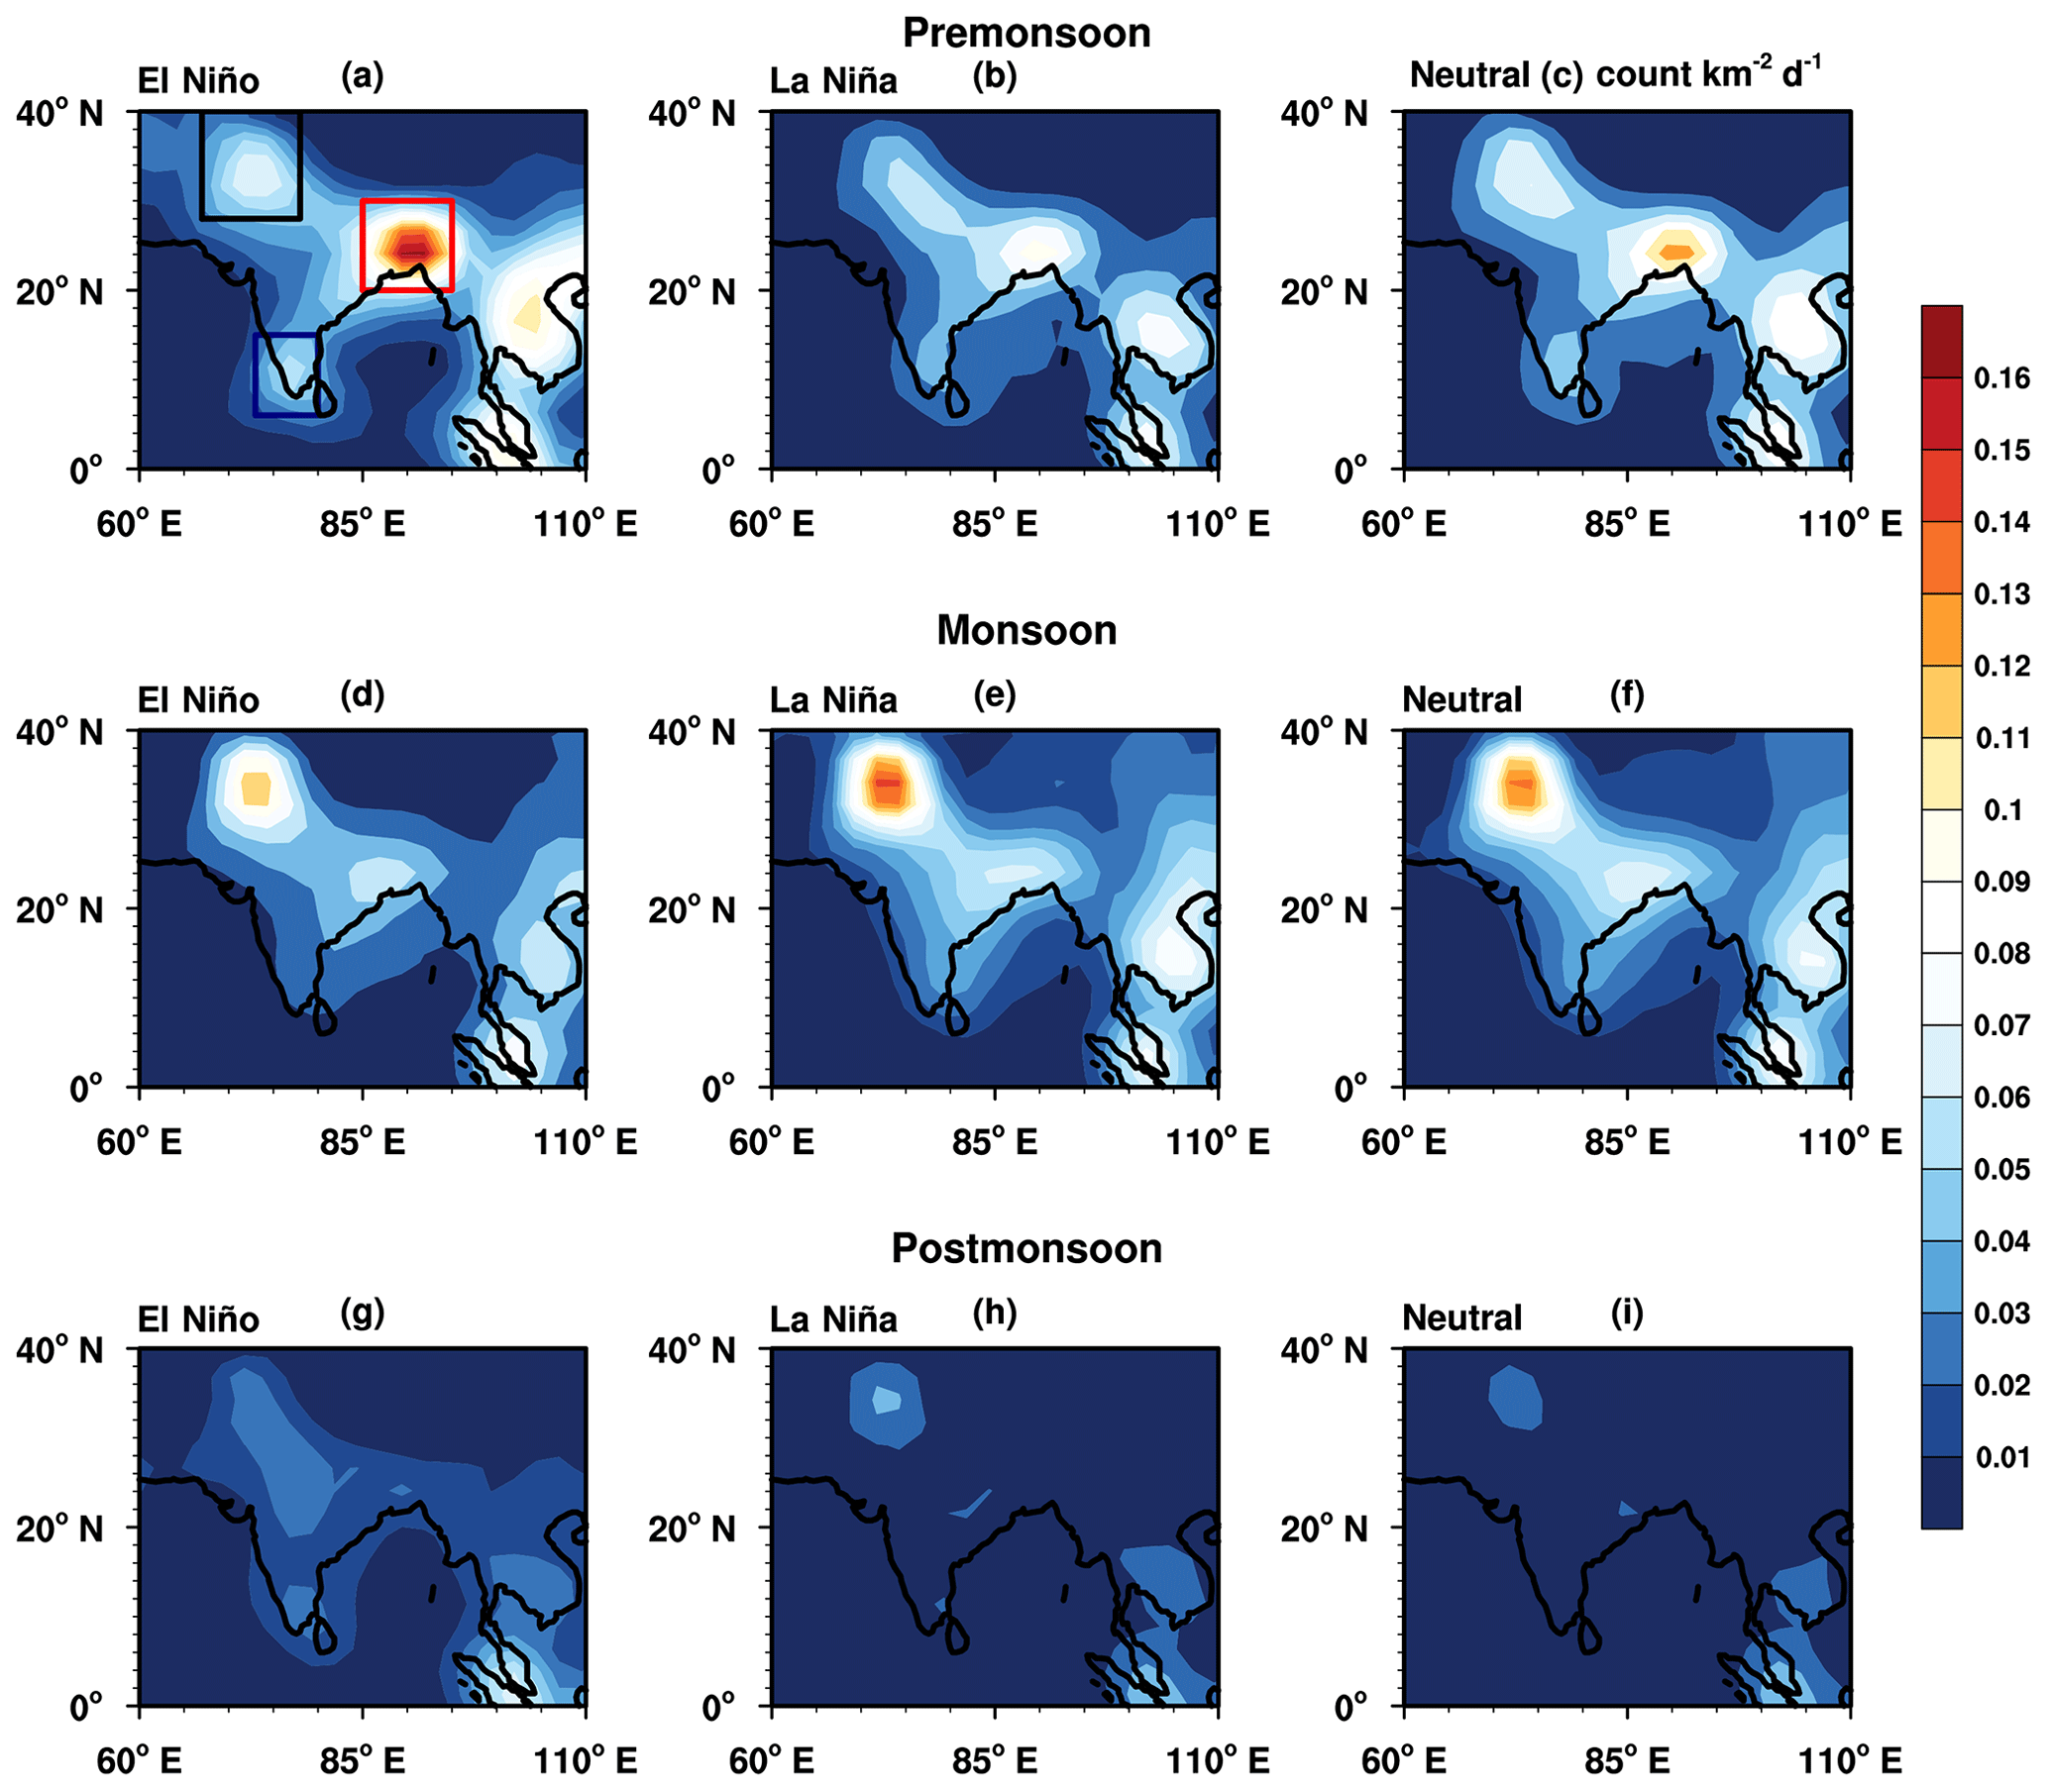
Figure 1LFD composite during different ENSO phases. Coloured boxes in Fig. 1 a represents the hot spot regions of LFD (red box is NEI; black box is NNWI; blue box is SPI).
3.1 Composite LFD with respect to ENSO phases
Figure 1 represents the LFD composites for premonsoon, monsoon and postmonsoon seasons corresponding to the three ENSO phases. Irrespective of ENSO phases, the LFD peak is located over NEI during the premonsoon season, while its peak shifts to the NNWI in the monsoon season. Kamra and Athira (2016) identified a higher concentration of LFD over northwestern and northeastern regions of India, and it is tightly correlated with convective available potential energy (CAPE) over those regions. They also observed that the maxima of lightning during postmonsoon is also lying over India's southern and eastern regions. Ahmad and Ghosh (2017) reported that, compared to other Indian regions, lightning activity is higher over the northeastern and southern parts of India during the premonsoon season. Similarly, we have identified three hot spots of higher lightning activity over the Indian subcontinent (Fig. 1a). They are located in the NEI (85–95∘ E, 20–30∘ N), NNWI (25–40∘ N, 65–80∘ E) and SPI (5–15∘ N, 75–80∘ E). The Himalayan orography favours the formation of deep convective systems over the NEI (Goswami et al., 2010) and is evidenced by the high values of LFD over the region. Rather than the altitude, the steep topographic gradient is responsible for producing deep convection. Most likely, the deep convective clouds developed in the conditionally unstable atmosphere during the premonsoon season are electrically more active (Williams et al., 1992). Lau et al. (2008) proposed that, during the premonsoon months, dust and black carbon from neighbouring sources accumulate over the Indo–Gangetic Plain against the foothills of the Himalayas and act as an elevated heat pump (EHP). Accordingly, this enhanced warming of the middle and upper troposphere contributes to the genesis of deep clouds and higher LFD.
Compared to monsoon and postmonsoon seasons, CAPE is higher during the premonsoon season. The seasonal average of CAPE is highest over India's east coast, and it is near 1500 J kg−1 all over southern India (Murugavel et al., 2014). Nevertheless, large regions of India, especially the central Indian region, show a seasonal average of CAPE of less than 1000 J kg−1 (Murugavel et al., 2014). Strikingly, the areas of higher values of LFD (Fig. 1) during the premonsoon season coincide with the regions of CAPE maxima reported by (Murugavel et al., 2014). Previous works ascertain that the moderate updraughts limit the vertical development of convective clouds during the summer monsoon under the influence of maritime air mass (Kumar et al., 2014; Tinmaker et al., 2015), which leads to a decline in the cloud electrification during the monsoon season. Among the three seasons, postmonsoon shows a minimum of LFD over the Indian region (Fig. 1). One possible reason for this may be the existence of a low average value of CAPE (<500 J kg−1) over most parts of India during this season (Murugavel et al., 2014), which is relatively low to favour the development of deep convection and, hence, lightning.
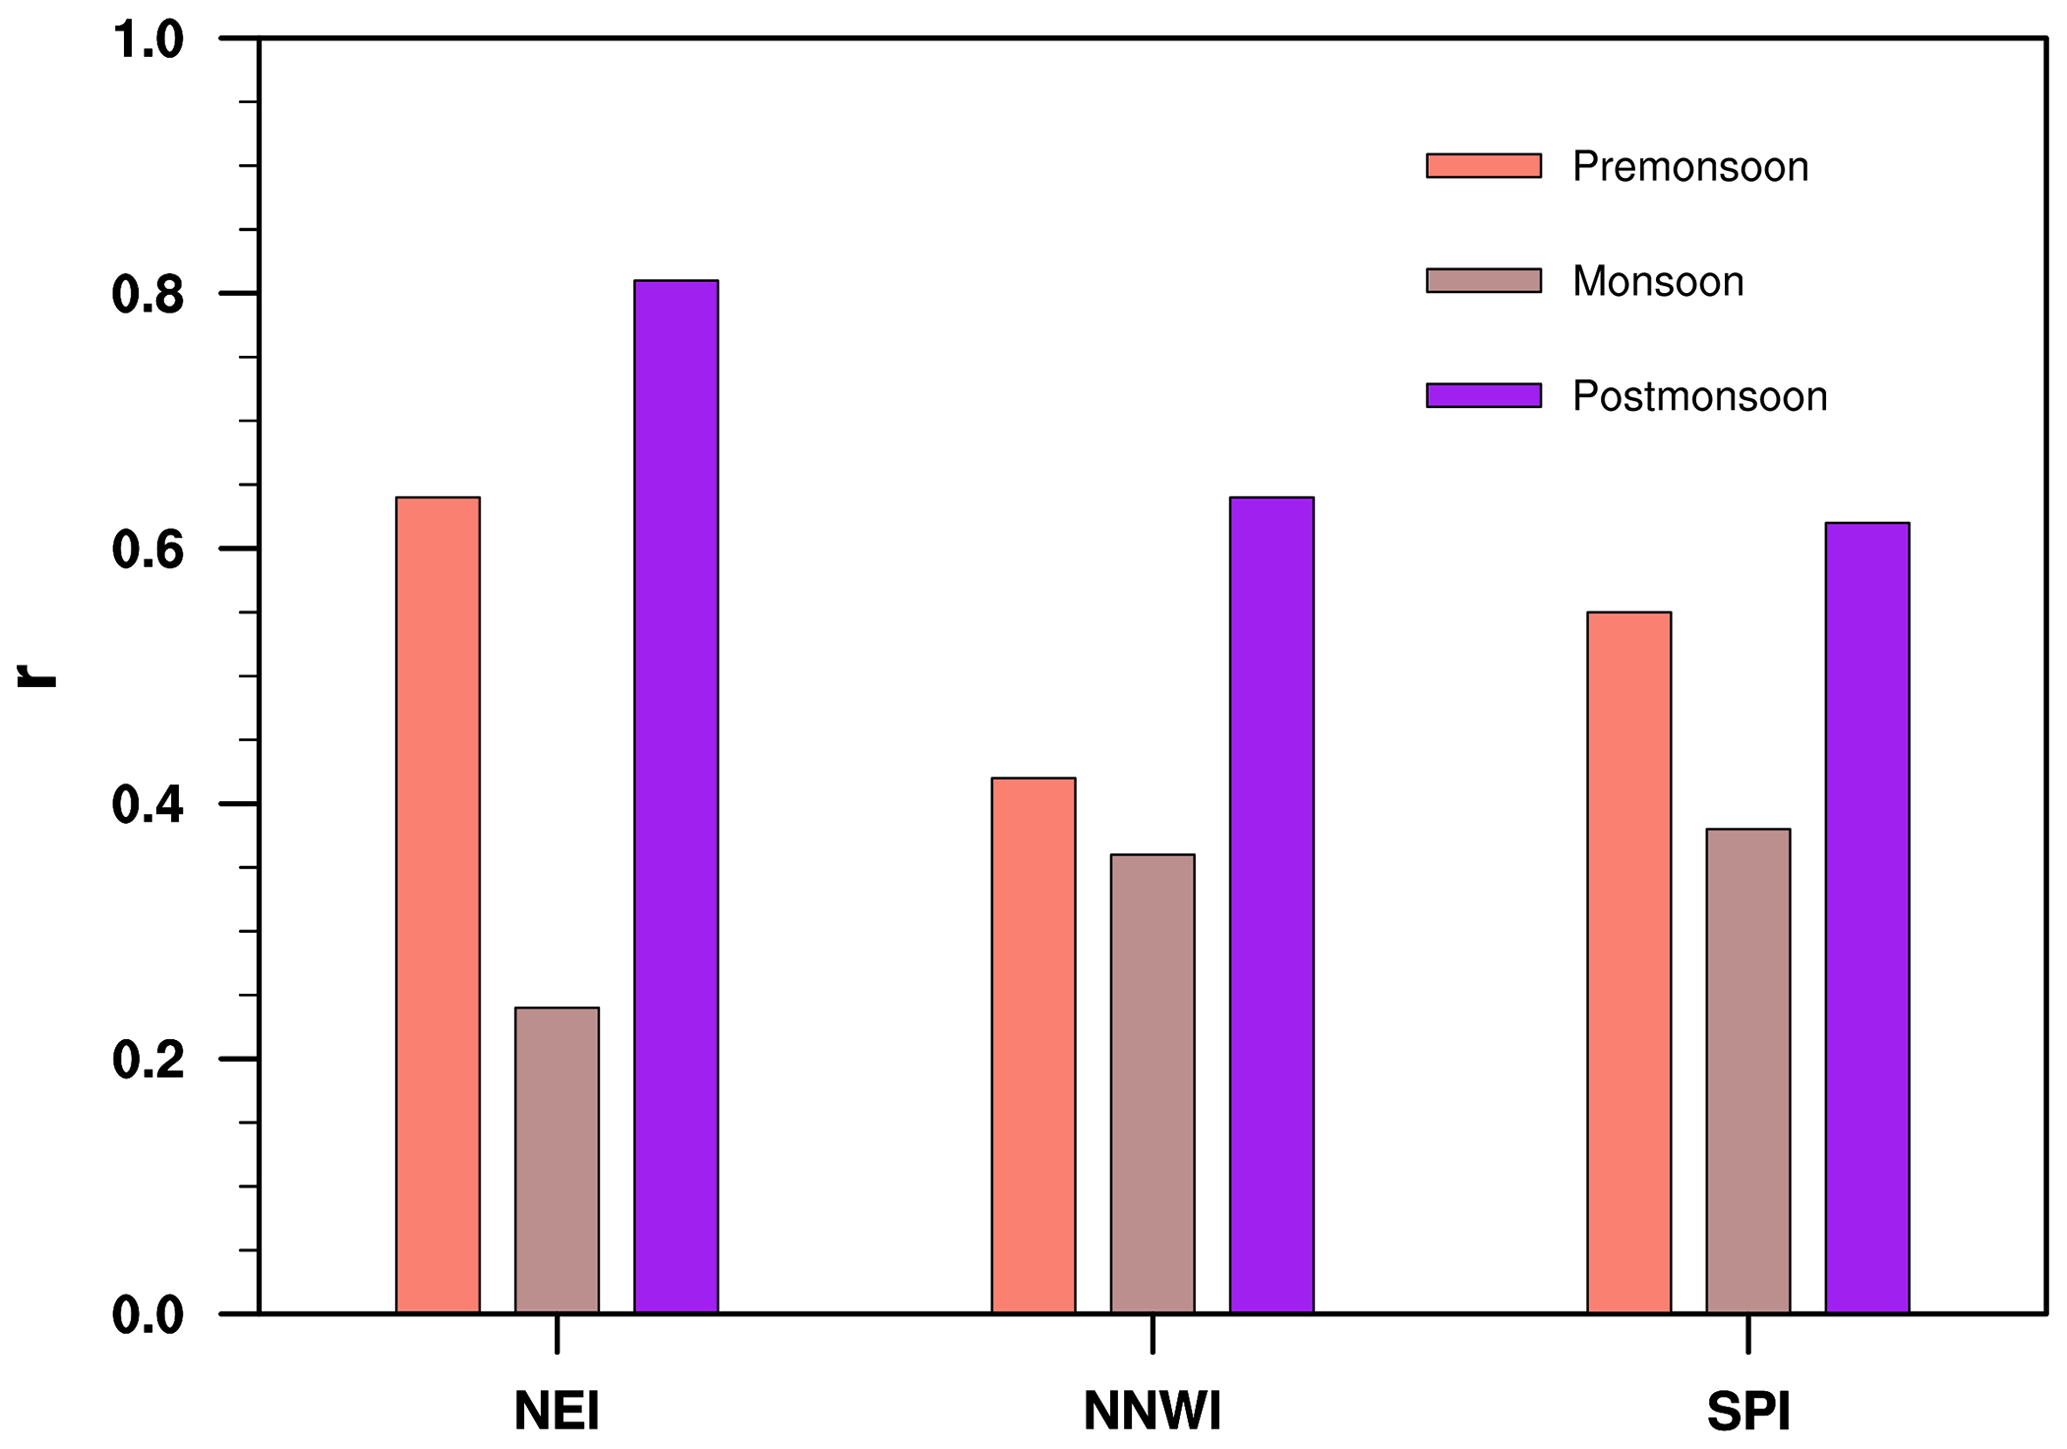
Figure 2 Pearson correlation coefficient (r) between LFD and graupel concentration over NEI, NNWI and SPI during premonsoon, monsoon and postmonsoon seasons.
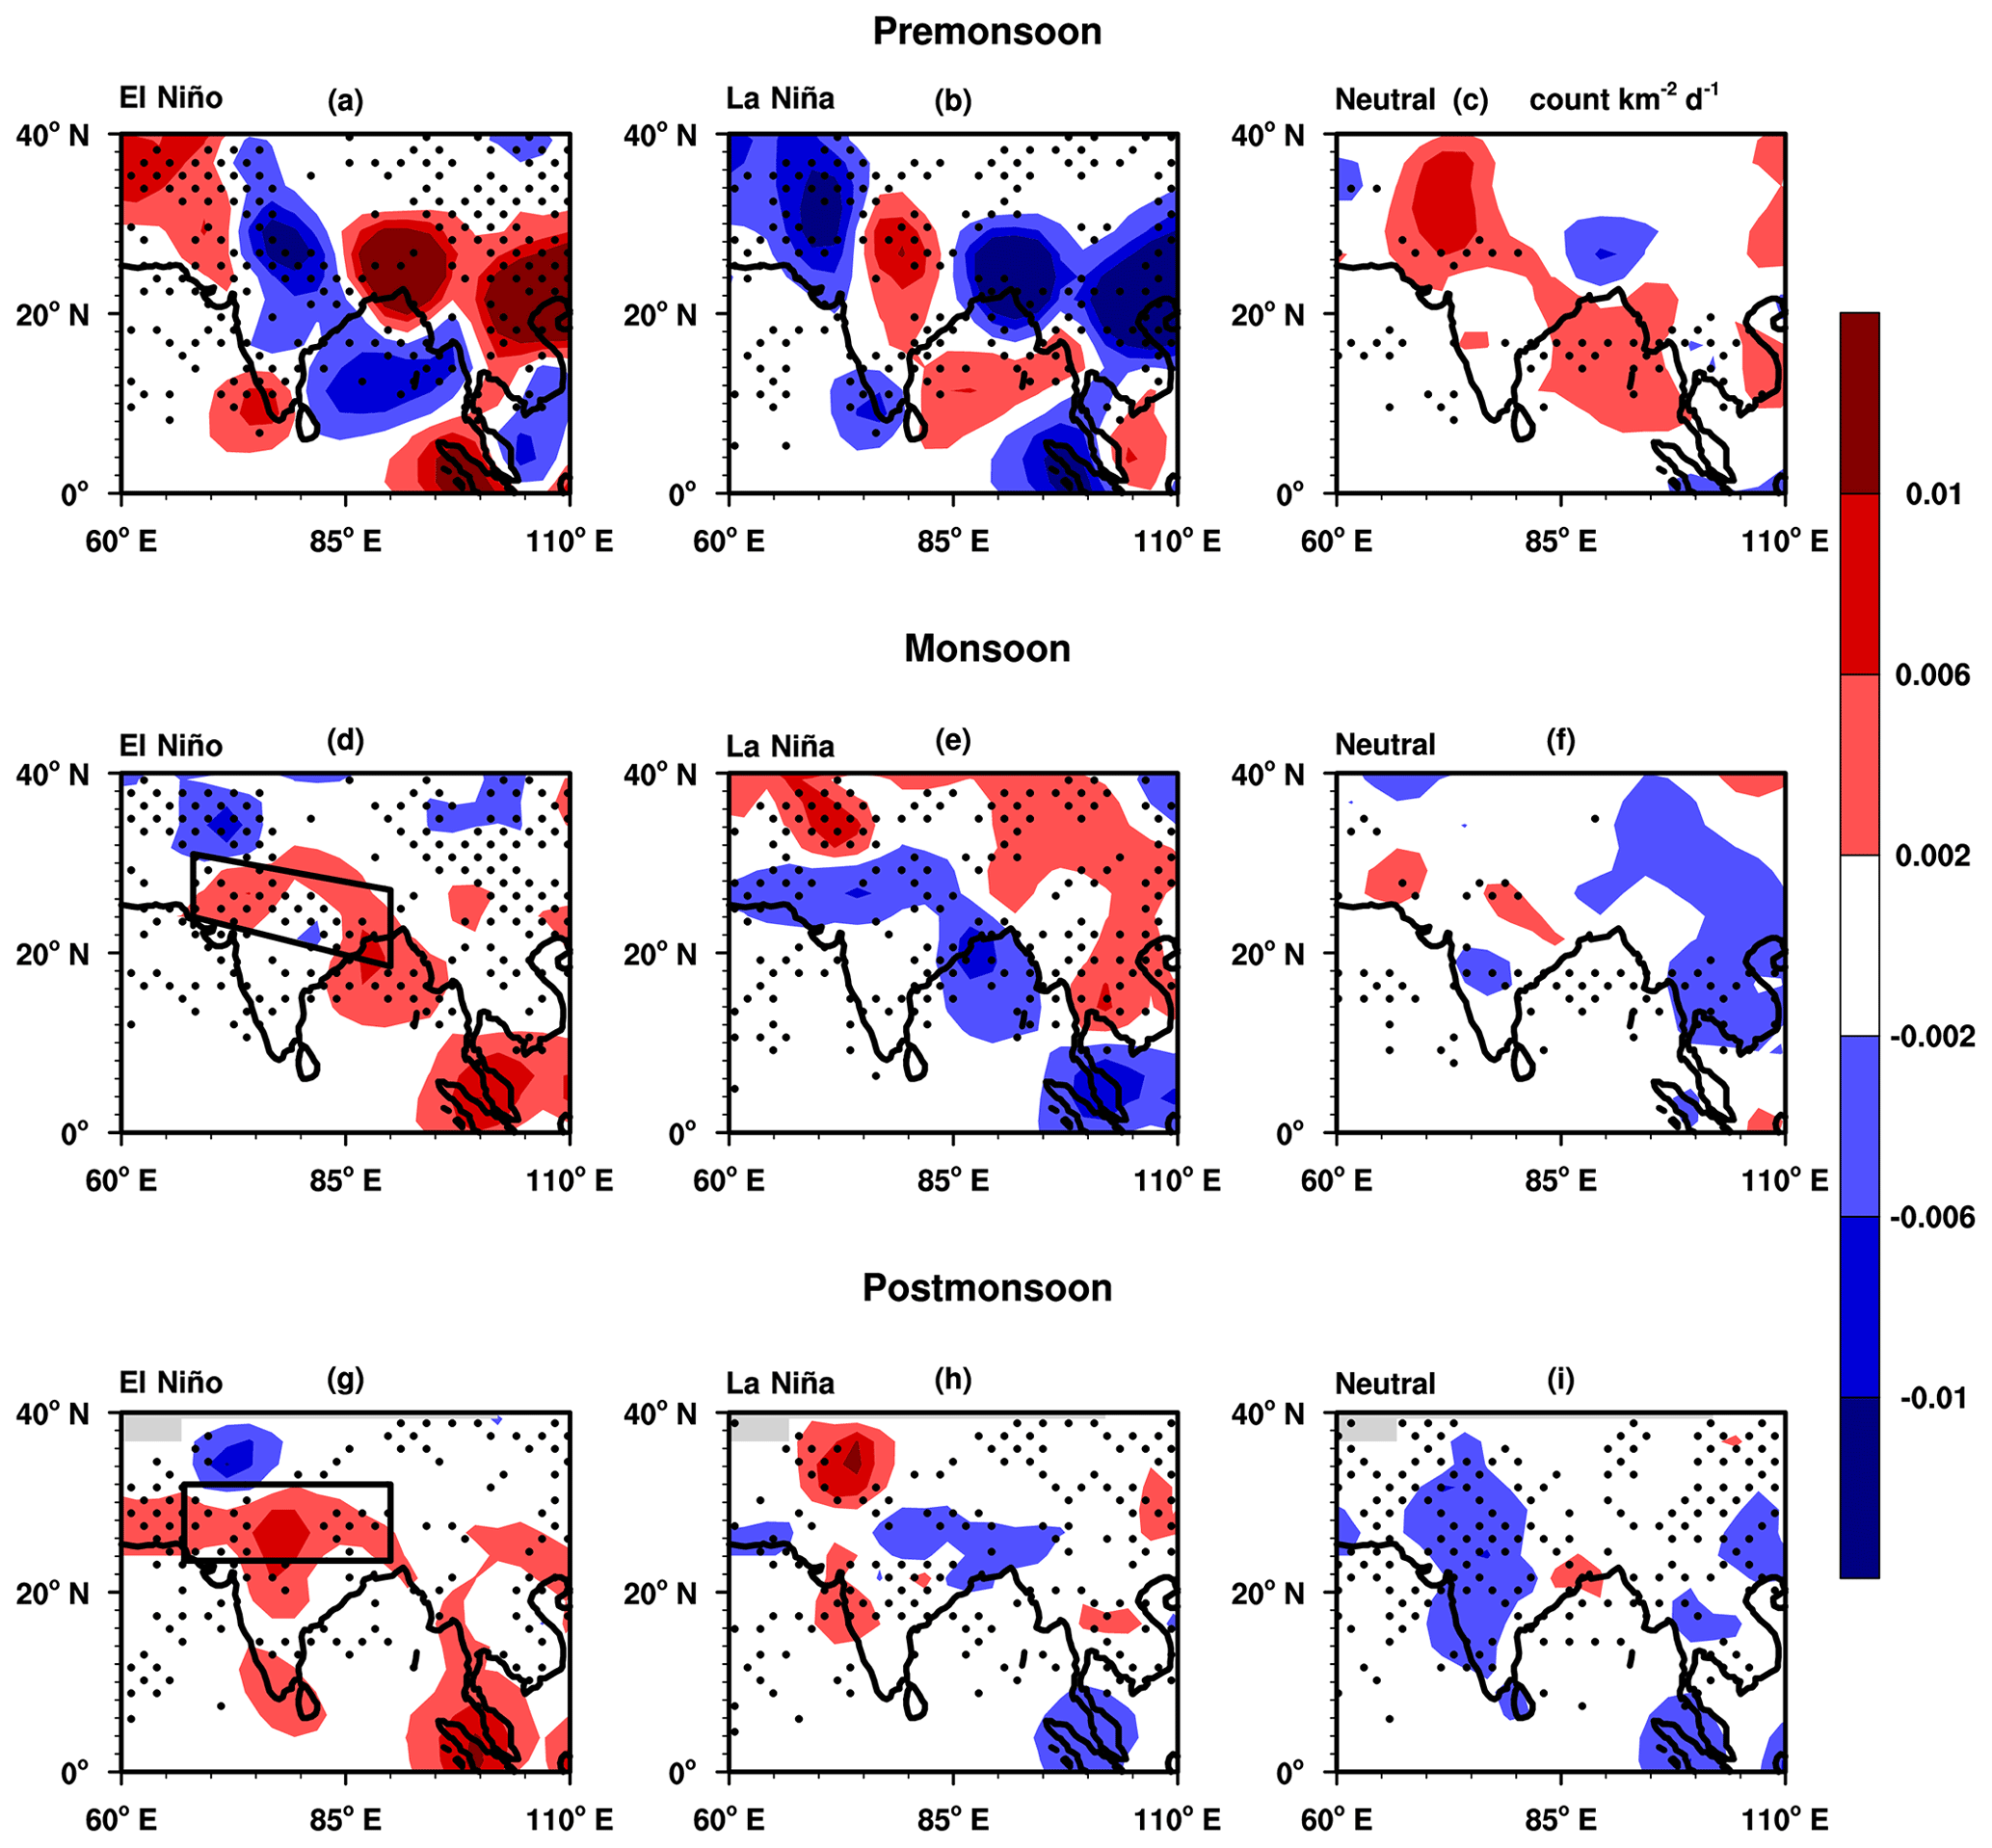
Figure 3 Anomaly composite of LFD during different ENSO phases with stippling indicating the statistically significant areas at a 95 % confidence level. The box in panels (d) and (g) shows the monsoon trough and western disturbance region, respectively.
The relationship between LFD and graupel concentration is examined during the three seasons by using a Pearson correlation analysis over NEI, NNWI and SPI (Fig. 2). It shows that the correlation between LFD and graupel concentration is peaking during the postmonsoon season over NEI (r=0.81), NNWI (r=0.64) and SPI (r=0.62). In contrast, the correlation attained a minimum value during the monsoon season over these hot spot regions of LFD (NEI, where r=0.24; NNWI, where r=0.36; SPI, where r=0.38). It is important to note that the premonsoon season also exhibits a solid correlation between the LFD and graupel concentration over NEI (r=0.64), NNWI (r=0.42) and SPI (r=0.55). All the correlation values are strong and statistically significant at a 95 % confidence level, indicating tight linearity in the relationship between LFD and graupel concentration over regions of higher lightning activity over India.

Figure 4 Anomalous LFD during the individual years with different ENSO phases. The red bar corresponds to warm phases of ENSO, the green bar corresponds to cold phases of ENSO and the blue bar indicates the neutral phases of ENSO.
3.2 Distribution of anomalous LFD during premonsoon season with respect to ENSO phases
The LFD values are lower than normal during the premonsoon season over NNWI when the ENSO phase is either warm or cold (Fig. 3a,b), and it exhibits an increase in LFD during the neutral phase (Fig. 3c). While looking into the LFD anomaly of individual years, premonsoons of 3 years (1997, 1998 and 2010) over NNWI have come under the El Niño phase (Fig. 4d). The first two exhibit a decrease in LFD, contributing to the overall reduction in the LFD over NNWI (Fig. 3a). Out of the 4 La Niña years (1999, 2000, 2008 and 2011) of the premonsoon season, 1999, 2000 and 2011 have below-average values of LFD over the same region (Fig. 4d).
In situ airborne observations during the Cloud–Aerosol Interaction and Precipitation Enhancement Experiment (CAIPEEX) over various locations of India shows that convective clouds during the premonsoon and monsoon period have an ice water content of 10−4 to 1 g m−3 (Patade et al., 2015). Moreover, in situ measured ice cloud properties in the European Cloud Radiation Experiment (EUCREX) have reported a similar range of ice water content inside the clouds system (10−4 to 1 g m−3; Hogan et al., 2006). From TRMM observations and high-resolution model simulations, Abhilash et al. (2008) reported ice concentrations of 10−3 to 10−2 g m−3 for convective storms over the Indian region. The vertical profiles for graupel and snow concentration are shown over the hot spot domains of LFD in Figs. 5 and 6, respectively, revealing a significant disparity in their seasonal average with the observation region. These figures clearly demonstrate that the seasonal average of graupel and snow concentration are peaking around 6 km over NEI, NNWI and SPI, and after that level, they show a rapid decrease with height. Note that the seasonal average of latent heat (LH) over these hot spot domains of LFD are peaking between a 6 and 7 km range, and this dramatically coincides with the peaking altitude of graupel/snow concentration, mainly because of the release of energy during the phase transition of cloud droplets to ice particles (Fig. 7). It is captivating that graupel/snow concentrations are prominent during all three seasons over SPI, with a maximum value in the postmonsoon season. In contrast to this observation, the NEI and NNWI are showing a minimum value of graupel/snow concentrations during the postmonsoon season in India.
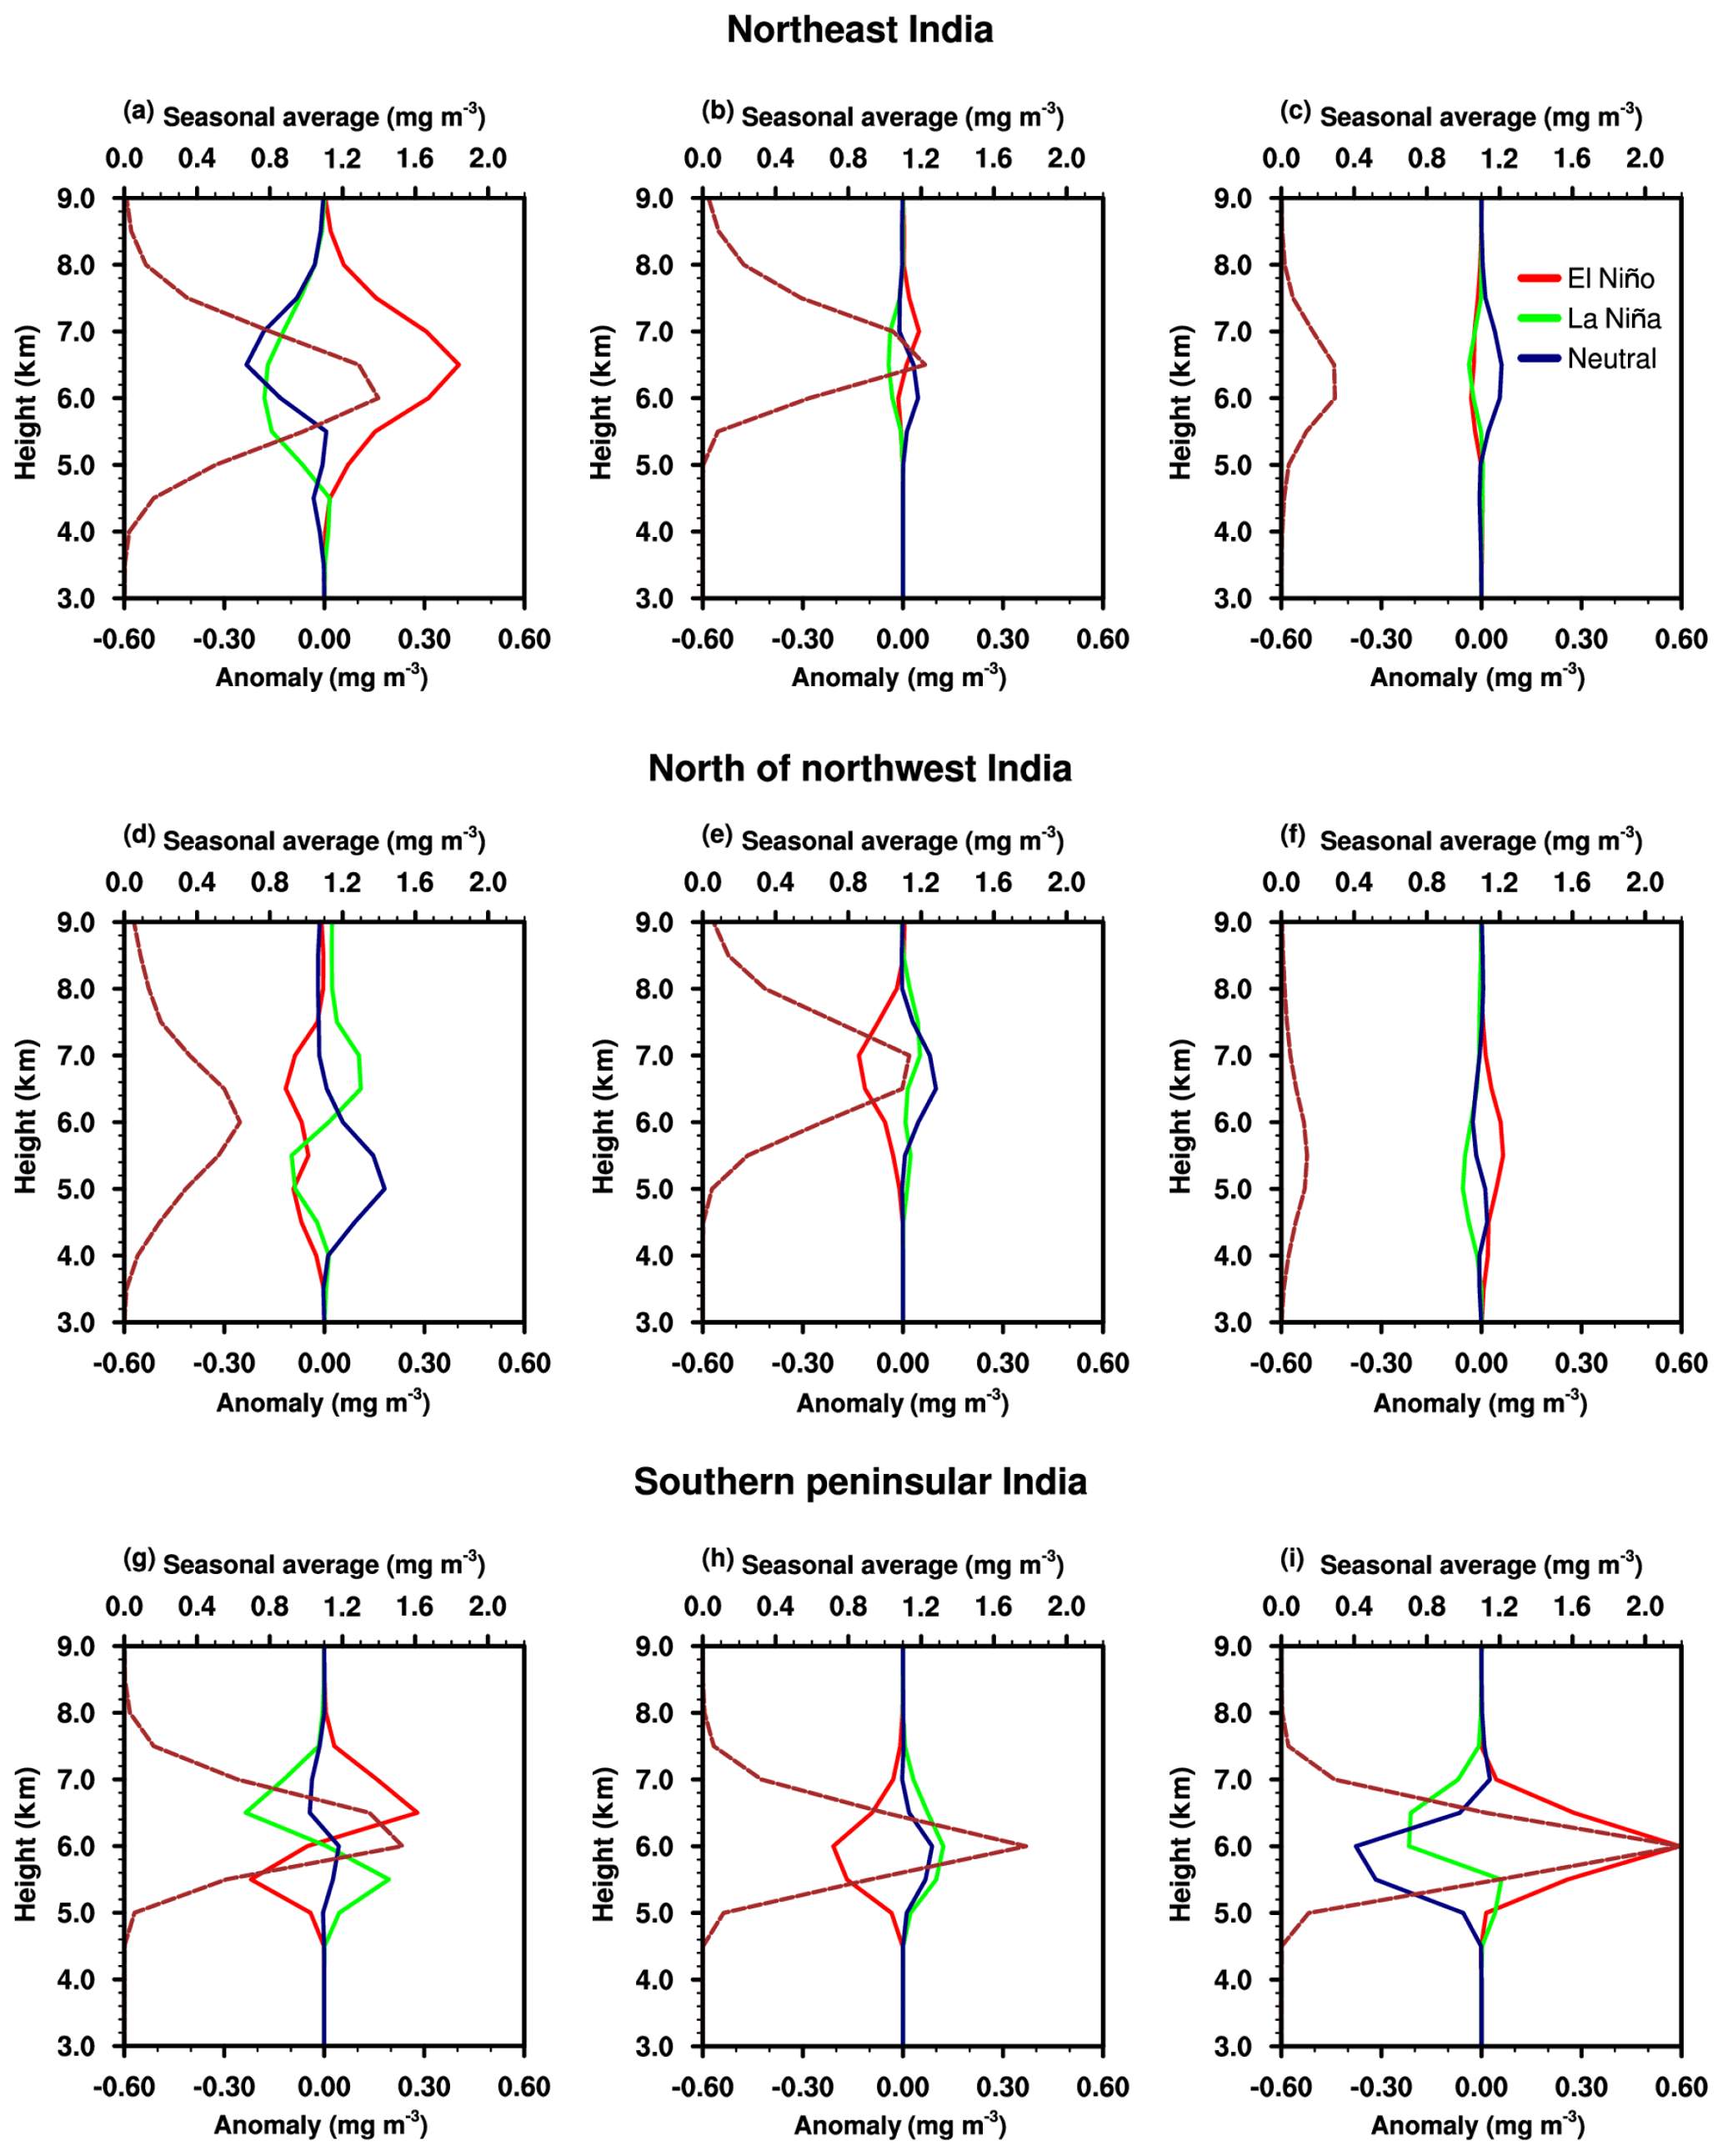
Figure 5 Seasonal average (brown dotted curve) and anomaly composite of graupel concentration during different ENSO phases. (a, d, g) Premonsoon season. (b, e, h) Monsoon season. (c, f, i) Postmonsoon season.
The anomalous profile of graupel in Fig. 5a indicates that clouds over NEI have high (low) graupel content during the ENSO warm (cold) phase. An increase in snow content with a peak value near 6.5 km is also observed over NEI during premonsoon in the warm ENSO phase (Fig. 6a). The interaction between snow and graupel and the associated charge generation is responsible for lightning from convective clouds. Thus, the formation of the higher amount of graupel and snow over NEI during the warm phase will release more latent heat, which is evident from Fig. 7a. Positive (negative) anomalies of SH over NEI indicate that the convective clouds formed during the ENSO warm (cold) phase are vigorous (wimpy) and consequently responsible for the enhanced (reduced) LFD. More importantly, graupel, snow and latent heat profiles present below-average values in the neutral ENSO phase, which may confirm a decrease in lightning events over NEI.
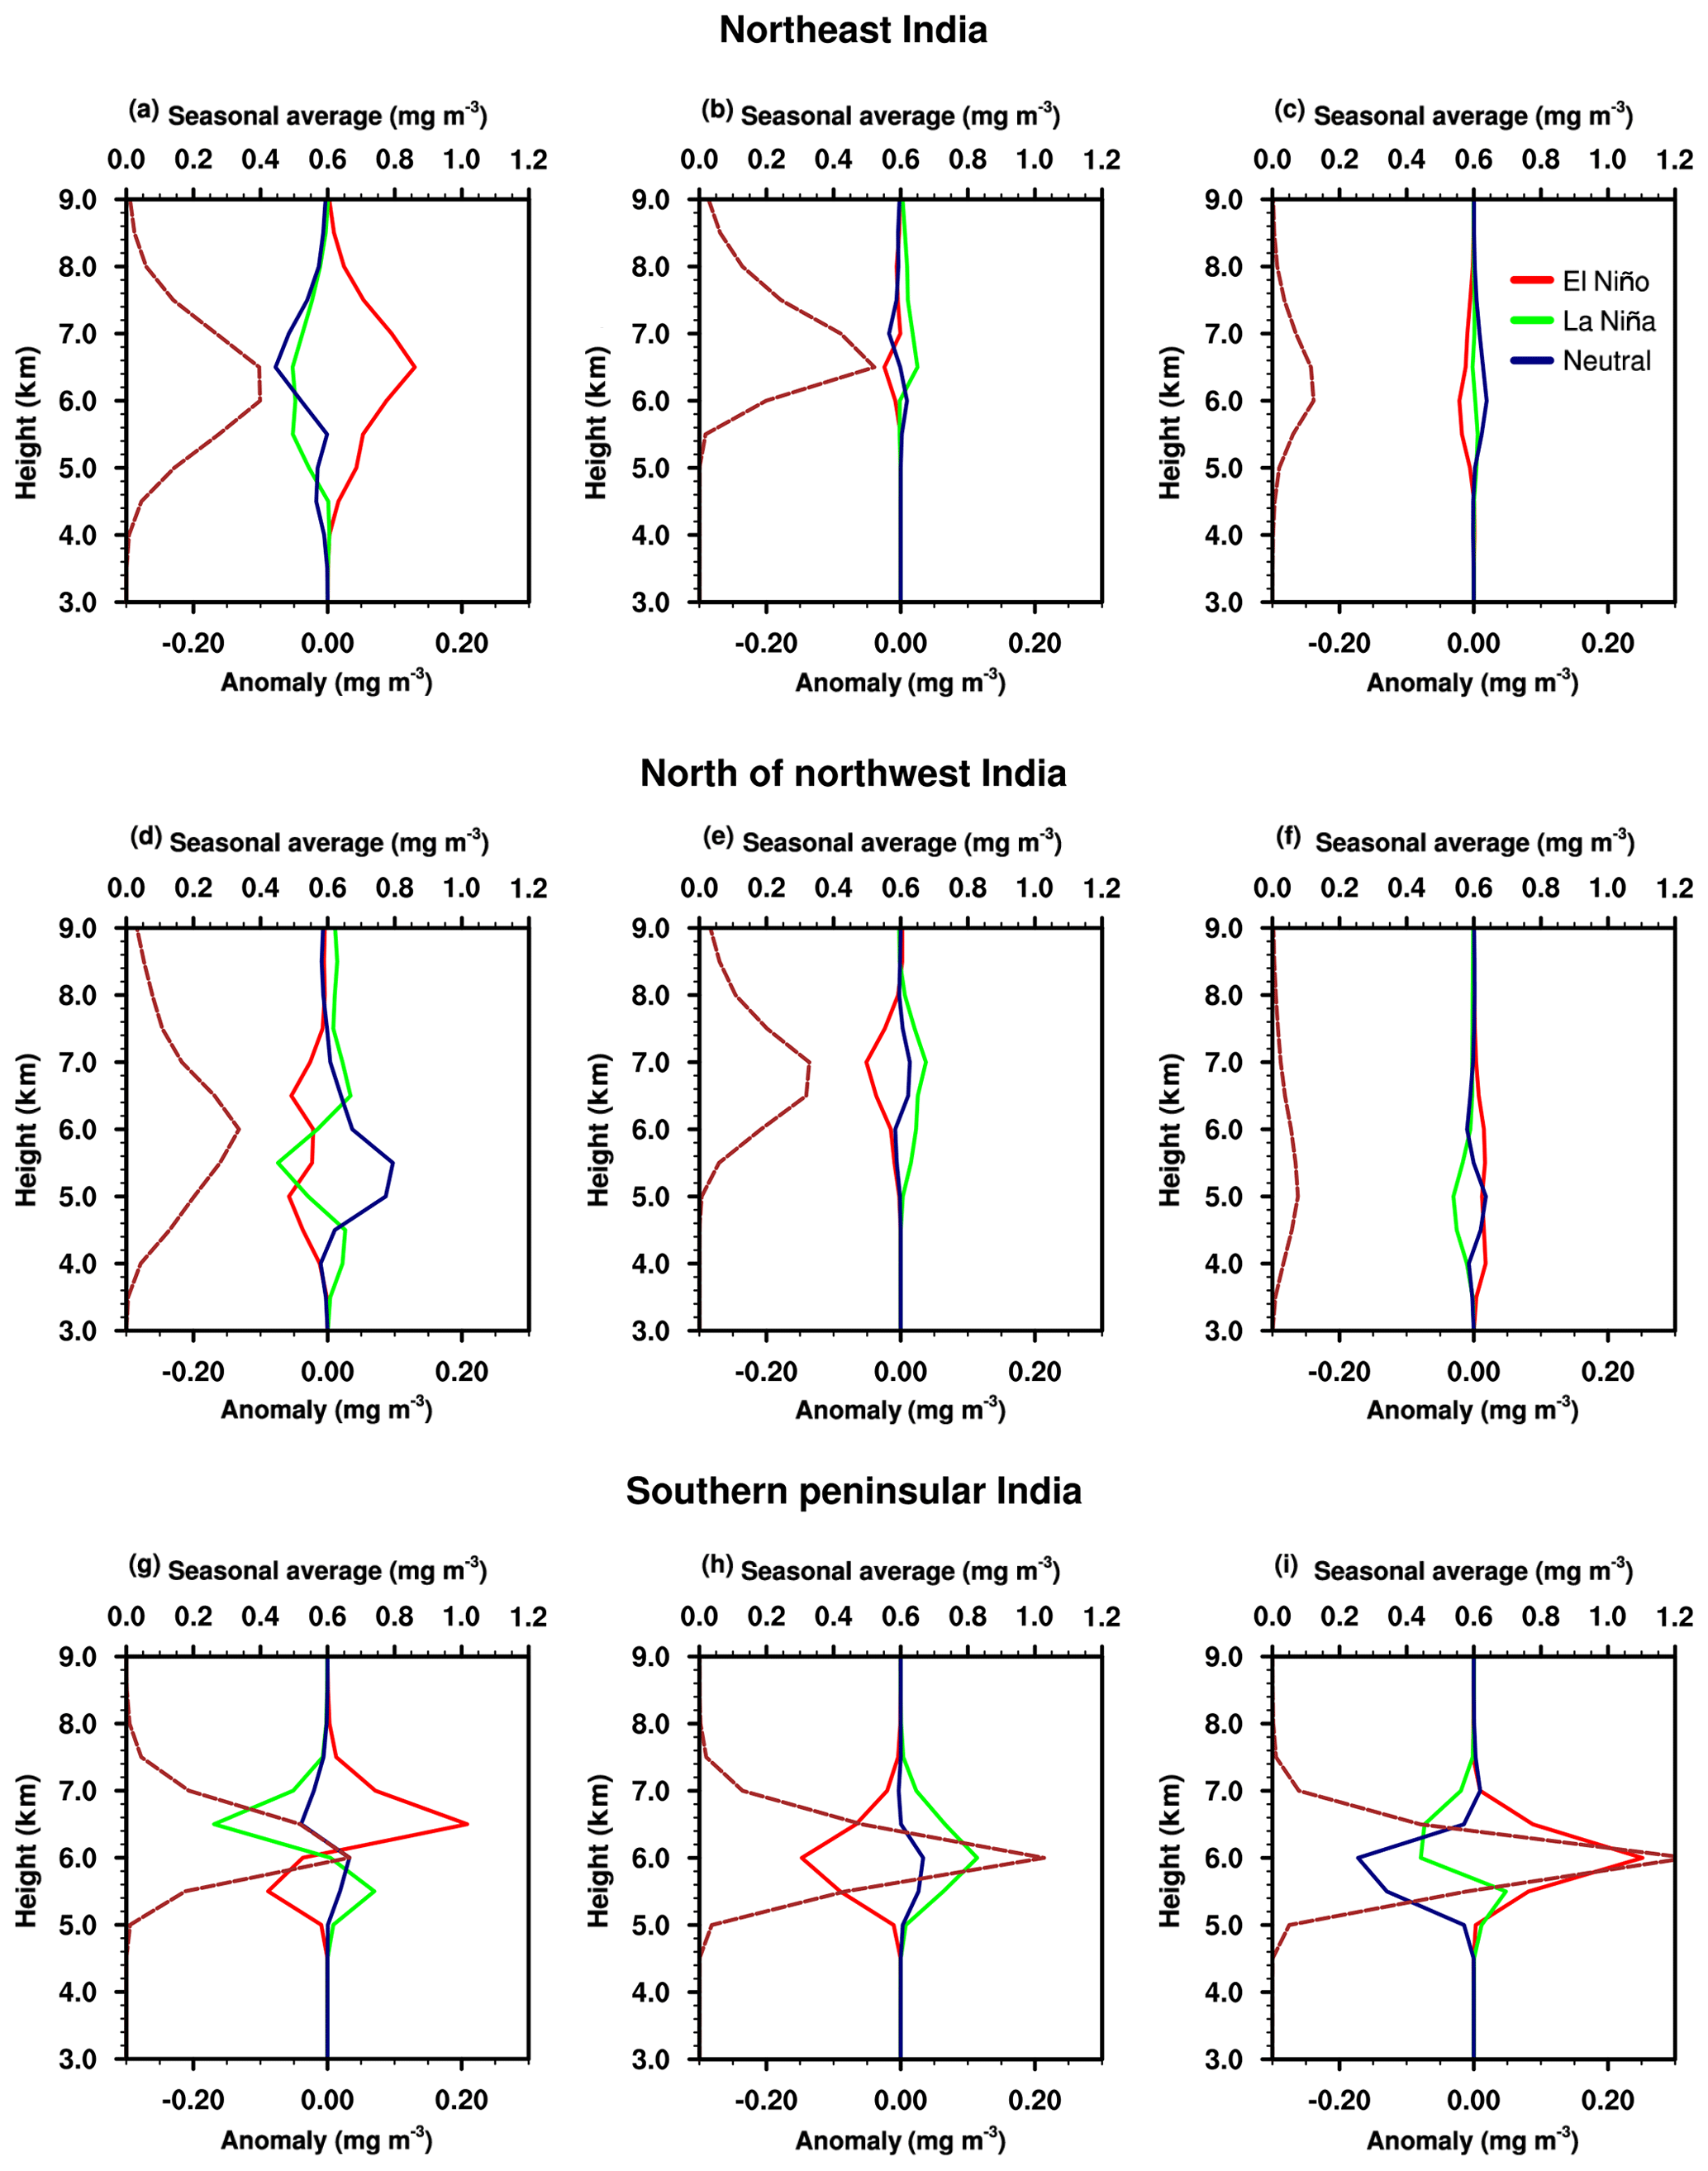
Figure 6 Seasonal average (brown dotted curve) and anomaly composite of snow concentration during different ENSO phases. (a, d, g) Premonsoon season. (b, e, h) Monsoon season. (c, f, i) Postmonsoon season.
From Fig. 7, the anomalous latent heating exists mostly between ±0.01. In some cases, it is extends up to ±0.02 (K h−1); additionally, previous studies indicate that these anomalous values are highly significant (Kumar et al., 2014). Linked with the decrease in graupel and snow content over NNWI during the warm and cold phase of ENSO (Figs. 5d, 6d), LH changes (Fig. 7d). The anomalous negative SH at 300 hPa manifests that the clouds are unable to penetrate deep into the atmosphere during these two phases over NNWI (Fig. 8a,b). As a result, LFD over NNWI in these phases is low, especially in the cold phase. Contrarily, higher LFD during the neutral phase points to the abundance of graupel and snow inside the cloud system. It is noticed that the ENSO cold phase during the premonsoon season is favourable to LFD over central India (CI) (Fig. 3b), and the converse is true for the ENSO warm phase (Fig. 3a).
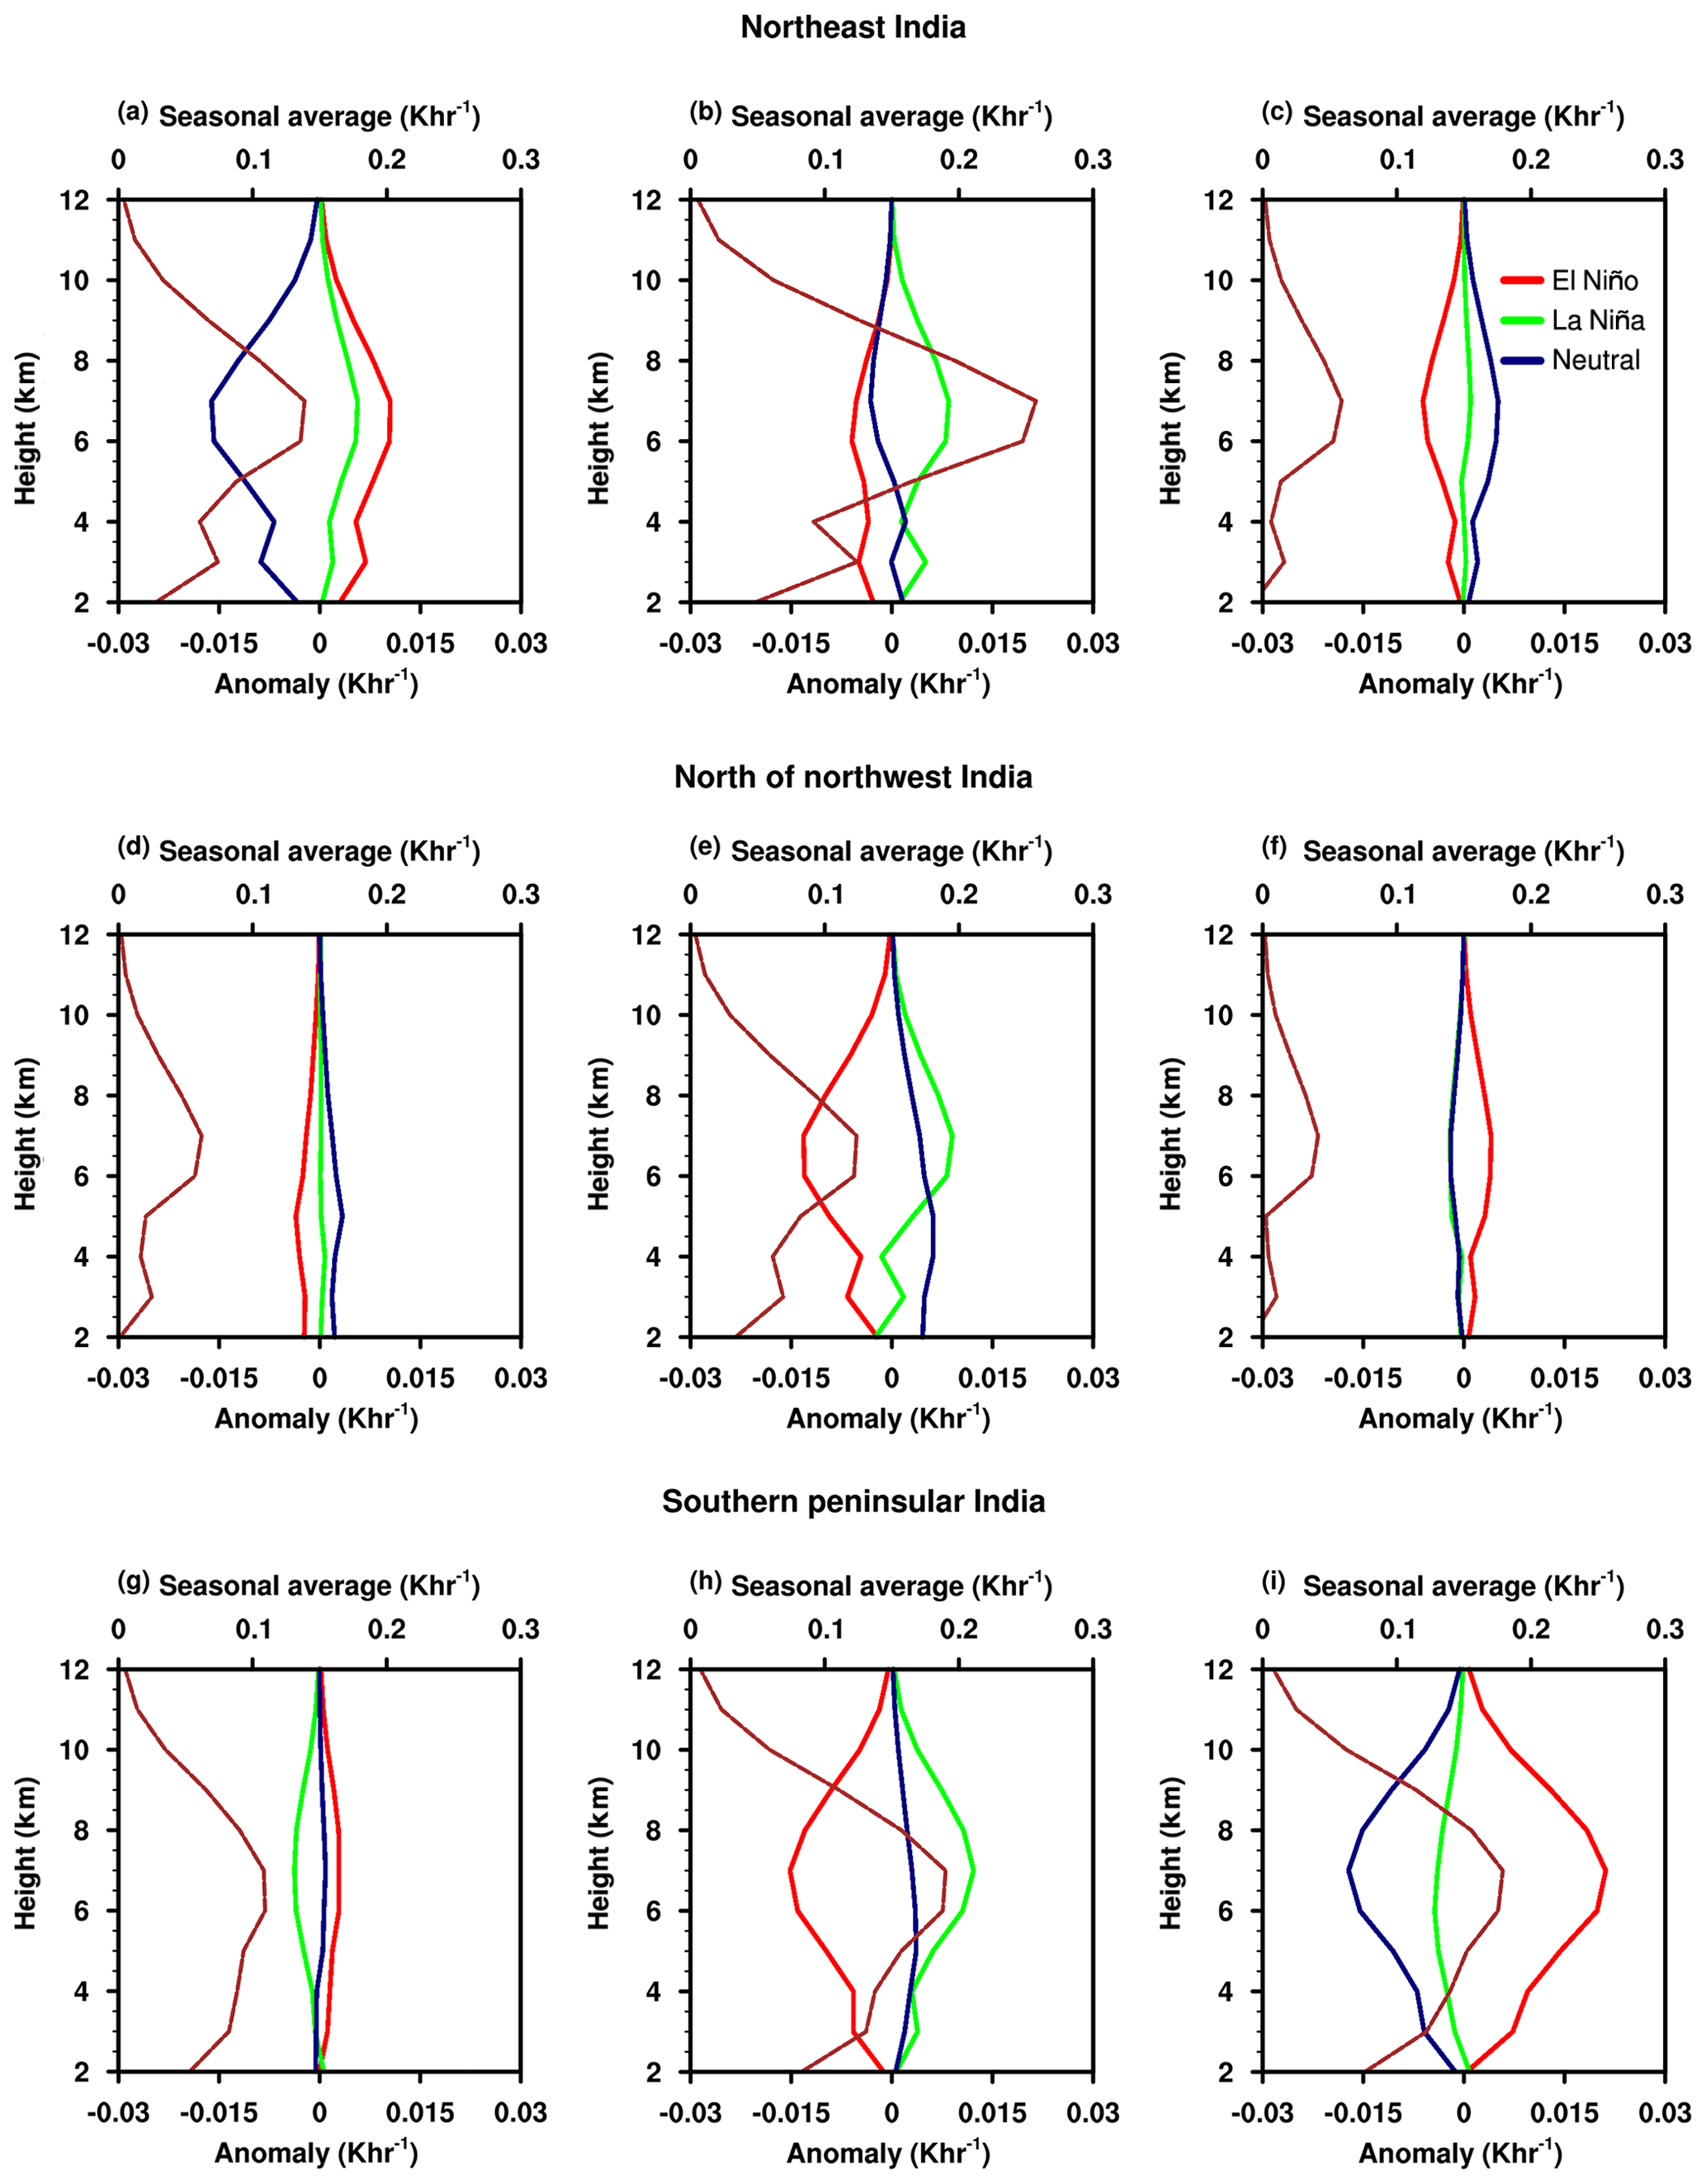
Figure 7 Seasonal average (brown dotted curve) and anomaly composite of latent heat during different ENSO phases. (a, d, g) Premonsoon season. (b, e, h) Monsoon season. (c, f, i) Postmonsoon season.
The graupel and snow concentrations over SPI are anomalously high up to 6 km during the cold phase of ENSO, and above that level, it decreases (Figs. 5, 6d). This particular hydrometeor pattern reverses during the warm phase, exhibits below-average values beneath 6 km and rapidly increases above that level. A similar pattern is observed in the vertical profiles of latent heat release above 6 km. Note that the analysis presented here confirms that the warm phase of ENSO intensifies the deep convection over SPI during the premonsoon season and, hence, promotes LFD.
3.3 Distribution of anomalous LFD during monsoon season with respect to ENSO phases
The LFD over the monsoon trough region of India increases during the warm phase of ENSO (Fig. 3d), but it, remarkably, decreases during the cold phase (Fig. 3e). Based on the 1998–1999 El Niño event, Hamid et al. (2001) suggested that intense convective storms developing over the maritime continents are responsible for the increase in lightning activity despite a decrease in the number of convective storms. During the El Niño years of 1997–1998 and 2002–2003, the southeast Asian regime exhibited an above-average value of lightning (Kumar and Kamra, 2012). While analysing the 300 hPa SH variability, we noticed that the amount of SH over the monsoon trough is higher during the warm and lower during the cold phase (Fig. 8d,e). The NEI shows a positive anomaly of LFD during the cold phase of ENSO. Figure 4b enforces this result by showcasing that the majority of the years under the cold phase (during the monsoon season) show an increase in LFD over NEI. The vertical profile of LH shows an above-average value during the cold phase, and this enhancement of LH in the mid-troposphere helps to increase atmospheric instability and deep convection. On the other hand, the vertical distribution of hydrometers are not displaying any compelling variability with ENSO phases over NEI (Figs. 5b, 6b). The observed increase (decrease) in the anomalous LFD over NNWI during the cold (warm) period is captured well in the vertical profiles of graupel, snow and latent heat release (Figs. 5e, 6e, 7e). There is no noticeable change in the distribution of LFD over SPI in the three phases of ENSO (Fig. 3d, e, f).
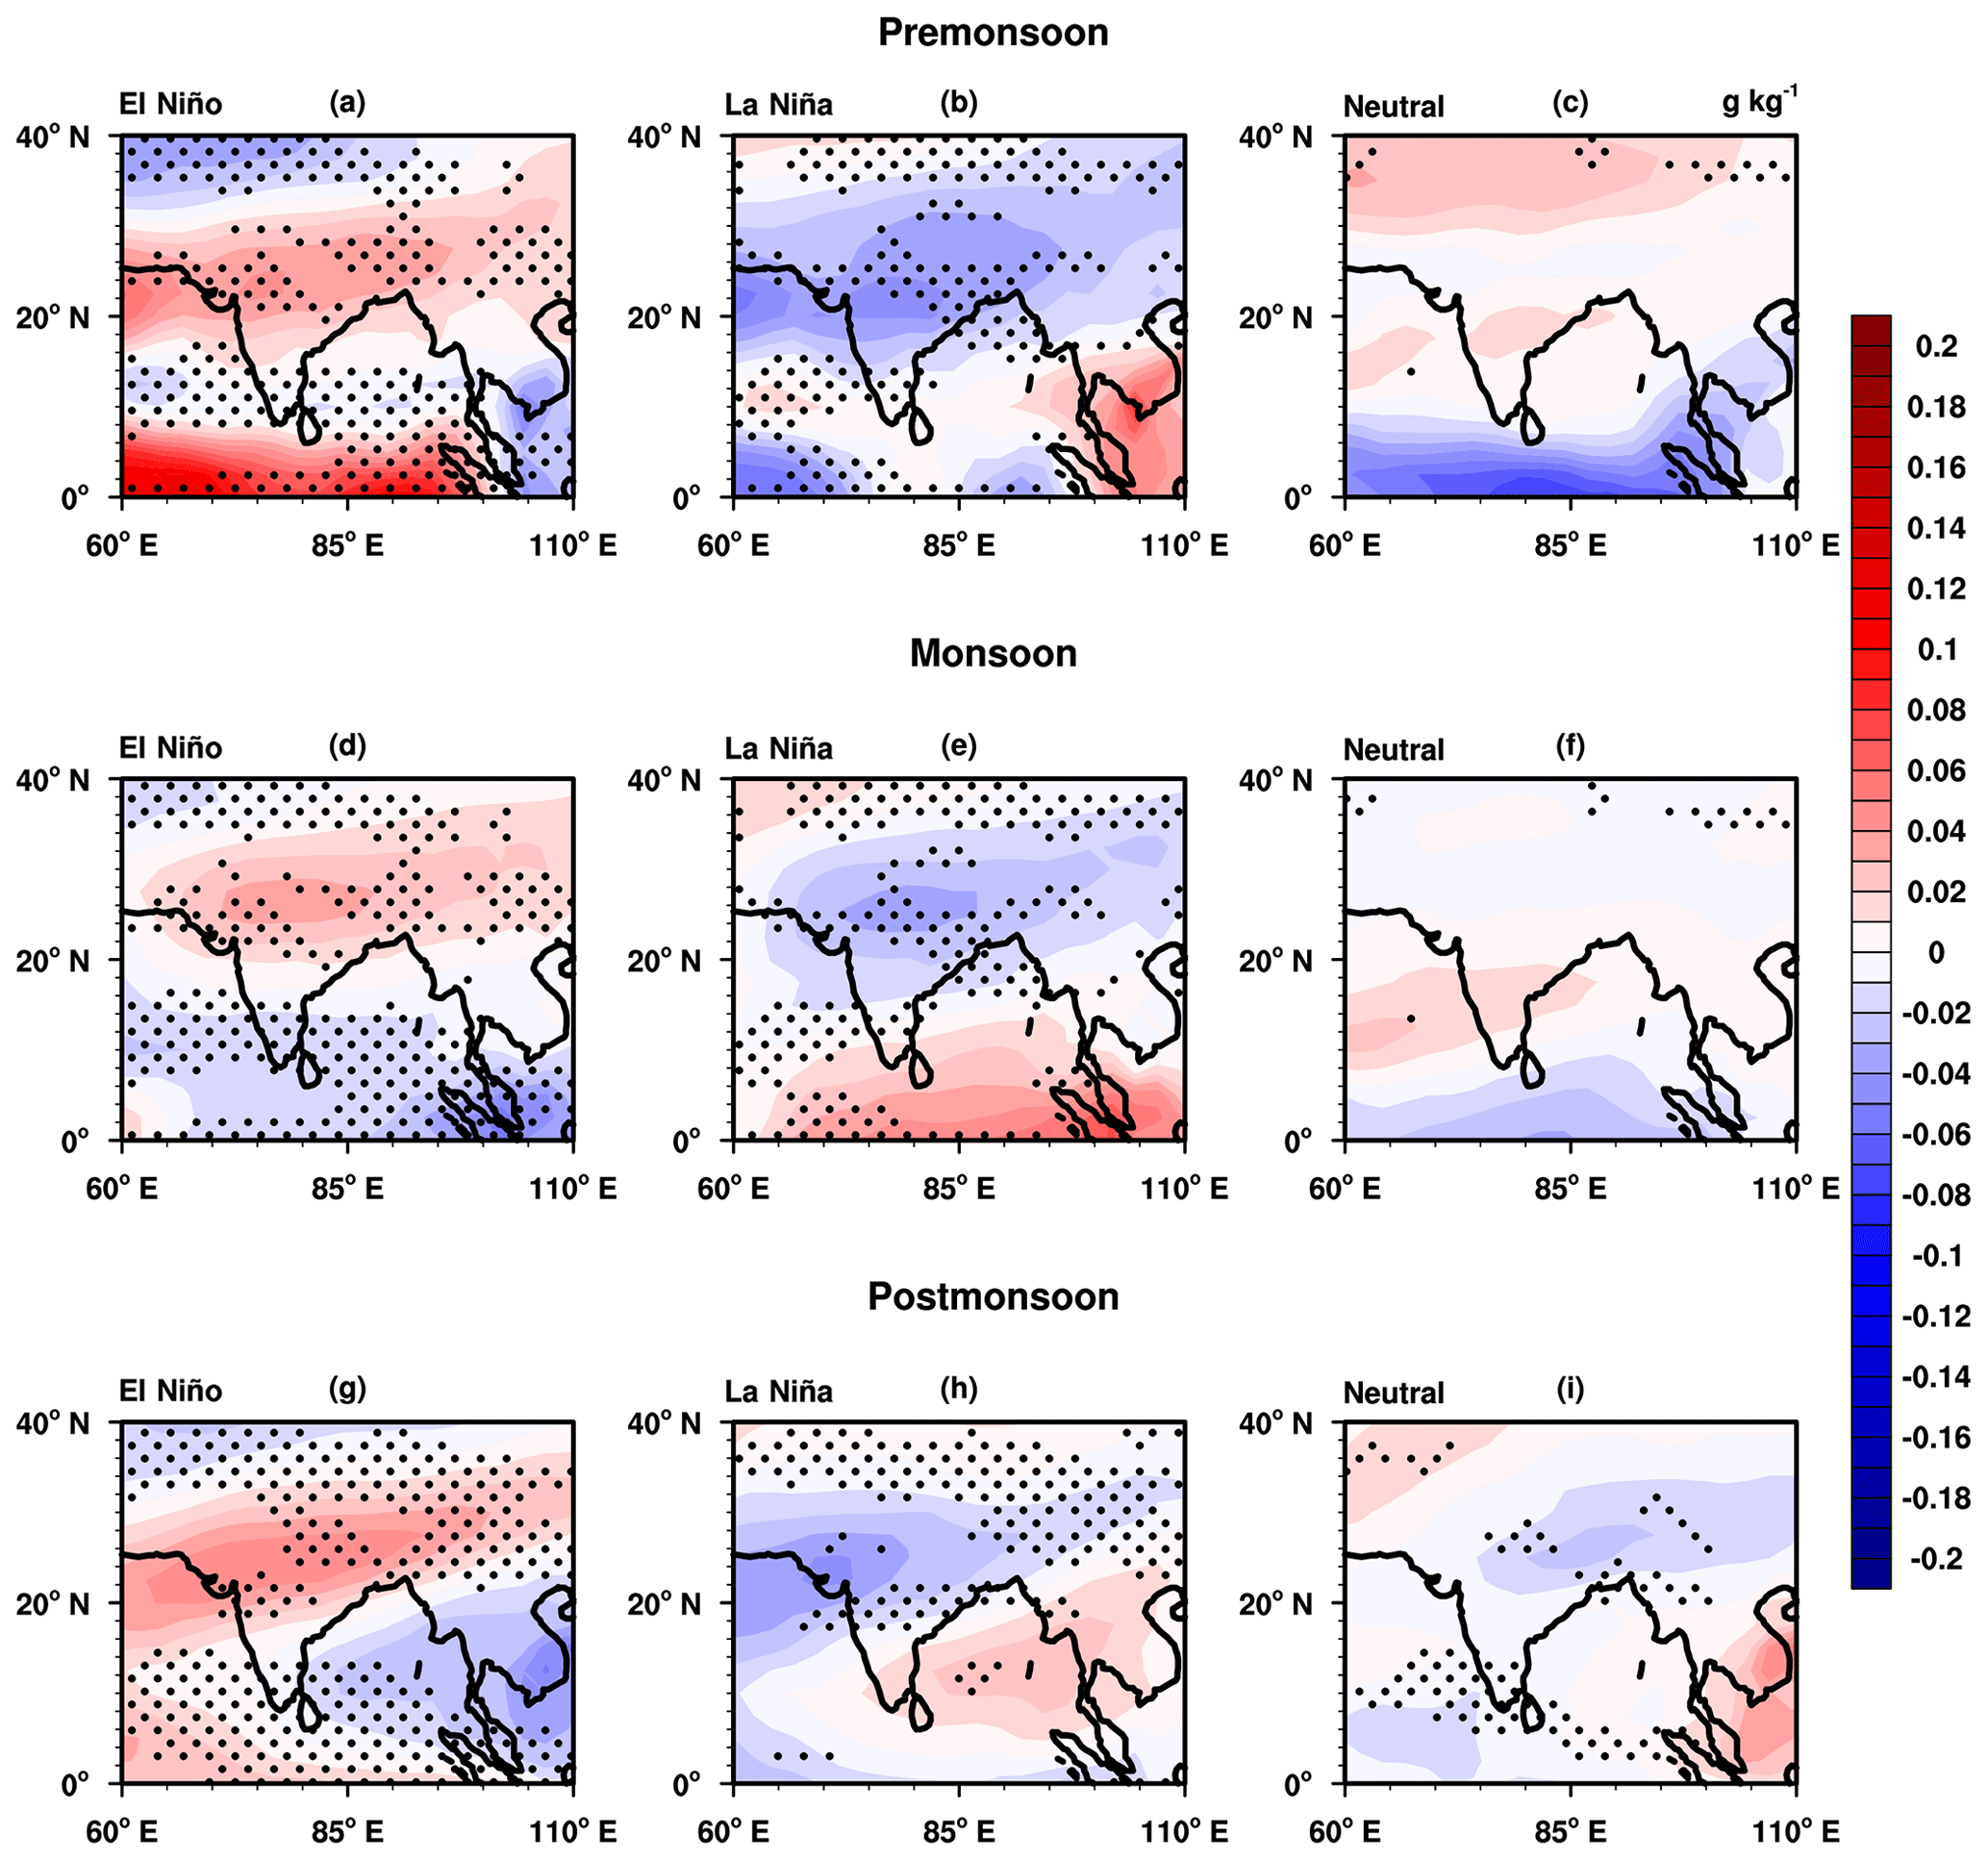
Figure 8 Anomaly composite of specific humidity at 300 hPa during different ENSO phases with stippling to indicate statistically significant areas at a 95 % confidence level.
It is interesting to observe that, during the 12 years from 2002 to 2013, 11 years have shown above-average values of LFD over the NEI and NNWI regions (Fig. 4b, e), registering the intensification of deep convective cloud formation during the recent monsoon season over respective areas. Out of the 9 years from 2005 to 2013, 8 have above-normal LFD over SPI (Fig. 4h), thus indicating an escalation of deep convection over SPI in that period. Specifically, the hot spots of LFD over the Indian land region became more prominent during the last decade's monsoon seasons.
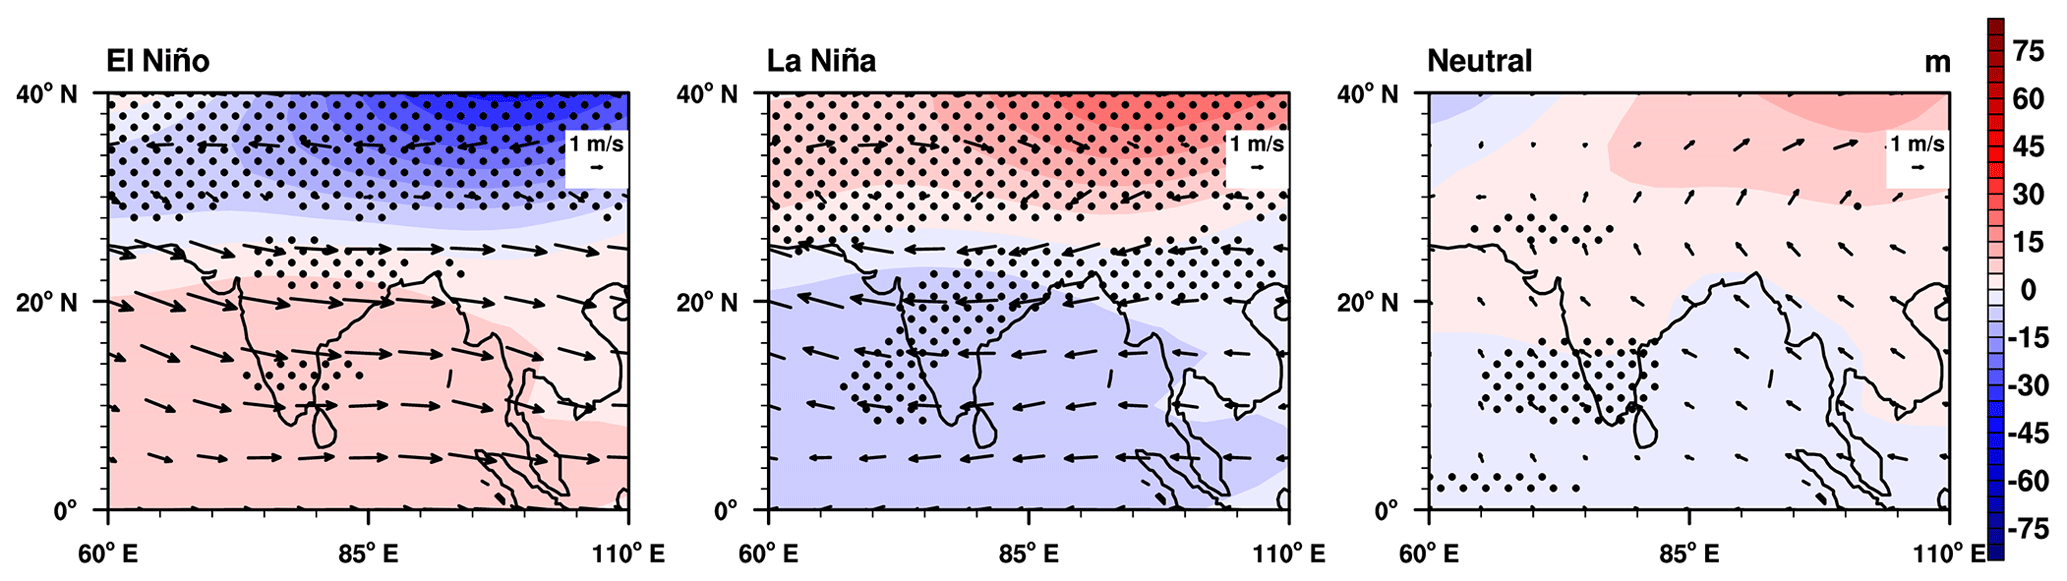
Figure 9 Anomaly composite of geopotential height at 500 and 200 hPa wind during different ENSO phases. The stippling indicates statistically significant areas of geopotential height at a 95 % confidence level.
3.4 Distribution of anomalous LFD during postmonsoon season with respect to ENSO phases
Western disturbances (WDs) are the vertical perturbations associated with the subtropical westerly jet stream, which is one of the potential contributors to the rainfall over northern India during the postmonsoon season (Dimri et al., 2016). The jet is more intense and propagates southward during the El Niño phase of ENSO (Schiemann et al., 2009). Our analysis shows that, at the time of the postmonsoon El Niño period, LFD is increased throughout the country, and it is maximum over north–central India (Fig. 3g). In contrast, in the cold phase, intense LFD is concentrated only over the NNWI (Fig. 3h). Zubair and Ropelewski (2006) reported a significant role for ENSO in controlling the postmonsoon rainfall over SPI. The SPI shows an increase in LFD in the warm phase of ENSO during this season due to the presence of clouds having higher graupel and snow content over that region (Figs. 3g, 5i, 6i). The entire number of years grouped under the warm phase of ENSO during the postmonsoon season show an increase in LFD over SPI. On the other hand, during the cold phase, anomalous LFD displays an inconsistent pattern of oscillation (Fig. 4i).
Climate variability, like ENSO, can alter the position of jet streams and, hence, the distribution of WDs (Hunt et al., 2018). Syed et al. (2006) identified that the intensification of WDs during the El Niño is associated with the weakening of the Siberian high. Studies signify that depressions formed over the southern Bay of Bengal and the Arabian Sea can also modulate the WDs' path (Rao et al., 1969). The 500 hPa geopotential (GP) surface drops down (goes up) beyond 25∘ N latitude and indicates the reduction in (enhancement of) convection over that region during the warm (cold) phase of ENSO (Fig. 9a, b). Meanwhile, a higher (lower) GP surface is visible over all of India during the warm (cold) phase, which is an indication of an increase (decrease) in the convective activity during the respective phases. By considering the anomalous circulation at 200 hPa level, an anomalous westerly (easterly) wind is prevalent over the whole of India during warm (cold) periods (Fig. 9). Accordingly, upper-level wind pattern and variability in GPH together indicate the southward extension of WDs during ENSO's warm phase. The sharp increase (decrease) in SH lies precisely over the region of the maximum undulation of GPH over India during the warm (cold) phase (Fig. 8g,h). This suggests that ENSO indirectly influences the LFD over India during the postmonsoon season by modulating the WDs' path.
In this study, we have discussed the influence of ENSO on LFD distribution during premonsoon, monsoon and postmonsoon seasons over India. Regardless of ENSO phases, the LFD is peaking at the time of the premonsoon season over NEI and SPI. However, the NNWI exhibits a peak LFD during the monsoon season. More importantly, the compelling correlation values indicates the solid linear dependence of LFD on graupel concentration over the hot spot regions of lightning. The LFD is increased (decreased) compared to their average values over NEI and SPI during the warm (cold) phase of ENSO, and anomalies of the charge-generating hydrometeors also show a similar kind of swing during the premonsoon season. An increase in graupel and snow formation above 6 km pinpoints that the warm phase of ENSO is conducive to deep convection over SPI during the premonsoon season. However, the neutral phase of ENSO favours the deepening of clouds over NNWI, as evidenced by the high values of the upper-level-specific humidity.
During monsoon season, LFD over NEI and NNWI is higher than the average values during the La Niña periods. The SPI is not showing a significant variation in LFD with respect to different ENSO phases during the monsoon season. While considering the recent 12 years of this study, irrespective of the ENSO phases, every year has displayed above-average values of LFD over the NEI and NNWI region. Out of 9 years from 2005 to 2013, 8 displayed above-normal LFD over SPI, which signifies the intensification of LFD over the three hot spots during the monsoon seasons of the last decade.
Almost all regions in India are exhibiting higher LFD during the warm ENSO phase in the postmonsoon season. The elevated (reduced) GPH is visible all over India during the warm (cold) phase of ENSO, which is an indication of an increase (decrease) in the convective activity during the respective phases. Furthermore, the intensification of convection during the warm phase is advocated by a significant rise in graupel and snow concentration over SPI. The entire years grouped under the warm phase of ENSO during the postmonsoon season show an increase in LFD over SPI, whereas the years elected under the cold phase show a dispersed anomalous pattern. Both the intensification and southward extension of WDs are responsible for higher LFD over India in the warm phase, indicating an indirect interaction between ENSO and LFD by modulating the mid-latitude westerlies.
The LIS/OTD data and vertical profiles of hydrometeors and latent heat are obtained from the website https://doi.org/10.5067/LIS/LIS-OTD/DATA309 (Cecil, 2006) and https://disc.gsfc.nasa.gov/datasets/ (last access: 23 August 2021) (TRMM, 2011) respectively. The GPH, wind and SH data are available at https://psl.noaa.gov/data/gridded/data.ncep.reanalysis.html (last access: 23 August 2021) (National Centers for Environmental Prediction/National Weather Service/NOAA/US Department of Commerce, 1994). The HadISST data used in this work are accessible from https://psl.noaa.gov/gcos_wgsp/ (last access: 23 August 2021) (NOAA Physical Sciences Laboratory, 2021).
The paper and its methodology were conceptualized and developed by SA, AVS, and PV. AVS performed the analyses, and PV curated the data. The original draft preparation was by AVS; further reviewing and editing was by PV and SA. AVS handled the visualization.
The authors declare that they have no conflict of interest.
Publisher's note: Copernicus Publications remains neutral with regard to jurisdictional claims in published maps and institutional affiliations.
We are grateful to NASA and the Propulsion Systems Laboratory (PSL) for providing the LIS/ODT, TRMM and NCEP reanalysis data products, respectively, which have been used in this study. Support from the Department of Atmospheric Sciences, Cochin University of Science and Technology, is acknowledged.
This research has been supported by the Kerala State Council for Science, Technology and Environment (grant no. KSCSTE/343/2019-FSHP-Earth).
This paper was edited by Vassiliki Kotroni and reviewed by two anonymous referees.
Abhilash, S., Mohankumar, K., and Das, S.: Simulation of microphysical structure associated with tropical cloud clusters using mesoscale model and comparison with TRMM observations, Int. J. Remote Sens., 29, 2411–2432, 2008. a
Ahmad, A. and Ghosh, M.: Variability of lightning activity over India on ENSO time scales, Adv. Space Res., 60, 2379–2388, 2017. a
Blakeslee, R. J., Mach, D. M., Bateman, M. G., and Bailey, J. C.: Seasonal variations in the lightning diurnal cycle and implications for the global electric circuit, Atmos. Res., 135, 228–243, 2014. a
Cecil, D. J.: LIS/OTD 2.5 Degree Low Resolution Monthly Climatology Time Series (LRMTS), NASA Global Hydrology Resource Center DAAC [data set], Huntsville, Alabama, USA, https://doi.org/10.5067/LIS/LIS-OTD/DATA309, 2006. a
Cecil, D. J., Buechler, D. E., and Blakeslee, R. J.: Gridded lightning climatology from TRMM-LIS and OTD: Dataset description, Atmos. Res., 135, 404–414, 2014. a, b, c, d, e
Cess, R. D., Zhang, M., Wielicki, B. A., Young, D. F., Zhou, X.-L., and Nikitenko, Y.: The influence of the 1998 El Niño upon cloud-radiative forcing over the Pacific warm pool, J. Climate, 14, 2129–2137, 2001. a
Christian, H. J., Blakeslee, R. J., Boccippio, D. J., Boeck, W. L., Buechler, D. E., Driscoll, K. T., Goodman, S. J., Hall, J. M., Koshak, W. J., Mach, D. M., and Stewart, M. F.: Global frequency and distribution of lightning as observed from space by the Optical Transient Detector, J. Geophys. Res.-Atmos., 108, ACL–4, 2003. a
Chronis, T., Goodman, S., Cecil, D., Buechler, D., Robertson, F., Pittman, J., and Blakeslee, R.: Global lightning activity from the ENSO perspective, Geophys. Res. Lett., 35, L19804, https://doi.org/10.1029/2008GL034321, 2008. a
Cooray, V., Rakov, V., and Theethayi, N.: The lightning striking distance – Revisited, J. Electrostat., 65, 296–306, 2007. a
Dimri, A., Yasunari, T., Kotlia, B., Mohanty, U., and Sikka, D.: Indian winter monsoon: Present and past, Earth-Sci. Rev., 163, 297–322, 2016. a
Goodman, S., Buechler, D., Knupp, K., Driscoll, K., and McCaul Jr., E.: The 1997–98 El Nino event and related wintertime lightning variations in the southeastern United States, Geophys. Res. Lett., 27, 541–544, 2000. a
Goodman, S., Buechler, D., and McCaul, E.: Lightning, in: Our Changing Planet: The View From Space, Cambridge University Press, Cambridge, 44–52, 2007. a
Goswami, B. B., Mukhopadhyay, P., Mahanta, R., and Goswami, B.: Multiscale interaction with topography and extreme rainfall events in the northeast Indian region, J. Geophys. Res.-Atmos., 115, 1–12, https://doi.org/0.1029/2009JD012275, 2010. a
Hamid, E. Y., Kawasaki, Z.-I., and Mardiana, R.: Impact of the 1997–98 El Niño event on lightning activity over Indonesia, Geophys. Res. Lett., 28, 147–150, 2001. a
Hogan, R. J., Mittermaier, M. P., and Illingworth, A. J.: The retrieval of ice water content from radar reflectivity factor and temperature and its use in evaluating a mesoscale model, J. Appl. Meteorol. Clim., 45, 301–317, 2006. a
Houze Jr., R. A., Wilton, D. C., and Smull, B. F.: Monsoon convection in the Himalayan region as seen by the TRMM Precipitation Radar, Q. J. Roy. Meteor. Soc., 133, 1389–1411, 2007. a
Hsu, C.-P. F. and Wallace, J. M.: The global distribution of the annual and semiannual cycles in precipitation, Mon. Weather Rev., 104, 1093–1101, 1976. a
Hunt, K. M., Turner, A. G., and Shaffrey, L. C.: The evolution, seasonality and impacts of western disturbances, Q. J. Roy. Meteor. Soc., 144, 278–290, 2018. a
Kamra, A. and Athira, U.: Evolution of the impacts of the 2009–10 El Niño and the 2010–11 La Niña on flash rate in wet and dry environments in the Himalayan range, Atmos. Res., 182, 189–199, 2016. a, b
Kandalgaonkar, S., Kulkarni, J., Tinmaker, M., and Kulkarni, M.: Land-ocean contrasts in lightning activity over the Indian region, Int. J. Climatol., 30, 137–145, 2010. a
Kent, G., Williams, E., Wang, P., McCormick, M., and Skeens, K.: Surface temperature related variations in tropical cirrus cloud as measured by SAGE II, J. Climate, 8, 2577–2594, 1995. a
Kilinc, M. and Beringer, J.: The spatial and temporal distribution of lightning strikes and their relationship with vegetation type, elevation, and fire scars in the Northern Territory, J. Climate, 20, 1161–1173, 2007. a
Kulkarni, M. and Siingh, D.: The relation between lightning and cosmic rays during ENSO with and without IOD – a statistical study, Atmos. Res., 143, 129–141, 2014. a
Kumar, P. R. and Kamra, A.: Variability of lightning activity in South/Southeast Asia during 1997–98 and 2002–03 El Nino/La Nina events, Atmos. Res., 118, 84–102, 2012. a, b
Kumar, S., Hazra, A., and Goswami, B.: Role of interaction between dynamics, thermodynamics and cloud microphysics on summer monsoon precipitating clouds over the Myanmar Coast and the Western Ghats, Clim. Dynam., 43, 911–924, 2014. a, b
Lau, K.-M., Ramanathan, V., Wu, G.-X., Li, Z., Tsay, S., Hsu, C., Sikka, R., Holben, B., Lu, D., Tartari, G., Chin, M., Koudelova, P., Chen, H., Ma, Y., Huang, J., Taniguchi, K., and Zhang, R.: The Joint Aerosol–Monsoon Experiment: A new challenge for monsoon climate research, B. Am. Meteorol. Soc., 89, 369–384, 2008. a
Mills, B., Unrau, D., Pentelow, L., and Spring, K.: Assessment of lightning-related damage and disruption in Canada, Nat. Hazards, 52, 481–499, 2010. a
Murugavel, P., Pawar, S., and Gopalakrishan, V.: Climatology of lightning over Indian region and its relationship with convective available potential energy, Int. J. Climatol., 34, 3179–3187, 2014. a, b
National Centers for Environmental Prediction/National Weather Service/NOAA/US Department of Commerce: NCEP/NCAR Global Reanalysis Products, 1948–continuing, updated monthly, Research Data Archive at NOAA/PSL [data set], available at: https://psl.noaa.gov/data/gridded/data.ncep.reanalysis.html (last access: 23 August 2021), 1994. a
NOAA Physical Sciences Laboratory (PSL): Nino 3.4 SST index, available at: https://psl.noaa.gov/gcos_wgsp/, last access: 23 August 2021. a
Patade, S., Prabha, T., Axisa, D., Gayatri, K., and Heymsfield, A.: Particle size distribution properties in mixed-phase monsoon clouds from in situ measurements during CAIPEEX, J. Geophys. Res.-Atmos., 120, 10418–10440, https://doi.org/10.1002/2015JD023375, 2015. a
Petersen, W. A., Rutledge, S. A., and Orville, R. E.: Cloud-to-ground lightning observations from TOGA COARE: Selected results and lightning location algorithms, Mon. Weather Rev., 124, 602–620, 1996. a
Rao, Y., Srinivasan, V., Raman, S., and Ramakrishnan, A.: Forecasting manual, Part-II, Discussion of typical synoptic weather situation, winter-western disturbances and their associated features. FMU Report No. III-1.1, India Meteorological Department, Delhi, India, 1969. a
Rasmussen, K. L. and Houze Jr., R. A.: Orogenic convection in subtropical South America as seen by the TRMM satellite, Mon. Weather Rev., 139, 2399–2420, 2011. a
Romatschke, U., Medina, S., and Houze Jr., R. A.: Regional, seasonal, and diurnal variations of extreme convection in the South Asian region, J. Climate, 23, 419–439, 2010. a
Rosenfeld, D.: TRMM observed first direct evidence of smoke from forest fires inhibiting rainfall, Geophys. Res. Lett., 26, 3105–3108, 1999. a
Sátori, G., Williams, E., and Lemperger, I.: Variability of global lightning activity on the ENSO time scale, Atmos. Res., 91, 500–507, 2009. a
Schiemann, R., Lüthi, D., and Schär, C.: Seasonality and interannual variability of the westerly jet in the Tibetan Plateau region, J. Climate, 22, 2940–2957, 2009. a
Selvi, S. and Rajapandian, S.: Analysis of lightning hazards in India, Int. J. Disast. Risk. Re., 19, 22–24, 2016. a
Singh, O. and Singh, J.: Lightning fatalities over India: 1979–2011, Meteorol. Appl., 22, 770–778, 2015. a
Syed, F., Giorgi, F., Pal, J., and King, M.: Effect of remote forcings on the winter precipitation of central southwest Asia part 1: observations, Theor. Appl. Climatol., 86, 147–160, 2006. a
Takahashi, T., Tajiri, T., and Sonoi, Y.: Charges on graupel and snow crystals and the electrical structure of winter thunderstorms, J. Atmos. Sci., 56, 1561–1578, 1999. a
Tinmaker, M., Aslam, M., and Chate, D.: Lightning activity and its association with rainfall and convective available potential energy over Maharashtra, India, Nat. Hazards, 77, 293–304, 2015. a
TRMM – Tropical Rainfall Measuring Mission: TRMM Microwave Imager Precipitation Profile L3 1 month 0.5 degree × 0.5 degree V7, GES DISC – Goddard Earth Sciences Data and Information Services Center [data set], Greenbelt, MD, https://disc.gsfc.nasa.gov/datasets/, last access: 23 August 2021. a
Venevsky, S.: Importance of aerosols for annual lightning production at global scale, Atmos. Chem. Phys. Discuss., 14, 4303–4325, https://doi.org/10.5194/acpd-14-4303-2014, 2014. a
Williams, E., Rosenfeld, D., Madden, N., Gerlach, J., Gears, N., Atkinson, L., Dunnemann, N., Frostrom, G., Antonio, M., Biazon, B., Camargo, R., Franca, H., Gomes, A., Lima, M., Machado, R., Manhaes, S., Nachtigall, L., Piva, H., Quintiliano, W., Machado, L., Artaxo, P., Roberts, G., Renno, N., Blakeslee, R., Bailey, J., Boccippio, D., Betts, A., Wolff, D., Roy, B., Halverson, J., Rickenbach, T., Fuentes, J., and Avelino, E.: Contrasting convective regimes over the Amazon: Implications for cloud electrification, J. Geophys. Res.-Atmos., 107, LBA–50, 2002. a
Williams, E. R.: The Schumann resonance: A global tropical thermometer, Science, 256, 1184–1187, 1992. a, b
Williams, E. R.: The electrification of severe storms, in: Severe Convective Storms, Springer, Boston, 527–561, 2001. a
Williams, E. R., Geotis, S., Renno, N., Rutledge, S., Rasmussen, E., and Rickenbach, T.: A radar and electrical study of tropical “hot towers”, J. Atmos. Sci., 49, 1386–1395, 1992. a
Yadava, P. K., Soni, M., Verma, S., Kumar, H., Sharma, A., and Payra, S.: The major lightning regions and associated casualties over India, Nat. Hazards, 101, 217–229, 2020. a
Yang, S., Lau, K., and Kim, K.: Variations of the East Asian jet stream and Asian–Pacific–American winter climate anomalies, J. Climate, 15, 306–325, 2002. a
Zipser, E. J.: Deep cumulonimbus cloud systems in the tropics with and without lightning, Mon. Weather Rev., 122, 1837–1851, 1994. a
Zipser, E. J., Cecil, D. J., Liu, C., Nesbitt, S. W., and Yorty, D. P.: Where are the most intense thunderstorms on Earth?, B. Am. Meteorol. Soc., 87, 1057–1072, 2006. a
Zubair, L. and Ropelewski, C. F.: The strengthening relationship between ENSO and northeast monsoon rainfall over Sri Lanka and southern India, J. Climate, 19, 1567–1575, 2006. a