the Creative Commons Attribution 4.0 License.
the Creative Commons Attribution 4.0 License.
 | 06 Aug 2021
Vulnerability and site effects in earthquake disasters in Armenia (Colombia) – Part 2 : Observed damage and vulnerability
Francisco J. Chávez-García
Hugo Monsalve-Jaramillo
Joaquín Vila-Ortega
Damage in Armenia, Colombia, for the 25 January 1999 (Mw=6.2, peak ground acceleration (PGA) 580 Gal) event was disproportionate. We analyze the damage report as a function of number of stories and construction age of buildings. We recovered two vulnerability evaluations made in Armenia in 1993 and in 2004. We compare the results of the 1993 evaluation with damage observed in 1999 and show that the vulnerability evaluation made in 1993 could have predicted the relative frequency of damage observed in 1999. Our results show that vulnerability of the building stock was the major factor behind damage observed in 1999. Moreover, it showed no significant reduction between 1999 and 2004.
- Article
(1039 KB) - Full-text XML
- BibTeX
- EndNote


Destructive earthquakes occur relatively frequently in Colombia (the first reported event dates from 1551; Espinosa, 2003). However, the development of earthquake engineering began only relatively recently, punctuated by several major, significant events. The first building code in the country was published in 1984 (CCCSR-84, 1984), partly as a result of the heavy toll caused by the Popayán earthquake in March 1983 (Ingeominas, 1986). Increasing building requirements have improved earthquake resistance, for example phasing out non-engineered construction. The development of earthquake engineering has led to a decrease in the vulnerability of buildings in Colombia, but progress has been slow, in pace with the development of building codes. In addition, as favored construction styles evolve, additional challenges appear. For example, the cost of land pushes current housing projects consisting of tall concrete structures for which there is little experience regarding their seismic behavior in that country. Instrumenting some of those buildings to analyze their motion during small earthquakes would provide useful data and may eventually become a necessity (e.g., Meli et al., 1998). Meanwhile, it is important to learn as much as possible from past destructive events.
Damage evaluation after large earthquakes is recognized as a primary input to understanding structural responses subject to dynamic excitations. It offers valuable data on the behavior of structures in response to actual seismic motion. In addition to very significant efforts like GEER (Geotechnical Extreme Events Reconnaissance, 2020), local initiatives have contributed significantly to understanding damage occurrence, especially in relation to site effects (e.g., Chávez-García et al., 1990; Midorikawa, 2002; Sbarra et al., 2012; Montalva et al., 2016; Panzera et al., 2018; Fernández et al., 2019).
One seismic event that has had a long-lasting impact in Colombia is the 25 January 1999 earthquake in the Quindío department, close (18 km) to the city of Armenia. This moderate (Mw=6.2) normal-fault earthquake had profound economic and social consequences in the country. There was only one accelerograph in Armenia, and it recorded peak ground acceleration (PGA) of Gal in the EW/NS/Z components. Strong ground motion duration was very short (smaller than 5 s), and ground motion energy peaked at periods shorter than 0.5 s. The source of the main shock and aftershocks was studied in Monsalve-Jaramillo and Vargas-Jiménez (2002), while macroseismic observations were presented in Cardona (1999). The city of Armenia sustained heavy damage (maximum intensity was IX on the EMS-96 scale): 2000 casualties and 10 000 injuries due to the collapse of 15 000 houses, with a further 20 000 houses severely damaged (SIQ, 2002). Site effect evaluation during this event in Armenia was addressed by Chávez-García et al. (2018). Earthquake and ambient noise data were analyzed with the objective of characterizing local amplification due to soft surficial layers using a variety of techniques. The results showed that, while local amplification contributed significantly to destructive ground motion, observed damage distribution in 1999 was incompatible with the rather small variations in dominant frequency and maximum amplification throughout the city.
Chávez-García et al. (2018) referred to the damage distribution observed for the 1999 earthquake, but no data were analyzed. In this paper, we present an analysis of damage observed during the 1999 earthquake. Earthquake damage data are analyzed in relation to geology and to the site classes defined in the microzonation map of Armenia (AIS, 1999). In addition, the city of Armenia offers a very uncommon advantage in Latin America. Two vulnerability studies have been conducted in the city, one in 1993 and one in 2004. We compare the 1999 damage distribution to vulnerability estimated in 1993 for the small downtown district of the city where the two data sets overlap. The comparison of the two vulnerability studies, in 1993 and in 2004, allows an assessment of the changes in vulnerability in the city as a consequence of a destructive earthquake, even though the method used was different and the studied zones overlap only partially. We show that building vulnerability was the main factor behind the heavy damage toll in Armenia during the 1999 earthquake. Our results substantiate the improvement of engineering practice with time and provide evidence of the efficacy of simple methods to evaluate vulnerability. However, they also strike an alarm bell as they show that vulnerability in Armenia remains high. Our results offer an unusually complete analysis of the major factors behind seismic risk in a typical medium-size city in Colombia. Seismic risk mitigation in Armenia, as well as in similar midsize cities in Latin America, requires an increase in the number of permanent seismic stations and support of additional efforts to improve our understanding of moderate-size seismic events.
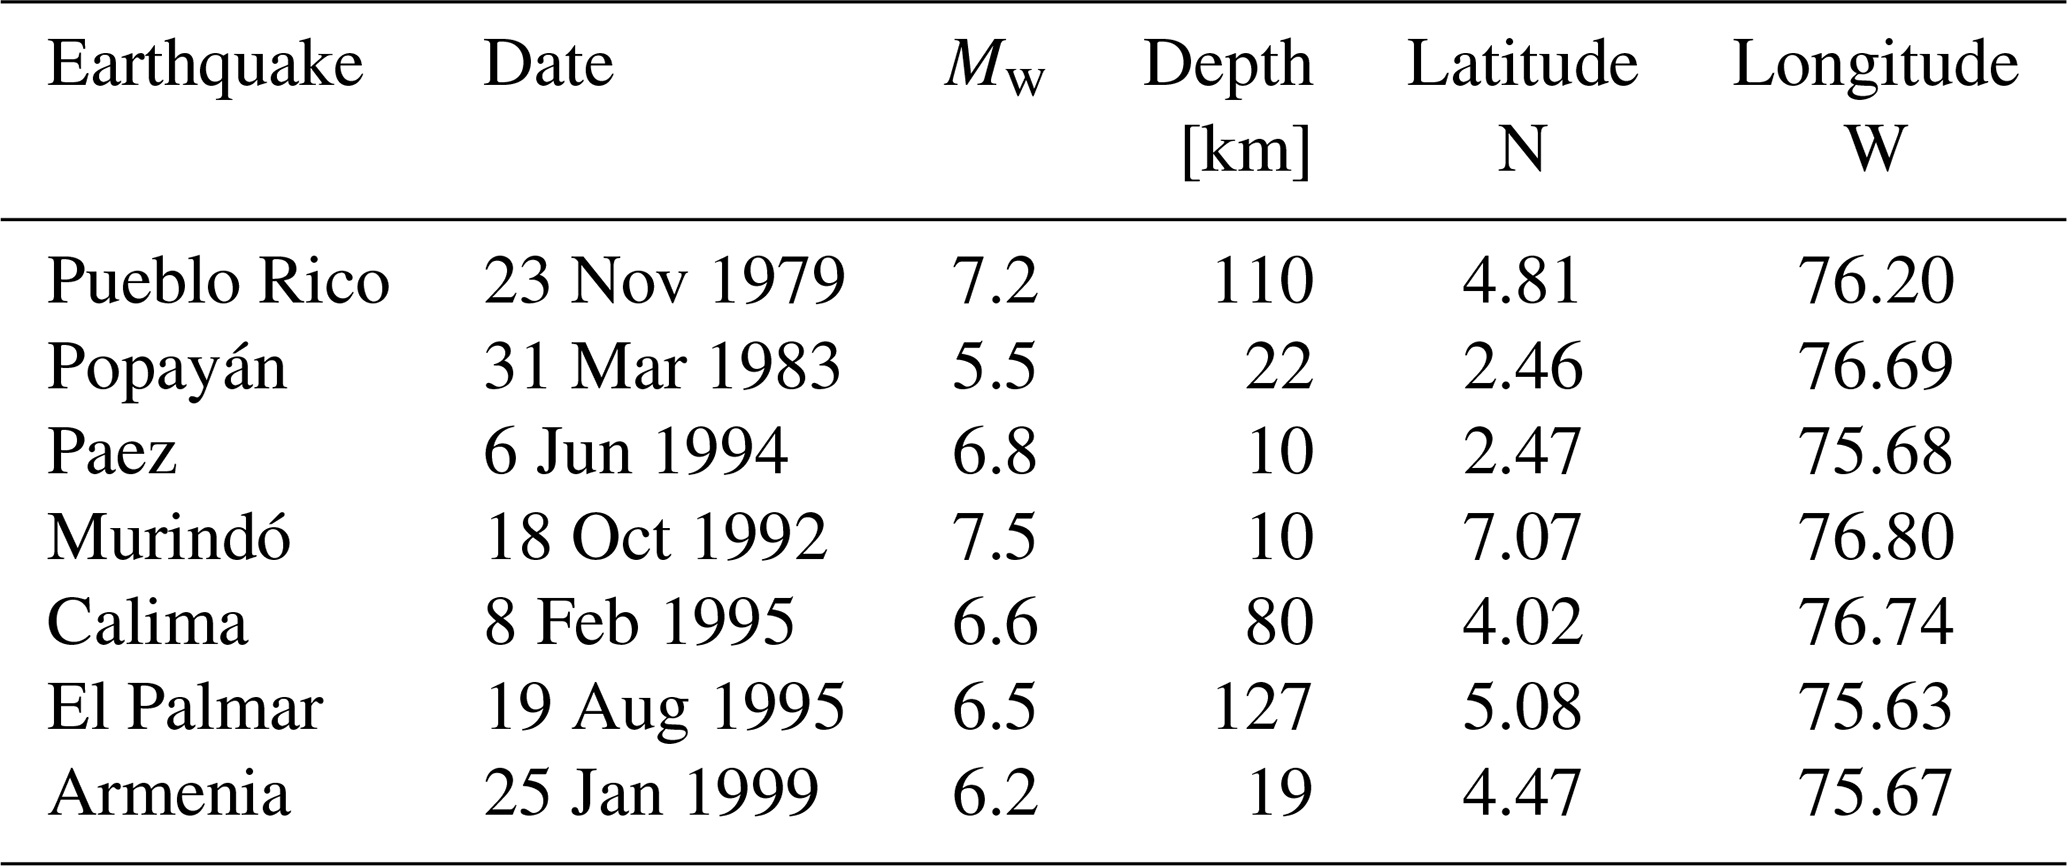
This paper will not include a discussion of the geological setting of Armenia, as this can be found in Chávez-García et al. (2018). The coffee-growing region was occupied during the second half of the 19th century. For this reason, data on historical earthquakes are scarce, even though it is located in a zone of high seismic hazard (the current Colombian building code prescribes a PGA of 0.25 g for Armenia for a return period of 475 years). During the second half of the 20th century, seven earthquakes occurred in the region producing intensities as large as IX (Table 1; Espinosa, 2011).
Table 1Data of the seven damaging earthquakes that have occurred in the Colombian coffee-growing region during the second half of the 20th century.
Before 1960, construction in this region consisted mainly of bahareque and unreinforced masonry. In Colombia, bahareque refers to structures that use Guadua (a local variety of bamboo) for the skeleton elements. Walls are made using a Guadua-based mat, covered with mud mixed with dung as a bonding agent. In about 1960, reinforced concrete frames began to be used, but Colombia lacked a building code until 1984, although conscientious engineers followed guidelines from international codes, mostly American. Between 1977 and 1984 design practice for those structures shifted from the elastic method to ultimate strength design. Unfortunately, this allowed construction companies to decrease the quantity of steel reinforcement. Until 1984, no seismic provisions were considered.
A major milestone was the Popayán earthquake of 31 March 1983 (ML 5.5). This small, shallow event caused major destruction in Popayán, where important Spanish heritage sites were severely damaged. Although restricted in extension, the heavy damage gave the final push for the adoption of a national building code including seismic provisions in 1984. This code had been promoted since the end of the 1970s by the Asociación Colombiana de Ingeniería Sísmica (Colombian Association for Earthquake Engineering), founded in 1975. A major consequence of the 1984 code was to eliminate new construction using unreinforced masonry. This code was replaced by a new version in 1998. The effects of two events in 1995 (8 February, Mw=6.6; 19 August, Mw=6.5) convinced engineers that lateral drift requirements in the 1984 code were too lenient, and stricter requirements were incorporated.
Only a few months passed between publication of the 1998 building code and the occurrence of the 1999 Armenia earthquake. Some of the shortcomings identified during this event were addressed in improvements to the code published in 2010: requirements for irregular buildings with weak stories, short columns, p–Δ effects, and torsion-related problems among others. Microzonation of cities with more than 100 000 people became mandatory. However, those studies are the responsibility of local authorities and are not necessarily considered a priority. In Armenia, 9 years after becoming compulsory, an update of the microzonation study carried out in the wake of the 1999 earthquake is still missing. Currently, discussions for a new version of the building code center on imposing requirements on the quality control of the materials used and ensuring the correspondence between drawings and the real structure.
In the aftermath of the 1999 event, the Sociedad de Ingenieros del Quindío (Quindian Society of Engineers) organized teams that made a detailed evaluation of damaged structures in Armenia (SIQ, 2002). The status of a building was determined by the attributes of damage level, damage type, and usage status (Tang et al., 2020). The priority was to distinguish between those buildings that did not pose a risk to occupants and those that must be evacuated. The template used to qualify buildings allowed SIQ (2002) to grade the damage sustained by buildings and included information on year of construction, structural system, and number of stories. SIQ (2002) classified observed damage using a color scale:
-
Grey. There is very light or no damage at all.
-
Green. The building can still be used. Although some damage is apparent in non-structural elements, it poses no risk to occupants.
-
Yellow. There is significant damage, to the point that partial occupancy restriction is required. The structure is not evaluated as unsafe, but access to parts of it must be restricted.
-
Orange. The structure is unusable. Damage to the structure implies a high risk, and the building cannot be occupied.
-
Red. There is total collapse or danger of collapse due to severe damage to the structure or its foundation.
This scale is quite standard and very similar to that proposed by the European Seismological Commission (Xin et al., 2020). For our purpose, we have simplified this scale. We use light damage to refer to structures classified in grey or green. Moderate damage in this paper is used for buildings classified as yellow. Finally, severe damage corresponds to structures classified as orange or red. The SIQ (2002) report presents an inventory of 43 023 structures classified as a function of damage sustained. From this total, data for 1946 sites could not be used due to incomplete information that made it impossible to locate them on a map. This number suggests a lower limit for the uncertainties in our database, inevitable in any post-earthquake damage survey and which we have no means to evaluate. However, the number of samples is large enough to justify our confidence in average values. Our final database for Armenia includes 41 077 buildings. Data are available only for damaged structures, and it is not possible to normalize the results relative to the number of existing buildings in the city.
Five categories were used to classify the buildings structuring type, following CCCSR-84 (1984). In order of decreasing seismic performance, the first four categories are frame structures, confined masonry, unreinforced masonry, and bahareque structures (wooden structures are included here). The fifth category, as written in the template used by SIQ (2002), is “none of the preceding”, named “other” in the following. This last category was used to refer to buildings using hybrid structuring systems, a mix of different materials, and unstructured houses mixing wood with other elements. Such precarious houses are non-engineered structures and are common in illegal settlements.

Figure 1Upper left panel: the small rectangle shows the location of Armenia in Colombia, South America. The main figure shows the geological map of the city from a map at the scale 1:15 000. The small circles indicate the location of 6467 structures that were severely damaged during the 25 January 1999 earthquake. The thick solid line crossing the city from north to south shows the trace of the Armenia Fault (modified from Ingeominas, 1999).
Figure 1 shows the distribution of the 6467 structures classified as severely damaged in Armenia. The background of the figure shows the geological formations that can be found in the city (AIS, 1999), from a map at the scale of 1:15 000. No correlation is observed between geology and severe damage distribution. The same observation can be made for moderate and light damage. Site geology seems irrelevant to explaining damage distribution for this event, which shows no clear pattern. It may be argued that the geological classification cannot reflect site effects caused by mostly thin layers. That site effects in Armenia are related to thin layers is suggested by the values of dominant frequencies in the city, shown to be between 2 and 3 Hz by Chávez-García et al. (2018). Figure 2 shows the depth to the base of ash deposits in Armenia (Ingeominas, 1999), determined from the inversion of 36 vertical electrical soundings. Dominant frequencies computed for the thicknesses shown in Fig. 2 using the average shear-wave velocities for the topmost sedimentary layers (Chávez-García et al., 2018) are between 2 and 3 Hz, similarly to those observed. Shallow soils in Armenia were mapped in the microzonation study of the city, carried out in the wake of the 1999 earthquake (AIS, 1999). For example, Table 2 shows the shear-wave velocity soil profile at two representative sites in Armenia, indicated by stars in Fig. 2. From these profiles, we may compute the fundamental soil frequencies. We obtain 2.5 Hz for site UNI and 2.8 Hz for site EST, in very good agreement with Chávez-García et al. (2018). The final microzonation map proposed by AIS (1999) defined four different soil types: ash deposits (zone A); thin sedimentary fill deposits (zone B); alluvial terraces, residual soils, and ancient volcanic flows (zone C); and soils that have undergone shearing as they are located close to the Armenia Fault that cuts through the city (zone D). The seismic coefficients proposed by AIS (1999) decrease from zones A to C, implying similarly decreasing site amplification. Zone D was declared inapt for construction. Figure 3 shows histograms of damage distribution for the city as a function of structuring type, damage level, and soil class. Bahareque structures suffered the largest proportion of severe damage, followed by structures in the category other and unreinforced masonry. Figure 3 shows clearly that damage distribution is independent of soil type as classified by the seismic microzonation study. This result supports the conclusions of Chávez-García et al. (2018). They observed that, while local amplification is far from being negligible, it does not vary greatly within Armenia and is not helpful in explaining damage distribution. Site effects may have enhanced building damage throughout the city, but the resulting damage is distributed homogeneously throughout the city, as is shown in Fig. 1.

Figure 2Contours of the depth of the interface (in m) at the base of the ash deposits that cover the city of Armenia. The solid squares show the location of the 36 electrical vertical soundings where the depth of that interface was measured. The thick solid line crossing the city from north to south indicates the trace of the Armenia Fault. The solid-line polygon inside the city shows the extent of the downtown district covered in the 1993 vulnerability study. The dashed-line outline shows the area covered by the vulnerability study carried out in 2004 (modified from Ingeominas, 1999).

Figure 3Histograms of observed damage in Armenia for the 25 January 1999 earthquake. Each diagram corresponds to the given structuring type and shows the relative incidence of light, moderate, and severe damage as a function of the four soil types defined in the microzonation map of AIS (1999) (A–D). The last diagram shows data for all structuring types together.
Table 2Shear-wave velocity (Vs) soil profile at two representative sites in Armenia. The sites are indicated by stars in Fig. 2.

Consider now the role of two additional variables in damage distribution: number of stories and building age. In order to compare these results with the vulnerability study made in 1993 in Armenia, we restrict this analysis to the small downtown district shown in Fig. 2, where the 1993 study was carried out. In this sector, the damage database includes 3697 records corresponding to 470 bahareque, 884 unreinforced masonry, 195 confined masonry, and 745 frame structures. We dropped the data for 1403 structures classified as other. Figure 4 shows damage distribution as a function of number of stories and structuring type. The diagram for all types of structures combined shows an apparent decrease in severe damage and increase in light damage with increasing number of stories. The diagrams for each structure type do not show such progression. The reason for that apparent trend is that buildings smaller than five stories are overrepresented (90 % of our sample) in the downtown district. Together, one-story-high and two-story-high buildings make up 95 % of the total of bahareque structures. The tallest unreinforced masonry structures were one 6-story and one 10-story building. With this caveat, it is clear that the number of stories was not a major factor in damage distribution during the 1999 earthquake in Armenia. This observation suggests that we may discard the double resonance effect (soft soil resonance coupled to building resonance) as a significant factor. Chávez-García et al. (2018) showed that the fundamental soil periods in Armenia are between 0.4 and 0.6 s (see their Fig. 13). If the double resonance effect were significant, we should observe a higher relevance of the number of stories in damage distribution, given the large range of dominant periods expected for the buildings in Armenia as a function of number of stories.
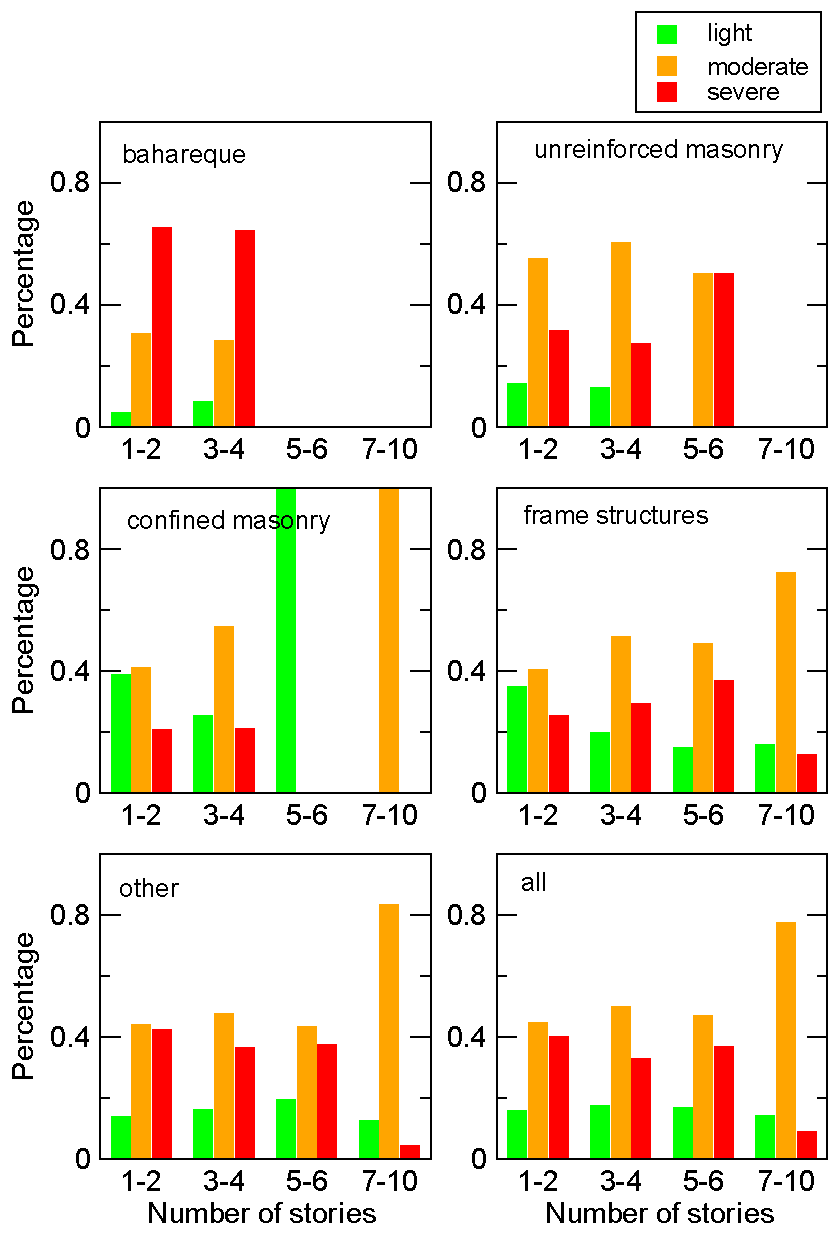
Figure 4Histograms of observed damage in Armenia for the 25 January 1999 earthquake. Each diagram corresponds to the given structuring type and shows the relative incidence of light, moderate, and severe damage for groups of buildings of a similar number of stories. The last diagram shows data for all structuring types together.
Figure 5 shows damage distribution as a function of structuring type and construction period, again for the small downtown district. Our division of time corresponds to the evolution of construction practice in Colombia, as discussed above. Severe damage in bahareque structures does not show a clear trend with time; it is larger than 60 % for all periods, except for the period 1985–1997. The period later than 1998 is not representative of bahareque structures as there is only one lightly damaged structure, zero moderately damaged structures, and two severely damaged structures. In contrast, severe damage for frame and unreinforced masonry structures shows a steady decrease with time (and the number of structures is significant). The relative number of structures suffering light damage increases with decreasing age of the structure, while the relative frequency of severe damage decreases significantly, showing the benefit of building code improvements. The number of confined masonry structures built before 1959 was very small (10 buildings in our sample), making the histograms for that period unreliable. For later periods, confined masonry shows an increase in the percentage of light damage and a stable or decreasing percentage for moderate and severe damage.
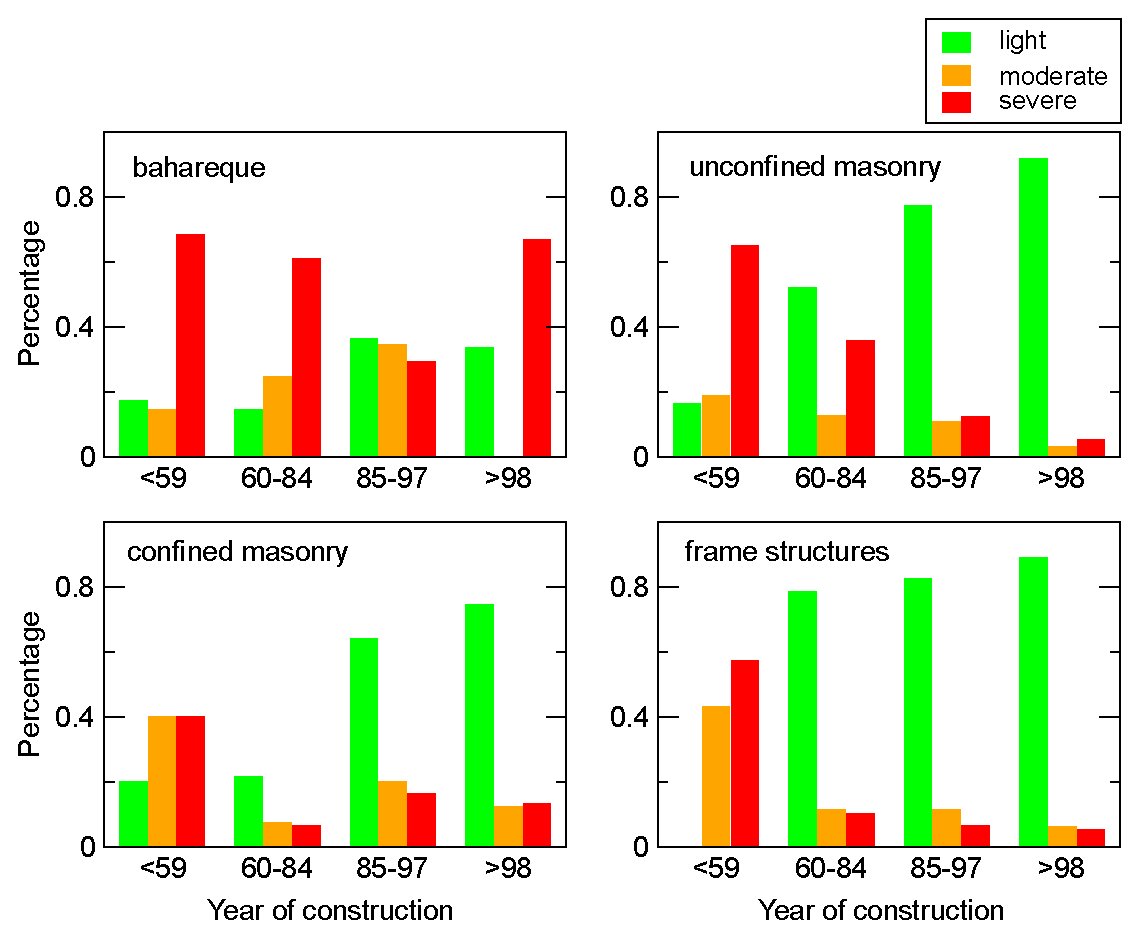
Figure 5Histograms of observed damage in Armenia for the 25 January 1999 earthquake. Each diagram corresponds to the given structuring type and shows the relative incidence of light, moderate, and severe damage as a function of the time period where the structure was built (before 1959, between 1960 and 1984, between 1985 and 1997, and later than 1998). The data shown correspond to the downtown district whose outline is shown in Fig. 2.
Earthquake damage is the result of strong ground motion and building vulnerability. Vulnerability of the building stock has always been a key factor in seismic risk evaluations (e.g., Dolce et al., 2006; Vicente et al., 2014; Fikri et al., 2019) or post-earthquake evaluations (e.g., Marotta et al., 2017). A review of current challenges has been presented in Silva et al. (2019). A major problem is the large number of buildings for which a vulnerability estimate is required in a city. When the number of structures is limited to a few hundred, simple methods are often used, which usually consist in simple evaluations of a limited number of parameters (e.g., Fikri et al., 2019). Larger building populations have to be dealt with using probabilistic methods (e.g., Noh et al., 2017) or extremely indirect techniques (Geiß et al., 2014).
In Latin America, vulnerability studies of the building stock are not often made outside capital cities. However, in the case of Armenia, we are fortunate to have two vulnerability studies available: one performed in 1993 (López et al., 1993), 6 years prior to the 1999 event, and one made in 2004 (Cano-Saldaña et al., 2005). Those two studies followed different procedures, and the area coverage overlaps only partially (Fig. 2). In this section, we will compare the results of the 1993 vulnerability study with damage distribution observed in 1999. Then, we will compare the two evaluation studies.
In 1993, different sectors of the city were sampled, but not all of the data were preserved. We analyze the results for the downtown sector presented in López et al. (1993), shown in Fig. 2. A census was made to count the number of structures of each type. In the downtown sector, 3364 buildings were counted and assigned to one of three categories: bahareque structures (908), unreinforced masonry structures (1877), and frame structures (579). It was not possible to evaluate, even in a simplified way, all those structures. For this reason, a small sample of 84 buildings was designed, assuming a normal distribution and choosing a 95 % confidence level of the extrapolation of the results to the total population. The 84 buildings were randomly selected in the field, and the vulnerability of each of them was evaluated using the procedure described in Tassios (1989), which is very similar to that described in Inel et al. (2008) or Alam et al. (2013). Each selected building was visited by a team of students of civil engineering, and a detailed template was completed with information on the structure. The compiled information consisted of structuring type, relation with neighboring structures (possible interaction problems), year of construction, maintenance, vertical and horizontal configuration, and roofing material. These factors were assigned numerical values and combined with arbitrary weights based on expert opinions to compute a vulnerability index (VI) for each building. The VI was made to vary between 0 and 100, where 0 corresponds to an absolutely safe structure and 100 to a totally vulnerable structure. Finally, the vulnerability indexes determined for the sample were extrapolated to the complete population in the downtown district.
Figure 6 compares the VI values determined in 1993 with damage observed during the 1999 earthquake inside the downtown district (solid-line polygon in Fig. 2). Percentages for VI values were extrapolated from the numbers determined for the 84-building sample. In this figure, we counted together moderate and severe damage, while the VI was classified into two groups: larger and smaller than 20. We observe a very good correlation between the VI estimated in 1993 and damage observed during the 1999 earthquake, 6 years later. Thus, the approximate procedure used to estimate the VI in 1993 was effective in predicting dynamic behavior during that earthquake.
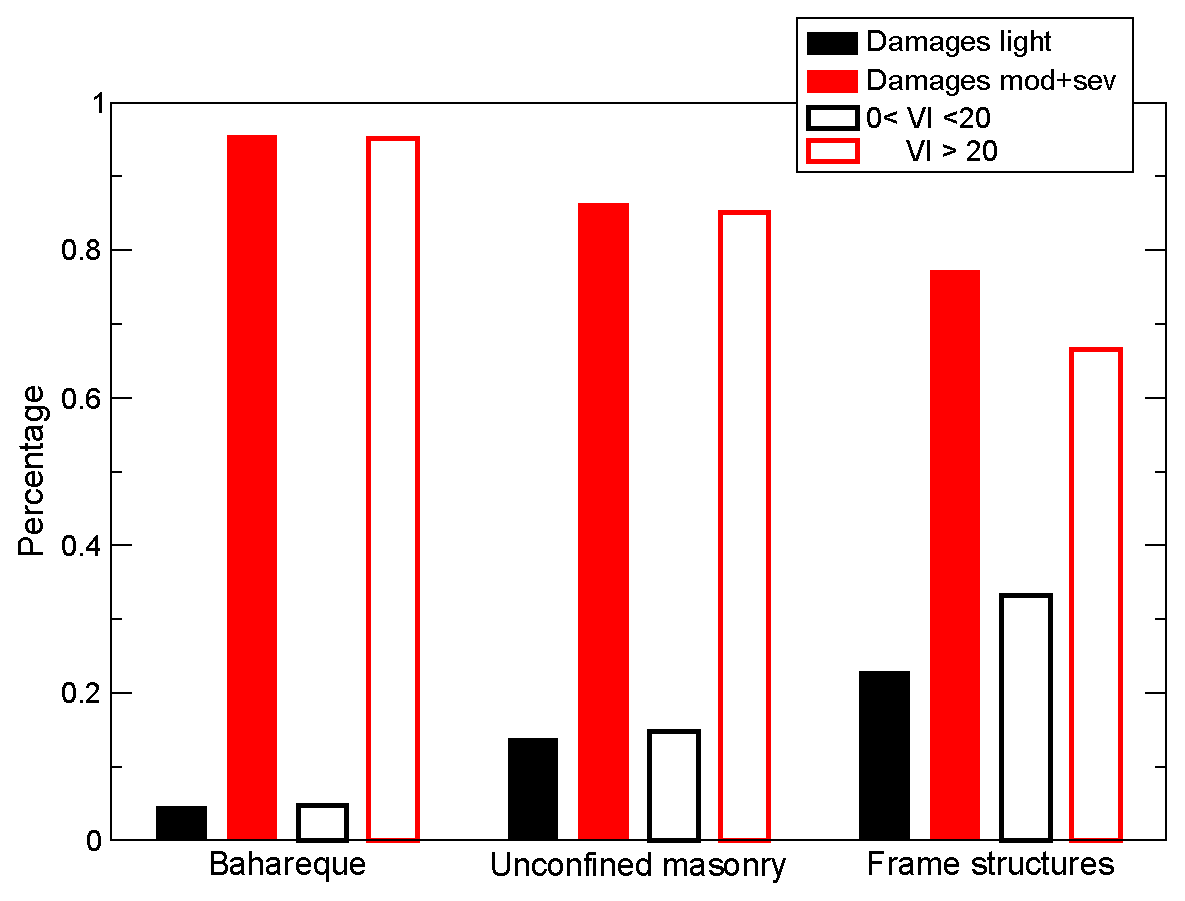
Figure 6Comparison between vulnerability values estimated in 1993 and damage observed in 1999. This comparison was only possible for the three structuring types shown. Moderate damage and severe damage were counted together. Vulnerability indexes (VIs) are separated into two groups, below and above a value of 20. Both damage and vulnerabilities correspond to the complete building population inside the polygon drawn with a solid line in Fig. 2.
In addition to comparing the extrapolated VI with damage for the downtown district, we may ask another question. How did each one of the 84 buildings whose VI was evaluated fare during the 1999 earthquake? This question has no simple answer due to different georeferencing systems for the two surveys (vulnerability and damage) and incomplete data. Only 28 out of the 84 could be confidently identified. The unidentified buildings could be absent from the damaged buildings database because they suffered no damage or because their recorded location was inaccurate. Figure 7 shows a box-and-whisker plot of the observed VI values against observed damage for the 28 buildings that could be identified in both databases. VI values are well correlated with observed damage. Figure 7 shows that severe damage may be associated with an average VI of 44 and moderate damage with an average VI of 32, while light damage corresponds to an average VI of 16.

Figure 7Box-and-whisker plot comparing the vulnerability index for 28 buildings evaluated in 1993 against their actual behavior observed during the 1999 earthquake. The cross inside each symbol indicates the location of average values.
Consider finally the vulnerability study made in 2004 (Cano-Saldaña et al., 2005). The procedure used was very different and followed that of Velásquez and Jaramillo (1993). Cano-Saldaña et al. (2005) computed expected losses for three different events considered to pose the largest seismic hazard to Armenia. A required input for them was an estimate of the vulnerability of the building stock, and this comprised the data we recuperated from that study. Cano-Saldaña et al. (2005) selected a sector of the downtown district that overlaps only partially with the district sampled in 1993. It is shown with a dashed line in Fig. 2. They tallied every building in that sector, a total of 2525 land plots. For each one of them, a template simpler than that of 1993 was completed including data on structuring type, number of stories, roofing type, and construction quality. The simplified nature of the template made it possible to complete it for the 2525 land plots, in contrast to the more detailed template used in 1993. We recuperated the 2004 building database and estimated vulnerability using the same procedure used in 1993, i.e., assigning numerical values to each factor and combining them with arbitrary weights based on expert opinions to compute a vulnerability index for each building in the sample. The weights used to estimate a vulnerability index had to be modified from those used in 1993 given that less information on each structure was available. The VI results for the 2004 study may thus have a constant bias. We could assign a vulnerability index to 1217 buildings out of the 2525 counted in 2004. The building categories that could be identified across the two studies were bahareque, unconfined masonry, and frame structures. VI values were grouped into three categories: low (VI between 0 and 20), medium (VI between 20 and 40), and high (VI larger than 40). The results in Fig. 8 show that the relative proportions are maintained between 1993 and 2004: most buildings in that sector still have high vulnerability in 2004 and less than 20 % have a low VI. Our results suggest that significant improvements in the relative vulnerability occurred in the 11-year period between 1993 and 2004. High vulnerabilities are still predominant in downtown Armenia, in spite of the destruction of weak buildings in the 1999 earthquake and the reinforcement carried out during the reconstruction of the city. It may be hoped that this result will prompt local authorities to take decisive actions to mitigate seismic risk in Armenia. A starting point could be to replicate the use of simplified procedures to estimate vulnerability to evaluate possible changes in the 17-year period since 2004.
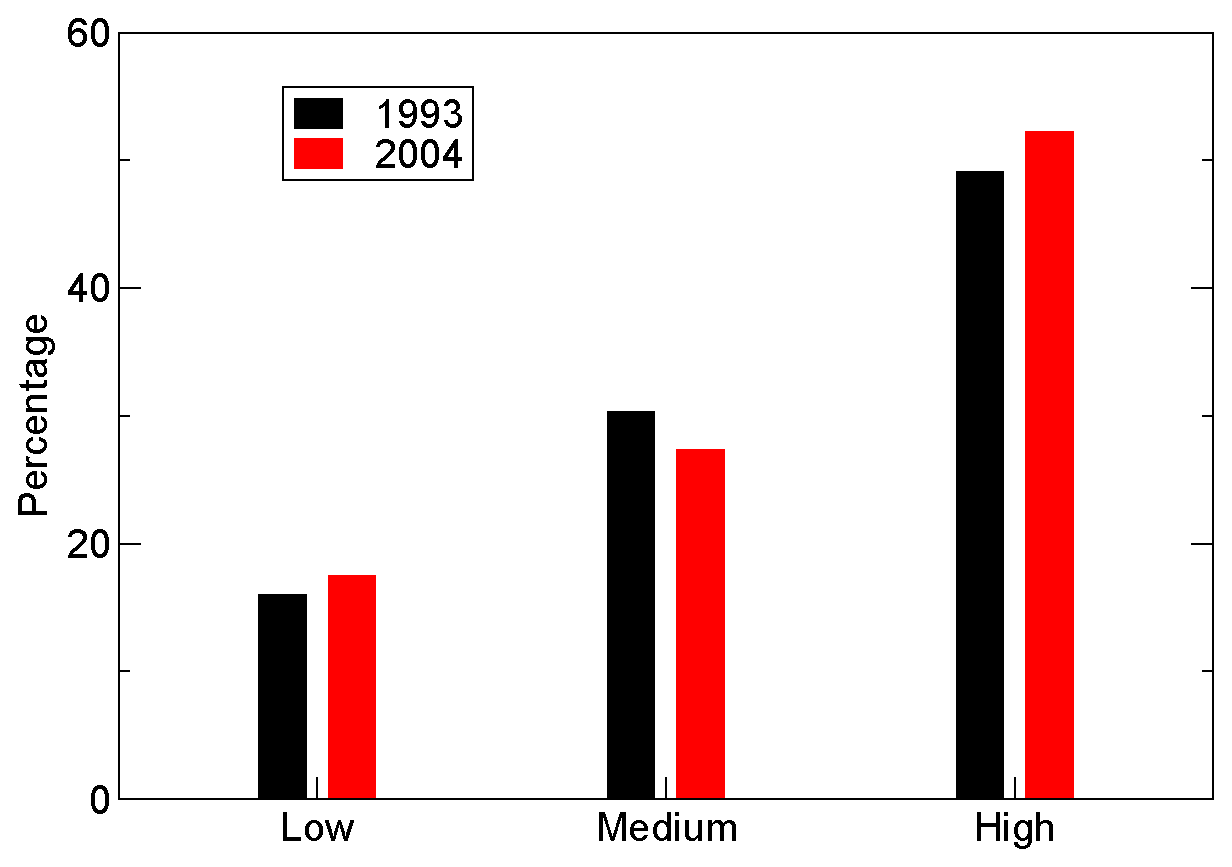
Figure 8Comparison between percentages of buildings classified as low, medium, and high vulnerability in the evaluation made in 1993 and that of 2004 in Armenia. The values for 2004 used ad hoc weights in an effort to obtain a vulnerability estimate compatible with the scale used in 1993. Values for 2004 may thus have a constant bias.
Colombia, in particular the coffee-growing region, has been historically affected by large earthquakes, with the 1999 event being the most recent destructive event. The consequences of that earthquake significantly changed society in Armenia and forced important improvements in engineering practice. The large economic consequences led the government to add a new tax to pay for reconstruction: a levy of 2 ‰ was imposed on every bank transaction in the country. Earthquake disasters occur rarely, and therefore seismic risk has seldom been a priority. In the Armenia region, the first two accelerographs were installed in 1994: on the campus of the Universidad del Quindío and in Calarcá (a neighboring town, 10 km to the SE of Armenia). To date, they continue to be the only accelerographs in operation. As mentioned above, the mandatory microzonation study of Armenia is still due.
We have presented an analysis of observed damage and vulnerability in Armenia during the 1999 earthquake. Our results are based on databases that had been unpublished reports. The severity of damage is uncorrelated either with geology or with the zones identified in the microzonation map. Damage distribution is uncorrelated with structure height, but we do observe a decrease in the severity of damage for younger structures. The data on observed damage were contrasted against two vulnerability evaluations, one in 1993 and one in 2004. In the 1993 study, 84 buildings were visited and their vulnerability was evaluated using a detailed template. The comparison of the results with observed damage in the city 6 years later strongly supports this method.
Our results indicate that building vulnerability was the main factor behind the large damage caused by the 1999 earthquake. The comparison between the vulnerability studies of 1993 and 2004 shows no significant improvements in the relative vulnerability in that 11-year period. Unfortunately, it is possible that the money allocated to house owners for repairs may not have been used for that purpose. Seismic risk mitigation in Armenia, as well as in similar midsize cities in Latin America, requires more decisive support to increase the number of permanent seismic stations. This is especially important given that current practice fosters tall concrete structures for which there is little experience regarding their seismic behavior. This paper strives to ring an alarm bell regarding the current risk in Armenia through a better understanding of a significant past destructive event.
The analyses reported in this paper did not use specific software. Our results may be reproduced using any general code with simple statistical analysis tools.
The data that were used in this paper were graciously provided by their respective owners. Geological and geophysical data of Armenia were provided by Ingeominas. Sociedad de Ingenieros del Quindío (SIQ) granted access to the raw damage data of the 1999 Armenia earthquake. The original vulnerability data were provided by the authors of the two studies we analyzed. The interested reader may contact those organization but must bear in mind that all those data are not in digital format.
HMJ recovered the original data. FJCG, HMJ, and JJVO analyzed the data. JJVO prepared the maps and processed the statistics of the data. FJCG wrote the first draft and prepared the figures. All three authors revised the manuscript and made final corrections.
The authors declare that they have no conflict of interest.
Publisher's note: Copernicus Publications remains neutral with regard to jurisdictional claims in published maps and institutional affiliations.
We thank the Sociedad de Ingenieros del Quindío and Servicio Geológico Colombiano (previously Ingeominas) for authorization to use the data included in the unpublished reports on damage distribution and microzonation projects carried out in Armenia after the 1999 earthquake. The comments of Francesco Panzera and the anonymous reviewer were helpful for improving the manuscript.
Part of this research was performed during a sabbatical visit of FJCG to the Facultad de Ingeniería, Universidad del Quindío. This visit was possible thanks to the support of the Dirección General de Asuntos del Personal Académico of UNAM through program PASPA. Additional support was received from project 934 supported by the Vicerrectoría de Investigaciones of Universidad del Quindío and from the rectory of the Universidad del Quindío.
This paper was edited by Oded Katz and reviewed by Francesco Panzera and one anonymous referee.
AIS – Asociación Colombiana de Ingeniería Sísmica: Estudio de microzonificación sísmica para orientar la reconstrucción de Armenia – Quindío, Quindío, Armenia, 1999.
Alam, M. S., Sajjad, M. R., Yasir, Z., and Haque, F. M. M.: A statistical study on structural characteristics of RC building stock of Dhaka City for seismic loss assessment application, Appl. Mech. Mater., 330, 884–888, 2013.
Cano-Saldaña, L., Monsalve-Jaramillo, H., Agudelo-Calvo, J. A., Upegui-Botero, F. M., and Jaramillo-Fernández J. D': Metodología para la evaluación del riesgo sísmico de pequeñas y medianas ciudades. Estudio de caso: zona centro de la ciudad de Armenia – Colombia, Revista Internacional de Desastres Naturales, Accidentes e Infraestructura Civil, 5, 3–20, 2005.
Cardona, O. D.: Terremoto de Armenia, Colombia, enero 25 de 1999, Revista de Ingenieria Sísmica, 60, 21–42, 1999.
CCCSR-84: Código colombiano de construcciones sismorresistentes 1984, Colombian Association of Earthquake Engineering (AIS), Ministry of Public Works and Transportation, and National Bureau for Disaster Attention and Prevention, Bogotá, 1984.
Chávez-García, F. J., Pedotti, G., Hatzfeld, D., and Bard, P. Y.: An experimental study of site effects near Thessaloniki (Northern Greece), Bull. Seismol. Soc. Am., 80, 784–806, 1990.
Chávez-García, F. J., Monsalve-Jaramillo, H., Gómez-Cano, M., and Vila-Ortega, J. J. : Vulnerability and site effects in earthquake disasters in Armenia (Colombia). I - Site effects, Geosciences, 8, 254, 2018.
Dolce, M., Kappos, A., Masi, A., Penelis, G., and Vona, M.: Vulnerability assessment and earthquake damage scenarios of the building stock of Potenza (Southern Italy) using Italian and Greek methodologies, Eng. Struct., 28, 357–371, 2006.
Espinosa, A.: Historia sísmica de Colombia 1550–1830, Academia Colombiana de Ciencias Exactas, Físicas y Naturales, Universidad del Quindío, Quindío, 2003.
Espinosa, A.: Enciclopedia de desastres naturales históricos de Colombia, Academia Colombiana de Ciencias Exactas, Físicas y Naturales, Universidad del Quindío, Quindío, 2011.
Fernández, J., Pastén, C., Ruiz, S., and Leyton, F.: Damage assessment of the 2015 Mw 8.3 Illapel earthquake in the North-Central Chile, Nat. Hazards, 96, 269–283, 2019.
Fikri, R., Dizhur, D., and Ingham, J.: Typological study and statistical assessment of parameters influencing earthquake vulnerability of commercial RCFMI buildings in New Zealand, B. Earthq. Eng., 17, 2011–2036, 2019.
Geiß, C., Taubenböck, H., Tyagunov, S., Tisch, A., Post, J., and Lakes, T.: Assessment of seismic building vulnerability from space, Earthq. Spectra, 30, 1553–1583, 2014.
Geotechnical Extreme Events Reconnaissance: http://www.geerassociation.org, last access: 29 October 2020.
Inel, M., Senel, S. M., Toprak, S., and Manav, Y.: Seismic risk assessment of buildings in urban areas: a case study for Denizli, Turkey, Nat. Hazards, 46, 265–285, 2008.
Ingeominas: El sismo de Popayán del 31 de marzo de 1983, Bogotá, 1986.
Ingeominas: Terremoto del Quindío (enero 25 de 1999), Bogotá, 1999.
López, C. A., Merchan, J. M., and Tejada, J. L.: Evaluación del escenario de pérdidas en caso de terremoto para la ciudad de Armenia, sector III centro, BE thesis, School of Engineering, Quindio University, Quindio, 1993.
Marotta, A., Sorrentino, L., Liberatore, D., and Ingham, J. M.: Vulnerability assessment of unreinforced masonry churches following the 2010–2011 Canterbury earthquake sequence, J. Earthq. Eng., 21, 912–934, 2017.
Meli, R., Faccioli, E., Muria-Vila, D., Quaas, R., and Paolucci, R.: A study of site effects and seismic response of an instrumented building in Mexico City, J. Earthq. Eng., 2, 89–111, 1998.
Midorikawa, S.: Importance of damage data from destructive earthquakes for seismic microzoning. Damage distribution during the 1923 Kanto, Japan, earthquake, Ann. Geophys., 45, 769–778, 2002.
Monsalve-Jaramillo, H. and Vargas-Jiménez, C. A.: El sismo de Armenia, Colombia (Mw=6.2) del 25 de enero de 1999. Un análisis telesísmico de ondas de cuerpo, observaciones de campo y aspectos sismotectónicos, Revista Geofísica IPGH, 57, 21–57, 2002.
Montalva, G. A., Chávez-Garcia, F. J., Tassara, A., and Jara Weisser, D. M.: Site Effects and Building Damage Characterization in Concepción after the Mw 8.8 Maule Earthquake, Earthq. Spectra, 32, 1469–1488, 2016.
Noh, H. Y., Kiremidjian, A., Ceferino, L., and So, E.: Bayesian updating of earthquake vulnerability functions with application to mortality rates, Earthq. Spectra, 33, 1173–1189, 2017.
Panzera, F., Lombardo, G., Imposa, S., Grassi, S., Gresta, S., Catalano, S., Romagnoli, G., Tortorici, G., Patti, F., and Di Maio, E.: Correlation between earthquake damage and seismic site effects: the study case of Lentini and Carlentini, Italy, Eng. Geol., 240, 149–162, 2018.
Sbarra, P., De Rubeis, V., Di Luzio, E., Mancini, M., Moscatelli, M., Stigliano, F., Tosi, P., and Vallone, R.: Macroseismic effects highlight site response in Rome and its geological signature, Nat. Hazards, 62, 425–443, 2012.
Silva, V., Akkar, S., Baker, J., Bazzurro, P., Castro, J. M., Crowley, H., Dolsek, M., Galasso, C., Lagomarsino, S., Monteiro, R., Perrone, D., Pitilakis, K., and Vamvatsikos, D.: Current challenges and future trends in analytical fragility and vulnerability modeling, Earthq. Spectra, 35, 1927–1952, 2019.
SIQ – Sociedad de Ingenieros del Quindío: Procesamiento y Análisis de los Formularios de Evaluación de Daños del Sismo del 25 de Enero de 1999 en Armenia (Quindío), Quindío, Armenia, 2002.
Tang, C., Liu, X., Cai, Y., Van Westen, C., Yang, Y., Tang, H., Yang, C., and Tang, C.: Monitoring of the reconstruction process in a high mountainous area affected by a major earthquake and subsequent hazards, Nat. Hazards Earth Syst. Sci., 20, 1163–1186, https://doi.org/10.5194/nhess-20-1163-2020, 2020.
Tassios, T.: Evaluation of the relative seismic risk of existing buildings by means of simplified vulnerability techniques, National Technical University of Athens, Athens, 1989.
Velásquez, E. and Jaramillo, J. D.: Estudio de la amenaza sísmica de Medellín, in Estudio de la amenaza, zonificación, análisis y vulnerabilidad sísmica para Medellín, Report from EAFIT University to Town Hall of Medellín, UNDP, Medellín, 1–48, 1993.
Vicente, R., Ferreira, T., and Maio, R.: Seismic risk at the urban scale: assessment, mapping and planning, Proc. Econ. Financ., 18, 71–80, 2014.
Xin, D., Daniell, J. E., and Wenzel, F.: Review article: Review of fragility analyses for major building types in China with new implications for intensity–PGA relation development, Nat. Hazards Earth Syst. Sci., 20, 643–672, https://doi.org/10.5194/nhess-20-643-2020, 2020.