the Creative Commons Attribution 4.0 License.
the Creative Commons Attribution 4.0 License.
 | 21 Jan 2021
A glimpse into the future of exposure and vulnerabilities in cities? Modelling of residential location choice of urban population with random forest
Sebastian Scheuer
Dagmar Haase
Annegret Haase
Manuel Wolff
Thilo Wellmann
The most common approach to assessing natural hazard risk is investigating the willingness to pay in the presence or absence of such risk. In this work, we propose a new, machine-learning-based, indirect approach to the problem, i.e. through residential-choice modelling. Especially in urban environments, exposure and vulnerability are highly dynamic risk components, both being shaped by a complex and continuous reorganization and redistribution of assets within the urban space, including the (re-)location of urban dwellers. By modelling residential-choice behaviour in the city of Leipzig, Germany, we seek to examine how exposure and vulnerabilities are shaped by the residential-location-choice process. The proposed approach reveals hot spots and cold spots of residential choice for distinct socioeconomic groups exhibiting heterogeneous preferences. We discuss the relationship between observed patterns and disaster risk through the lens of exposure and vulnerability, as well as links to urban planning, and explore how the proposed methodology may contribute to predicting future trends in exposure, vulnerability, and risk through this analytical focus. Avenues for future research include the operational strengthening of these linkages for more effective disaster risk management.
- Article
(4904 KB) - Full-text XML
- BibTeX
- EndNote


In the human-environmental system, disaster risk arises from the interactions of different system components (Zscheischler et al., 2018). The Hyogo Framework for Action 2005–2015 maintains that disaster risk stems from the interaction of a hazard with exposed physical, socioeconomic and environmental vulnerabilities (UNISDR, 2007), consequently referring to the potential fatalities and losses in livelihoods, health, assets, and services. Urban processes such as not only the expansion into potentially hazardous areas but also gentrification or densification shape exposure and vulnerabilities of services and assets within urban areas in a highly dynamic manner and are thus at the basis of urban disaster risk. Hence, incorporating these urban processes more specifically into disaster risk assessment promises potential for more holistic perspectives.
Disaster risk R is conceived as a function of the interacting, interdependent risk component hazard H, exposure E, and vulnerability V, expressed as (Brauch, 2011; UNISDR, 2015; Zscheischler et al., 2018). Here, hazard refers to potentially damaging physical events or latent conditions representing future threats of natural, human-natural (environmental), or human origin (UNISDR, 2007). Exposure denotes the physical aspects of disaster risk (UNISDR, 2004), referring to the socioeconomic and demographic spatiotemporal fabric, i.e. assets such as population or the built environment that are potentially affected by a hazardous event (Brauch, 2011; Dilley et al., 2005; Villagrán de León, 2006). Vulnerability embraces the predisposition or propensity to be adversely affected, i.e. those physical, socioeconomic, and environmental conditions leading to (an increase in) the susceptibility of elements or fragility of elements exposed to hazards (Carreño et al., 2017; UNISDR, 2007). Disaster risk is consequently driven by the specifics of hazardous conditions, i.e. hazard extent, severity, and return period (Fuchs et al., 2013), as well as by (changes in) exposure and the degree of vulnerability (Cardona et al., 2012). In the case of extreme events, disaster risk is mostly conditioned by exposure (UNISDR, 2015). H, E, and V are dynamic over time and across spatial scales and are thus non-stationary (Fuchs et al., 2013). This gives rise to considerable uncertainty in the assessment of future risks (Cardona et al., 2012; Sarhadi et al., 2016; Westra et al., 2010; Zscheischler et al., 2018), thus calling for a more holistic, combined assessment of all relevant risk drivers (Fuchs et al., 2013; Winsemius et al., 2016).
Whilst climatic drivers, encompassing both natural variability and anthropogenic climate change, affect the magnitude and (joint) probability of (compound) hazardous events (Carrão et al., 2018; Sarhadi et al., 2016, 2018; Zscheischler et al., 2018), non-climatic drivers including socioeconomic and demographic development with resulting land-use changes shape exposure as well as vulnerability (Elmer et al., 2012; Fuchs et al., 2013). Particularly high levels of or increases in exposure and vulnerability are found in the global urban land (Pelling, 2011; Scheuer et al., 2017). Urban areas as complex, highly dynamic, and integrated systems are particularly prone to hazards, which pose threats to physical assets as well as economic, social, and political activities; disadvantaged populations and the urban poor; critical infrastructures; livelihoods; and households (Pelling, 2011; Scheuer et al., 2017). This is due to various interlinking economic, social, and spatial processes, e.g. the accumulation of capital, the increasing interconnectedness of places, and increasing individualization as well as urban growth and expansion (Cardona et al., 2012; Castells, 2002; Scheuer et al., 2017; UNISDR, 2015). For instance, from a global perspective, almost 90 % of the anticipated urban growth is expected in regions with limited economic development and thus comparatively high vulnerability including e.g. the small- to medium-sized cities of Africa and Asia (Scheuer et al., 2016; Seto et al., 2013; UNDESA, 2019).
As recognized for instance by Castells (2002), Smith (2002), or Harvey (2009), these global phenomena are linked down to the local level through their repercussions on the urban form. Consequently, also from this local perspective, exposure is governed firstly by urban population growth and the expansion of urban land. However, exposure is also shaped by multiple processes such as neighbourhood redevelopments and urban and economic restructuring, gentrification, infill, densification, or decay as well as (intra-urban) mobility and (rural–urban) migration, social–spatial segregation, increasing polarization, and growing inequalities (Braubach and Fairburn, 2010; Broitman and Koomen, 2015; Mustafa et al., 2018; Pelling, 2011; Smith, 2002). In this context, urban disaster risk is also driven by demographic changes and shifts (ageing) as well as by the impacts of conditions of the natural and built environment on human wellbeing and human health (Giles-Corti et al., 2016; Hunter et al., 2019; Sarkar and Webster, 2017).
The aforementioned processes bring about the substantial reorganization of urban structures and functions and the redistribution of activities and assets in cities (Harvey, 2009). This also effects changes in individual self-selections, preferences, and attitudes, e.g. regarding the choice of residential location and household mobility (Aslam et al., 2019). It has been estimated that, overall, in North America, Australia, and New Zealand, the share of households moving annually is about 15 % to 20 % and in Europe is 5 % to 10 % (Knox and Pinch, 2010). Household mobility is typically characterized as a two-step process, i.e. the decision to seek a new residence and its actual selection (Kim et al., 2005; Knox and Pinch, 2010). A comprehensive body of literature on residential choice adopts stated-preference approaches and discrete-choice modelling to study this decision process and the corresponding determinants of residential location choice. This includes case studies, e.g. for Burkina Faso (Traoré, 2019), China (Wu, 2004), Colombia (Stokenberga, 2019), Germany (Heldt et al., 2016), Israel (Frenkel et al., 2013), the Netherlands (Ettema and Nieuwenhuis, 2017), Pakistan (Aslam et al., 2019), or the UK (Kim et al., 2005; Walker et al., 2002). McFadden (1978) describes the choice of housing location as a rational, complex decision based on multiple dwelling characteristics such as the number of rooms or types of appliances, as well as location or neighbourhood attributes such as proximity to green spaces and the accessibility to places of work, commerce, education, and transportation. It is consequently recognized that residential location choice and hence residential mobility and migration are driving (intra-urban) spatial (re)structuring and thus exposure and vulnerabilities (Hunter, 2005; Kim et al., 2005; Wu, 2004).
Yin (2010) additionally highlights the role of land-use policies and population densities in the residential-location-choice process and the urban–rural gradient patterns emerging from this process. A substantial body of research studies this nexus of household perceptions on environmental amenities and disamenities – i.e. risks – and their role in residential location choice (Braubach and Fairburn, 2010; Ewing et al., 2005; Hunter, 2005) (Zhang, 2010, for a comprehensive list of references). For example, in the case of less developed countries, in-migration and residential location choice within hazard-prone areas is often the result of the lack of coordination of urban development; informality of large parts of the residential sector; lack of institutional capacities; failed risk governance; lack of financial capacities; housing-market discrimination; and lack of knowledge, awareness and risk perception of disadvantaged populations (Hunter, 2005; Zhang, 2010). However, in the case of the more developed countries, it is also highlighted that risks and potential losses are often accepted due to locational benefits (Hunter, 2005; Zhang, 2010) or outweighed by environmental amenities such as riparian areas, lake shores, or scenic views (Benson et al., 2000; Yin, 2010).
Most approaches that investigate the nexus between residential housing choice and hazard risk assume an indirect approach, i.e. the hedonic price model and associated regression methods (Zhang, 2010). Hereby, physical housing attributes and locational and neighbourhood characteristics as well as environmental attributes – such as the level of exposure, risk, or expected losses – are considered in the derivation of a willingness to pay (Xiao, 2017). Whilst following Zhang (2010) some empirical findings suggest that residents' willingness to pay is indeed lower in hazard-prone areas; it is also remarked that this evidence base is not at all clear-cut. Direct approaches, e.g. using household surveys, thus aim to directly identify the respondents' main motivations and decision factors for a specific location choice and the role that hazard exposure and risk play in them (Zhang, 2010).
This paper seeks to bring together the study of residential housing choice and the school of natural hazard risk assessment by an indirect, machine-learning-based approach. Unlike the aforementioned approaches, it is not the focus of this case study to estimate the willingness to pay in the presence or absence of natural hazard risk. It is also not aiming to elicit risk awareness e.g. of households on the move. Instead, it is proposed to explore the means and insights that residential-location-choice modelling offers for the identification of spatial hot spots of exposure and/or vulnerabilities and – by extension – how identifying current shifts in these patterns may hint at future trends in exposure and vulnerability, which we consider fundamental information for disaster risk assessment. The study presented in this paper builds on a case study by Scheuer et al. (2020) that – akin to a stated-preference approach – modelled residential-choice behaviour towards hypothetical apartment listings in the city of Leipzig, Germany. To do so, Scheuer et al. (2020) use a random forest model (Breiman, 2001) that models residential choice as the likelihood of a positive or negative decision outcome including considering the heterogeneity of preferences, i.e. the variation in housing preferences across individuals and socioeconomic groups (Hoshino, 2011). Random forests allow the use of large sets of mixed data and have proved to be robust and efficient classification models that often outperform individual decision trees or regression models (Antipov and Pokryshevskaya, 2012; see Tyralis et al., 2019, and Hastie et al., 2009, for more comprehensive reviews of random forests and other machine-learning algorithms). This case study goes beyond the previous work by making predictions of residential choice for actual real-estate data in the form of apartments advertised for rent on a common internet platform called ImmobilienScout24 (Boelmann et al., 2019), and by spatializing these predictions to elicit spatial patterns of residential choice and their change over time. In so doing, this case study seeks to address the following research questions:
-
Does residential-choice modelling allow us to identify spatial patterns of exposure, e.g. hot spots of (vulnerable) socioeconomic groups? How are these spatial patterns of exposure and thus vulnerabilities shaped by the heterogeneity of preferences as a function of the socioeconomic status of urban dwellers?
-
Can residential-choice modelling contribute to the estimation of changes in exposure and vulnerabilities by detecting trends in the spatial distribution of vulnerable groups?
In so doing, this case study aims to bring disaster risk assessment forward by making manifold and complex urban dynamics that shape the spatial distribution of urban dwellers and that consequently drive urban exposure and vulnerabilities more accessible in the assessment process.
Predictors for residential choice include spatial as well as non-spatial housing attributes, namely inclusive rent, location, number of rooms, total size, furnishing features, and house type – i.e. the structure type of the apartment building – and neighbourhood amenities such as the presence of major roads, urban green areas, or local suppliers. Additionally, various household attributes including income, employment status, qualification, and age are used for this prediction. The spatialization of the random forest model by Scheuer et al. (2020) necessitates that the real-estate data provided by Boelmann et al. (2019) are re-coded, e.g. regarding categorial predictor variables, and geolocated. Hence, the methodology applied in this case study embraces the following steps (Fig. 1): (i) extraction of non-spatial housing attributes, i.e. the characteristics of each actual apartment, from the scientific-use file provided by Boelmann et al. (2019; see Table 1); (ii) determination of spatially homogeneous units for the geolocation of prediction targets; (iii) determination of spatial housing attributes based on ancillary data (Table 1); (iv) formulation of a set of socioeconomic profiles to account for heterogeneity of preferences (Table 2); and (v) application of the pre-trained random forest model to predict the likelihoods of positive residential-choice outcomes. To evaluate changes in residential choice over time, this case study considers three reference years: 2008/09, 2013/14, and 2018/19. In the following, each methodological step is described in more detail.

Figure 1Data (pre-)processing for the prediction of residential-choice behaviour. (a) Non-spatial housing attributes are elicited directly from the apartment advertisements (Boelmann et al., 2019; see Table 1). (b) Identification of spatially homogeneous units and estimation of neighbourhood amenities per spatially homogeneous unit based on the spatial overlap of buffer and service areas of major roads, urban green areas, pharmacies, and local suppliers. Geolocation of advertised apartments within these spatially homogeneous units; (c) determination of spatial housing attributes as a function of the properties of the corresponding spatially homogeneous unit; (d) based on a set of formulated socioeconomic profiles, household attributes are created. (e) Permutation of predictor factors and subsequent application and evaluation of the random forest model.
First, the non-spatial housing attributes house type, number of rooms, furnishing features, inclusive rent (rent including heating costs), condition, and total size (Table 1) were determined from the apartment advertisements listed in the scientific-use file (Fig. 1a). As shown in Table 1, all housing attributes except furnishing features have a one-to-one cardinality; i.e. each advertised apartment has exactly one inclusive rent, a specific number of rooms, etc. A given apartment may however have multiple furnishing features, such as a fitted kitchen, courtyard or garden, and so forth. This constitutes a one-to-many relationship.
Second, prediction targets, i.e. the individual advertised apartments, need to be geolocated. The geolocation of each apartment typically corresponds to its address. However, in the provided scientific-use file, due to privacy protection, the actual address is anonymized and coded to a 1 km2 grid cell location in the European standard ETRS89-LAEA. Such a coarse spatial resolution obviously has limits, particularly in complex urban environments. To overcome this limitation, we suggest increasing the spatial resolution through a mapping of apartment locations to so-called spatially homogeneous units (SHUs). SHUs were identified on the basis of a grid with a spatial resolution of 250 m×250 m instead of 1000 m×1000 m; i.e. each grid cell of the original 1 km2 grid was divided into 16 sub-cells. An SHU is characterized by the following properties: (i) residential land use, (ii) a predominant (unique) house type, and (iii) the presence or absence of each individual spatial housing attribute. Areas of residential land use were determined from official topographic land-use data ATKIS (BKG, 2018). The predominant house type for each grid cell was subsequently derived by intersecting the 250 m×250 m grid with a dataset by Haase and Nuissl (2007) that describes the urban structure of the city of Leipzig by a combination of land-use and (residential) house types, e.g. “single and semi-detached houses” or “prefabricated housing estates”. House types were consequently assigned to each grid cell of the 250 m×250 m grid through the intersection. Then, the grid cells with common types of housing within each original 1 km2 grid cell were merged, and in so doing, the SHUs were identified (Fig. 2). As shown in Fig. 2, it needs to be noted that as the final delineation of each SHU depends on the predominant house type, the size of the resulting SHU must not correspond to a single 250 m×250 m grid cell but may comprise more than one sub-cell.
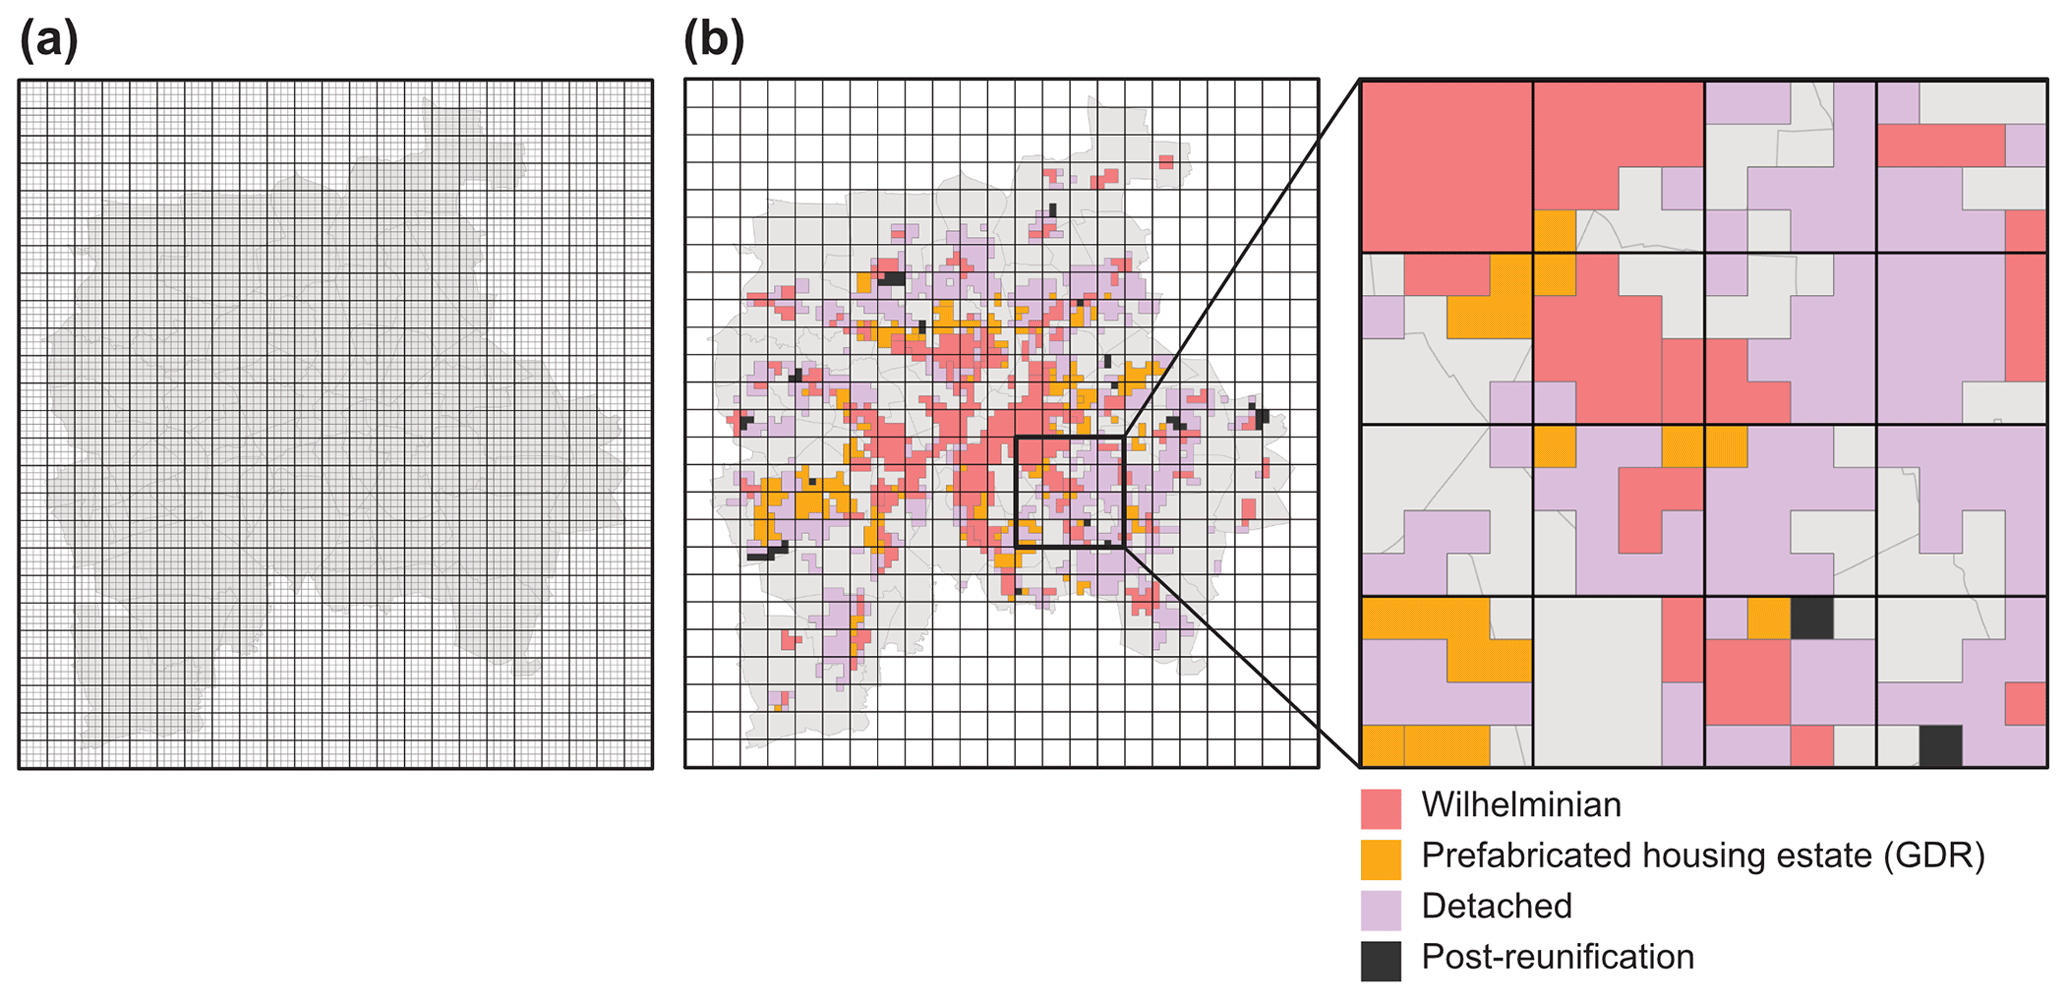
Figure 2Delineation of spatially homogeneous units (SHUs) based on house types. (a) Study area overlaid with the 1 km2 INSPIRE grid used in the scientific-use file (Boelmann et al., 2019) for geolocating advertised apartments (bold lines) and the 250 m×250 m grid used as basis for the delineation of SHU (thin lines); (b) SHU obtained by dissolving the intersection of the 250 m×250 m grid and the urban structure and land-use dataset by Haase and Nuissl (2007). As the detail shows, the final size of each SHU may vary considerably, depending on the homogeneity or heterogeneity of urban structure and corresponding predominant house types within each ETRS89-LAEA 1 km2 grid cell. GDR refers to the German Democratic Republic.
In a next step, each SHU was assigned spatial housing attributes, i.e. the presence or absence of major roads as well as of the neighbourhood amenities of green urban areas, pharmacies, and local suppliers. It follows that similarly to furnishing features, neighbourhood amenities constitute an attribute with a one-to-many cardinality, where the presence of a given amenity was affirmed if at least 67 % of an SHU was within one of the following (see Fig. 1b and Table 1):
-
A 150 m buffer area to major roads. This distance threshold is in line with the literature that suggests that air pollutant concentrations are highest within this distance to major roads (Balmes et al., 2009) and is further supported by studies stating increased health risks – e.g. regarding obstetrical complications (Yorifuji et al., 2015), decreased lung function in adults (Balmes et al., 2009), or neurological disease incidence (Chen et al., 2017) – within up to 200 m of major roads.
-
The service area of urban green areas. This is defined by a walking distance of 250 m, a threshold in line with recommendations that urban green areas should be accessible within no more than a 300 m linear (buffer) distance or an approximately 5 min walk (WHO Regional Office for Europe, 2016)/
-
The service areas of local suppliers or pharmacies. This is defined by a walking distance of 500 m or an approximately 10 min walk (Hoshino, 2011; BBSR, 2015).
The advertised apartments were then geolocated to a given SHU within their coded 1 km2 grid cell by the matching of house types.
Third, as a function of this geolocation, spatial housing attributes for each apartment listing were determined by the properties of the corresponding SHU. Moreover, the categorized location as well as multiculturality was determined (see Fig. 1c and Table 1).
Fourth, to account for heterogeneity of preferences and in this way for different degrees of vulnerability (Table 2), predictions are carried out for a set of socioeconomic groups that are characterized by employment status, qualification, net income, and age (Fig. 1d). In so doing, the shaping of exposure and vulnerabilities – and subsequently disaster risk – through residential choice can be illuminated as a function of these household characteristics. The attributes for each socioeconomic group were chosen from the factor distributions, i.e. mode, of the sampled dataset used by Scheuer et al. (2020) for random forest training. The hazard-specific degree of vulnerability, as exemplarily postulated in Table 2, is a compound based on the age and income characteristics of each socioeconomic group. Regarding flood hazards, the estimated degree of vulnerability follows empirical findings by Steinführer and Kuhlicke (2007), whereas for heat stress, vulnerability is based on Heaton et al. (2014). In both cases, older persons feature generally higher degrees of vulnerability. Likewise, more deprived or disadvantaged groups feature higher vulnerabilities compared to less disadvantaged ones.
Boelmann et al. (2019)Haase and Nuissl (2007)Stadt Leipzig, Amt für Statistik und Wahlen (2017)BKG (2018)Table 1Types, variables, description, cardinality, and source of data.
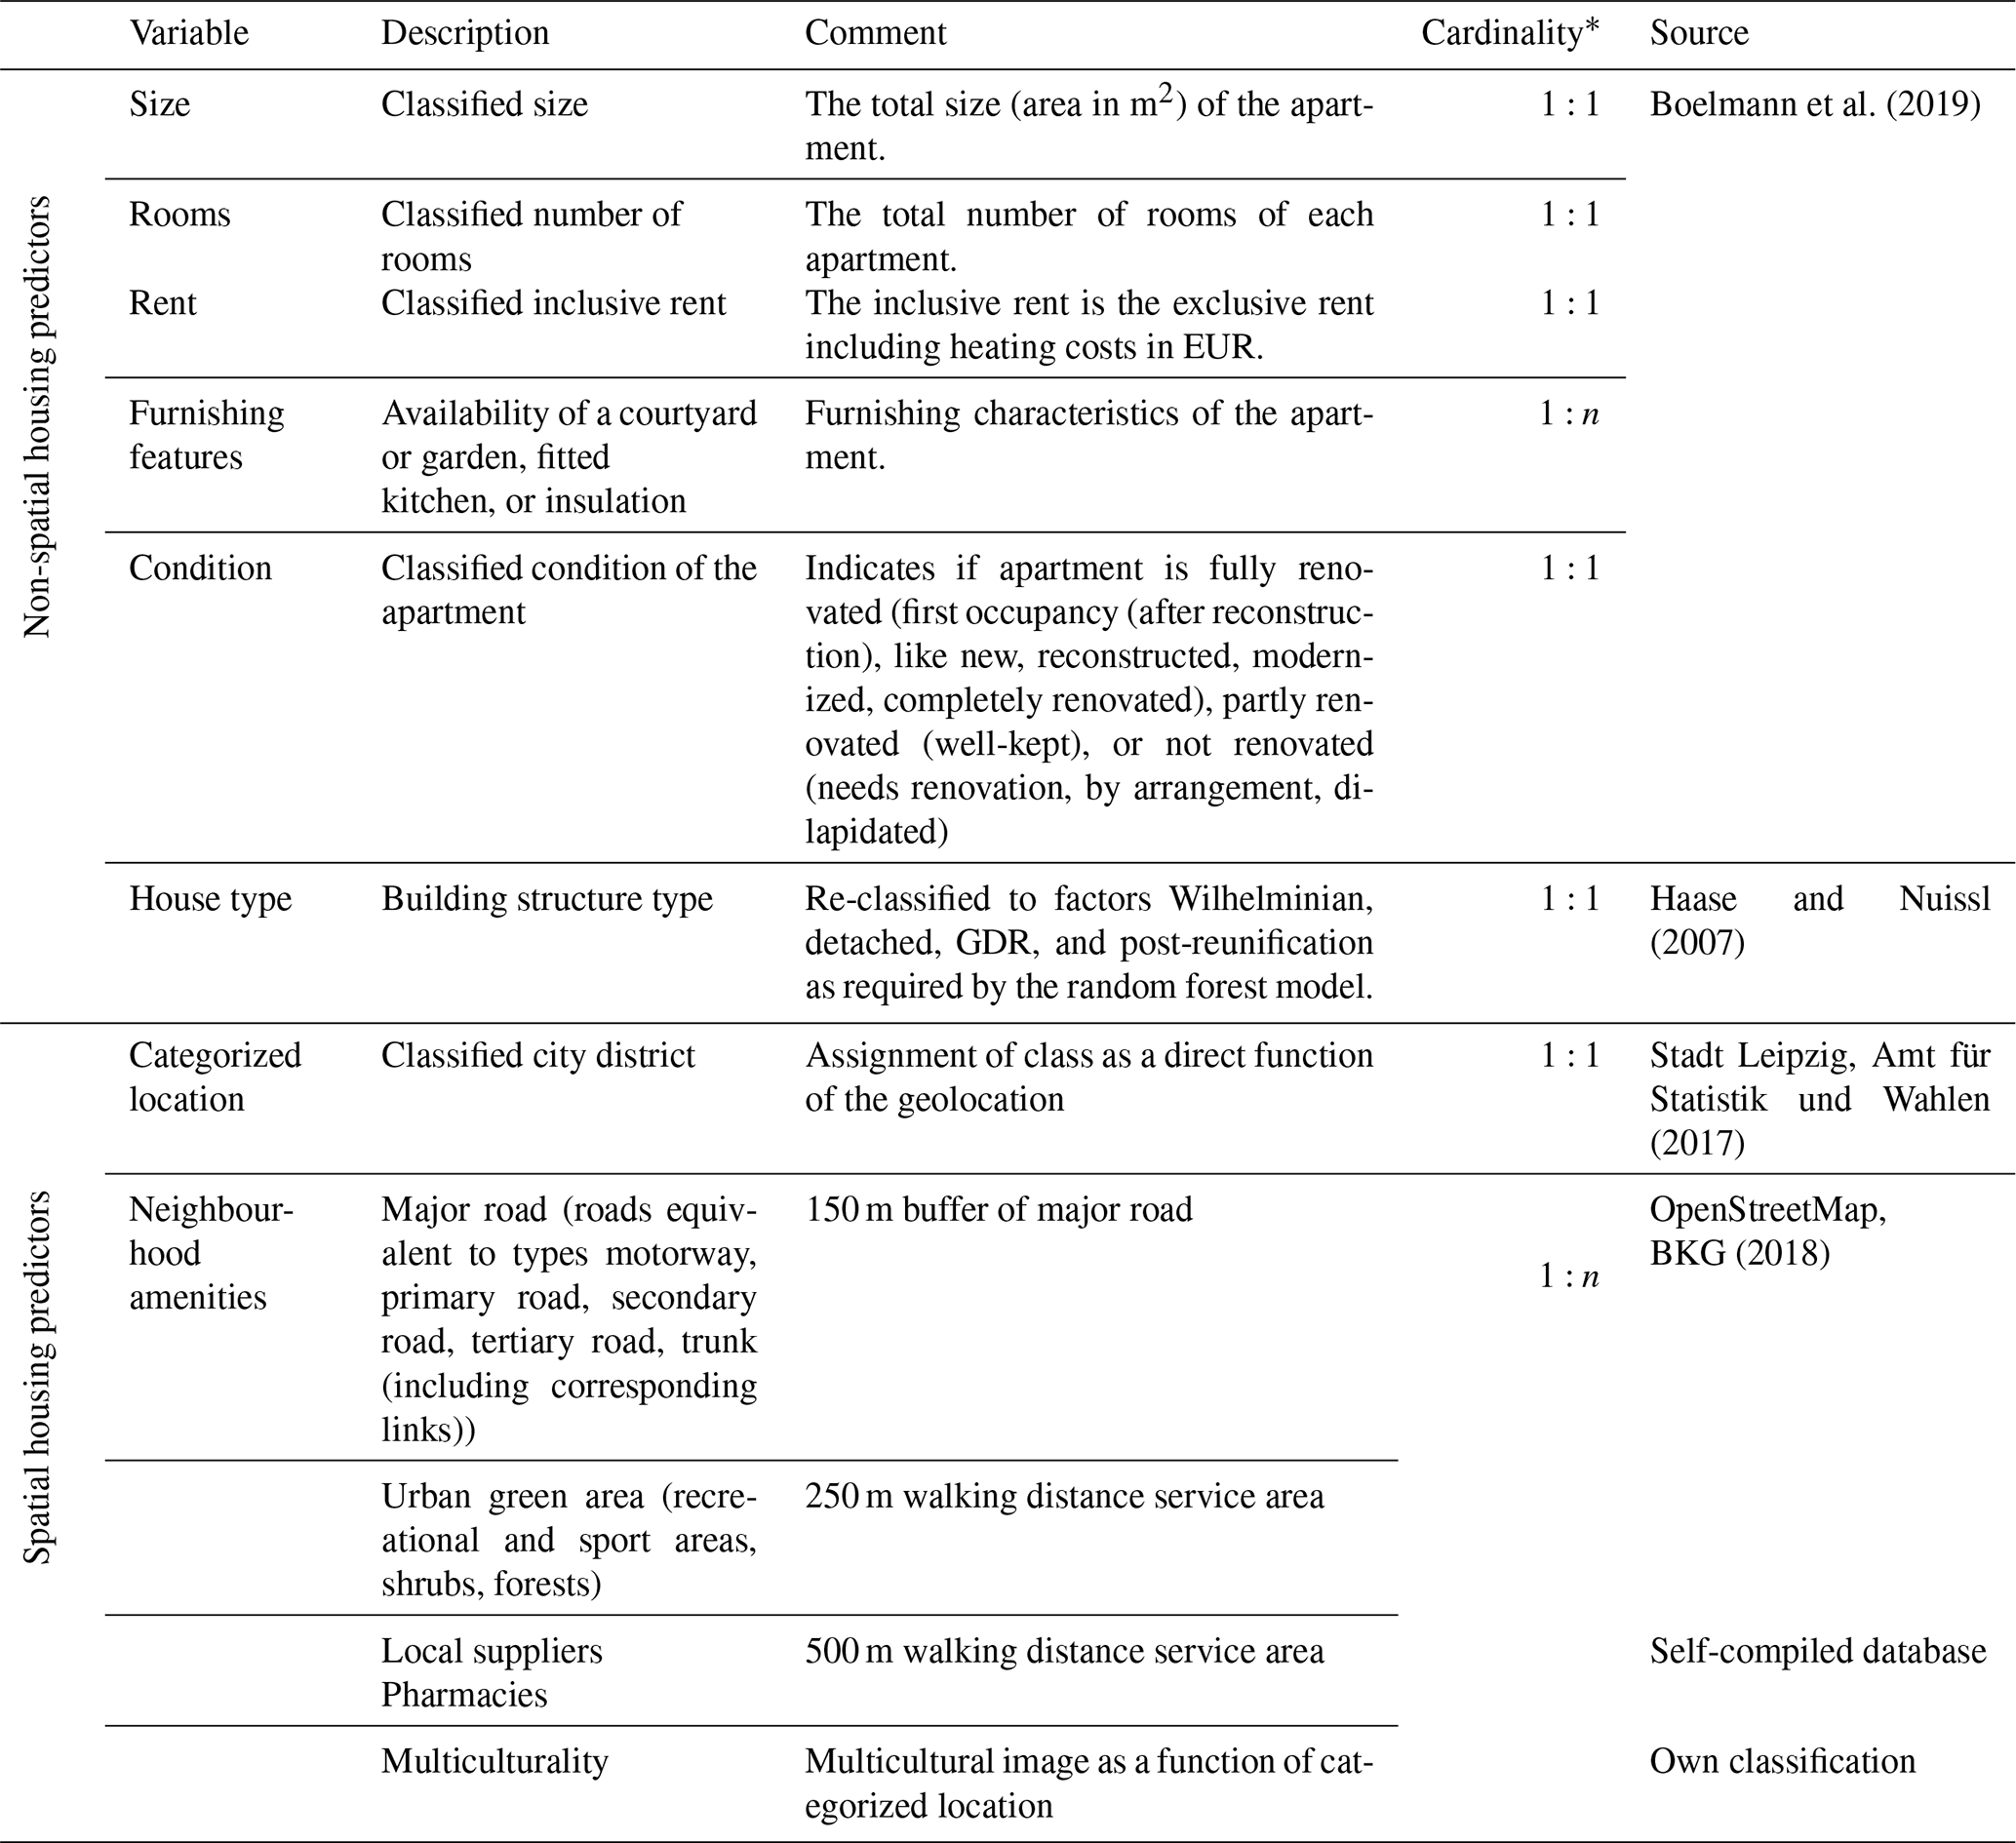
* A one-to-one cardinality is indicated by 1:1; a one-to-many cardinality is indicated by 1:n.

Figure 3Characterization of the apartments offered for rent regarding predictors (a) categorized inclusive rent (rent including heating costs), (b) house type, (c) categorized total size, and (d) categorized number of rooms. For house type, GDR is equal to prefabricated housing estates, post-90 to buildings constructed post-reunification, and W to Wilhelminian-style buildings. For each house type, the condition is indicated in brackets: FR = fully renovated; PR = partly renovated; NR = not renovated. Note that condition is not differentiated for post-reunification buildings due to the random forest training data.
Fifth, applying the pre-trained random forest model (Fig. 1e) that is implemented in the R package randomForestSRC (Ishwaran et al., 2008), the predicted probability p for a positive residential choice is then a function of factor combinations: p=f(house type, rooms, size, rent, features, location, amenities, employment, qualification, income, age). For this random forest model, the rate of success, i.e. the share of all correct predictions including both negative and positive outcomes, is shown to be approximately 78 %; however, precision – i.e. the share of correct positive choices – is lower at approximately 26 %. This is however comparable to other prediction models, such as binary logistic regression (Scheuer et al., 2020). It is also important to note that the random forest model allows for only a single factor value per predictor variable. To overcome this limitation, for each apartment, the factor values of all predictors with a one-to-many cardinality – i.e. furnishing features m and neighbourhood amenities a – were permuted to obtain all a⋅m factor combinations. E.g. a given apartment features both a garden and a fitted kitchen, so m=2. If this apartment is then located near both an urban green area and local suppliers, also a=2, and predictions thus need to be carried out for all four possible combinations of factors, with the values of all remaining predictors being held constant. The predicted likelihoods of residential choice for all factor combinations were subsequently averaged per apartment and then aggregated at the level of SHUs for further analysis, including hot-spot and cold-spot analysis using local G* statistics (Ord and Getis, 1995) as implemented in the R package spdep (Bivand and Wong, 2018).
.
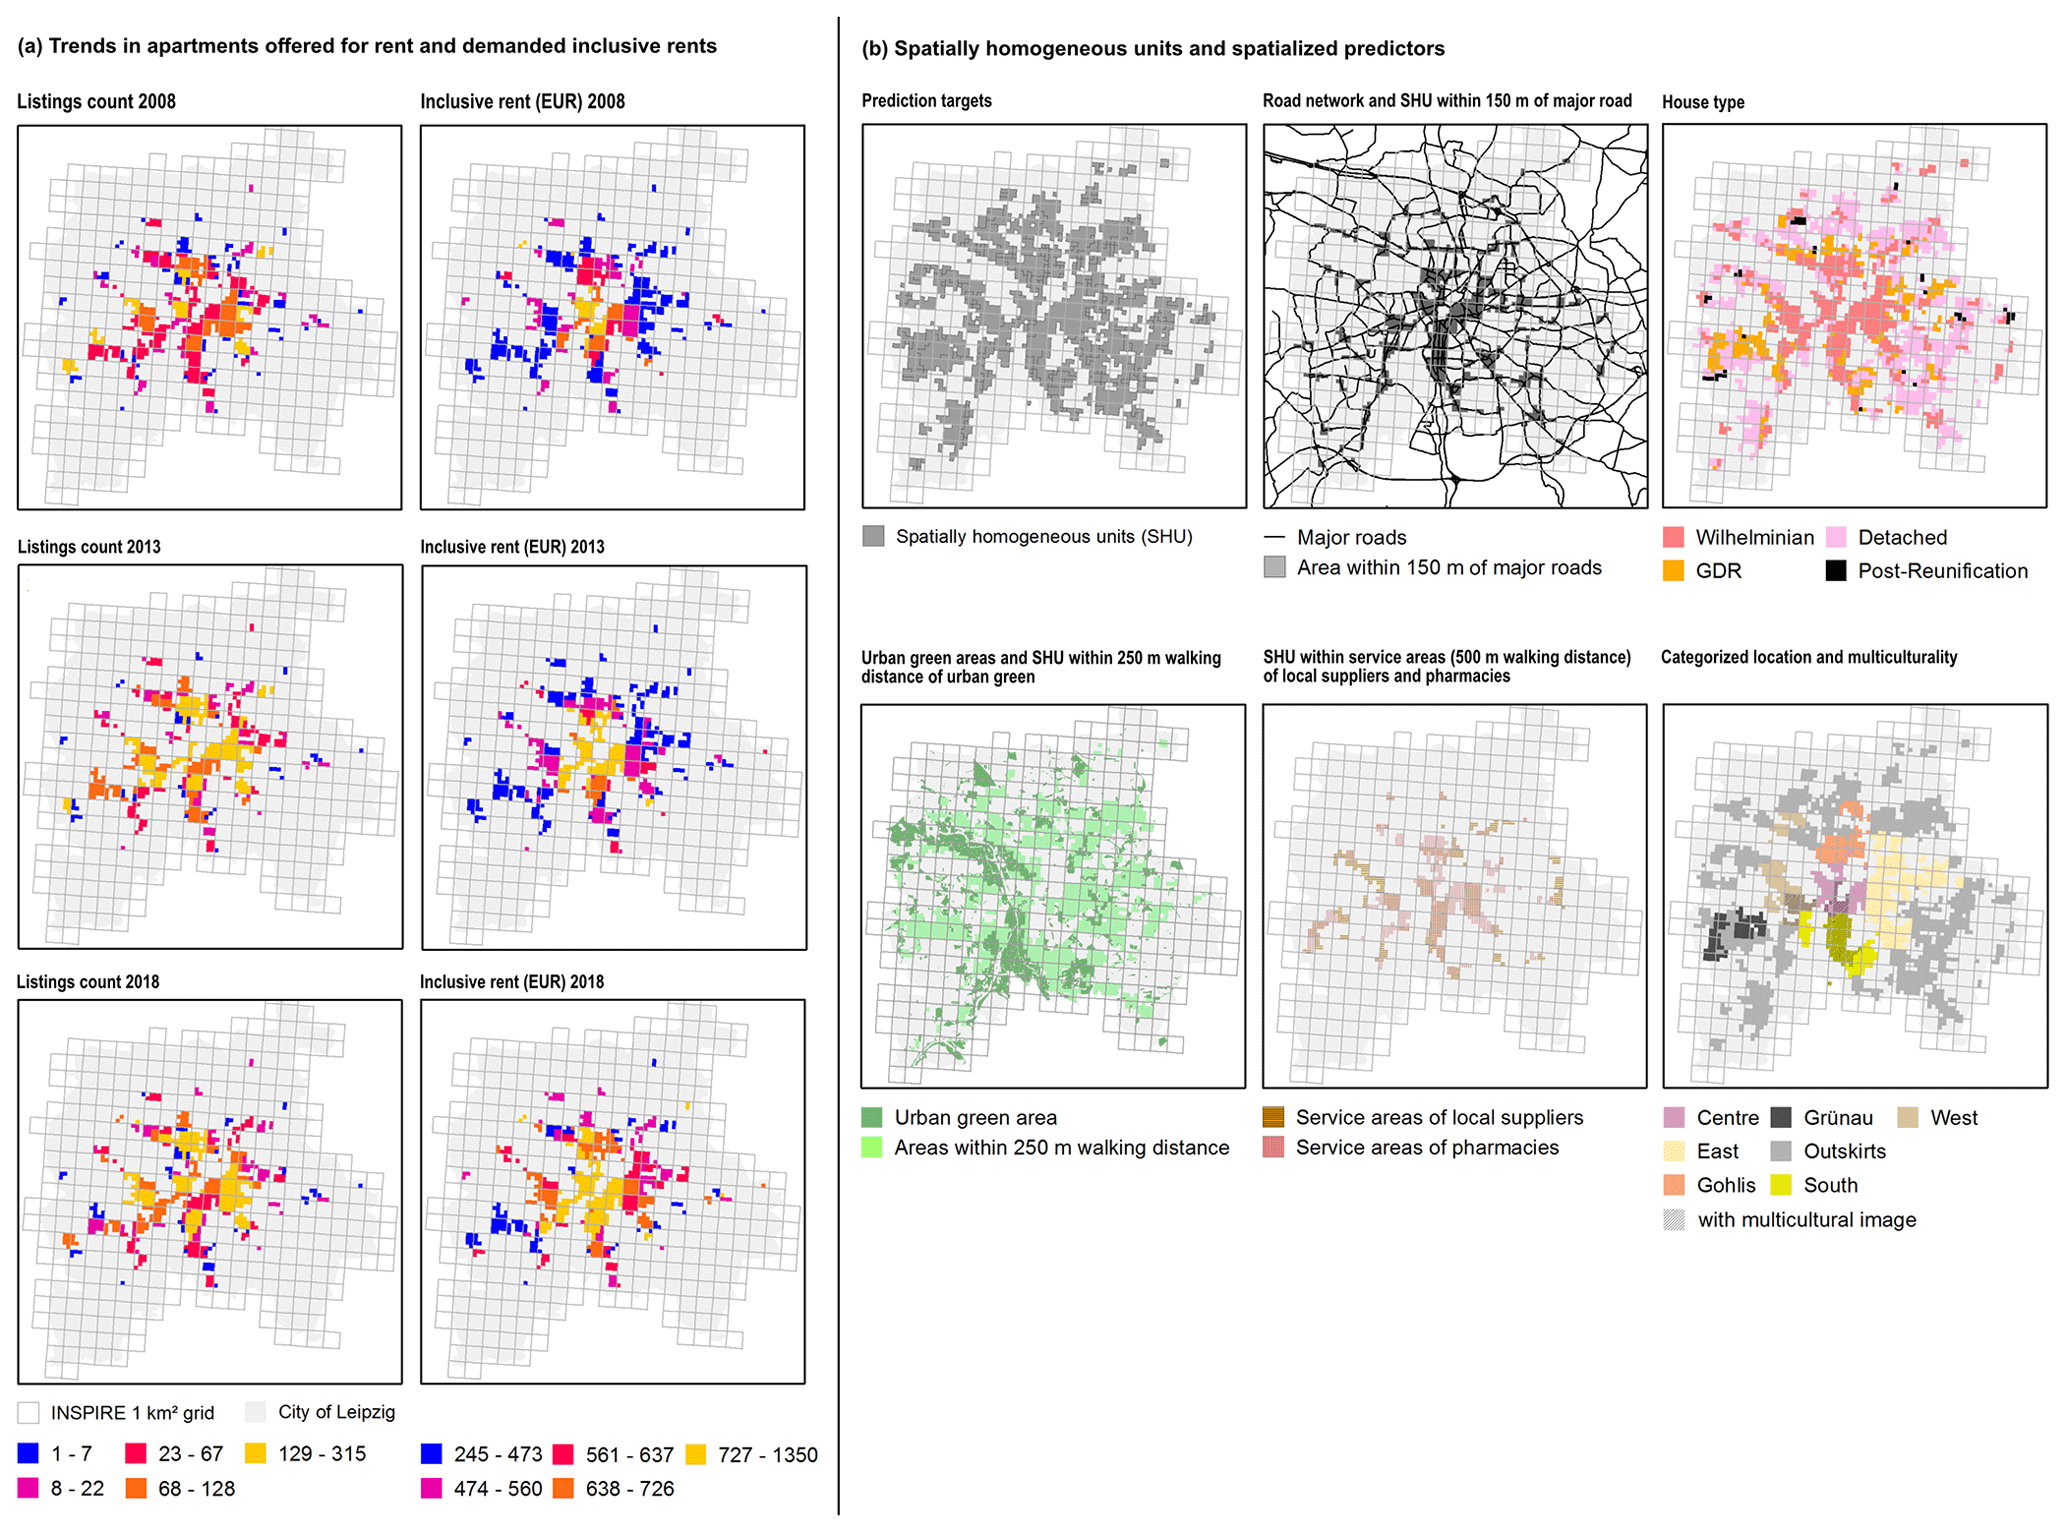
Figure 4Trends in the number of apartments offered for rent and demanded inclusive rent (EUR) averaged per SHU, per time step (a); identified SHU as prediction targets and modelled spatial housing attributes (b).
Figure 3 summarizes the non-spatial housing attributes of the advertised apartments. A total of N=25 579 apartment listings were considered in this analysis; for the period 2008/09, n2008=5468; for 2013/14, n2013=10 803; and for 2018/19, n2018=9308 (Fig. 4). In this context, it is important to note that this does not necessarily correspond to the number of apartments available for rent. Instead, a single apartment could be advertised multiple times, e.g. in the case of short rental periods. The listings were geolocated to 132 different SHUs, out of a total of 455 SHUs identified across the whole city of Leipzig.
As shown in Fig. 3, listings include mostly apartments with a size of between 40 and 80 m2 and with two to four rooms. The highest share is of the Wilhelminian house type – i.e. multi-storey tenement blocks – followed by buildings constructed in the GDR, i.e. prefabricated housing estates, and residential parks constructed post-reunification in the 1990s. In 2008 and 2013, a considerable number of apartments in GDR-type housing were offered in a rather bad condition, i.e. not renovated or requiring renovation. This number declined substantially in the following period until 2018. The majority of Wilhelminian housing is offered in good condition (fully renovated), although a considerable amount is also categorized as only partially renovated. This is due to the rental object being categorized as only well-kept. Spatial housing attributes in the form of the derived SHU properties, including the categorized location and multiculturality as well as proximity to or the presence of the neighbourhood amenities of major roads, urban green areas, local suppliers, and pharmacies, are visualized in Fig. 4.
Table 2Set of household predictors in the form of socioeconomic profiles to represent societal groups differentially vulnerable and/or at risk.

Only 7 % of all SHUs feature a multicultural image. Most SHUs are attributed to being dominated by single or semi-detached housing (41.3 %), followed by multi-storey tenement blocks and Wilhelminian house types (33.4 %), prefabricated GDR housing estates (20.4 %), and post-reunification residential parks (4.9 %). This contrasts with the house types offered, which were majorly Wilhelminian style, whilst there are only few offers of single or semi-detached housing; this could also explain the high number of SHUs in which no advertisements were geolocated. The median relative SHU area covered by the buffer area to major roads is equal to 60.8 % (mean 56.3 %); about 42.4 % of all SHUs are considered to be within 150 m of major roads. The median coverage of SHUs by the service areas of urban green spaces is equal to 75.3 % (mean 67.1 %); more than half of the derived SHUs (about 60.9 %) are located within 250 m walking distance of urban green areas. The median areas covered by the service areas of local suppliers and pharmacies are 3.6 % (mean 23.8 %) and 4.2 % (mean 27.3 %), respectively, so that only 14.9 % of all SHUs are located within 500 m walking distance of local suppliers; for pharmacies, this share is equal to 18 %. Looking at Fig. 4, it becomes apparent that the coverage of SHUs by local suppliers and pharmacies is concentrated in the city centre.
The demanded inclusive rent, averaged across the whole city, was equal to EUR 477 in 2008, was equal to EUR 524 in 2013, and increased further to EUR 642 in 2018. As shown in Fig. 4, inclusive rents increase particularly in the central parts of the city and to a lesser extent in the eastern parts of Leipzig. However, it is here where a comparatively high number of apartments are also offered for rent. On the outskirts, particularly in the western parts of the city, inclusive rents remain lower but so does the number of apartments listed for rent.
The predicted likelihoods for positive residential choices, averaged at the level of SHUs per socioeconomic group as described in Table 2, were subsequently summarized into hot spots and cold spots using local G* statistics (Ord and Getis, 1995). Figure 5 shows the associated z scores for the three considered time steps. Here, high z scores (z>1.65) indicate likely hot spots, i.e. a clustering of comparatively high likelihoods of positive residential choices for a specific socioeconomic group at a given location. Hot spots are therefore considered to feature a comparatively high chance that a socioeconomic group moves into (or resides at) the location in question. Conversely, low z scores () indicate likely cold spots, i.e. a grouping of comparatively low likelihoods of positive residential choices. Consequently, cold spots are considered to feature lower chances of a given socioeconomic group moving in.
In 2008, the spatial distribution of hot spots and cold spots between the different socioeconomic groups appears to be rather similar. In all cases, the western outskirts of the city comprising the district of Grünau, a prefabricated housing estate district with a rather negative image (Grossmann et al., 2015), is mostly avoided by all groups. Similarly, locations on the northern outskirts feature relatively low z scores across all socioeconomic profiles. However, in the period until 2018, these patterns change considerably, thereby becoming less similar overall, with many of the changes being explained by “extreme” locations, such as the very city centre or the outskirts. The centre loses attractiveness, as indicated by decreasing z scores. This is particularly true for middle-aged skilled workers; precarious, unemployed persons; and pensioners, i.e. for the socioeconomic groups considered most vulnerable due to comparatively lower incomes; part-time, precarious, or lack of employment; and/or age. A contrary trend of increasing z scores suggests an increasing attractiveness of the corresponding locations. For these vulnerable socioeconomic groups, such a trend can be identified for previous cold spots such as Grünau in the west or locations in the north of the city.
In contrast to the more vulnerable socioeconomic groups, the spatial patterns of z scores indicating hot spots and cold spots of full-time employed academics and young adults in education appear to shift less over time. For these groups, the loss of attractiveness of the city centre is much less pronounced. It can be noted instead that certain hot spots, e.g. in the eastern parts of the city, seem to reinforce themselves. For these groups, it also appears to be the case that certain locations, e.g. Grünau in the western part of the city, remain rather unattractive, as indicated by continuously low z scores over time (Fig. 5).
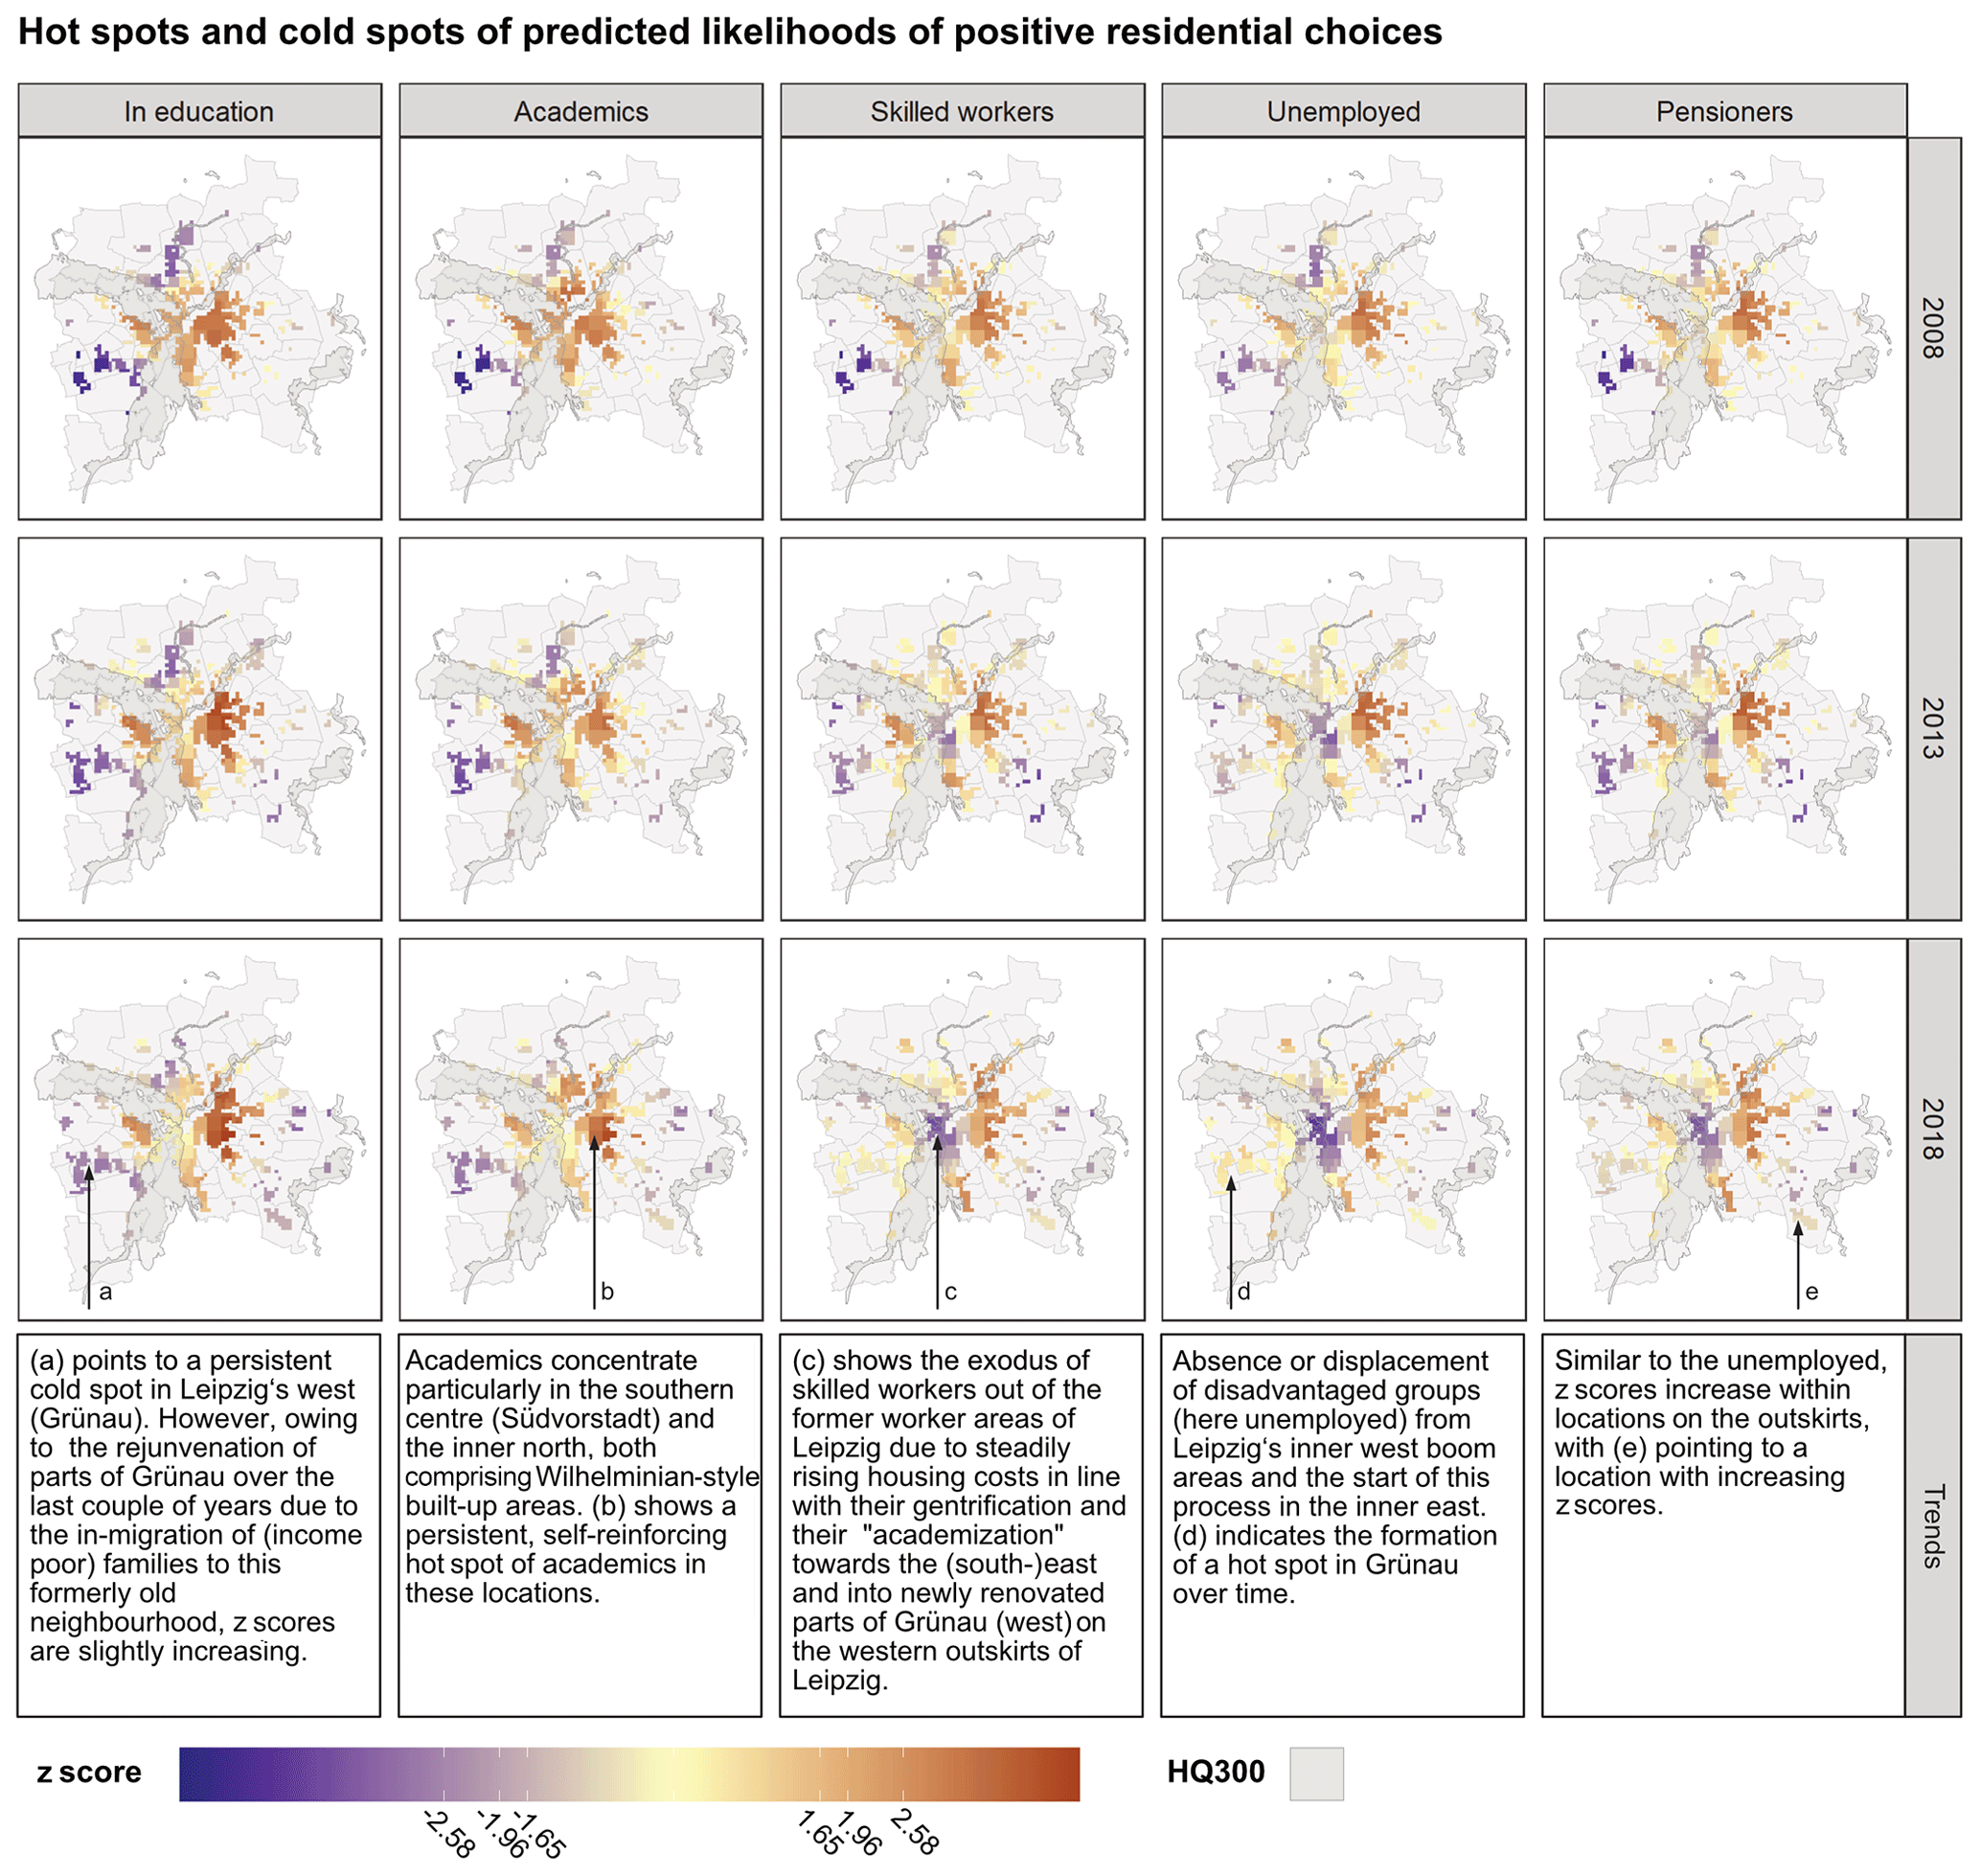
Figure 5Map of local G* z scores indicating likely hot spots and cold spots of the predicted likelihoods of positive residential choices per socioeconomic group for the time steps 2008, 2013, and 2018. Arrows indicate exemplary locations of persisting cold spots (a), reinforcing hot spots (b), hot spots turning into cold spots (c), and cold spots turning into hot spots for unemployed (d) or elderly persons (e). The map furthermore shows the area potentially affected by a 1-in-300-year flood event (HQ300).
This case study demonstrates that residential-choice behaviour can inform disaster risk assessment through several means. First, it has been shown that the proposed methodology allows for identifying hot spots and cold spots of residential choice for distinct socioeconomic groups, i.e. groups of population with heterogeneous preferences. The hot spots of residential choice are especially considered to highlight where a progressive concentration of the respective group of the population is likely. Consequently, the spatial pattern of hot spots is seen to directly reveal the shaping of exposure and vulnerabilities towards specific hazards through residential-choice processes. The impact on disaster risk becomes specifically obvious when the elicited hot-spot or cold-spot pattern is overlaid with hazard-prone areas to account for the hazard dimension of disaster risk. By so doing, areas of importance for disaster risk assessment can immediately be revealed. For example, Fig. 5 includes the area potentially affected by a 1-in-300-year flood event, denoted as HQ300. By comparing this area with the pattern of hot spots, it appears that especially academics and young adults in education may be particularly exposed to flooding, a trend possibly explained by previous studies indicating that environmental amenities outweigh possible risks (Benson et al., 2000; Yin, 2010). Contrary to that, exposure and thus vulnerabilities to heat stress may be more dominated by the spatial patterns of the hot spots of the elderly and deprived socioeconomic groups (Heaton et al., 2014).
Second, it has been shown that the proposed methodology allows for detecting changing patterns of residential-choice behaviour over time, e.g. cold spots becoming more attractive, as well as hot spots “cooling”, i.e. losing attractiveness. Particularly the former are considered to be of relevance in disaster risk assessment, as such “warming” cold spots could be highlighting spatial shifts in exposure and vulnerabilities, thereby possibly forming future hot spots of disaster risk. It is consequently such areas that could become a priority for intervention, and by bringing such potential hot spots to the attention of decision-makers, timely and proactive instead of rather reactive adaptation measures might be taken. In the case of heat stress, for instance, greening measures could be implemented for heat adaptation in evolving hot spots with low green-space accessibility and thus lack of cooling potential (Andersson et al., 2020; Haase et al., 2019). Similarly, in the case of flooding, the implementation of both structural and non-structural (behavioural) flood protection measures may be facilitated. Such mitigation and adaptive action address vulnerabilities and exposures (Cardona et al., 2012), thereby promising large potential for a reduction in damage and disaster risk (Winsemius et al., 2016).
Moreover, spatially co-located hot spots of residential choice for different disadvantaged socioeconomic groups may be highlighting strong competition between these demand groups and may furthermore be indicative of conflicts in urban planning, e.g. due to diverging interests and needs of the said demand groups for the development of residential areas vs. the implementation of greening as a risk adaptation measure or for the improvement of environmental justice. It is consequently through such “feedbacks” that links between (the prediction of) residential-choice behaviour, disaster risk assessment, and urban planning become apparent, and the role of urban planning in managing disaster risks, climate change adaptation, and human health and wellbeing is emphasized clearly. In this context, the proposed method could point to relevant process chains between urban drivers, housing-market dynamics, and disaster risk management, thereby inviting research and action to address developmental shortcomings or planning weaknesses.
Third, by providing disaster risk assessment with a spatially explicit model of residential choice, the spatial outcomes of a multitude of urban processes influencing residential-choice behaviour become incorporated into the disaster risk assessment process. Thereby, additional bodies of knowledge are tapped into, and bridges are built between different scientific disciplines. In so doing, novel insights may be obtained allowing for a more holistic and integrative perspective on disaster risk, and a better understanding of the importance of urban processes in the driving and shaping of exposure, vulnerabilities, and risks may be achieved (Carreño et al., 2017). In the context of the presented case study, these processes include (eco-)gentrification, segregation, polarization, and ageing, each influencing the formation of both hot spots and cold spots. In the case of comparatively privileged socioeconomic groups such as academics, hot spots may indicate an increasing (self-reinforcing) concentration of potentially exposed (material, economic) assets at risk. For socioeconomically disadvantaged or more vulnerable groups of people such as the unemployed or the elderly, hot spots may however put emphasis on locations of increasing socioeconomic vulnerabilities. In contrast, cold spots reveal evasive behaviour of specific socioeconomic groups, e.g. due to increasing rents. This becomes apparent in the wider city centre, which appears to be increasingly avoided over time by pensioners and the unemployed, who in turn shift, at least partially, towards the prefabricated GDR real-estate complexes such as Grünau (Fig. 5). These findings are in line with previous case studies for Leipzig, e.g. on the centrally located Lene-Voigt-Park, where greening led to inner-city urban renewal resulting in an influx of higher-income families, rising rents, and a subsequent exodus of less privileged groups (Ali et al., 2020; Haase et al., 2017), or on the risk of the accumulation of a socially weak and ageing population in the large prefabricated GDR housing estates (Brade et al., 2009). Hereby, the importance of selected predictors in the shaping of patterns of vulnerability and exposure is emphasized once more; for example, rent was identified to be amongst the three most important predictors of residential-choice behaviour by Scheuer et al. (2020). Furthermore, it becomes clear that the presented approach is a means for detecting and communicating social phenomena associated with complex urban processes.
Whilst we believe that disaster risk assessment is brought forward by the proposed approach through informing the dimensions of exposure and vulnerability by incorporating heterogeneous preferences of distinct sociodemographic and socioeconomic groups, several shortcomings of the presented approach need to be identified. These include the overall data availability and completeness of data, e.g. regarding neighbourhood amenities such as local suppliers or pharmacies. In this context, due to re-using a pre-trained machine-learning algorithm, the choice of predictors and corresponding categorial values was also limited. Shortcomings further include the spatial resolution of the SHUs for the geolocation of apartment listings, which is obviously dependent on the way data were provided in the scientific-use file but which is clearly too coarse to depict spatial manifestations of “hyper-local” urban processes such as redevelopments, retrofitting, or urban infill (Xu et al., 2020) in high detail, i.e. at site level. The SHUs' coarse spatial resolution thus compounds the quality of predictions of residential choice through the limited spatial representation of housing attributes, which had to be approximated at the level of SHUs. For example, in the case of house type, a dominant house type had to be elicited, thereby possibly neglecting other house types within a given grid cell.
In contrast to other case studies, transferability is limited due to the reliance on case-study-specific data and due to the specific local patterns and trends at play. However, the overall analytical lens of detecting patterns of residential choice based on tacit knowledge, i.e. unconscious knowledge tied to personal experiences (Raymond et al., 2010) embedded into a broader setting of urban development, is a unique approach which will be of increasing relevance for cities facing similar trends of built-up and climate changes (Scheuer et al., 2017). In this regard, revealing spatially explicit trends and shifts in heterogeneous groups of population and thereby enabling more precise ex ante analysis, the proposed methodology could be particularly useful for urban-planning authorities of cities in less developed countries, where census data are less reliably available, thus calling for alternative data sources (Contreras et al., 2020).
It furthermore must be noted that the presented case study does not consider preferences or spatial attributes evolving over time, a limitation deriving from a lack of training data before 2018. Consequently, the residential-choice predictions for the time steps 2008 and 2013 assume invariant (homogeneous) preferences, as well as a constant importance of predictors. This shortcoming may however be alleviated by adapting the proposed methodology to enable continuous and incremental training – e.g. with online random forests (Saffari et al., 2009) or Mondrian forests (Lakshminarayanan et al., 2014), each allowing for so-called online training – as part of long-term panel studies. Other machine-learning algorithms that are capable of handling mixed data such as neural networks may also be investigated (Hastie et al., 2009). Such longer-term studies could facilitate disaster risk assessment by further strengthening the linkages between urban planning and disaster risk management.
This paper proposes a methodology for the spatially explicit prediction of residential-choice behaviour in the form of hot spots and cold spots for distinct socioeconomic groups, a process seen to (co-)govern spatial patterns of exposure and vulnerabilities and subsequently disaster risk. Through the lens of predicting residential choice, the proposed methodology enables disaster risk assessment and management to improve (ex ante) analysis of the highly dynamic spatial shifts and resulting distribution of the urban population and to tap into additional bodies of knowledge, e.g. through making heterogeneous preferences of different socioeconomic groups accessible. In so doing, the assessment of exposure, vulnerabilities, and disaster risk is brought forward. An interesting avenue for future research includes the revision of predictors alongside the perpetuation of the methodology to allow for online training. Thereby, additional components of vulnerability, exposure, and disaster risk such as coping, preparedness, or adaptation could be incorporated more specifically. In so doing, linkages between the disaster risk community and environmental justice, e.g. in the form of green-space accessibility, would be explored further and operationalized in more detail.
The scientific-use file with apartments listed for rent (Boelmann et al., 2019) can be obtained by delivery as indicated in the referenced DOI https://doi.org/10.7807/immo:red:wm:suf:v1.
SS, DH, AH, MW, and TW were responsible for conceptualization of the case study. Development and implementation of the methodology, formal analysis, and visualization were by SS. Data acquisition was by MW and SS. The original draft was written by SS with contributions from all co-authors. Funding acquisition was by DH.
The authors declare that they have no conflict of interest.
This article is part of the special issue “Groundbreaking technologies, big data, and innovation for disaster risk modelling and reduction”. It is not associated with a conference.
Dagmar Haase and Manuel Wolff were supported as part of the project ENABLE, funded through the 2015–2016 BiodivERsA COFUND call for research proposals, with the national funders the Swedish Research Council for Environment, Agricultural Sciences, and Spatial Planning; Swedish Environmental Protection Agency; German Aerospace Center; National Science Centre (Poland); Research Council of Norway; and Spanish Ministry of Economy, Industry and Competitiveness. In addition, Dagmar Haase and Sebastian Scheuer benefited from the GreenCityLabHue Project (FKZ 01LE1910A) and Dagmar Haase, Sebastian Scheuer, and Manuel Wolff from the CLEARING HOUSE (Collaborative Learning in Research, Information-sharing and Governance on How Urban tree-based solutions support Sino-European urban futures) Horizon 2020 project (no. 821242). Sebastian Scheuer was additionally supported by the 2018 Summer Academy on World Risk and Adaptation Futures: Urbanization, hosted by the Institute for Environment and Human Security (UNU-EHS) of the United Nations University and the Munich Re Foundation (MRF). Thilo Wellmann receives a scholarship from the Deutsche Bundesstiftung Umwelt (DBU; German Federal Environmental Foundation). We acknowledge support by the German Research Foundation (DFG) and the Open Access Publication Fund of Humboldt-Universität zu Berlin.
This research has been supported by the Bundesministerium für Bildung und Forschung (grant no. 01LE1910A) and Horizon 2020 (grant no. 821242).
This paper was edited by Mario Lloyd Virgilio Martina and reviewed by Philippe Ker Rault and Georgia Papacharalampous.
Ali, L., Haase, A., and Heiland, S.: Gentrification through Green Regeneration? Analyzing the Interaction between Inner-City Green Space Development and Neighborhood Change in the Context of Regrowth: The Case of Lene-Voigt-Park in Leipzig, Eastern Germany, Land, 9, 24, https://doi.org/10.3390/land9010024, 2020. a
Andersson, E., Haase, D., Scheuer, S., and Wellmann, T.: Neighbourhood character affects the spatial extent and magnitude of the functional footprint of urban green infrastructure, Landscape Ecol., 35, 1605–1618, https://doi.org/10.1007/s10980-020-01039-z, 2020. a
Antipov, E. A. and Pokryshevskaya, E. B.: Mass appraisal of residential apartments: An application of Random forest for valuation and a CART-based approach for model diagnostics, Expert Syst. Appl., 39, 1772–1778, 2012. a, b
Aslam, A., Masoumi, H., Naeem, N., and Ahmad, M.: Residential location choices and the role of mobility, socioeconomics, and land use in Hafizabad, Pakistan, Urbani Izziv, 30, 115–128, 2019. a, b
Balmes, J. R., Earnest, G., Katz, P. P., Yelin, E. H., Eisner, M. D., Chen, H., Trupin, L., Lurmann, F., and Blanc, P. D.: Exposure to traffic: Lung function and health status in adults with asthma, J. Allergy Clin. Immun., 123, 626–631, 2009. a, b
BBSR – Bundesinstitut für Bau-, Stadt- und Raumforschung im Bundesamt für Bauwesen und Raumordnung: Indikatoren zur Nahversorgung. Erreichbarkeit von Gütern und Dienstleistungen des erweiterten täglichen Bedarfs, BBSR-Analysen KOMPAKT 10/2015, Bonn, Germany, 2015. a
Benson, E., Hansen, J., and Schwartz Jr., A.: Water views and residential property values, Appraisal J., 68, 260–271, 2000. a, b
Bivand, R. and Wong, D. W. S.: Comparing implementations of global and local indicators of spatial association, Test, 27, 716–748, 2018. a
BKG – Bundesamt für Kartographie und Geodäsie: Amtliches Topographisch-Kartographisches Informationssystem (Authoritative Topographic Cartographic Information System) ATKIS, dataset for Saxony, 2018. a, b
Boelmann, B., Budde, R., Klick, L., Schaffner, S., and RWI, et al.: RWI-GEORED: RWI Real Estate Data (Scientific Use File) – apartments for rent. Version: 1, RWI – Leibniz Institute for Economic Research Dataset, https://doi.org/10.7807/immo:red:wm:suf:v1, 2019. a, b, c, d, e, f
Brade, I., Herfert, G., and Wiest, K.: Recent trends and future prospects of socio-spatial differentiation in urban regions of Central and Eastern Europe: A lull before the storm?, Cities, 26, 233–244, 2009. a
Braubach, M. and Fairburn, J.: Social inequities in environmental risks associated with housing and residential location – a review of evidence, Eur. J. Publ. Heal., 20, 36–42, 2010. a, b
Brauch, H. G.: Concepts of Security Threats, Challenges, Vulnerabilities and Risks, in: Coping with Global Environmental Change, Disasters and Security. Threats, Challenges, Vulnerabilities and Risks, edited by: Brauch, H. G., Spring, U., Mesjasz, C., Grin, J., Kameri-Mbote, P., Chourou, B., Dunay, P., and Birkmann, J., Springer, Berlin, Heidelberg, Germany, 61–106, 2011. a, b
Breiman, L.: Random Forests, Mach. Learn., 45, 5–32, 2001. a
Broitman, D. and Koomen, E.: Residential density change: Densification and urban expansion, Comput. Environ. Urban, 54, 32–46, 2015. a
Cardona, O., van Aalst, M., Birkmann, J., Fordham, M., McGregor, G., Perez, R., Pulwarty, R., Schipper, E., and Sinh, B.: Determinants of risk: exposure and vulnerability, in: Managing the Risks of Extreme Events and Disasters to Advance Climate Change Adaptation. A Special Report of Working Groups I and II of the Intergovernmental Panel on Climate Change (IPCC), edited by: Field, C., Barros, V., Stocker, T., Qin, D., Dokken, D., Ebi, K., Mastrandrea, M., Mach, K., Plattner, G.-K., Allen, S., Tignor, M., and Midgley, P., Cambridge University Press, Cambridge, UK, 65–108, 2012. a, b, c, d
Carrão, H., Naumann, G., and Barbosa, P.: Global projections of drought hazard in a warming climate: a prime for disaster risk management, Clim. Dynam., 50, 2137–2155, 2018. a
Carreño, M. L., Cardona, O., Barbat, A. H., Suarez, D. C., del Pilar Perez, M., and Narvaez, L.: Holistic Disaster Risk Evaluation for the Urban Risk Management Plan of Manizales, Colombia, Int. J. Disast. Risk Sc., 8, 258–269, 2017. a, b
Castells, M.: Local and Global: Cities in the network society, Tijdschr. Econ. Soc. Ge., 93, 548–558, 2002. a, b
Chen, H., Kwong, J. C., Copes, R., Tu, K., Villeneuve, P. J., and van Donkelaar, A.: Living near major roads and the incidence of dementia, Parkinson's disease, and multiple sclerosis: a population-based cohort study, Lancet, 389, 718–726, 2017. a
Contreras, D., Chamorro, A., and Wilkinson, S.: Review article: The spatial dimension in the assessment of urban socio-economic vulnerability related to geohazards, Nat. Hazards Earth Syst. Sci., 20, 1663–1687, https://doi.org/10.5194/nhess-20-1663-2020, 2020. a
Dilley, M., Chen, R. S., Deichmann, U., Lerner-Lam, A. L., and Arnold, M. (Eds.): Natural Disaster Hotspots: A Global Risk Analysis, The World Bank, Washington, D.C., USA, 2005. a
Elmer, F., Hoymann, J., Düthmann, D., Vorogushyn, S., and Kreibich, H.: Drivers of flood risk change in residential areas, Nat. Hazards Earth Syst. Sci., 12, 1641–1657, https://doi.org/10.5194/nhess-12-1641-2012, 2012. a
Ettema, D. and Nieuwenhuis, R.: Residential self-selection and travel behaviour: What are the effects of attitudes, reasons for location choice and the built environment?, J. Transp. Geogr., 59, 146–155, 2017. a
Ewing, B., Kruse, J., and Wang, Y.: Local housing price index analysis in wind-disaster-prone areas, Nat. Hazards, 40, 463–483, 2005. a
Frenkel, A., Bendit, E., and Kaplan, S.: Residential location choice of knowledge-workers: The role of amenities, workplace and lifestyle, Cities, 35, 33–41, 2013. a
Fuchs, S., Keiler, M., Sokratov, S., and Shnyparkov, A.: Spatiotemporal dynamics: the need for an innovative approach in mountain hazard risk management, Nat. Hazards, 68, 1217–1241, 2013. a, b, c, d
Giles-Corti, B., Vernez-Mundon, A., Reis, R., Turrell, G., Dannenberg, A., Badland, H., Foster, H., Lowe, M., Sallis, J., Stevenson, M., and Owen, N.: City planning and population health: a global challenge, Lancet, 388, 2912–2924, 2016. a
Grossmann, K., Kabisch, N., and Kabisch, S.: Understanding the social development of a postsocialist large housing estate: The case of Leipzig-Grünau in eastern Germany in long-term perspective, Eur. Urban Reg. Stud., 24, 142–161, 2015. a
Haase, D. and Nuissl, H.: Does urban sprawl drive changes in the water balance and policy?: The case of Leipzig (Germany) 1870–2003, Landscape Urban Plan., 80, 1–13, 2007. a, b
Haase, D., Kabisch, S., Haase, A., Andersson, E., Banzhaf, E., Baró, F., Brenck, M., Fischer, L., Frantzeskaki, N., Kabisch, N., Krellenberg, K., Kremer, P., Kronenberg, J., Larondelle, N., Mathey, J., Pauleit, S., Ring, I., Rink, D., Schwarz, N., and Wolff, M.: Greening cities – To be socially inclusive? About the alleged paradox of society and ecology in cities, Habitat Int., 64, 41–48, 2017. a
Haase, D., Jänicke, C., and Wellmann, T.: Front and back yard green analysis with subpixel vegetation fractions from Earth observation data in a city, Landscape Urban Plan., 182, 44–54, 2019. a
Harvey, D.: Social Justice and the City, Athens, Georgia, USA, 2009. a, b
Hastie, T., Tibshirani, R., and Friedman, J.: The Elements of Statistical Learning, 2nd Edn., Springer, New York, 2009. a, b, c
Heaton, M., Sain, S., Greasby, T., Uejio, C., Hayden, M., Monaghan, A., Boehnert, J., Sampson, K., Banerjee, D., Nepal, V., and Wilhelmi, O.: Characterizing urban vulnerability to heat stress using a spatially varying coefficient model, Spat. Spatiotemp. Epidemiol., 8, 23–33, 2014. a, b
Heldt, B., Gade, K., and Heinrichs, D.: Determination of Attributes Reflecting Household Preferences in Location Choice Models, Transp. Res. Proc., 19, 119–134, 2016. a
Hoshino, T.: Estimation and Analysis of Preference Heterogeneity in Residential Choice Behaviour, Urban Stud., 48, 363–382, 2011. a, b
Hunter, L.: Migration and Environmental Hazards, Popul. Environ., 26, 273–302, 2005. a, b, c, d
Hunter, R., Cleland, C., Cleary, A., Droomers, M., Wheeler, B., Sinnett, D., Nieuwenhuijsen, M., and Braubach, M.: Environmental, health, wellbeing, social and equity effects of urban green space interventions: A meta-narrative evidence synthesis, Environ. Int., 130, 104923, https://doi.org/10.1016/j.envint.2019.104923, 2019. a
Ishwaran, H., Kogalur, U. B., Blackstone, E. H., and Lauer, M. S.: Random survival forests, Ann. Appl. Stat., 2, 841–860, 2008. a
Kim, J., Pagliara, F., and Preston, J.: The Intention to Move and Residential Location Choice Behaviour, Urban Stud., 42, 1621–1636, 2005. a, b, c
Knox, P. and Pinch, S.: Urban Social Geography: An Introduction, Routledge, Essex, UK, 2010. a, b
Lakshminarayanan, B., Roy, D. M., and Yee, W. T.: Mondrian Forests: Efficient Online Random Forests, Adv. Neur. Inf., 27, 3140–3148, 2014. a
McFadden, D.: Modeling the choice of residential location, Transport Res. Rec., 673, 72–77, 1978. a
Mustafa, A., Bruwier, M., Archambeau, P., Erpicum, S., Pirotton, M., Dewals, B., and Teller, J.: Effects of spatial planning on future flood risks in urban environments, J. Environ. Manage., 225, 193–204, 2018. a
Ord, J. K. and Getis, A.: Local Spatial Autocorrelation Statistics: Distributional Issues and an Application, Geogr. Anal., 27, 286–306, 1995. a, b
Pelling, M.: The Vulnerability of Cities to Disasters and Climate Change: A Conceptual Framework, in: Coping with Global Environmental Change, Disasters and Security. Threats, Challenges, Vulnerabilities and Risks, edited by: Brauch, H. G., Spring, U., Mesjasz, C., Grin, J., Kameri-Mbote, P., Chourou, B., Dunay, P., and Birkmann, J., Springer, Berlin, Heidelberg, Germany, 549–558, 2011. a, b, c
Raymond, C., Fazey, I., Reed, M., Stringer, L., Robinson, G., and Evely, A.: Integrating local and scientific knowledge for environmental management, J. Environ. Manage., 91, 1766–1777, 2010. a
Saffari, A., Leistner, C., Santner, J., Godec, M., and Bischof, H.: On-line Random Forests, in: Proceedings of the 2009 IEEE 12th International Conference on Computer Vision Workshops, 27 September–4 October 2009, IEEE Computer Society, Kyoto, Japan, 1393–1400, 2009. a
Sarhadi, A., Burn, D., Concepción Ausín, M., and Wiper, M.: Time-varying nonstationary multivariate risk analysis using a dynamic Bayesian copula, Water Resour. Res., 52, 2327–2349, 2016. a, b
Sarhadi, A., Concepción Ausín, M., Wiper, M., Touma, D., and Diffenbaugh, N.: Multidimensional risk in a nonstationary climate: Joint probability of increasingly severe warm and dry conditions, Sci. Adv., 4, eaau3487, https://doi.org/10.1126/sciadv.aau3487, 2018. a
Sarkar, C. and Webster, C.: Urban environments and human health: current trends and future directions, Curr. Opin. Env. Sust., 25, 33–44, 2017. a
Scheuer, S., Haase, D., and Volk, M.: On the Nexus of the Spatial Dynamics of Global Urbanization and the Age of the City, PLoS ONE, 11, e0160471, https://doi.org/10.1371/journal.pone.0160471, 2016. a
Scheuer, S., Haase, D., and Volk, M.: Integrative assessment of climate change for fast-growing urban areas: Measurement and recommendations for future research, PLoS ONE, 12, e0189451, https://doi.org/10.1371/journal.pone.0189451, 2017. a, b, c, d
Scheuer, S., Haase, D., Haase, A., Kabisch, N., Wolff, M., Schwarz, N., and Großmann, K.: Combining tacit knowledge elicitation with the SilverKnETs tool and random forests – The example of residential housing choices in Leipzig, Environ. Plan. B, 47, 400–416, https://doi.org/10.1177/2399808318777500, 2020. a, b, c, d, e, f
Seto, K., Parnell, S., and Elmqvist, T.: A Global Outlook on Urbanization, in: Urbanization, biodiversity and ecosystem services: Challenges and opportunities, edited by: Elmqvist, T., Fragkias, M., Goodness, J., Güneralp, B., Marcotullio, P., McDonalds, R., Parnell, S., Schewenius, M., Sendstad, M., Seto, K., and Wilkinson, C., Springer Netherlands, Dordrecht, the Netherlands, 1–12, 2013. a
Smith, N.: New Globalism, New Urbanism: Gentrification as Global Urban Strategy, Antipode, 34, 427–450, 2002. a, b
Stadt Leipzig, Amt für Statistik und Wahlen: Kommunale Gebietsgliederung (Stand 08/2017), Leipzig, 2017. a
Steinführer, A. and Kuhlicke, C.: Social vulnerability and the 2002 flood, FLOODsite Project Report, Helmholtz-Zentrum für Umweltforschung GmbH – UFZ, Leipzig, Germany, 2007. a
Stokenberga, A.: How family networks drive residential location choices: Evidence from a stated preference field experiment in Bogotá, Colombia, Urban Stud., 56, 368–384, 2019. a
Traoré, S.: Residential location choice in a developing country: What matter? A choice experiment application in Burkina Faso, Forest Policy Econ., 102, 1–9, 2019. a
Tyralis, H., Papacharalampous, G., and Langousis, A.: A brief review of random forests for water scientists and practitioners and their recent history in water resources, Water, 11, 910, https://doi.org/10.3390/w11050910, 2019. a, b
UNDESA – United Nations Department of Economic and Social Affairs, Population Division: World Urbanization Prospects: The 2018 Revision, New York, USA, 2019. a
UNISDR – United Nations International Strategy for Disaster Reduction: Living with Risk: A global review of disaster reduction initiatives, Volume II Annexes, Geneva, Switzerland, 2004. a
UNISDR – United Nations International Strategy for Disaster Reduction: Hyogo Framework for Action 2005–2015: Building the Resilience of Nations and Communities to Disasters, Geneva, Switzerland, 2007. a, b, c
UNISDR – United Nations International Strategy for Disaster Reduction: Making Development Sustainable: The Future of Disaster Risk Management, Global Assessment Report on Disaster Risk Reduction, Geneva, Switzerland, 2015. a, b, c
Villagrán de León, J. C.: Vulnerability – A conceptual and methodological review, Studies of the University: Research, Counsel, Education, Bonn, Germany, 2006. a
Walker, B., Marsh, A., Wardman, M., and Niner, P.: Modelling Tenants' Choices in the Public Rented Sector: A Stated Preference Approach, Urban Stud., 39, 665–688, 2002. a
Westra, S., Varley, I., Jordan, P., Nathan, R., Ladson, A., Sharma, A., and Hill, P.: Addressing climatic non-stationarity in the assessment of flood risk, Aust. J. Water Resour., 14, 1–16, 2010. a
WHO Regional Office for Europe: Urban green spaces and health, Copenhagen, Denmark, 2016. a
Winsemius, H., Aerts, J., van Beek, L., Bierkens, M., Bouwman, A., Jongman, B., Kwadijk, J., Ligtvoet, W., Lucas, P., van Vuuren, D., and Ward, P.: Global drivers of future river flood risk, Nat. Clim. Change, 6, 381–385, 2016. a, b
Wu, F.: Intraurban residential relocation in Shanghai: modes and stratification, Environ. Plan. A, 36, 7–25, 2004. a, b
Xiao, Y.: Urban Morphology and Housing Market, Springer, Shanghai, China, 2017. a
Xu, G., Zhou, Z., Jiao, L., and Zhao, R.: Compact Urban Form and Expansion Pattern Slow Down the Decline in Urban Densities: A Global Perspective, Land Use Policy, 94, 104563, https://doi.org/10.1016/j.landusepol.2020.104563, 2020. a
Yin, L.: Modeling Cumulative Effects of Wildfire Hazard Policy and Exurban Household Location Choices: An Application of Agent-based Simulations, Plan. Theory Pract., 11, 375–396, 2010. a, b, c
Yorifuji, T., Naruse, H., Kashima, S., Murakoshi, T., and Doi, H.: Residential proximity to major roads and obstetrical complications, Sci. Total Environ., 508, 188–192, 2015. a
Zhang, Y.: Residential Housing Choice in a Multihazard Environment: Implications for Natural Hazards Mitigation and Community Environmental Justice, J. Plan. Educ. Res., 30, 117–131, 2010. a, b, c, d, e, f, g
Zscheischler, J., Westra, S., van den Hurk, B., Seneviratne, S., Ward, P., Pitman, A., AghaKouchak, A., Bresch, D., Leonard, M., Wahl, T., and Zhang, X.: Future climate risk from compound events, Nat. Clim. Change, 8, 469–477, 2018. a, b, c, d