the Creative Commons Attribution 4.0 License.
the Creative Commons Attribution 4.0 License.
 | 24 Jun 2021
Review article: Risk management framework of environmental hazards and extremes in Mediterranean ecosystems
Nicolas R. Dalezios
Ioannis N. Faraslis
Kostas Mitrakopoulos
Anna Blanta
Marios Spiliotopoulos
Stavros Sakellariou
Pantelis Sidiropoulos
Ana M. Tarquis
Risk assessment constitutes the first part within the risk management framework and involves evaluating the importance of a risk, either quantitatively or qualitatively. Risk assessment consists of three steps, namely risk identification, risk estimation and risk evaluation. Nevertheless, the risk management framework also includes a fourth step, i.e., the need for feedback on all the risk assessment undertakings. However, there is a lack of such feedback, which constitutes a serious deficiency in the reduction of environmental hazards at the present time. Risk identification of local or regional hazards involves hazard quantification, event monitoring including early warning systems and statistical inference. Risk identification also involves the development of a database where historical hazard information and hazard effects are included. Similarly, risk estimation involves magnitude–frequency relationships and hazard economic costs. Furthermore, risk evaluation consists of the social consequences of the derived risk and involves cost-benefit analysis and community policy. The objective of this review paper is twofold. On the one hand, it is to address meteorological hazards and extremes within the risk management framework. Analysis results and case studies over Mediterranean ecosystems with emphasis on the wider area of Greece, in the eastern Mediterranean, are presented for each of the three steps of risk assessment for several environmental hazards. The results indicate that the risk management framework constitutes an integrated approach for environmental planning and decision-making. On the other hand, it sheds light on advances and current trends in the considered meteorological and environmental hazards and extreme events, such as tornadoes, waterspouts, hailstorms, heat waves, droughts, floods, heavy convective precipitation, landslides and wildfires, using recorded datasets, model simulations and innovative methodologies.


Disaster risk arises when hazards interact with physical, social, economic and environmental vulnerabilities. The impact of disaster can be transferred from one region to another. This, compounded by increasing vulnerability related to several factors, such as population growth, land pressure, urbanization, social inequality, climate change, political change, economic growth, technological innovation, social expectations, global interdependence, environmental degradation, competition for scarce resources and the impact of epidemics, points to a future where disasters could increasingly threaten, among others, the sustainable development of agricultural regions (Smith, 2013). Sustainable development, socioeconomic improvement, good governance and disaster risk reduction are mutually supportive objectives.
Environmental degradation is one of the major factors contributing to the vulnerability of environment and agriculture because it directly magnifies the risk of natural disasters (Dalezios et al., 2017). In order to ensure sustainability in environmental status and agricultural production, a better understanding of the natural disasters that have an impact on the environment and agriculture is essential (Sivakumar et al., 2005). A comprehensive assessment of impacts of natural disasters on environment and agriculture requires a multidisciplinary, multi-sectoral and integral approach involving several components and factors (Dalezios et al., 2020). Priority should be given to supporting applied research since research is necessary to understand the physical and biological factors contributing to disasters. Community-wide awareness and capacity building programs on natural disasters, mainly for farmers and stakeholders, should also be included in any research effort. Programs for improving prediction and early warning methods, as well as dissemination of warnings, should be expanded and intensified. Moreover, efforts are required to determine the impact of disasters on natural resources.
Recent research findings suggest that variability of climate, if encompassing more intense and frequent extremes, such as major large-scale environmental hazards like droughts, heat waves (HWs) or floods, results in the occurrence of natural disasters that are beyond our socioeconomic planning levels. This is expected to stretch regional response capabilities beyond their capacity and will require new adaptation and preparedness strategies (Salinger et al., 2005). Disaster prevention and preparedness should become a priority, and rapid response capacities to climate change need to be accompanied by a strategy for disaster prevention. Nevertheless, each type of extreme event has its own specific climate, cultural and environmental setting, and mitigation activities must use these settings as a foundation of proactive management. There is an urgent need to assess the forecasting skills for natural disasters affecting mainly agriculture and other sectors of the economy in order to determine those where more research is necessary. It is well known that the lack of good forecast skill is a constraint to improving adaptation, management and mitigation. Seasonal to interannual climate forecasting is a new branch of climate science which promises to reduce vulnerability. Improved seasonal forecasts are now being linked to decision-making for cropping. The application of climate knowledge to the improvement of risk management is expected to increase the resilience of farming systems.
A more integrated approach to environmental hazards has been gradually attempted using common methodologies, such as risk analysis. An understanding of extreme events and disasters is a prerequisite for the development of adaptation strategies in the context of climate change and risk reduction within the disaster risk management framework (IPCC, 2012). Extreme events will have greater impacts on sectors with closer links to climate, such as agriculture and food security (Dalezios et al., 2020). Risk management means reducing the threats posed by known hazards while at the same time accepting unmanageable risks and maximizing any related benefits (Smith, 2013). Moreover, risk assessment constitutes the first part within the risk management framework and involves evaluating the importance of a risk, either quantitatively or qualitatively. Risk assessment consists of three steps (Smith, 2013), namely risk identification, risk estimation and risk evaluation. Nevertheless, the risk management framework also includes a fourth step, i.e., the need for feedback on all the risk assessment undertakings. However, there is a lack of such feedback, which constitutes a serious deficiency in the reduction of environmental hazards at the present time.
The objective of this paper is to attempt a comprehensive presentation of the risk management framework related to environmental hazards and, specifically, to meteorological hazards and extremes. At first, a comprehensive description of the risk management framework is presented. This is followed by a description of the concepts of meteorological hazards. Then, environmental hazards and extremes are analyzed, and several case studies are presented with emphasis on the wider area of Greece, eastern Mediterranean.
This section initially covers a comprehensive and brief presentation of the concepts of hazards, risk and disaster. Then, a comprehensive presentation is conducted of the components which constitute the risk management framework (Fig. 1). At first, risk identification is considered, which involves risk quantification, monitoring and early warning systems, as well as statistical inference. Then, the risk estimation component is considered involving the probability of hazard events, as well as magnitude–duration–frequency and areal extent relationships. The risk estimation also involves vulnerability assessment and its uncertainty. These two components contribute to the next component, which refers to quantitative risk assessment (QRA). Then, the next component refers to risk evaluation and adaptation to future changes. Finally, the last component refers to risk governance, which refers to feedback on the effectiveness of the risk reduction measures and the dissemination of policy results (Dalezios, 2017). Figure 2 presents an analytical flow chart of the risk analysis methodological procedure (Dalezios and Eslamian, 2016). A brief description of the components follows.
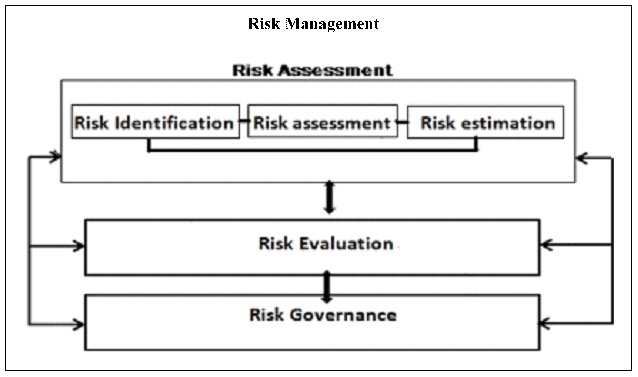
Figure 1Components of drought risk management (adapted from Dalezios et al., 2014).
2.1 Hazards and disasters
Hazard is an inescapable part of life. Hazard is defined as “a potentially damaging physical event, phenomenon or human activity that may cause the loss of life or injury, property damage, social and economic disruption or environmental degradation” (Smith, 2013). Hazards can include latent conditions that may represent future threats and can have different origins: natural (geological, hydrometeorological and biological) or induced by human processes (environmental degradation and technological hazards) (UN/ISDR, 2005). Risk is sometimes taken as synonymous with hazard (UN/ISDR, 2005), but risk has the additional implication of the chance of a particular hazard actually occurring. Thus, risk is the actual exposure of something of human value to a hazard and is often regarded as the product of probability and loss. Therefore, hazard (or cause) may be defined as “a potential threat to humans and their welfare” and risk (or consequence) as “the probability of a hazard occurring and creating loss” (Smith, 2013). Unlike hazard and risk, a disaster is an actual happening rather than a potential threat; thus, a disaster may be defined as “the realization of hazard”. A more detailed disaster definition is “an event, concentrated in time and space, in which a community experiences severe danger and disruption of its essential functions, accompanied by widespread human, material or environmental losses, which often exceed the ability of the community to cope without external assistance” (Smith, 2013).
The term environmental hazard has the advantage of including a wide variety of hazard types ranging from “natural” (geophysical) events through “technological” (man-made) events to “social” (human behavior) events. Specifically, it is possible to use the following working definition of environmental hazards: “Extreme geophysical events, biological processes and major technological accidents, characterized by concentrated releases of energy or materials which pose a large unexpected threat to human life and can cause significant damage to goods and environment” (Smith, 2013).
Vulnerability is defined as “The conditions determined by physical, social, economic and environmental factors or processes, which increase the susceptibility of a community to the impact of hazards” (UN/ISDR, 2005). The concept of vulnerability, like risk and hazard, indicates a possible future state. Most approaches to reduce system-scale vulnerability can be viewed as expressions of either resilience or reliability. Resilience is defined as “The capacity of a system, community or society potentially exposed to hazards to adapt, by resisting or changing in order to reach and maintain an acceptable level of functioning and structure”. This is determined by the degree to which the social system is capable of organizing itself to increase this capacity for learning from past disasters for better future protection and to improve risk reduction measures (UN/ISDR, 2005). Reliability, on the other hand, reflects the frequency with which protective devices against hazard fail (Smith, 2013).
2.2 Risk identification
Risk identification involves quantification, event monitoring including early warning systems, statistical inference and the development of a database. The aim of this component is to analyze the changes in hazards affecting several sectors of the economy that are expected as a result of environmental changes. The database consists of historical information on hazards and their effects for the study areas. Quantification and modeling of hazards constitute the main subject of this component. The potential domino effect of hazards is also analyzed, for instance the links between climate and land use change, river damming, and consequent flooding. A brief description of each part follows.
2.2.1 Database development
A database is developed which constitutes the input data to risk analysis and is based on recorded historical environmental data of the study areas. At first, digital information is collected on environmental factors, such as geology, geomorphology, soil, topography, hydrology, meteorology, agronomy, land use, land cover, graphic information system (GIS) and similar aspects, which are used in susceptibility assessment. Information is also collected on triggering factors leading to hazards, which are used in hazard assessment. Also, a hazard inventory is developed based on recorded historical disaster events. This hazard inventory is used in susceptibility and hazard assessments. Finally, the exposed elements at risk are identified and recorded, which are used in exposure analysis and vulnerability assessment.
2.2.2 Risk quantification
Hazards are quantified either numerically or by modeling or even by using indicators and/or indices, depending on the type of hazard. Moreover, the frequency of occurrence of a hazard, e.g., the flooded area with a probability of 1 in 5 years, could also be considered. Furthermore, the potential damage caused by a disaster requires the need for forecasting and monitoring in the affected region.
2.2.3 Susceptibility assessment
This assessment involves initiation and spreading analyses, which are used in risk estimation and hazard assessment. Initiation analysis includes hazard inventory, as well as heuristic, statistical and physical hazard modeling based on environmental factors and triggering factors. Spreading analysis includes empirical, analytical and numerical hazard modeling.
2.3 Risk estimation and vulnerability assessment
The objective is to develop a method for regional- and local-scale probabilistic hazard assessment. The aim of this component is to assess environmental changes triggered by climate change which interact with economic development, leading to changes in exposed elements at risk. The assessment of probability distributions along with quantification and analysis of the exposed elements at risk constitutes the basis of this component. Also, estimation of hazard magnitude–duration–frequency and areal extent relationships are considered (e.g., Dalezios et al., 2000). Scenarios for the location and type of exposed elements at risk depend on a few factors, such as climate change, but also on future economic developments and implementation of policies for land use planning. Vulnerability assessment also includes testing, selecting and mapping indicators. An example is the case of hazard assessment of flood events, which results in a number of possible hazard scenarios with associated probabilities and indications of magnitude, frequency and areal extent.
2.3.1 Risk estimation for hazard assessment
Risk estimation involves the risk of hazard events, i.e., the probability of such event. As already mentioned, risk estimation also includes hazard magnitude–duration–frequency and areal extent relationships with the associated costs. The changes in environmental conditions, reflected in the changes of land use patterns, also form the input in the models that are used for hazard assessment, resulting in several possible hazard scenarios with associated probabilities and indications of magnitude, frequency and spatial extent. This part contributes to exposure analysis.
2.3.2 Exposure analysis
This part is essentially a GIS analysis and involves spatial overlap of hazard footprints for the elements at risk. The elements at risk are considered in terms of type, temporal variation and quantification, i.e., quantity and economic value. This part contributes to risk assessment and, in particular, to the quantification of the number of elements at risk.
2.3.3 Vulnerability assessment
An inventory is considered of exposed elements at risk and their characterization in terms of aspects that can be used for the assessment of vulnerability. The vulnerability to a hazard is generally understood and assessed. Uncertainty analysis of vulnerability is also considered and becomes large when dealing with the evaluation of future changes in exposed elements at risk, based on several land use scenarios. Indeed, a number of factors contribute to future scenarios which are related to global change but also to future economic developments and implementation of policies for land use planning. The uncertainty in vulnerability approaches is usually evaluated based on historical damage catalogues, modeling and expert assessment. Indices for vulnerability assessment that include uncertainty levels are also considered and integrated within a dynamic context.
2.4 Quantitative risk assessment (QRA)
The aim is to integrate the techniques for probabilistic hazard assessment which incorporate the uncertainty due to future environmental changes with the results of the exposure and vulnerability analyses into a platform for quantitative risk assessment (QRA). Indeed, the combination of all the specific risks leads to the total risk for all the hazard intensities, return periods, triggering events and elements at risk. The methods for probabilistic risk assessment that are developed require a lot of data, mainly spatial data, from different data sources. Indeed, a significant component of the analysis remains the organization and standardization of the datasets which are used in the risk assessment models and in the integration of risk management. The designed platform can be accessed through a web portal, which allows users to explore the effects of different scenarios due to environmental changes with regards to land use planning.
2.4.1 Risk analysis
This part involves specific risk scenarios, which consist of a combination of probabilistic hazard scenarios with scenarios of exposed elements at risk and their vulnerabilities (Fig. 2). A probabilistic scenario seems the most feasible since large uncertainties are involved in predicting changes in risk. Hazard assessment at different scales seems flexible using various statistically or physically based models. In fact, hazard assessment consists of temporal probability in terms of duration and time of onset, hazard intensity, and spatial extent through exposure analysis. Remote sensing data and methods are used to delineate the spatial features of the parameters and constitute an innovative approach. Vulnerability refers to the degree of loss to each type of element at risk as related to hazard intensity, in which exposure means the spatial overlay of hazard and each element at risk. The term elements at risk refers to the type, the temporal variation and quantification, as well as the location, of the elements at risk through exposure as described above. The research effort focuses on the performance of these models with regards to data requirements and their effectiveness for risk assessment at different scales. This part contributes to quantitative risk assessment.
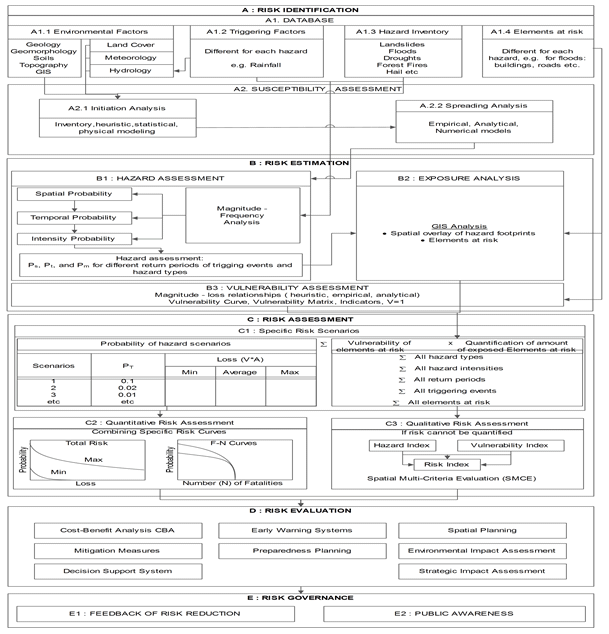
Figure 2Flow chart of risk analysis methodological procedure (adapted from Dalezios and Eslamian, 2016).
2.4.2 Quantitative risk assessment (QRA)
The combination of hazard scenarios along with vulnerability scenarios and quantification of elements at risk develops the QRA. In particular, the combination of all the specific risks leads to the total risk, as already mentioned, which constitutes the quantitative risk assessment (QRA). If risks cannot be quantified, the qualitative risk assessment involving indices should be used. This part contributes to risk evaluation.
2.5 Risk evaluation and adaptation to future changes
The aim of this component is to analyze all the risk management options and optimal tools based on the previous risk scenario results in order to achieve risk reduction eventually. Indeed, risk evaluation refers to the loss associated with each event. Risk evaluation involves environmental impact assessment (EIA) and strategic environmental assessment (SEA), land use planning, cost-benefit analysis (CBA) of adaptation options for the development of mitigation measures, and early warning plans. This is then combined with indicators of climate change impacts and vulnerabilities at different scales, including methodology for cost-effectiveness and uncertainty assessment of adaptation measures. Hazard and risk information can be integrated into EIA and SEA for future land use planning, as well as in the design of early warning systems and emergency response planning at local and regional levels. These approaches can then be integrated into a web-based platform in the form of a decision support system (DSS) for risk management, which also considers feedback on risk reduction. This development comes as an additional supplement for probabilistic risk assessment already described.
2.5.1 Risk evaluation
Risk evaluation consists of the loss associated with each event and involves cost-benefit analysis and policy issues. This part also involves methods or indicators for the estimation of adaptation options at different spatial and temporal scales. Indeed, risk evaluation involves environmental impact assessment (EIA) and strategic environmental assessment (SEA), land use planning, cost-benefit analysis of adaptation options for the development of mitigation measures, and early warning plans. Spatial multi-criteria evaluation (MCE) can be employed, which combines heterogeneous sets of different factors and constraints including hazard and risk information for spatial planning. All these are expected to lead to risk reduction.
2.5.2 Development of decision support system (DSS)
All the risk management options are used to evaluate the required changes in risk management approaches and are integrated into a web-based platform for risk management in terms of a multi-scale and interactive DSS. For the development of the DSS, there are certain phases that are followed starting from the intelligence phase involving the problem analysis, then the design phase for generation of alternatives and then the decision phase. Specifically, the decision phase involves several methods, including economic techniques, such as cost-benefit analysis (CBA), physical planning approaches, social impact assessment, environmental impact assessment (EIA) and multi-criteria evaluation (MCE), which consists of certain steps, namely formulation of objectives and procedure development for vulnerability assessment using indicators for social and physical vulnerability, as well as capacity.
2.6 Risk governance
Risk governance is an integration of all the rules, processes and mechanisms implemented and communicated within the risk management framework through the developed DSS for risk reduction. It is understood that there are differences in risk governance strategies between regions. In fact, sound risk evaluation requires both good science and good judgment. However, very few studies have followed risk assessment to analyze whether any protective action taken was effective. Indeed, at the present time the lack of such feedback constitutes a serious deficiency in the reduction of environmental hazards (Smith, 2013). Thus, there is a need for feedback on all the risk assessment exercises. This could justify the level of public awareness and response by the authorities. A more integrated consideration of risk management by institutions due to climate change can also be examined.
2.6.1 Feedback on risk reduction
The effectiveness of risk reduction measures is based on successful risk governance. It is necessary to consider both the QRA and the relevant aspects of risk perception. The methods of hazard and risk assessment described in previous components are demonstrated to local stakeholders and end users. The target is to achieve an agreement on risk reduction measures.
2.6.2 Dissemination of results and public awareness
The effectiveness of risk communication strategies is analyzed, and suitable information and training materials are developed for different stakeholders. Dissemination tools and activities can be employed for improving the level of public awareness and the extent of information spreading.
This section covers a conceptual description and definitions of the meteorological and environmental hazards and extremes, which is followed by case studies for each hazard in the wider area of Greece, eastern Mediterranean. According to the World Meteorological Organization (WMO, 2006), some natural hazards are weather events (tropical and extra-tropical cyclones, tornadoes, thunderstorms, lightning, hailstorms, high winds, snowstorms, freezing rain, dense fog, thermal extremes, and drought). Others are related to weather, climate and water (floods and flash floods, storm surges, high waves at sea, sand or dust storms, forest or bush fires, smoke and haze, landslides and mudslides, avalanches, and desert locust swarms). Each hazard is in some way unique. Tornadoes and flash floods are short-lived, violent events, affecting a relatively small area. Others, such as droughts, develop slowly but can affect most of a continent and entire populations for months or even years (Dalezios et al., 2017). An extreme weather event can involve multiple hazards at the same time or in quick succession. In addition to high winds and heavy rain, a tropical storm can result in flooding and mudslides. In temperate latitudes, severe summer weather (thunder and lightning storms or tornadoes) can be accompanied by heavy hail and flash floods. Winter storms with high winds and heavy snow or freezing rain can also contribute to avalanches on some mountain slopes and to high runoff or flooding later on in the melt season. Advances in meteorological hazards and extreme events reflect a wide range of meteorological hazards and extreme events using recorded datasets, model simulations and innovative methodologies. In the following, meteorological and environmental hazards and extremes are presented by means of their definitions and related citations. Furthermore, the analysis is enriched with characteristic case studies, mainly over the wider area of Greece.
3.1 Heat waves
A heat wave is commonly considered as a period of abnormally and uncomfortably hot weather with high air humidity. Typically, a heat wave lasts at least 2 d (Koppe et al., 2004). Nevertheless, a clear definition of heat waves has not yet been addressed by the World Meteorological Organization. Even though the heat wave concerns a meteorological phenomenon, it could not be assessed without reference to the related impacts on humans. So, it would be better to consider the human sensation of heat against determining specific thresholds of meteorological parameters. Robinson (2001) considers a heat wave as an extended period of uncommonly high atmosphere-related heat stress which causes temporary modifications in lifestyle habits and adverse health-related problems affecting humans. It is very likely that heat waves will occur with a higher frequency and duration by the late 21th century due to global warming (Beniston et al., 2007; IPCC, 2013; Tolika et al., 2014). Recent research has given evidence that “Mega-heat waves” such as the 2003 and 2010 events broke the 500-year-long seasonal temperature records over approximately 50 % of Europe (Barriopedro et al., 2011; Katsafados et al., 2014). In summer 2003, in a large area of central Europe, temperatures exceeded the 1961–1990 mean by about 3 ∘C, corresponding to an excess of up to 5 SDs (standard deviations) (Schär et al., 2004). In major cities of Europe, the daily maximum temperature exceeded 35 ∘C for more than a week, causing about 70 000 excess deaths in parts of southern, western and central Europe (Robine et al., 2006; Vandentorren et al., 2006). More specifically, Matzarakis and Nastos (2011) made an effort to identify heat waves in Athens, Greece, by using the physiologically equivalent temperature (PET), a human thermal index based on the energy balance of the human body. They used consecutive days (three and more) and the duration of each heat wave for PET ≥ 35 ∘C (the threshold of extreme heat stress; Matzarakis et al., 1999) and Tamin≥23 ∘C (the threshold that represents PET values of thermal neutrality; Nastos and Matzarakis, 2008) in order to quantify the duration of heat waves and their impacts (Fig. 3).

Figure 3Consecutive number of days with PET ≥ 35 ∘C (upper graph) and Tamin≥23 ∘C (lower graph) for Hellenikon/Athens during the period 1955–2001. The number in the bars indicates the duration in days for each heat wave recorded (adapted from Matzarakis and Nastos, 2011).
There is no clear pattern for the number of consecutive days with respect to PET ≥ 35 ∘C, but a statistically significant (at confidence level, CL, 95 %) increasing trend of the maximum duration of heat waves within the year (b=1.33 d yr−1, p=0.000) has been observable since 1983. In addition, the number of heat waves (HWs) within the year appears to be a statistically significant (at confidence level 95 %) trend (b=0.26 HW yr−1, p=0.000) from 1983 onwards. Regarding the consecutive days with Tamin≥23 ∘C, a statistically significant trend (at confidence level 95 %) for the number of heat waves within the year (b=0.15 HW yr−1, p=0.048) appears from 1983 onwards, while there is not a statistically significant trend of the maximum duration of heat waves within the year (b=0.07 d yr−1, p=0.344).
3.2 Extreme air temperature indices
The extreme air temperature indices can be divided into three categories: absolute, percentile and duration indices, defined by the joint CCl/CLIVAR/JCOMM Expert Team (ET) on Climate Change Detection and Indices (Alexander et al., 2006; Burić et al., 2014). The absolute indices concern the following: summer days, SU25 (number of days with daily maximum temperature above 25 ∘C); tropical days, SU30 (number of days with daily maximum temperature above 30 ∘C); tropical nights, TR20 (number of days with daily minimum temperature above 20 ∘C); frost days, FD0 (days with absolute minimum temperature below 0 ∘C); maximum of daily maximum temperature, TXx (let Txj be the daily maximum temperatures in period j. The maximum of daily maximum temperature is then ); and maximum of daily minimum temperature, TNx (let Tnj be the daily minimum temperatures in period j. The maximum of daily minimum temperature is then ). The percentile indices concern the following: warm days, TX90p (the number of days with daily maximum temperature above the 90th percentile calculated for each calendar day, on the basis of 1961–1990, using a running 5 d window); warm nights, TN90p (the number of days with daily minimum temperature above the 90th percentile calculated for each calendar day, on the basis of 1961–1990, using a running 5 d window); cold days, TX10p (the number of days with daily maximum temperature below the 10th percentile calculated for each calendar day, on the basis of 1961–1990, using a running 5 d window); and cold nights, TN10p (the number of days with daily minimum temperature below the 10th percentile calculated for each calendar day, on the basis of 1961–1990, using a running 5 d window). The duration index concerns the warm spell duration indicator, WSDI (let Txij be the daily maximum temperature on day i in period j and let Txin90 be the calendar day 90th percentile centered on a 5 d window; Zhang et al., 2005). Then the number of days per period is summed in which, in intervals of at least 6 consecutive days, Txij>Txin90. For spell/duration indices, a spell can continue into the next year and is counted against the year in which the spell ends. Nastos and Kapsomenakis (2015) examined future projected patterns for extreme indices of air temperature in Greece using the simulations from six RCMs, which were employed for the reference (1961–1990), near (2031–2050) and far (2071–2100) future periods. Results showed widespread significant changes in temperature extremes associated with projected warming especially in the far future under Special Report on Emissions Scenarios A1B (SRES A1B). The simulations revealed a remarkable contrast of land–maritime air temperature extremes due to different thermal characteristics between land and sea. Figure 4 depicts the ensemble means of maximum daily maximum temperature (TXx) (left graphs) and maximum daily minimum temperature (TNx) (right graphs) for the reference period (Fig. 4a and b), along with changes of near future (Fig. 4c and d) and far future (Fig. 4e and f) from the reference period. More specifically, the increase in TXx in the near future is projected to be 2.4–3.0 ∘C over land against 2.0–2.2 ∘C over sea (Fig. 4c), while a higher increase is anticipated in the far future – namely 4.4–5.4 ∘C for continental Greece and 3.6–4.2 ∘C over sea (Fig. 4e). The increase in TNx in the near future is projected to be 2.6–2.8 ∘C over land against 2.0–2.4 ∘C over sea (Fig. 4d), while a higher increase will take place for the projections in the far future, namely 4.6–5.4 ∘C for continental Greece and 3.6–4.4 ∘C over sea (Fig. 4f).
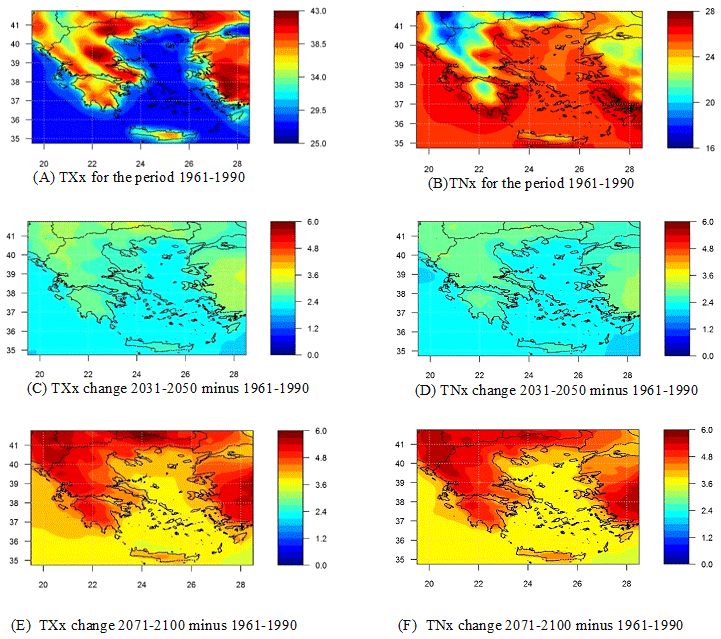
Figure 4Spatial distribution of ensemble means of maximum daily maximum temperature (TXx) (a, c, e) and maximum daily minimum temperature (TNx) (b, d, f) for the reference period (a, b), along with changes of near future (c, d) and far future (e, f) from the reference period. The color scale concerns degrees Celsius (∘C) (adapted from Nastos and Kaposmenakis, 2015).
3.3 Tornadoes and waterspouts
The tornado is a violently whirling column of air in contact with the ground or hanging from a cumulonimbus and often (but not always) visible as a funnel cloud. The tornadoes and waterspouts are identical phenomena, the first definition is used over land and the second over sea. The horizontal extent of the tornado reaches even 250 m, and the speed of movement is relatively small (8–20 m s−1). The speed of the spinning column of air in the central region reaches 100 m s−1 but can also exceed these speeds reaching 200 m s−1. At the same time the vertical movements of the air are very powerful. The pressure gradient from the periphery to the center of tornado presents a remarkable fall and can reach 25 hPa, having as a result to intensify the rotational movement of the wind. The path traveled by a tornado is relatively small, 10 km, reaching in specific cases 200 km, having a life period of 4–5 h. The passage of a tornado causes major damage due to stormy winds and the sharp drop in atmospheric pressure.
Tornadoes are extreme phenomena associated with severe convective storms. The Greek philosopher Aristotle (384–322 BC) in Meteorologica presented perhaps the most renowned exposition of natural extreme phenomena: “So the whirlwind originates in the failure of an incipient cyclone to escape from its cloud. It is due to the resistance the eddy generates and emerges when the spiral descends to the earth dragging along the cloud that cannot shake off. When blowing in a straight line it carries along whatever comes by in a circular motion and overturns and snatches up whatever it meets” (Lee, 1952). Tornadoes occur in many parts of the world (Fujita, 1973). Several publications during the last several decades have presented historical records concerning tornadic activity (e.g., Meaden, 1976; Tooming and Peterson, 1995; Peterson, 1998; Reynolds, 1999; Tyrrell, 2003; Macrinoniene, 2003; Dotzek, 2003; Nastos and Matsangouras, 2010; Gayà et al., 2000; Brázdil et al., 2012; Rauhala et al., 2012; Haghroosta et al., 2014). As far as tornadic activity over Greece is concerned, a comprehensive spatial distribution of a total of 612 events (171 tornadoes, 374 waterspouts and 67 funnel clouds) recorded in 405 d was presented (Matsangouras et al., 2014a, b: Nastos and Matsangouras, 2014) as there were several days with multiplied events within the period 1709–2012 (Fig. 5). This study gives evidence that even in an eastern Mediterranean region these extreme atmospheric phenomena are abundant, causing catastrophic impacts on infrastructures and in many cases loss of life.
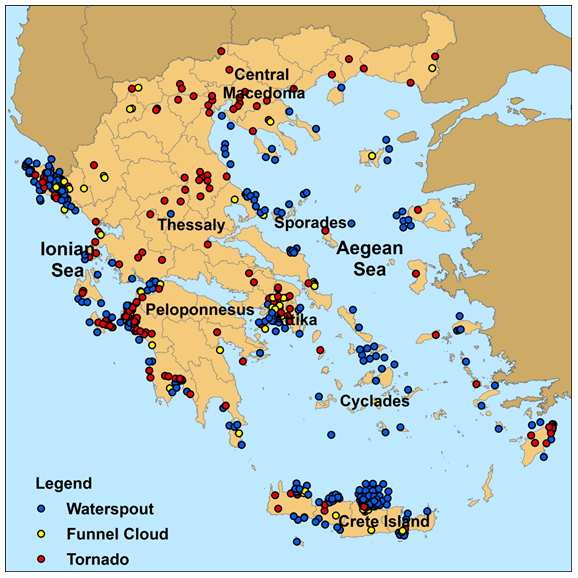
Figure 5Spatial variability of tornadoes, waterspouts and funnel clouds over Greece for the period 1709–2012. Numerous tornadic events lie under the tornadic type symbols due to low resolution of the image (adapted from Matsangouras et al., 2014a).
Fundamental processes of waterspout formation and the identification of the water-surface signatures of waterspouts in relation to their development stage and intensity were described by Golden (1974a, b, 1977, 2003) in which the following five stages of waterspout were identified: (1) the dark spot, (2) the spiral pattern, (3) the spray ring, (4) the mature waterspout and (5) the decay stage. Waterspouts rotate either cyclonically or anticyclonically, having surface diameters between 5 and 75 m; they receive their vorticity from local horizontal wind shear. The air temperature and pressure perturbations observed within waterspouts vary from 0.2 to 2.5 K and from 10 to 90 hPa, respectively. Waterspouts usually form under convective clouds, while regions of local horizontal shear lines, separating the updrafts from downdrafts, are favored for waterspout genesis (Golden, 1974a; Leverson et al., 1977; Hess and Spillane, 1990), although this condition is a necessary but not sufficient condition for waterspout formation (Simpson et al., 1986).
3.4 Medicanes
Mediterranean tropical-like cyclones (TLCs), known as medicanes, are mesoscale extreme low-pressure systems resembling the structure of tropical cyclones as they are captured by satellites. Two areas have experienced a larger number of medicane formation: the western Mediterranean and the wider area of the Ionian Sea with limited occurrence in the Aegean Sea and eastern Mediterranean. Figure 6 illustrates the seasonal geographical distribution of medicane occurrence over the Mediterranean within the period 1969–2014 (Nastos et al., 2018).
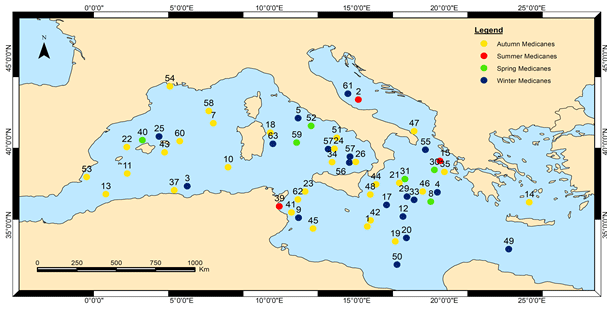
Figure 6Seasonal geographical distribution of medicane occurrence (yellow color for autumn, red color for summer, green color for spring and blue color for winter) over the Mediterranean during the study period 1969–2014 (adapted from Nastos et al., 2018).
Their intensity appears much weaker than tropical hurricanes; however, some of them have reached tropical hurricane strengths (Akhtar et al., 2014). Emanuel (2005) indicated that their genesis is triggered when an upper-level cut-off low is advected over an area, resulting in air mass lifting and cooling causing convective instability. Their structure and evolution (Pytharoulis et al., 2000; Homar et al., 2003; Moscatello et al., 2008) and the model physics in simulating the structure and intensity are of high concern (Miglietta et al., 2015). These mesoscale systems with a diameter usually less than 300 km have a rounded structure and a warm core, as well as intensely low sea level pressure (Businger and Reed, 1989). Strong winds, heavy precipitation and thunderstorms are associated with the incidence of medicanes, causing occasional severe damage to private property, agriculture and communication networks or resulting in flooding of populated areas, posing a risk to human life (Fig. 7).
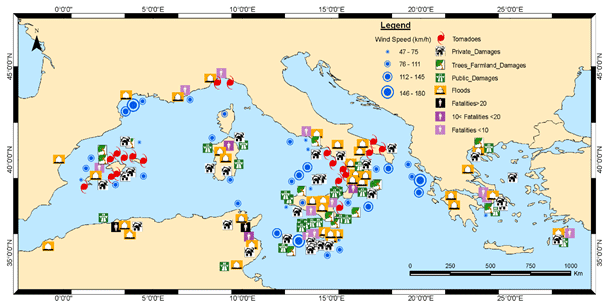
Figure 7Geographical distribution of medicane impacts over the Mediterranean during the study period 1969–2014 (adapted from Nastos et al., 2018).
In a recent study (Mylonas et al., 2019), the higher spatial horizontal resolution of a TLC event, south of Sicily on 7–8 November 2014, through a physics parameterization sensitivity analysis, allows for improved simulations in most setups that were tested in terms of trajectory and TLC structure.
3.5 Extreme precipitation indices and heavy convective precipitation
3.5.1 Extreme precipitation indices
The extreme precipitation indices can be divided in three categories: absolute, percentile and duration indices, defined by the joint CCl/CLIVAR/JCOMM Expert Team (ET) on Climate Change Detection and Indices (Alexander et al., 2006). The absolute threshold indices concern the following: number of heavy precipitation days (number of days with daily precipitation amount above 10 mm), number of very heavy precipitation days (number of days with daily precipitation amount above 20 mm) and simple daily intensity index (daily precipitation amount on wet days in a period per number of wet days in the period) (Benhamrouche et al., 2015). The percentile indices concern the following: very wet days (the number of days with daily precipitation amount above the 95th percentile from the examined period) and extremely wet days (the number of days with daily precipitation amount above the 99th percentile from the examined period). The duration indices concern consecutive dry days (the largest number of consecutive days with daily precipitation amount below 1 mm) and consecutive wet days (the largest number of consecutive days with daily precipitation amount above 1 mm). A recent research by Kostopoulou et al. (2014) presents the spatial patterns and temporal trends in temperature and precipitation and their extremes in the eastern Mediterranean and Middle East region (EMME) using output from the Hadley Centre PRECIS climate model. The model projects drying trends by 5 %–30 % in annual precipitation towards the end of the 21st century, with the number of wet days decreasing at the rate of 10–30 d yr−1, while heavy precipitation is likely to decrease in the high-elevation areas by 15 d yr−1.
3.5.2 Heavy convective precipitation
Heavy precipitation typically occurs with moist deep convection. The excess water vapor in rising air parcels condenses to form a cloud. The heat released through this condensation can help to sustain the convection by warming the air further and making it rise still higher, which causes more water vapor to condense, so the process feeds on itself. Doswell et al. (1996) have concluded that in order to produce moist deep convection three ingredients are needed: (1) the environmental lapse rate must be conditionally unstable, (2) there must be enough lifting so that a parcel will reach its level of free convection, and (3) there must be enough moisture present that a rising parcel's associated moist adiabat has a level of free convection. In midlatitudes, convective precipitation is associated with cold fronts (often behind the front), squall lines and warm fronts in very moist air. Graupel and hail indicate convection. Moreover, warm rain, precipitation produced solely through condensation and accretion of liquid, is known to be important in the tropics (Rogers, 1967; Houze, 1977). However, the warm rain process may also play a critical role in heavy convective precipitation events in midlatitudes as well, resulting in many flash floods and landslides (Segoni et al., 2014a, b). A number of researchers have noted the importance of convection and especially mesoscale convective systems in producing warm season precipitation. Heideman and Fritsch (1984) estimated that about half of warm season precipitation over the United States is produced directly by mesoscale systems or phenomena. In long lasting, circular shaped, convective systems, using satellite imagery found that such systems accounted for approximately 30 % to 70 % of warm season precipitation between the Rocky Mountains and Mississippi River. Extreme weather events, including heavy rain, lightnings, waterspouts and severe wind gusts, occur due to the interaction between large-scale environmental conditions and local conditions, related to pure convection. Specifically, Nastos et al. (2014) showed that the seasonal distribution of cloud-to-ground (CG) lightning activity frequency coincides well with the regional climatic convective characteristics of Greece; namely CG strokes are dominant over land and coastal areas during summer and spring compared to over warm water bodies of the Aegean and Ionian seas during the other seasons. Convective conditions and summer showers are a frequent phenomenon in the greater Athens area, Greece (Feloni et al., 2019). A recent research campaign concerns the COnvective Precipitation Experiment (COPE), which was a joint UK–US field campaign held during the summer of 2013 in the southwest peninsula of England and designed to study convective clouds that produce heavy rain leading to flash floods. The clouds form along convergence lines that develop regularly due to the topography. The overarching goal of COPE is to improve quantitative convective precipitation forecasting by understanding the interactions of the cloud microphysics and dynamics and thereby to improve NWP model skill for forecasts of flash floods (Leon et al., 2016). Moreover, weather research and forecasting (WRF) simulations were carried out to examine the sensitivity of the rainfall distribution in and around the urban area to different urban land surface model representations and urban land use scenarios (Alexakis et al., 2014). Simulation results suggest that urbanization plays an important role in precipitation distribution even in settings characterized by strong large-scale forcing (Yang et al., 2014). Nastos et al. (2017) concluded that the urbanization of Athens, Greece, due to the rapid increase in the population and the number of vehicles over the last decades had remarkable impacts on the mean annual rain intensity and annual number of days for rain events over 10, 20 and 30 mm. The analysis of the rain intensity for Athens (Fig. 8, left graphs) revealed a statistically significant (CL 95 %) positive trend (+0.03 mm h−1 yr−1) for rain events over 10 mm during the examined period 1930–2004, while stronger trends, statistically significant (CL 95 %) within the period 1990–2004, with respect to the rain threshold of 10 mm (+0.46 mm h−1 yr−1) and 20 mm (0.48 mm h−1 yr−1) appear. Similar results have been found with respect to the annual number of days with daily rain totals ≥10, 20 and 30 mm (Fig. 8, right graphs). Many studies have given evidence that the urban heat island (UHI) triggers convective precipitation in Atlanta (Bornstein and Lin, 2000), in Beijing City (Guo et al., 2006), in Tokyo (Yonetani, 1982), in London, in Ankara (Cicek and Turkoglu, 2005), and in Athens (Nastos and Zerefos, 2007; Giannaros et al., 2014).
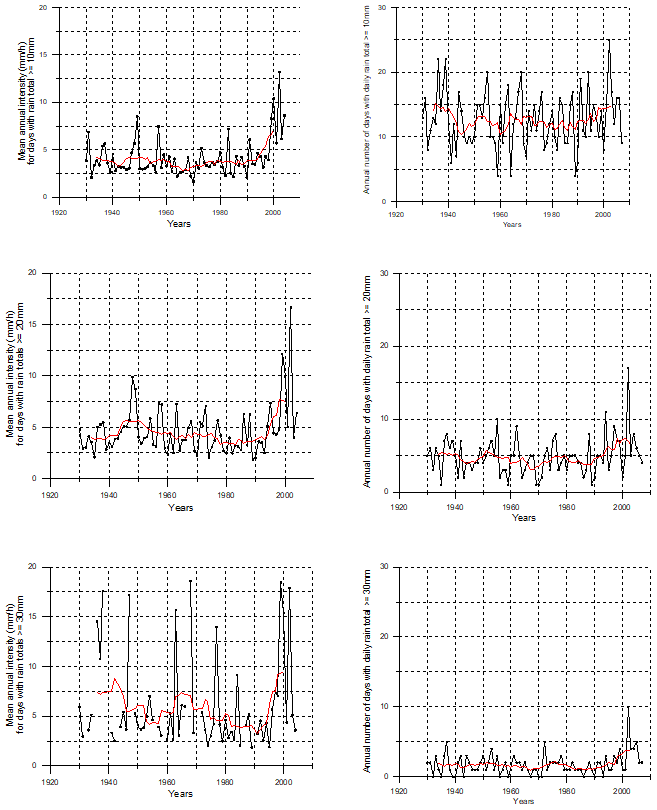
Figure 8Mean annual rain intensity (mm h−1) (left graphs) and annual number of days (right graphs) with daily rain totals ≥ 10, 20 and 30 mm, along with the 9 points moving average fitting (red line), for Athens during the period 1930–2004 (adapted from Nastos et al., 2017).
3.6 Droughts
Drought is a natural, casual and temporary state of continuous decline in precipitation and water availability in relation to normal values, spanning a considerable period and covering a wide area. It is discriminated into meteorological, hydrological and agricultural drought (Dalezios et al., 2020; Dalezios, 2018). It is a local phenomenon identified by the intensity, duration and extent. Drought impacts concern a variety of sectors of the economy, environment and society of the affected area (Wang, 2005; Mechler et al., 2010; Dalezios et al., 2012). The identification of dry areas was considered two millennia ago. The classical Greek thought acknowledged that the latitude affects the arid, temperate and cold zones of the earth. There was a perception that the arid climates in low latitudes were dry (Nastos et al., 2013). The evaluation of drought is accomplished by the drought indices, the most important of which and widely used are the aridity index (AI), which is based on the ratio of annual precipitation and potential evapotranspiration rates (UNESCO, 1979), the standardized precipitation index (SPI), which is based on the probability of precipitation for any timescale (McKee et al., 1993), Palmer drought severity index (PDSI), which is a soil moisture algorithm calibrated for relatively homogeneous regions (Palmer, 1965) and reclamation drought index (RDI), which is based on a calculation of drought at the river basin level, incorporating temperature, precipitation, snowpack, stream flow and reservoir levels as input (Weghorst, 1996). Reconnaissance drought index (RDI) proposed by Tsakiris et al. (2007) is one of the most recent developments in the field of meteorological drought indices. Essentially, it relates precipitation to the potential evapotranspiration at a location and can be considered as an extension of the SPI (Dalezios et al., 2012). The development of Earth observation satellites from the 1980s onwards promoted the drought monitoring and detection. The most prominent vegetation index is certainly the normalized difference vegetation index (NDVI; Tucker, 1979) which was first applied to drought monitoring by Tucker and Choudhury (1987). The index NDVI, by itself, does not depict drought or drought conditions, but the severity of drought can be defined as the deviation from the mean NDVI value of a long period (DEVNDVI). Nastos et al. (2013) studied the spatiotemporal patterns of the aridity index (AI) in Greece, per decade, during 1951–2000 and the projected changes in ensemble mean AI between the period 1961–1990 (reference period) and the near future (2021–2050) and far future (2071–2100), simulated by a number of regional climatic models (RCMs) within the ENSEMBLE European project under SRES A1B. They illustrated a progressive shift from the “humid” class, which characterized the wider area of Greece, towards the “sub-humid” and “semi-arid” classes appearing in eastern Crete, the Cyclades complex, the island of Evia and Attica, the area of which is mainly eastern Greece and which is most pronounced within the period 1991–2000 (Fig. 9). Drier conditions are anticipated to appear in subregions of Greece (Attica, eastern continental Greece, Cyclades, Dodecanese, eastern Crete and northern Aegean).

Figure 9Spatial distribution of the aridity index per decade for the period 1951–2000, based on stations' data (adapted from Nastos et al., 2013).
Similar results have been extracted by Polychroni and Nastos (2017), who found decreasing trends in the annual SPI in Greece and western Turkey against increasing trends in northeastern Europe and northwestern Africa, both statistically significant (at 95 % CL), during the period 1981–2010 (Fig. 10). The atmospheric circulation, by means of North Atlantic Oscillation index (NAOI) and North Sea Caspian Pattern index (NCPI), seems to influence SPI variability, making the climate drier or wetter depending on the phase of the indices. Dalezios et al. (2014) identified the agricultural drought in Thessaly, which is the major agricultural drought-prone region of Greece, characterized by vulnerable agriculture, by the implementation of the vegetation health index (VHI), which is based on satellite data of temperature and the normalized difference vegetation index (NDVI). The results show that agricultural drought appears every year during the warm season in the region. The severity of drought is increasing from mild to extreme throughout the warm season, with peaks appearing in the summer. Similarly, the areal extent of drought is also increasing during the warm season, whereas the number of extreme drought pixels is much less than those of mild to moderate drought throughout the warm season.
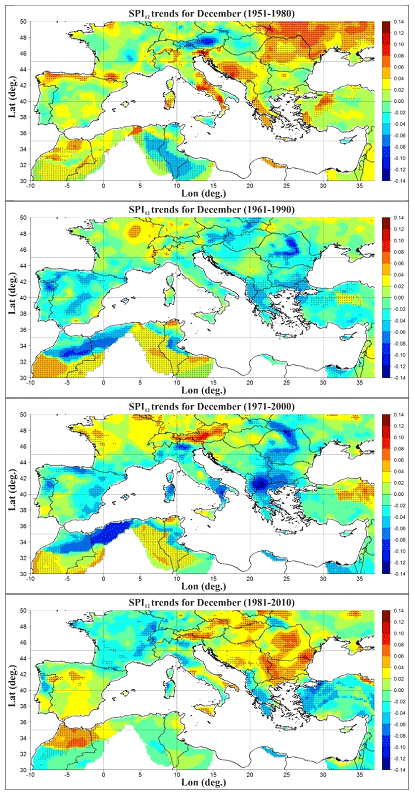
Figure 10Evolution of December SPI12 trends over consecutive 30-year periods (annual; January to December). The values with an asterisk (*) refer to statistically significant trends at 95 % CL (adapted from Polychroni and Nastos, 2017).

Figure 11Mean number of critical fire risk days for the control period (1961–1990) (a–c), differences between the near future (2021–2050) and the control period (d–f), and differences between the distant future (2071–2100) and the control period (g–i). Columns correspond to the mean number of days with fire weather index (FWI) values above the critical fire risk threshold for different subregions: western Greece (a, d, g), northern Greece (b, e, h), and eastern and southern Greece (c, f, i) (adapted from Karali et al., 2014).
3.7 Wildfires
The frequency of large wildfires and the total area burned have been steadily increasing, with global warming being a major contributing factor. Drier conditions will increase the probability of fire occurrence. Longer fire seasons will result as spring runoff occurs earlier, summer heat builds up more quickly, and warm conditions extend further into fall (Running, 2006). More fuel for forest fires will become available because warmer and drier conditions are conducive to widespread beetle and other insect infestations, resulting in broad ranges of dead and highly combustible trees (Joyce et al., 2008). Increased frequency of lightning is expected as thunderstorms become more severe (Price, 2009). Heat waves, droughts and cyclical climate changes such as El Niño can also have a dramatic effect on the risk of wildfires, although more than four out of every five wildfires are caused by people. There is a variety of fire danger rating systems used worldwide, including the Canadian Forest Fire Weather Index System (CFFWIS) used in Canada (van Wagner, 1987), the National Fire Danger Rating System (NFDRS) used in the USA (Deeming et al., 1977) and the McArthur Forest Fire Danger Index (FFDI) used in Australian forests (Mc Arthur, 1967). In Europe, some well-known indices include the Finnish Forest Fire Index (FFI), developed by the Finnish Meteorological Institute (Venäläinen and Heikinheimo, 2003), the Portuguese index (ICONA, 1988) and the Italian index (IREPI) proposed by Bovio et al. (1984). Karali et al. (2014) evaluated the Canadian fire weather index (FWI) over Greece by suggesting three critical fire risk threshold values: FWI = 15 for western Greece, FWI = 30 for northern Greece and FWI = 45 for eastern Greece. Future fire risk projections suggest a general increase in fire risk over the domain of interest, with a very strong impact in the eastern Peloponnese, Attica, central Macedonia, Thessaly and Crete. In the near future, 15 to 20 additional critical fire risk days are expected in western and northern Greece. For eastern and southern Greece, the increase reaches up to 10 d yr−1. For the distant future, the same pattern applies, with an increase of 30 to 40 d for western and northern Greece and 20 to 30 for eastern and southern Greece (Fig. 11).
The objective of this review paper is twofold: to present the risk management framework of meteorological hazards and extremes and to analyze the results and case studies for each of the three steps of risk assessment for several meteorological and environmental hazards in the wider area of Greece, eastern Mediterranean. More specifically, a comprehensive presentation of the risk management framework related to meteorological hazards and extremes is introduced, followed by a description of the concepts of meteorological hazards. On the other hand, the analysis is enriched with characteristic case studies, mainly over the wider area of Greece. The readers of this paper will benefit from understanding the physical systems and environmental processes in an integrated manner. Last but not least, the authors consider that this scientific effort contributes to the existing knowledge of modeling and assessing meteorological hazards and extreme events, appearing mainly in the wider area of Greece in the eastern Mediterranean, a vulnerable area taking into consideration the impacts of climate change on the intensity and frequency of large-scale environmental hazards, like droughts, heat waves and floods.
Data are available upon request.
PTN and NRD designed the organization and did the revision and editing. INF, MS and KM compiled and organized Sect. 2 (Risk management framework). AB, SS, PS and AMT compiled and organized Sect. 3 (Meteorological and environmental hazards). All authors contributed to Summary and conclusions.
The authors declare that they have no conflict of interest.
Publisher's note: Copernicus Publications remains neutral with regard to jurisdictional claims in published maps and institutional affiliations.
The authors are deeply grateful to the anonymous referees and the editor for the thoughtful comments.
This paper was edited by Paolo Tarolli and reviewed by two anonymous referees.
Akhtar, N., Brauch, J., Dobler, A., Béranger, K., and Ahrens, B.: Medicanes in an ocean–atmosphere coupled regional climate model, Nat. Hazards Earth Syst. Sci., 14, 2189–2201, https://doi.org/10.5194/nhess-14-2189-2014, 2014.
Alexakis, D. D., Grillakis, M. G., Koutroulis, A. G., Agapiou, A., Themistocleous, K., Tsanis, I. K., Michaelides, S., Pashiardis, S., Demetriou, C., Aristeidou, K., Retalis, A., Tymvios, F., and Hadjimitsis, D. G.: GIS and remote sensing techniques for the assessment of land use change impact on flood hydrology: the case study of Yialias basin in Cyprus, Nat. Hazards Earth Syst. Sci., 14, 413–426, https://doi.org/10.5194/nhess-14-413-2014, 2014.
Alexander, L. V., Zhang, X., Peterson, T. C., Caesar, J., Gleason, B., Klein Tank, A. M. G., Haylock, M., Collins, D., Trewin, B., Rahimzadeh, F., Tagipour, A., Rupa Kumar, K. M., New, M., Zhai, P., Rusticucci, M., and Vazquez-Aguirre, J. L.: Global observed changes in Revadekar, J., Griffiths, G., Vincent, L., Stephenson, D. B., Burn, J., Aguilar, E., Brunet, M., Taylor, M., New, M., Zhai, P., Rusticucci, M., and Vazquez-Aguirre, J. L.: Global observed changes in daily climate extremes of temperature and precipitation, J. Geophys. Res., 111, D05109, https://doi.org/10.1029/2005JD006290, 2006.
Barriopedro, D., Fischer, E. M., Luterbacher, J., Trigo, R. M., and García-Herrera, R.: The Hot Summer of 2010: Redrawing the Temperature Record Map of Europe, Science, 332, 220–224, https://doi.org/10.1126/science.1201224, 2011.
Benhamrouche, A., Boucherf, D., Hamadache, R., Bendahmane, L., Martin-Vide, J., and Teixeira Nery, J.: Spatial distribution of the daily precipitation concentration index in Algeria, Nat. Hazards Earth Syst. Sci., 15, 617–625, https://doi.org/10.5194/nhess-15-617-2015, 2015.
Beniston, M., Stephenson, D. B., Christensen, O. B., Ferro, C. A. T., Frei, C., Goyette, S., Halsnaes, K., Holt, T., Jylhä, K., Koffi, B., Palutikof, J., Schöll, R., Semmler, T., and Woth, K.: Current and future extreme climatic events in Europe: observations and modeling studies conducted within the EU PRUDENCE project, Climatic Change, 81, 71–95, 2007.
Bornstein, R. and Lin, Q.: Urban Heat Island and Summer Time Convective Thunderstorms in Atlanta: Three Case Studies, Atmos. Environ., 34, 507–516, https://doi.org/10.1016/S1352-2310(99)00374-X, 2000.
Bovio, G., Quaglino, A., and Nosenzo, A.: Individuazione di un indice di previsione per il Pericolo di Incendi Boschivi, Montie Boschi Anno XXXV(4), Boca Raton, Florida, USA, 39–44, 1984.
Brázdil, R., Chromá, K., Dobrovolný, P., and Černoch, Z.: The tornado history of the Czech Lands, AD 1119–2010, Atmos. Res., 118, 193–204, 2012.
Burić, D., Luković, J., Ducić, V., Dragojlović, J., and Doderović, M.: Recent trends in daily temperature extremes over southern Montenegro (1951–2010), Nat. Hazards Earth Syst. Sci., 14, 67–72, https://doi.org/10.5194/nhess-14-67-2014, 2014.
Businger, S. and Reed, R.: Cyclogenesis in cold air masses, Weather Forecast., 20, 133–156, 1989.
Cicek, I. and Turkoglu, N.: Urban Effects on Precipitation in Ankara, Atmosfera, 18, 173–187, 2005.
Dalezios, N. R. (Ed.): Environmental Hazards Methodologies for Risk Assessment and Management, IWA, London, UK, ISBN 9781780407128, p. 534, 2017.
Dalezios, N. R.: Drought and Remote Sensing: An Overview, in: Book chap. 1, Remote Sensing of Hydrometeorological Hazards, edited by: Petropoulos, G. P. and Islam, T., Taylor and Francis, Boca Raton, Florida, USA, 3–32, 2018.
Dalezios, N. R. and Eslamian, S.: Regional Design Storm for Greece within the Flood Risk Management Framework, Int. J. Hydrol. Sci. Technol., 6, 82–102, 2016.
Dalezios, N. R., Loukas, A., Vasiliades, L., and Liakopoulos, H.: Severity-Duration-Frequency Analysis of Droughts and Wet Periods in Greece, Hydrol. Sci., 45, 751–769, 2000.
Dalezios, N. R., Blanta, A., and Spyropoulos, N. V.: Assessment of remotely sensed drought features in vulnerable agriculture, Nat. Hazards Earth Syst. Sci., 12, 3139–3150, https://doi.org/10.5194/nhess-12-3139-2012, 2012.
Dalezios, N. R., Blanta, A., Spyropoulos, N. V., and Tarquis, A. M.: Risk identification of agricultural drought for sustainable Agroecosystems, Nat. Hazards Earth Syst. Sci., 14, 2435–2448, https://doi.org/10.5194/nhess-14-2435-2014, 2014.
Dalezios, N. R., Tarquis, A. M., and Eslamian, S.: Drought Assessment and Risk Analysis, in: Book chap. 18 in Vol. 1 of 3-Volume Handbook of Drought and Water Scarcity (HDWS), edited by: Eslamian, S., Taylor and Francis, Boca Raton, Florida, USA, 323–343, 2017.
Dalezios, N., Petropoulos, G. P., and Faraslis, I. N.: Concepts and Methodologies of Environmental Hazards and Disasters, in: chap. 1, Techniques for Disaster Risk Management and Mitigation, edited by: Srivastava, P. K., Singh, S. K., Mohanty, U. C., and Murty, T., AGU-Wiley, Washington, DC, USA, 3–22, ISBN-10: 111935918X, April 2020.
Deeming, J. E., Burgan, R. E., and Cohen, J. D.: The National Fire-Danger Rating System – 1978, USDA Forest Service General technical Report INT-39, Intermountain Forest and Range Experiment Station, Ogden, UT, 1977.
Doswell, C. A., Brooks, H. E., and Maddox, R. A.: Flash flood forecasting: An ingredients-based methodology, Weather Forecast., 11, 560–581, 1996.
Dotzek, N.: An updated esti mate of tornado occurrence in Europe, Atmos. Res., 67–68, 153–161, 2003.
Emanuel, K.: Genesis and maintenance of “Mediterranean hurricanes”, Adv. Geosci., 2, 217–220, https://doi.org/10.5194/adgeo-2-217-2005, 2005.
Feloni, E. G., Baltas, E. A., Nastos, P. T., and Matsangouras, I. T.: Implementation and evaluation of a convective/stratiform precipitation scheme in Attica region, Greece, Atmos. Res., 220, 109–119, 2019.
Fujita, T. T.: Tornadoes around the world, Weatherwise, 26, 56–83, 1973.
Gayà, M., Homar, V., Romero, R., and Ramis, C.: Tornadoes and waterspouts in the Balearic Islands: Phenomena and environment characterization, Atmos. Res., 56, 253–267, 2000.
Giannaros, T. M., Melas, D., Daglis, I. A., and Keramitsoglou, I.: Development of an operational modeling system for urban heat islands: an application to Athens, Greece, Nat. Hazards Earth Syst. Sci., 14, 347–358, https://doi.org/10.5194/nhess-14-347-2014, 2014.
Golden, J. H.: An assessment of waterspout frequencies along the U.S. east and Gulf states, J. Appl. Meteorol., 16, 231–236, 1977.
Golden, J. H.: The life cycle of Florida Keys' waterspouts I, J. Appl. Meteorol., 13, 676–692, 1974a.
Golden, J. H.: Scale-interaction implications for the waterspout life cycle II, J. Appl. Meteorol., 13, 693–709, 1974b.
Golden, J. H.: Waterspouts, in: Encyclopedia of Atmospheric Sciences, edited by: Holton, J. R., Academic Press, Oxford, 2510–2525, https://doi.org/10.1016/B0-12-227090-8/00451-6, 2003.
Guo, L. X., Fu, H. D., and Wang, J.: Mesoscale convective precipitation system modified by urbanization in Beijing City, Atmos. Res., 82, 112–126, 2006.
Haghroosta, T., Ismail, W. R., Ghafarian, P., and Barekati, S. M.: The efficiency of the Weather Research and Forecasting (WRF) model for simulating typhoons, Nat. Hazards Earth Syst. Sci., 14, 2179–2187, https://doi.org/10.5194/nhess-14-2179-2014, 2014.
Heideman, K. F. and Fritsch, J. M.: A quantitative evaluation of the warm-season QPF problem, in: Preprints Tenth Conf. on Weather Forecasting and Analysis, Clearwater Beach, Amer. Meteor. Soc., Boston, MA, USA, 57–64, 1984.
Hess, G. D. and Spillane, K. T.: Waterspouts in the Gulf of Carpentaria, Aust. Meteorol. Mag., 38, 173–180, 1990.
Homar, V., Romero, R., Stensrud, D. J., Ramis, C., and Alonso, S.: Numerical diagnosis of a small, quasi-tropical cyclone over the western Mediterranean: Dynamical vs. boundary factors, Q. Roy. Meteorol. Soc., 129, 1469–1490, 2003.
Houze, R. A.: Structure and dynamics of a tropical squall-line system, Mon. Weather Rev., 105, 1540–1567, 1977.
ICONA: Experimentacion de un nuevo sistema para determinacion del peligro de incendios forestales derivado de los combustibles:instrucciones de calculo, Instituto Nacional para la Conservacion de la Naturaleza, Madrid, Spain, 1988.
IPCC: Managing the Risks of Extreme Events and Disasters to Advance Climate Change Adaptation, Special Report of IPCC, Cambridge University Press, Cambridge, UK, p. 594, 2012.
IPCC: Summary for Policymakers, in: Climate Change 2013, The Physical Science Basis, Contribution of Working Group I to the Fifth Assessment Report of the Intergovernmental Panel on Climate Change, Cambridge University Press, Cambridge, UK and New York, NY, USA, 2013.
Joyce, L. A., Blate, G. M., Littell, J. S., McNulty, S.G., Millar, C. I., Moser, S. C., Neilson, R. P., O'Halloran, K., and Peterson, D. L.: National Forests, In: Preliminary review of adaptation options for climate-sensitive ecosystems and resources, in: A Report by the U.S. Climate Change Science Program and the Subcommittee on Global Change Research, US Environmental Protection Agency, Washington, DC, USA, 3-1–3-127, 2008.
Karali, A., Hatzaki, M., Giannakopoulos, C., Roussos, A., Xanthopoulos, G., and Tenentes, V.: Sensitivity and evaluation of current fire risk and future projections due to climate change: the case study of Greece, Nat. Hazards Earth Syst. Sci., 14, 143–153, https://doi.org/10.5194/nhess-14-143-2014, 2014.
Katsafados, P., Papadopoulos, A., Varlas, G., Papadopoulou, E., and Mavromatidis, E.: Seasonal predictability of the 2010 Russian heat wave, Nat. Hazards Earth Syst. Sci., 14, 1531–1542, https://doi.org/10.5194/nhess-14-1531-2014, 2014.
Koppe, C., Jendritzky, G., Kovats, S., and Menne, B.: Heat-waves: risks and responses, Series No. 2, Regional Office for Europe, Health and Global Environmental Change, Kopenhagen, Denmark, 2004.
Kostopoulou, E., Giannakopoulos, C., Hatzaki, M., Karali, A., Hadjinicolaou, P., Lelieveld, J., and Lange, M. A.: Spatio-temporal patterns of recent and future climate extremes in the eastern Mediterranean and Middle East region, Nat. Hazards Earth Syst. Sci., 14, 1565–1577, https://doi.org/10.5194/nhess-14-1565-2014, 2014.
Lee, H. D. P.: Aristotle: Meteorologica, Loeb Classical Library No. 397, Harvard University press and Heinemann, Cambridge, London, 1952.
Leon, D. C., French, J. R., Lasher-Trapp, S., Blyth, A. M., Abel, S. J., Ballard, S., Barrett, A., Bennett, L. J., Bower, K., Brooks, B., Brown, P., Charlton-Perez, C., Choularton, T., Clark, P., Collier, C., Crosier, J., Cui, Z., Dey, S., Dufton, D., Eagle, C., Flynn, M. J., Gallagher, M., Halliwell, C., Hanley, K., Hawkness-Smith, L., Huang, Y., Kelly, G., Kitchen, M., Korolev, A., Lean, H., Liu, Z., Marsham, J., Moser, D., Nicol, J., Norton, E. G., Plummer, D., Price, J., Ricketts, H., Roberts, N., Rosenberg, P. D., Simonin, D., Taylor, J. W., Warren, R., Williams, P. I., and Young, G.: The COnvective Precipitation Experiment (COPE): Investigating the origins of heavy precipitation in the southwestern UK, B. Am. Meteorol. Soc., 97, 1003–1020, https://doi.org/10.1175/BAMS-D-14-00157.1, 2016.
Leverson, V. H., Sinclair, P. C., and Golden, J. H.: Waterspout wind, temperature and pressure structure deduced from aircraft measurements, Mon. Weather Rev., 105, 725–733, 1977.
Marcinoniene, I.: Tornadoes in Lithuania in the period of 1950–2002 including analysis of the strongest tornado of 29 May 1981, Atmos. Res., 67–68, 475–484, 2003.
Matsangouras, I. T., Nastos, P. T., Bluestein, H. B., and Sioutas, M. V.: A climatology of tornadic activity over Greece based on historical records, Int. J. Climatol., 34, 2538–2555, 2014a.
Matsangouras, I. T., Pytharoulis, I., and Nastos, P. T.: Numerical modeling and analysis of the effect of complex Greek topography on tornadogenesis, Nat. Hazards Earth Syst. Sci., 14, 1905–1919, https://doi.org/10.5194/nhess-14-1905-2014, 2014b.
Matzarakis, A. and Nastos, P. T.: Human-biometeorological assessment of heat waves in Athens, Theor. Appl. Climatol., 105, 99–106, 2011.
Matzarakis, A., Mayer, H., and Iziomon, M. G.: Applications of a universal thermal index: physiological equivalent temperature, Int. J. Biometeorol., 43, 76–84, 1999.
Mc Arthur, A. G.: Fire Behaviour in Eucalypt Forests, Leaflet No. 107, Department of National Development, Forestry and Timber Bureau, Canberra, Australia, 1967.
McKee, T. B., Doesken, N. J., and Kleist, J.: The relationship of drought frequency and duration to time scale, in: Preprints Eighth Conference on Applied Climatology, 17–22 January 1993, AMS – American Meteorological Society, Anaheim, CA, 179–184, 1993.
Meaden, G. T.: Tornadoes in Britain: Their intensities and distribution in space and time, J. Meteorol., 1, 242–251, 1976.
Mechler, R., Hochrainer, S., Aaheim, A., Salen, H., and Wreford, A.: Modelling economic impacts and adaptation to extreme events: Insights from European case studies, Mitig. Adapt. Strat. Global Change, 15, 737–762, 2010.
Miglietta, M. M., Mastrangelo, D., and Conte, D.: Influence of physics parameterization schemes on the simulation of a tropical-like cyclone in the Mediterranean Sea, Atmos. Res., 153, 360–375, 2015.
Moscatello, A., Miglietta, M. M., and Rotunno, R.: Numerical analysis of a Mediterranean `hurricane' over southeastern Italy, Mon. Weather Rev., 136, 4373–4397, 2008.
Mylonas, M. P., Douvis, K. C., Polychroni, I. D., Politi, N., and Nastos, P. T.: Analysis of a Mediterranean Tropical-Like Cyclone. Sensitivity to WRF Parameterizations and Horizontal Resolution, Atmosphere, 10, 425, https://doi.org/10.3390/atmos10080425, 2019.
Nastos, P. and Matzarakis, A.: Variability of tropical days over Greece within the second half of the twentieth century, Theor. Appl. Climatol., 93, 75–89, 2008.
Nastos, P. T. and Kapsomenakis, J.: Regional climate model simulations of extreme air temperature in Greece. Abnormal or common records in the future climate?, Atmos. Res., 152, 43–60, 2015.
Nastos, P. T. and Matsangouras, J. T.: Tornado activity in Greece within the 20th century, Adv. Geosci., 26, 49–51, https://doi.org/10.5194/adgeo-26-49-2010, 2010.
Nastos, P. T. and Matsangouras, I. T.: Analysis of synoptic conditions for tornadic days over western Greece, Nat. Hazards Earth Syst. Sci., 14, 2409–2421, https://doi.org/10.5194/nhess-14-2409-2014, 2014.
Nastos, P. T. and Zerefos, C. S.: On extreme daily precipitation totals at Athens, Greece, Adv. Geosci., 10, 59–66, https://doi.org/10.5194/adgeo-10-59-2007, 2007.
Nastos, P. T., Politi, N., and Kapsomenakis, J.: Spatial and temporal variability of the Aridity Index in Greece, Atmos. Res., 119, 140–152, 2013.
Nastos, P. T., Matsangouras, I. T., and Chronis, T. G.: Spatio-temporal analysis of lightning activity over Greece – Preliminary results derived from the recent state precision lightning network, Atmos. Res., 144, 207–217, 2014.
Nastos, P. T., Philandras, C. M., Kapsomenakis, J. N., Repapis, C. C., and Zerefos, C. S.: Features of extreme daily rain over specific thresholds in Athens and Thessaloniki, Greece, in: Vol. 2, 11th International Hydrogeological Congress, Athens, 371–383, 2017.
Nastos, P. T., Karavana-Papadimou, K., and Matsangouras, I. T.: Mediterranean tropical-like cyclones: Impacts and composite daily means and anomalies of synoptic patterns, Atmos. Res., 208, 156–166, 2018.
Palmer, W. C.: Meteorological drought, Research Paper No. 45, US Department of Commerce Weather Bureau, Washington, DC, 1965.
Peterson, R. E.: A historical review of tornadoes in Italy, J. Wind Eng. Ind. Aerod., 74–76, 123–130, 1998.
Polychroni, I., and Nastos, P. T.: Annual standardized precipitation index (SPI12) over the Mediterranean, in: Vol. 2, 11th International Hydrogeological Congress, Athens, 435–444, 2017.
Price, C.: Thunderstorms, Lightning and Climate Change, in: Lightning: Principles, Instruments and Applications, edited by: Betz, H. D., Schumann, U., and Laroche, P., Springer Publications, Cham, Switzerland, 521–536, 2009.
Pytharoulis, I., Craig, G. C., and Ballard, S. P.: The hurricane-like Mediterranean cyclone of January 1995, Meteorol. Appl., 7, 261–279, 2000.
Rauhala, J., Brooks, E. H., and Schultz, M. D.: Tornado climatology of Finland, Mon. Weather Rev., 140, 1446–1456, 2012.
Reynolds, D. J.: A revised U.K. tornado climatology, 1960–1989, J. Meteorol., 24, 290–321, 1999.
Robine, J. M., Cheung, S. L. K., Le Roy, S., van Oyen, H., Griffiths, C., Michel, J.-P., and Herrmann, F. R.: Death toll exceeded 70,000 in Europe during the summer of 2003, C. R. Biol., 331, 171–178, 2006.
Robinson, P. J.: On the definition of heat waves, J. Appl. Meteorol., 40, 762–775, 2001.
Rogers, R.: Doppler radar investigation of Hawaiian rain, Tellus, 19, 432–454, 1967.
Running, S. W.: Is Global Warming Causing More, Larger Wildfires?, Science, 313, 927–928, 2006.
Salinger, J., Sivakumar, M. V. K., and Motha, R. P. (Eds): Increasing Climate Variability and Change: Reducing the Vulnerability of Agriculture and Forestry, Springer, Dordrecht, the Netherlands, p. 362, ISBN 1-4020-3354-0,, 2005.
Schär, C., Vidale, P. L., Lüthi, D., Frei, C., Häberli, C., Liniger, M. A., and Appenzeller, C.: The role of increasing temperature variability in European summer heatwaves, Nature, 427, 332–336, 2004.
Segoni, S., Rosi, A., Rossi, G., Catani, F., and Casagli, N.: Analysing the relationship between rainfalls and landslides to define a mosaic of triggering thresholds for regional-scale warning systems, Nat. Hazards Earth Syst. Sci., 14, 2637–2648, https://doi.org/10.5194/nhess-14-2637-2014, 2014a.
Segoni, S., Rossi, G., Rosi, A., and Catani, F.: Landslides triggered by rainfall: a semi-automated procedure to define consistent intensity-duration thresholds, Comput. Geosci., 63, 123–131, 2014b.
Simpson, J. S., Morton, B. R., McCumber, M. C., and Penc, R. S.: Observations and mechanisms of GATE waterspouts, J. Atmos. Sci., 43, 753–782, 1986.
Sivakumar, M. V. K., Motha, R. P., and Das, H. P. (Eds): Natural Disaster and Extreme Events in Agriculture, Springer, Cham, Switzerland, p. 367, ISBN 10 3-540-22490-4, 2005.
Smith, K.: Environmental Hazards: Assessing Risk and Reducing Disaster, 6th Edn., Springer, Springer, Cham, p. 478, 2013.
Tolika, K., Maheras, P., Pytharoulis, I., and Anagnostopoulou, C.: The anomalous low and high temperatures of 2012 over Greece – an explanation from a meteorological and climatological perspective, Nat. Hazards Earth Syst. Sci., 14, 501–507, https://doi.org/10.5194/nhess-14-501-2014, 2014.
Tooming, H. K. and Peterson, R. E.: Vigorous tornadoes and waterspouts during the last 35 years in Estoniain: Meteorology in Estonia in Johannes Letzmann's Times and Today, edited by: Eelsalu, H. and Tooming, H., Estonian Academy Publishers, Tallinn, Estonia, 168–179, 1995.
Tsakiris, G., Pangalou, D., and Vangelis, H.: Regional drought assessment based on the Reconnaissance Drought Index (RDI), Water Res. Manage., 21, 821–833, 2007.
Tucker, C. J.: Red and photographic infrared linear combinations for monitoring vegetation, Remote Sens. Environ., 8, 127–150, 1979.
Tucker, C. J. and Choudhury, B. J.: Satellite remote sensing of drought conditions, Remote Sens. Environ., 23, 243–251, 1987.
Tyrrell, J.: A tornado climatology for Ireland, Atmos. Res., 67–68, 671–684, 2003.
UNESCO – United Nations Educational, Scientific and Cultural Organization: Map of the world distribution of arid regions: Map at scale with explanatory note, MAB Technical Notes 7, UNESCO, Paris, 1979.
UN/ISDR: Hyogo Framework for Action 2005–2015, in: Final Report, World Conference on Disaster Reduction, 18–20 January 2005, Kobe, Hyogo, Japan, p. 22, 2005.
Vandentorren, S., Bretin, P., Zeghnoun, A., Mandereau-Bruno, L., Croisier, A., Cochet, C., Ribéron, J., Siberan, I., Declercq, B., and Ledrans, M.: August 2003 heat wave in France: risk factors for death of elderly people living at home, Eur. J. Publ. Health, 16, 583–591, 2006.
van Wagner, C. E.: Development and structure of a Canadian forest fire weather index system, Forestry Tech. Rep. 35, Canadian Forestry Service, Ottawa, 1987.
Venäläinen, A. and Heikinheimo, M.: The Finnish forest fire index calculation system, in: Early warning systems for natural disaster reduction, edited by: Zschau, J. and Kuppers, A., Springer, Cham, Switzerland, 645–648, 2003.
Wang, G.: Agricultural drought in a future climate: Results from 15 global climate models participating in the IPCC 4th assessment, Clim. Dynam., 25, 739–753, 2005.
Weghorst, K.: The reclamation drought index: Guidelines and practical applications, Bureau of Reclamation, Denver, CO, 6 pp., 1996.
WMO – World Meteorological Organization: Preventing and mitigating natural disasters, WMO-No. 993, Geneva, Switzerland, ISBN 92-63-10993-1, 2006.
Yang, L., Smith, J. A., Baeck, M. L., Bou-Zeid, E., Jessup, S. M., Tian, F., and Hu, H.: Impact of Urbanization on Heavy Convective Precipitation under Strong Large-Scale Forcing: A Case Study over the Milwaukee–Lake Michigan Region, J. Hydrometeorol., 15, 261–278, 2014.
Yonetani, T.: Increase in number of days with heavy precipitation in Tokyo urban area, J. Appl. Meteorol., 21, 1466–1471, 1982.
Zhang, X., Hegerl, G., Zwiers, F. W., and Kenyon, J.: Avoiding Inhomogeneity in Percentile-Based Indices of Temperature Extremes, J. Climate, 18, 1641–1651, 2005.