the Creative Commons Attribution 4.0 License.
the Creative Commons Attribution 4.0 License.
 | 05 May 2021
Glacier detachments and rock-ice avalanches in the Petra Pervogo range, Tajikistan (1973–2019)
Enrico Bernardini
Mylène Jacquemart
Mikhail Dokukin
Glacier detachments are a rare, but hazardous, phenomenon of glacier instability, whereof only a handful have been documented to date. Common to all known cases is that many million cubic meters of ice detached from the bed of relatively low-angle valley glaciers and turned into long-runout mass flows. Recently, two such detachments were observed in the Petra Pervogo range in Tajikistan. Using a variety of satellite imagery, including Landsat 1–8, Sentinel-2, ASTER, TanDEM-X, WorldView, and Keyhole, we characterized these events and identified in total 17 mass flows involving glacier ice (detachments, ice, and rock-ice avalanches; rock avalanches falling on glaciers) that clustered in four different catchments between 1973 and 2019. The runout distances range from 2 to 19 km, and the largest detached glacier volume was 8.8×10⁶ m3. A total of 11 out of 13 detachments, ice, or rock-ice avalanches occurred between July and September in years with mean annual air temperatures above the trend of the past 46 years. The relatively large number of locally clustered events indicates that the Petra Pervogo range has particularly favorable conditions for glacier instabilities. The images and geology of the region suggest that easily erodible lithologies are widespread. These soft lithologies may be also one reason for the high density of surging glaciers in the Petra Pervogo range and the wider Pamir region. We conclude that high temperatures, combined with soft, fine-grained sediments, may increase the likelihood of mass wasting events and appear to be critical factors facilitating the detachment of entire valley glaciers, whereas such events appear to be relatively robust against earthquakes for our study area. The observed recurrence of mass wasting events make the Petra Pervogo range a potential candidate to witness glacier detachments by field studies.
- Article
(36690 KB) - Full-text XML
- BibTeX
- EndNote


Glacier detachments are extremely rare events, but the scientific understanding of these events is rapidly evolving. They occur when large volumes of glacier ice detach from valley glaciers with relatively low surface slopes (10 to 20∘) and turn into highly mobile, ice-rich mass flows. Evans and Delaney (2015) list glacier detachments, together with ice avalanches, as one of three classes of catastrophic mass flows in glacierized mountain environments that are pertinent to this work. The classes are distinguished by their starting mechanism and the involved material. Both glacier detachments and ice avalanches mainly involve glacier ice, but ice avalanches are much more frequent and typically originate from steep (hanging) glaciers. Rock avalanches – with sometimes long runouts if they descend onto glaciers or snow-covered terrain – form a second class; the combination of the first two classes, or mass movements that involve both ice and rock (Evans and Delaney, 2015), is classified as ice-rock or rock-ice avalanches. For all three classes, potential energy is transformed into kinematic energy and into frictional heat. Frictional heating, and sometimes entrained sediments (Moore, 2014, Sect. 5.2.2), increases the content of liquid water which can enhance the mobility of the resulting mass flows (Schneider et al., 2011; Evans and Delaney, 2015; Davies, 1982). The high mobility leads to much longer runout distances compared to pure rock avalanches (Schneider et al., 2011) and in turn increases the potential for damage to inhabited areas (Petrakov et al., 2008).
Several past events, including the 2002 Kolka–Karmadon rock-ice avalanche (Drobyshev, 2006; Huggel et al., 2005; Evans et al., 2009), the 2016 Aru Co twin glacier collapse (Kääb et al., 2018; Gilbert et al., 2018), and the 2013 and 2015 Flat Creek detachments (Jacquemart et al., 2020; Jacquemart and Loso, 2019), as well as comparable events reported in China and Argentina (Paul, 2019; Falaschi et al., 2019), are well described by the definition of glacier detachments offered by Evans and Delaney (2015) because they involved “the decoupling of a glacier ice mass from its bed and catastrophic detachment of a large volume of a valley glacier”. We therefore adopt this term when documenting the newly discovered detachments, as well as when referring to events described elsewhere (e.g., Kolka–Karmadon detachment, Aru detachments).
The reasons for glacier detachments are not yet fully understood, but several factors seem to play a major role. Water has been found to be the main cause for the drastic reduction of basal friction that is key for a glacier detachment (Kääb et al., 2018; Gilbert et al., 2018; Jacquemart et al., 2020), but stress changes due to loading from rock or rock-ice avalanches on the glaciers have also been invoked as possible triggers (Evans et al., 2009; Kääb et al., 2021). Fine grained sediments or weak bedrock underlying the glaciers have been found for all glacier detachments, presumably facilitating the storage of large amounts of water leading to the necessary loss of friction (Kääb et al., 2018; Gilbert et al., 2018; Jacquemart and Loso, 2019). Also, ice-sediment mixtures have been shown to experience profound weakening at temperatures close to the melting point (Moore, 2014). In many cases, a close proximity to surging glaciers has been documented; in some cases, the detached glaciers themselves exhibited a surge-like behavior before the detachment (Kääb et al., 2018) or had a prior history of surging.
Based on these observations, it has been hypothesized that glacier detachments may be catastrophic endmembers of the surging process (Kääb et al., 2018; Gilbert et al., 2018; Kääb et al., 2021). Glacier surges are rapid, transient, and often periodic advances of a glacier that can last for weeks, months, or even years (Cuffey and Paterson, 2010). Enhanced basal sliding driven by increased subglacial water pressure has been proposed as one of the key mechanisms behind surges (Kamb et al., 1985; Harrison and Post, 2003; Clarke et al., 2011). Therefore, glacier detachments could be considered “runaway” surges. Up to now, no relation between surge activity and changing climate conditions has been found, but glacier surges are obviously favored by a range of climatic conditions (Sevestre and Benn, 2015). Hence, it is suspected that rising temperatures increase, at least temporarily, the amount of meltwater and may thus favor the development of instabilities (Jacquemart et al., 2020).
The growing collection of documented glacier detachments raises the question of how common such events really are, whether they occur more frequently compared to the past, or whether the increasing availability of satellite imagery simply causes an observation bias. The demonstrated importance of liquid water in the detachment process and the temporarily increasing availability of melt water by rising global temperatures might be evidence that such events occur more frequently.
The aim of this work is to provide an inventory of glacier detachments, ice avalanches, and rock-ice avalanches that occurred within less than 30 km distance in the Petra Pervogo range, Tajikistan, between 1973 and 2019 and were hence exposed to very similar geologic and climatic conditions. We built this local inventory by analyzing vast collections of satellite images, including the entire Landsat archive. We subsequently used the inventory to put the glacier detachments in context with the local geology, climate conditions, the regional distribution of surge-type glaciers, and pre-detachment glacier dynamics. Finally, we also put these findings in context with glacier detachments known from elsewhere, in particular the well described events at Kolka, Aru, and Flat Creek.
The Petra Pervogo range (also called Peter the First or Peter the Great range) is situated in central Tajikistan, northwest of the Pamir mountain system. It extends east to west for about 200 km between the Surkhob river to the north and the Obikhingou river to the south, both of which drain into the Vakhsh river at the western end of the range. In the western Petra Pervogo range, shown in Fig. 1, we identified four catchments which showed repeated large mass flows. Two detachments, which happened in 2016 and 2017, were mentioned in Dokukin et al. (2019) and on Twitter (Dokukin, 2018). A third detachment, which happened in 2019, was found during this study and independently by Andreas Kääb (personal communication, 2020).
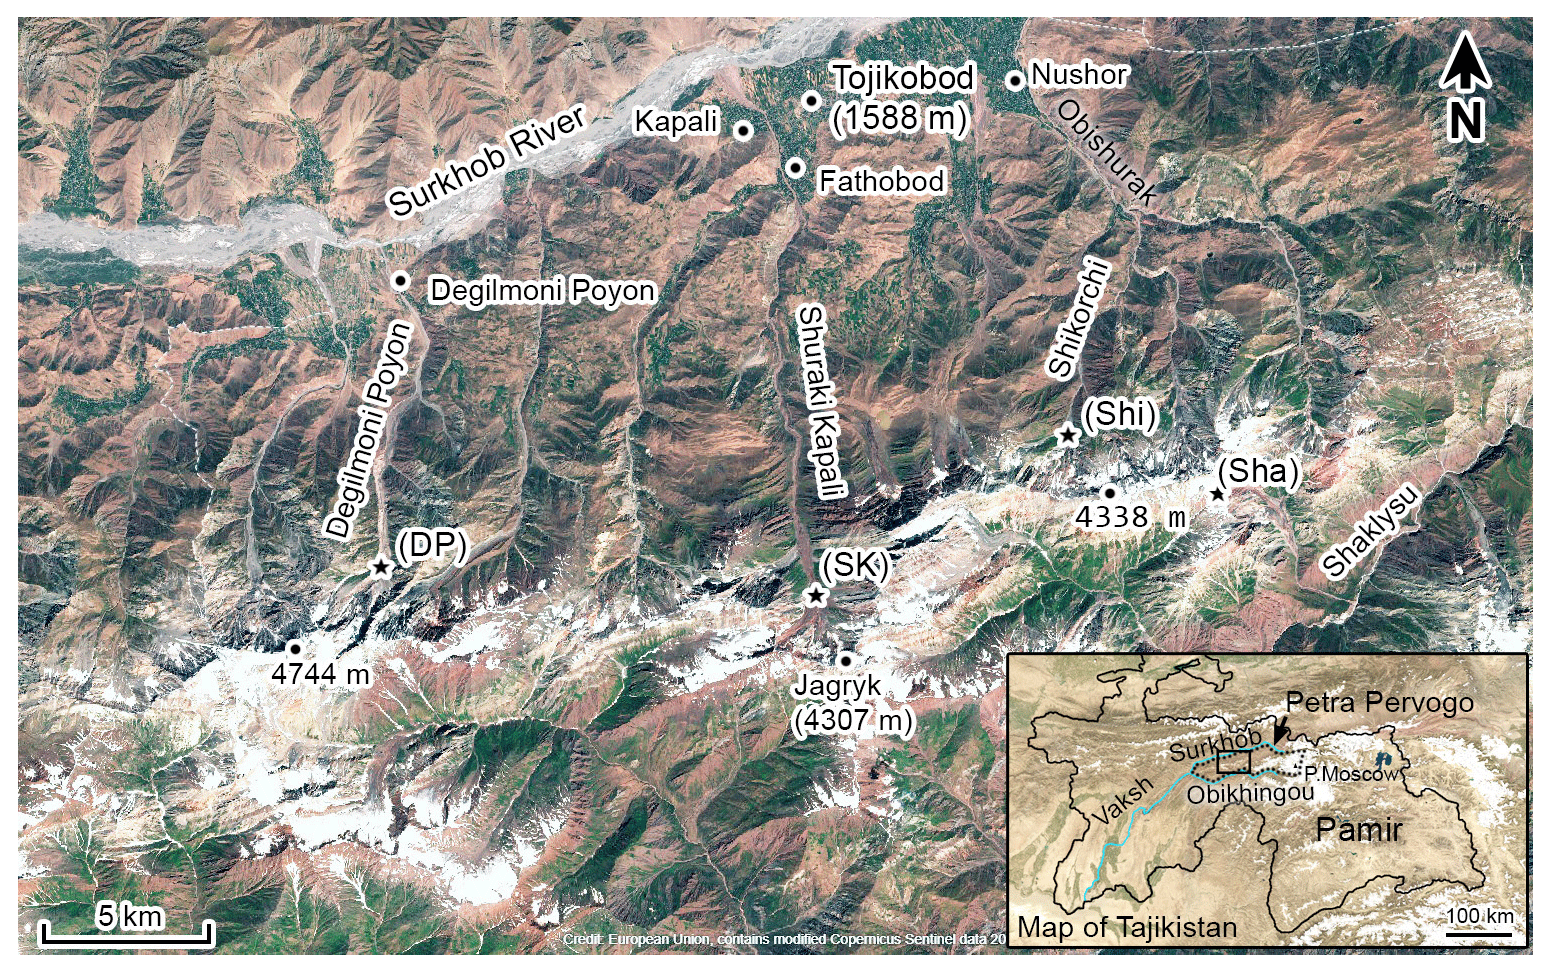
Figure 1Western Petra Pervogo range. The ⋆ symbols indicate catchments where large mass flows involving glacier ice occurred. Catchments are abbreviated by river names (DP, SK, Shi, Sha). Image contains Copernicus Sentinel-2 and MODIS data with borders, major rivers, and place names added.
2.1 Catchments in the Petra Pervogo range with large mass flows
In the catchment of the Degilmoni Poyon river (DP in Fig. 1), we identified a glacier detachment which occurred in 2019 (abbreviated as dp-19). It resulted in a debris flow which almost reached the village of Degilmoni Poyon, located 9 km downstream. The glacier detached between 2860 and 3360 m a.s.l. (above sea level) at about 38.988∘ N, 70.694∘ E.
In the catchment of the Shuraki Kapali river (SK in Fig. 1), 13 km upstream of the village of Tojikobod (Tadzhikabad, 1588 m a.s.l.), we observed a series of detachments and rock-ice avalanches that occurred between 1973 and 2019. The nearby villages of Kapali and Fathobod experienced some infrastructure damage from an event on 28 August 2016. The largest detachment from this catchment occurred in 2017 (abbreviated as sk-17 in the following), when ice masses detached from between 3300 and 4000 m a.s.l. at about 38.974∘ N, 70.844∘ E.
In the catchment of the Shikorchi river (Shi in Fig. 1), we identified a series of rock avalanches that occurred between 2001 and 2017, originating at elevations between 3000 and 4000 m a.s.l. and traveling over glaciers (39.026∘ N, 70.933∘ E).
In a side valley of the Shaklysu river (Sha in Fig. 1), rock-ice avalanches occurred in 2006 and 2019. The debris flow resulting from the 2019 event traveled through the side valley and almost reached the Shaklysu river. Both events originated from a small glacier at 3800 m altitude (39.012∘ N, 70.998∘ E).
2.2 Geology
The western Petra Pervogo range is composed mainly of Cretaceous–Neogene sedimentary rocks. The catchments DP and SK are made up of redstone, aleurolite, claystone, conglomerates, and limestone. Striking erosional features and thick glacial debris cover support the fact that soft lithologies are widespread. The Petra Pervogo range is located south of the Vakhsh thrust system where shallow earthquakes in the upper 15 km of the crust are frequent (Schurr et al., 2014). Similar sedimentary rocks are prolific in the northwestern corner of the Pamir mountains (lime-, clay-, and sandstones, as well as conglomerates, aleurolite, gypsum, and marl; see geological map by Ibrohim et al., 2020). The prevalence of such rocks, which may be easily eroded by glaciers and freeze–thaw processes, is spatially correlated to the particularly high density of surging glaciers present in the area (Goerlich et al., 2020).
2.3 Climate
Two meteorological stations, one located at Rasht/Garm (1316 m; 39.02∘ N, 70.37∘ E), 40 km west of SK in the Surkhob valley, and the other located above the Obikhingou river at Lyairun (2008 m; 38.89∘ N, 70.93∘ E), 12 km southeast of SK, indicate a mean annual precipitation of 700–1000 mm yr−1 (Williams and Konovalov, 2008) and a mean annual air temperature (MAAT) of 10.7 and 7.1 ∘C, respectively, resulting in a temperature-lapse rate of −0.52 ∘C per 100 m. The zero-degree isoline in the region is therefore at around 3300 m, and a global permafrost map indicates that permafrost is patchy (Obu et al., 2019). Vegetation grows until about 3500 m, and glacier tongues reach down to 2700–3200 m. Based on Sentinel-1 radar backscatter data we determined that snowmelt at ∼4000 m starts around mid-April every year, and melting temperatures last until October. A temperature increase of 0.42 ∘C over the last 40 years has been observed for the Pamir mountains, with an increase of almost 1 ∘C in fall and winter (Finaev et al., 2016).
Very little in situ data were available to us, so this study is primarily based on remote sensing imagery. We combined optical and radar images, as well as digital elevation models (DEMs), to identify, map, and characterize mass flows in the Petra Pervogo range, as well as the distribution of surging glaciers in the range and the larger Pamir region.
3.1 Detection and classification of mass flows
We analyzed the entire Landsat (L1–L8), Sentinel-2 (S2), and ASTER archives, as well as all freely available reconnaissance Keyhole (KH-3, KH-4A/4B, KH-9) images, to identify, classify, and characterize large mass flow events in the glaciated environment of the western Petra Pervogo range shown in Fig. 1. A temporal overview of analyzed acquisitions is shown in Fig. 2.
For event detection, we searched for the abrupt disappearance of glaciers and also for the appearances of bright (ice rich) and dark (sediment rich) deposits in the valleys below glaciers (for examples see Appendix). In addition, we looked for the removal of vegetation and changes in surface color indicating the overtopping of landscape by debris flows. To detect such changes, we visually compared images from consecutive years but acquired during similar snow conditions at the same month (or day, if available) of each year. For that we mainly analyzed imagery between July and September when snow and cloud cover was minimal and when vegetation showed a strong near-infrared (NIR) signal. In addition, we also compared consecutive images to detect events that occurred in winter or that did not leave traces detectable in the next summer. We chose spectral bands by the best available resolution (Table 1), followed by their ability to discriminate vegetation, ice, rock, and wet sediments. When possible, we chose longer wavelengths which better penetrate aerosols. We used the moisture-sensitive short-wave infrared channel (SWIR2) to distinguish wet and dry sediments (Kääb et al., 2014; USGS, 2020). To identify vegetation cover we used the NIR channel; for L7 we used the panchromatic (PAN) channel (L7) which covers the NIR spectrum but provides a higher spatial resolution. For L8 we averaged the higher-resolution panchromatic band 8 with the vegetation-sensitive NIR band 5. To identify snow and ice we used the red (R) or green (G) channel from the visible spectrum. To narrow down the date of events we also analyzed selected optical Planet imagery and Sentinel-1 (S1) radar imagery. We analyzed all images at a scale of approximately 1:25 000 but zoomed in for a more detailed analysis of detected events. Only events in which horizontal length from release area to deposit end exceeded about 2 km were considered. Due to the growing availability of imagery (bar plot in Fig. 2) the frequency of detected events is very likely biased towards more recent years. As glacier detachments are extremely rare events, we aimed for the detection of as many events as possible rather than on temporal consistency of the dataset as done by others (e.g., Bessette-Kirton and Coe, 2020).
Table 1List of satellite imagery that was systematically analyzed (upper rows) and used to narrow down event dates (lower rows).
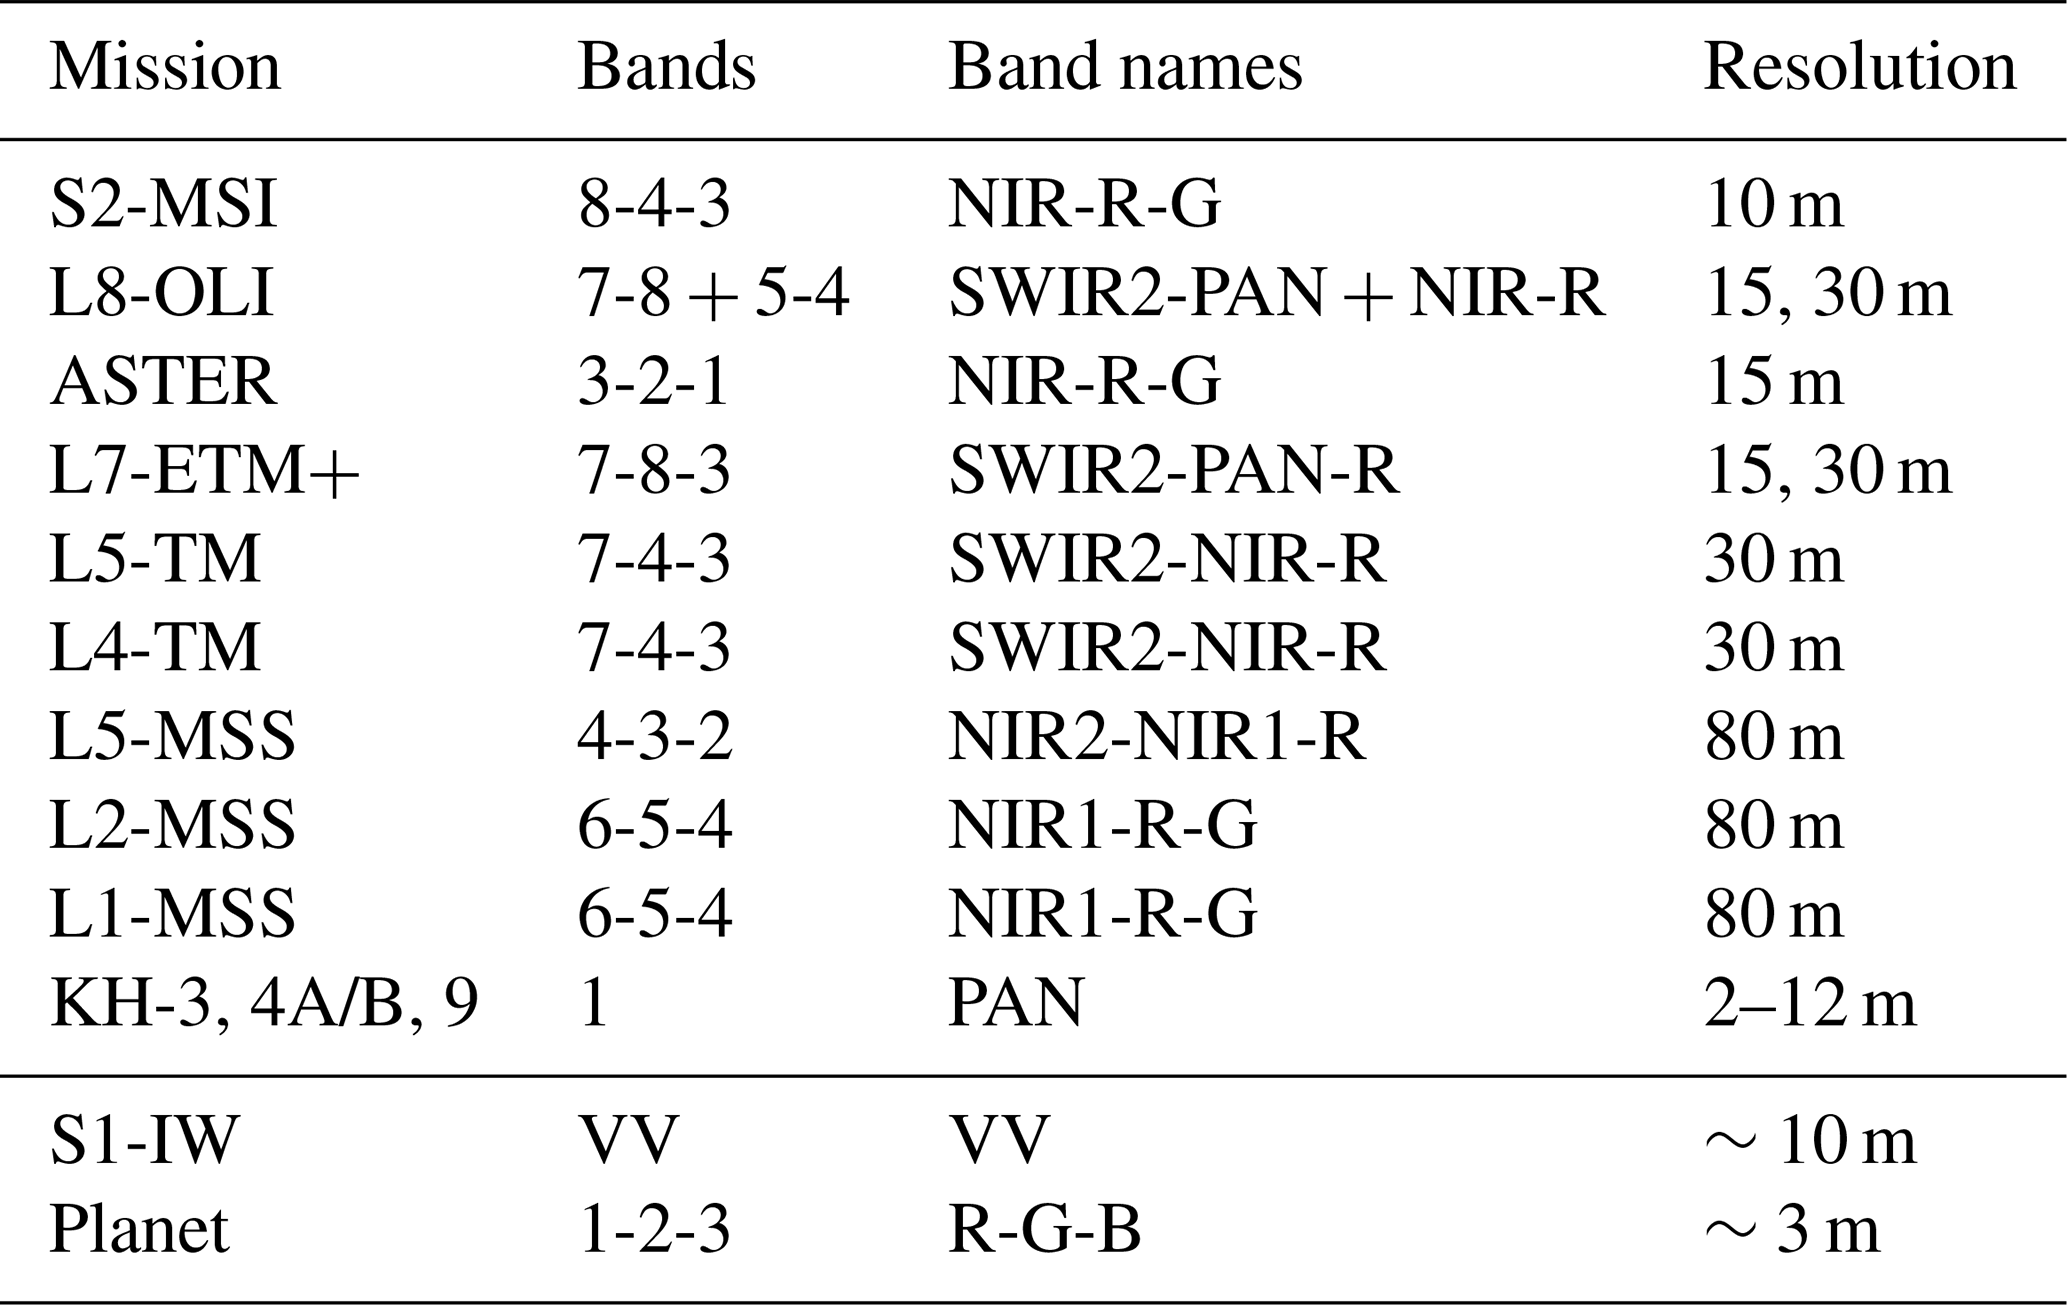
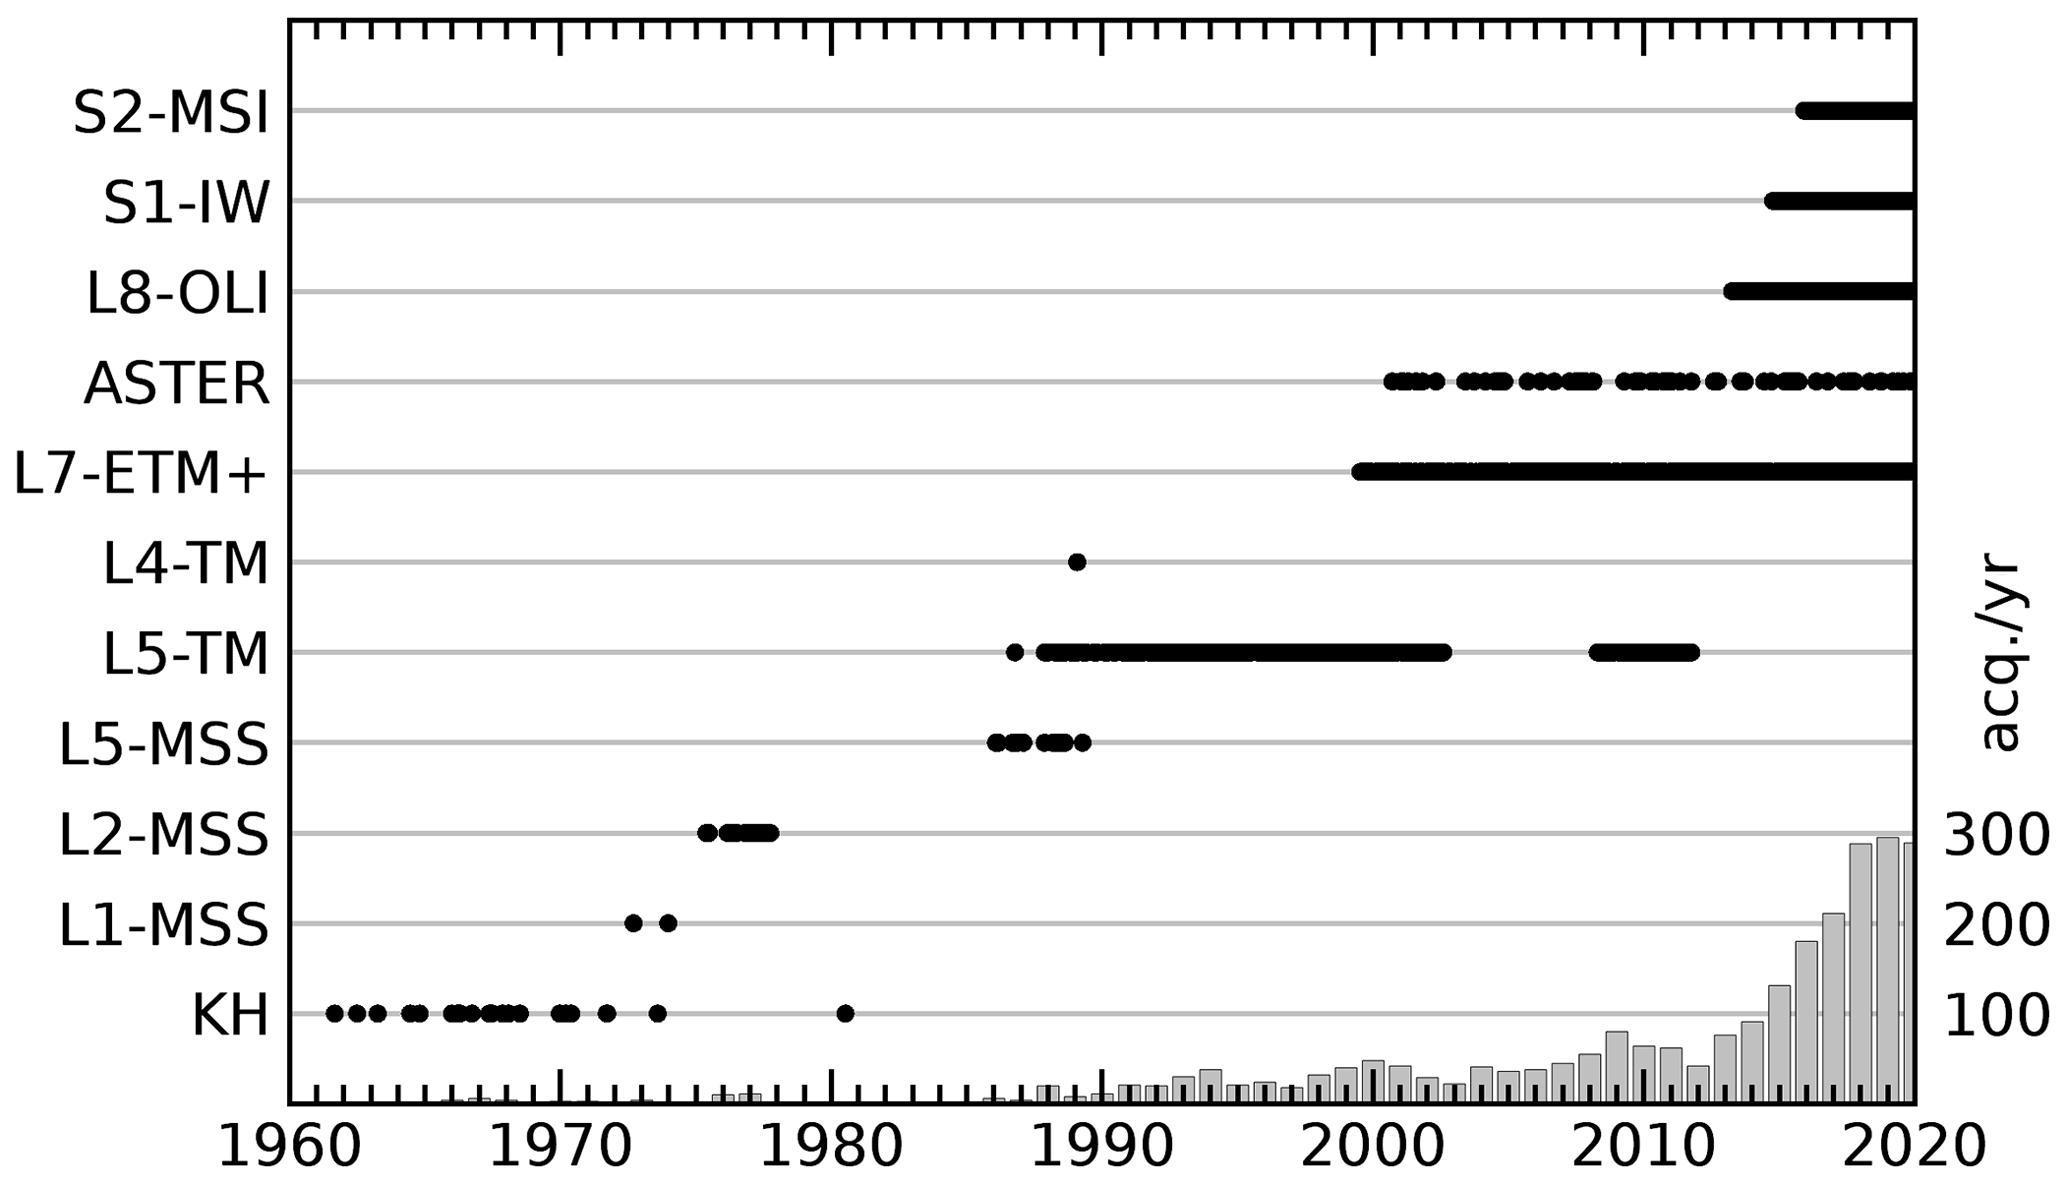
Figure 2Temporal overview of analyzed satellite imagery. The bar plot indicates the total number of available acquisitions per year.
Determining the nature of the detected events is rarely a straightforward task, but we tried to offer our best assessments based on the following criteria.
-
Glacier detachment (d). A glacier was visible prior to the event and lied within a polygon of the GLIMS inventory (Glacier Land Ice Measurements from Space); the glacier was located at the bottom of a valley or in topographical depressions; exposed bedrock or shadows indicated the removal of large amounts of ice; and downstream deposits consisted mostly of ice.
-
Ice avalanche (i). Only small amounts of ice were removed and the glacier seemed mostly intact, and downstream deposits consisted of mostly ice.
-
Rock-ice avalanche (r/i). Release area contained both ice and rock, and deposits showed traces of ice but were mostly ice free.
-
Rock avalanche (r). Release area included mainly rock but the avalanche traveled over a glacier, and deposits were mostly ice free.
3.2 Mass flow descriptions
For each detected event, we determined the release area and the slope of the release zone. To characterize the mobility of the mass flows, we determined the angle of reach α, calculated by from the horizontal path length L and the total fall height H measured from the top of the release area to the lowest point of the runout. The angle of reach (or mobility index or Fahrböschung) corresponds to the average friction coefficient of the mass flow (Scheidegger, 1973). We also measured the total impact area and the maximum height of the flows' trim lines using the elevation information of the Shuttle Radar Topography Mission (SRTM) DEM embedded in Google Earth Pro.
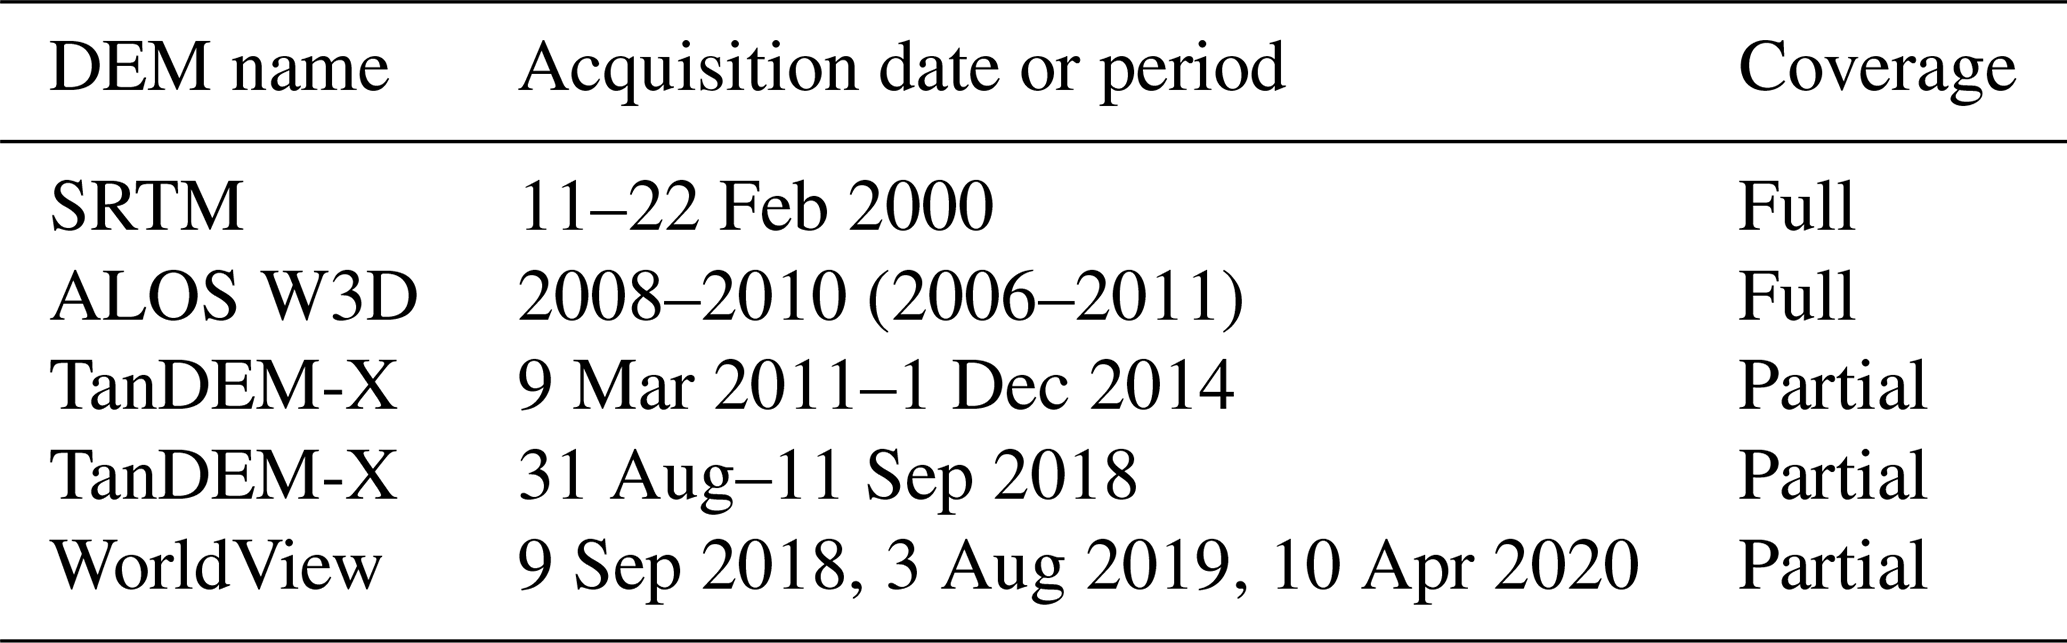
A precise estimation of volume changes requires the availability of timely elevation models before and after an event. Unfortunately, this was only the case for the event dp-19, for which three pairs of WorldView stereo images (Neigh et al., 2013) could be processed into DEMs using the SETSM algorithm (Surface Extraction with TIN-based Search-space Minimization from Noh and Howat, 2017). We coregistered the DEMs to each other following Nuth and Kääb (2011). For all other detected events, the available DEMs (Table 2) had either no precise time stamp or were acquired several years before or after a detected event, inhibiting precise volume estimates. For the two largest detachments, however, the DEM time series provided insight into a glacier's dynamics prior to the events.
To estimate the uncertainties of the volume estimates we masked all areas impacted by the events and tiled the remaining DEM into n2 tiles (n ranging from 2 to 200). By calculating the median height change (dH) per tile and relating this to tile size, we got estimates of the average per area dH error (Miles et al., 2018). This empirical error metric accounts for all error sources, including differences in snow cover and processing errors. In the WorldView images we masked obvious clouds (large areas with a DEM difference beyond ±130 m) before error estimation.
3.3 Pre-event glacier dynamics
Several studies have described surge-like behavior, increasing flow velocities, or opening crevasses prior to glacier detachments and ice avalanches (Kääb et al., 2018; Jacquemart et al., 2020; Faillettaz et al., 2011). When the data permitted, we tried to detect and describe such behavior.
We used high-resolution S2 and L8 imagery to measure flow velocities and crevasse opening prior to the sk-17 and dp-19 events. Velocities were determined by the manual tracking of surface features and by measuring the width of the opening rupture lines. We also tracked any surging or surge-like mass redistribution using DEMs from SRTM, TanDEM-X (TDM), the ALOS World DEM 3D (W3D), and WorldView (WV) stereo imagery (Farr et al., 2007; Krieger et al., 2007; Tadono et al., 2016; Neigh et al., 2013; Noh and Howat, 2017). We analyzed six TDM pairs acquired between 3 May 2011 and 5 September 2014 and generated DEMs using the InSAR processing algorithm detailed in Leinss and Bernhard (2021) to derive the surface dynamics from DEM differences.
3.4 Regional surge patterns
To compare the geometric characteristics of detected glacier instabilities within a wider regional context, we mapped glacier surges in the entire Pamir mountains that occurred between 2000 and 2011 by differencing the C-band SRTM and the optical W3D, both at 30 m resolution, horizontally aligned following Nuth and Kääb (2011). We analyzed DEMs from 37–39∘ N and 67–75∘ E. For the SRTM DEM an absolute vertical accuracy of 6 m is given in Farr et al. (2007), but the C-band radar can penetrate up to around 10 m into dry snow and firn (Rignot et al., 2001). For the W3D a vertical accuracy of 5 m is given (Tadono et al., 2016). Imagery for the W3D was acquired between 2006 and 2011, but the main acquisition period for the Petra Pervogo range was between March 2008 and March 2011.
For the mapping of glacier surges, we considered glaciers as being in an active surge phase when the glacier showed a surface height increase of more than 10 m over the glacier tongue accompanied by surface lowering further upstream. We consider glaciers being in a quiescent surge phase when surface lowering over the glacier tongue exceeded 10 m and a significant surface height increase was visible upstream in a possible reservoir area. To determine the slope of the surging part of a glacier we measured the horizontal length and the elevation difference of the area that showed the surge-like (wave-like) elevation change pattern.
3.5 Meteorological and seismic data
To analyze climatic influences on glacier mass wasting events, we used data from the two meteorological stations Garm and Lyairun, available from 1961–1990, and ERA-Land reanalysis data from 1981 to 2019 (Copernicus Climate Change Service, 2019). ERA data were obtained for the coordinates 70.90∘ E, 38.95∘ N, 6 km southeast the Shuraki Kapali (SK) catchment, and the height of 3470 m a.s.l. To obtain homogeneous temperature time series we calculated the mean difference between the Lyairun and ERA-Land temperature and shifted the temperature data of the Lyairun station by +7.6 ∘C to match the ERA-Land temperature data used for analysis. The shift is in agreement with the lapse rate of 0.52 ∘C per 100 m (Sect. 2.3). ERA-Land precipitation required a scaling factor of 16.7 to match data from the Lyairun station.
To assess earthquakes as triggering factors, we used data of seismic events that occurred within a range of 500 km around the Petra Pervogo range. We selected the earthquakes which occurred within the time period given by a pre-event and a post-event satellite image. To capture delayed triggering by earthquakes we also selected earthquakes up to 2 d before the acquisition of the pre-event image. Then we assessed the earthquakes's magnitude and the distance to the catchments where mass flows were detected and compared the earthquake's distance and magnitude to the threshold for the triggering of disrupted landslides according to Jibson (2013).
3.6 Normalized difference vegetation index (NDVI) for mass flow recognition and vegetation recovery analysis
The older available imagery showed gaps of a few years in which mass wasting events could have happened without being noticed. However, events with long runouts may remove or bury vegetation which can take years to recover. To assess vegetation recovery times, and to estimate how likely large events might have gone unnoticed in post-event imagery containing a vegetation-sensitive channel, we analyzed time series of the NDVI = (NIR − R)(NIR + R) from the band combinations (B5, B4) and (B8, B4) for LS8 and S2, respectively, of the two recent detachments, dp-19, and sk-17. We compare the results with vegetation recovery in the runout of the Kolka–Karmadon glacier detachment.
Our analyses revealed a very high activity of mass wasting events in the western Petra Pervogo range. In particular, we have detected two large-volume glacier detachments, as well as several smaller glacier detachments, ice avalanches, and rock-ice avalanches. Table 3 summarizes the characteristics of all detected events; Table 4 lists satellite images used to narrow down their date of occurrence. The following two sections describe the main detachment events, followed by short descriptions of all other events grouped by (sub)catchments.
Table 3Type and characteristics of detected mass flows determined as described in Sect. 3.1 and 3.2. Empty fields indicate quantities that could not be determined. Surge-like instabilities were observed several years before the sk-17 and dp-19 events (“yes” in parenthesis) but not immediately before the detachment. * The shi-17 event consisted of a primary and secondary event (shi-17-1 and shi-17-2).
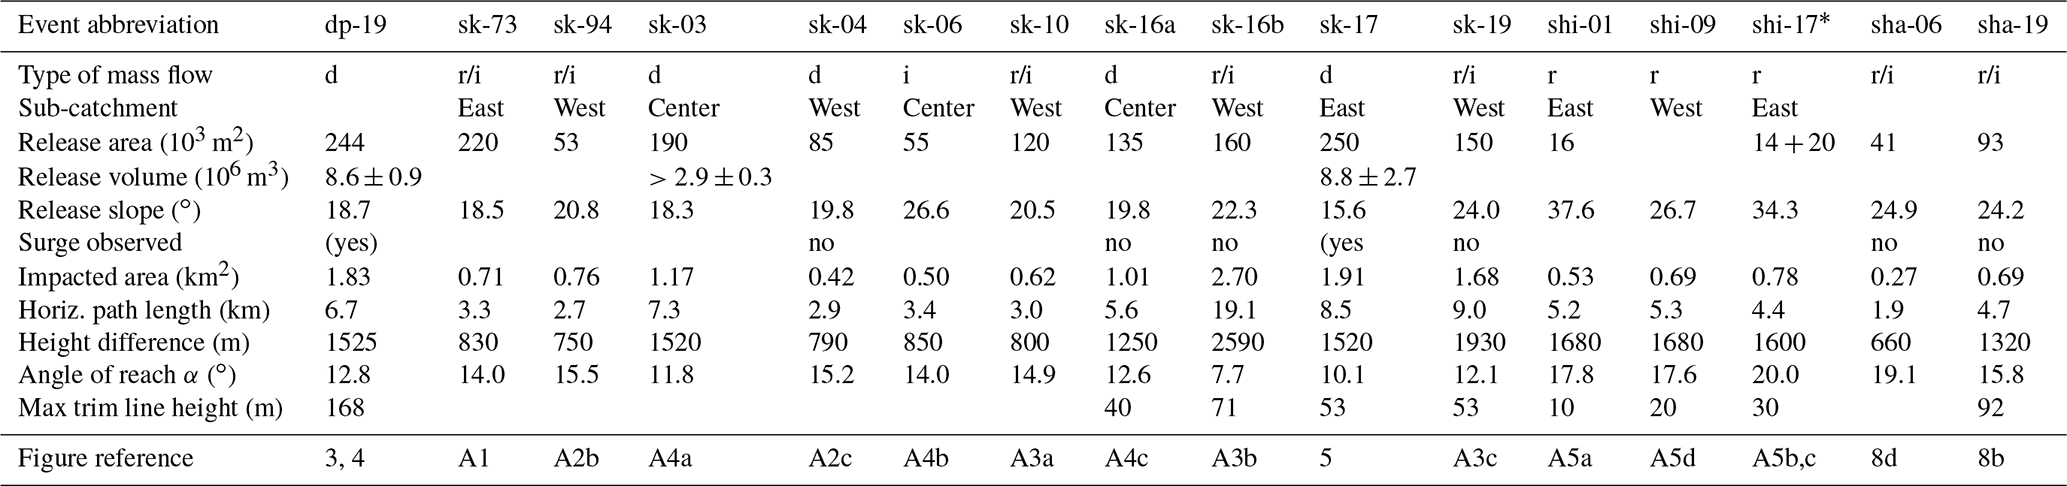
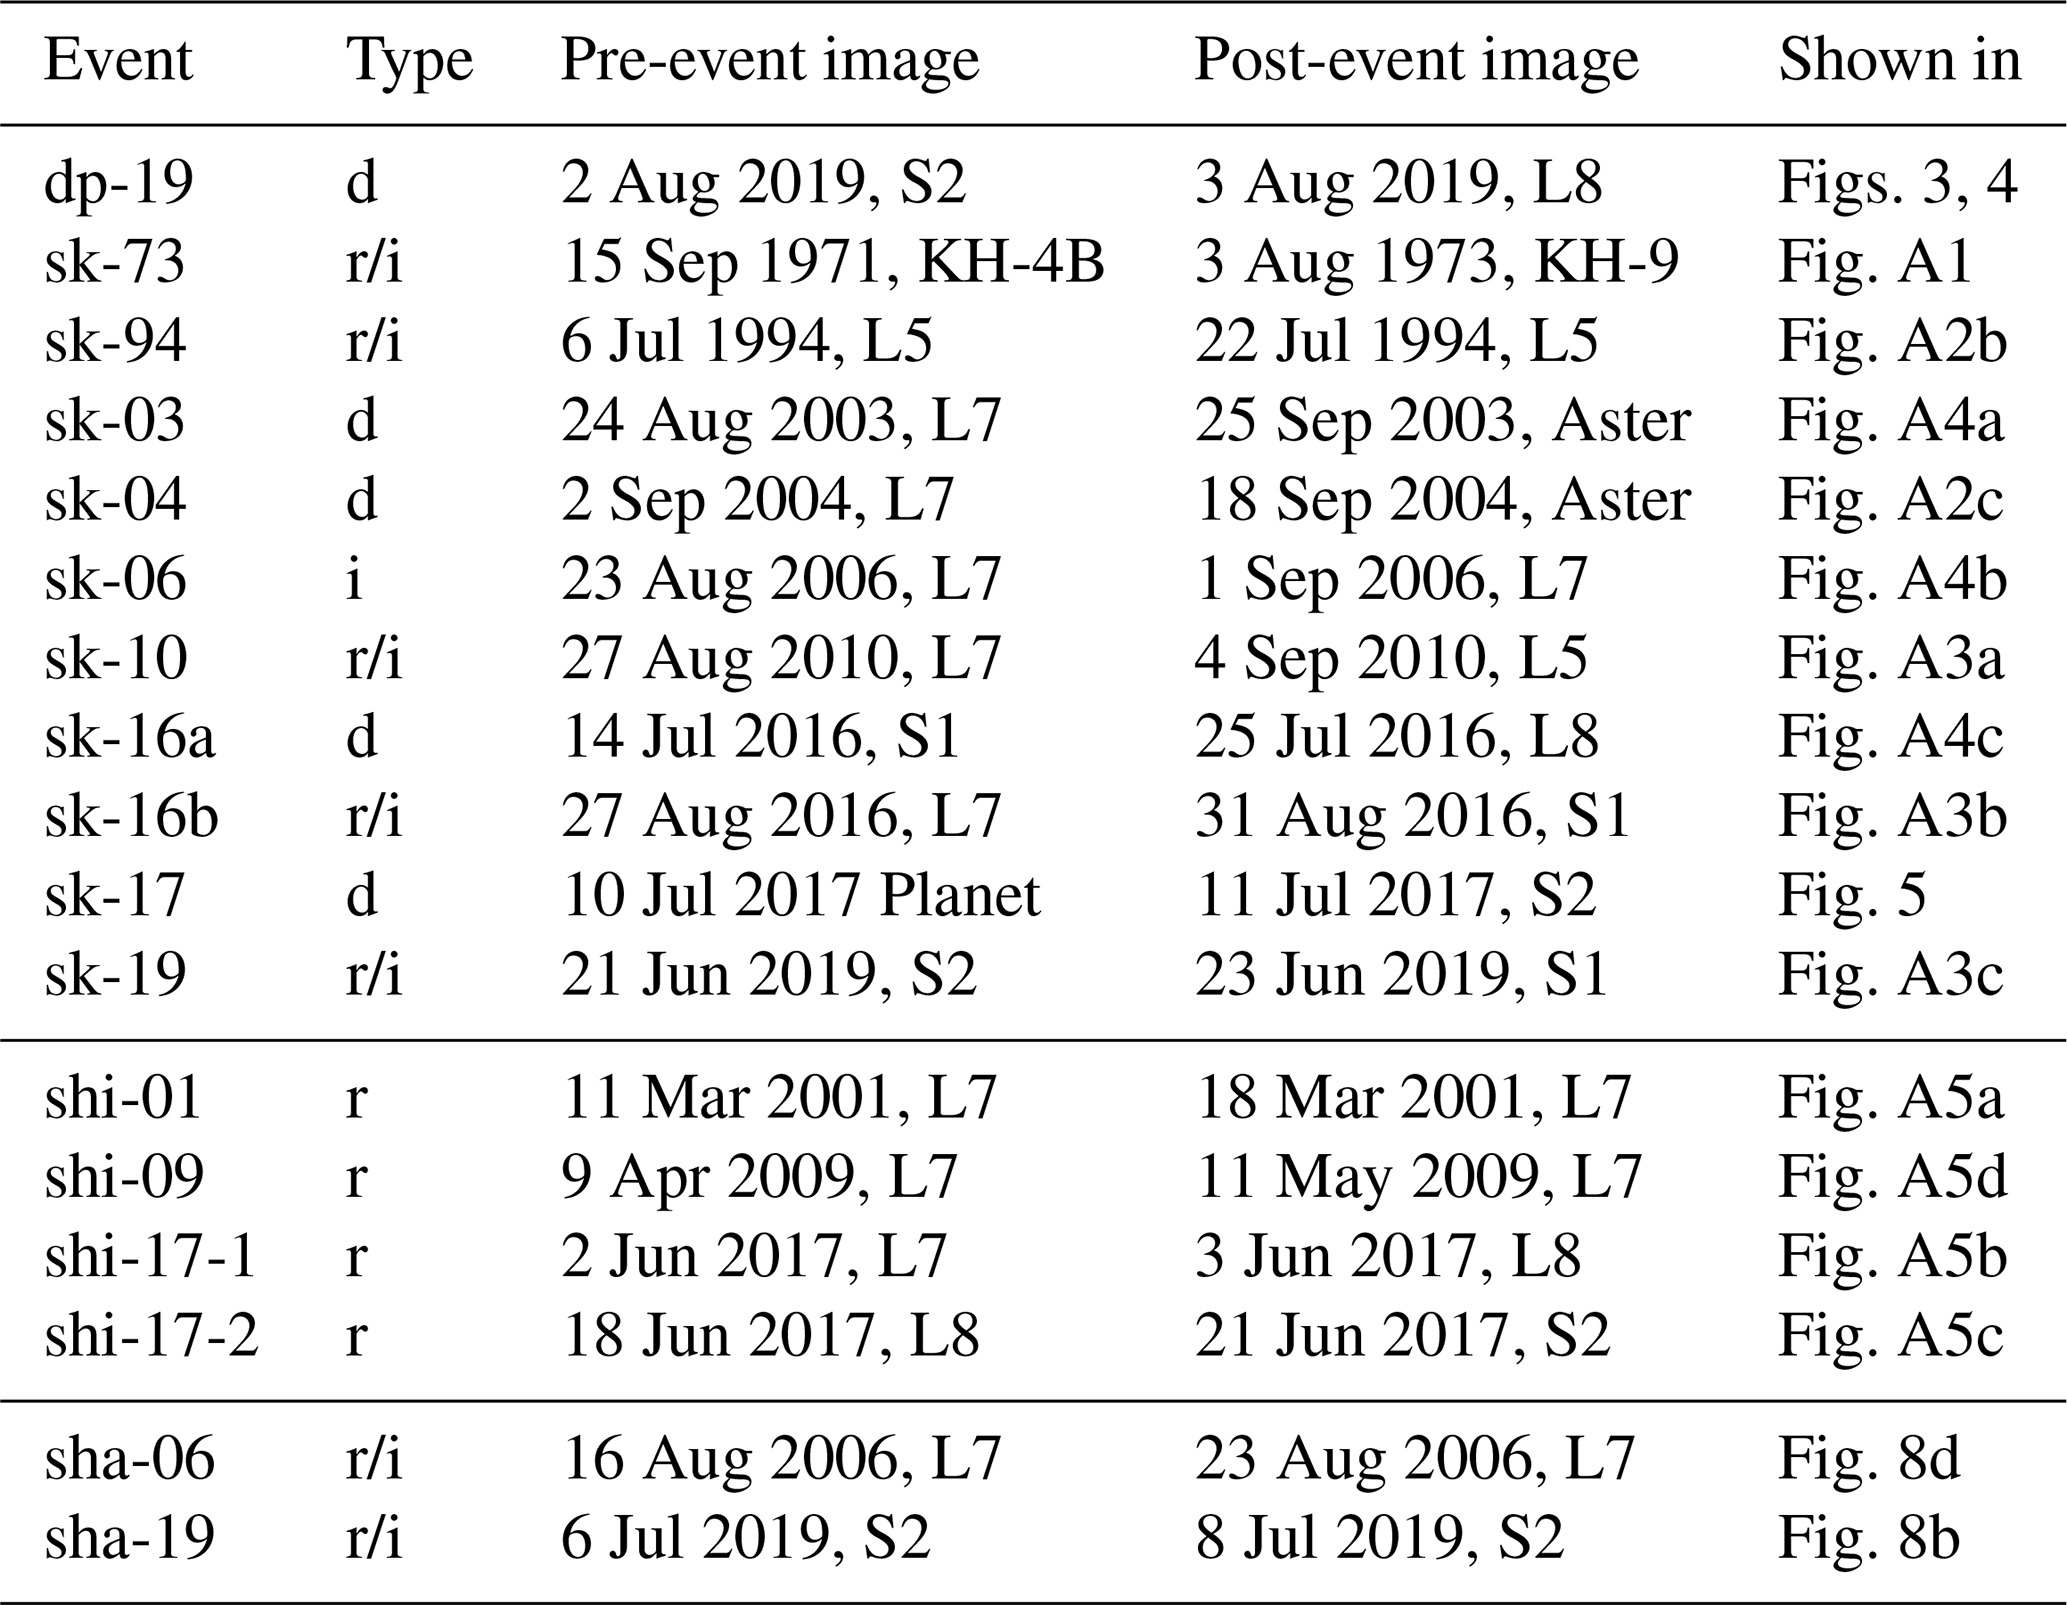
Table 4Satellite imagery that limit the date of occurrence of the events. Dates are given according to ISO-8601. Event types abbreviations are described in Sect. 3.1. Referred figures show images with the best visibility of the events; they can differ from the images that limit the date of occurrence.
4.1 The 2019 Degilmoni Poyon glacier detachment (dp-19)
A valley glacier in the Degilmoni Poyon catchment detached between 2 and 3 August 2019. The glacier is listed in the GLIMS database with the ID G070689E38981N (Raup et al., 2007), and its outline comprises a steep, ice-covered headwall and a lower-angle valley glacier below. The detachment involved essentially the entire glacier below the headwall (Fig. 3a–c).
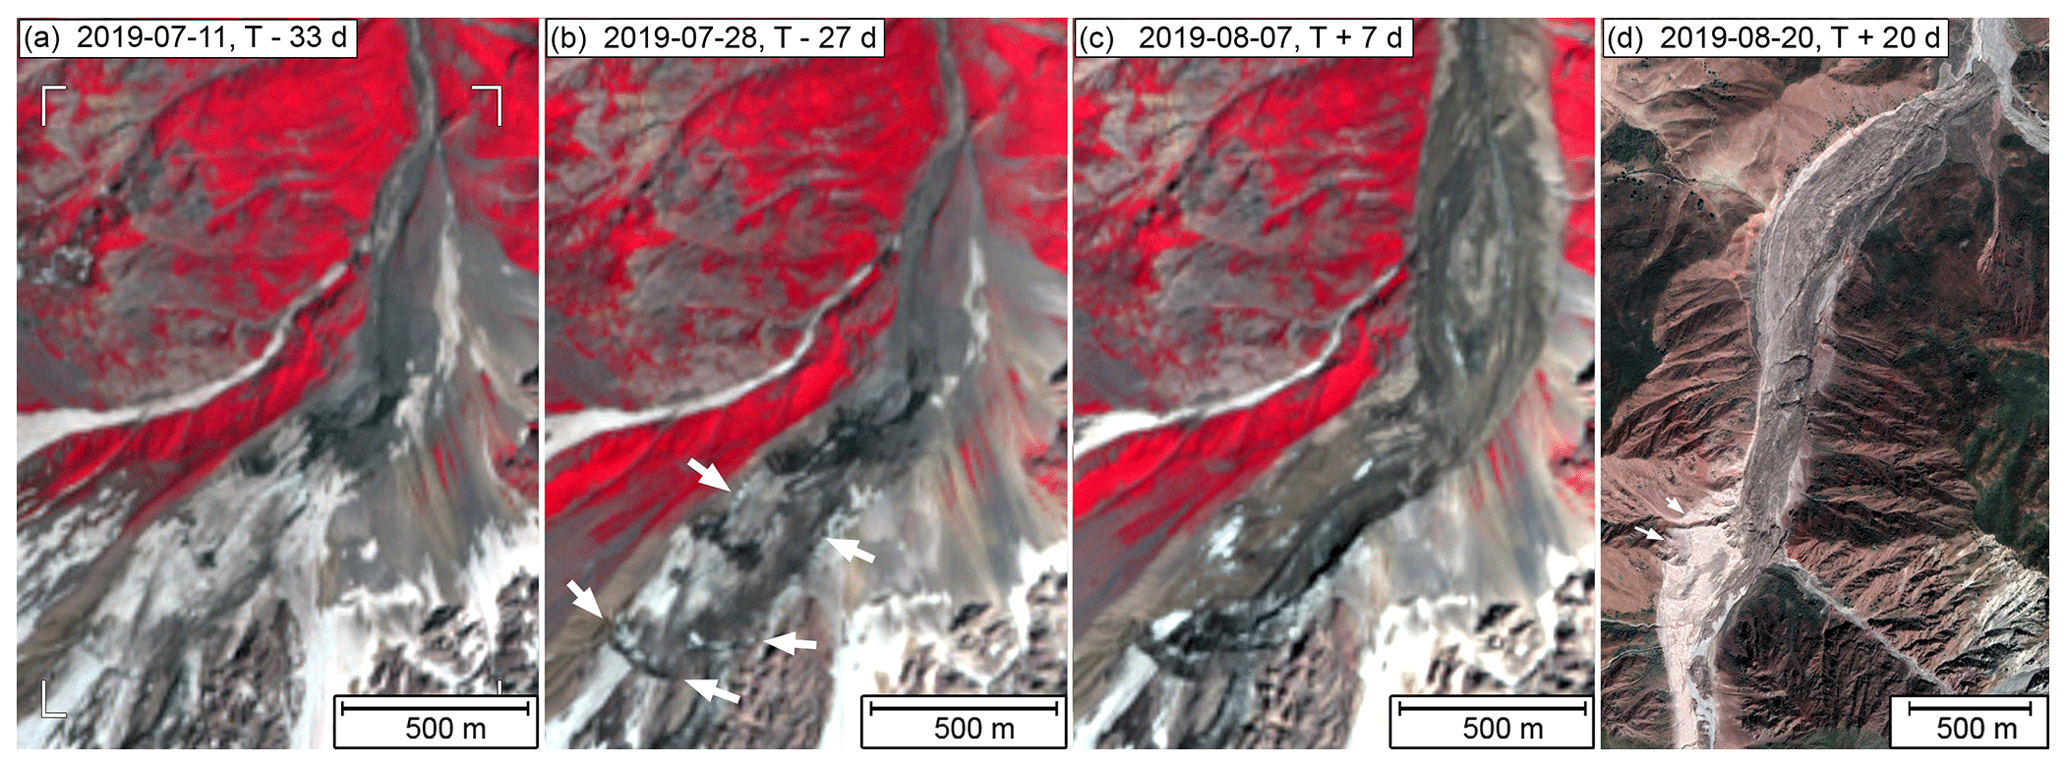
Figure 3S2 false color imagery capturing the evolution of the detachment dp-19. From (a) to (b) crevasses open around the glacier outline (arrows), while the middle part of the glacier remains snow covered. (c) Exposed glacier bed after detachment, and (d) runout zone of the resulting debris flow; arrows indicate the maximum height of the trim line. (a–c) Copernicus Sentinel data (2019). (d) © Google, Maxar Technologies.
From the difference of two WorldView DEMs from 2018 and 2019, shown in Fig. 4a, we determined a detached area of approximately 244×103 m2 and a detached volume of m3. A cloud obscured a small part of the detachment area in the 2019 image, but the DEM difference between a 2020 and the 2018 DEMs indicated that only a negligible part of the detachment area was obscured. The post-detachment glacier bed showed a nearly triangular cross section with a maximum erosion depth of 91 m (mean depth: 35 m). The detached mass traveled 6.7 km down the valley, with an elevation loss of 1525 m, resulting in an angle of reach of α=12.8∘. After traveling 4.3 km down valley, the continuous trim line of the mass flow reached over 150 m above the valley in a curve, indicating a very high velocity (arrows in Fig. 3d). The avalanche stopped 2.4 km later, only 2.6 km outside the village of Degilmoni Poyon.
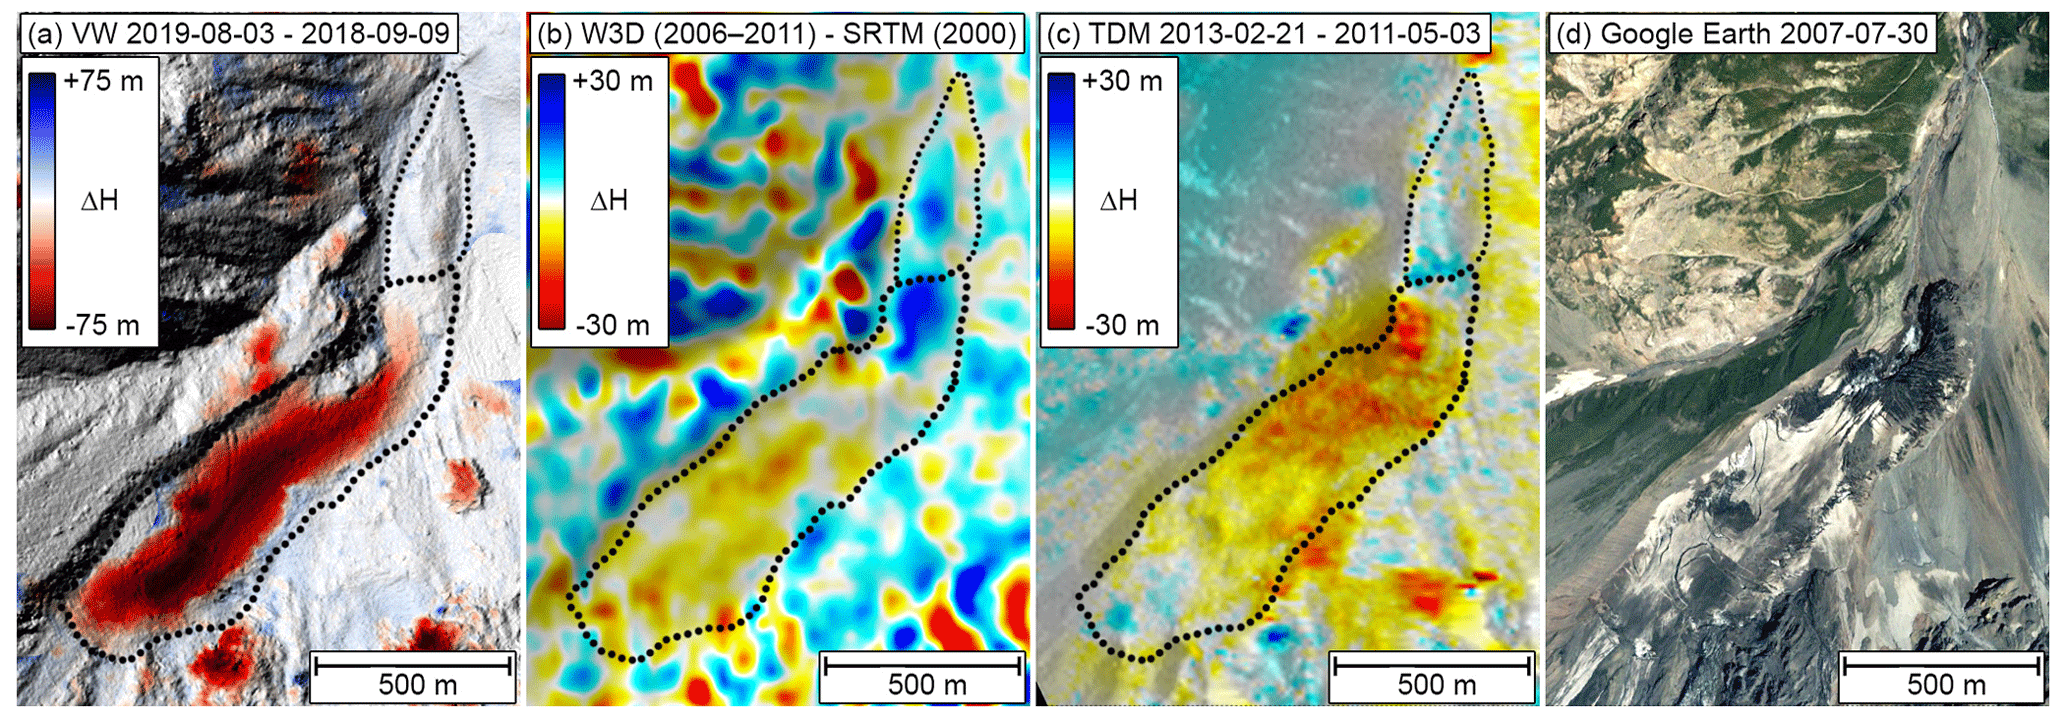
Figure 4DEM differences of the detachment dp-19. (a) WorldView elevation differences from before and after the event reveal a detached volume of 8.6×10⁶ m3. The shown area corresponds to the white frame indicated in Fig. 3a. (b, c) DEM differences indicate a surge-like elevation change pattern after 2000 which continued at least until 2013. (d) In 2007 strong crevassing at the glacier outline resemble surge-like dynamics. (a) 2020, DigitalGlobe, NextView License; (b) 2020, JAXA and USGS; (c) TanDEM-X; (d) © Google, Maxar Technologies.
Prior to its detachment, dp-19 had an active surge history. L5 imagery indicates a surge-like advance of about 230 m between 1991 and 1995. The glacier advanced again by about 100 m between 1999 and 2003, followed by quiescence until 2006. DEM differences between 2000 (SRTM) and 2006–2011 (W3D) indicate a weak surge-like mass redistribution during the advance (Fig. 4b). In a Google Earth image from 30 July 2007 (Fig. 4d) the glacier shows a multitude of lateral crevasses, indicating another active phase of advance which lasted until at least 2008 according to L7 imagery. After that, the glacier entered a pre-detachment quiescent phase. In L7, L8, and S2 data, that glacier appears progressively sediment covered, and no special activity was detected between 2008 and 2019. TanDEM-X data from 3 May 2011 and 21 February 2013 (Fig. 4c) indicate an elevation loss of about 10–15 m. All datasets indicate that the glacier's slow retreat and melt continued until shortly before the detachment in 2019. About 3 weeks prior to the detachment, around 11 July 2019, the Bergschrund started widening by 1 m d−1, and we observed increased sliding leading to enhanced lateral crevassing around the detached area. In the middle part of the glacier we did not observe any new crevasses exposed by snowmelt, indicating that the lateral crevasses are caused by the progressive detachment of the glacier body.
Pre-event imagery, going back to a KH image from 1961, shows erosion patterns and missing vegetation matching surprisingly well the flow patterns shown in Fig. 3d. However, in satellite imagery we could not find any confirmation of an earlier large mass flow before the 2019 event.
4.2 The 2017 Shuraki Kapali glacier detachment (sk-17)
Another large-volume glacier detachment was reported in the Shuraki Kapali catchment by Dokukin et al. (2019). Between 10 and 11 July 2017, almost the entire valley glacier (GLIMS ID G070852E38974N) with an area of about 250×103 m2 detached (Fig. 5). Because the geometry of sk-17 is remarkably similar to that of dp-19, we assumed the same mean detachment depth of 35 m of dp-19 to estimate a volume of m3. The detached mass lost 1520 m in elevation while traveling 8.5 km down the valley, corresponding to an angle of reach of α=10.1∘.
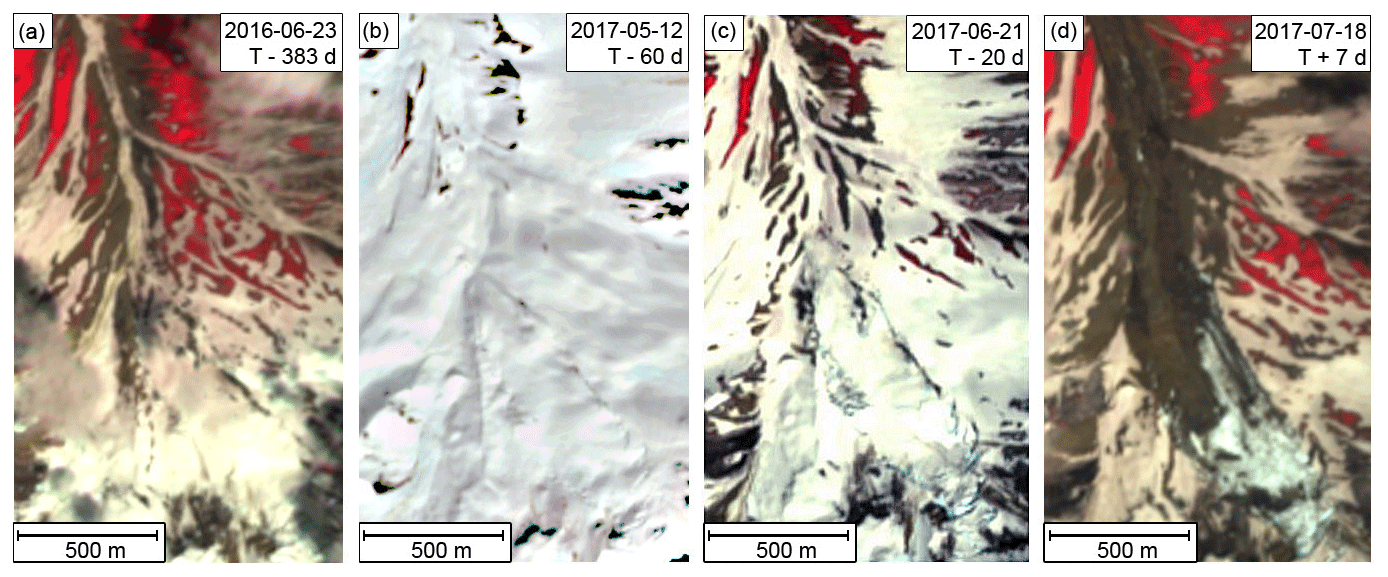
Figure 5S2 false color imagery capturing the evolution of the detachment sk-17. Copernicus Sentinel data (2017).
Figure 5a to c show the evolution of the glacier prior to the detachment. Crevasses surrounding the detaching area become increasingly visible 60 d before the detachment and indicate enhanced sliding 20 d before the detachment. Manual tracking of surface features in an S2 image pair from 21 and 28 June 2017 indicates a sliding velocity of about 3 m d−1. The glacier detached 2 weeks later.
DEM differences prior to the detachment indicate a surge-like elevation change between 2000 and 2006–2011 (W3D; Fig. 6a) which continued until 2011 (TDM). However, prior to the detachment the glacier's surface elevation seems nearly stagnant, and the TDM DEM differences in Fig. 6b show very little change in surface height between 2011 and 2014. TDM and L8 imagery does not show any advance or retreat either.
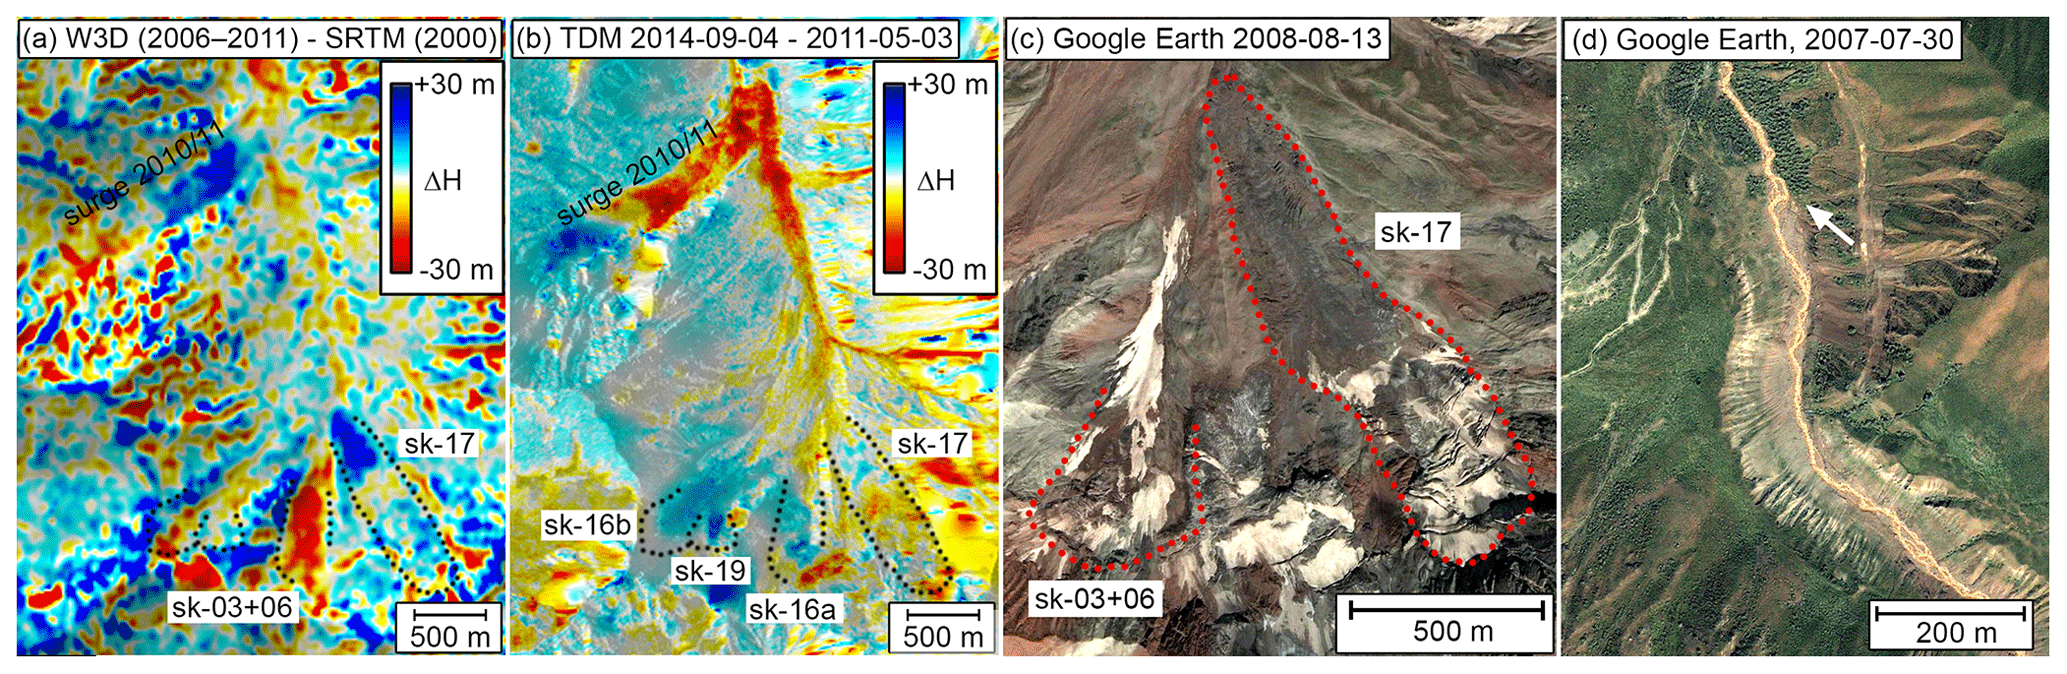
Figure 6Shuraki Kapali catchment. (a) The W3D–SRTM DEM difference shows a clear height loss (red) where the detachment sk-03 and the ice avalanche sk-06 occurred. A surge-like elevation gain (blue) is visible at the glacier tongue which detached in 2017 (sk-17). (b) The TDM DEM difference shows a nearly stagnant surface height before the sk-17 event. At the confluence of the 2010/11 surge and the valley floor, elevation loss indicates melt of ice and previous mass flow deposits. Panel (c) shows the rupture line of the sk-03 and sk-06 events. (d) The suspected end of the sk-03 avalanche is indicated by existing tall vegetation on the valley floor (arrow). (a) 2020, JAXA and USGS; (b) TanDEM-X. Imagery from (c) and (d) © Google, Maxar Technologies.
4.3 Other events
4.3.1 Shuraki Kapali (SK) catchment
The Shuraki Kapali catchment appears to be a hotspot for glacier detachments and ice or rock-ice avalanches. Distributed across three small sub-catchments, the GLIMS database lists five small glaciers in the upper part of this drainage (gray polygons in Fig. 7). In the following, we briefly describe the detected events, grouped into their respective sub-catchments, from west to east.

Figure 7All release areas of ice masses in the Shuraki Kapali catchment overlap with the glacier outlines (gray shading) of the GLIMS database. Black dotted lines mark terrain ridges and separate sub-catchments. Background image from 19 July 2019 © Google, Maxar Technologies.
In the western part of the Shuraki Kapali catchment the GLIMS database lists two small glaciers from which at least five mass flows originated (green and yellow polygons in Fig. 7). Extensive debris cover on the two glaciers made a precise delineation of the detached areas and unambiguous classification of the events difficult:
-
In July 1994 the lower part of a glacier with the GLIMS ID G070839E38975N broke away (sk-94) and resulted in an rock-ice avalanche with an approximate runout distance of 2.7 km (Fig. A2b). We did not find earlier events in this catchment, but KH imagery from 1961 indicates strong erosion and sediments below the glacier (Fig. A2a).
-
In September 2004 a slightly larger part detached from the same glacier (sk-04) and resulted in a mass flow with an approximate runout distance of 2.9 km. The detachment zone and the ice deposits are visible in Fig. A2c. Additional ice fell off from the upper scarp of the detachment zone a few days later (arrow in the inset of Fig. A2c) resulting in a similar runout distance of 2.5 km.
-
In early September 2010 ice continued to break off from the remaining parts of the glacier and resulted in a rock-ice avalanche (sk-10, Fig. A3a).
-
For 28 August 2016, local media reported a mud-flow as a result of glacier break off (Tajik telegraph agency, 2016; Radio Ozodi, 2016). We determined a glacier area of 160×103 m2, indicated as sk-16b in Fig. 7, which detached, corresponding to the major part of the glacier with the GLIMS ID G070835E38972N that is located above the glacier where previous events (sk-94, sk-04, sk-10) happened. The detachment scarp and the avalanche trim line are indicated by an arrow and a white dotted line in Fig. A3b. The avalanche reached or ran over the deposits of the sk-16a event (see below) and transformed into a debris flow with a remarkable runout distance of 19.1 km (measured from the detachment scarp), resulting in a very low angle of reach of only 7.7∘. The avalanche passed the villages of Fathobod and Kapali (Fig. 1) where 10 buildings and a bridge were damaged or destroyed and several cattle were swept away. The mud-flow reached the Surkhob River at 1507 m altitude (inset in Fig. A3b), still containing pieces of ice according to photographs from the media and blocked temporarily the Shuraki Kapali river (Radio Ozodi, 2016).
-
Between 21 and 23 June 2019 a rock-ice avalanche (sk-19) was released at the same place as sk-16b. However, Google Earth imagery indicates that a deeper layer of rock or ice had detached. The event was followed by a minor ice avalanches between 26 June and 1 July 2019 visible in the center of the sk-19 deposits (Fig. A3c). The runout distance of the main mass flow is approximately 9 km with an angle of reach of 12.1∘. In total an area of approximately 150×103 m2 of rock and ice detached from the mountain.
In the central part of the Shuraki Kapali catchment the GLIMS database lists a glacier with the ID G070846E38972N. Here, we identified three events: two glacier detachments and one followed by an ice avalanche:
-
In September 2003 the lower part of the glacier detached (sk-03) and ran out for about 7.3 km, resulting in an angle of reach of 11.8∘. The runout is clearly visible in Aster imagery (inset in Fig. A4a) and matches with missing vegetation on the valley floor shown in Fig. 6d. The detachment area of 190×103 m2 was derived from L7 imagery 1 year after detachment (Fig. A4a). In the detachment area, DEM difference between the SRTM and the W3D showed a height loss of up to 40 m (15 m on average; red area in Fig. 6). From DEM differences we estimate a volume loss of at least m3 for sk-03. The volume is very likely larger because the W3D is mainly composed of data acquired several years after the event (2006–2011).
-
In late August 2006 glacier ice with an area of 55×103 m2 (sk-06) was released just above the detachment scarp of the sk-03 event, resulting in a runout of 3.4 km (Fig. A4b). The likely rupture line of this event, and the detached area of sk-03 below, is visible in a Google Earth image from 13 August 2008 (Fig. 6c).
-
In July 2016 another detachment, mentioned by Dokukin et al. (2019), originated from the same area (sk-16a; Fig. A4c). The resulting mass flow traveled 5.6 km over a height loss of 1200 m, corresponding to an angle of reach of 12.4∘. TDM imagery and DEM differences indicate that the valley exposed by the sk-03 event has partially filled up with ice.
In the eastern part of the Shuraki Kapali catchment a KH-09 reconnaissance image from 3 August 1973 indicates a rock-ice avalanche (sk-73; Fig. A1) likely originating from the glacier that produced the sk-17 detachment. From the runout distance of 3.3 km and the estimated fall height, we calculated an angle of reach of around 14∘. The large deposit pattern in an earlier KH image from 30 August 1961 (Fig. A2a), an apparent widening of the valley until 1973, and the absence of the glaciers in the central and eastern catchments in a KH-4B image from 15 September 1971 (not shown) indicates that the SK catchment had been very active already before the 1973 event.
4.3.2 Shikorchi (Shi) catchment
In the catchment of the Shikorchi river, we identified a series of large mass flows which traveled over steep glaciers (Fig. A5), but we could not determine how much ice was entrained during flow or involved in the release area. The runout did not show clear traces of ice; therefore we classified them as rock avalanches. This classification is supported by the relatively steep slopes (27–38∘) and the low mobility (angles of reach 17.6–20.0∘) listed in Table 3:
-
In the eastern part of the catchment, a rock avalanche (shi-01) occurred in March 2001 (Fig. A5a). It originated in a relatively small area (16×103 m2) at 4000 m at the ridge of the catchment, ran across two glaciers (GLIMS IDs G070941E39016N and G070934E39019N), and covered a total of 5.2 km over an elevation difference of 1680 m.
-
At the same location, two rock avalanches of similar size (shi-17-1 and shi-17-2) occurred between 2 and 3 June 2017 and between 19 and 21 June 2017 (Fig. A5b and c). They flowed across the same two glaciers and had runout distances of 3.9 and 4.4 km, respectively, over elevation distances of 1550 and 1600 m.
-
In the western part of the catchment we identified a rock avalanche that occurred between 9 April and 11 May 2009 originating above the glacier with the ID G070926E39021N and traveling 5.3 km over 1680 m elevation (Fig. A5d).
4.3.3 Shaklysu catchment (Sha)
In a side valley of the Shaklysu river a very small glacier with the GLIMS ID G070995E39014N is located (≈0.1 km2):
-
In July 2019, a rock-ice avalanche originated from the upper reaches of the glacier at 3810 m. Exposed rocks at the former location of the glacier in Google Earth imagery indicate that the entire glacier had detached (Fig. 8). The resulting mass flow traveled 4.7 km over a vertical distance of 1320 m with an angle of reach of 15.8∘ and almost reached the Shaklysu river. A maximum trim line height of 92 m indicates a high flow velocity. Satellite imagery indicates that the glacier was non-existent in 2013 but built up mass until it detached in 2019.
-
In August 2006, satellite imagery indicates a similar event with a complete loss of the entire accumulation area (insets in Fig. 8).
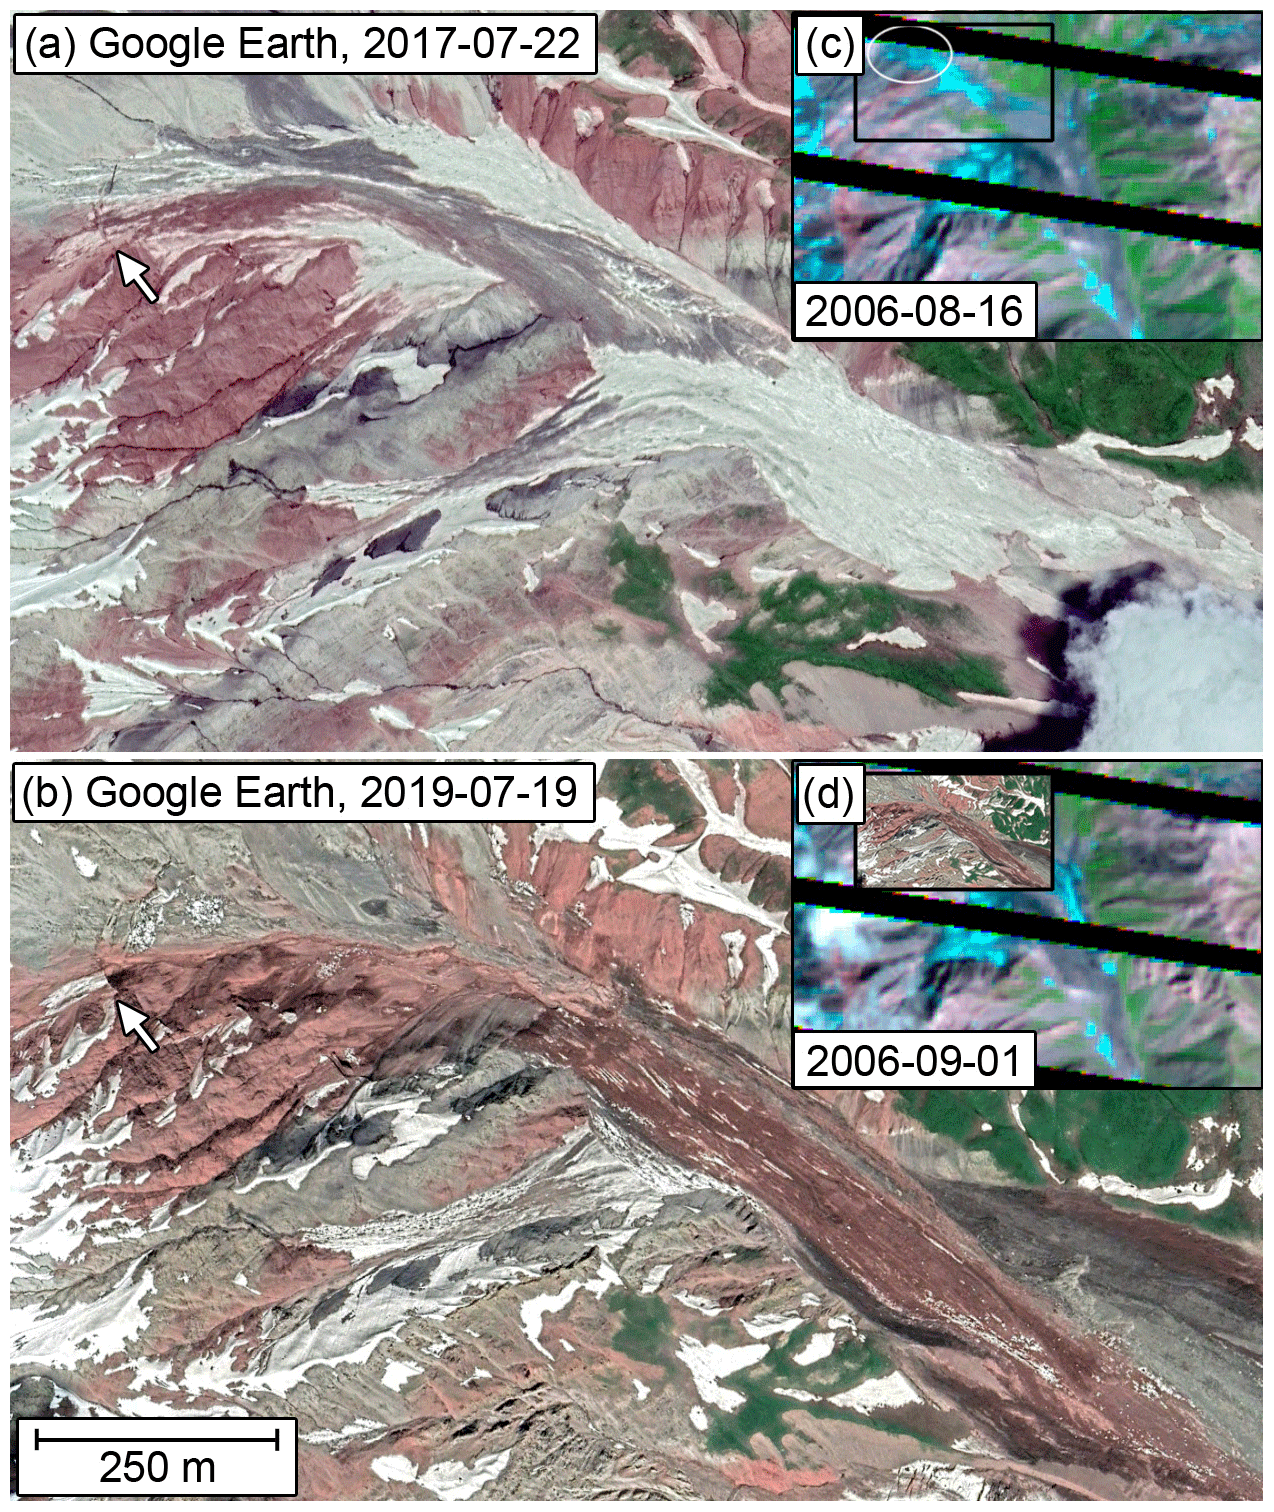
Figure 8Imagery from before (a) and after (b) the rock-ice avalanche sha-19 that caused the disappearance of a small glacier in a side valley of the Shaklysu river. White arrows indicate the detachment scarp. (c, d) At the same place (white circle) an earlier rock-ice avalanche (sha-06) happened. The black box in the inset corresponds to the outline of the main images. (a, b) © Google, Maxar Technologies. (c, d) Landsat-7 imagery courtesy of the US Geological Survey.
4.4 Meteorology and seismic activity
Almost all detected events (14 out of 17) occurred in years when the mean annual air temperature (MAAT) was above the 46-year trend (Fig. 9). Only the sk-94(r/i), the sk-06(i), and the shi-09(r) avalanches occurred in years with a MAAT below the trend. Except for rock avalanches, all events happened between June and September (Table 4) which are the warmest months of the year. We interpret this in the sense that temperature has a very strong impact on the occurrence of glacier detachments and rock-ice avalanches. No correlation to annual precipitation was found.
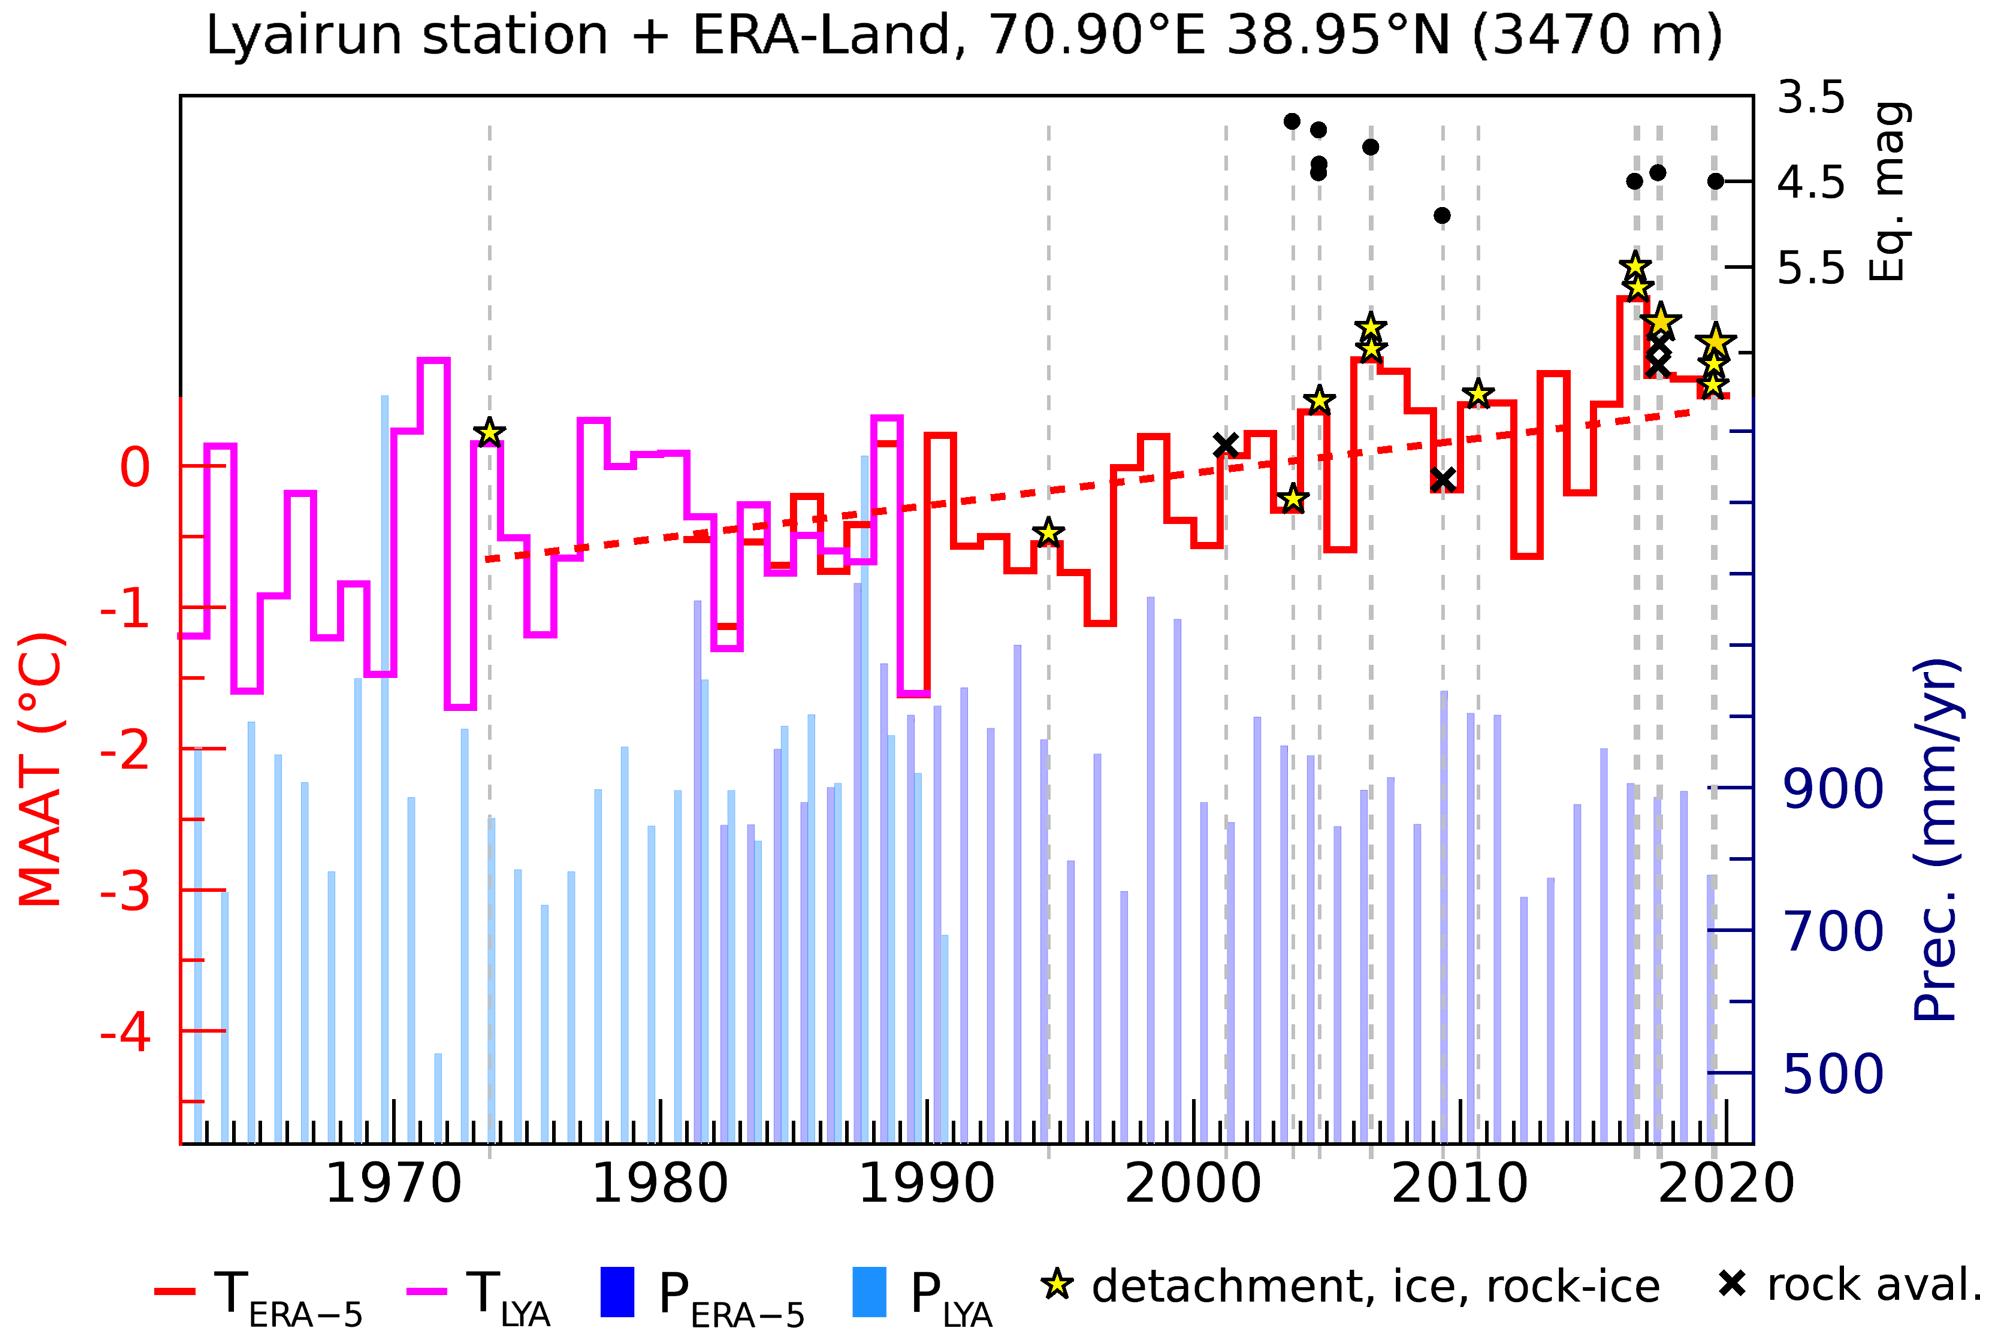
Figure 9Mean annual air temperature (MAAT) of ERA-5 Land reanalysis data obtained for 3470 m a.s.l. (red). The MAAT of the Lyairun station at 2008 m a.s.l. (magenta) was shifted to match the ERA data. The dashed red line indicates the temperature trend. Detachments and ice and rock-ice avalanches are indicated by ⋆ symbols and rock avalanches by + symbols. Symbols are vertically stacked when more than one event occurred in the same year. The magnitude of seismic events that occurred between the pre- and post event image (Table 4) and that are within the range indicated by the dotted line in Fig. 10 are indicated by black dots. Figure contains modified Copernicus Climate Change Service Information (2020); earthquake data from USGS via IRIS Data Services.
In our study area, we did not find an increased activity of mass flow events that we could relate to earthquakes. The magnitude and distance of all earthquakes which occurred within a radius of 500 km of the SK catchment are shown in Fig. 10 as gray dots. The solid line indicates the threshold for triggering disrupted landslides (Jibson, 2013). As we do not know the sensitivity of glacier detachments and rock-ice avalanches to earthquakes for our geological setting, we shifted the threshold for disrupted landslides by 1 and for earthquake magnitudes by 2 (dashed and dotted lines). Earthquakes that occurred between the pre-event and post-event satellite images listed in Table 4 and that are close enough and strong enough to be at least below the dotted line (magnitude for disrupted landslides – 2) are shown as black bullets. We found no mass flow events that could have been triggered by earthquakes below the dashed line (magnitude for disrupted landslides – 1). Because stronger earthquakes did not trigger any mass flows, we conclude that in our study area rock and ice avalanches and detachments are not especially sensitive to earthquakes.

Figure 10Proximity and magnitude of earthquakes which occurred within a 500 km radius around the analyzed catchment areas (gray dots). The solid line indicates the threshold for triggering disrupted landslides (Jibson, 2013); the dashed and dotted lines represent the same line but shifted by 1 and 2 magnitudes, respectively. Black dots indicate earthquakes that occurred between a pre- and post-event image of the analyzed events and that are closer or stronger to be located below the dotted threshold.
4.5 Comparison with surging glaciers in the Pamir
In total, we identified 237 glaciers in the entire Pamir mountains where the W3D–SRTM DEM difference showed a height change indicating either an active surge or a quiescence phase. Of these 188 showed both an elevation increase at the terminus and a decrease further up, 32 glaciers showed only an elevation increase at the terminus, and 17 seemed to be in a quiescent phase with strong melt at the tongue but mass gain in a possible reservoir area.
In the western Petra Pervogo range we found four surge-type glaciers, listed from east to west:
-
At 38.925∘ N, 70.524∘ E, a glacier surged between 2001 and 2006.
-
At 38.937∘ N, 70.695∘ E, a glacier surged between 1993 and 1996.
-
At 38.994∘ N, 70.725∘ E, a glacier surge started in June 1995 and advanced by a remarkable 2.3 km within 7 months. The glacier retreated and surged again between June 2015 and July 2016 with an advancement of 5 km.
-
The lower glacier entering the SK catchment from the left (Fig. 7) surged in autumn 1993 and also in 2010/11, each time entering the valley of the SK catchment.
The comparison in Fig. 11 of the slope and length of all surging glacier parts with the detached glaciers of the largest events, dp-19, sk-17, sk-03, and sk-04, and in addition with the Aru and Kolka–Karmadon detachments shows that glacier detachments occur predominantly for short but steep glaciers, at least when compared to glaciers which showed a surge-like instability in the past.
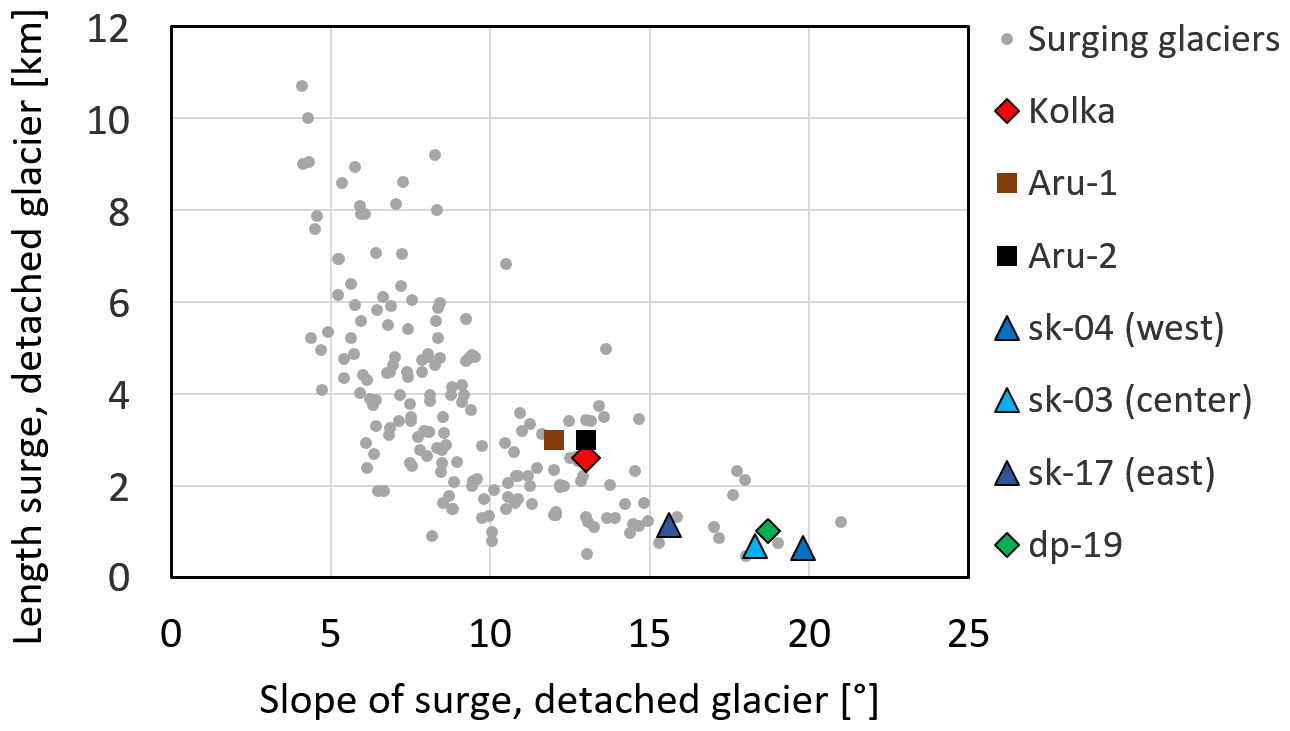
Figure 11Horizontal length over slope of the surging part of a glacier in the Pamir Mountains and surface slope of the detached parts of glacier detachments.
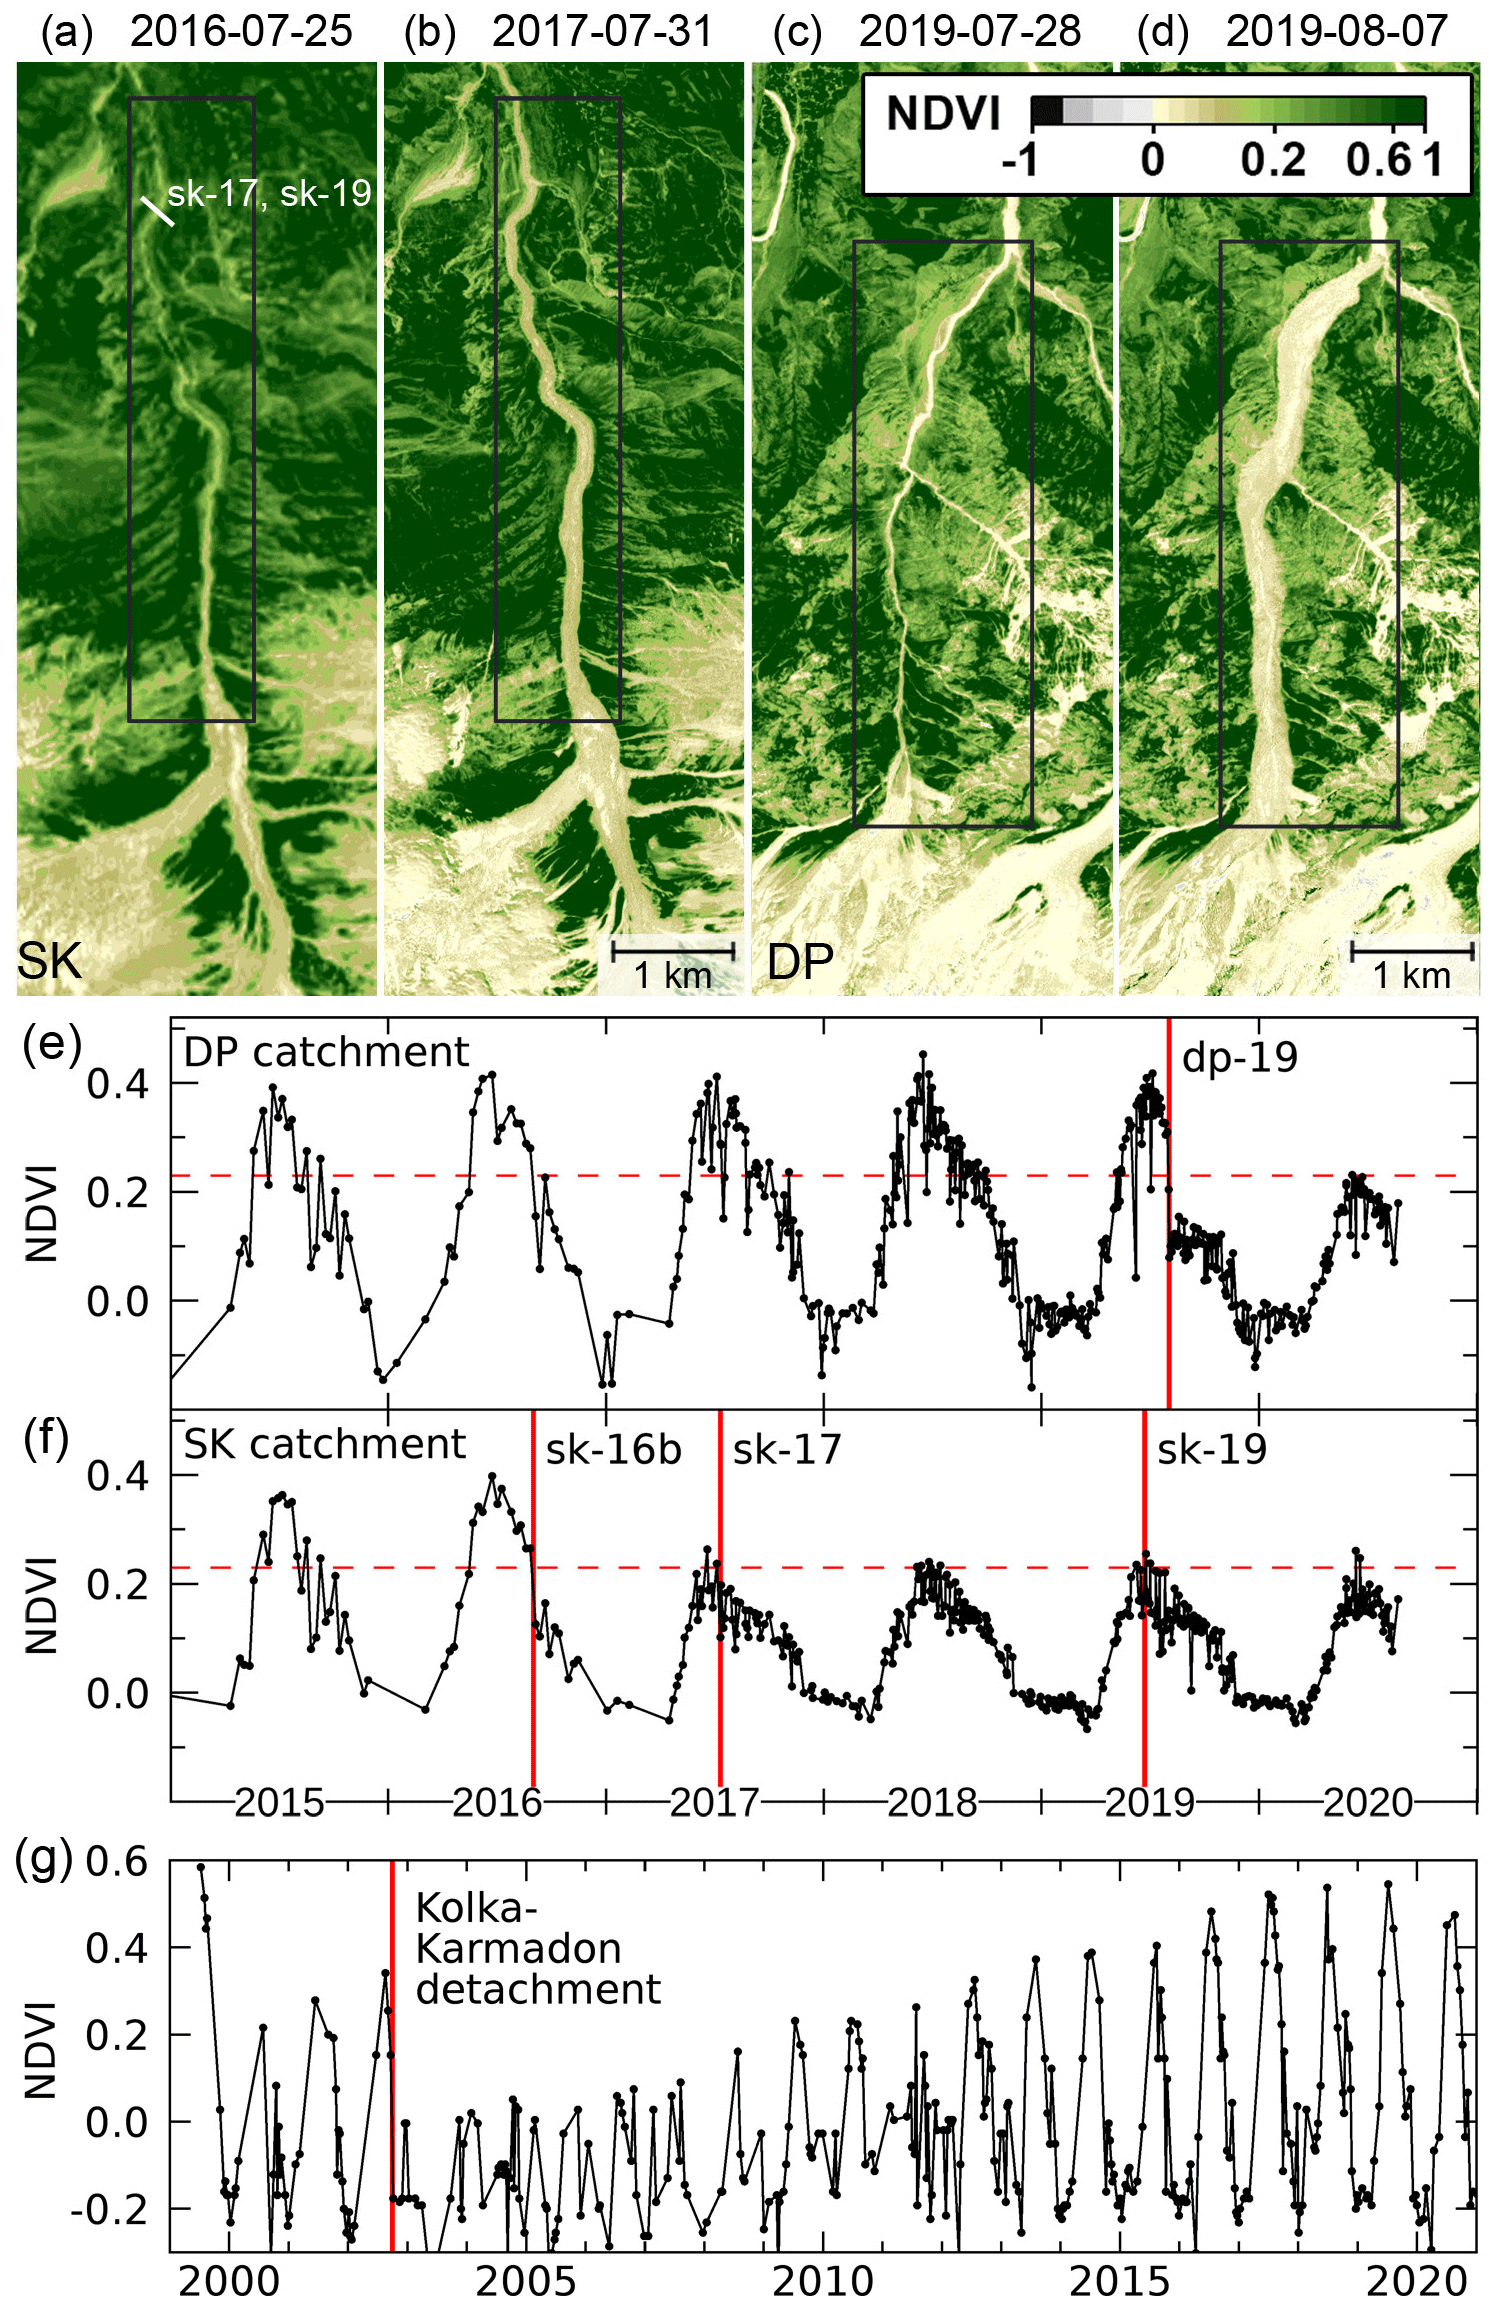
Figure 12(a–d) NDVI before and after the sk-16b and dp-19 detachments. The white bar in (a) indicates the end of the runout of the sk-17 and sk-19 events; the sk-16b mudflow in August 2016 traveled further downstream. (e, f) NDVI time series of the mean NDVI over the eroded area (black box in a–d) of the sk-16b and dp-19 events. Vegetation hardly recovered within 2 years. (g) NDVI time series from the runout of the Kolka–Karmadon detachment. Vegetation recovered within about 10–15 years. Copernicus Sentinel data (2020) and Landsat-8 image courtesy of the US Geological Survey.
4.6 Retroactive avalanche detection using NDVI
The largest mass flows in this study, sk16b, sk-17, sk-19, and dp-19, were identified by the destruction of vegetation in the valleys visible in satellite imagery. The analysis of time series of the NDVI evolution in the DP and SK catchments (Fig. 12) shows that vegetation did not recover within 2 years of the events. In the runout zone of the Kolka–Karmadon detachment, where a suitably long satellite time series exists and where no repeated avalanches occurred, vegetation recovery to pre-detachment NDVI values took around 10–15 years (Fig. 12g). The vegetation covered runout zones of the SK–DP catchments at roughly 2500 m and the runout of the Kolka–Karmadon detachment at 1800 m (Haeberli et al., 2004) show a similar climate, indicating that vegetation recovery times are comparable: for SK–DP we obtain a MAAT of +4.5 ∘C, comparable to the MAAT of +4.0 ∘C below the Kolka detachment. Therefore, we conclude that the chance of missing long runouts of mass flows that reach vegetated areas is very low when imagery every few years is available.
Unfortunately, most other avalanches traveled in already eroded valleys; therefore it was difficult to detect them by means of vegetation change only. We observed that the white color of ice avalanches quickly disappeared within a few days. Therefore, it is likely that smaller mass flows have been missed, especially in years with frequent cloud cover or few available satellite images.
The numerous recent discoveries of glacier detachments around the world (Kääb et al., 2018; Gilbert et al., 2018; Falaschi et al., 2019; Paul, 2019; Jacquemart et al., 2020; Kääb et al., 2021) have raised important questions about the conditions and triggers leading to these events. Our analysis of the 46 years of satellite records over the Petra Pervogo range has revealed a cluster of such events in a small geographical area that provides additional understanding of these catastrophic events, in particular with regard to the link between surging glaciers and glacier detachments and the influence of temperature and seismic activity.
5.1 Detachment detection
Analyzing the entire satellite record is not a foolproof approach since clouds and shadows can hamper the detection of certain events, but we always compared multiple consecutive images, as well as images acquired in the same month of consecutive years. While the traces left by smaller events easily disappear against the background of loose sediment and hillslopes free of vegetation, large events that reach vegetated areas leave distinct traces that can be detected for several years. Our analysis of vegetation recovery at Kolka–Karmadon (approximately 10 years), and the fact that we discovered sk-17 and dp-19 in this fashion, demonstrates how the NDVI and the vegetation-sensitive NIR channel are good means to detect long-runout events in remote sensing imagery, even years after they happened. Closer to the source, where there is typically no vegetation, the moisture-sensitive channels SWIR1 and SWIR2 of Landsat-7 and Landsat-8 allow for the detection of sediment-covered ice until at least a few weeks after detachment. Lastly, the low resolution of 80 and 30 m of Landsat 1–5, which lack a higher-resolution panchromatic channel, and especially the lower number of available images could impede the detection of some early events. To complement the drawbacks of detecting optically visible changes the differencing of high-resolution DEMs, acquired within a period of months to a few years, is undoubtedly the most reliable way to detect drastic changes in glaciated catchments; however, such DEM data are currently not acquired operationally and are only sparsely available in time and coverage. We found that weather-insensitive radar imagery is helpful to detect abrupt changes, but the bright backscatter signatures of ice avalanches disappear within a few days due to the low backscatter of melted ice. Because of the increasing availability of imagery (Fig. 2), we are relatively certain that our dataset is biased towards more frequent events; hence, no conclusion can be drawn from the relative frequency of detected events.
In contrast to the detection of past events, the detection of glaciers that may be prone to detach in the future is a much more difficult task. On sk-17 and dp-19, increased crevassing could be only seen in high-resolution images a few weeks prior to the detachment. This makes it extremely difficult to identify possible instabilities sufficiently early, especially when a glacier is not inspected on a regular basis. Similarly, the larger Aru glaciers also showed increased crevassing just a few weeks before their detachments (Kääb et al., 2018). Indeed, even the supposedly tell-tale crevasses do not always reliably predict a detachment. For example, a small glacier near the Guliya Ice Cap in the western Kunlun Shan has been showing detachment-like crevasses since early 2018 (Leinss et al., 2019) but has remained stable so far likely due to the stabilizing effect of its very broad tongue. Automated near-real-time velocity monitoring using very high-resolution sensors could be another option for early glacier hazard identification. However, based on our experience, the detached glaciers in the Petra Pervogo range are too small for current optical or radar sensors to provide reliable velocity estimates. Increased data bandwidth and imaging capabilities of future sensors and high-repeat-rate DEM differencing satellites could provide the required data for early detection of possible detachments. In the specific catchments of this study, where large mass flows occur frequently, in situ observations by radar or cameras could very likely act as relatively cheap warning systems to inform local populations in time.
5.2 Detachment characteristics and triggers
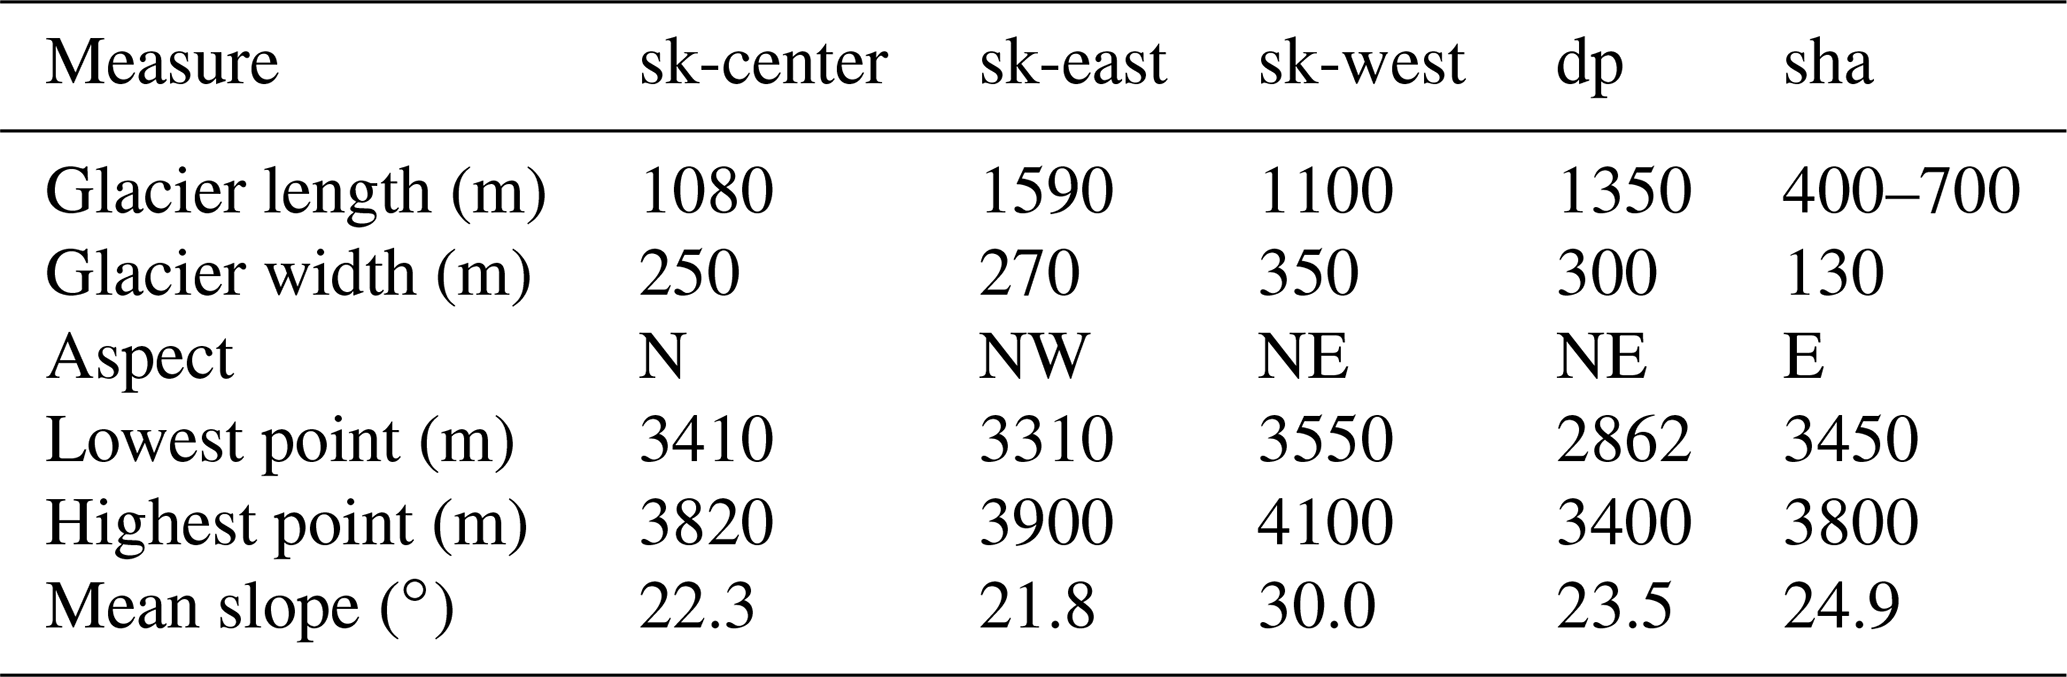
Fundamentally, the question of which events to classify as glacier detachments – failures of low-angle valley glaciers that involve substantial amounts of the glacier – is a tricky one when the observations are purely based on remotely sensed imagery. In our study region, the task is further complicated by widespread debris cover which makes it hard to delineate glaciers. While the boundaries of the glacier detachment category are certainly fuzzy, we have classified 5 of the 16 detected events listed in Table 3 as glacier detachments. The posterior analysis of the detachment events shows that all share the characteristic low to medium surface slope of the detached area (15–20∘) and that all occurred in a location where the GLIMS database (Raup et al., 2007) indicated the presence of a glacier. When using only satellite imagery for classification, the transition from detachment to rock-ice avalanche seems to be continuous as the amount of detached rock is hard to quantify and deposits can contain entrained sediments or sediments from the bedrock. Some of the events classified by us as rock-ice avalanche might well be glacier detachments of glaciers with a relatively steep slope (20–25∘). Remarkably, all events presented in this study happened within a roughly 30 km radius, and the glaciers in the catchment areas present very similar characteristics regarding elevation and aspect (Table 5), with the SK catchment, for which the GLIMS database lists five separate glaciers, appearing to provide particularly favorable conditions for detachments and rock-ice avalanches.
Table 5Characteristics of the glaciers listed by catchment where we identified detachments and rock-ice avalanches.
Henceforth, we focus our discussion on these events, in particular on the largest detachments, sk-17 and dp-19. In comparing these two events with other detachments described in the literature (in particular Aru, Kolka–Karmadon, and Flat Creek), we find similarities in slope, lithology, and the time of year of the events. Both images and the described lithology (sedimentary) suggest that the easily erodible bedrock and soft sediments are abundant in our study area. Similar to Kolka glacier, dp-19 was below a steep headwall and detached at the bergschrund so that the resulting mass movement involved basically the entire glacier.
As has been reported for other glacier detachments (Kääb et al., 2018; Gilbert et al., 2018; Jacquemart and Loso, 2019), there is a remarkable proximity, or in some cases overlap, between detaching and surging glaciers. Like others, we identified hundreds of surging glaciers throughout the Pamir, and the spatial distribution of the surging glaciers identified in our study is similar to Goerlich et al. (2020, their Fig. 6). By comparison of the spatial distribution of surging glaciers with the rock types according to the geological map by Ibrohim et al. (2020), we found that surging glaciers occur predominantly in regions with soft and fine-grained rock types. It is noteworthy, though the importance and effect are not yet well understood, that the glaciers that later detached (sk-17 and dp-19 in our study but also the Aru and Kolka glaciers) exhibited a slightly steeper slope and were relatively short compared to their non-detaching surging neighbors (Fig. 11). Both glaciers that generated the sk-17 and dp-19 events have surged in the past, but neither were they in the midst of a surge immediately before their detachment, nor did they show any surge-like behavior. They did, however, show a significant acceleration in the weeks prior to the detachment. Therefore, we do not believe that sk-17 or dp-19 were the consequence of a “runaway surge” but that both glacier surging and glacier detachments are favored by a soft sedimentary bedrock. We rather conclude that the detachments were triggered by external drivers: because velocities increased during or after snowmelt, we suspect that increased liquid water input played a crucial role in lubricating the glacier base or saturating the underlying glacier bed (Gilbert et al., 2018). This idea is supported by the fact that all detachments in this study happened in summer (end June–September) when more liquid water is available, making its influence on the glacier dynamics greater. We did not find any indication that earthquakes could have triggered the detachments or rock-ice avalanches in our study. Instead, we observed that 14 out of 17 mass movements, including 11 out of 13 detachments and ice or rock-ice avalanches, occurred in years when the mean annual air temperature was above the linear trend of the past 46 years. Even though we think that our dataset is biased towards the detection of more recent events, the comparison to the linear trend provides an indicator for the sensitivity to temperature, while the comparison to the, e.g., 30-year mean temperature should result in a observational bias that we tried to avoid.
The fact that relatively short and steep glaciers (compared to their surging neighbors) show detachments could be related to the reason that short glaciers are more likely to have a more homogeneous slope compared to long glaciers. When enhanced melt water lubricates the homogeneous base of a short glacier, it is more likely to detach compared to long glaciers where lubrication might cause a more local effect and could possibly initiate a surge cycle when a sufficiently high mass imbalance is present.
All of the investigated events were very mobile, though at first glance their mobility, characterized by an angle of reach of around α=10–15∘, was lower than that of the events at Aru and Kolka (α=5–8∘) (Huggel et al., 2005; Kääb et al., 2018). The lower mobility can be partly explained by the smaller volume involved (Petra-Pervogo: 3–9×10⁶ m3; the others 70–130×106 m3). However, if we compute the ratio between detachment volume and runout distance, the ratio is 1 to 2 orders of magnitude smaller compared to the Kolka and Aru detachments, indicating an extremely high mobility. This could be a consequence of the path geometry which channelized the avalanches over a very long distance in a narrow valley. The valleys of easily erodible sediments provided few obstacles and thus small energy loss. In addition, we think the exceptionally long runout of 19.1 km of the sk-16b event, whose angle of reach of α=7.7∘ is comparable to the other large events, was caused by entrainment of the ice–water–sediment mixture deposited in the catchment by the sk-16a event 5 weeks before. A video of the event shows that the debris flow is almost as liquid as water (Radio Ozodi, 2016).
In this study we built an inventory of glacier detachments and ice and rock-ice avalanches which occurred in the western Petra Pervogo range in Tajikistan. Compared to a handful of other large glacier detachments around the entire world, we found a cluster of at least five relatively small detachments and seven rock-ice avalanches within a radius of 30 km. The fact that multiple detachments occurred under very similar conditions (elevation, aspect, size, meteorological conditions) allows for studying external driving factors which can trigger the detachment of a valley glacier. We found that detachments occur in summer and in years with annual mean air temperature above the 46-year linear trend, indicating that high temperatures are an important factor favoring glacier detachments and rock-ice avalanches. By the comparison to the linear temperature trend instead of to the (rising) mean temperature, we avoided biased conclusions from the increasing number of detected events in more recent years which are likely the result of an observational bias caused by the increasing availability and resolution of satellite imagery. Despite being a seismic active region, we found that earthquakes are very unlikely to be the cause of the mass wasting events in our study area. Similar to other detachments, the glaciers in our study rest on a bedrock of soft sediments. For a rock-ice avalanche that occurred at the end of August 2016, we think that the entrainment of a sediment and ice debris mixture from a previous detachment of relatively small volume 5 weeks before was the reason of the resulting, extraordinarily long mudflow of 19.1 km. We also observed a spatial correlation between the occurrence of surging glaciers in the Pamir mountains and soft, fine-grained sediments. However, we did not observe that the studied glacier detachments were a consequence of surging, but we think that soft sediments are a prerequisite for detachments and at least a favorable factor for hydrologically controlled glacier surging. From the fact that the studied detached glaciers are shorter and steeper compared to surging glaciers in the same region, we hypothesize that melt water penetrating to the glacier base can lubricate major parts of the relatively small bedrock of soft sediments which then can lead to the detachment of the entire glacier, especially if the glacier is relatively steep and the destabilized area is not supported by a stabilizing tongue of lower slope. In contrast, for longer glaciers it is unlikely that the entire glacier loses friction at the bedrock, and it might instead be more likely that the glacier shows a temporary surge-like advance.
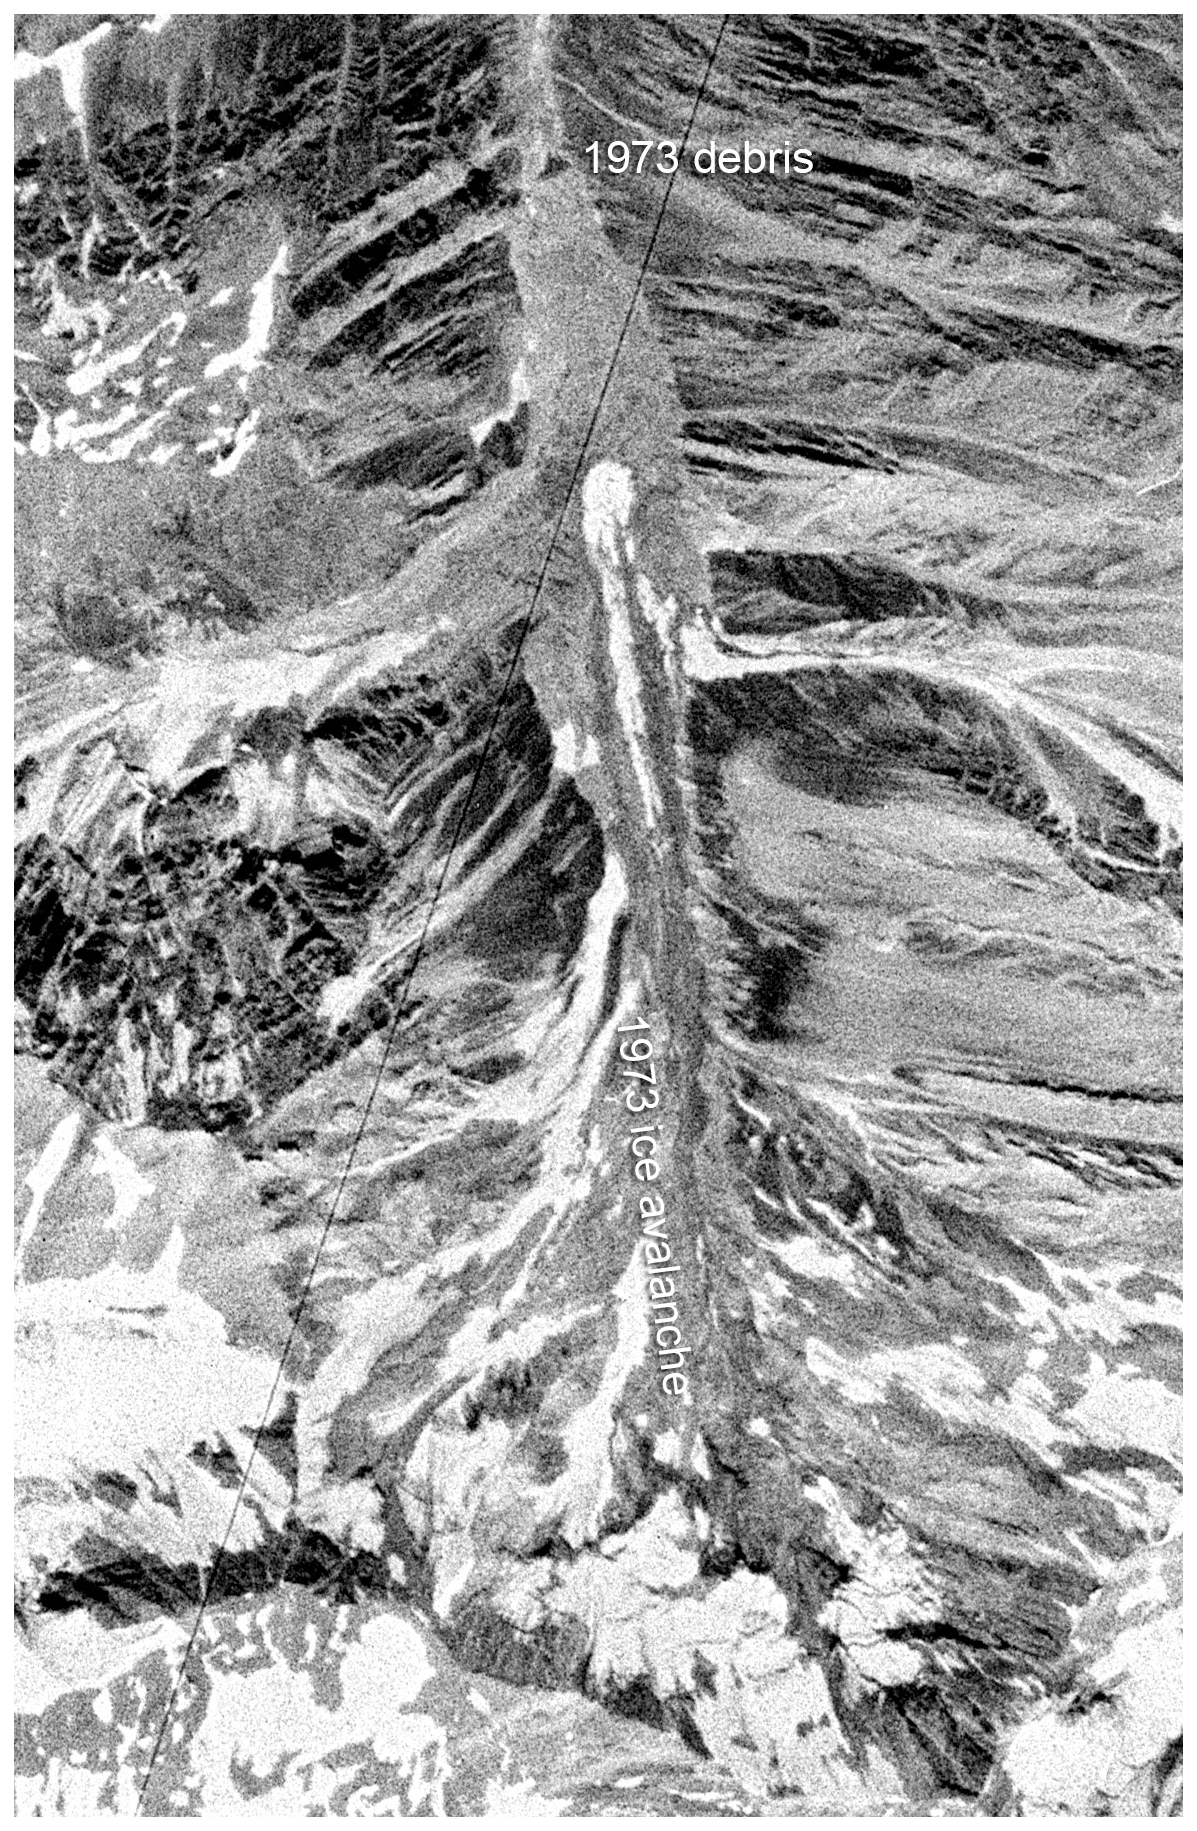
Figure A1KH-9 image of the SK-73 rock-ice avalanche in the eastern Shuraki Kapali catchment (3 August 1973). Courtesy of the US Geological survey.
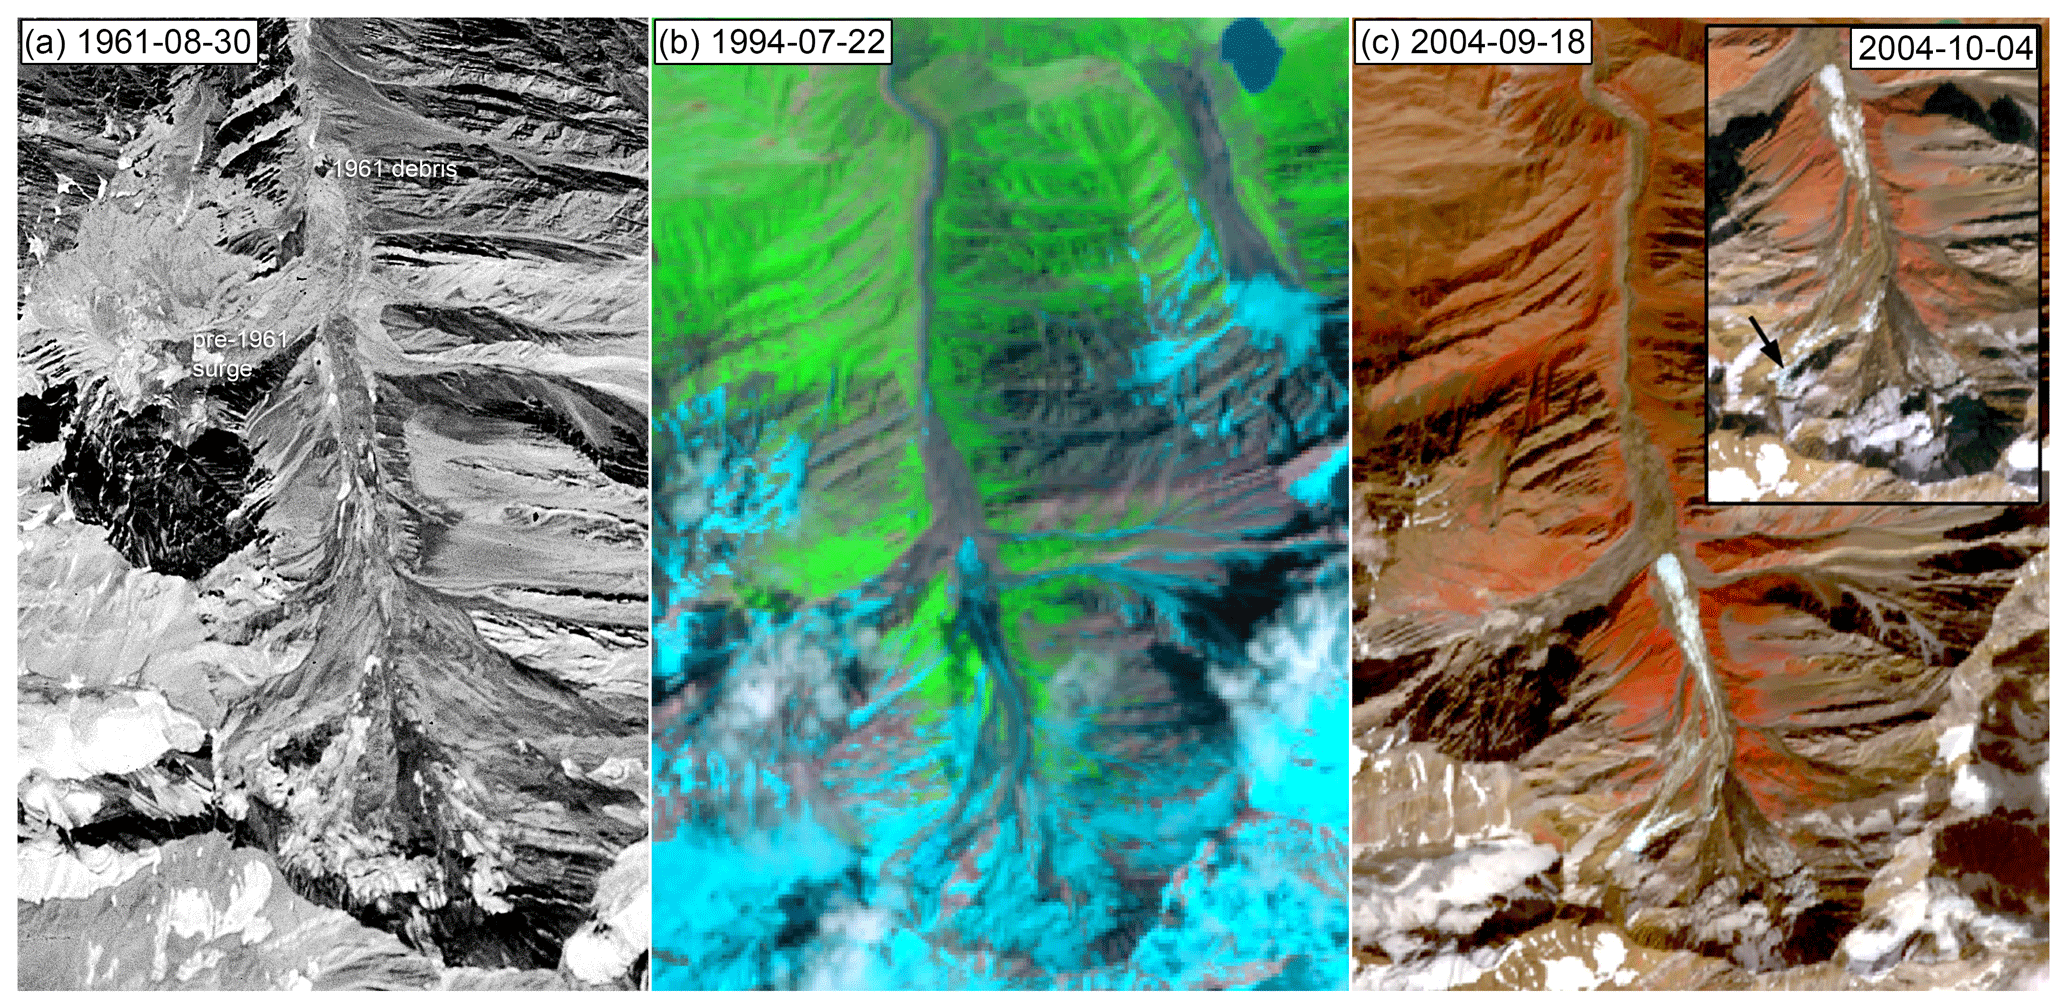
Figure A2(a) The KH-3 image from 30 August 1961 shows strong erosion in the entire Shuraki Kapali catchment. (b, c) Mass flow events in the western sub-catchment. (b) L5 image of the sk-94 rock-ice avalanche (22 July 1994). (c) ASTER image of the sk-04 detachment (18 September 2004) followed by an ice avalanche (inset: 4 October 2004). Imagery courtesy of the US Geological survey.
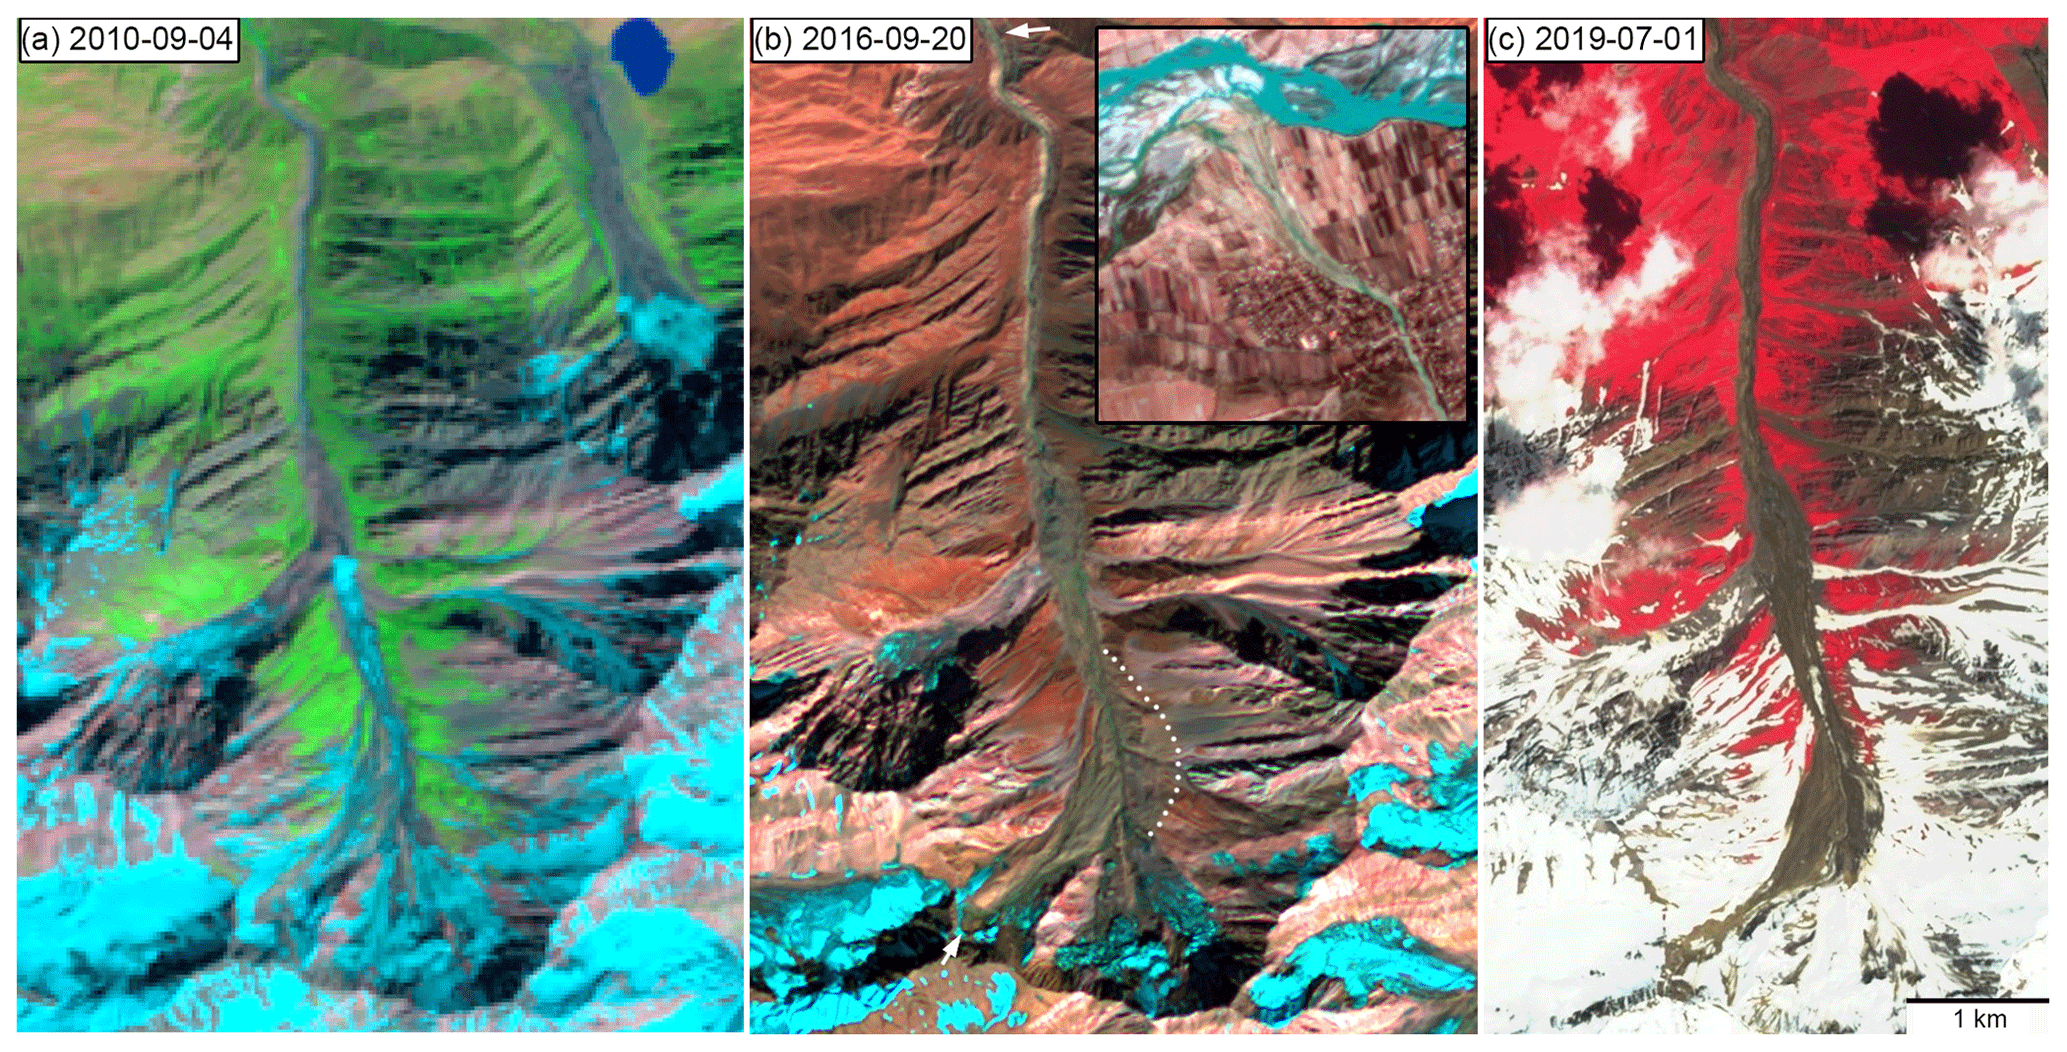
Figure A3Mass flow events in the western Shuraki Kapali sub-catchment (continued from Fig. A2). (a) L5 image of the sk-10 rock-ice avalanche (4 September 2010); (b) L8 image of the sk-16b rock-ice avalanche (20 September 2016). The trim line of the event is indicated by dots. The arrow in the western part of the catchment indicates where the rock/ice mass detached; the arrow in the downstream valley shows where trees were removed by the resulting mass flow. The inset shows the alluvial fan 19 km downstream where a mudflow reached the Surkhob river. (c) S2 image of the sk-19 rock-ice avalanche (1 July 2019). ASTER and L8 imagery courtesy of the US Geological Survey. Copernicus Sentinel data (2020).
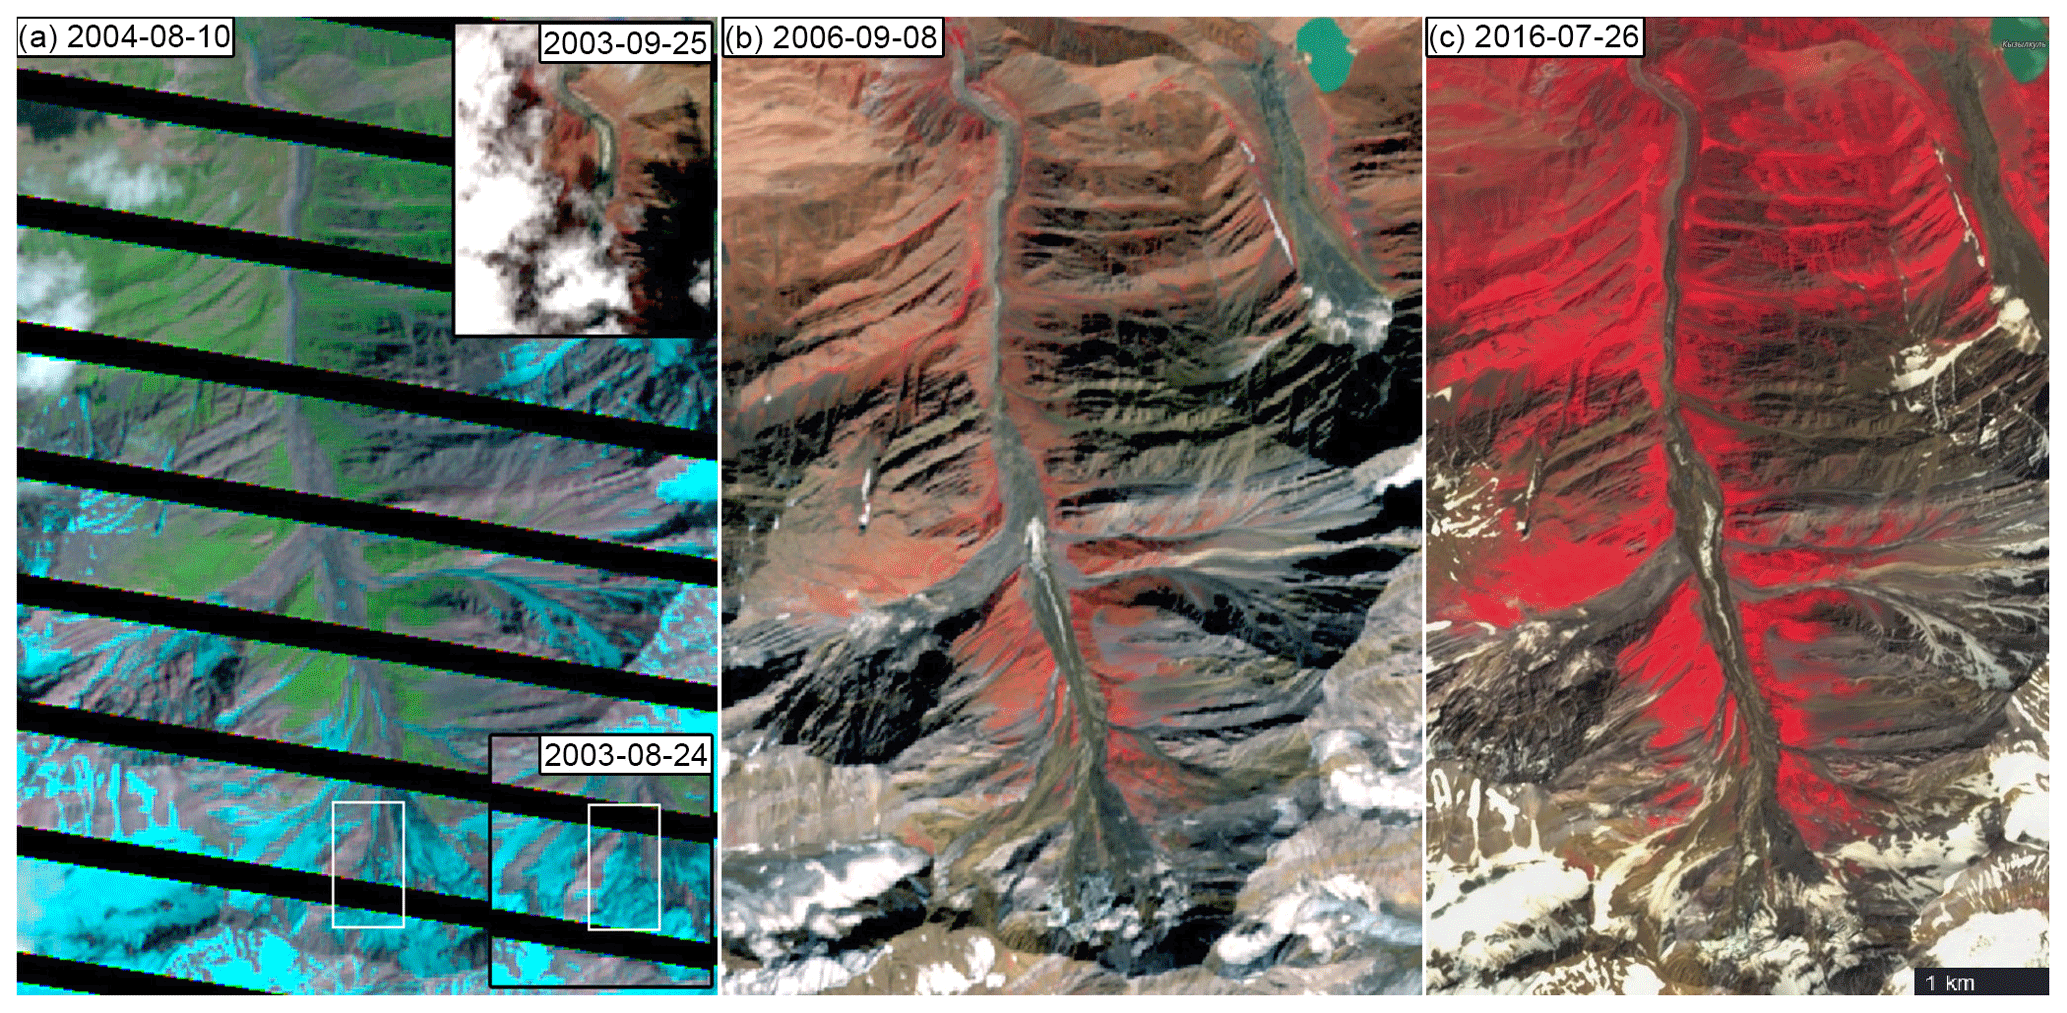
Figure A4Mass flow events in the central Shuraki Kapali sub-catchment (a) L7 image 1 year after the sk-03 detachment (10 August 2004). The lower inset shows the pre-event image (24 August 2003); the ice-rich runout is shown in the upper inset (ASTER, 25 September 2003). (b) ASTER image of the sk-06 ice avalanches that broke off above the sk-03 detachment (8 September 2006). (c) S2 image of the sk-16a detachment (26 July 2016) that originated from the same location as sk-03. Landsat-7 and ASTER image courtesy of the US Geological Survey. Copernicus Sentinel data (2020).
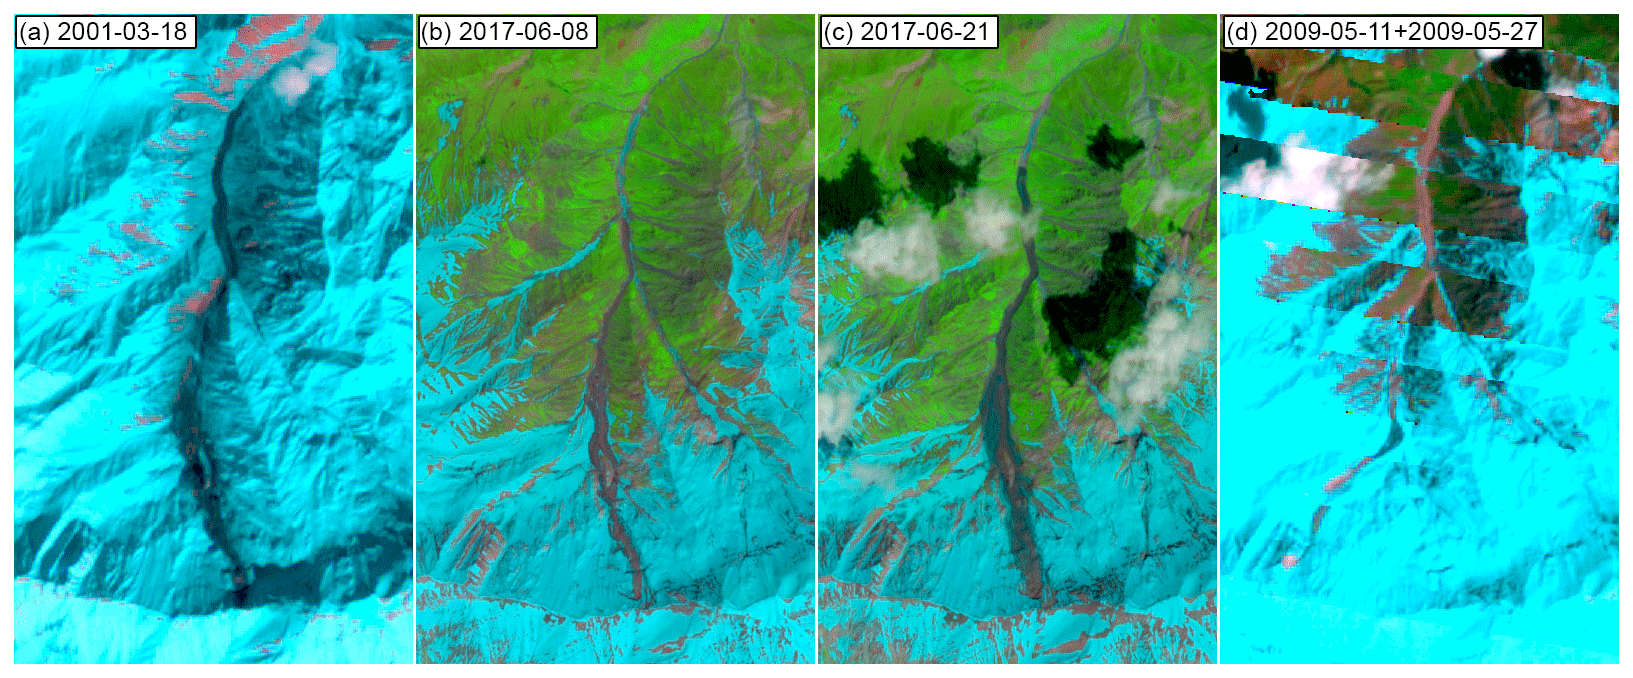
Figure A5(a–c) Rock avalanches traveling over glaciers in the eastern part of the Shikorchi catchment. (a) L7 of the shi-01 rock avalanche (18 March 2001). (b, c) S2 images of the first and second shi-17 rock avalanches (8 and 21 June 2017). (d) The shi-09 rock avalanche in the western part of the catchment (image composed from two L7 images from 11 and 27 May 2009. Landsat-7 image courtesy of the US Geological Survey. Copernicus Sentinel data (2020).
S2, L1–8, ASTER, and Sentinel-1 data are available in the Google Earth Engine data catalogue and were processed with the Google Earth Engine (Gorelick et al., 2017) with Java scripts available on request from the authors. Some Copernicus S2 data and USGS L8 data were also processed by ESA and downloaded from the Sentinel hub with the EO Browser: https://www.sentinel-hub.com/explore/eobrowser/ (last access: 4 May 2021) (Sinergise Laboratory, 2021). Declassified Keyhole imagery is available from the NASA USGS Earth Explorer https://earthexplorer.usgs.gov/ (last access: 4 May 2021) (USGS, 2021). TanDEM-X data are available from DLR: https://tandemx-science.dlr.de/ (last access: 4 May 2021) (DLR, 2021) and were provided by the proposal leinss_XTI_GLAC6600. DigitalGlobe data were provided by the Commercial Archive Data for NASA investigators (https://cad4nasa.gsfc.nasa.gov/, last access: 22 July 2020) (NGA, 2020) under the National Geospatial-Intelligence Agency's NextView license agreement. The SRTM DEM is available from the USGS; the W3D is commercially available at 5 m resolution, but we used the freely available 30 m resolution provided by JAXA. The facilities of IRIS Data Services, and specifically the IRIS Data Management Center, were used for accessing the seismic products used in this study. IRIS Data Services are funded through the Seismological Facilities for the Advancement of Geoscience (SAGE) award of the National Science Foundation under cooperative support agreement EAR-1851048.
SL, EB, and MJ jointly wrote the manuscript. SL processed the TanDEM-X data and wrote the Google Earth scripts. SL and EB analyzed the data. MJ computed the WorldView DEM differences and calculated uncertainty estimates. MD provided relevant local information, initiated the seismic study, and indicated two of the detachments. SL coordinated the study.
The authors declare that they have no conflict of interest.
The authors thank Mike Willis and Brie Corsa for troubleshooting and running the SETSM processing and Irena Hajnsek for her support of this study.
Mylène Jacquemart was funded through a NASA Earth and Space Science fellowship.
This paper was edited by Pascal Haegeli and reviewed by two anonymous referees.
Bessette-Kirton, E. K. and Coe, J. A.: A 36-year record of rock avalanches in the Saint Elias Mountains of alaska, with implications for future hazards, Front. Earth Sci., 8, 293, https://doi.org/10.3389/feart.2020.00293, 2020. a
Clarke, G., Collins, S., and Thompson, D.: Flow, thermal structure, and subglacial conditions of a surge-type glacier, Can. J. Earth Sci., 21, 232–240, https://doi.org/10.1139/e84-024, 2011. a
Copernicus Climate Change Service – C3S: C3S ERA5-Land reanalysis, https://doi.org/10.24381/cds.68d2bb30, 2019. a
Cuffey, K. M. and Paterson, W. S. B.: The physics of glaciers, Academic Press, Amsterdam, Boston, Heidelberg, London, New York, Oxford, Paris, San Diego, San Francisco, Singapore, Sydney, Tokyo, 2010. a
Davies, T. R. H.: Spreading of rock avalanche debris by mechanical fluidization, Rock Mech., 15, 9–24, https://doi.org/10.1007/BF01239474, 1982. a
DLR – German Aerospace Center: TanDEM-X Science Service System, available at: https://tandemx-science.dlr.de/, last access: 4 May 2021. a
Dokukin, M.: Glacier collapse on the slope of the Peter 1 Range (Tajikistan) in 2017 (Sentinel 2A), available at: https://twitter.com/inrushmd/status/1059061814691012608 (last access: 4 May 2021), 2018. a
Dokukin, M. D., Bekkiev, M. Y., Kalov, R. H., Savernuk, E. A., and Chernomorets, S. S.: Signs of catastrophic glacier detachments (Analysis of multitemporal space information), in: Dangerous natural and technogenic processes in mountain regions: models, systems and technologies, edited by: Nikolaev, A. and Zaalishvili, V., 522–528, available at: https://istina.msu.ru/publications/article/266605247/ (last access: 4 May 2021), 2019. a, b, c
Drobyshev, V.: Glacial catastrophe of 20 September 2002 in North Osetia, Russ. J. Earth Sci., 8, 1–25, https://doi.org/10.2205/2006ES000207, 2006. a
Evans, S. G. and Delaney, K. B.: Chapter 16 – Catastrophic Mass Flows in the Mountain Glacial Environment, in: Snow and Ice-Related Hazards, Risks and Disasters, edited by: Shroder, J. F., Haeberli, W., and Whiteman, C., Academic Press, Boston, 563–606, https://doi.org/10.1016/B978-0-12-394849-6.00016-0, 2015. a, b, c, d
Evans, S. G., Tutubalina, O. V., Drobyshev, V. N., Chernomorets, S. S., McDougall, S., Petrakov, D. A., and Hungr, O.: Catastrophic detachment and high-velocity long-runout flow of Kolka Glacier, Caucasus Mountains, Russia in 2002, Geomorphology, 105, 314–321, https://doi.org/10.1016/j.geomorph.2008.10.008, 2009. a, b
Faillettaz, J., Sornette, D., and Funk, M.: Numerical modeling of a gravity-driven instability of a cold hanging glacier: reanalysis of the 1895 break-off of Altelsgletscher, Switzerland, J. Glaciol., 57, 817–831, https://doi.org/10.3189/002214311798043852, 2011. a
Falaschi, D., Kääb, A., Paul, F., Tadono, T., Rivera, J., and Lenzano, L.: Brief communication: Collapse of 4 Mm3 of ice from a cirque glacier in the Central Andes of Argentina, The Cryosphere, 13, 997–1004, https://doi.org/10.5194/tc-13-997-2019, 2019. a, b
Farr, T. G., Rosen, P. A., Caro, E., Crippen, R., Duren, R., Hensley, S., Kobrick, M., Paller, M., Rodriguez, E., Roth, L., Seal, D., Shaffer, S., Shimada, J., Umland, J., Werner, M., Oskin, M., Burbank, D., and Alsdorf, D.: The Shuttle Radar Topography Mission, Rev. Geophys., 45, RG2004, https://doi.org/10.1029/2005RG000183, 2007. a, b
Finaev, A., Shiyin, L., Weijia, B., and Li, J.: Climate Change and Water Potential of the Pamir Mountains, Geogr. Environ. Sustainabil., 9, 88–105, https://doi.org/10.15356/2071-9388_03v09_2016_06, 2016. a
Gilbert, A., Leinss, S., Kargel, J., Kääb, A., Gascoin, S., Leonard, G., Berthier, E., Karki, A., and Yao, T.: Mechanisms leading to the 2016 giant twin glacier collapses, Aru Range, Tibet, The Cryosphere, 12, 2883–2900, https://doi.org/10.5194/tc-12-2883-2018, 2018. a, b, c, d, e, f, g
Goerlich, F., Bolch, T., and Paul, F.: More dynamic than expected: an updated survey of surging glaciers in the Pamir, Earth Syst. Sci. Data, 12, 3161–3176, https://doi.org/10.5194/essd-12-3161-2020, 2020. a, b
Gorelick, N., Hancher, M., Dixon, M., Ilyushchenko, S., Thau, D., and Moore, R.: Google Earth Engine: Planetary-scale geospatial analysis for everyone, Remote Sens. Environ., 202, 18–27, https://doi.org/10.1016/j.rse.2017.06.031, 2017. a
Haeberli, W., Huggel, C., Kääb, A., Zgraggen-Oswald, S., Polkvoj, A., Galushkin, I., Zotikov, I., and Osokin, N.: The Kolka-Karmadon rock/ice slide of 20 September 2002: an extraordinary event of historical dimensions in North Ossetia, Russian Caucasus, J. Glaciol., 50, 533–546, https://doi.org/10.3189/172756504781829710, 2004. a
Harrison, W. D. and Post, A. S.: How much do we really know about glacier surging?, Ann. Glaciol., 36, 1–6, https://doi.org/10.3189/172756403781816185, 2003. a
Huggel, C., Zgraggen-Oswald, S., Haeberli, W., Kääb, A., Polkvoj, A., Galushkin, I., and Evans, S. G.: The 2002 rock/ice avalanche at Kolka/Karmadon, Russian Caucasus: assessment of extraordinary avalanche formation and mobility, and application of QuickBird satellite imagery, Nat. Hazards Earth Syst. Sci., 5, 173–187, https://doi.org/10.5194/nhess-5-173-2005, 2005. a, b
Ibrohim, A., Verhov, V. I., Dyakov, Y. A., Vlasov, N., Bakhtdavlatov, R. D., Rahmonov, I. U., Bobomurodov, O. M., Nurov, T., and Ormonov, O.: Geological and Mineral Resource Map of Tajikistan, available at: http://www.geoportal-tj.org/index.php/geology/deposits, last access: 3 August 2020. a, b
Jacquemart, M. and Loso, M.: Catastrophic Glacier Collapse and Debris Flow at Flat Creek, Wrangell-St. Elias National Park and Preserve, Alaska Park Sci., 1, 16–25, 2019. a, b, c
Jacquemart, M., Loso, M., Leopold, M., Welty, E., Berthier, E., Hansen, J. S., Sykes, J., and Tiampo, K.: What drives large-scale glacier detachments? Insights from Flat Creek glacier, St. Elias Mountains, Alaska, Geology, 48, 703–707, https://doi.org/10.1130/G47211.1, 2020. a, b, c, d, e
Jibson, R.: 7.23 Mass-Movement Causes: Earthquakes, in: Treatise on Geomorphology, edited by: Shroder, J. F., Academic Press, San Diego, 223–229, https://doi.org/10.1016/B978-0-12-374739-6.00169-X, 2013. a, b, c
Kääb, A., Bolch, T., Casey, K., Heid, T., Kargel, J. S., Leonard, G. J., Paul, F., and Raup, B. H.: Glacier Mapping and Monitoring Using Multispectral Data, Springer, Berlin, Heidelberg, 75–112, https://doi.org/10.1007/978-3-540-79818-7_4, 2014. a
Kääb, A., Leinss, S., Gilbert, A., Bühler, Y., Gascoin, S., Evans, S. G., Bartelt, P., Berthier, E., Brun, F., Chao, W.-A., Farinotti, D., Gimbert, F., Guo, W., Huggel, C., Kargel, J. S., Leonard, G., Tian, L., Treichler, D., and Yao, T.: Massive collapse of two glaciers in Western Tibet in 2016 after surge-like instability, Nat. Geosci., 11, 114–120, https://doi.org/10.1038/s41561-017-0039-7, 2018. a, b, c, d, e, f, g, h, i, j
Kääb, A., Jacquemart, M., Gilbert, A., Leinss, S., Girod, L., Huggel, C., Falaschi, D., Ugalde, F., Petrakov, D., Chernomorets, S., Dokukin, M., Paul, F., Gascoin, S., Berthier, E., and Kargel, J.: Sudden large-volume detachments of low-angle mountain glaciers – more frequent than thought?, The Cryosphere, 15, 1–36, https://doi.org/10.5194/tc-15-1-2021, 2021. a, b, c
Kamb, B., Raymond, C., Harrison, W., Engelhardt, H., Echelmeyer, K., Humphrey, N., Brugman, M., and Pfeffer, W.: Glacier Surge Mechanism: 1982–1983 Surge of Variegated Glacier, Alaska, Science, 227, 469–79, https://doi.org/10.1126/science.227.4686.469, 1985. a
Krieger, G., Fiedler, H., Zink, M., Hajnsek, I., Younis, M., Huber, S., Bachmann, M., Hueso Gonzalez, J., Werner, M., and Moreira, A.: TanDEM-X: A satellite formation for high-resolution SAR interferometry, IEEE T. Geosci. Remote, 45, 3317–3341, https://doi.org/10.1109/TGRS.2007.900693, 2007. a
Leinss, S. and Bernhard, P.: TanDEM-X: deriving height and velocity dynamics of Great Aletsch Glacier, IEEE J. Select. Top. Remote Sens., accepted, 2021. a
Leinss, S., Willimann, C., and Hajnsek, I.: Glacier Detachment Hazard Analysis in the West Kunlun Shan Mountains, in: IGARSS 2019–2019 IEEE International Geoscience and Remote Sensing Symposium, 28 July–2 August 2019, Yokohama, Japan, 4565–4568, 2019. a
Miles, E. S., Watson, C. S., Brun, F., Berthier, E., Esteves, M., Quincey, D. J., Miles, K. E., Hubbard, B., and Wagnon, P.: Glacial and geomorphic effects of a supraglacial lake drainage and outburst event, Everest region, Nepal Himalaya, The Cryosphere, 12, 3891–3905, https://doi.org/10.5194/tc-12-3891-2018, 2018. a
Moore, P. L.: Deformation of debris-ice mixtures, Rev. Geophys., 52, 435–467, https://doi.org/10.1002/2014RG000453, 2014. a, b
Neigh, C., Masek, J., and Nickeson, J.: High-resolution satellite data open for government research, EOS Trans. Am. Geophys. Union, 94, 121–123, https://doi.org/10.1002/2013EO130002, 2013. a, b
NGA – National Geospatial-Intelligence Agency: Commercial Archive Data for NASA investigators, available at: https://cad4nasa.gsfc.nasa.gov/, last access: 22 July 2020. a
Noh, M. J. and Howat, I. M.: The Surface Extraction from TIN based Search-space Minimization (SETSM) algorithm, ISPRS J. Photogram. Remote Sens,, 129, 55–76, https://doi.org/10.1016/j.isprsjprs.2017.04.019, 2017. a, b
Nuth, C. and Kääb, A.: Co-registration and bias corrections of satellite elevation data sets for quantifying glacier thickness change, The Cryosphere, 5, 271–290, https://doi.org/10.5194/tc-5-271-2011, 2011. a, b
Obu, J., Westermann, S., Bartsch, A., Berdnikov, N., Christiansen, H. H., Dashtseren, A., Delaloye, R., Elberling, B., Etzelmüller, B., Kholodov, A., Khomutov, A., Kääb, A., Leibman, M. O., Lewkowicz, A. G., Panda, S. K., Romanovsky, V., Way, R. G., Westergaard-Nielsen, A., Wu, T., Yamkhin, J., and Zou, D.: Northern Hemisphere permafrost map based on TTOP modelling for 2000–2016 at 1 km2 scale, Earth-Sci. Rev., 193, 299–316, https://doi.org/10.1016/j.earscirev.2019.04.023, 2019. a
Paul, F.: Repeat glacier collapses and surges in the Amney Machen mountain range, Tibet, possibly triggered by a developing rock-slope instability, Remote Sens., 11, 708, https://doi.org/10.3390/rs11060708, 2019. a, b
Petrakov, D. A., Chernomorets, S. S., Evans, S. G., and Tutubalina, O. V.: Catastrophic glacial multi-phase mass movements: a special type of glacial hazard, Adv. Geosci., 14, 211–218, https://doi.org/10.5194/adgeo-14-211-2008, 2008. a
Radio Ozodi: https://rus.ozodi.org/a/27952776.html, last access: 4 May 2021, Radio Ozodi Bureau, Dushanbe, Tadschikistan, 29 August 2016. a, b, c
Raup, B., Racoviteanu, A., Khalsa, S. J. S., Helm, C., Armstrong, R., and Arnaud, Y.: The GLIMS geospatial glacier database: a new tool for studying glacier change, Global. Planet. Change, 56, 101–110, https://doi.org/10.1016/j.gloplacha.2006.07.018, 2007. a, b
Rignot, E., Echelmeyer, K., and Krabill, W.: Penetration depth of interferometric synthetic-aperture radar signals in snow and ice, Geophys. Res. Lett., 28, 3501–3504, https://doi.org/10.1029/2000GL012484, 2001. a
Scheidegger, A. E.: On the prediction of the reach and velocity of catastrophic landslides, Rock Mech., 5, 231–236, https://doi.org/10.1007/BF01301796, 1973. a
Schneider, D., Huggel, C., Haeberli, W., and Kaitna, R.: Unraveling driving factors for large rock–ice avalanche mobility, Earth Surf. Proc. Land., 36, 1948–1966, https://doi.org/10.1002/esp.2218, 2011. a, b
Schurr, B., Ratschbacher, L., Sippl, C., Gloaguen, R., Yuan, X., and Mechie, J.: Seismotectonics of the Pamir, Tectonics, 33, 1501–1518, https://doi.org/10.1002/2014TC003576, 2014. a
Sevestre, H. and Benn, D. I.: Climatic and geometric controls on the global distribution of surge-type glaciers: implications for a unifying model of surging, J. Glaciol., 61, 646–662, https://doi.org/10.3189/2015JoG14J136, 2015. a
Sinergise Laboratory: Sentinel Hub, available at: https://www.sentinel-hub.com/explore/eobrowser/, last access: 4 May 2021. a
Tadono, T., Nagai, H., Ishida, H., Oda, F., Naito, S., Minakawa, K., and Iwamoto, H.: Generation of the 30m-mesh global digital surface model by ALOS PRISM, ISPRS - International Archives of the Photogrammetry, Remote Sens. Spat. Inform. Sci., XLI-B4, 157–162, https://doi.org/10.5194/isprs-archives-XLI-B4-157-2016, 2016. a, b
Tajik telegraph agency: https://tajikta.tj/ru/news/v-tadzhikistane-stikhiya-nanesla-ushcherb-mestnym-zhitelyam- razrushiv-most-i-10-domov (last access: 4 May 2021), 29 August 2016. a
USGS: What are the best Landsat spectral bands for use in my research?, available at: https://www.usgs.gov/faqs/what-are-best-landsat-spectral-bands-use-my-research?qt-news_science_products (last access: 3 February 2021), 2020. a
USGS – US Geological Survey: USGS Earth explorer [without NASA], available at: https://earthexplorer.usgs.gov/, last access: 4 May 2021. a
Williams, M. W. and Konovalov, V. G.: Central Asia temperature and precipitation data, 1879–2003, Version 1. Lyakhsh station, NSIDC – National Snow and Ice Data Center, Boulder, Colorado, USA, https://doi.org/10.7265/N5NK3BZ8, 2008. a