the Creative Commons Attribution 4.0 License.
the Creative Commons Attribution 4.0 License.
 | 31 Mar 2021
The heavy precipitation event of 14–15 October 2018 in the Aude catchment: a meteorological study based on operational numerical weather prediction systems and standard and personal observations
Marc Mandement
François Bouttier
Judith Eeckman
Cindy Lebeaupin Brossier
Alexane Lovat
Olivier Nuissier
Olivier Laurantin
The case of the heavy precipitation event on 14 and 15 October 2018 which has led to severe flash flooding in the Aude watershed in south-western France is studied from a meteorological point of view using deterministic and probabilistic numerical weather prediction systems, as well as a unique combination of observations from both standard and personal weather stations. This case features typical characteristics of Mediterranean heavy precipitation events such as its classic synoptic situation and its quasi-stationary convective precipitation that regenerates continuously, as well as some peculiarities such as the presence of a former hurricane and a pre-existing cold air mass close to the ground.
Mediterranean Sea surface temperature and soil moisture anomalies are briefly reviewed, as they are known to play a role in this type of hydrometeorological events. A study of rainfall forecasts shows that the event had limited predictability, in particular given the small size of the watersheds involved. It is shown that the stationarity of precipitation, whose estimation benefits from data from personal stations, is linked to the presence near the ground of a trough and a strong potential virtual temperature gradient, the stationarity of both of which is highlighted by a combination of observations from standard and personal stations. The forecast that comes closest to the rainfall observations contains the warmest, wettest, and fastest low-level jet and also simulates near the ground a trough and a marked boundary between cold air in the west and warm air in the east, both of which are stationary.
- Article
(18022 KB) - Full-text XML
- BibTeX
- EndNote


Heavy precipitation events (HPEs) are common in coastal regions bordering the Mediterranean (e.g. Ricard et al., 2012). These events regularly cause flash floods with tragic consequences, as the catchment areas affected are small and therefore react very quickly (Sivapalan et al., 2002; Berne et al., 2004; Creutin et al., 2009). The mechanisms at the origin of heavy rainfall involve the Mediterranean Sea, the relief, and a favourable synoptic situation. The combination of these three ingredients can, however, lead to a multitude of different configurations. The interactions between relief and atmospheric circulation can be particularly complex. In addition to the simple uplift of a moist, unstable low-level jet by the relief, other more complex mechanisms can take place, such as the creation of convergence zones through deflection or channelling of this jet by the relief. Pre-existing thunderstorms can also have an effect on the initiation of new convective cells, particularly through the creation of a density current that can initiate deep convection at its leading edge. The most extreme events may be due to the stationary nature of the precipitation or its long duration.
In order to anticipate these events and reduce their impact, it is necessary to set up forecasting chains ranging from numerical rainfall forecasting to impacts on property and people, ideally by propagating uncertainties along this chain. For some time now, initiatives have been advancing in the integration of forecast chains, giving rise to the prospect of improvements in the effectiveness of these warning systems. For instance, the European COST 731 Action “Propagation of uncertainty in advanced meteo-hydrological forecast systems” promoted the use of integrated flood forecasting models and systems (Rossa et al., 2011). Later, the DRIHM (Distributed Research Infrastructure for Hydro-Meteorology) and DRIHM2US (Distributed Research Infrastructure for Hydro-Meteorology to United States of America) projects (Parodi et al., 2017) aimed to facilitate research on hydrometeorological forecast chains by developing a distributed infrastructure integrating numerical weather prediction systems, hydrological models and hydraulic models. National initiatives such as PICS (Payrastre et al., 2019) aim to enhance and transfer these advances from research to operations by designing and evaluating integrated forecast chains capable of anticipating the impacts of flash floods within a few hours, notably through interactions between various scientific teams (meteorologists, hydrologists, hydraulic engineers, economists, sociologists) and operational stakeholders (civil security, local authorities, insurance companies, hydropower companies, transport network operators). At the international level, the High-Impact Weather (HIWeather; Jones et al., 2014) project, under the World Weather Research Programme (WWRP) of the World Meteorological Organization (WMO), promotes international collaborative research to significantly increase resilience to extreme weather around the world by improving forecasts for periods ranging from a few minutes to 2 weeks and enhancing their communication and usefulness in social, economic and environmental applications. Concerning extreme hydrometeorological events, uncertainties in numerical rainfall prediction remain particularly important and constitute a bottleneck for improving the efficiency of flood forecast chains (e.g. Hally et al., 2015). A better understanding of heavy rainfall events is necessary to identify the weaknesses of numerical weather prediction systems and thus focus efforts on the most critical aspects of these systems, be they observations, model parameterizations, resolution or others. This was, for example, the objective of the Hydrological in the Mediterranean Experiment First Special Observation Period (Ducrocq et al., 2014) that took place in the north-western Mediterranean in autumn 2012.
Here, we are interested in a case of a Mediterranean HPE that entailed dramatic consequences. On the night of 14 to 15 October 2018, the Aude, and to a lesser extent, the Hérault and the Tarn departments, in the south of France, were affected by heavy rainfall. A regenerative multicellular convective system affected the region. This led to flash floods that caused the death of 15 people and injured 75 people; 7000 homes were flooded and 24 000 people suffered material damages for a cost of several hundred million euros. During the event, the villages of Pezens and Conques-sur-Orbiel were completely evacuated. Victims and damage were particularly concentrated in the area on the left bank of the Aude, between the Orbiel and Fresquel rivers but not necessarily on these rivers (Villegailhenc is located on the ungauged Trapel stream). This case was chosen because it has had particularly dramatic consequences but also because of the atypical joint presence of a former hurricane (Leslie) and a near-ground cold air mass. The 2018 floods took place 19 years after one of the major precipitating episodes recorded in the same region, the episode of 12–13 November 1999 (Nuissier et al., 2008; Ducrocq et al., 2008). In 2018, the maximum rainfall occurred about 30 km west of the one observed in 1999.
The objective of this article is to examine operational weather forecasts and standard and crowd-sourced observations to highlight the meteorological processes that characterize this extreme hydrometeorological event. Among the innovative tools used to carry out this undertaking, storm-scale ensemble forecasting enables correlations between processes to be identified and data from personal weather stations make it possible to observe, at unprecedented spatial resolutions, the near-ground meteorological signatures of the precipitating system and its environment responsible for the flash flood.
Section 2 describes the model and observational meteorological data used in this study. The case of 14–15 October 2018 is then described in Sect. 3 using global analyses and radar observations. The performance of the different forecasting systems is then evaluated in Sect. 4, in particular in order to relate the presence or absence of ingredients according to whether the forecasts simulate the event correctly or not. Section 5 builds on the previous one to investigate the links between rainfall and other meteorological signatures. Conclusions are presented in Sect. 6.
In this section, the numerical weather prediction (NWP) systems used in this study are first presented. Radar observations and weather station observations are then described.
2.1 NWP systems
The suite of Météo-France NWP systems is used in this study. This includes ARPEGE (Action de Recherche Petite Échelle Grande Échelle), a global spectral model with variable resolution and a four-dimensional variational (4D-Var) data assimilation system (Courtier et al., 1991). Besides ARPEGE, different NWP systems based on Applications of Research to Operations at Mesoscale (AROME) are used, such as AROME-France (Seity et al., 2011; Brousseau et al., 2016) and its ensemble prediction version AROME-EPS (Bouttier et al., 2012; Raynaud and Bouttier, 2016; Bouttier et al., 2016). AROME features a non-hydrostatic dynamical model core inherited from ALADIN (Aire Limitée Adaptation dynamique Développement InterNational) (Members of the ALADIN international team, 1997; Termonia et al., 2018), detailed moist physics shared with the non-hydrostatic mesoscale atmospheric model (Meso-NH) (Lafore et al., 1998; Lac et al., 2018), and an associated three-dimensional variational (3D-Var) data assimilation scheme (Brousseau et al., 2011). AROME runs at horizontal resolutions at which deep convection is largely resolved. There is therefore no parameterization of deep convection activated for the AROME-based models used in this study.
AROME-France is used by Météo-France for short-term (up to 2 d) regional forecasts over France at a horizontal resolution of 1.3 km and 90 vertical levels. Analyses are performed every hour and longer forecasts are run every 6 h.
AROME-EPS is a 12-member ensemble based on perturbations of the AROME-France model at a resolution of 2.5 km in 2018. The AROME-EPS system is updated every 6 h, and it samples the forecast uncertainties using perturbations of the initial condition (atmosphere and surface), large-scale coupling, and model equation (using stochastic physics perturbations). The system is extensively documented in the references given above.
2.2 Radar observations
The operational weather radar network in metropolitan France was composed of 30 radars in October 2018. In this study, the French operational base reflectivity, i.e. measured at the lowest elevation angle of the radar, mosaicked from these 30 radars is used. It has a 1 km ×1 km spatial resolution and a 5 min temporal resolution with reflectivities ranging from −9 to 70 dBZ with a 0.5 dBZ step. For every pixel in the mosaic, the maximum base reflectivity from radars distant by 180 km or less is taken. If the pixel is distant by more than 180 km to every radar, the maximum base reflectivity of radars at a distance between 180 and 250 km is taken. More details on the French radar network are given by Figueras i Ventura and Tabary (2013).
During the event, the radar located in Opoul suffered several down times, at 20:45, 21:05, and 21:30 UTC on 14 October and between 21:55 and 06:05 UTC on 15 October. As a result, reflectivity and derived products have been mainly underestimated around this radar at these times.
2.3 Surface observations
Surface observations result from the combination of standard weather stations (SWSs), which are Météo-France operational weather stations sampling atmospheric parameters at a time step of 1 min on the one hand, and crowd-sourced personal weather stations (PWSs), on the other hand. The PWS time series of mean sea level pressure (MSLP), temperature, and relative humidity are processed following the method presented by Mandement and Caumont (2020a). Gridded analyses of surface pressure, mean sea level pressure, temperature, relative humidity, and virtual potential temperature derived from observations near the ground are built at a 5 min time step and 0.01∘ resolution in latitude and longitude. For MSLP and relative humidity, the gridding method used is the inverse distance weighting (IDW) with a power factor of 2. For surface pressure and temperature, the method used is a linear regression over the altitude followed by the IDW with a power factor of 2 of the residuals. Virtual potential temperature fields are built from the previous fields. Details are given by Mandement and Caumont (2020a).
For rainfall, the ANTILOPE (ANalyse spaTiaLisée hOraire des PrEcipitations) quantitative precipitation estimate (QPE) algorithm (Laurantin, 2008, 2013) is used. In this study, PWS data are included in ANTILOPE QPE, which improves the operational output on all sub-basins where independent rainfall observations are available. The ANTILOPE algorithm and the evaluation of the inclusion of PWS data is detailed in Appendix A.
An overview of the case is first given from the point of view of the meteorological context. The ARPEGE model is used for this. The case is then described from a hydrometeorological point of view, this time using standard and personal observations.
3.1 Meteorological context
During the week of 10–15 October 2018, several coastal regions neighbouring the north-western Mediterranean basin were concerned by intense precipitating episodes. The Balearic Islands were the first impacted by very heavy downpour, on the night of 9 October 2018, that have ravaged the eastern coast of Mallorca, killing 13 people and causing considerable material damage (Lorenzo-Lacruz et al., 2019). A few days later, the southern regions of France (especially the Aude department) were affected, in turn, by heavy precipitation. The meteorological context during the period was characterized by slow-evolving patterns including high values of geopotential at 500 hPa centred over central Europe and surges of geopotential anomalies over western Atlantic and Iberian Peninsula. These meteorological conditions are typical synoptic-scale patterns favouring heavy precipitation over the north-western part of the Mediterranean (Nuissier et al., 2008; Ricard et al., 2012; Duffourg et al., 2016, among others).
Furthermore, the remnants of hurricane Leslie, over the Atlantic Ocean, could also have enhanced these severe weather conditions over western Europe. Indeed, after having made two transitions into a subtropical storm, Leslie was a large, erratic, and long-lived tropical cyclone in the Atlantic which finally became a powerful hurricane-force post-tropical system just west of the coast of Portugal. The lower- (upper-)level synoptic situation over north-eastern Atlantic Ocean and western Europe is presented in Figs. 1 and 2, from 18:00 UTC on 12 October until 06:00 UTC on 15 October 2018. Leslie strengthened over the north-eastern Atlantic and reached a peak intensity with sustained winds of 150 km h−1 and a minimum central pressure of 969 hPa on 12 October (not shown). Leslie then accelerated north-eastwards on 13 October while gradually weakening and interacting with an upper-level trough which forced its transition into an extratropical cyclone (Fig. 1a, b). The remnants of Leslie impacted western Europe in two ways: (i) a direct impact over land where winds reaching up to 175 km h−1 were recorded in Portugal and (ii) very moist low-level air masses were advected downstream of the Leslie–trough merged system and fed a quasi-stationary cold front over south-western France in the night of 14 October, generating heavy thunderstorms and leading to flash flooding in that area. Figure 1d shows that the anomalies of specific humidity calculated between 0 and 3 km altitude exceeded by 3 standard deviations over a region between the Balearic Islands and Strait of Gibraltar. This very high water vapour might be related to warm anomalies at the sea surface already present over the North Atlantic at midlatitudes in spring and the hurricane season. A significant surface low-pressure deepening occurred when the remnants of Leslie and the associated upper-level geopotential anomalies crossed through and moved downstream of the Iberian Peninsula’s steep orography (Fig. 2c, d). A strengthening low-level flow then establishes over the Mediterranean Sea and conveys very high low-level moisture content towards coastal regions of south-eastern France.
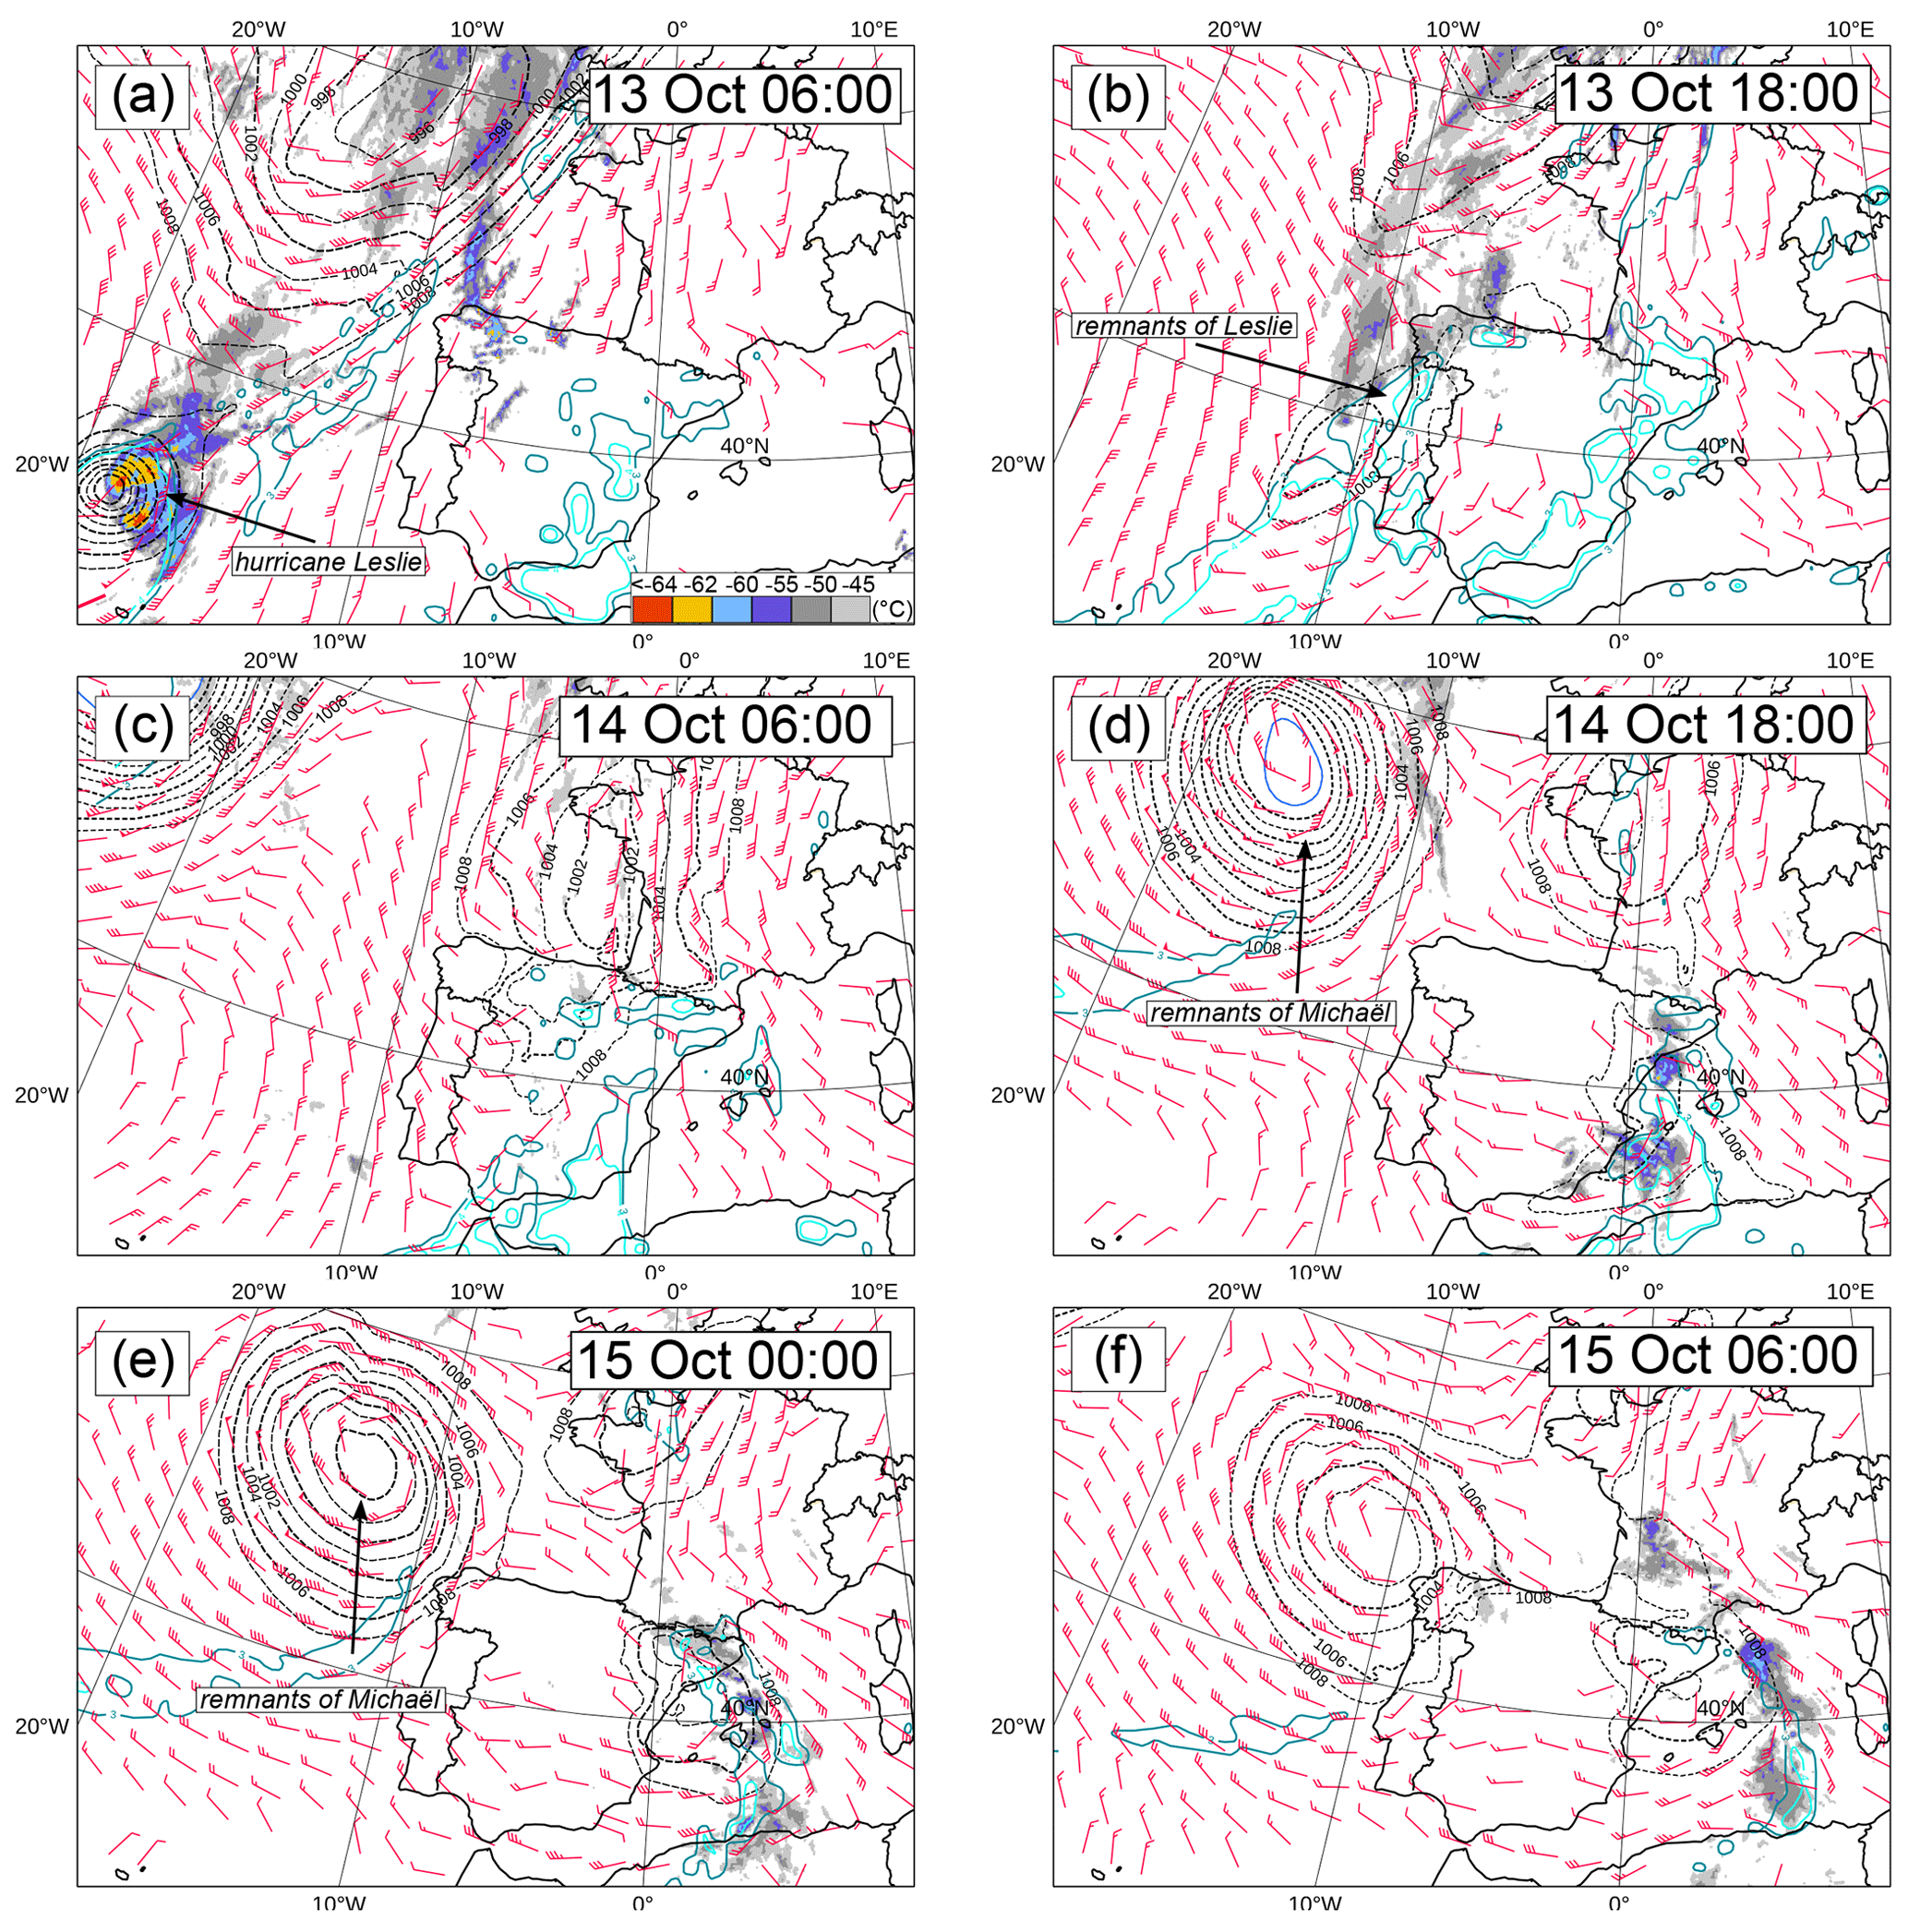
Figure 1Infrared satellite images superimposed to ARPEGE analysis in terms of mean sea level pressure (dotted lines, hPa), horizontal winds at 925 hPa (barbs, knots), and anomalies of specific humidity (solid lines, g kg−1) exceeding 3 and 4 standard deviations, respectively, between 0 and 3 km height and over the domain shown in the figure.
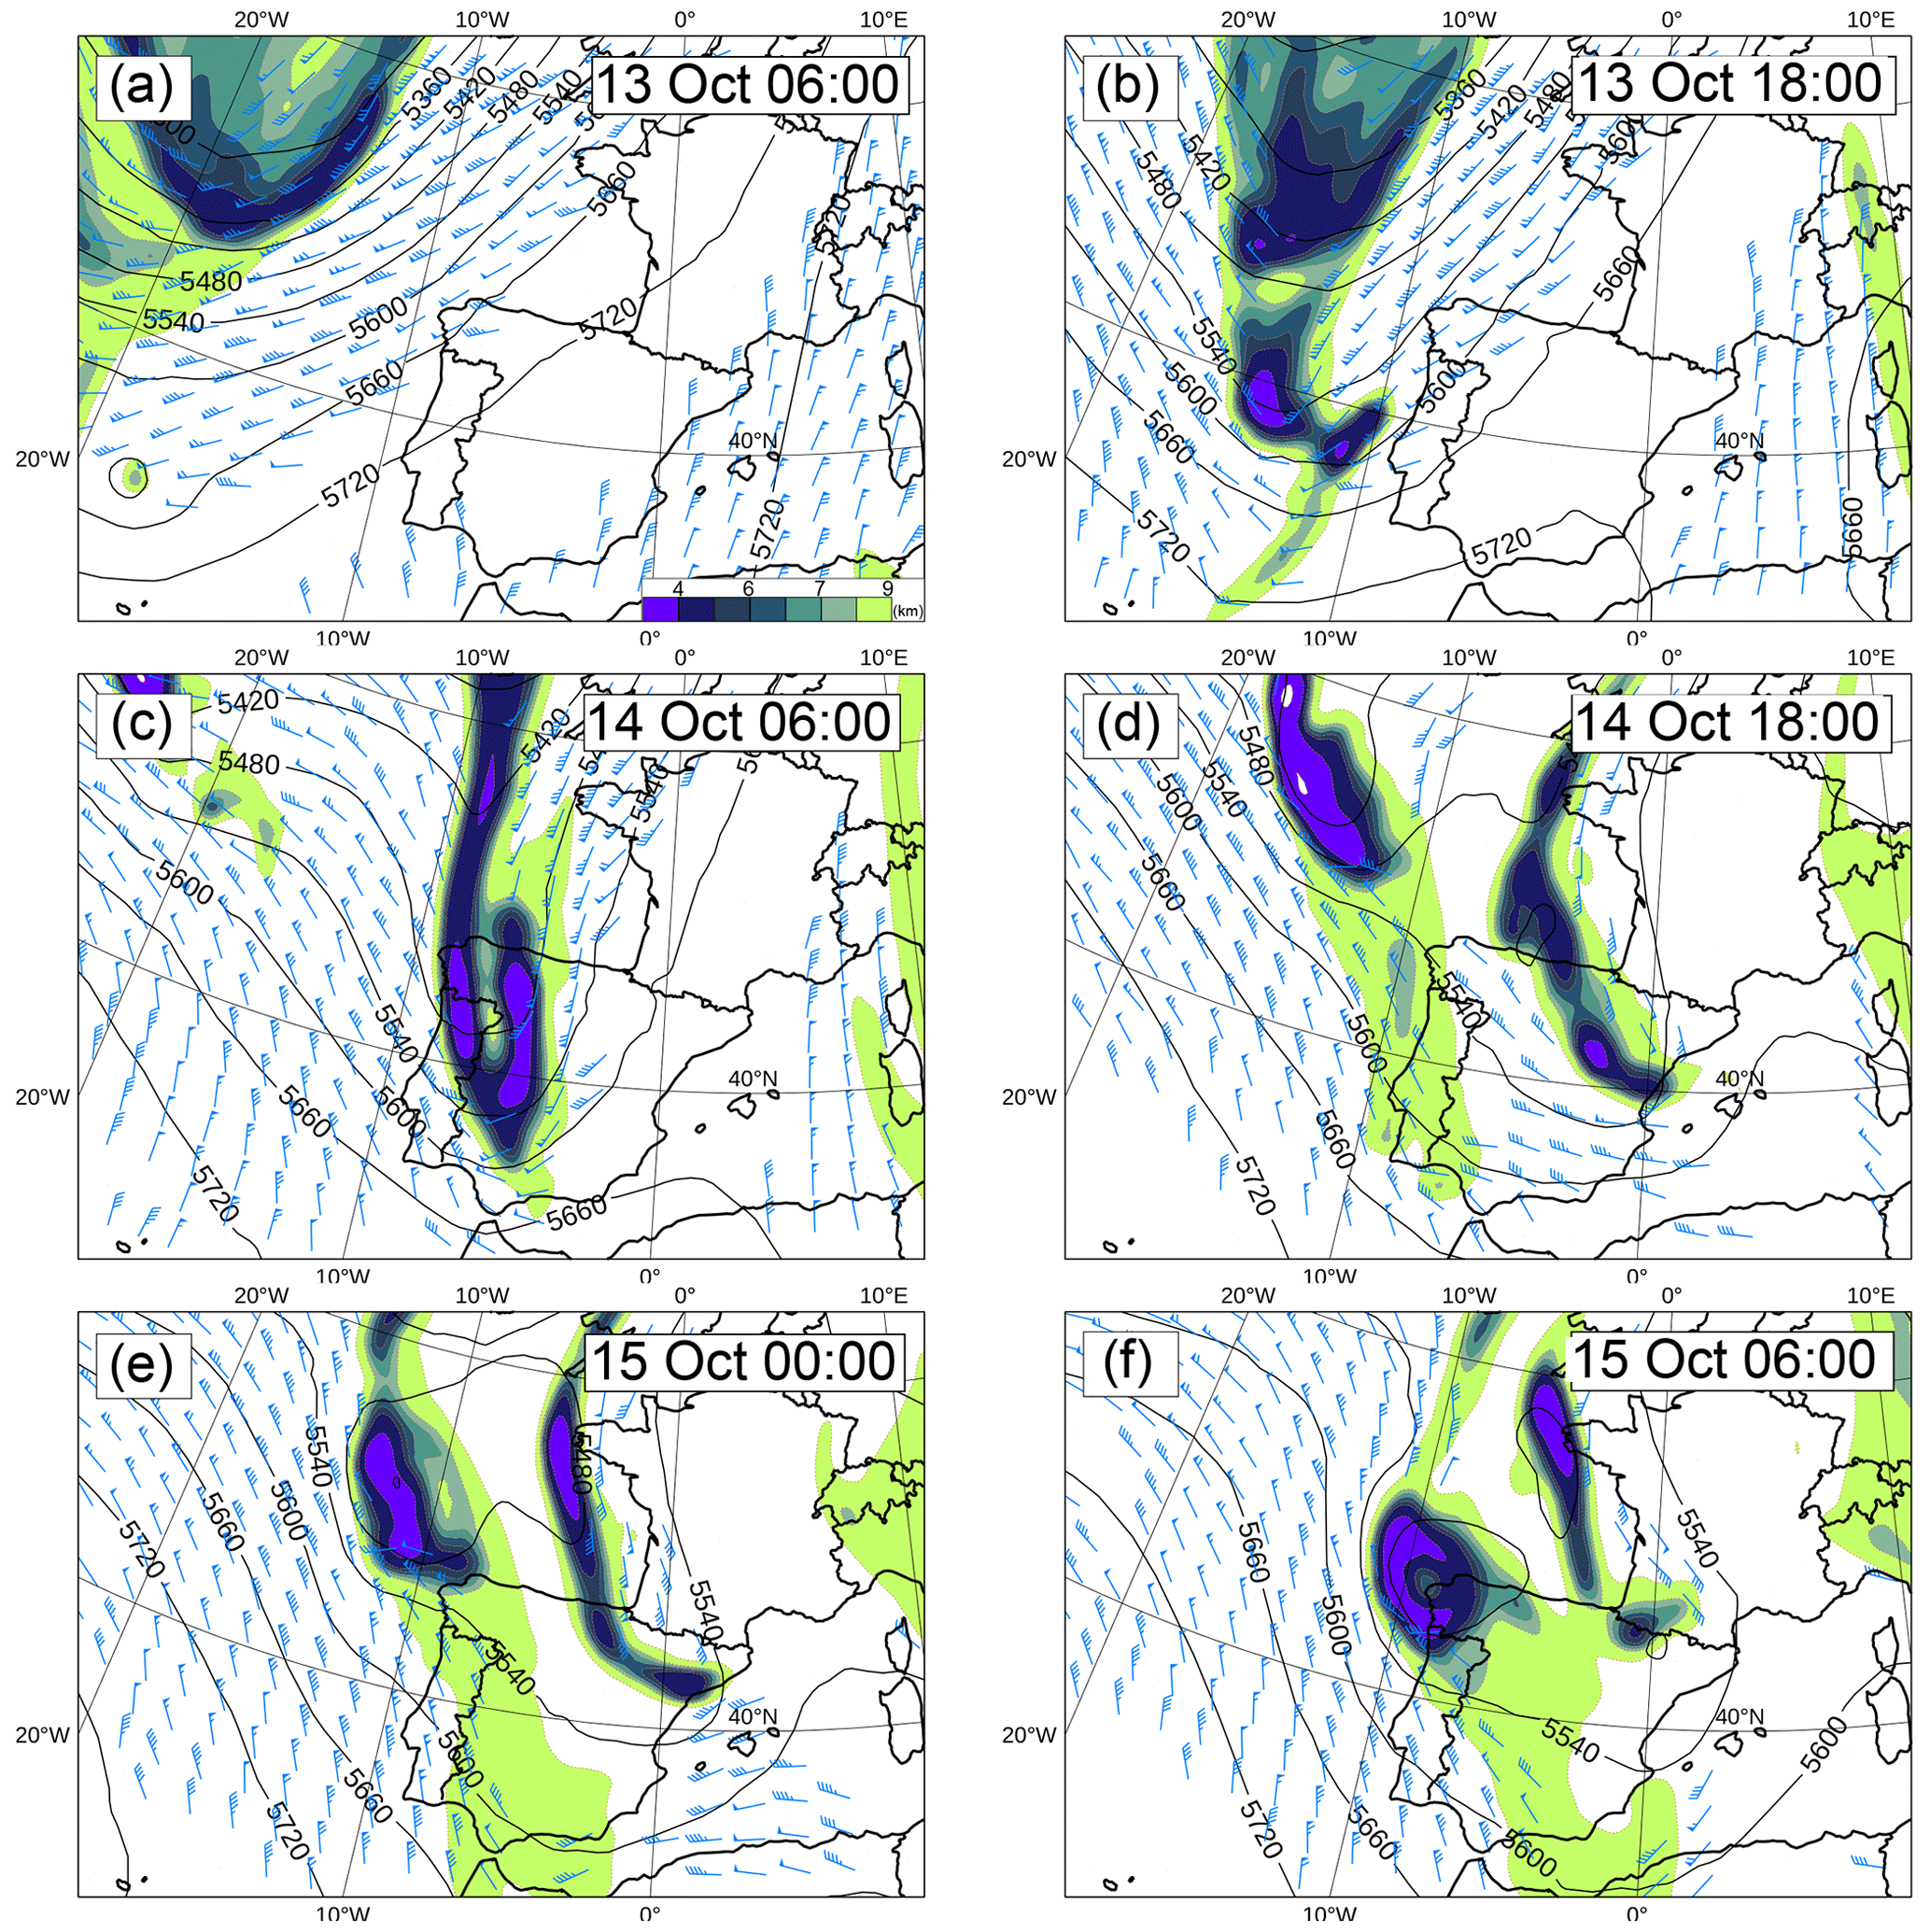
Figure 2Same as Fig. 1 but for geopotential height at 500 hPa (solid lines, gpm), geopotential height (coloured areas, gpkm), and horizontal winds (barbs, m s−1) along the 2 PVU surface.
The beginning of autumn 2018 was indeed characterized by a positive sea surface temperature (SST) anomaly over the European Atlantic shelf and the western Mediterranean Sea, as shown in Fig. 3 by the OSTIA analyses (Donlon et al., 2012). The SST anomaly was more marked in the south-western Mediterranean area with values up to +4 ∘C and persisted until 15 October (see Fig. 3 on 14 October). It appears also to correspond to the area with large anomalies in specific humidity, as highlighted by the ARPEGE analyses (Fig. 1d–f).

Figure 3Daily SST anomaly (K) for 14 October 2018 from the OSTIA analyses.
Using the ARPEGE forecasts, the areas of high evaporation can be highlighted (Fig. 4). During the afternoon, large evaporation took place in the Gulf of Cádiz and the Alboran Sea, then intensified in the evening and night while moving slowly north-eastwards to the Balearic Islands. These progression and intensification events are related to large winds at low levels due to the remnants of Leslie, which favour the heat and vapour extraction from the warm sea. Strong evaporation also took place south-west of Sardinia, and locally along the French coastal area, related to the rapid south-easterly/easterly low-level flow (Fig. 1d–f).
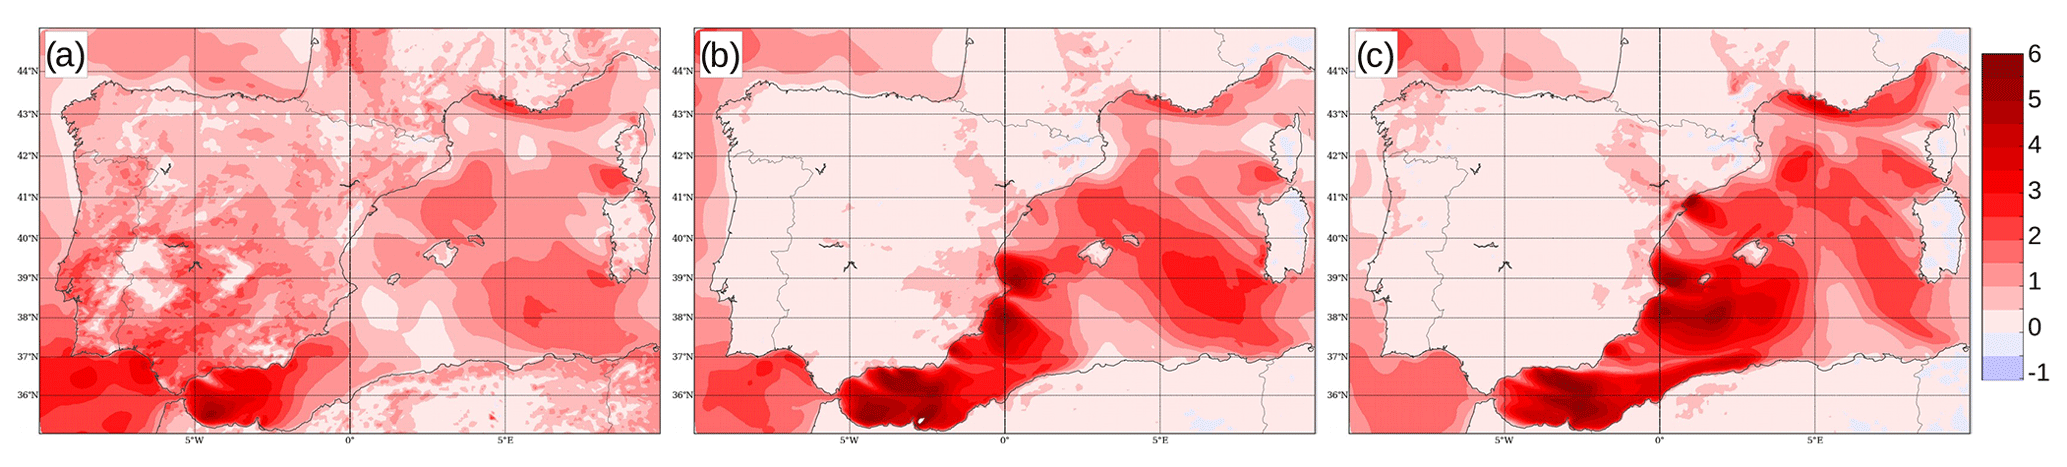
Figure 46 h cumulative surface evaporation (kg m−2) from successive ARPEGE forecasts: (a) at 18:00 UTC on 14 October (forecast basis: 14 October 12:00 UTC), (b) at 00:00 UTC on 15 October (forecast basis: 14 October 18:00 UTC), and (c) at 06:00 UTC on 15 October (forecast basis: 15 October 00:00 UTC).
3.2 Hydrometeorological description of the event
During the night of 13 to 14 October, precipitation first occurs on the south-eastern flank of the Massif Central. As the rainfall intensity increases, the affected area extends to the piedmont plains of the Hérault department and eventually to the Mediterranean Sea. In the morning, convective cells develop over the sea and are advected north-westwards towards the Hérault department's coast. The convective cells over the sea disappear after noon. Then orographic precipitation persists over the south-eastern flank of the Massif Central, whilst slowly decaying (Fig. 5a).

Figure 5Base radar reflectivity (dBZ) (a) at 16:30 UTC on 14 October; (b) at 18:55 UTC on 14 October; (c) at 21:15 UTC on 14 October; (d) at 09:55 UTC on 15 October.
During the day, some convective cells cross the Pyrenees in a south–south-westerly flow and produce rain showers over the south of the Pyrenees-Orientales department (Fig. 5a). The flow becomes south-easterly in the late afternoon, and convective cells appear from 18:30 UTC around the eastern tip of the Pyrenees, which are advected north-westwards towards the Montagne Noire, which forms the southern tip of the Massif Central (Fig. 5b). Convective cells keep developing in the same south-easterly flow for hours (Fig. 5c) until they are shifted north-westwards from 05:00 UTC on 15 October. The Hérault department is again affected by rainfall for hours until 13:00 UTC on 16 October 2018 (Fig. 5d).
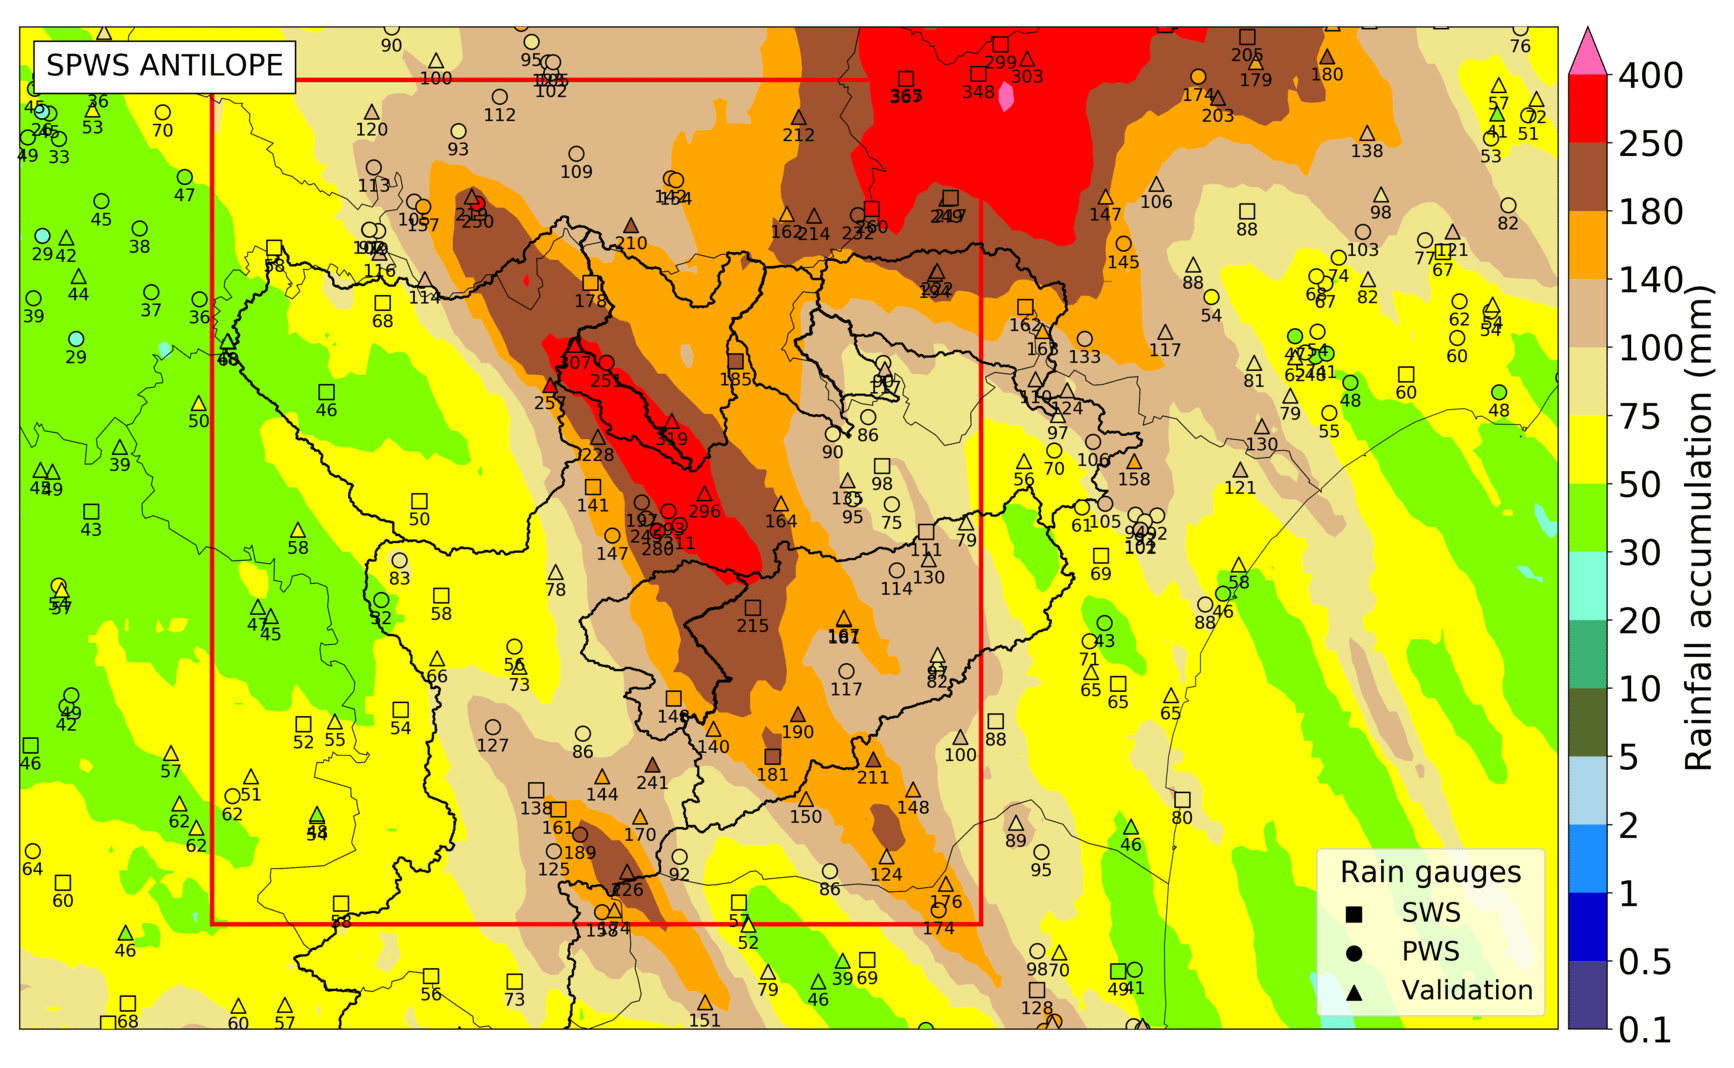
Figure 6SPWS ANTILOPE 48 h rainfall accumulation superimposed with rain gauge accumulations (mm) between 06:00 UTC on 14 October and 06:00 UTC on 16 October. Major river basins are indicated in bold black. The red rectangle indicates the integration area used to rank the ensemble members (see Sect. 4.2).
Figure 6 shows the ANTILOPE QPE including PWS data, i.e. the Standard and Personal Weather Stations (SPWS) ANTILOPE QPE, between 06:00 UTC on 14 October and 06:00 UTC on 16 October. Rainfall accumulations exceeding 300 mm are observed in the Aude department within this period of time. The rainfall pattern extends north-westwards from the eastern tip of the Pyrenees, reaching a maximum in the piedmont of the Montagne Noire, to the north-western boundary of the Tarn department. Rainfall intensity was very strong in places on 15 October with, for example, 57.6 mm in 1 h measured at Caunes-Minervois at 04:00 UTC, 55.5 mm in 1 h measured at Trèbes at 03:00 UTC and Lézignan-Corbières at 06:08 UTC. But the accumulations over periods of between 3 and 12 h were the most remarkable, with return periods reaching 100 years, observed, for example, at Trèbes with 295.5 mm in 12 h, Arquettes-en-Val with 212.1 mm in 12 h and Carcassonne with 113.0 mm in 6 h.
The maximum rainfall amounts were located in the Trapel catchment, on the west side of the Orbiel River, on the north-east of the Fresquel River, and on many rivers in the south of Carcassonne. This caused several rivers to burst their banks from the early morning of 15 October on.
Wet soils are known to prevent precipitation from infiltrating, resulting in higher runoff regardless of other environmental conditions and can therefore lead to more severe flash floods (Grillakis et al., 2016). The comparison between the daily average soil wetness index (SWI) provided by the Safran–Isba–Modcou chain (Habets et al., 2008) on the day preceding the event (i.e. from 06:00 UTC on 12 October to 06:00 UTC on 13 October) and the daily reference average over the period of 1981 to 2010 reveals that apart from the Orbiel River basin in Bouilhonnac, whose SWI is 0.26 % higher than the daily reference, the SWI averages for the basins affected by the event do not differ significantly from the daily references (not shown). It is concluded that soil moisture was not particularly large and did not play a significant role in the flood of 14 and 15 October 2018.
NWP systems such as those based on AROME can realistically forecast precipitation within 1 h to 2 d. They are an important component of flash-flood warning systems but are also tools for understanding the meteorological phenomena that cause heavy precipitation. In this section, the capabilities of the deterministic and ensemble versions of AROME to forecast heavy precipitation on 14 and 15 October 2018 are evaluated.
4.1 Deterministic regional NWP system (AROME-France)
The objective of deterministic systems is to optimize computational resources, the use of observations, and resolution in order to produce forecasts that are as close as possible to reality with sufficient lead time. These systems have variable refresh periods depending on the maximum forecast term. We focus here on AROME-France which produces long forecasts (up to 1 to 2 d) every 3 or 6 h. Figure 7 shows the average rainfall over three critical watersheds predicted by different runs of AROME-France. It shows that AROME-France can at the same time overestimate (run of 18:00 UTC on 14 October for the Lauquet River in flood rise), underestimate (flood rise of the Trapel River), or correctly estimate (run of 18:00 UTC on 14 October for the Orbiel River in flood rise) the average rainfall per catchment area. This is due to spatial discrepancies in rainfall forecasts compared to observations, which is a well-known problem for convective rainfall over small watersheds (e.g. Vincendon et al., 2011, and references therein). Forecast errors are larger than the observational errors that can be roughly inferred from the two (i.e. with or without personal weather station data) ANTILOPE estimates. Another observation is that the rainfall forecasts are not stable from one run to the next. The runs from 12:00 and 18:00 UTC on 13 October and from 12:00 UTC on 14 October give totals justifying an alert, while the other runs give lower totals, even if the precipitation structure is generally respected (not shown). This complicates the work of forecasters and crisis managers, since the spread of successive AROME-France runs indicates that the event had limited predictability.
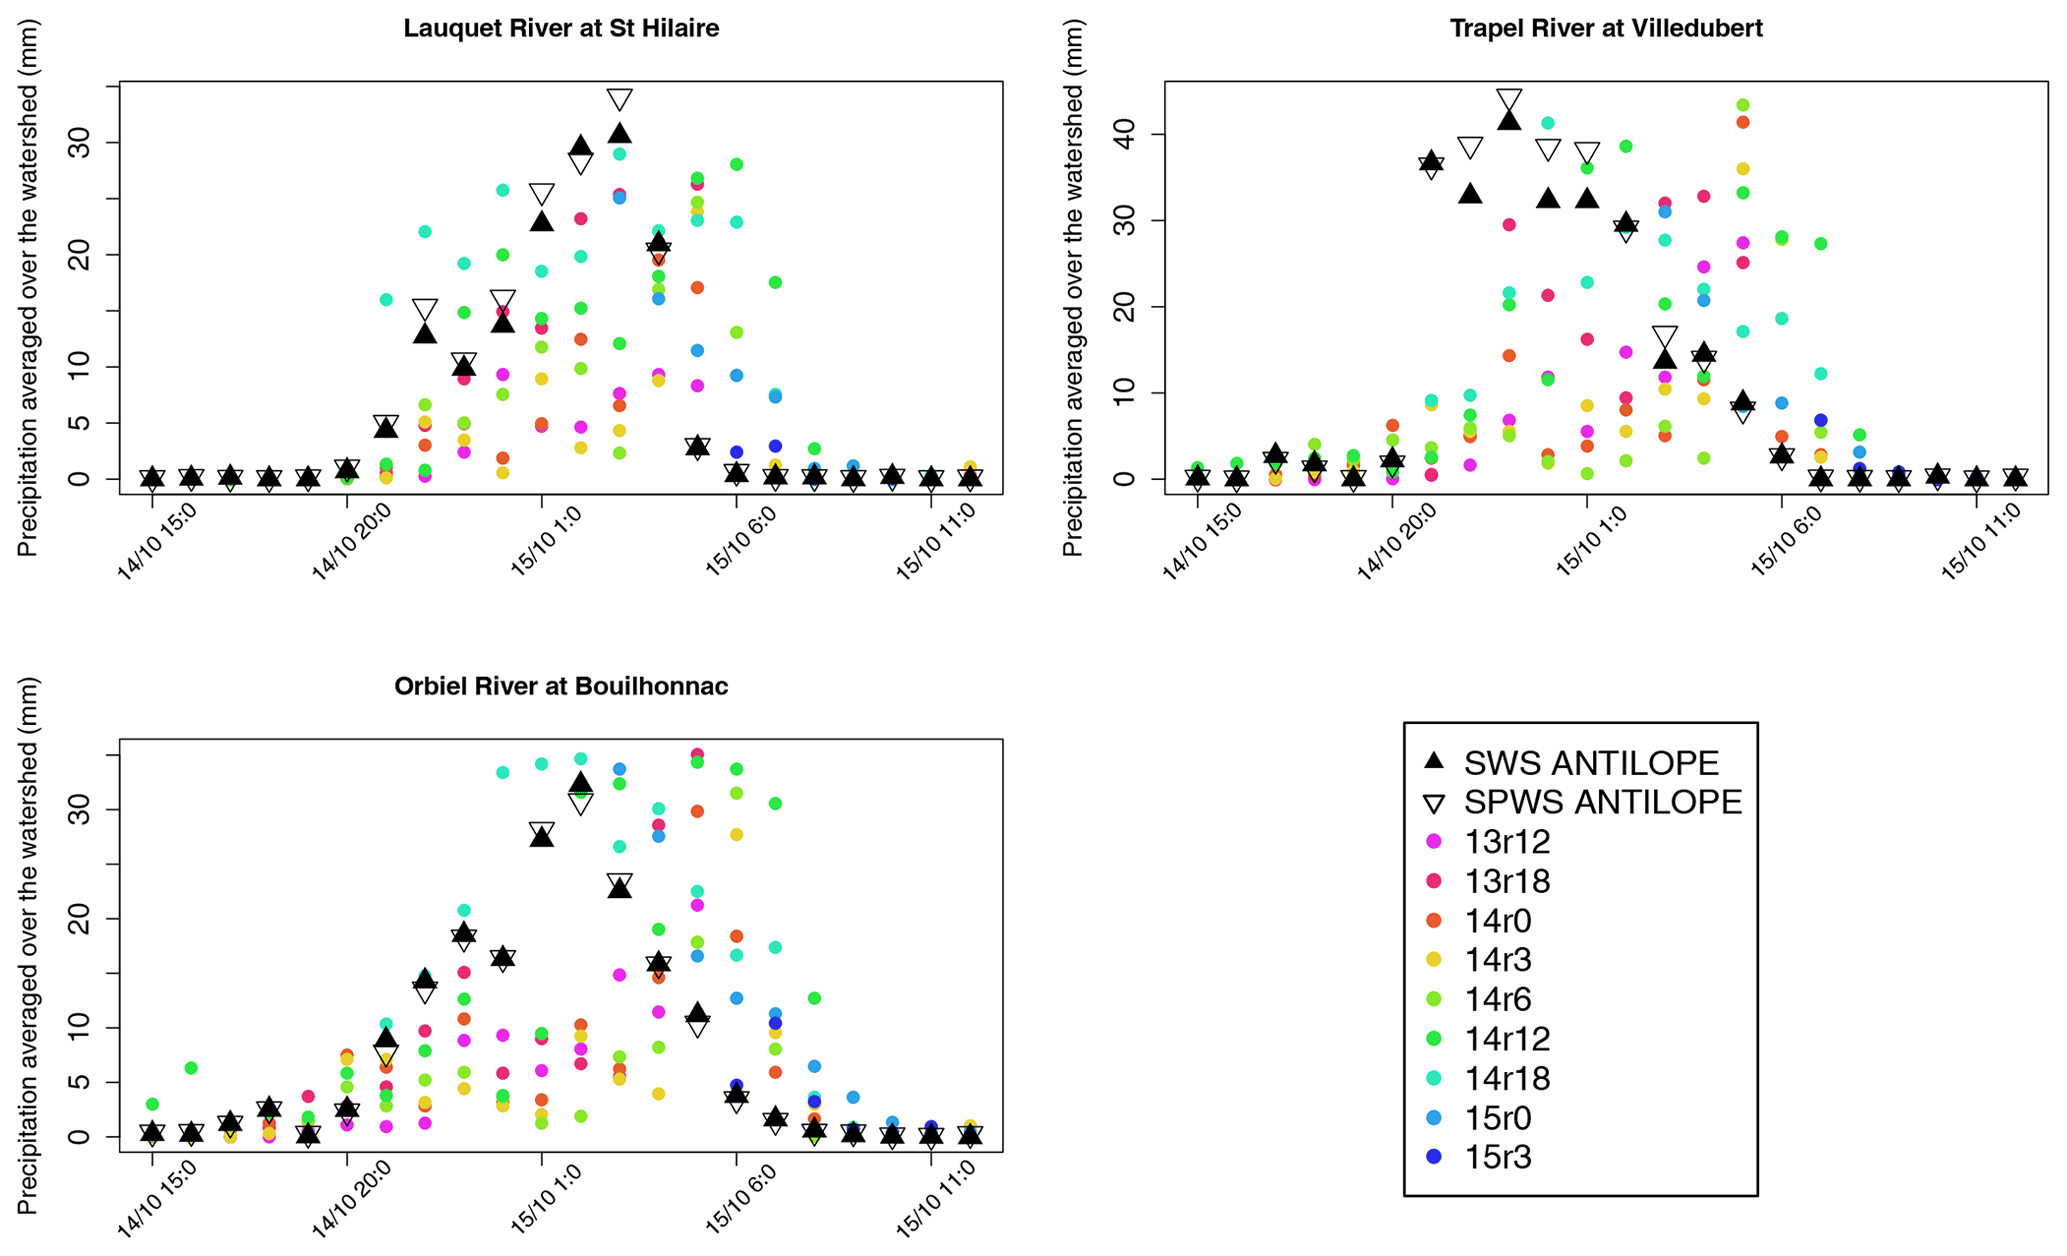
Figure 7Time series of average hourly rainfall per watershed (in mm), observed by ANTILOPE and predicted by various runs of AROME-France. The nomenclature associated with the coloured dots is as follows: XrY corresponds to the run of AROME-France starting at Y UTC on X October 2018.
4.2 AROME ensemble prediction system (AROME-EPS)
Although they are not perfect tools, convection-permitting ensembles like AROME-EPS are known to provide valuable information about the probability distribution of Mediterranean heavy precipitation events (see, e.g. Hally et al., 2015). In this section, we present the forecasted probability distribution. Some discussion of the link between member performance and its physical behaviour is provided in Sect. 5. Figure 8 illustrates the time behaviour of the AROME-EPS ensemble forecasts with respect to the observations. The blue areas show the probability distribution for two 12-member ensembles. They show that all members predicted heavy precipitation, with a substantial spread: the ratio between the 85 % and 15 % percentiles (which delineate the bulk of the forecast distribution) is nearly 3 for the 03:00 UTC based forecast, and of the order of 2 for the 15:00 UTC one, which was the best available in real time. The 15:00 UTC forecast is also the most accurate in terms of intensity. The highest quantiles are shifted in time with respect to the observed precipitation peak, by about 4 h before and after the most intense observed values (with intensities over 8 mm h−1). The time evolution of the forecasts is illustrated by the three most rainy members only, for the sake of readability. It shows that there is great variability in the precipitation timing: on timescales shorter than 3 h, there is hardly an apparent relationship between the forecast and observed variations of intensities. As seen in Sect. 3.2, large rainfall accumulations result from a succession of intense convective cells; our time series indicate that, although there is predictive value in the precipitation accumulated over at least 6 h, which is what matters most for flood prediction, the individual convective events that cause shorter intense precipitation do not seem predictable beyond a few hours.
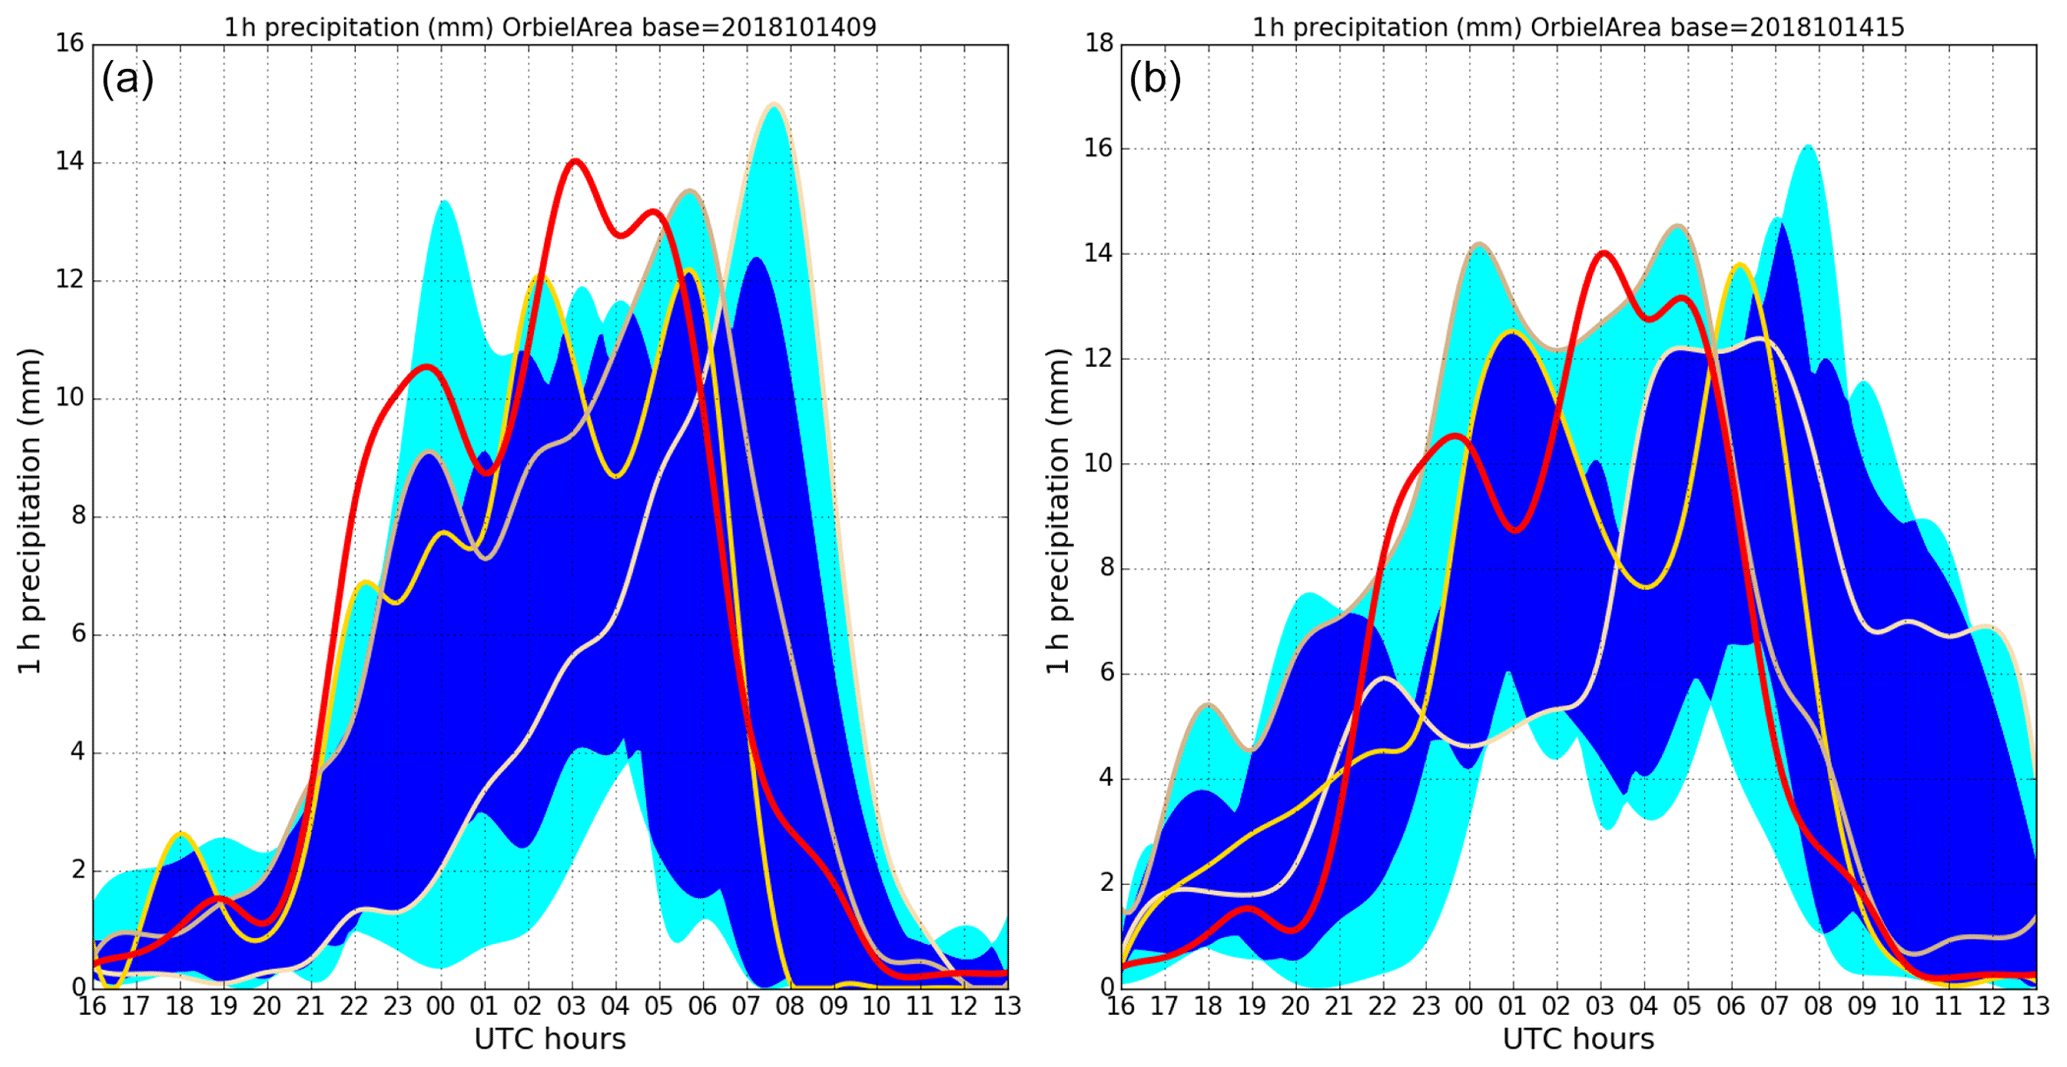
Figure 8Time series of hourly precipitation over the area of interest (depicted in red in Fig. 6). Panels (a) and (b), respectively: AROME-EPS forecasts based on the 09:00 and 15:00 UTC analyses on 14 October. Red curve: SWS ANTILOPE observation. Yellow: forecasts from three rainiest members of each ensemble. Light blue area: ensemble minimum and maximum forecasts. Dark blue areas: interval between the 15 % and 85 % percentiles.
In summary, Fig. 8 indicates that, although the higher quantiles of the ensembles provided an accurate representation of the overall event in space, time, and intensity, the predictability of the event was rather low according to AROME-EPS (as already indicated by AROME-France in Sect. 4.1): prediction could not have been forecast with less than a 50 % uncertainty on intensity and about 3 h in terms of timing.
To study the relationship between rainfall and other meteorological mesoscale features, members of the AROME-EPS run starting at 15:00 UTC on 14 October, which was the latest available run before the event, are ranked in order of proximity to rainfall observations. Departures are quantified by computing the fractions skill score (FSS; Roberts and Lean, 2008), using the Python code of Faggian et al. (2015). FSS is computed for each member for a range of rainfall thresholds from 0 to the maximum rainfall observed in 12 h by steps of 1 mm. Spatial tolerances between 2 (0.02∘) and 64 (0.64∘) grid points are considered. The members are ranked in Fig. 9 by decreasing mean FSS over all thresholds and all spatial tolerances over the red box shown in Fig. 6: the higher the FSS, the closest the member is to the observation. Between 20:00 UTC on 14 October and 08:00 UTC on 15 October, hereafter referred to as the “period of interest” because it encompasses most of the heavy rainfall that led to flooding, the three ensemble members closest to the observations are ensemble members 7, 3, and 6. Only member 7 is able to forecast more than 250 mm in 12 h, and three members (1, 10, 11) forecast less than 140 mm in 12 h over the area that received more than 180 mm (Fig. 9).
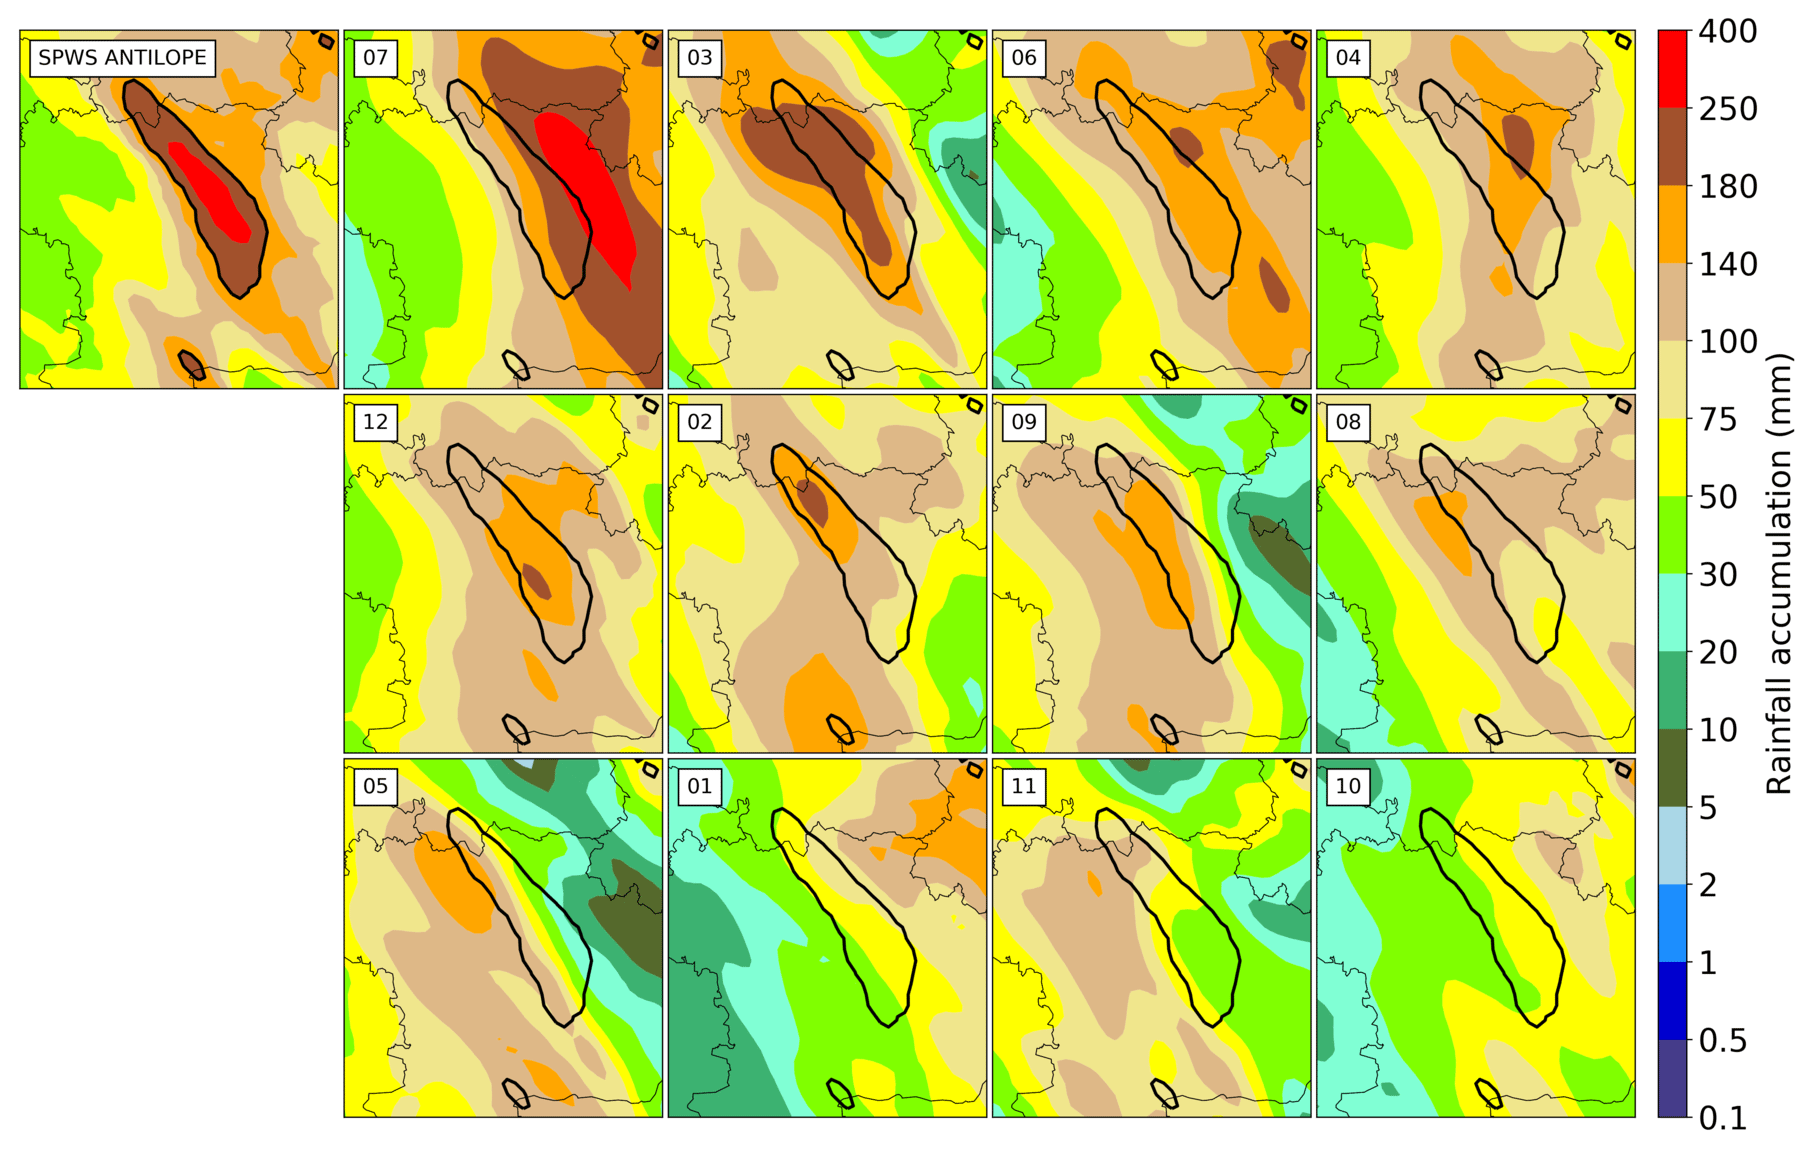
Figure 9Rainfall accumulation over the period of interest observed by SPWS ANTILOPE and predicted by the 12 members of the AROME-EPS run starting at 15:00 UTC on 14 October. Members are ranked by decreasing FSS (from left to right and from top to bottom). The black contour delineates areas where SPWS ANTILOPE observed rain exceeds 180 mm.
Figure 10 gives some insight about the physical causes of precipitation ensemble spread. Rainfall (from the 15:00 UTC run) has been integrated over the period of interest and averaged inside the rectangular domain depicted in red. In terms of this measure, the rainiest ensemble members were members 7, 6, and 3 with respective average 12 h rainfall of 126, 104, and 95 mm. These values are all exceptionally high and associated with local values over 200 mm. These rainiest members are in this case also the three with the highest FSS (but not in the exact same order). Figure 10 shows the average anomaly of these three members with respect to the ensemble mean. In other words, it gives clues about the correlation between the forecast rainfall and other forecast parameters, similarly to Ancell (2016), who used correlation maps from ensembles to investigate the mechanisms of high-impact weather events. Here, we only have 12 members, so it is not possible to claim that the observed correlations are statistically significant. Focusing on larger-scale features of the anomaly maps, we only attempt to identify clues about the connection between extreme precipitation and other weather fields in this particular event.
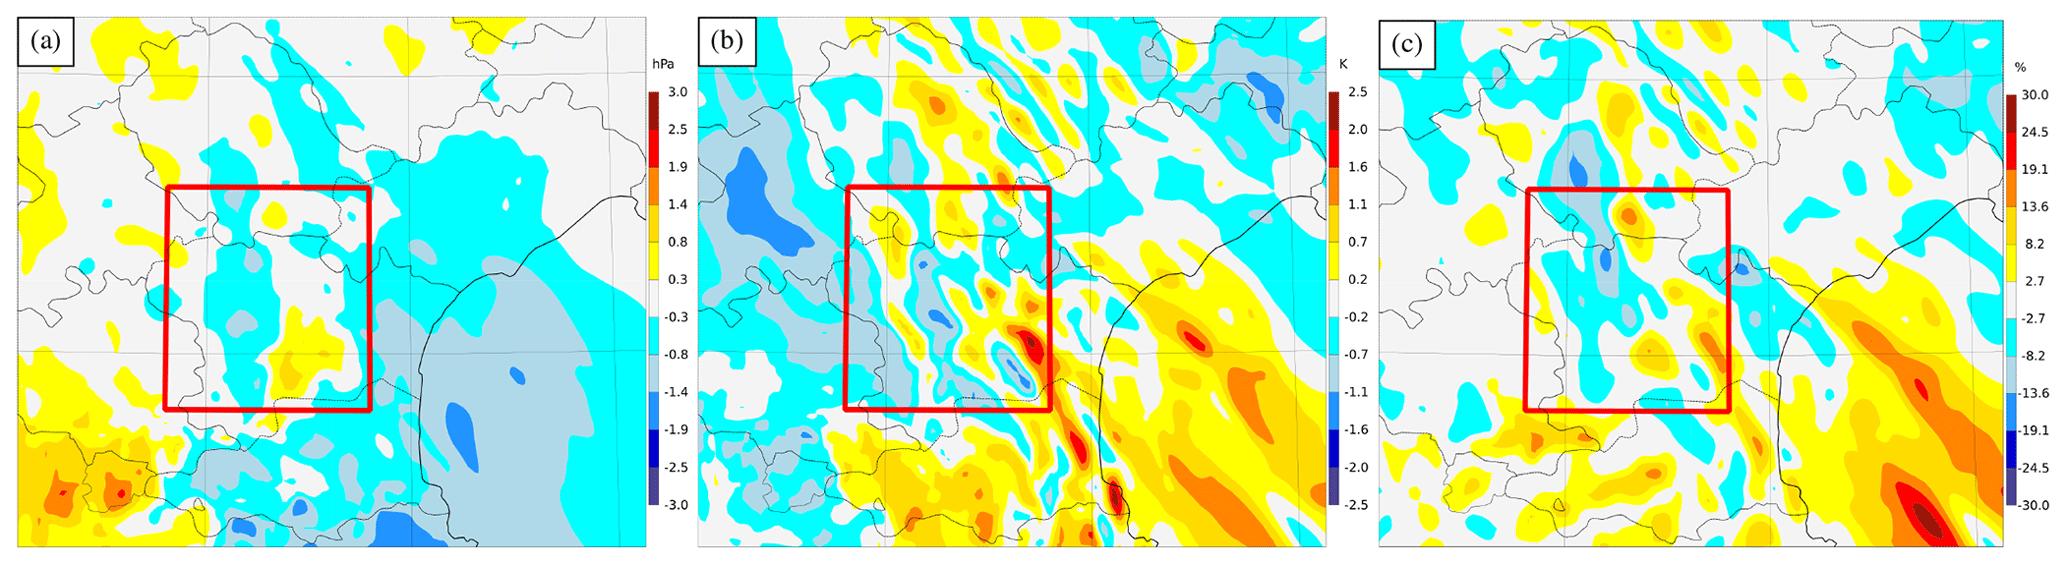
Figure 10Average difference of the three most rainy AROME-EPS members based on 15:00 UTC analysis on 14 October. The forecast time is 02:00 UTC on 15 October 2018, i.e. in the middle of the period of interest. The anomaly is computed with respect to the ensemble mean at each point. (a) Mean sea level pressure (hPa), (b) moist potential temperature (K) at 850 hPa, and (c) relative humidity (%) at 850 hPa.
Figure 10 indicates that higher precipitation is associated with lower pressure over the Mediterranean Sea, which is both due to a larger and earlier deepening of the mesoscale trough as indicated by a visual examination of the pressure fields of all members (not shown). A deeper trough is expected to be linked with large-scale ascent, which is known to encourage condensation and precipitation. The correlation maps for both moist potential temperature and relative humidity indicate that higher precipitation is correlated with warmer, moister air over the Mediterranean, i.e. upstream of the south-eastern airflow that drove the main precipitating cells. This is consistent with established conceptual models that identify an incident onshore flux of warm, moist air as the key ingredient for Mediterranean heavy precipitation events (e.g. Bresson et al., 2012). Interestingly, our maps also show heavier precipitation linked with a colder air mass near the west of the domain, which confirms the notion that the interaction of the Mediterranean flux with an Atlantic flux was an important mechanism for heavy precipitation in this particular case.
In the following, the focus is on the surface pressure low and the marine low-level jet that are associated with heavy precipitation.
5.1 Large-scale MSLP low and mesoscale trough observed over the Aude region
At 18:00 UTC, two MSLP low-pressure areas on both sides of the Pyrenees and a high-pressure area over the Alps are observed (Fig. 11a). North of the Pyrenees, the MSLP rapidly rose between 18:00 and 20:00 UTC and filled the low-pressure area. To investigate the role of the synoptic low located between Spain and the Balearic Islands during this HPE, its characteristics are tracked in AROME-France hourly analyses. The low has a non-symmetric shape, and between 18:00 and 22:00 UTC (Fig. 11a, b), the development of a trough from the low-pressure area towards the Aude region is observed.
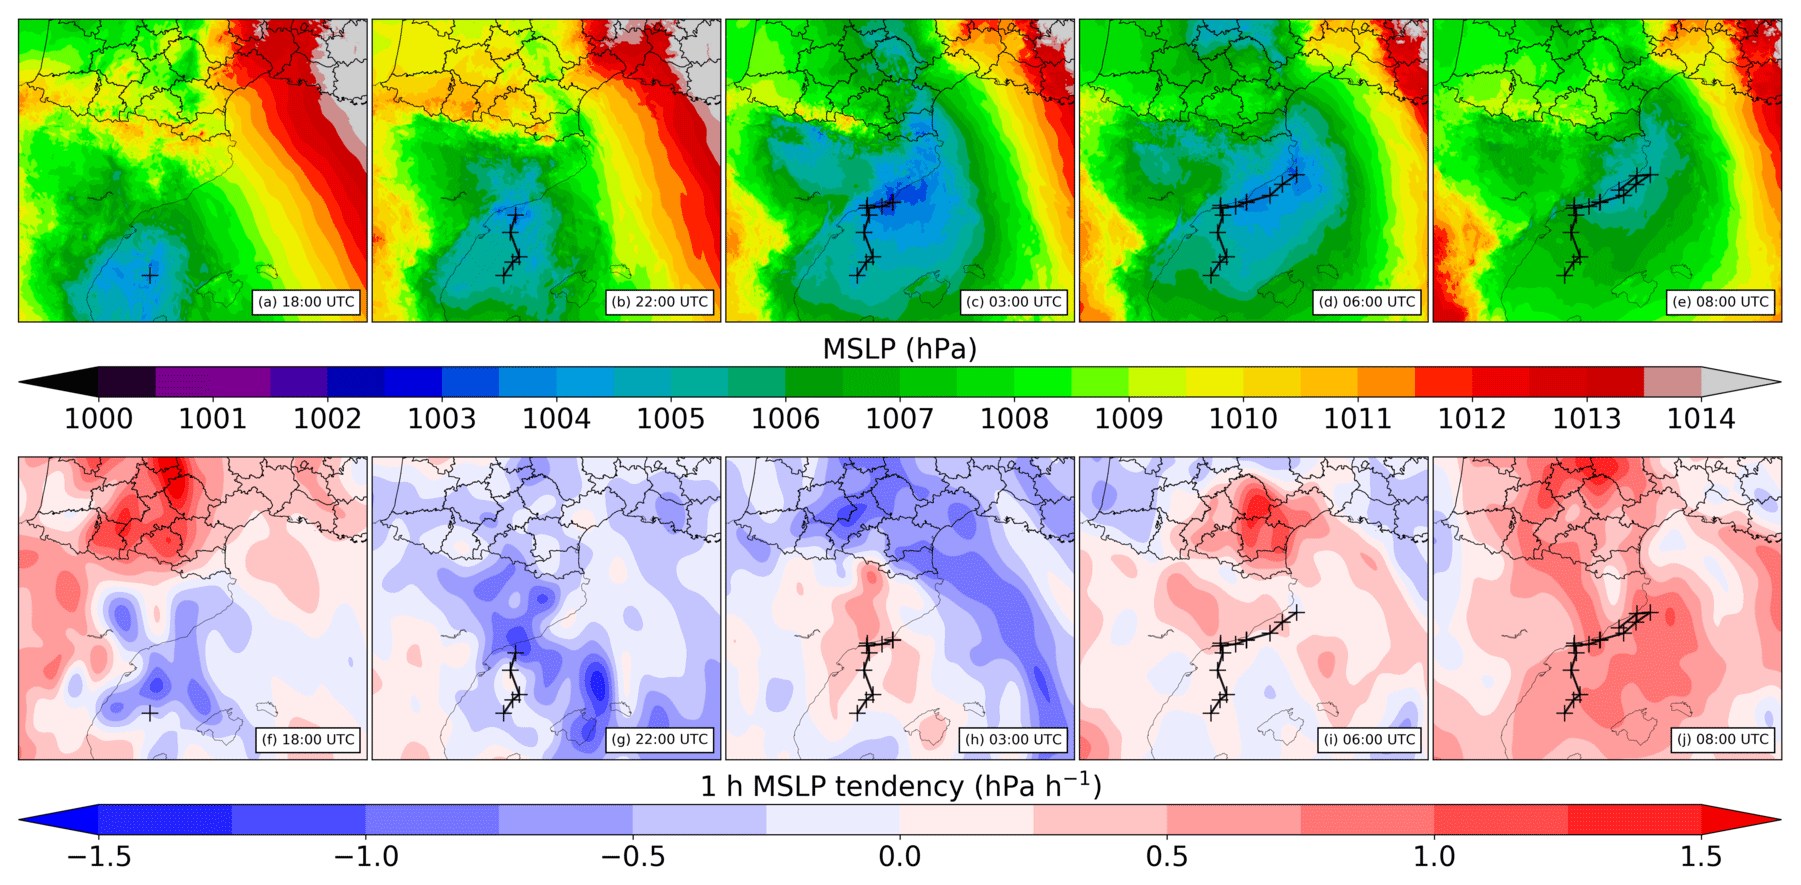
Figure 11AROME-France analyses of (a–e) MSLP and (f–j) 1 h MSLP tendency filtered at 18:00, 22:00 UTC on 14 October and 03:00, 06:00, 08:00 UTC on 15 October.
Figure 11a–e show that the centre of the low moved slowly during the entire period. It moved slowly north–north-eastwards between 18:00 and 20:00 UTC, northwards between 20:00 and 22:00 UTC (Fig. 11a, b). It remained quasi-stationary between 22:00 and 03:00 UTC (Fig. 11b, c) and then moved slowly east–north-eastwards between 03:00 and 06:00 UTC (Fig. 11c, d).
In MSLP tendency analyses (Fig. 11f–j), we look at the dipoles of pressure tendency that are associated with the movement of the low. Because the low is not symmetric, these dipoles are most of the time also not symmetric. When the low deepens, the negative part of the dipole predominates and the figure appears globally blue; when the low fills itself, the positive part of the dipole predominates and the figure appears globally red.
Between 21:00 and 00:00 UTC, the low rapidly deepened, as shown by MSLP tendencies (Fig. 11g). Between 00:00 and 04:00 UTC (Fig. 11h), the central pressure of the low remained almost constant, which results in a quite symmetric dipole. The positive part of the pressure tendency dipole associated with the slow movement of the low reached the Pyrenees-Orientales department between 03:00 and 04:00 UTC, stopping the continuous pressure decrease observed from 20:00 until 03:00 UTC over the area of interest (Fig. 11g, h). This modified the structure of the MSLP field over this area after 04:00 UTC, in particular the location of the trough (Fig. 11c–e). After 04:00 UTC (Fig. 11i, j), a global pressure rise is observed showing the filling of the low.
There are noticeable differences between AROME-EPS members regarding the spatial structure of the low and the minimum pressure inside the trough over the Aude region (not shown). Because the low-pressure area is not symmetric in all the members, there is no direct relationship between the location of the centre of the low and the MSLP over our area of interest. But the spatial structure of the low directly influences the pressure gradient along the Mediterranean shore. In the following section, the relationship of the MSLP gradient delineating the low with the marine low-level wind is investigated.
5.2 Marine low-level jet
Time series of departures in meteorological parameters between Sète and Cap Béar (see locations in Fig. 12a) are plotted in Fig. 12. Figure 12d shows that the MSLP departure between Sète and Cap Béar, along the Mediterranean shore, increased between 18:00 and 23:00 UTC. At the same time, an increase in the mean wind speed in Leucate was observed around 19:00 UTC (Fig. 12b). Between 21:00 and 04:00 UTC, the MSLP difference between Sète and Cap Béar remained nearly constant between 4.2 and 5.2 hPa. Near the shore, the mean wind speed in Cap Béar remained nearly constant around 21 m s−1 in speed and a 140∘ direction between 22:00 and 04:00 UTC (not shown), while the same constant wind speed is observed around 18 m s−1 in speed and a 120∘ direction in Leucate between 23:00 and 05:00 UTC (Fig. 12b, c). Inland, a slow increase of the wind is observed in Lézignan-Corbières from 8 m s−1 to around 13 m s−1, also with a remarkable constant direction around 110∘ between 20:00 and 04:00 UTC. The constant direction of the low-level wind observed near the shore and inland shows that even if the MSLP inside the trough decreased during the period, the location and spatial structure of the MSLP field did not evolve much between 20:00 and 04:00 UTC.
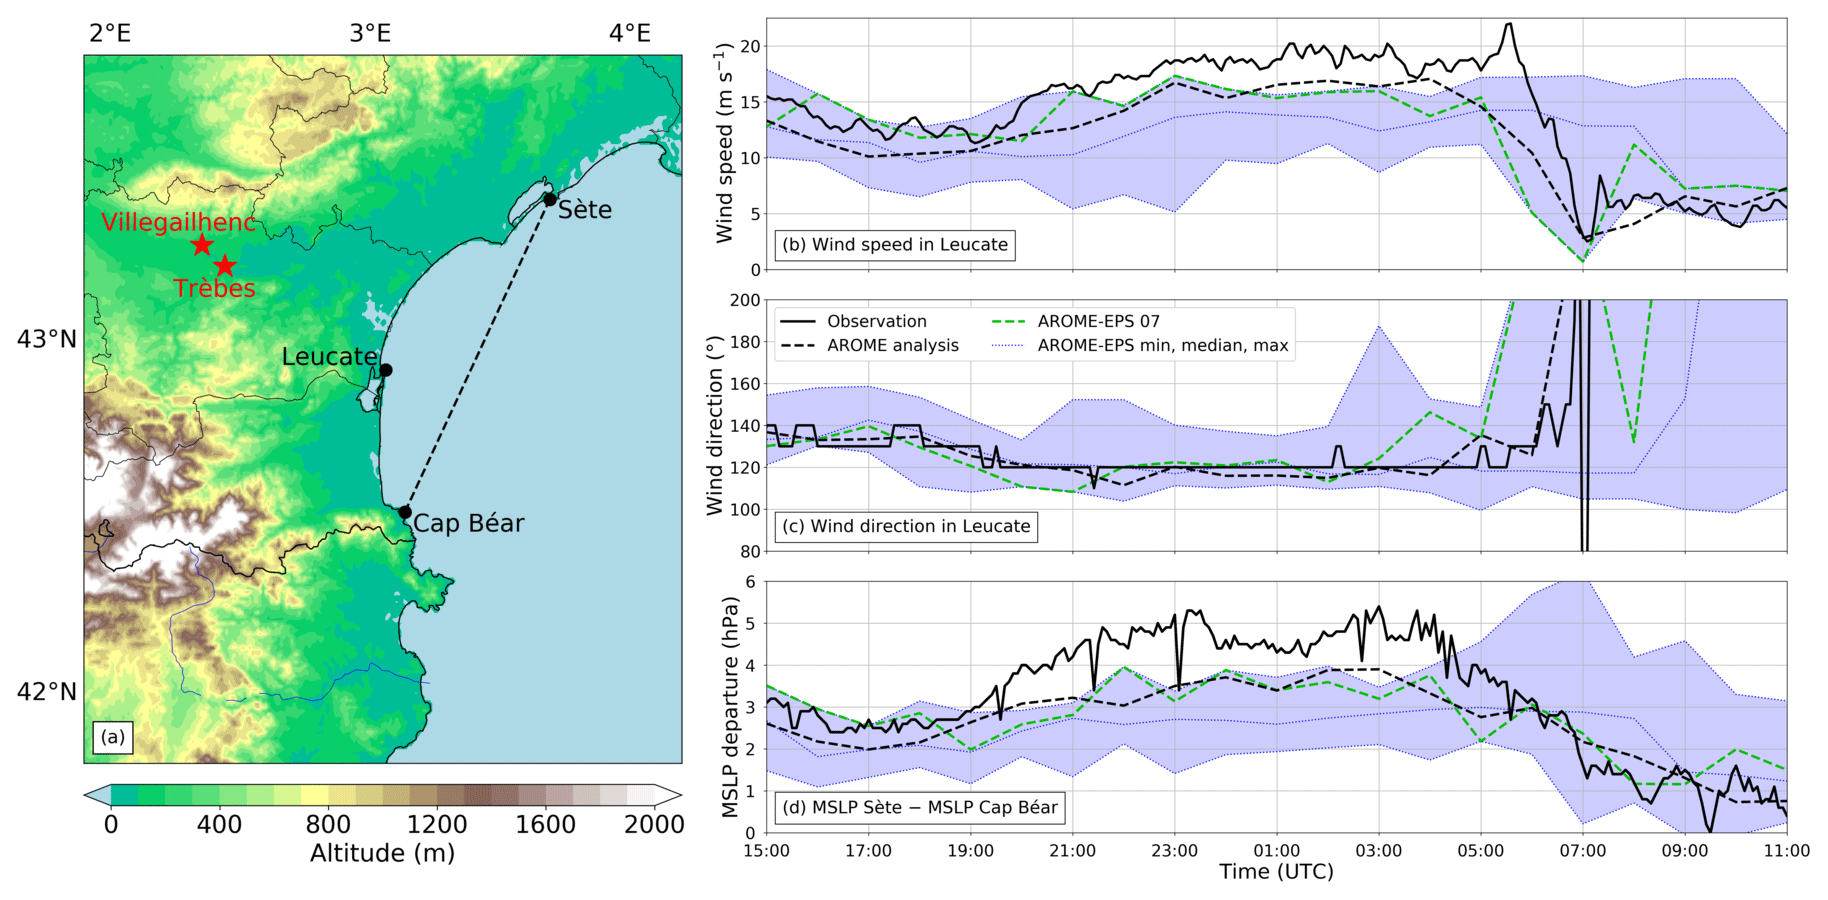
Figure 12(a) Map showing the locations of Sète, Cap Béar, and Leucate relative to the region of interest. (b–d) SWS observations, hourly AROME-France analyses, and AROME-EPS forecasts of (b) 10 m wind speed in Leucate (c) 10 m wind direction in Leucate, and (d) MSLP departure along the Mediterranean shore between 15:00 UTC on 14 October and 11:00 UTC on 15 October. Wind observations are a 10 min mean, while models and analyses provide the instantaneous wind at a given time.
AROME-France analyses reproduce well the wind directions observed by all SWSs. The wind decrease and direction shift in Leucate begin approximately 1 h earlier in analyses compared to observations. Wind speed in Leucate is higher in observations than in analyses. Part of this departure is expected because the anemometer in Leucate is located at the top of a 40 m height cliff facing the Mediterranean Sea. Wind speed is better reproduced by the analyses inland over flat terrain. However, the MSLP departure along the Mediterranean Sea is underestimated by 2 hPa in analyses compared to observations.
Figure 12b illustrates that the AROME-EPS median wind speed in Leucate is underestimated by 1.5 to 4 m s−1 between 20:00 and 04:00 UTC compared to the AROME-France analysis and overestimated by 4 to 10 m s−1 between 06:00 and 08:00 UTC. Moreover, between 01:00 and 04:00 UTC, the AROME-France analysis wind speed is higher than in all members of the ensemble. The strong change in wind speed and direction observed between 05:30 and 07:00 UTC is forecast by the ensemble median between 08:00 and 09:00 UTC. The underestimation of wind speed is correlated with underestimations of the pressure departure along the Mediterranean shore (exactly between Sète and Cap Béar, almost perpendicularly to the isobars). The median MSLP departure forecast is around 2.8 hPa between 21:00 and 04:00 UTC, whereas the MSLP departure observation is around 4.7 hPa during the same time period.
The member of the ensemble with the highest FSS (member 7, also the rainiest) is shown in green. It predicted a wind direction close to the observed one, and it is one of the most windy members between 21:00 and 05:00 UTC as well as one exhibiting the highest MSLP departure between Sète and Cap Béar, above the median of the members during the whole time period.
Figure 13 shows that observations exhibit MSLP departures and mean wind speeds that are higher than in all AROME-EPS member forecasts and higher than the AROME-France analysis. The three rainiest members of the ensemble (members 7, 3, and 6) exhibit the closest maritime mean wind speed in Leucate to both observation and AROME-France analysis among the ensemble. This figure illustrates the linear relationship between the MSLP gradient along the shore and the maritime flux.
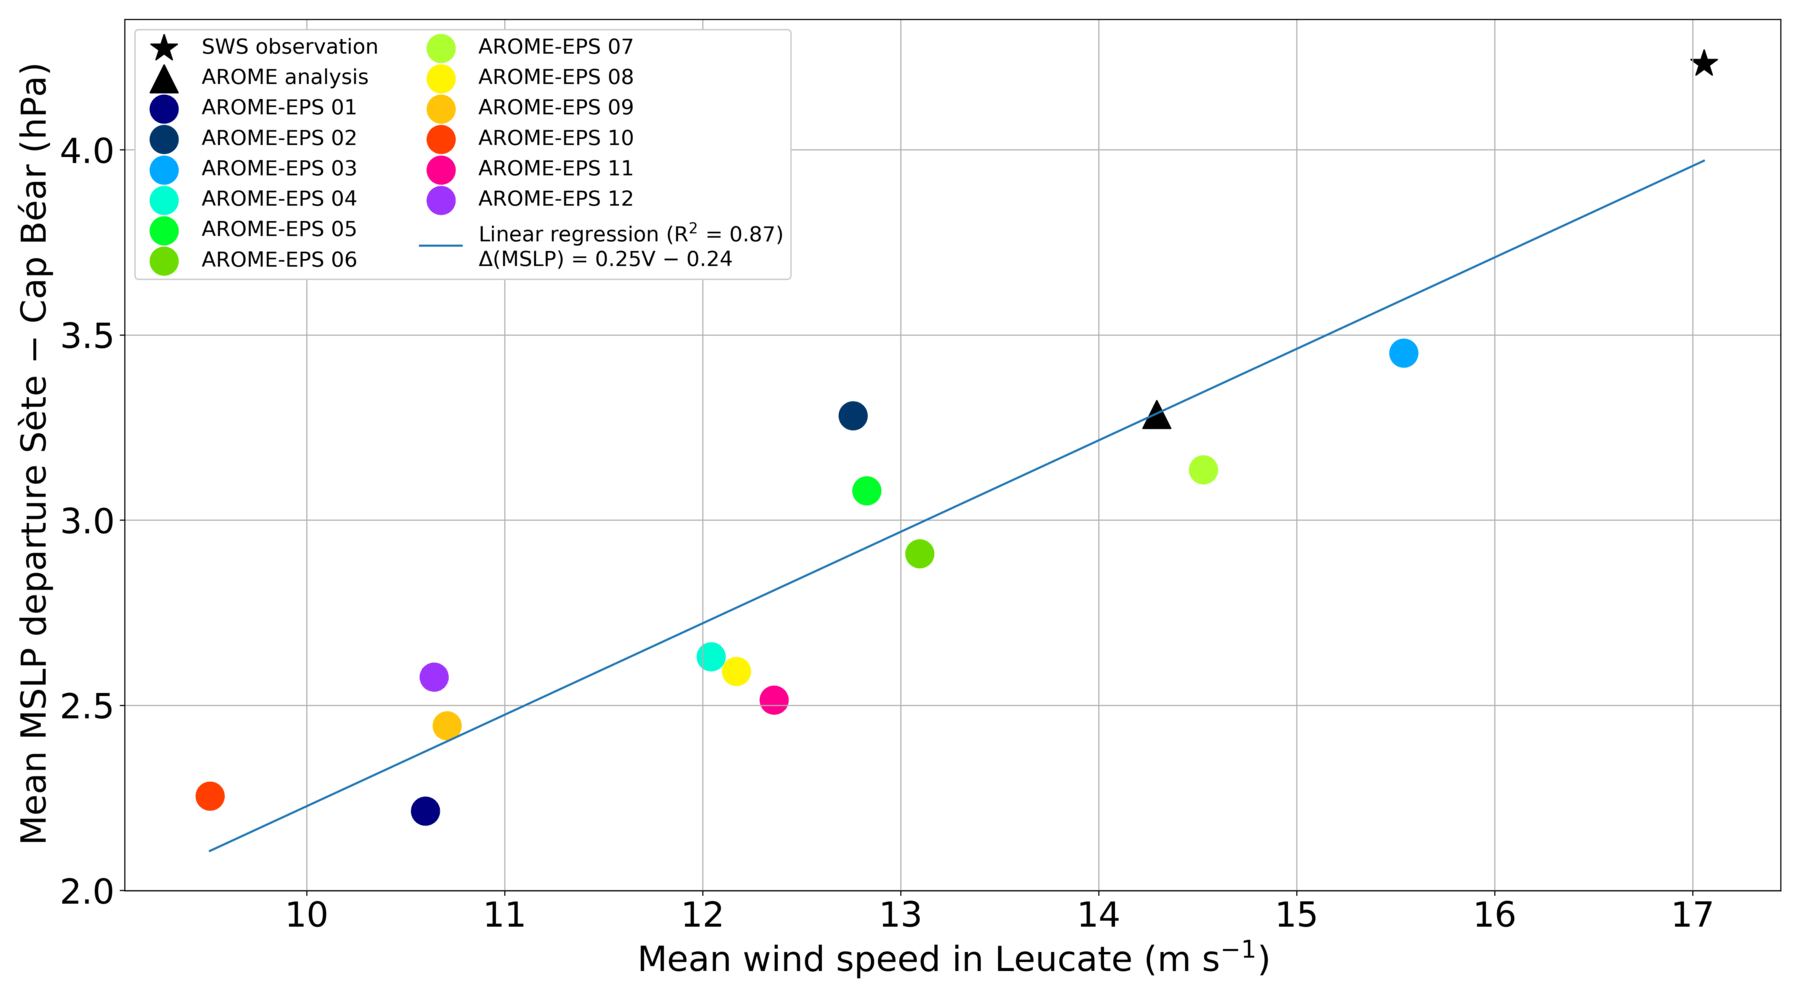
Figure 13SWS observation, AROME-France analysis, and AROME-EPS forecasts of 10 m wind speed blowing from the Mediterranean Sea (sector 90–150∘) as a function of the MSLP departure between Sète and Cap Béar, averaged over the event between 19:00 UTC on 14 October and 07:00 UTC on 15 October (period taken 1 h ahead of the period of interest). To give an order of magnitude, if we hypothetically consider that the geostrophic balance applies near the ground, the ageostrophic wind is equal to zero, and the pressure field is such that the Sète–Cap Béar orientation is always parallel to the pressure gradient during the event, the slope of the regression line would theoretically be about 0.13 (with a y intercept equal to zero).
5.3 Stationarity of near-ground mesoscale features
SPWS analyses show that at 18:00 UTC a low MSLP area is observed over the west of the Aude department. Between 19:00 and 21:00 UTC, the MSLP decreases south of the domain shown in Fig. 14a, forming the trough shown previously by AROME-France analyses. Around 20:00 UTC, precipitation began and the trough shifted eastwards (Fig. 14b). Then, associated with the large-scale MSLP decrease seen in AROME-France analyses, related to the low, a general decrease of MSLP in most of the Aude region is observed from 22:00 UTC until around 04:00 UTC (Fig. 14g, h). The axis of the trough remained almost stationary from 22:00 to 04:00 UTC while it deepened (Fig. 15a). It is remarkable, and consistent with MSLP observations, that in most of the domain, except in the south of the Tarn department and under the convective cells, mean wind speed and direction measured by SWSs remained almost stationary between 6 to 8 h in a row (Fig. 12b, c). Then, after 04:00 UTC, MSLP increased as seen in AROME-France analyses (Fig. 14i, j). The axis of the trough moved again slowly eastwards, as well as the convective cells (Fig. 14d, e). Several SWSs observed the rotation of the wind associated with this movement of the trough.
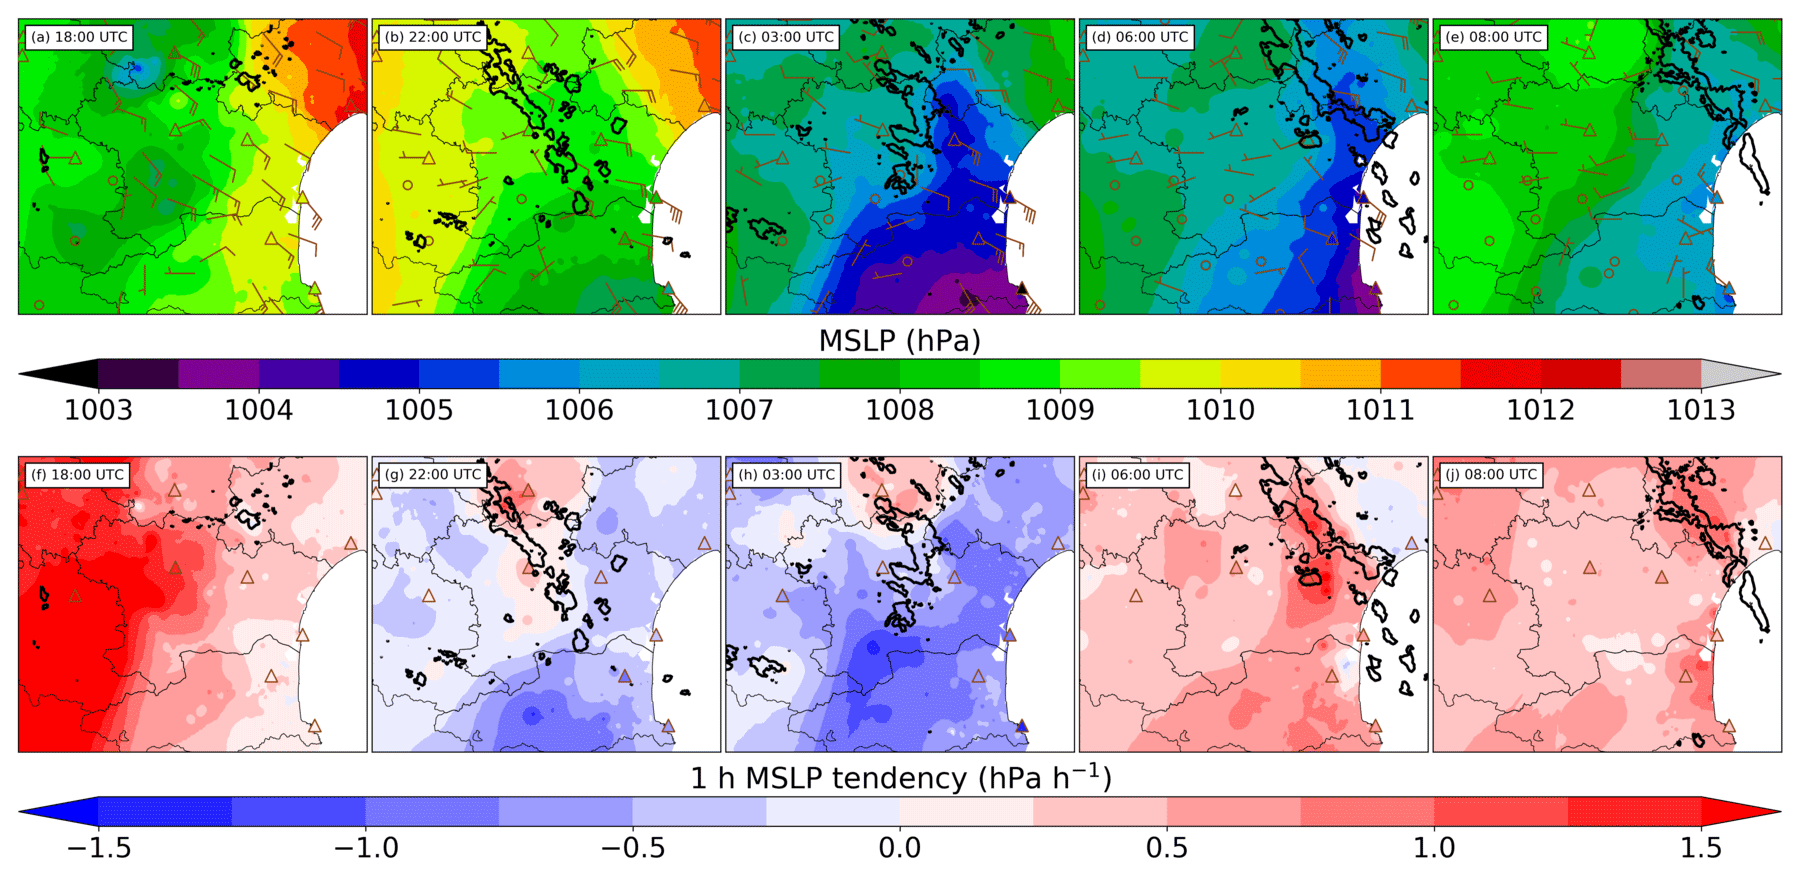
Figure 14SPWS analyses of (a–e) MSLP and (f–j) 1 h MSLP tendency at 18:00, 22:00 UTC on 14 October and 03:00, 06:00, 08:00 UTC on 15 October. Brown triangles show SWS MSLP observations, and brown barbs show SWS wind observations. Bold black contours indicate radar reflectivities above 40 dBZ.
Even if AROME-France analyses are most of the time close to SPWS analyses regarding the position of the trough, they underestimate the small-scale signal of stationarity of the trough east of Trèbes seen in SPWS analyses (Fig. 15).
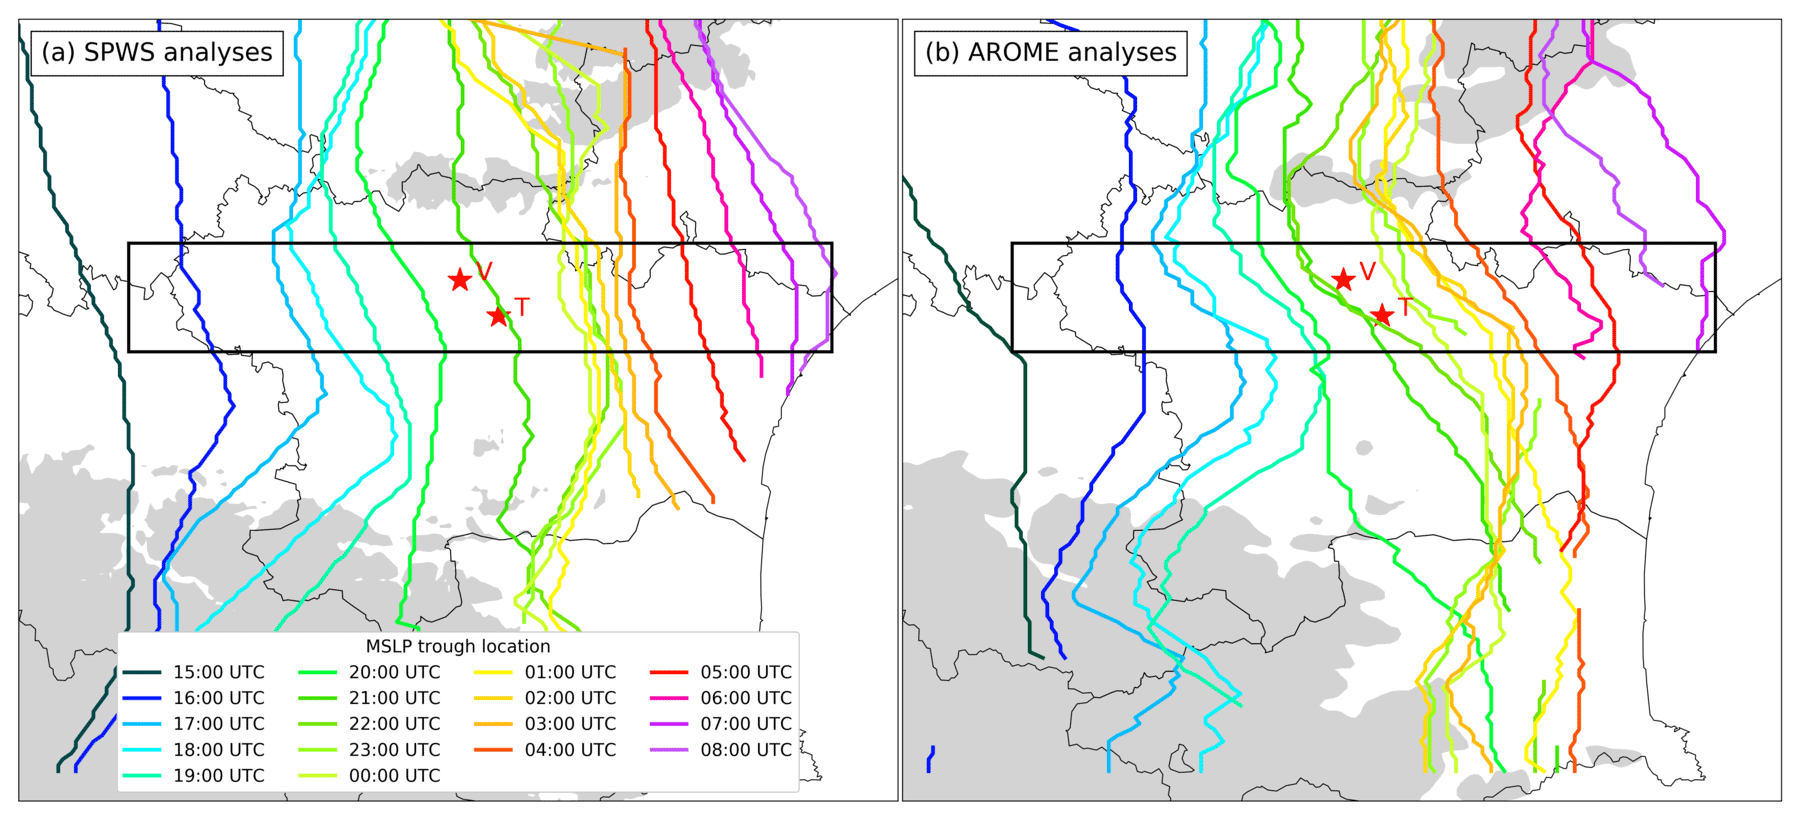
Figure 15Location of the MSLP trough as a function of time between 15:00 UTC on 14 October and 08:00 UTC on 15 October indicated by (a) SPWS analyses and (b) AROME-France analyses. The Aude valley domain is indicated by the black box. Stars annotated “T” and “V” show the locations of Trèbes and Villegailhenc, respectively, which are two towns that were severely damaged. Terrain above 750 m a.s.l. is shaded in grey.
From 20:00 UTC on 14 October until the trough vanished around 09:00 UTC on 15 October, the main convective cells of the convective lines remained located near or slightly west of the axis of the trough, resulting in heavy rain slightly west of the trough (Fig. 16). After 04:00 UTC on 15 October, when the axis of the trough moved east towards the Hérault department, this situation persisted. Rainfall was still intense but was not stationary over the same area.
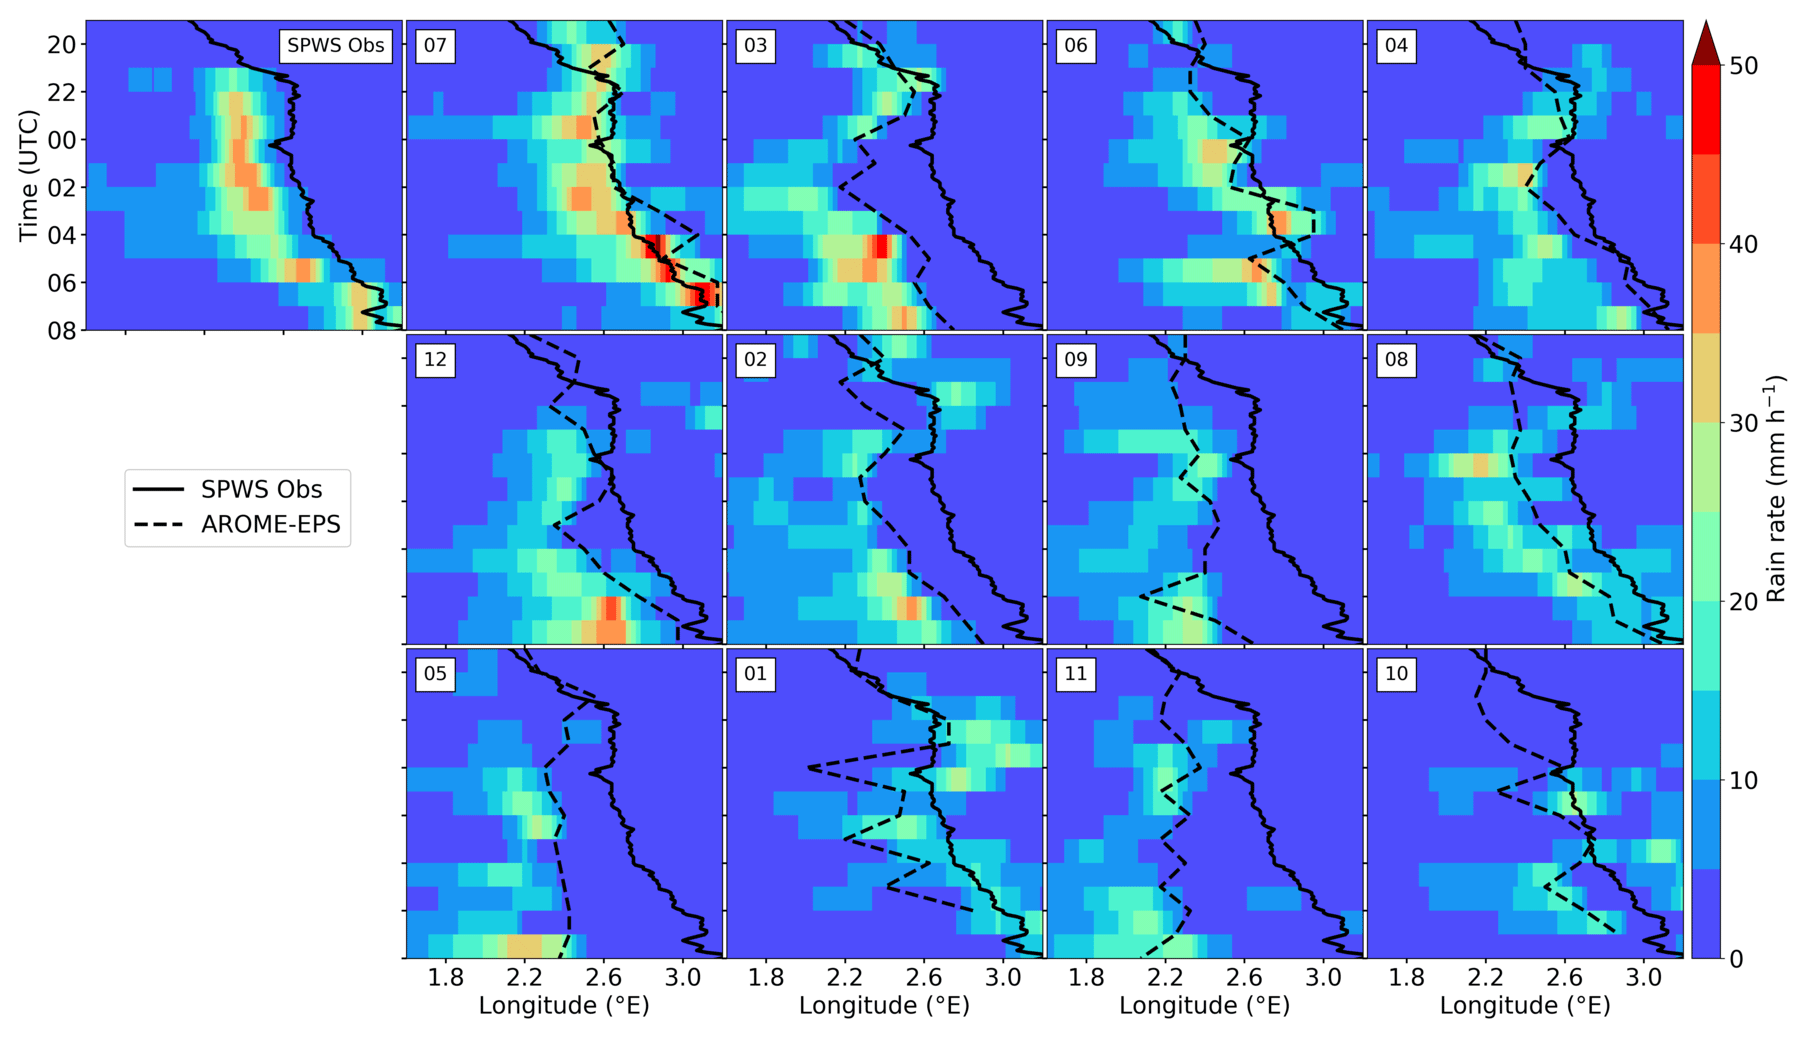
Figure 16Hovmöller diagram of the mean trough's longitude over the Aude valley observed with SPWS analyses and predicted by the members of the AROME-EPS between 19:00 UTC on 14 October and 08:00 UTC on 15 October. The mean hourly rain rate observed by SPWS ANTILOPE or predicted by AROME-EPS over the Aude valley [43.15–43.33∘ N] is shown as a function of the longitude. Members are ranked as in Fig. 9.
An east–west gradient in 2 m temperature has been observed since the beginning of the event over the Aude region associated to a decaying cold front. Temperatures from 14 to 16 ∘C are observed west of the Aude department, whereas they range from 19 to 20 ∘C east of it, near the Mediterranean Sea. Between 20:00 and 22:30 UTC, the strong temperature gradient moved slightly from the west of Carcassonne to the east of it, with this temperature gradient separating a cold air mass west of the cold front from a warm air mass advected from the Mediterranean Sea at the east. Then, between 22:30 UTC on 14 October and 04:00 UTC on 15 October, the strong temperature gradient remained remarkably quasi-stationary. During this period, west of this front, under the convective cells, the temperature decrease reached 1.4 ∘C (e.g. from 14.6 to 13.2 ∘C at Carcassonne), while near the Mediterranean Sea it remained constant (e.g. from 19.6 to 19.5 ∘C in Leucate). During the whole event, relative humidity remained high over the region of interest with values ranging from 80 % to 100 %. It exceeded 90 % in most of the Aude region after 22:00 UTC. The remarkable stationarity is well captured in virtual potential temperature, a parameter which combines temperature and humidity, from 22:30 to 04:00 UTC (Fig. 17a).
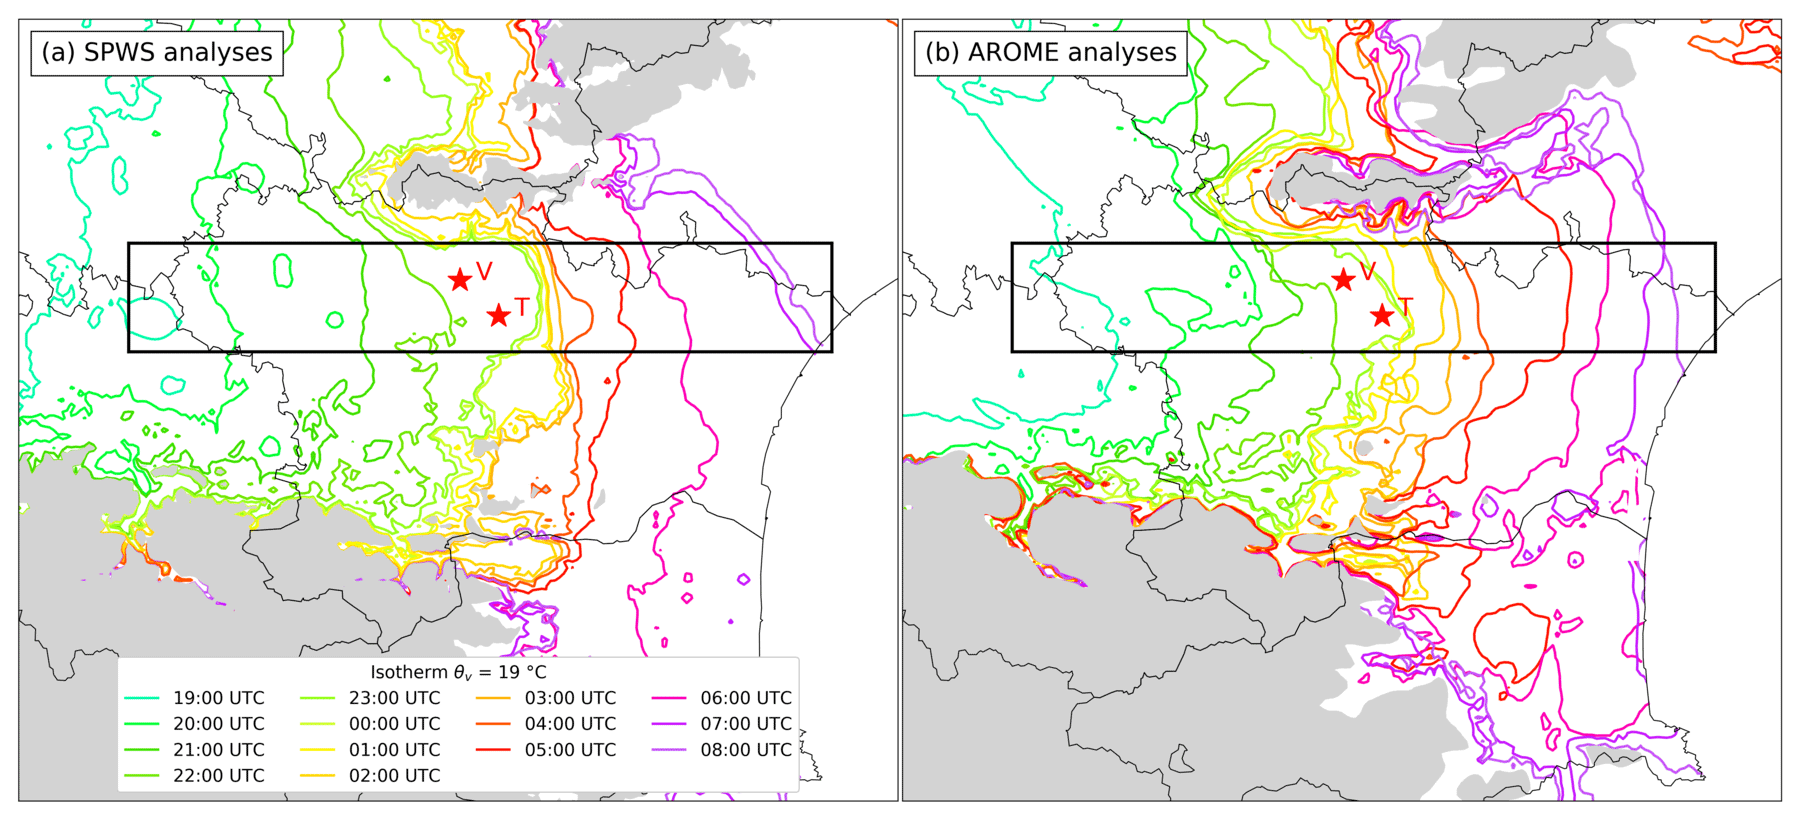
Figure 17As in Fig. 15 showing the location of the 19 ∘C 2 m virtual potential temperature isotherm, starting at 19:00 UTC on 14 October.
The stationarity is remarkable in the Aude valley around 2.5∘ E (Fig. 18), several kilometres east of Villegailhenc and Trèbes, two of the main towns affected by the event. The amplitude of the virtual potential temperature gradient reaches 3 to 4 ∘C on average over the Aude valley over a distance of 0.2∘ in longitude (around 16 km). As for the position of the trough, even if AROME-France analyses are most of the time close to SPWS analyses regarding the position of the virtual potential temperature gradient (Fig. 17b), they underestimate the small-scale signal of stationarity of this gradient east of Trèbes seen in SPWS analyses.
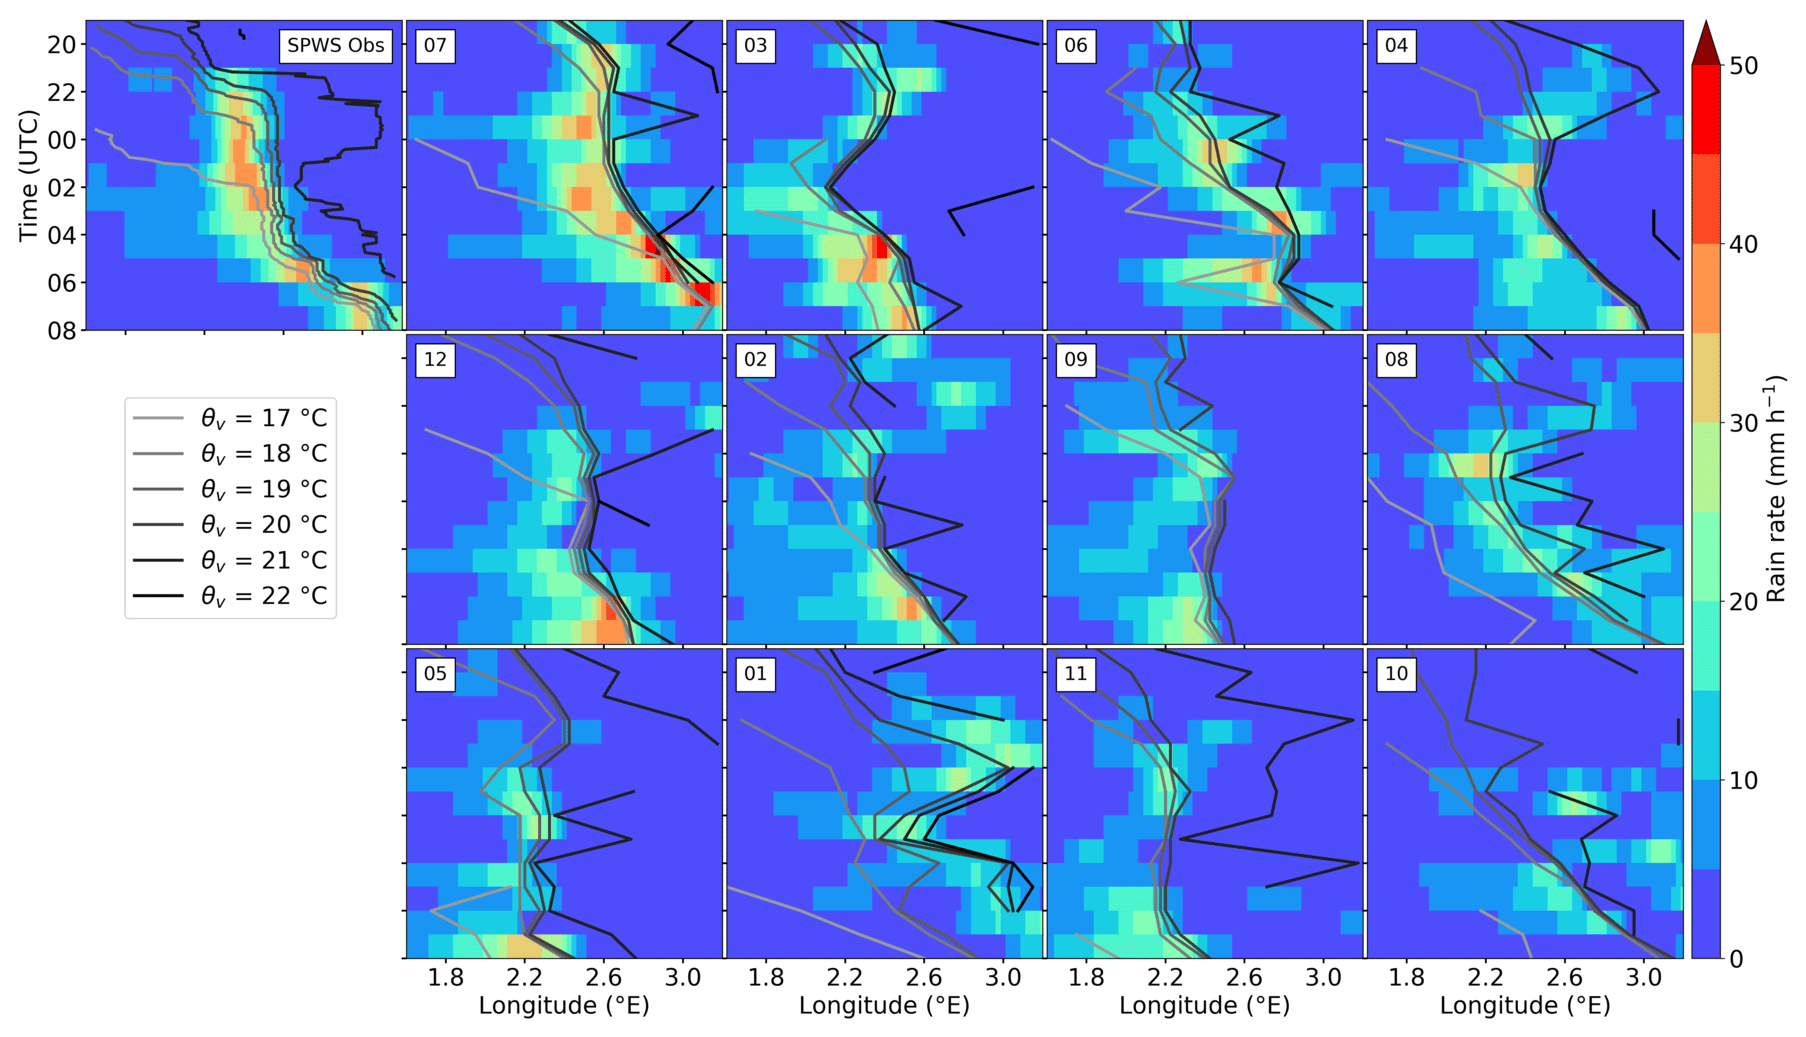
Figure 18As in Fig. 16 showing the mean longitude of the 17, 18, 19, 20, 21 and 22 ∘C 2 m virtual potential temperature isotherms.
By combining SWSs with PWSs, we identified two main near-surface features correlated with the stationarity of the heavy precipitation system:
-
a quasi-stationary MSLP trough around 0.25∘ east in longitude of the heavy precipitation and
-
a quasi-stationary virtual potential temperature gradient 0.1∘ east in longitude of the heavy precipitation.
The virtual potential temperature gradient materializes the boundary between the cold air located at the west of the region and the warm maritime air advected from the Mediterranean Sea. During the period of stationarity of rainfall, as the 2 m temperature decreases under the convective system, we could hypothesize that it is due to evaporation processes. It has already been shown that slow-moving cold fronts or cold pools have a major impact on the location of heavy precipitation events in the Mediterranean region (Ducrocq et al., 2008; Fiori et al., 2017; Duffourg et al., 2018). In this case, near the ground, observations show an existing cold air mass before the event begins, which is cooled during the event, increasing the west–east gradient of temperature along the front.
In addition to this boundary, the slow-moving synoptic low extended by a mesoscale quasi-stationary trough probably helped to enhance near-surface convergence and subsequently focus the convection over the Trèbes area. The presence of mesoscale surface disturbances such as a trough or a mesolow, modifying the circulation near the ground during a Mediterranean HPE, has already been noted by Romero et al. (2000); Nuissier et al. (2008); Ducrocq et al. (2008).
There may be some similarities between the HPE of November 1999 also in the Aude region and the 2018 case: the presence of a surface low in ALADIN forecasts was noted in the vicinity of the system, and the correlation between the strong radar echoes and the area of strong dew-point temperature gradient was also remarked (Aullo et al., 2002).
Figure 18 shows that the exact location of the precipitation predicted by the AROME-EPS system over the Aude valley is strongly correlated with the location of the predicted virtual potential temperature gradient, located east of the precipitation, as in the observations. Also, the highest hourly rain rates are associated with strong virtual potential temperature gradients (>3 ∘C difference in less than 0.2∘ longitude). If we focus on the three rainiest members (7, 3, and 6), they show strong gradients of virtual potential temperature in the Aude valley region, located east of the strongest rainfall, as seen in observations. Member 7 shows a quasi-stationary virtual potential temperature gradient near 2.65∘ E during 6 h, close to the stationarity seen in observations around 2.5∘ E also during almost 6 h. Even if the location of the gradient is shifted eastwards, its evolution from west to east is very similar to the observed one. The temperature gradient is a little stronger than observed. Members 3 and 6 show temperature gradients and trough oscillations during the case but with no clear stationarity as seen in member 7. These oscillations result in too-large predicted rainfall areas and too-low peak rainfall accumulations.
Figure 16 shows that in most of the members (all except 1 and 10), the location of rainfall is also correlated with the location of the trough. The reason why it is not correlated in members 1 and 10 is probably because the trough is almost non-existing over the area in these members, which leads us to identify locations that are isolated local MSLP minima.
The case of the deadly flash floods in the Aude catchment area on 14 and 15 October 2018 was studied on several scales using operational numerical weather prediction systems and observations including observations of connected objects. On a large scale, the meteorological situation is characterized by high geopotential values at 500 hPa over central Europe and slowly evolving geopotential anomalies over the western Atlantic and the Iberian Peninsula. These are classically found in Mediterranean HPEs, especially in the one of 12 and 13 November 1999, which caused flash floods in the same region (Nuissier et al., 2008).
Less classic was the presence of the remnants of a hurricane that may have brought additional moisture. Our study did not reveal any particular role of the remnants of Leslie in the contribution of humidity to the convective system that flooded the Aude basin. To evidence such a contribution, it is planned to carry out numerical simulations with backward trajectories to determine the origin of the humidity. Another potential source of humidity is traditionally the Mediterranean Sea. It has been shown that strong evaporation has taken place in the western part of the Mediterranean basin, which most likely contributed to the supply of moisture to the convective system. Once again, backward trajectories could make it possible to quantify this effect.
Examination of the radar reflectivities revealed the presence of a continuous train of convective cells starting from the eastern tip of the Pyrenees mountain range and heading towards the Aude catchment. The eastern end of the Pyrenees seems to play a role in the initiation of convection. Ducrocq et al. (2008) also noted that this same orographic feature, described as a small hill, could be a cause of the lifting of the low-level jet in the case of the 1999 event. The role of this feature could be confirmed by a numerical study of the sensitivity to the presence of the relief.
From a hydrological point of view, it has been shown that soil moisture did not play a significant role in the formation of floods in the Aude basin. Predictability of basin rainfall with a set of NWP systems (either deterministic or probabilistic) has been shown to be limited despite predicted rainfall that was often realistic but offset with respect to the catchments where the highest rainfall was observed – a well-known phenomenon in the field of hydrometeorological forecasting of flash floods (e.g. Hally et al., 2015).
The analysis of the link between heavy rainfall and other fields predicted by AROME-EPS showed particular mesoscale meteorological patterns in the rainiest members. The presence of a mesoscale trough near the ground was evidenced in the area of interest, as well as a moist, warm low-level jet coming from the Mediterranean and colder air west of the heavy precipitation. The mesoscale trough connected to a low located between Spain and the Balearic Islands which moved slowly north-eastwards during the event. The low deepened until 00:00 UTC on 15 October, between 00:00 and 04:00 UTC, MSLP remained quite constant and then the low started filling up after 04:00 UTC. It was shown that the marine low-level jet wind speed is linearly related to the pressure gradient around the low. AROME-France analyses and the rainiest AROME-EPS members exhibit the largest pressure gradients and low-level jet wind speeds, even if they do not reach the values observed by surface stations.
The use of observations from personal weather stations in addition to standard stations has improved precipitation estimates and helped give a picture of the state of the atmosphere near the ground with unprecedented detail. With supplementary surface observations, small-scale near-surface features correlated to the stationarity of the rainfall observed were brought to light.
The mesoscale trough was found to remain quasi-stationary east of the largest rainfall accumulations in the Aude valley during approximately 6 h. The observed deepening of the trough may have been amplified by intense lifting, which in turn helped increase the near-surface marine flux and convergence. Cold air was advected from the Atlantic on 14 October by a cold front during the day. The remnants of the cold front formed a pre-existing west–east virtual potential temperature gradient, and cold air was observed moving from the western part of the Aude towards the east before the event. The gradient strengthened rapidly from 22:30 UTC and remained almost stationary just after rainfall began. It was located during the whole event east of the largest rainfall accumulations. This cold boundary may have caused enhanced lifting of air parcels, helping to focus thunderstorms over the area where the maximal rainfall was observed. Moreover, the cooling associated with rainfall evaporation, by increasing the temperature gradient, may have provided a positive feedback to lifting enhancement. In comparison, Ducrocq et al. (2008) did not find a pre-existing cold boundary for the 1999 case but showed that the evaporation of precipitation acted mainly to enhance the rainfall intensity by reinforcing the low-level convergence at the leading edge of the convective line. Although the origin of the pre-existing cold air mass is different, one may note some similarity with other Mediterranean heavy precipitation events such as that of Genoa, 2011 (Fiori et al., 2014) and 2014 (Fiori et al., 2017), where a cold jet outflowing from the Po Valley met a warm and moist low-level south-easterly jet coming from the Mediterranean Sea.
The stationarity of these two features between 22:30 and 04:00 UTC showed that a quasi-equilibrium between the near-surface marine flux feeding the system from the Mediterranean Sea and the expansion of the cold boundary towards east was reached. This equilibrium seems to have lasted until the low over the Mediterranean Sea moved north-eastwards and caused a pressure increase in the Aude region starting from 04:00 UTC, shifting the trough and the temperature gradient as well as the thunderstorms from the stationarity area.
Operational AROME-EPS members globally underestimated the rainfall over the Aude valley. Only the rainiest member of the ensemble was able to forecast a rainfall amount exceeding 320 mm over the Aude valley, approximately 20 km east of the area exceeding 300 mm in the observations. The other members generally located the maximum rainfall over the mountains. Regarding the near-surface features, significant differences in the MSLP low amplitude and trajectory are seen among members. They affect in turn the forecasts of the amplitude and location of the trough associated with it as well as the predicted maritime flux.
The three rainiest members predicted the three strongest mean wind speeds blowing from the Mediterranean Sea in Leucate. Among these three members, only the rainiest member of the AROME-EPS reproduced quasi-stationary MSLP trough and virtual potential temperature gradient similar to the observations.
To investigate the initiation processes, the impact of the Pyrenees relief, the role of the diabatic cooling, the origin of moisture, and the role of changes in wind near the Mediterranean shore in the stationarity of this back-building multicellular system, further storm-scale numerical simulations will be presented in a follow-up study that is under revision at the time of writing (Mandement and Caumont, 2020b).
A1 Description of the ANTILOPE algorithm
The ANTILOPE algorithm combines radar data and rain gauge data. The estimation of stratiform and convective rainfall in ANTILOPE is based on a spatial-interpolation geostatistical method: kriging with external drift (KED), which allows us to take into account an auxiliary spatial variable (here the radar QPE) to interpolate point values (here rain gauge observations). It only involves observations within a radius of 100 km around the point to be calculated. The KED is applied on the one hand to the large-scale rain-gauge accumulations with the large-scale radar QPE as an auxiliary variable and on the other hand to the small-scale rain-gauge accumulations with the small-scale radar QPE as an auxiliary variable. The ANTILOPE QPE is the sum of the two estimates. ANTILOPE QPE thus has a spatial structure close to that of the radar but with values adjusted according to the observed rainfall totals. In particular, the total accumulation of a pixel containing a rain gauge is equal to the total measured by the rain gauge.
For operations, ANTILOPE is run in real time, as well as in delayed time to benefit from more rain gauge data. Total rainfall is estimated at 15 min or hourly intervals over France at a spatial resolution of 1 km. Here, the delayed-time version of ANTILOPE is used as a reference. In this study, the inclusion of PWS data in the ANTILOPE algorithm in addition to SWS data is tested and evaluated (see Appendix A2). This inclusion is expected to be all the more beneficial to the ANTILOPE QPE as the radar suffered failures during the event.
A2 Evaluation of the inclusion of PWS data in ANTILOPE
Accumulated rainfall observed during 48 h as computed with the operational ANTILOPE algorithm, which blends radar data and conventional (SWS) rain gauges, is shown in Fig. A1. This product is hereafter referred to as “SWS ANTILOPE”. The cumulative rainfall observed when manually quality checked, supplementary PWS observations are included in the ANTILOPE product is shown in Fig. 6. This product is hereafter referred to as “SPWS ANTILOPE”.
A validation performed on 34 independent automatic and manual rain gauges over six watersheds of the Aude region shows a better agreement of the rainfall accumulation computed by adding PWS data in RMSE, compared to the operational rainfall accumulation (Fig. A2). As a consequence, this new QPE is used in this study as a reference.

Figure A1SWS ANTILOPE 48 h rainfall accumulation superimposed with rain gauge accumulations (mm) between 06:00 UTC on 14 October and 06:00 UTC on 16 October. Major river basins are indicated in bold black. The 48 h period has been chosen to include manual Météo-France rain gauges to evaluate both products (in the “validation” group).
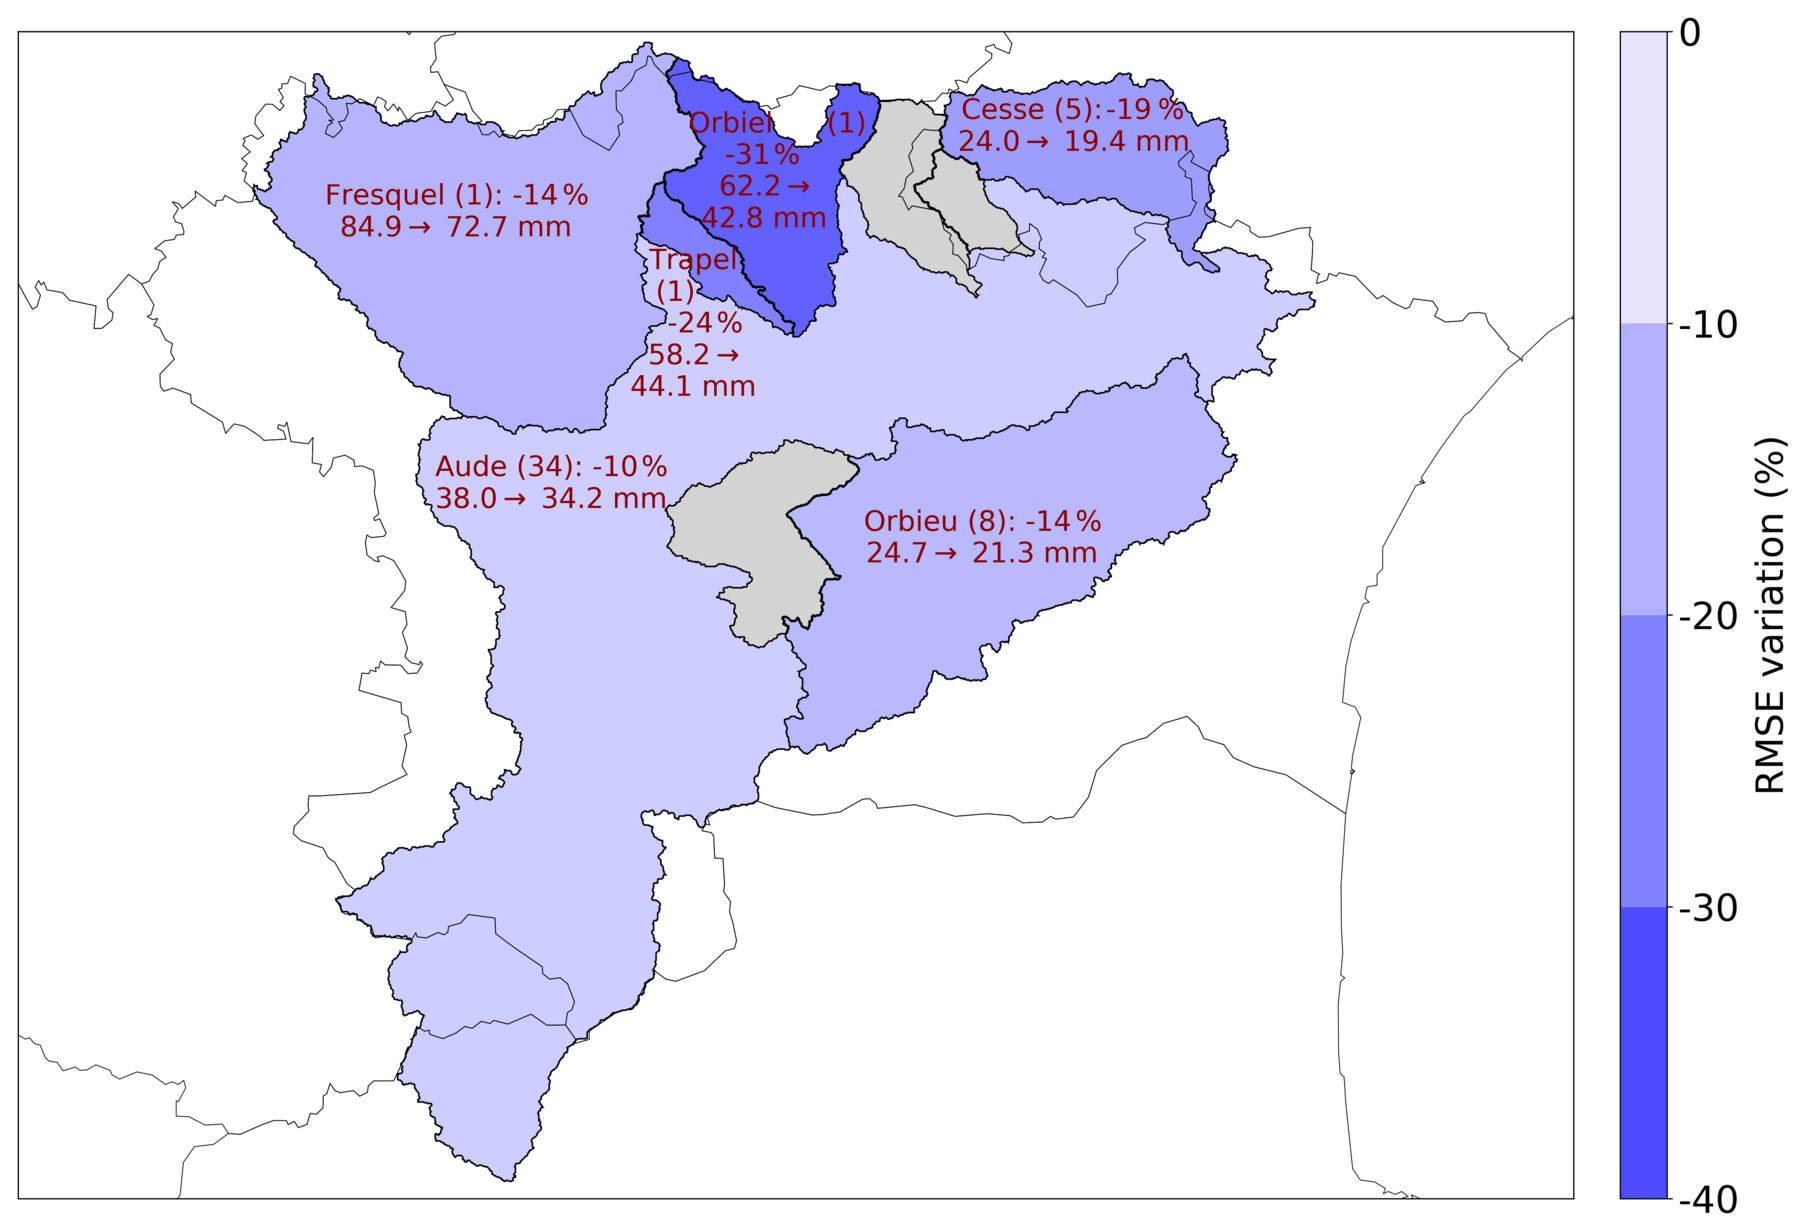
Figure A2RMSE variation (% and mm) between SPWS ANTILOPE and SWS ANTILOPE over validation rain gauges in each watershed of the Aude basin. The name of the watershed and the number of validation rain gauges (in parentheses) are indicated. Grey watersheds indicate that no validation rain gauges are available.
The codes of the operational NWP systems mentioned in the paper are not free, but the forecasts can be obtained upon request from the authors for research purposes. The OSTIA SST fields were provided by GHRSST, the Met Office, and CMEMS (METOFFICE-GLO-SST-L4-NRT-OBS-ANOM-V2 product on http://marine.copernicus.eu/; Copernicus Marine Environment Monitoring Service, CMEMS, 2021). The hydrological observational data are available from the French HYDRO data bank (http://www.hydro.eaufrance.fr/; Ministère de l'écologie, du développement durable et de l'énergie, 2020) or come from post-event surveys conducted in the framework of HyMeX (data set available here: https://mistrals.sedoo.fr/?editDatsId=1512&datsId=1512&project_name=HyMeX&q=post-event+survey; Payrastre, 2019). The weather observations can be obtained upon request from the authors for research purposes.
All authors collaborated and contributed to drafting, reviewing, and editing the paper. In particular, OC coordinated the writing of the paper; MM contributed to the analysis of radar–rain gauge data and to the analysis of the relationship between rainfall and mesoscale features; FB contributed to the analysis of AROME-EPS forecasts; JE contributed to the analysis of soil moisture and hydrological data; CLB contributed to the analysis of atmosphere–ocean interactions; AL contributed to the analysis of hydrological data and AROME-France rainfall forecasts. ON contributed to the analysis of the meteorological context; and OL contributed to the analysis of radar–rain gauge data.
The authors declare that no competing interests are present.
This article is part of the special issue “Hydrological cycle in the Mediterranean (ACP/AMT/GMD/HESS/NHESS/OS inter-journal SI)”. It is not associated with a conference.
The map tiles in Fig. 5 were created by Stamen Design, under CC BY 3.0; data by OpenStreetMap, under ODbL. The authors would like to thank the two anonymous reviewers who helped improve the quality of this article.
This research has been supported by the Agence Nationale de la Recherche (PICS project under grant ANR-17-CE03-0011) and the MISTRALS (HyMeX programme).
This paper was edited by Heini Wernli and reviewed by two anonymous referees.
Ancell, B. C.: Improving High-Impact Forecasts through Sensitivity-Based Ensemble Subsets: Demonstration and Initial Tests, Weather Forecast., 31, 1019–1036, https://doi.org/10.1175/waf-d-15-0121.1, 2016. a
Aullo, G., Santurette, P., Ducrocq, V., Jacq, V., Guillemot, F., Sénéquier, D., Bourdette, N., and Bessemoulin, P.: L'épisode de pluies diluviennes du 12 au 13 novembre 1999 sur le Sud de la France, Météo-France, Toulouse, 80 pp., ISBN 2110923407, 2002. a
Berne, A., Delrieu, G., Creutin, J.-D., and Obled, C.: Temporal and spatial resolution of rainfall measurements required for urban hydrology, J. Hydrol., 299, 166–179, https://doi.org/10.1016/j.jhydrol.2004.08.002, 2004. a
Bouttier, F., Vié, B., Nuissier, O., and Raynaud, L.: Impact of Stochastic Physics in a Convection-Permitting Ensemble, Mon. Weather Rev., 140, 3706–3721, https://doi.org/10.1175/mwr-d-12-00031.1, 2012. a
Bouttier, F., Raynaud, L., Nuissier, O., and Ménétrier, B.: Sensitivity of the AROME ensemble to initial and surface perturbations during HyMeX, Q. J. Roy. Meteor. Soc., 142, 390–403, https://doi.org/10.1002/qj.2622, 2016. a
Bresson, E., Ducrocq, V., Nuissier, O., Ricard, D., and de Saint-Aubin, C.: Idealized numerical simulations of quasi-stationary convective systems over the Northwestern Mediterranean complex terrain, Q. J. Roy. Meteor. Soc., 138, 1751–1763, https://doi.org/10.1002/qj.1911, 2012. a
Brousseau, P., Berre, L., Bouttier, F., and Desroziers, G.: Background-error covariances for a convective-scale data-assimilation system: AROME-France 3D-Var, Q. J. Roy. Meteor. Soc., 137, 409–422, https://doi.org/10.1002/qj.750, 2011. a
Brousseau, P., Seity, Y., Ricard, D., and Léger, J.: Improvement of the forecast of convective activity from the AROME-France system, Q. J. Roy. Meteor. Soc., 142, 2231–2243, https://doi.org/10.1002/qj.2822, 2016. a
Copernicus Marine Environment Monitoring Service (CMEMS): METOFFICE-GLO-SST-L4-NRT-OBS-ANOM-V2 product, available at: http://marine.copernicus.eu/, last access: 25 March 2021. a
Courtier, P., Freydier, C., Geleyn, J.-F., Rabier, F., and Rochas, M.: The Arpege project at Meteo France, in: Seminar on Numerical Methods in Atmospheric Models, ECMWF, Shinfield Park, Reading, UK, 9–13 September 1991, 193–232, available at: https://www.ecmwf.int/node/8798 (last access: 27 March 2021), 1991. a
Creutin, J. D., Borga, M., Lutoff, C., Scolobig, A., Ruin, I., and Créton-Cazanave, L.: Catchment dynamics and social response during flash floods: the potential of radar rainfall monitoring for warning procedures, Meteorol. Appl., 16, 115–125, https://doi.org/10.1002/met.128, 2009. a
Donlon, C. J., Martin, M., Stark, J., Roberts-Jones, J., Fiedler, E., and Wimmer, W.: The Operational Sea Surface Temperature and Sea Ice Analysis (OSTIA) system, Remote Sens. Environ., 116, 140–158, https://doi.org/10.1016/j.rse.2010.10.017, 2012. a
Ducrocq, V., Nuissier, O., Ricard, D., Lebeaupin, C., and Thouvenin, T.: A numerical study of three catastrophic precipitating events over southern France, II: Mesoscale triggering and stationarity factors, Q. J. Roy. Meteor. Soc., 134, 131–145, https://doi.org/10.1002/qj.199, 2008. a, b, c, d, e
Ducrocq, V., Braud, I., Davolio, S., Ferretti, R., Flamant, C., Jansa, A., Kalthoff, N., Richard, E., Taupier-Letage, I., Ayral, P.-A., Belamari, S., Berne, A., Borga, M., Boudevillain, B., Bock, O., Boichard, J.-L., Bouin, M.-N., Bousquet, O., Bouvier, C., Chiggiato, J., Cimini, D., Corsmeier, U., Coppola, L., Cocquerez, P., Defer, E., Delanoë, J., Di Girolamo, P., Doerenbecher, A., Drobinski, P., Dufournet, Y., Fourrié, N., Gourley, J. J., Labatut, L., Lambert, D., Le Coz, J., Marzano, F. S., Molinié, G., Montani, A., Nord, G., Nuret, M., Ramage, K., Rison, W., Roussot, O., Saïd, F., Schwarzenboeck, A., Testor, P., Van Baelen, J., Vincendon, B., Aran, M., and Tamayo, J.: HyMeX-SOP1: The Field Campaign Dedicated to Heavy Precipitation and Flash Flooding in the Northwestern Mediterranean, B. Am. Meteorol. Soc., 95, 1083–1100, https://doi.org/10.1175/bams-d-12-00244.1, 2014. a
Duffourg, F., Nuissier, O., Ducrocq, V., Flamant, C., Chazette, P., Delanoë, J., Doerenbecher, A., Fourrié, N., Di Girolamo, P., Lac, C., Legain, D., Martinet, M., Saïd, F., and Bock, O.: Offshore deep convection initiation and maintenance during the HyMeX IOP 16a heavy precipitation event, Q. J. Roy. Meteor. Soc., 142, 259–274, https://doi.org/10.1002/qj.2725, 2016. a
Duffourg, F., Lee, K.-O., Ducrocq, V., Flamant, C., Chazette, P., and Di Girolamo, P.: Role of moisture patterns in the backbuilding formation of HyMeX IOP13 heavy precipitation systems, Q. J. Roy. Meteor. Soc., 144, 291–303, https://doi.org/10.1002/qj.3201, 2018. a
Faggian, N., Roux, B., Steinle, P., and Ebert, B.: Fast calculation of the fractions skill score, MAUSAM, 457–466, available at: https://metnet.imd.gov.in/mausamdocs/166310_F.pdf (last access: 27 March 2021), 2015. a
Figueras i Ventura, J. and Tabary, P.: The New French Operational Polarimetric Radar Rainfall Rate Product, J. Appl. Meteorol. Clim., 52, 1817–1835, https://doi.org/10.1175/jamc-d-12-0179.1, 2013. a
Fiori, E., Comellas, A., Molini, L., Rebora, N., Siccardi, F., Gochis, D. J., Tanelli, S., and Parodi, A.: Analysis and hindcast simulations of an extreme rainfall event in the Mediterranean area: The Genoa 2011 case, Atmos. Res., 138, 13–29, https://doi.org/10.1016/j.atmosres.2013.10.007, 2014. a
Fiori, E., Ferraris, L., Molini, L., Siccardi, F., Kranzlmueller, D., and Parodi, A.: Triggering and evolution of a deep convective system in the Mediterranean Sea: modelling and observations at a very fine scale, Q. J. Roy. Meteor. Soc., 143, 927–941, https://doi.org/10.1002/qj.2977, 2017. a, b
Grillakis, M. G., Koutroulis, A. G., Komma, J., Tsanis, I. K., Wagner, W., and Blöschl, G.: Initial soil moisture effects on flash flood generation – A comparison between basins of contrasting hydro-climatic conditions, J. Hydrol., 541, 206–217, https://doi.org/10.1016/j.jhydrol.2016.03.007, 2016. a
Habets, F., Boone, A., Champeaux, J. L., Etchevers, P., Franchistéguy, L., Leblois, E., Ledoux, E., Moigne, P. L., Martin, E., Morel, S., Noilhan, J., Seguí, P. Q., Rousset-Regimbeau, F., and Viennot, P.: The SAFRAN-ISBA-MODCOU hydrometeorological model applied over France, J. Geophys. Res., 113, D06113, https://doi.org/10.1029/2007jd008548, 2008. a
Hally, A., Caumont, O., Garrote, L., Richard, E., Weerts, A., Delogu, F., Fiori, E., Rebora, N., Parodi, A., Mihalović, A., Ivković, M., Dekić, L., van Verseveld, W., Nuissier, O., Ducrocq, V., D'Agostino, D., Galizia, A., Danovaro, E., and Clematis, A.: Hydrometeorological multi-model ensemble simulations of the 4 November 2011 flash flood event in Genoa, Italy, in the framework of the DRIHM project, Nat. Hazards Earth Syst. Sci., 15, 537–555, https://doi.org/10.5194/nhess-15-537-2015, 2015. a, b, c
Jones, S., Golding, B., Members of the HIWeather Task Team, Participants in the HIWeather Workshops in Karlsruhe, Germany (2013) and Silver Springs, USA (2014): HIWeather Implementation Plan, available at: http://www.hiweather.net/Uploads/ue/file/20190411/1554934497413129.pdf (last access: 27 March 2021), 2014. a
Lac, C., Chaboureau, J.-P., Masson, V., Pinty, J.-P., Tulet, P., Escobar, J., Leriche, M., Barthe, C., Aouizerats, B., Augros, C., Aumond, P., Auguste, F., Bechtold, P., Berthet, S., Bielli, S., Bosseur, F., Caumont, O., Cohard, J.-M., Colin, J., Couvreux, F., Cuxart, J., Delautier, G., Dauhut, T., Ducrocq, V., Filippi, J.-B., Gazen, D., Geoffroy, O., Gheusi, F., Honnert, R., Lafore, J.-P., Lebeaupin Brossier, C., Libois, Q., Lunet, T., Mari, C., Maric, T., Mascart, P., Mogé, M., Molinié, G., Nuissier, O., Pantillon, F., Peyrillé, P., Pergaud, J., Perraud, E., Pianezze, J., Redelsperger, J.-L., Ricard, D., Richard, E., Riette, S., Rodier, Q., Schoetter, R., Seyfried, L., Stein, J., Suhre, K., Taufour, M., Thouron, O., Turner, S., Verrelle, A., Vié, B., Visentin, F., Vionnet, V., and Wautelet, P.: Overview of the Meso-NH model version 5.4 and its applications, Geosci. Model Dev., 11, 1929–1969, https://doi.org/10.5194/gmd-11-1929-2018, 2018. a
Lafore, J. P., Stein, J., Asencio, N., Bougeault, P., Ducrocq, V., Duron, J., Fischer, C., Héreil, P., Mascart, P., Masson, V., Pinty, J. P., Redelsperger, J. L., Richard, E., and Vilà-Guerau de Arellano, J.: The Meso-NH Atmospheric Simulation System. Part I: adiabatic formulation and control simulations, Ann. Geophys., 16, 90–109, https://doi.org/10.1007/s00585-997-0090-6, 1998. a
Laurantin, O.: ANTILOPE: hourly rainfall analysis merging radar and rain gauge data, in: Int. Symp. Weather Radar and Hydrology (WRaH2008), Grenoble/Autrans, France, 10–15 March 2008, 2008. a
Laurantin, O.: ANTILOPE: hourly rainfall analysis over France merging radar and rain gauges data, in: Proceedings of the 11th International Precipitation Conference, edited by: Leijnse, H. and Uijlenhoet, R., KNMI, Ede-Wageningen, the Netherlands, 30 June to 3 July 2013. a
Lorenzo-Lacruz, J., Amengual, A., Garcia, C., Morán-Tejeda, E., Homar, V., Maimó-Far, A., Hermoso, A., Ramis, C., and Romero, R.: Hydro-meteorological reconstruction and geomorphological impact assessment of the October 2018 catastrophic flash flood at Sant Llorenç, Mallorca (Spain), Nat. Hazards Earth Syst. Sci., 19, 2597–2617, https://doi.org/10.5194/nhess-19-2597-2019, 2019. a
Mandement, M. and Caumont, O.: Contribution of personal weather stations to the observation of deep-convection features near the ground, Nat. Hazards Earth Syst. Sci., 20, 299–322, https://doi.org/10.5194/nhess-20-299-2020, 2020a. a, b
Mandement, M. and Caumont, O.: A numerical study to investigate the roles of former hurricane Leslie, orography, and evaporative cooling in the 2018 Aude heavy precipitation event, Weather Clim. Dynam. Discuss. [preprint], https://doi.org/10.5194/wcd-2020-54, in revision, 2020b. a
Members of the ALADIN international team: The ALADIN project: Mesoscale modelling seen as a basic tool for weather forecasting and atmospheric research, World Meteorological Organization Bulletin, 46, 317–324, 1997. a
Ministère de l'écologie, du développement durable et de l'énergie (French Ministry of Ecology, Sustainable Development, and Energy): HYDRO data bank, available at: http://hydro.eaufrance.fr/, last access: 19 August 2020. a
Nuissier, O., Ducrocq, V., Ricard, D., Lebeaupin, C., and Anquetin, S.: A numerical study of three catastrophic precipitating events over southern France, I: Numerical framework and synoptic ingredients, Q. J. Roy. Meteor. Soc., 134, 111–130, https://doi.org/10.1002/qj.200, 2008. a, b, c, d
Parodi, A., Kranzlmüller, D., Clematis, A., Danovaro, E., Galizia, A., Garrote, L., Llasat, M. C., Caumont, O., Richard, E., Harpham, Q., Siccardi, F., Ferraris, L., Rebora, N., Delogu, F., Fiori, E., Molini, L., Foufoula-Georgiou, E., and D'Agostino, D.: DRIHM(2US): An e-Science Environment for Hydrometeorological Research on High-Impact Weather Events, B. Am. Meteorol. Soc., 98, 2149–2166, https://doi.org/10.1175/bams-d-16-0279.1, 2017. a
Payrastre, O.: Post event Survey Aude October 2018 – HYMEX LOP, SEDOO OMP, https://doi.org/10.6096/MISTRALS-HYMEX.1512, 2019. a
Payrastre, O., Bourgin, F., Caumont, O., Ducrocq, V., Éric Gaume, Janet, B., Javelle, P., Lague, D., Moncoulon, D., Naulin, J.-P., Perrin, C., Ramos, M.-H., Ruin, I., and the PICS project contributors: Integrated nowcasting of flash floods and related socio-economic impacts: The French ANR PICS project (2018–2021), in: European Geosciences Union General Assembly, EGU2019-15204, available at: https://meetingorganizer.copernicus.org/EGU2019/EGU2019-15204.pdf (last access: 27 March 2021), 2019. a
Raynaud, L. and Bouttier, F.: Comparison of initial perturbation methods for ensemble prediction at convective scale, Q. J. Roy. Meteor. Soc., 142, 854–866, https://doi.org/10.1002/qj.2686, 2016. a
Ricard, D., Ducrocq, V., and Auger, L.: A Climatology of the Mesoscale Environment Associated with Heavily Precipitating Events over a Northwestern Mediterranean Area, J. Appl. Meteorol. Clim., 51, 468–488, https://doi.org/10.1175/jamc-d-11-017.1, 2012. a, b
Roberts, N. M. and Lean, H. W.: Scale-Selective Verification of Rainfall Accumulations from High-Resolution Forecasts of Convective Events, Mon. Weather Rev., 136, 78–97, https://doi.org/10.1175/2007MWR2123.1, 2008. a
Romero, R., Doswell, C. A., and Ramis, C.: Mesoscale Numerical Study of Two Cases of Long-Lived Quasi-Stationary Convective Systems over Eastern Spain, Mon. Weather Rev., 128, 3731–3751, https://doi.org/10.1175/1520-0493(2001)129<3731:MNSOTC>2.0.CO;2, 2000. a
Rossa, A., Liechti, K., Zappa, M., Bruen, M., Germann, U., Haase, G., Keil, C., and Krahe, P.: The COST 731 Action: A review on uncertainty propagation in advanced hydro-meteorological forecast systems, Atmos. Res., 100, 150–167, https://doi.org/10.1016/j.atmosres.2010.11.016, 2011. a
Seity, Y., Brousseau, P., Malardel, S., Hello, G., Bénard, P., Bouttier, F., Lac, C., and Masson, V.: The AROME-France Convective-Scale Operational Model, Mon. Weather Rev., 139, 976–991, https://doi.org/10.1175/2010MWR3425.1, 2011. a
Sivapalan, M., Jothityangkoon, C., and Menabde, M.: Linearity and nonlinearity of basin response as a function of scale: Discussion of alternative definitions, Water Resour. Res., 38, 41–45, https://doi.org/10.1029/2001wr000482, 2002. a
Termonia, P., Fischer, C., Bazile, E., Bouyssel, F., Brožková, R., Bénard, P., Bochenek, B., Degrauwe, D., Derková, M., El Khatib, R., Hamdi, R., Mašek, J., Pottier, P., Pristov, N., Seity, Y., Smolíková, P., Španiel, O., Tudor, M., Wang, Y., Wittmann, C., and Joly, A.: The ALADIN System and its canonical model configurations AROME CY41T1 and ALARO CY40T1, Geosci. Model Dev., 11, 257–281, https://doi.org/10.5194/gmd-11-257-2018, 2018. a
Vincendon, B., Ducrocq, V., Nuissier, O., and Vié, B.: Perturbation of convection-permitting NWP forecasts for flash-flood ensemble forecasting, Nat. Hazards Earth Syst. Sci., 11, 1529–1544, https://doi.org/10.5194/nhess-11-1529-2011, 2011. a
- Abstract
- Introduction
- Meteorological data
- Case description
- Validation of operational NWP systems
- Relationship between rainfall and other meteorological mesoscale features
- Conclusions
- Appendix A: ANTILOPE quantitative precipitation estimates
- Code and data availability
- Author contributions
- Competing interests
- Special issue statement
- Acknowledgements
- Financial support
- Review statement
- References