the Creative Commons Attribution 4.0 License.
the Creative Commons Attribution 4.0 License.
 | 08 Dec 2020
What controls the coarse sediment yield to a Mediterranean delta? The case of the Llobregat River (NE Iberian Peninsula)
Juan P. Martín-Vide
Arnau Prats-Puntí
Carles Ferrer-Boix
The human pressure upon an alluvial river in the Mediterranean region has changed its riverine and deltaic landscapes. The river has been channelized in the last 70 years while the delta has been retreating for more than a century (a set of data unknown, so far). The paper concentrates on the fluvial component, trying to connect it to the delta evolution. Is the channelization responsible for the delta retreat? We develop a method to compute the actual bed load transport with real information of the past river morphology. The paper compares the computation with very limited measurements, among which are bulk volumes of trapped material at a modern, deep river mouth. The decrease in sediment availability in the last 30 km of the channelized river is deemed responsible for the decrease in the sediment yield to the delta. Moreover, power development and flood frequency should be responsible for a baseline delta retreat during the 20th century. The sediment trapping efficiency of dams is less important than the flow regulation by dams, in the annual sediment yield. Therefore, it is more effective to dismantle channelization than to pass sediment at dams, to provide sand to the beaches.
- Article
(11335 KB) - Full-text XML
- BibTeX
- EndNote


The framework for this research is the human pressure upon an alluvial river in the Mediterranean region. The paper aims at showing how and why the riverine and deltaic landscapes have changed. The time frame of the research is the last 70 years, over which the main pressure has been one of river channelization, yet some information prior to this period is necessary to understand the long-term trends. The practice of channelizing a river generally involves increasing channel capacity and so an erosional response is to be feared, although this is not always the case (Simon and Rinaldi, 2006). Typically, it also involves narrowing of the flood channel by taking a large part of the floodplains for urban uses. This floodplain width reduction (encroachment or contraction) implies a perturbation of the equilibrium (more specifically, a degradation), as demonstrated analytically and experimentally by Vanoni (1975), yet this is only one of the several causes of the degradation of a river bed (Galay, 1983).
With regards to the delta, the relative importance of fluvial building and wave and tidal reworking determines the delta morphology and evolution (Bridge, 2003). The relevant maritime factors are reduced to wave action in the case of the Mediterranean Sea (no substantial tides). This wave action and its related currents produce a certain longitudinal coastal sediment transport, as well as a transfer of sand towards the open sea. The dominance of the fluvial or the maritime factor varies in space and time for a given delta. However, the simple statement made herein is that the greater the river sediment supply the more the delta will protrude into the standing water body, keeping the maritime factor constant, and vice versa. Literature on delta evolution is abundant (e.g., Orton and Reading, 1993; Syvitski and Saito, 2007) and on river evolution as well (e.g., Rinaldi and Simon, 1998; Martín-Vide et al., 2010), but the connection between the two is less well known in physical terms, in spite of statistical approaches (Ibañez et al., 2019; Xing et al. 2014). It is difficult to find data to evaluate the disturbance of river sediment supply on delta evolution, except for a few cases such as the Mississippi River (Allison et al., 2012; Viparelli et al., 2015). A connection of this type is attempted in this research.
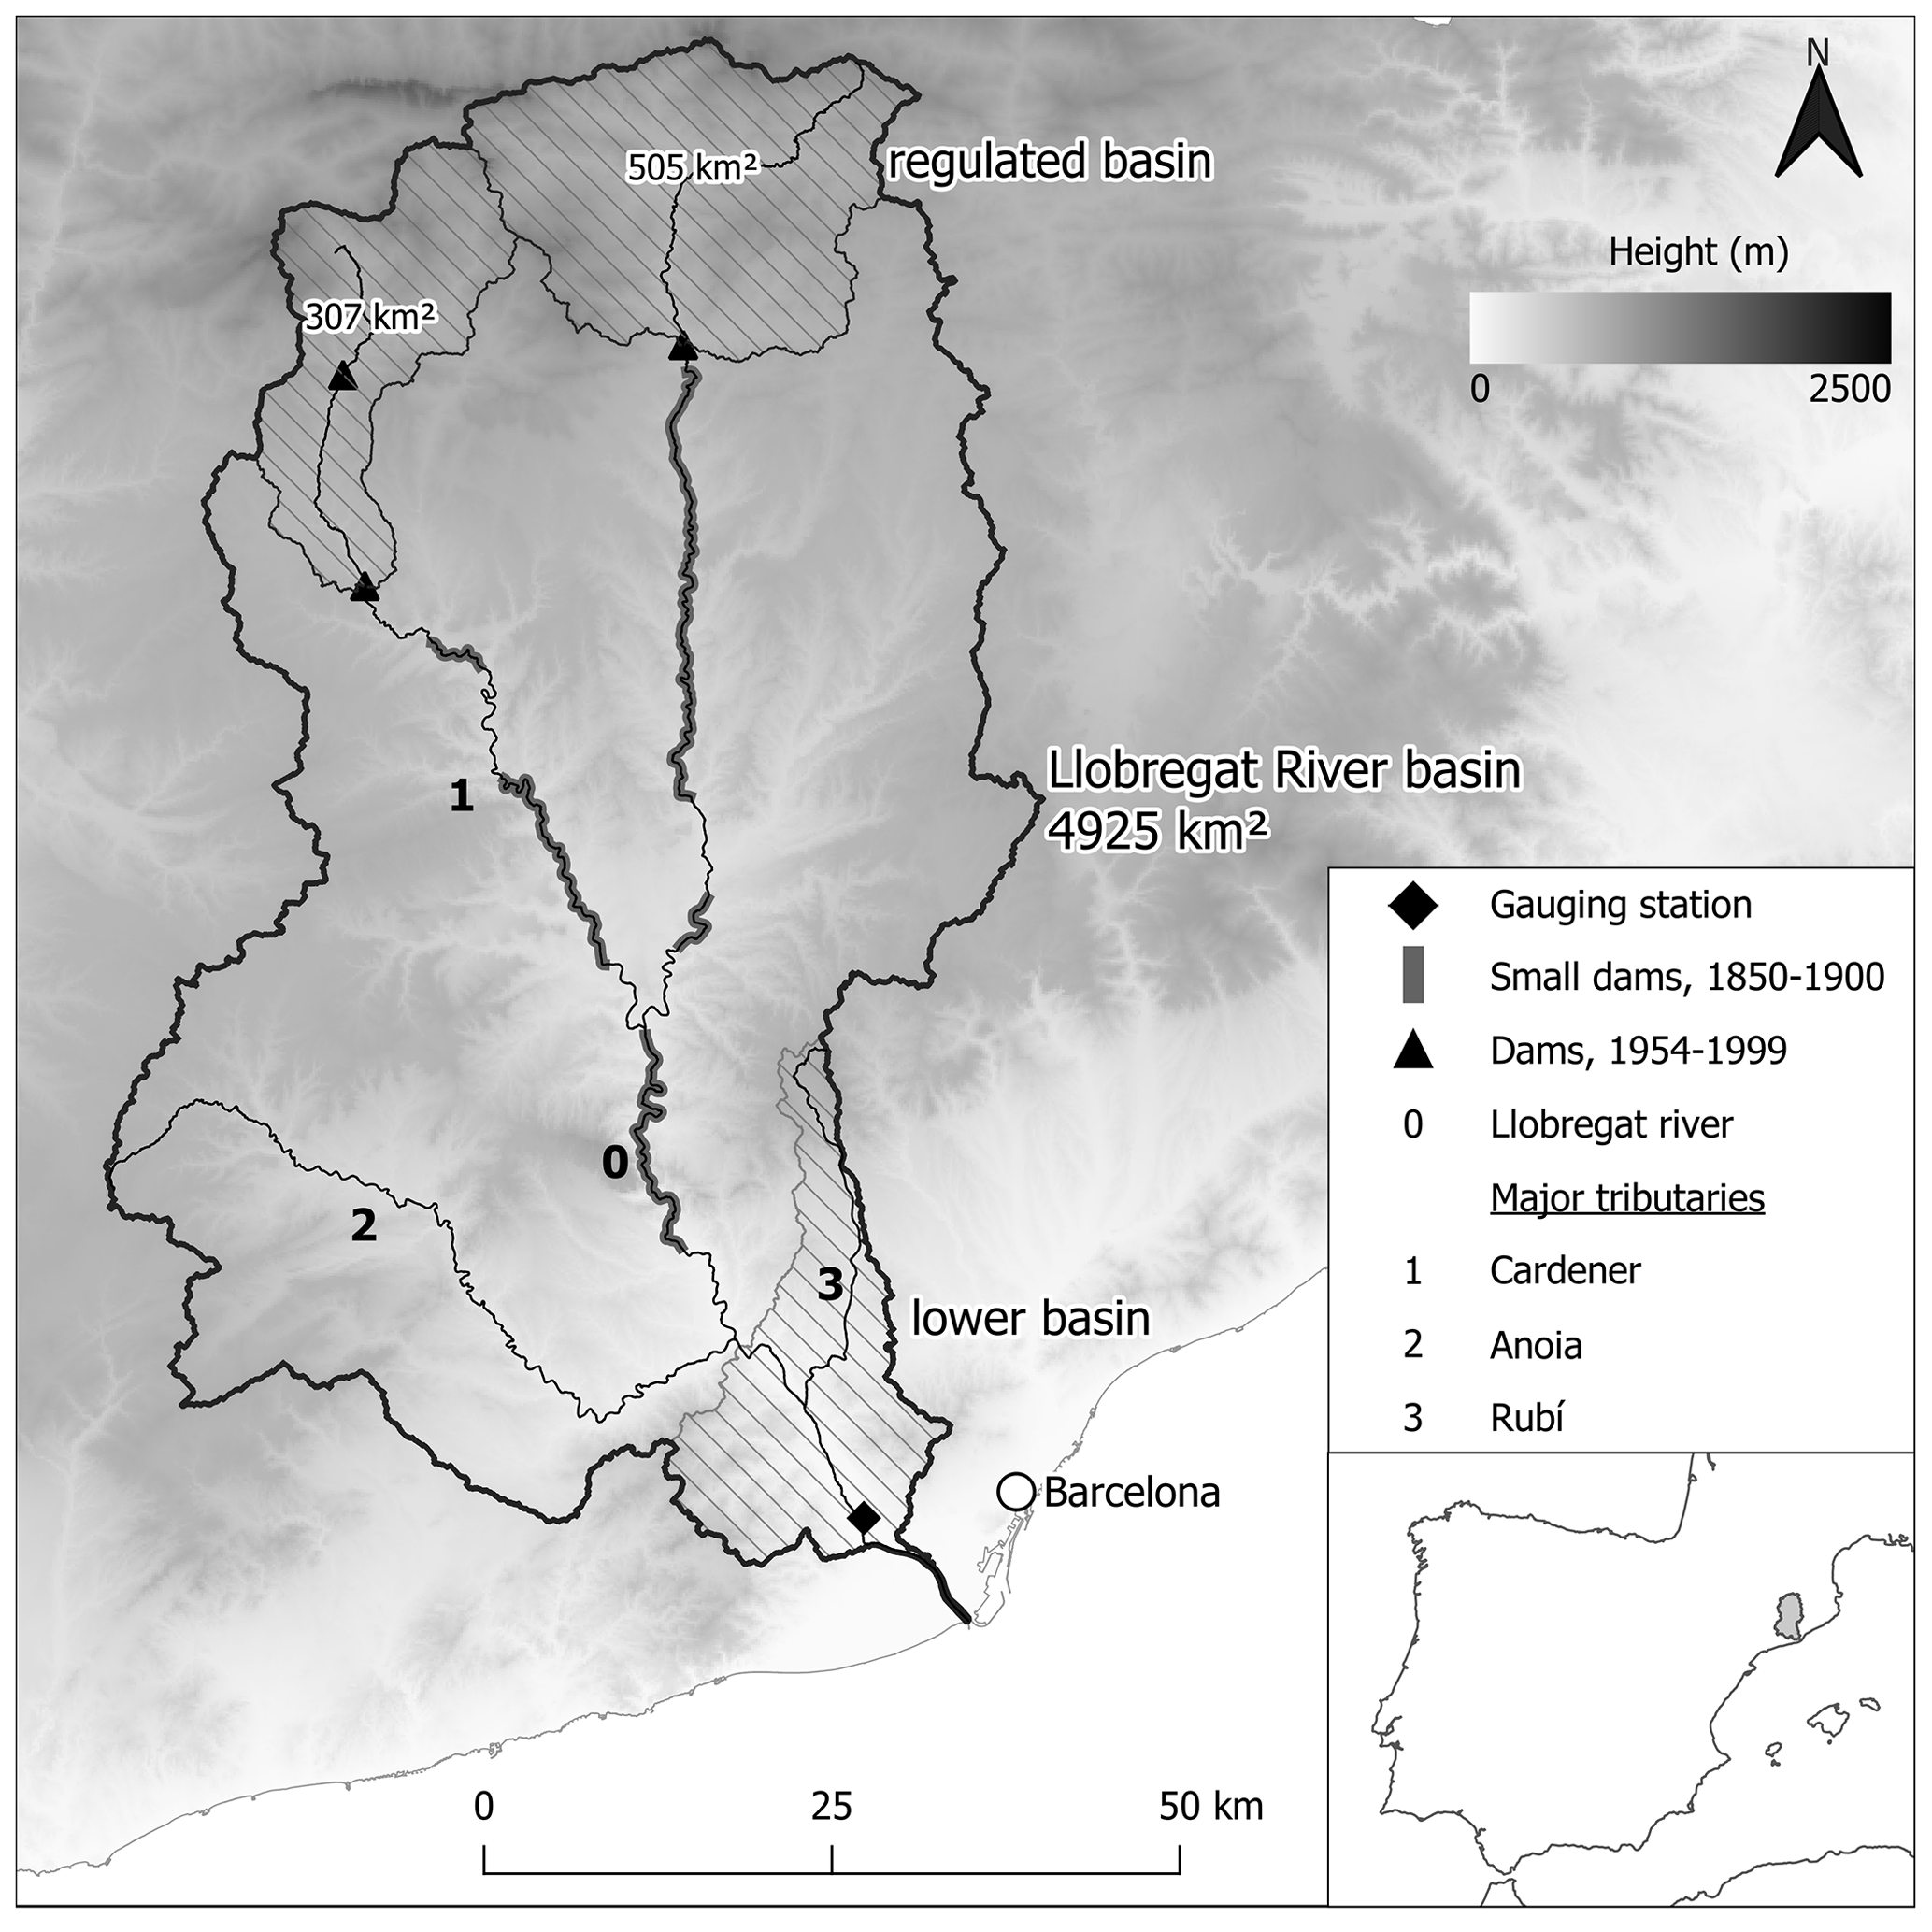
Figure 1Location map. For the lower basin see the zoom in Fig. 4. For small dams see the discussion section.
The retreat of beaches (specially in deltas) is a big concern in the Mediterranean region. The evidence of a long-term beach retreat in the Llobregat delta is presented first. This is a new set of data for this particular river, not presented so far. Then, the paper concentrates on the fluvial component, with the main objective of finding out whether the river channelization and encroachment have produced some retreat of the delta. Our method is to examine one by one the causes of change of river sediment yield, specifically of bed load. In this way, our focus is on what controls the coarse sediment yield of the river into the sea, nourishing the beaches with sand (part of the coarse load). To know what controls the yield into the sea implies, as a consequence, figuring out which measures are more sensible in order to keep providing enough sand to the beaches. The management of the basin will benefit from this knowledge.
Two natural hazards, flooding and fluvial erosion, are being addressed by the Llobregat case. The river has flooded its lower valley and delta for centuries (Codina, 1971). Channelization during the last decades has brought a temporary relief to flooding, partly due to bed degradation, i.e., erosion of the alluvial bed as flow concentrates. Despite temporary reduction of flooding risks, this situation is not welcomed, actually, because serious consequences for groundwater levels and on riparian vegetation are to be feared. Regarding the consideration of fluvial and coastal erosion as a natural hazard, it should be borne in mind that sandy beaches on the Llobregat delta shoreline represent a precious natural resource in danger since the wave action is not compensated for anymore by sandy sediment yield coming from the river.
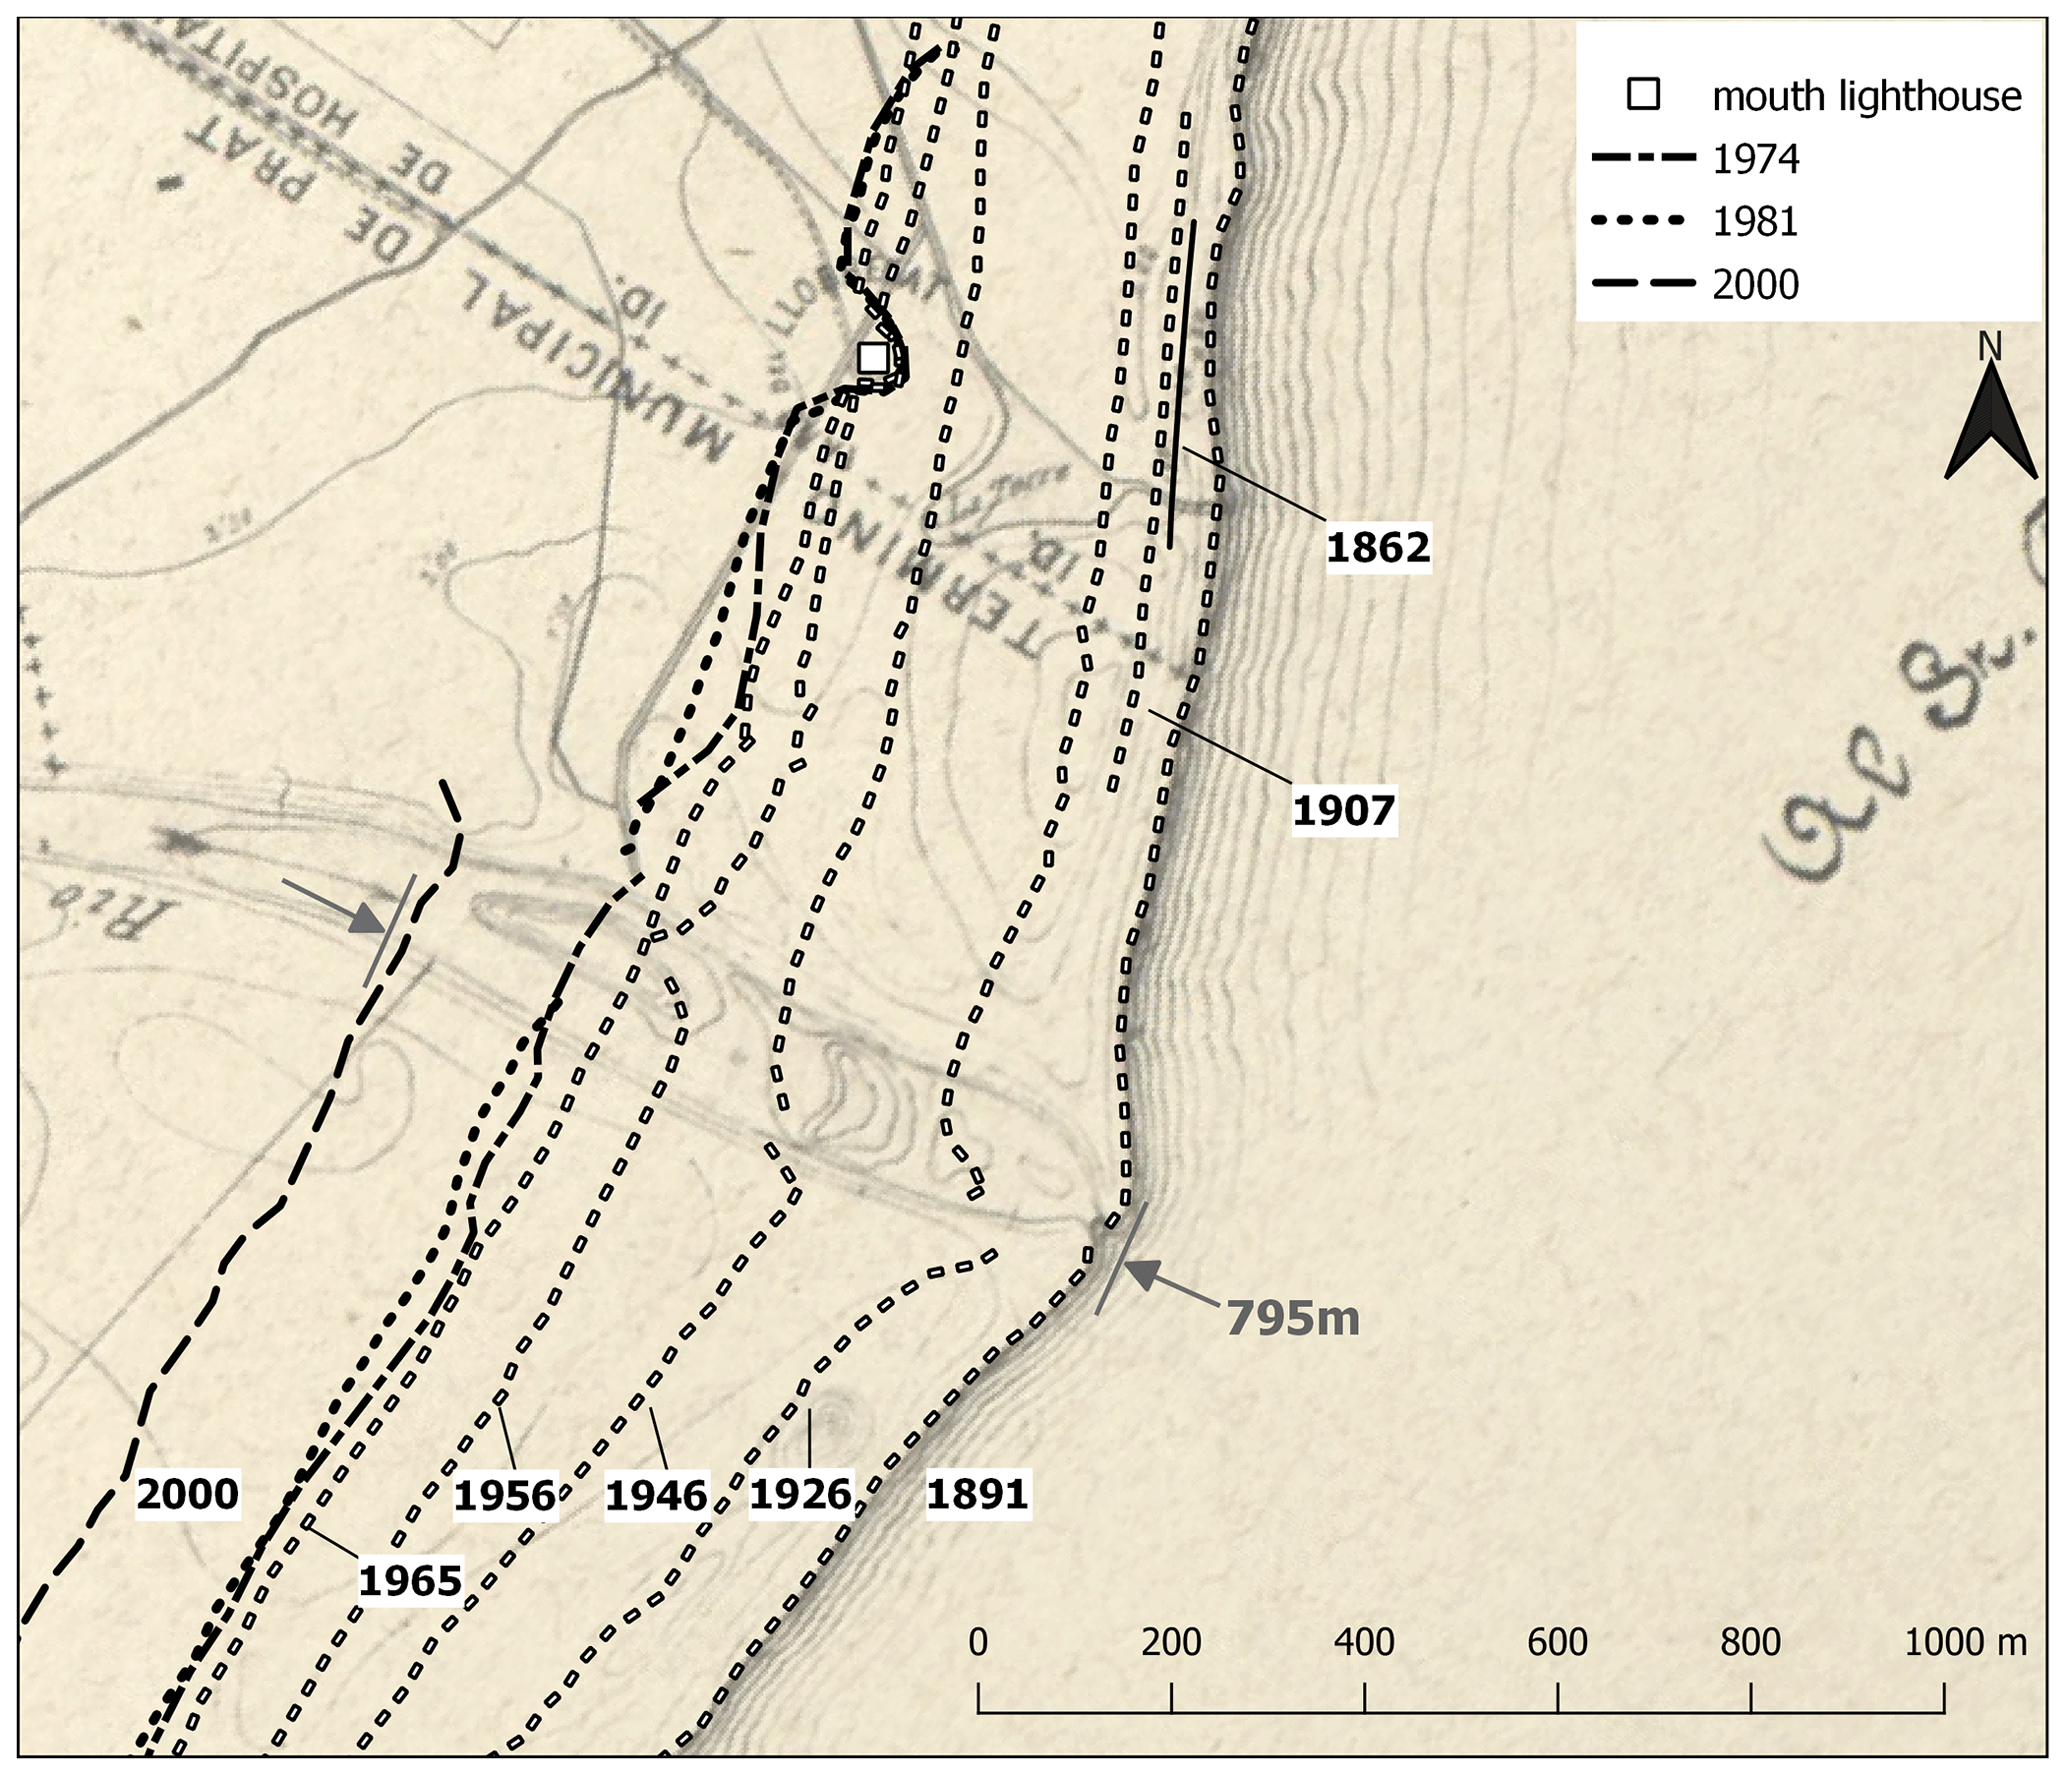
Figure 2Coastline retreat in the Llobregat delta since 1891 (date of the map in the background, as well). Figure produced by authors using our own and freely available data from Institut Cartogràfic i Geològic de Catalunya (ICGC). The 1862 line comes from Marcos (1995). The lighthouse was built as a watchtower in 1567. Drawings show its location well inland in the 17th century. It was turned into a lighthouse in 1852 to prevent ships from getting stuck in the sandbanks of the river mouth.
The Llobregat River is 163 km long and drains an area of 4925 km2 of the northeastern Iberian peninsula, with its headland in the Pyrenees mountain range (Fig. 1). Archeologists have found evidence of human presence in the delta since Roman times (Marquès, 1984). The present delta (≈100 km2) results from the Holocene transgression (6000 years ago; Ibáñez et al., 2019), yet we are more interested in the delta evolution in the last century (within the so-call Anthropocene). The Latin name of the river was Rubricatus, which means dyed red, in allusion to the color of its waters, probably because of its large fine sediment load. Moreover, Llobregat is today a gravel-bed river upstream of its delta, with a high bed load transport capacity. The delta can be classified as sandy mixed load (bed and suspension) with only one distributary, following Orton and Reading (1993). More river features and flood history will be given opportunely.
Contrary to the delta building up in the past, it has been heavily receding in the last century. Figure 2 shows the coastline in the area of the river mouth since 1891 until 1956, with point data for 1862 and 1907 (taking advantage of the mouth lighthouse that was much inland at that time) and two intermediate lines in 1926 from a map and 1946 from an aerial photograph. Three more of them, dated in 1965, 1974 and 1981 show further receding of the coastline. The coast is a 24 km long beach (Fig. 3), between a northern closed boundary (Barcelona harbor) and a partially open western boundary. The reach is a sedimentary unit throughout the whole period 1891–1981. More recent photographs, such as the 2000 shoreline in Fig. 2, show the coastline much changed by the enlargement of the northern harbor and the construction of dikes and of a second harbor at the western boundary. In addition, dredging for beach nourishment has become normal in recent years. Due to these modern interventions, the present analysis is limited to the period 1891–1981 and more accurately to 1946–1981, although we will resort to other facts dated in the 19th century in the discussion. The current situation of the river mouth since 2004 is presented at the end of the paper, not only for information but because it also provides a kind of sediment closure.
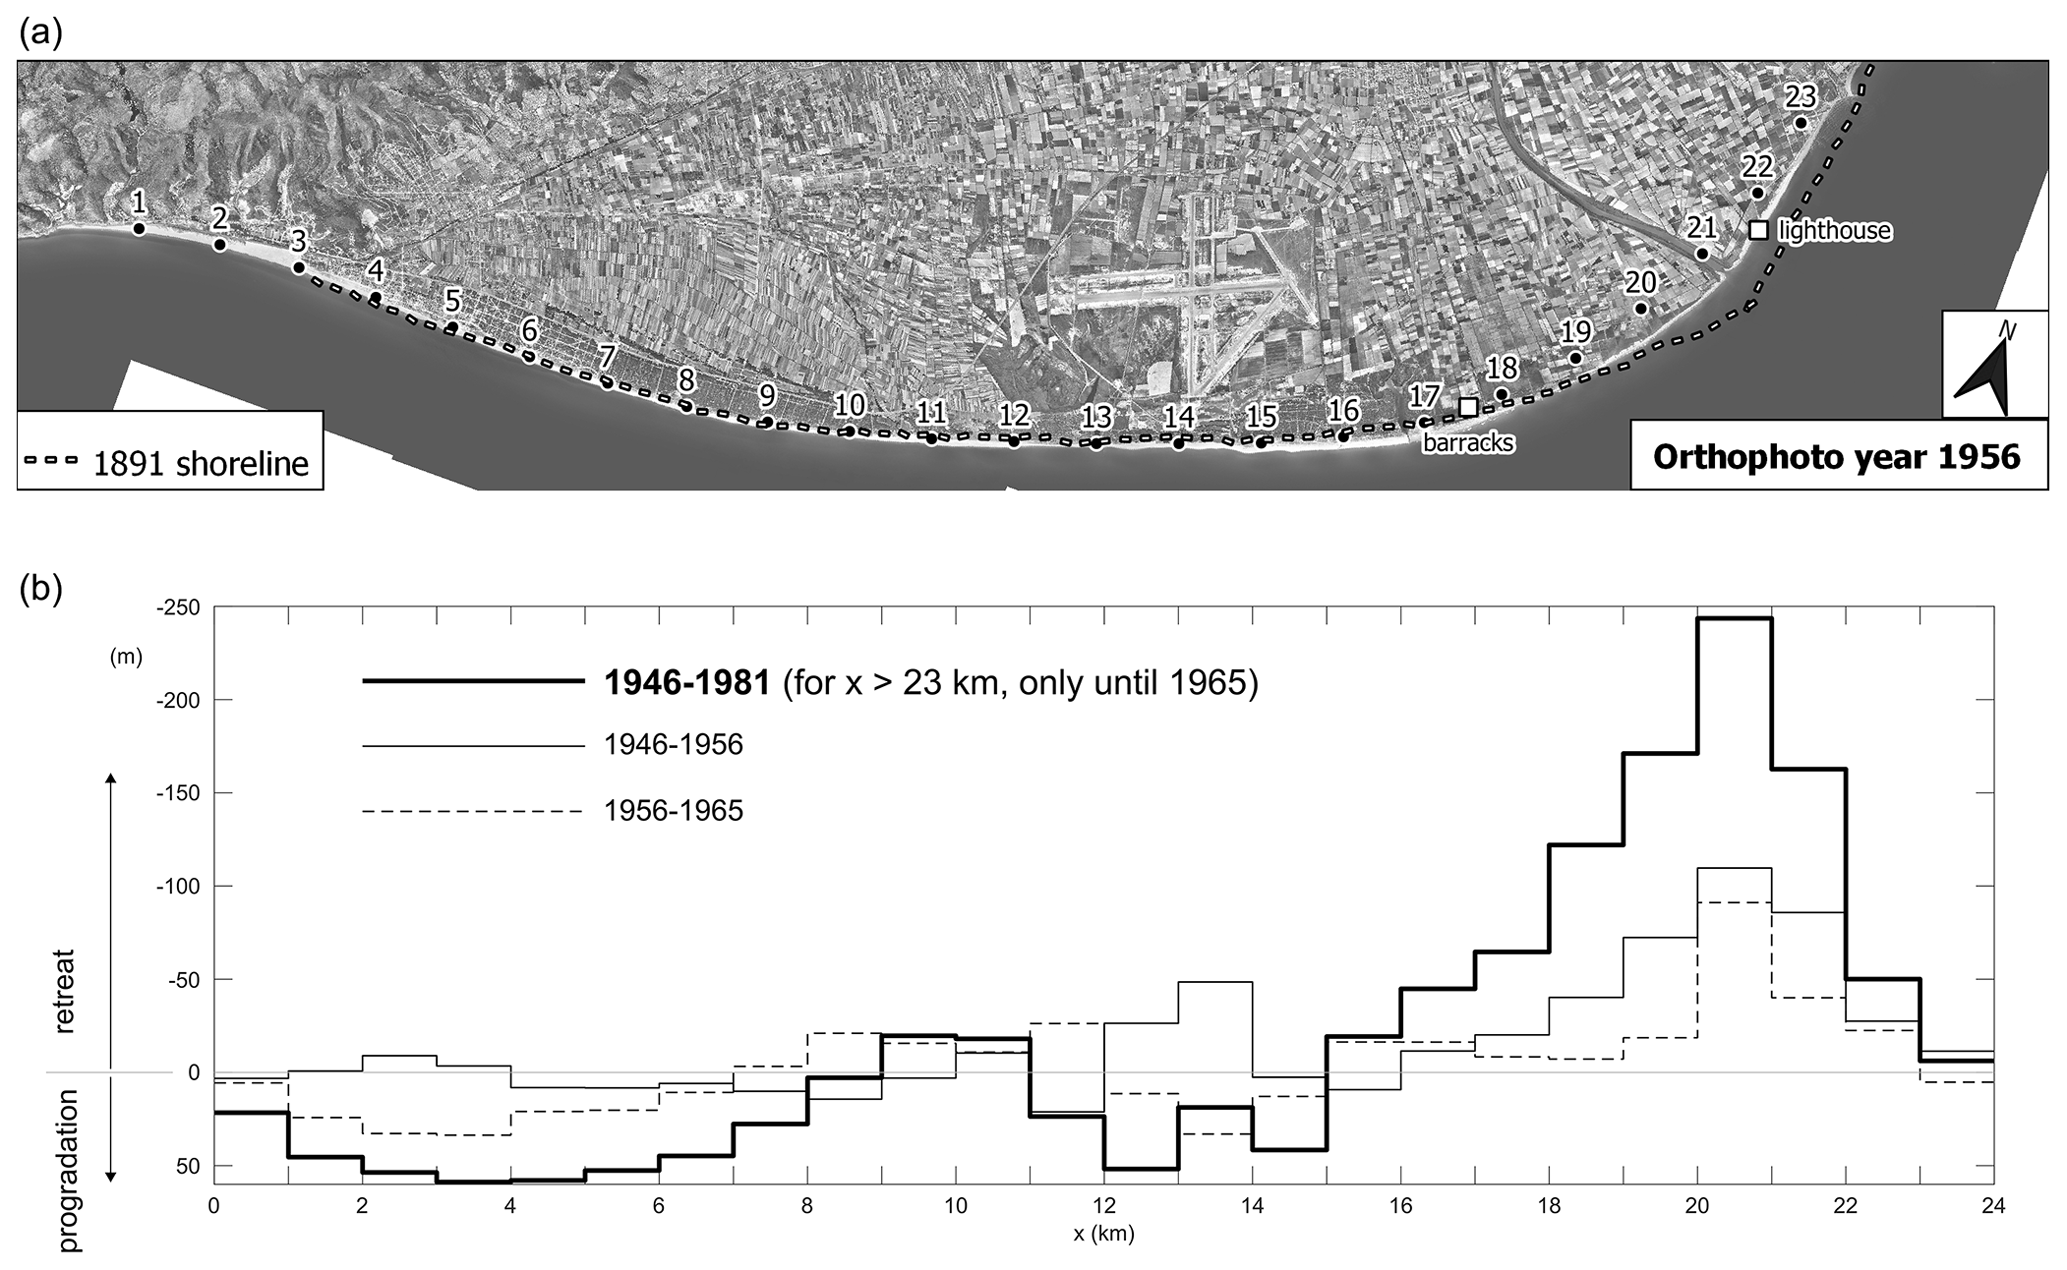
Figure 3(a) The 24 km long sedimentary unit (delta), produced by authors using freely available data from ICGC. (b) Total change in meters perpendicular to the coastline in ordinates (progradation +, or retreat −) along the coastline above in the period 1946–1981 and in 2 decades within it. Apart from the lighthouse in Fig. 2, the history of the barracks at x≈17.5 km in 1844 is also known: from that date until 1934 the coastline prograded 179 m (Paladella and Faura, 1935).
The coastline change, either progradation into the sea or retrogradation inland (retreat), expressed in meters, is summarized in Fig. 3 for the period 1946–1981 when photographs are good, almost complete in area coverage, and the coast has not changed yet. The total change in these 35 years, discretized in reaches 1 km long, is plotted against an abscissa x from west (left) to north (right), together with the change in the first and second decades (1946–1956–1965) to show temporal trends and oscillations. An oval contour slightly protruding into the sea can be assigned to the length between x=15 and x=24 km, being the river mouth at x=21 km (see plan view in Fig. 2). In this 9 km long reach, the delta has been receding in a coherent way, in the sense that the closer to the river mouth, the larger the receding, suggesting the key role of a decrease in the river sediment yield. This trend is quite common through different decades (Fig. 3). The beaches between x=0 and x=15 km, on the contrary, are mostly prograding, yet the temporal and spatial fluctuation in this area has been more noticeable. An old river mouth is even conjecturable around kilometer 10.
2.1 Volume calculation
The sand grain size in the long delta beach is around 280 µm (Gracia and Calafat, 2019). The longitudinal sediment transport goes from north to west, with a transport capacity in the range 10 000–75 000 m3/yr (CIIRC, 2010). The closure depth of the beach platform in the delta, i.e., the depth under sea level involved in the sediment transport shaping the beaches, is around 6.35 m. In turn, the berm height above sea level, involved as well, goes from 0.9 to 1.4 m (CIIRC, 2012). Then, every kilometer of beach in the coastline, either prograding or retreating 1 m, means a sand volume of ≈3500 m3, respectively deposited or eroded (Digital Shoreline An. Sys. by U.S.G.S., Himmelstoss et al., 2018). The computation of sand volumes, by multiplying the change in meters (Fig. 3) by 3500 m3/km, produces gross volumes, converted into net volumes, by deducting some 35 % of voids. The calculation yields a deficit of 63 000 m3/year in the north (x=15–24 km) and a surplus of 25 000 m3/year in the beaches of the west (x=0–15 km). The temporal distribution of these net volumes over the four periods from 1946 until 1981 is (Table 1) as follows.
Table 1Volumes of change of sand (×103 m3 per year), distributed by decades and by region (oval delta in the north, x=15–24 km, and beaches west of it, x=0–15 km).
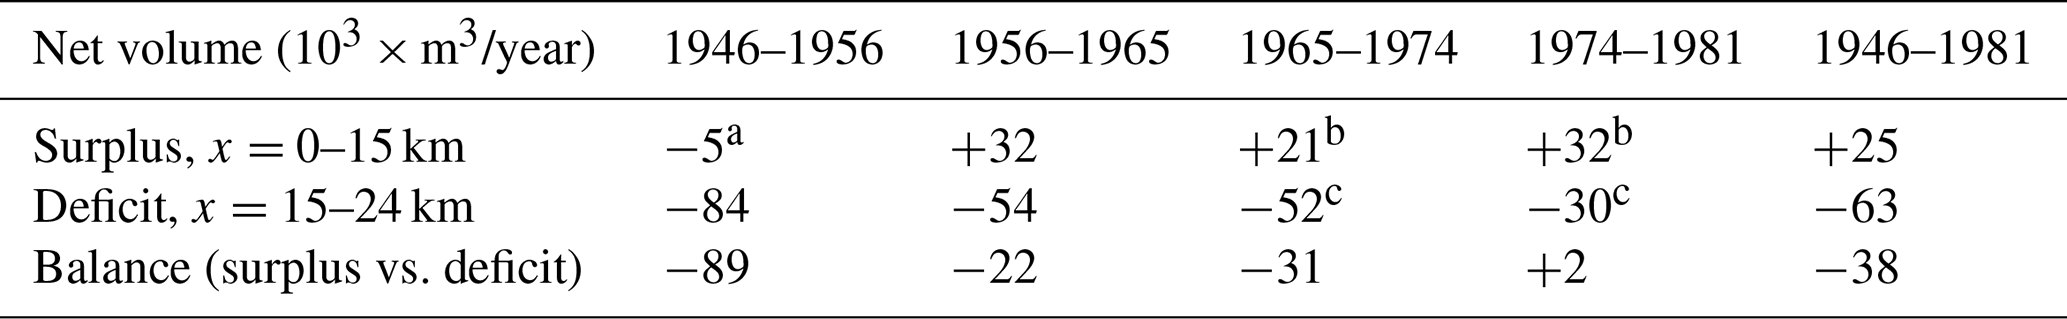
a It is a deficit, actually, not a surplus; note the minus sign. b Extended over 10 km instead of 15 km. c Extended over 7 km instead of 9 km.
The deficit is larger than the surplus three times out of four in Table 1. The negative balance (loss of sand) can be explained by the partially open western boundary (at x=0). The coastal longitudinal transport capacity cited above (net volume of 10–75×103 m3/yr) seems capable, by order of magnitude, to take these amounts of sand from north to west beaches and even to push part of it across the western boundary.
One lacking piece in the balance of the coastal system is the sand sediment yield supplied by the Llobregat River, to which the core of this paper is devoted. Our objective is to ascertain to which extent the river sediment yield is important to the delta evolution, as the distribution of beach retreat in Fig. 3 suggests. Did the river yield decrease over the same period 1946–1981? Do river yield figures compare with the volumes in Table 1? Which hydrological, hydraulic or sedimentary factors control the river yield? Similar to what has been done about the beach retreat, we will primarily use historical information on the river condition in 1946–1981, although discussion of the results will require us to go back to the river condition in the 19th century.
The decrease in the sediment yield of a river to its delta may be due to different causes. Here we will consider (a) land use changes including urbanization; (b) the construction of large dams, so that reservoirs (1) trap sediment and (2) regulate flow; and (c) river engineering works of any kind (mining included) on the channel and floodplains.
Cause (a) affects primarily one component of the sediment load, the wash load, i.e., the fine sediment coming from anywhere in the basin. Cause (b) affects all components of the sediment load but certainly its coarse fraction, which is more prone to getting trapped in reservoirs than wash load. Cause (c) in the Llobregat case since 1946 has been the progressive encroachment of the river by infrastructures (roads and railways) and its channelization against flooding with bank erosion control measures, in combination with some gravel and sand mining. These engineering works affect sediment load coming from the channel, composed of sand and gravel, not the wash load coming from the basin.
The causes of change of river sediment yield are analyzed one by one in the next paragraphs, with special attention to bed load at the end.
Land use changes in the Llobregat basin have been analyzed comparing the best past aerial photographs (1956) with a modern land use map (2009) (CREAF research center). The results are summarized in Table 2, with aggregation of land uses in only three main categories: agriculture, forest and urban. The percentages for the whole Llobregat basin show a modest change consisting of a loss of agriculture land for the equitable benefit of towns (urban), on the one side, and forest, which grows on the abandoned fields, on the other.
Table 2Land use change in the whole lower basin and tributary 3 sub-basin in 1956–2009 (Prats-Puntí, 2018).
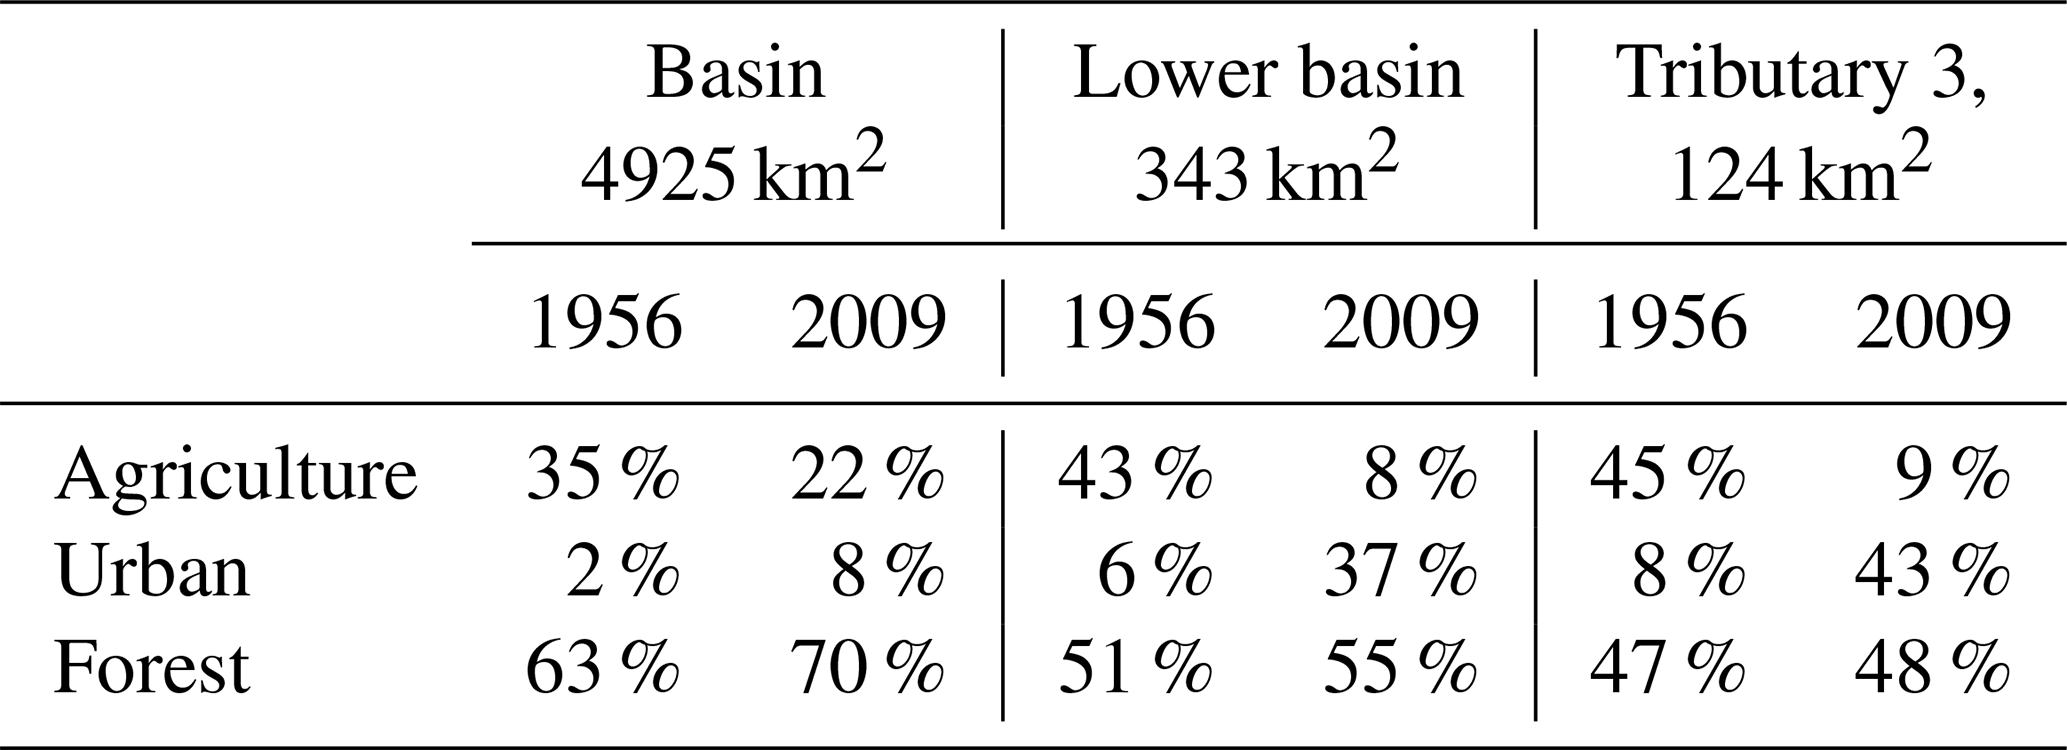
For the lower Llobregat basin, amounting to 7 % of the total basin area (Fig. 1), the loss of agricultural fields is more important and benefits the urban area more than the forest (Fig. 4). The lower Llobregat channel close to Barcelona is the most intervened reach. The case of the most urbanized sub-basin, the tributary 3 catchment (Figs. 1 and 4, Table 2), shows a more marked reversal of shares between agricultural fields and urban areas. There is some channelization in this tributary but not any dam. Therefore, cause (c) must have been dominant in the large bed incision reported in it since 1962 (Martín-Vide and Andreatta, 2009).
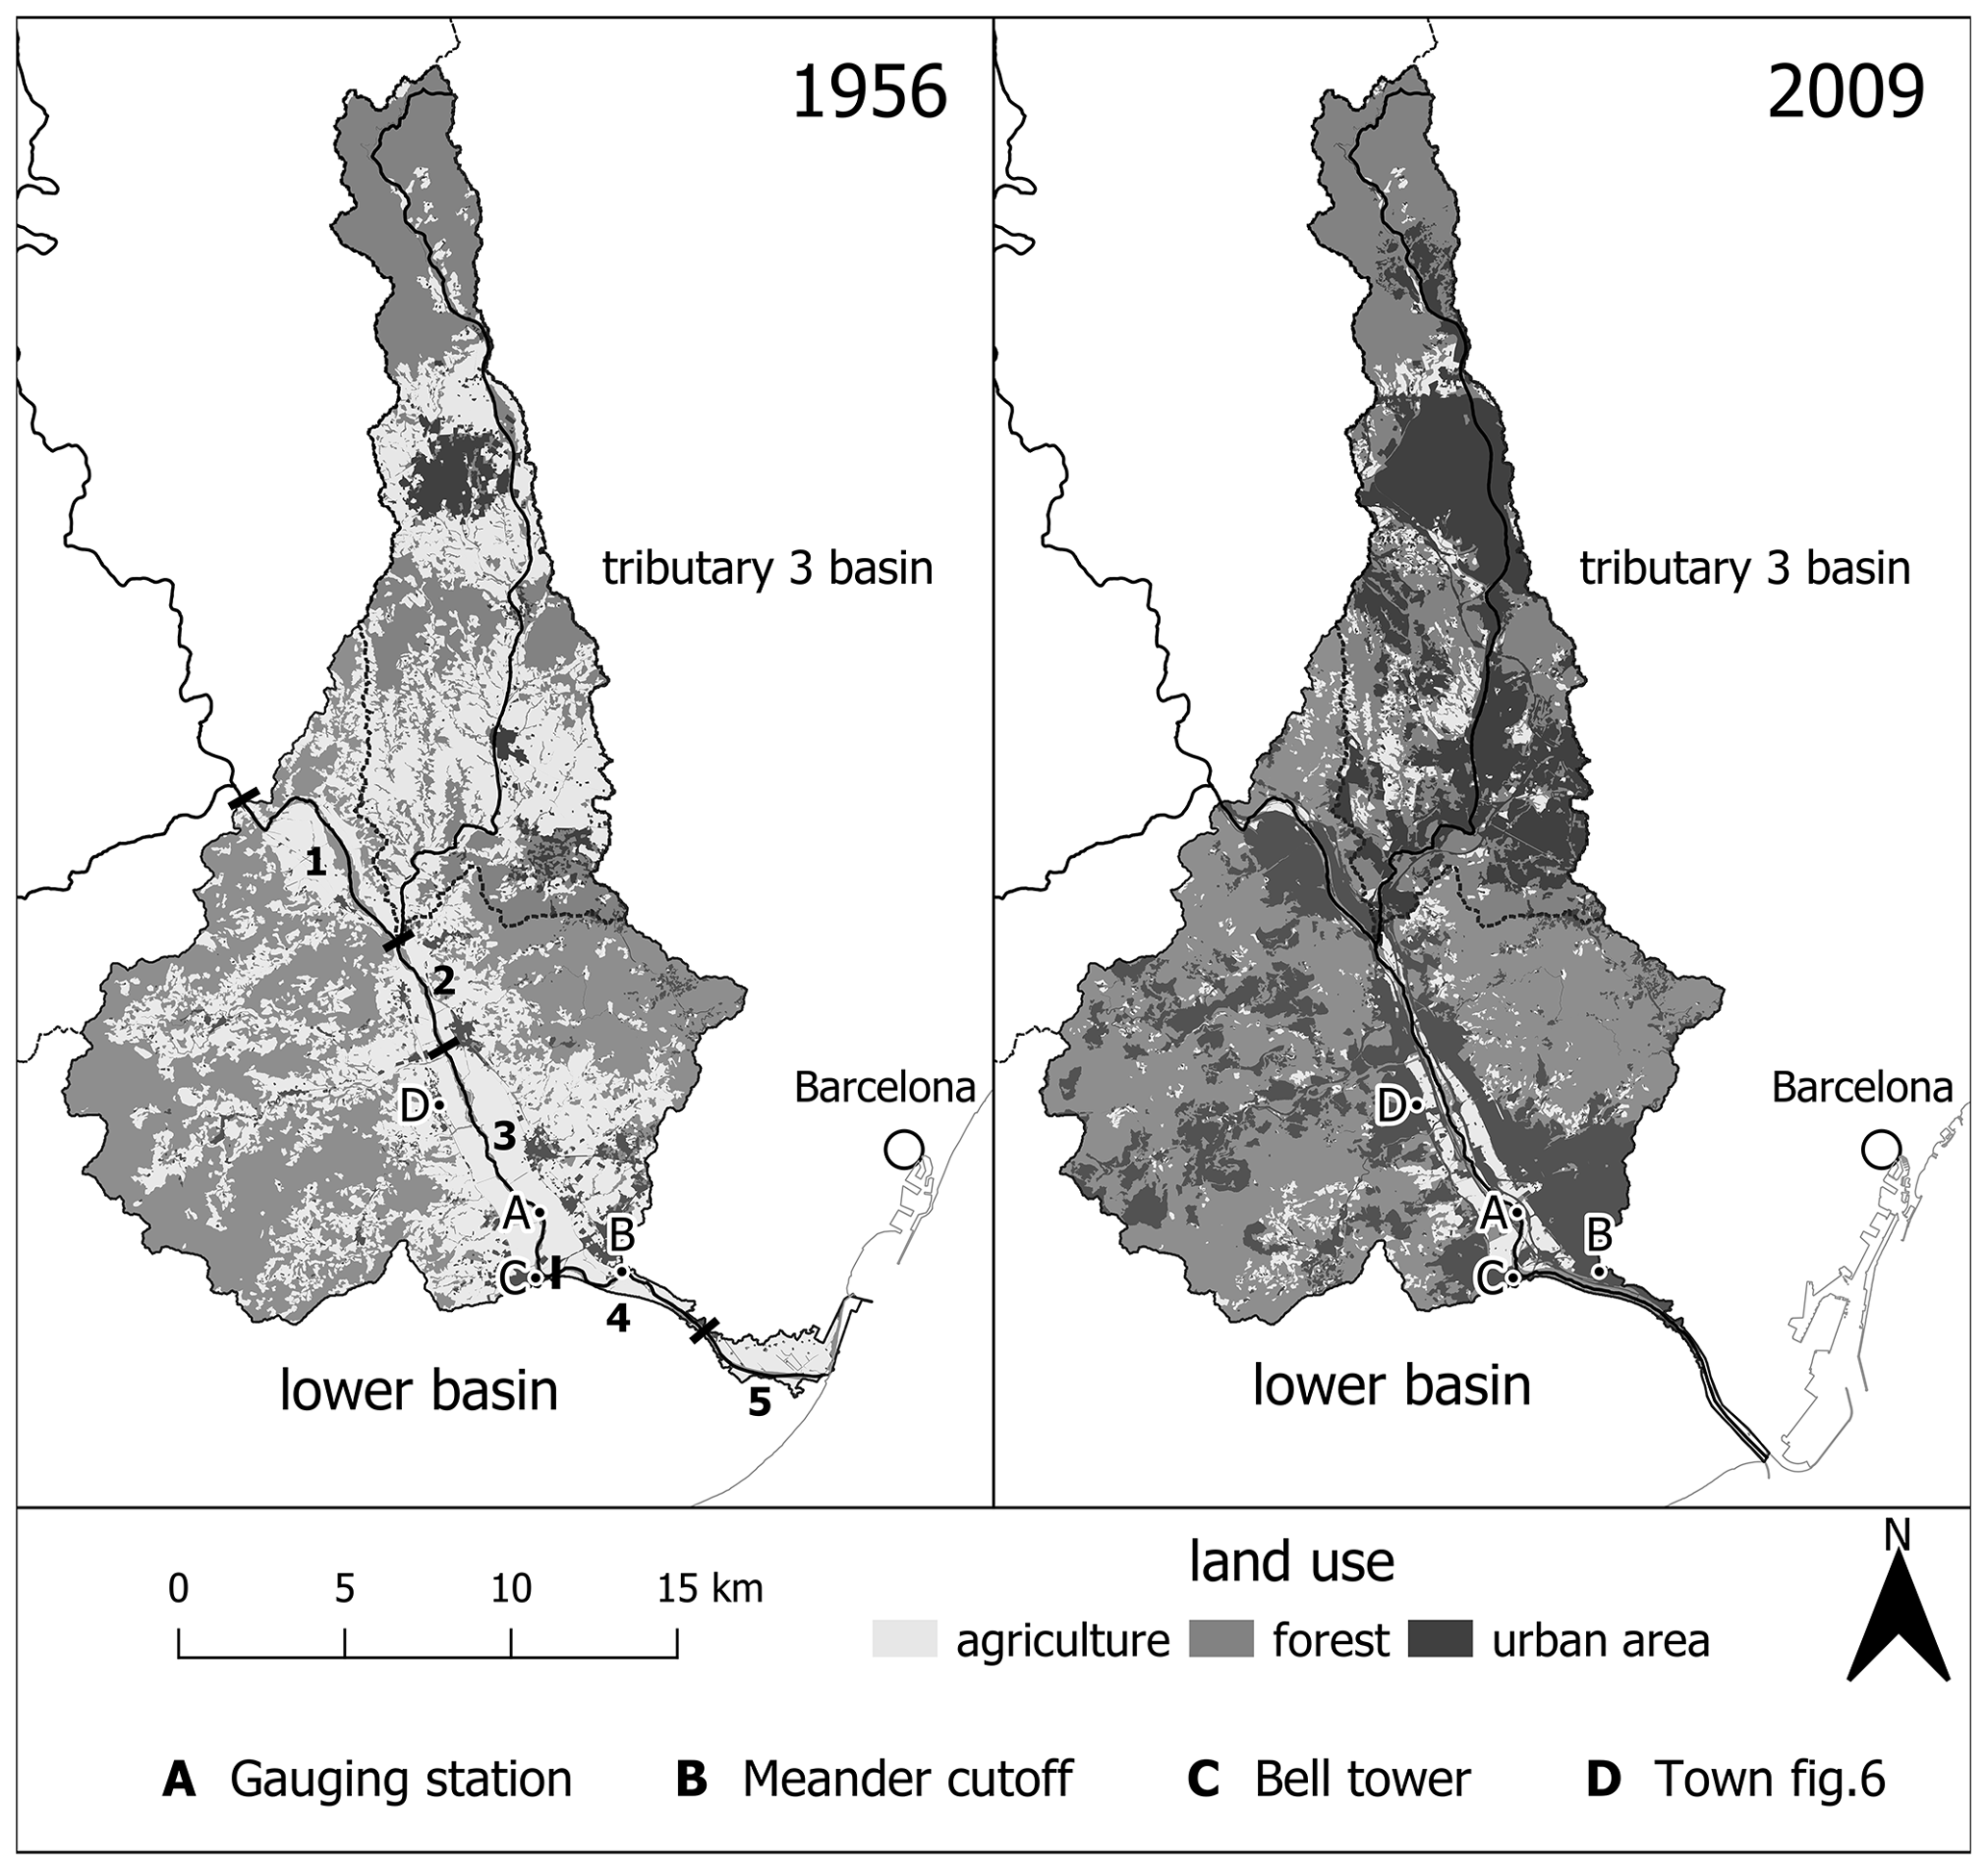
Figure 4Land use changes in the lower Llobregat basin. Figure produced by authors using our own and freely available data from the CREAF public research center. Note the added information on the lower river (reach nos. 1 to 5 used in the analysis and reference points A to D mentioned in the text).
In the upper basin there are two areas regulated by dams (Fig. 1). One dam built in 1975 controls a 505 km2 catchment, with a reservoir of 109 hm3. The second dam, built in 1954 in tributary 1, controls a 307 km2 catchment, with a small reservoir of 24 hm3 (inside this second catchment, another dam with a volume of 80 hm3 was built in 1999). Therefore, the area under hydrological control by large dams (the regulated basin) amounts to 812 km2 since 1975, while it was 307 km2 in the years 1954–1975, that is to say 16.5 % and 6.2 %, respectively, of the whole Llobregat basin. None of the three dams have any sediment bypass device, nor are their bottom outlets able to pass or flush sediment, so far.
Sediment load coming from the regulated basin as wash load will be mostly trapped in the reservoirs, but the wash load component of the sediment yield, having dominant grain sizes in the clay–silt range (up to 62 µm), is not relevant for the coastline evolution, made of fine sand (280 µm). Regarding the load coming from the channels, ultimately trapped in the reservoirs, the drainage network density is similar all over the whole basin, but the main rivers and tributaries are steeper in the mountainous regulated basins. Thus, the supply of coarse sediment from channels to the reservoirs is probably larger than the proportion of controlled catchment (16.5 %), since most of the natural erosion comes from high-elevation areas (Wilkinson and McElroy, 2007). Sediment supply is resumed in Sect. 9.
The previous reasoning must be extended to the flux of coarse sediment along the channel down to the river mouth. Dams produce a cut of the coarse sediment supply to the channel downstream, due to their sediment trapping capacity. This deficit travels downstream as a disturbance of incision (Martín-Vide et al., 2010), because supply is cut or reduced while transport capacity remains the same (this argument will be resumed in Sect. 9). Liébault et al. (2005) found a propagation velocity of 300–500 m per year for this disturbance (produced by reforestation in their case). In the south of the Iberian peninsula, Liquete et al. (2005) showed that, although damming was active since 1970, up to a regulation of 42 % of the basin areas, its effect was barely noticeable on the mouths of rivers with lengths 5–150 km by 2005. As the distance from the dams to river mouth is more than 120 km in our case, it is highly unlikely that this disturbance has reached the lower Llobregat yet. In other words, the trapping of coarse sediment in the reservoirs since 1954 and 1975 must not have been relevant for the delta retreat yet and also not for the period 1946–1981 of coastal retreat data (Sect. 2). In the long term, this trapping effect will be seen. It is believed that this argument holds better for gravel than for sand.
Reservoirs produce a second effect on sediment yield, through flow regulation, more precisely through peak flow attenuation. Once a reservoir stores water, the flow duration curve undergoes a reduction in peak flow along with an increase in low flow. These changes affect the sediment load coming from channels by means of two features of sediment transport: (1) the existence of a threshold for the initiation of transport, so that a reduction in peaks implies fewer days of flow above the threshold and so more days with no transport, and (2) the non-linearity of bed load equations, in the sense that a certain reduction in flow means a higher reduction in bed load (f.e. one-half in flow but one-fourth in bed load, if bed load is proportional to the square of flow).
This effect can be assessed by comparing the flow duration curves with and without reservoirs. The period 2002–2018, after the last dam was built in 1999, is long enough to represent flows and reservoir management for computation of an average flow duration curve with reservoirs. Indeed, it is long enough to handle normal flows and annual floods but not to take into account large floods, those occurring at return periods larger than about 10 years. Since no such large flood occurred in the period 2002–2018, the selected data describe normal flows and annual floods. The flow duration curve is done with the hourly data at the most downstream gauging station (see Figs. 1 and 4). Moreover, this curve together with the contemporary measured daily levels at the reservoirs allow the computation of a new flow duration curve without reservoirs, a “would-be” curve. This is done by adding or subtracting the reservoirs' volume variation in 1 d to the flow gauged at the station. The travel times of water from reservoirs to the station (22 h through the main river and 20 h through tributary 1, according to the hydrographs of a real flood, Fig. 1) are the time lags between the volume variation at reservoirs and the discharge to be modified by addition or subtraction at the station.
Then, the comparison of flow duration curves with and without reservoirs assumes that the difference between the two are not much impacted by other hydrological and water resource changes, such as (a) water abstractions for irrigation and supply along the river, (b) basin runoff due to land uses and (c) rainfall regime under the climate. It is not meant at all that flows are not impacted by (a), (b) and (c), but only that their difference with and without reservoirs is not impacted. In other words, the reservoirs would have produced a similar difference in flow duration curves no matter what the rainfall (climate), the runoff (land use) and the abstraction (water use) had been. Under this assumption, the curve without reservoirs represents the state prior to 1954. Note that in this way we have circumvented the lack of any substantial river flow data prior to 1954. Moreover, if these data had existed, their use in comparison with the period 2002–2018 would have brought serious doubts of data homogeneity, just because abstractions, runoff and probably also rainfall regime have changed.
The main result of this computation is that flow is higher without reservoirs than with them throughout the first 130 d; the opposite happens over the rest of the year (Fig. 5). The representative discharge of the first day in the flow duration curve at the gauging station goes up from 259 to 308 m3/s and a similar, quite constant increase of ≈20 % extends to the first 100 d. The consequences of these results on sediment carrying capacity are discussed in Sect. 9.
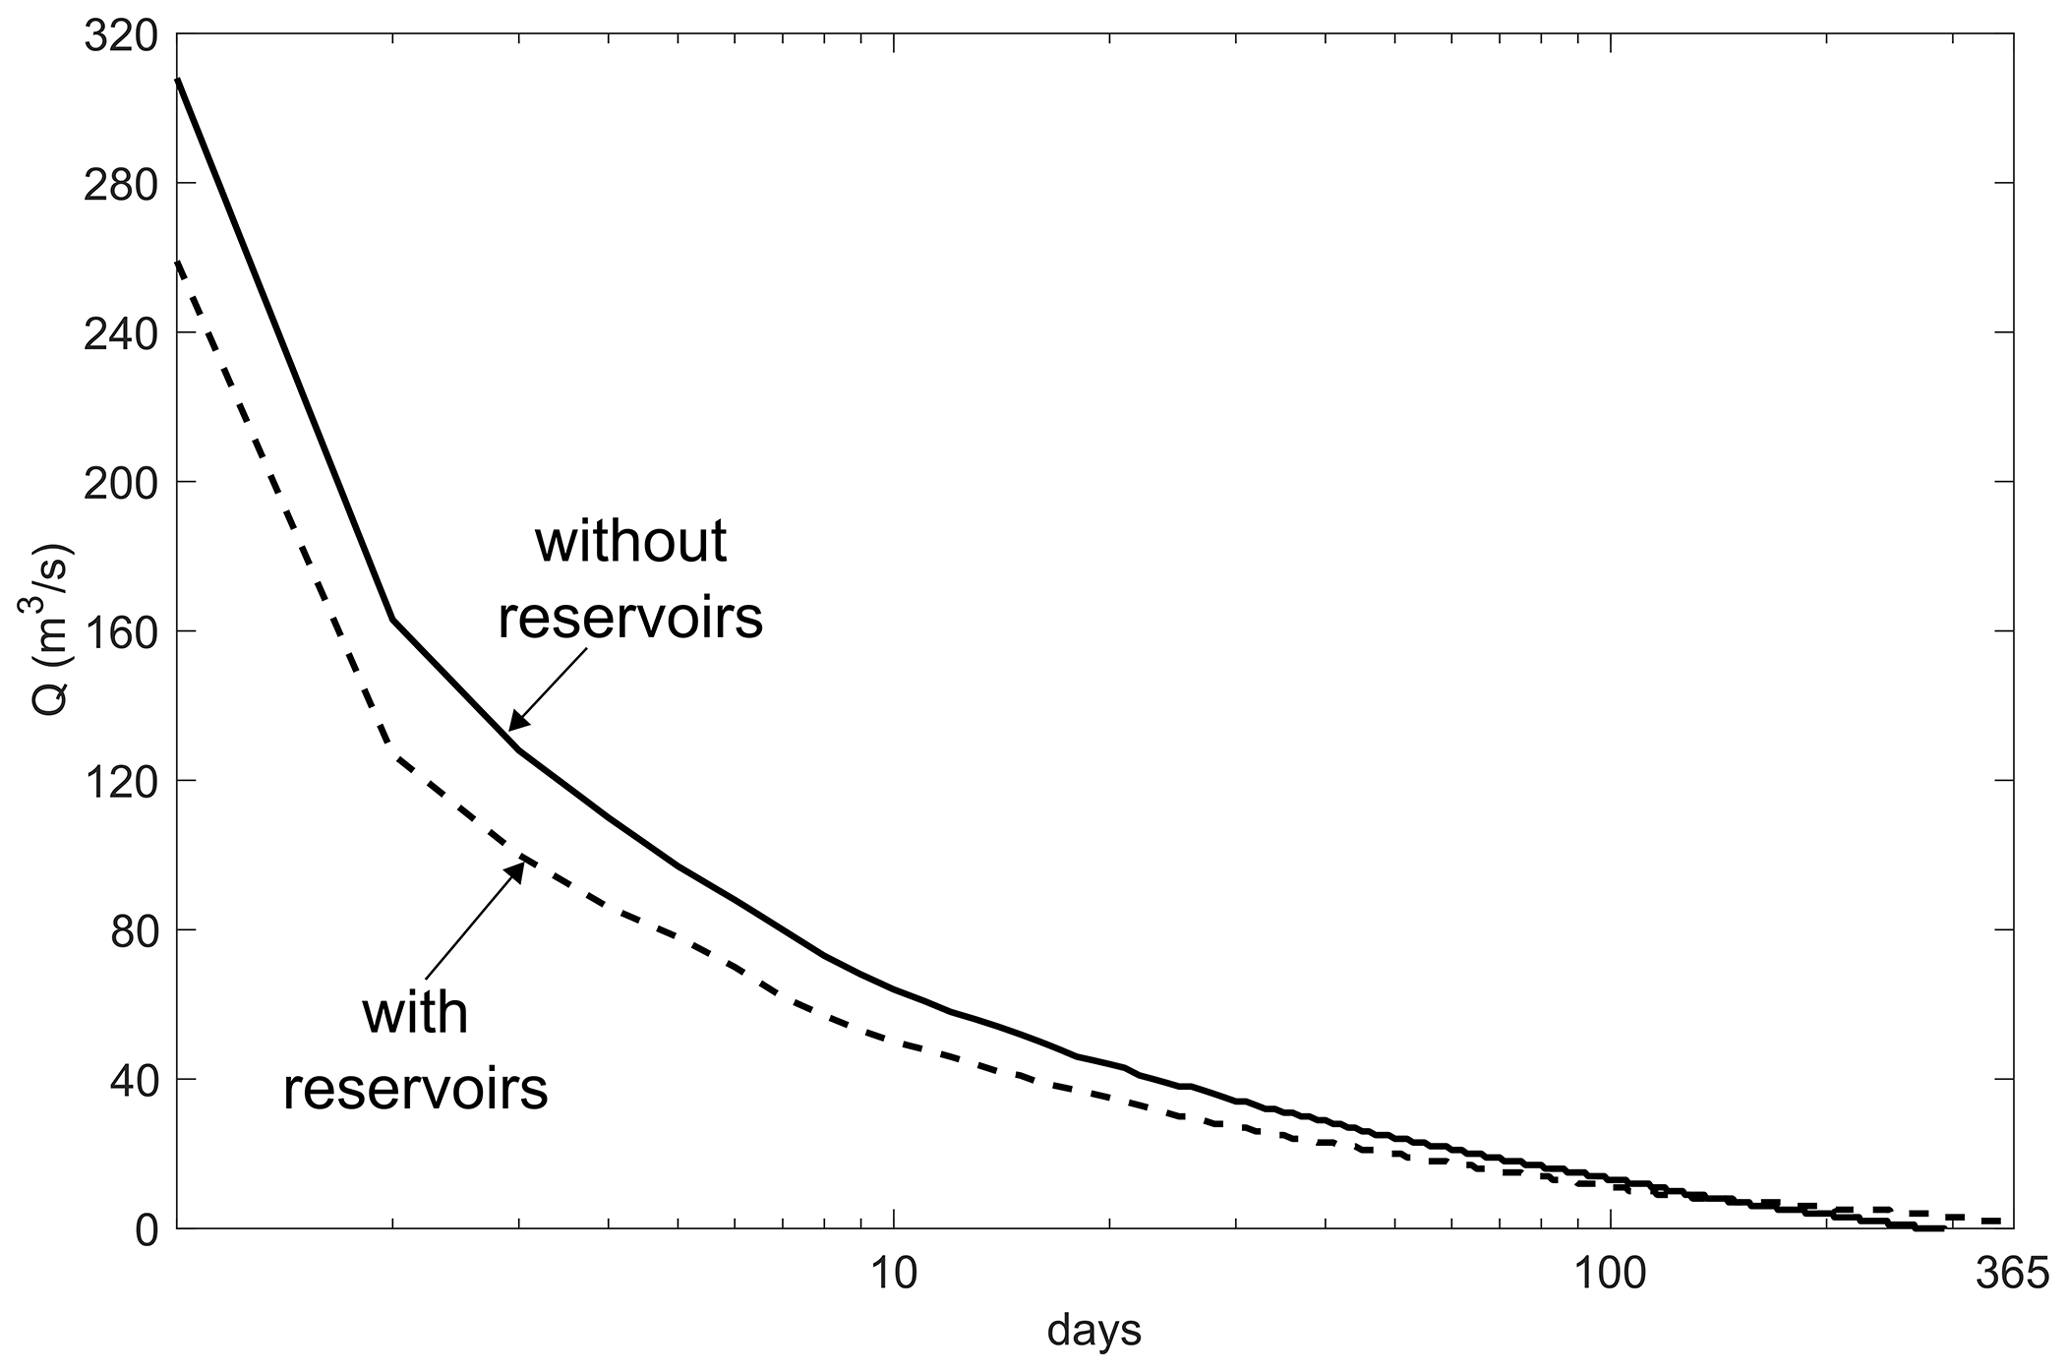
Figure 5Flow duration curves at the gauging station (see Fig. 1 for location) with and without reservoirs. Log scale for days.
The lower Llobregat River stretches along 30 km from the junction of the last major tributary (nr. 2, Figs. 1 and 4) to the delta mouth into the sea, with the gauging station located halfway. It is the most changed section of the Llobregat channel in the 20th century, luckily with the best archival records. Channel morphology (plan and long profile), grain sizes of the alluvium, and the history of floods and engineering works (roads, railways and flood defenses) are obtained from these archives. Large floods in the lower Llobregat occurred in 1942, 1943 and 1944 (≈1750 m3/s), 1962 (≈2100 m3/s), 1971 (≈3100 m3/s, the highest peak discharge), and 1982 (≈1600 m3/s), within the period of analysis, broadly speaking (Codina, 1971). The 3-year period ending in 1944 is described in the documents as causing general aggradation. Just for reference, 1278 m3/s has been estimated as the 10-year return period flood and 3050 m3/s as the 100-year flood (Martín-Vide, 2007). Other floods in the 20th century occurred in 1907 (≈2900 m3/s), 1919 (≈1500 m3/s) (Codina, 1971) and 2000 (≈1500 m3/s). The total number of large floods in the 20th century is nine. The large floods in the 19th century will be mentioned in the discussion section.
For the sake of analysis, the 30 km long channel is divided into five reaches here, 1 to 5, from up- to downstream (Fig. 4). In the first three (1–3), the channel used to be wandering within its wide valley floor, with incipient braids. In the last two (4–5), the river is rather a single, meandering, more stable channel running through the delta plains. Archival documents of different dates confirm this description. The corresponding bed slopes and mean grain sizes obtained from documents are gathered in Table 3.
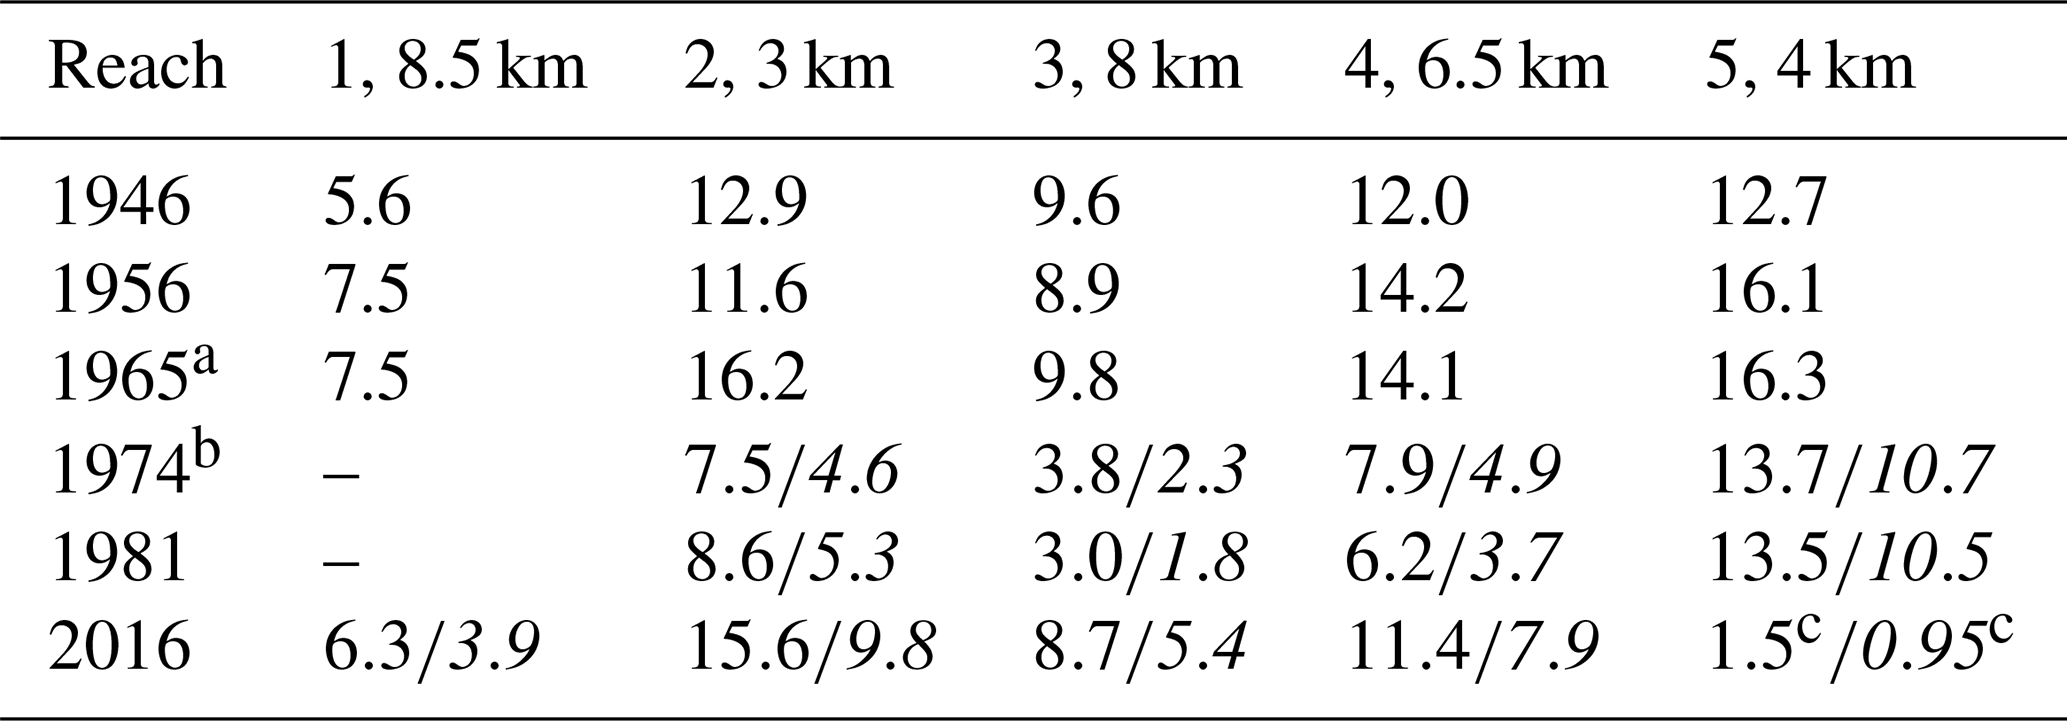
Table 3Slope and mean grain size of the alluvial material for the five reaches of the lower Llobregat. Note the small slope change with time (1946–1982) (Prats-Puntí, 2018).
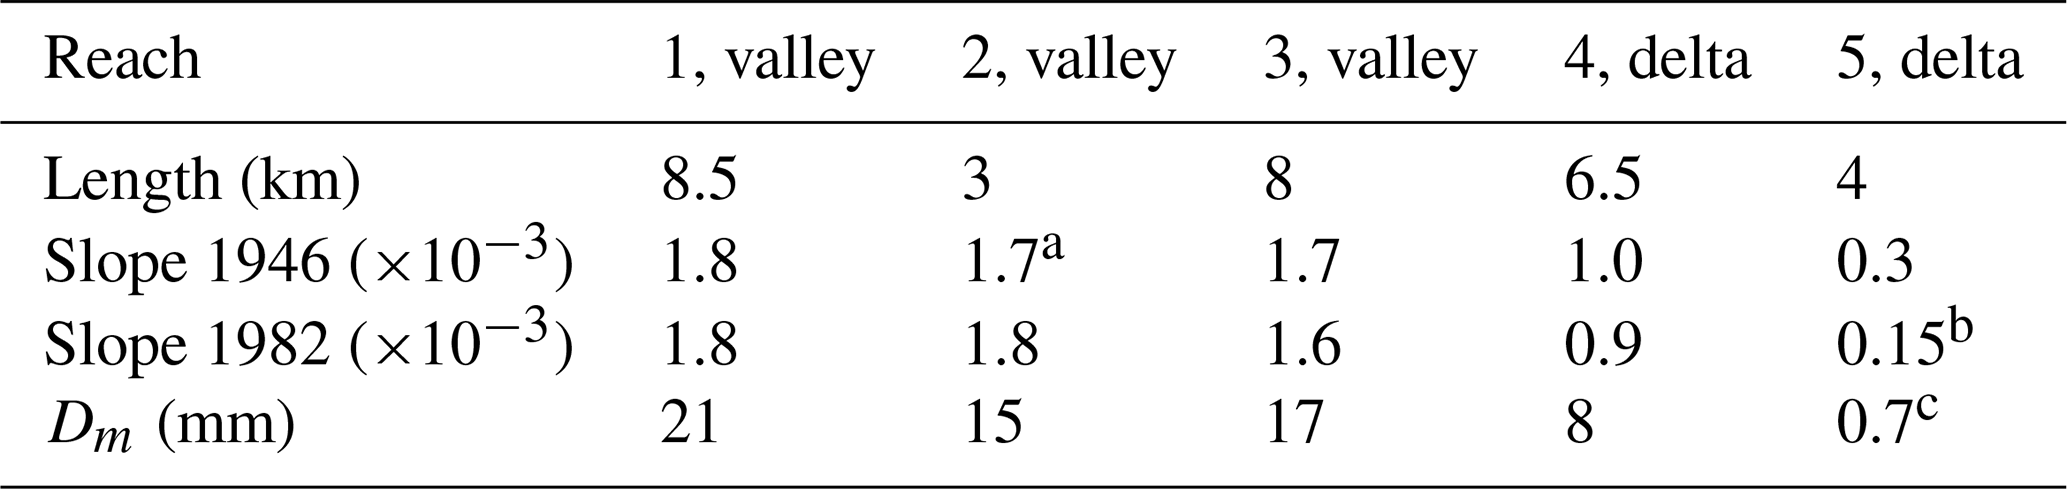
a Dated 1974. b Dated 2016, actually. c Additionally D50=0.6 mm.
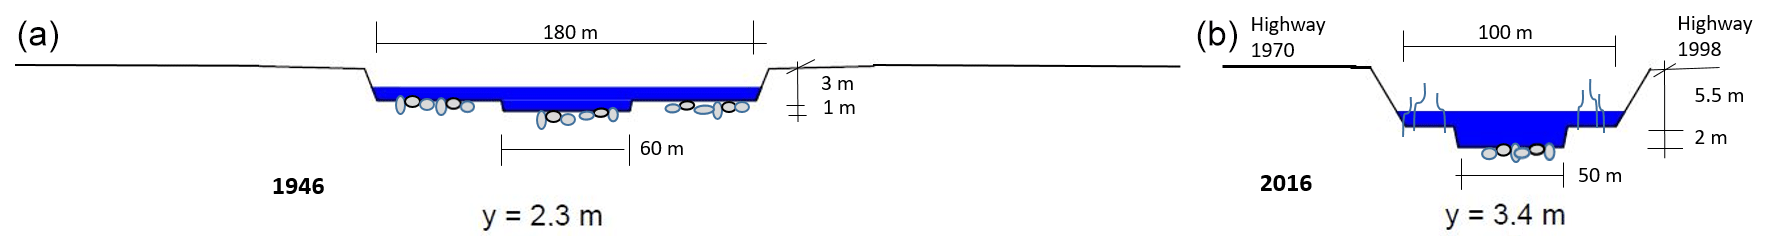
Figure 6Cross sections of reach 1 for the two extreme dates, 1946 (a) and 2016 (b). Alluvial widths are 175 and 33 m, respectively (Table 4, later). Depth y drawn in the cross sections corresponds to a discharge of 600 m3/s, within the first day of the flow duration curve.
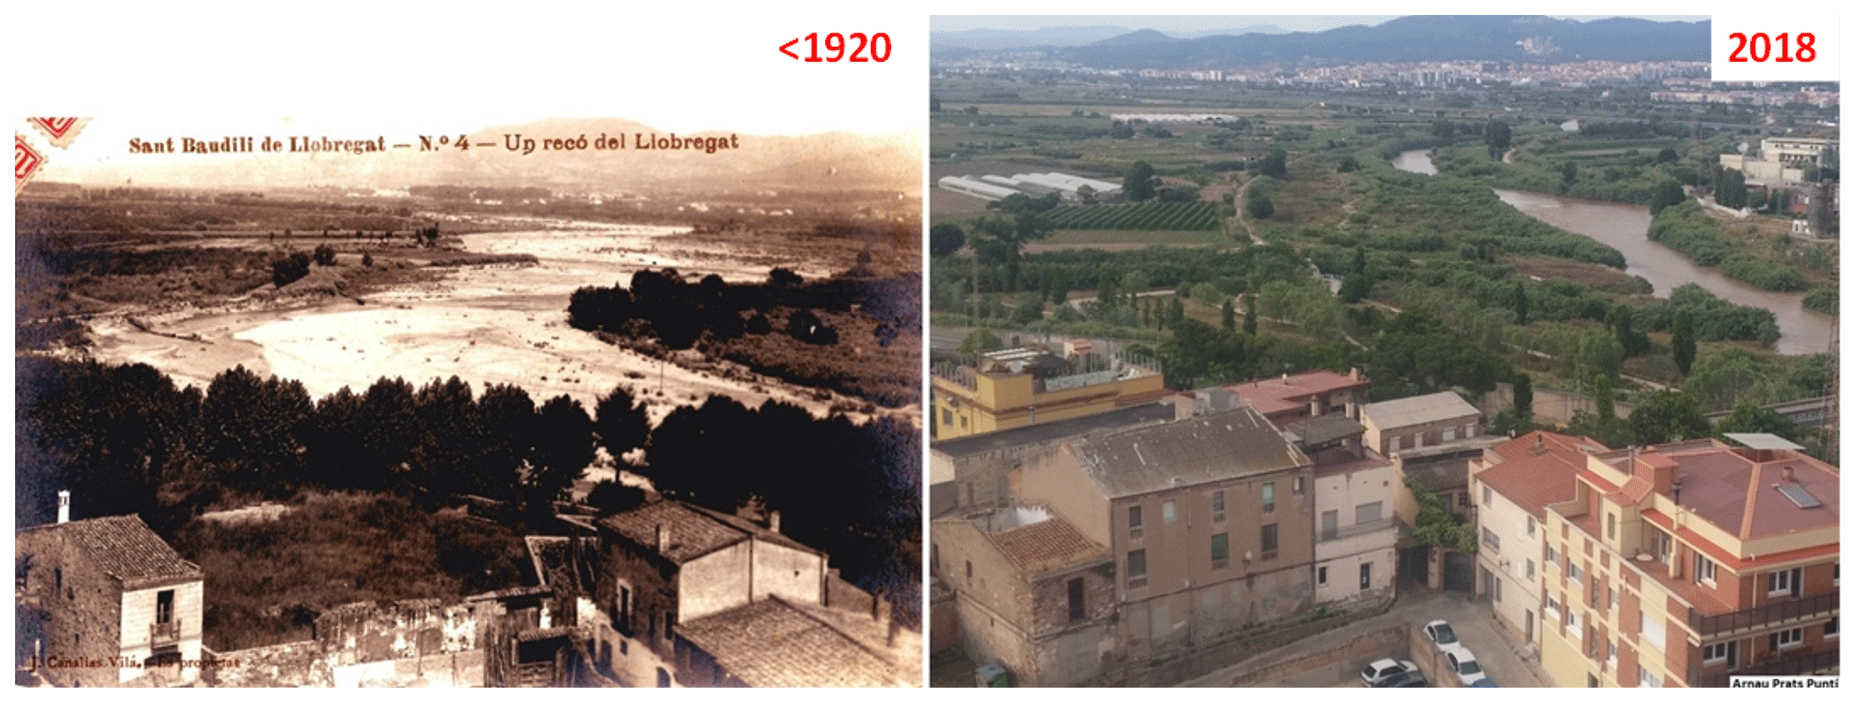
Figure 7Pictures of the Llobregat looking upstream prior to 1920 (left, anonymous in Catalan National Archives) and in 2018 (right, by A. Prats-Puntí) from the same viewpoint on top of the bell tower in town C (Fig. 4).
After Table 3, the lower Llobregat is a 15–20 mm gravel-bed channel with a slope a little less than 2 per mil in the valley, which turns into a sand-bed river (much finer) with a much milder slope in the delta. This abrupt transition from a gravel-bed to a sand-bed stream typically goes with a sudden change in bed slope and stream morphology (Parker and Cui, 1998) such as wandering to meandering, as happens in our case. The important consequence is that the reach issuing sediment to the coastline is reach 5 with bed grain size D50=600 µm (Table 3), similar to the grain size on the beaches.
A cross section representative of each date and each reach was drawn with the aid of aerial photographs and archival documents. One example is Fig. 6 for reach 1 (see also sketch in Fig. 8, later, for a section in the border between reaches 2 and 3).
Width changes during (1946–1982) have been extremely large. Table 4 collects the alluvial bed surfaces in hectares obtained from the series of aerial photographs (Sect. 2). These surfaces are strictly alluvial, excluding the areas of early colonizing plants growing there. The average width shown in the table is the alluvial area divided by the reach length. Note the reduction to roughly half of the alluvial area in the period 1946–1981 (up to one-third in reach 3). The current situation (2016) shows the last stage of the dramatic loss of alluvium, so far.
Table 4Alluvial surfaces and average widths of the strictly speaking alluvium in the aerial photographs. For an example see Fig. 6 (Prats-Puntí, 2018).

a This value has to do with the new mouth (Sect. 14). b These values are extended to and averaged over the lowermost 21.5 km (reaches 2–5). c Idem in the uppermost 26 km (reaches 1–4).
This change is conspicuous for any observer of the river. For example, the river landscape prior to 1920 is compared to the present state in Fig. 7, both photographs taken from the bell tower of town C (see Fig. 4 for location). The same conclusion of a dramatic change is drawn from archival plans and documents. The widest, wandering Llobregat of 1946 seems to be related to the aggradation brought by the 1942–1944 floods.
These changes have been forced by the infrastructures serving the urban area of Barcelona. Reaches 1–3 make the main corridor of roads and railways across the mountain range towards the plains where the city stands. Dates of opening of the main infrastructures are 1970 for a highway (built as a dike) through the middle of the left floodplain, 1979 for a meander cutoff (Fig. 4) and 1998 for the companion highway (another dike) through the middle of the right floodplain, followed by the railway attached to the riverine side of this dike (and 2004 for the new river mouth into the sea). Figure 8 is a close view of a particular section around town D (Fig. 4 for location). It shows that the highways are also flooding dikes (or levees), which encroach upon the floodplains.
This calendar of works suggests that only the last four rows in Table 4, showing a reduction of average alluvial width from 96 m (1965) to 72 m (1981) and ultimately to only 38 m (2016), are attributable to the main infrastructures, which have cut off roughly half of the floodplain width at least.
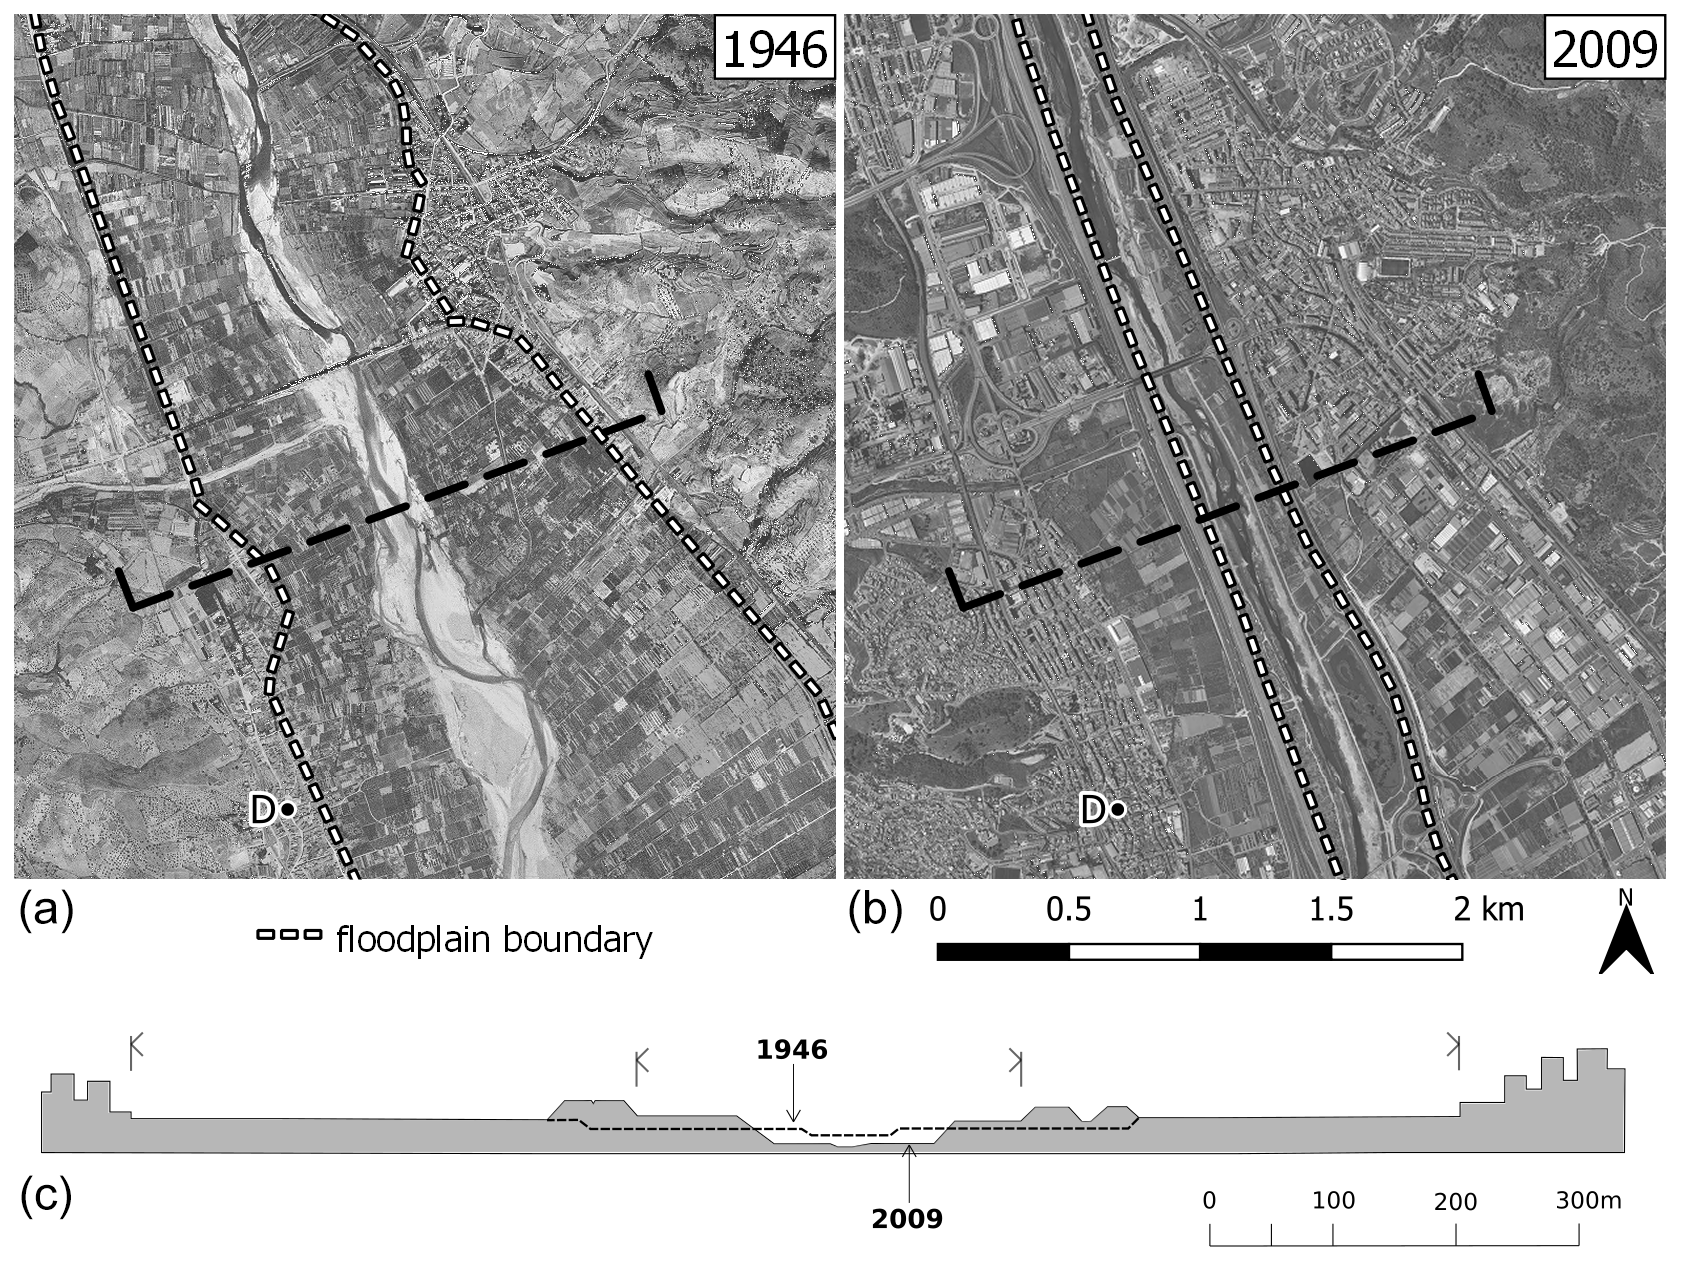
Figure 8Plan view in 1946 (a) and 2009 (b) of the river around town D (see Fig. 4 for location) in the overlapping of reaches 2 and 3, produced by authors using freely available data from ICGC. The bridge in the middle of (a) (see Fig. 10, later) failed in 1971. (c) Cross section in reach 3 taken through the dashed line above (see Fig. 6 for more cross sections).
Some other works are worth mentioning. After the 1944 and 1962 floods, several river-training works of lesser scope were executed. Gravel mining operations in the active channel were still minor in 1956 and larger in 1965, with their heyday in 1974 and decline in 1981. Most of the mining pits were located in reaches 2 and 3. Unlike the 1970 left highway, the engineering works for the 1998 highway and railroad included the digging of the channel, from the left dike to the right dike, to allow for flow in case of floods.
As presented in Sect. 5 for the sediment trapping by dams, the bed material transport of a river reach is the balance between the supply from upstream and the carrying capacity of the reach (Einstein, 1964). Focusing now on supply, Table 4 provides metrics to the bed material source of supply. High flows and floods are able to pick particles from those alluvial sources, which in this way will keep being alluvial, as seen in the aerial photographs. Thus, Table 4 is useful as an indicator of the change of supply in time within the lower Llobregat. For example, the alluvial bed surface in reach 1 decreases from 148 to 86 Ha in the decade 1946–1956 (or from 175 to 100 m in terms of average alluvial width), so that the likely supply to reach 2 from reach 1 is probably reduced in the same proportion. The supply to reach 1, the first in the row, from further upstream is treated in the discussion.
Unlike the effect of the upland dams, the disturbance of this supply cut is likely able to affect the lower Llobregat, at least the next reach downstream of the one considered, if a disturbance velocity of hundreds of meters per year (for example, 500 m/yr, Liébault et al., 2005) is reasonable. In 1 decade then, such as 1946–1956, reach 2 would be affected by the supply cut in reach 1 and so on for the next reaches and decades. Unlike the case of dams again, this disturbance is not necessarily one of degradation, because each reach downstream suffers a comparable reduction of alluvial bed as the reach upstream. For example, reach 2 decreases from 180 to 110 m in width (Table 4) in 1946–1956, at the same time as reach 1 reduces its own width from 175 to 100 m. The reduced supply due to a narrower alluvium upstream finds a narrower cross section downstream to carry it further downstream. Whether the difference of supply and carrying capacity is positive or negative, the result will be aggradation or degradation in reach 2 (this argument will be resumed in Sect. 11).
Carrying capacities are dealt with next, but the point to be retained now is that the changes of alluvial area in the lower Llobregat are able to control the sediment yield of the river in a period of 3 to 4 decades (1946–1981) and even more in the lapse of time until present (1946–2018).
Assuming uniform flow and bed shear stress proportional to hydraulics radius and bed slope (Table 3), we have applied the Meyer-Peter and Müller (MPM) equation (Wong and Parker, 2006) to the cross sections of each date and reach, for each hour of the flow duration curve, with and without reservoirs, in order to get unit solid discharges, which multiplied by the alluvial widths produce Table 5.
The ratio of carrying capacity with and without reservoirs is 0.62 for reaches 1–4 and 0.73 for reach 5, on average (Table 5). In other words, flow regulation by reservoirs is responsible for a reduction of carrying capacity amounting to 38 % in most of the lower Llobregat today (reaches 1–4), which is quite a bit more than the reduction of discharge in the flow duration curve of the present flow regime with reservoirs (≈20 %, Sect. 6).
Table 5Carrying capacity (×103 m3/yr) of the five reaches and all years. The values in italics are the capacity with reservoirs.
a Computed with none of the reservoirs in operation. b Computed with the three reservoirs in operation. c These figures have to do with the new mouth (Sect. 14) (Prats-Puntí, 2018).
Carrying capacity computed in this way is proportional to the alluvial width, but it is also affected by the depth increase, because this implies an increase in shear stress (1.50 times higher in 2016 than in 1946 in the case of Fig. 6).
The balance between supply and carrying capacity states that if the former is larger than the latter, aggradation occurs and the amount conveyed further downstream equals the carrying capacity only, not the supply. If the opposite happens, the amount conveyed is the supply plus material from the bed (and so, degradation occurs), as long as the alluvium is not exhausted but available, tending to the carrying capacity at the most. If the two quantities are equal, equilibrium holds.
Table 6Comparison of the amounts of coarse sediment supply (figure left) and bed material carrying capacity (figure right) by reaches and years, with reference to a level 100 of both quantities in 1946.
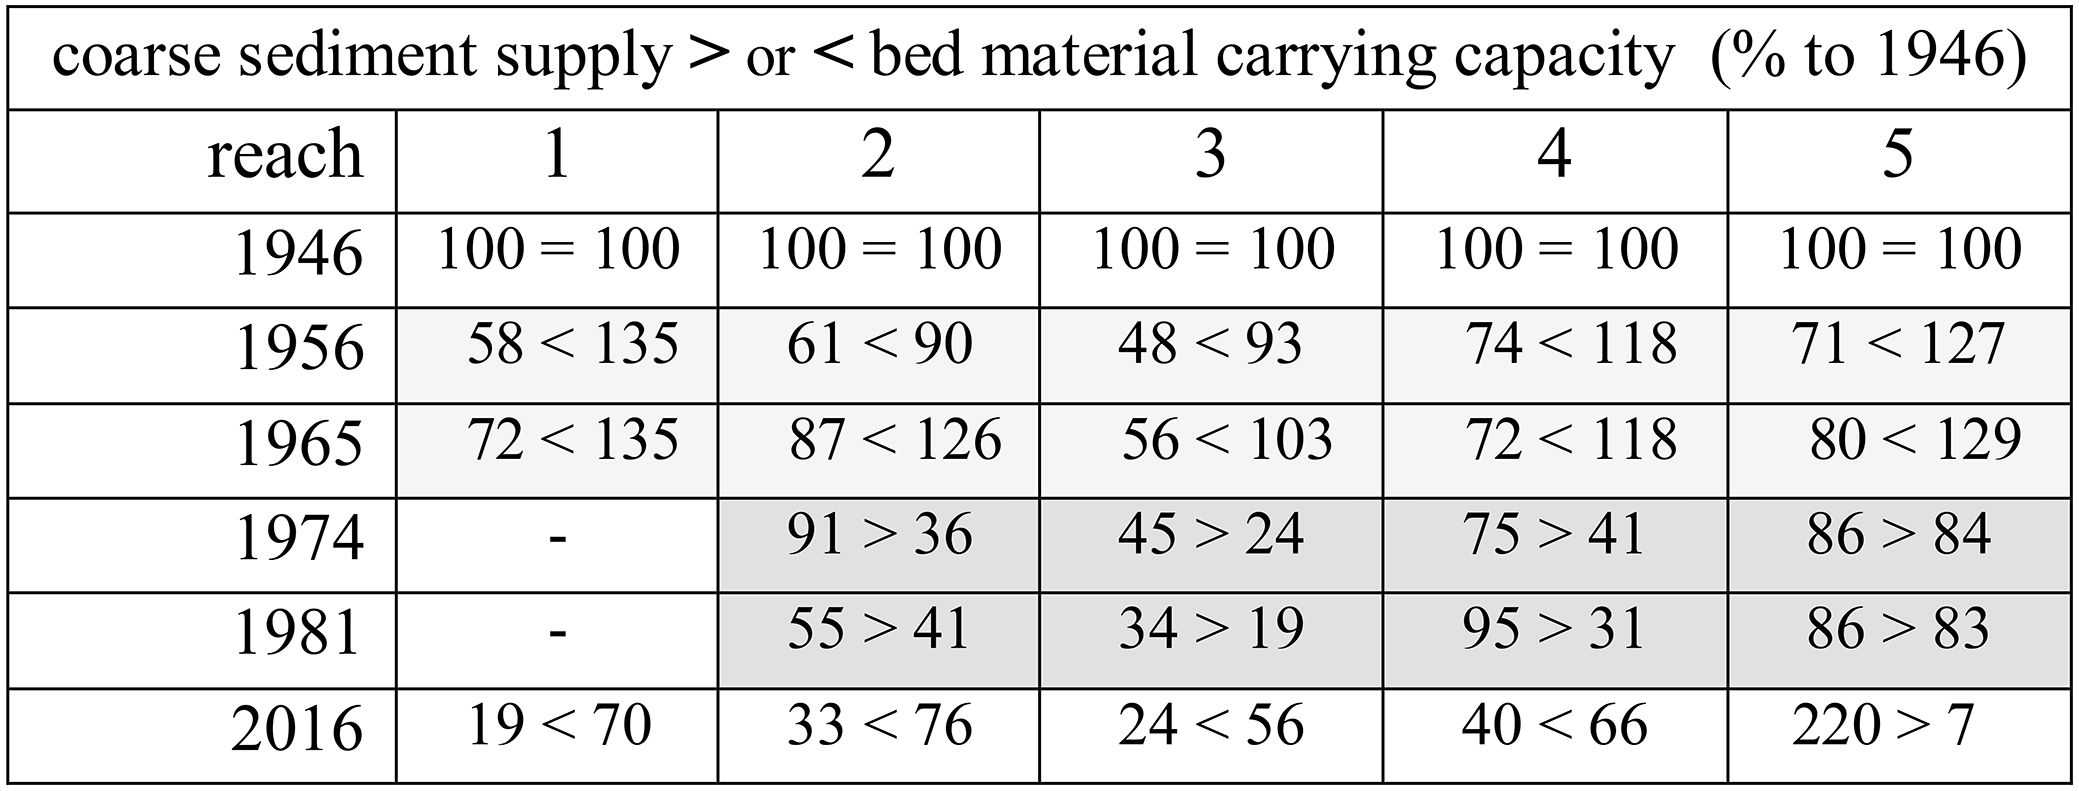
The underlined values in Table 5 (with reservoirs) are used; symbols a, b and c in Table 5 apply here too. Dark grey boxes mean likely aggradation (>) and light grey likely degradation (<).
Table 7Coarse sediment transport (×103 m3/yr). The quantities at the right-hand side of symbols > or < are capacities from Table 5 (with reservoirs); those at the left-hand side are supplies transferred.
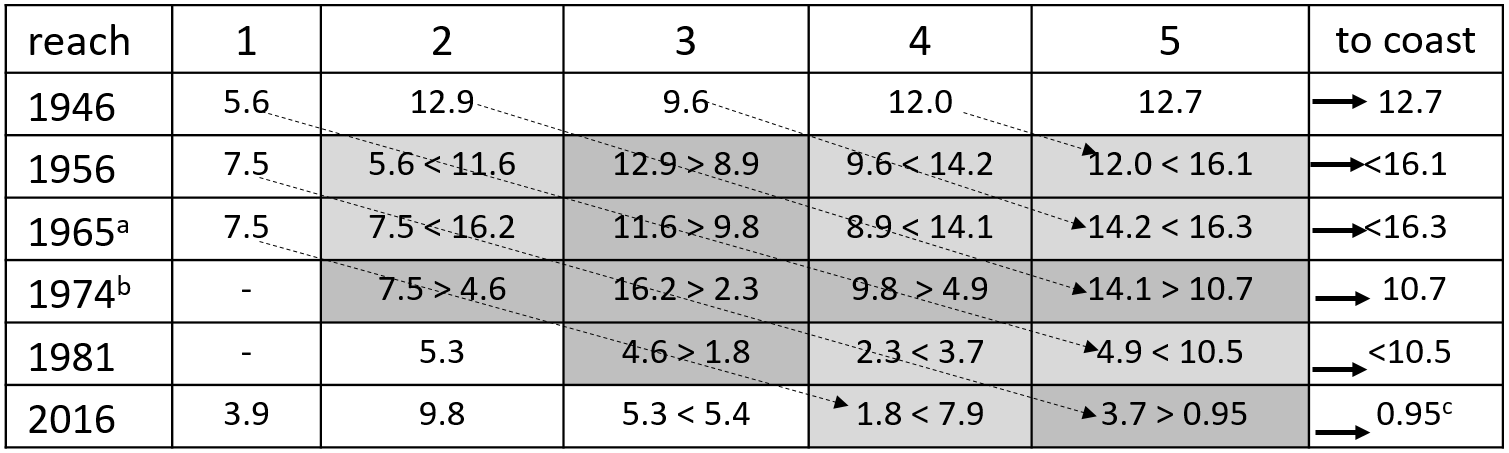
Dark and light grey boxes have the same meaning as above. Dotted lines with arrows mean transference to the next reach and decade and arrows mean transference to the coast. The symbols a, b and c in Table 5 apply here too.
The delta was steadily retreating before 1946 (Fig. 2), the date of the first quantitative, extensive information (photographs), so that supply and carrying capacity changes from 1946 can be seen as disturbances to this state. An attempt at this “disturbance” analysis is Table 6, which combines data of Table 4 for supply and Table 5 for capacity, in the form of percentages with respect to their 1946 values, either alluvial area (Ha), the surrogate of supply or computed carrying capacity (m3/yr). After Table 6, in 1956–1965 capacity exceeded supply because it went higher than in 1946 or at least stayed quite high, but supply dropped significantly (so, degradation was likely), whereas in 1974–1981 supply exceeded capacity because it was capacity that dropped a lot while supply still stayed at the previous level (so, aggradation was likely). The degradation observed in 1956 for the whole lower river probably followed the 1944 flood aggradation (Sect. 7).
11.1 Routing algorithm
As stated above, the volume dispatched downstream is the capacity if supply is greater than capacity and the capacity at most if supply is less than capacity. Then, the logical operation < or > in any row of Table 6 would allow the transfer of amounts in cubic meters per year (capacities) to the next period and reach, serving there as supply (case >) or supply at most (case <), to be compared to capacities in a consistent way (same unity, m3/yr). This lapse (1 decade) and step (one reach) have been justified in Sects. 5 and 8 with the velocity of the disturbance created by a cutoff supply. This kind of algorithm is applied to produce Table 7 by starting with the 1956 row in Table 6 and using the data of Table 5. Regarding the “boundary” data, i.e., the year 1946 and reach 1, we assume for the moment that carrying capacities are dispatched quantities to the next reach and period.
Table 8Comparison of Table 1 and the differences in Table 7, for the balance at the delta and the change in sediment yield. Flood discharges come from Sect. 7.
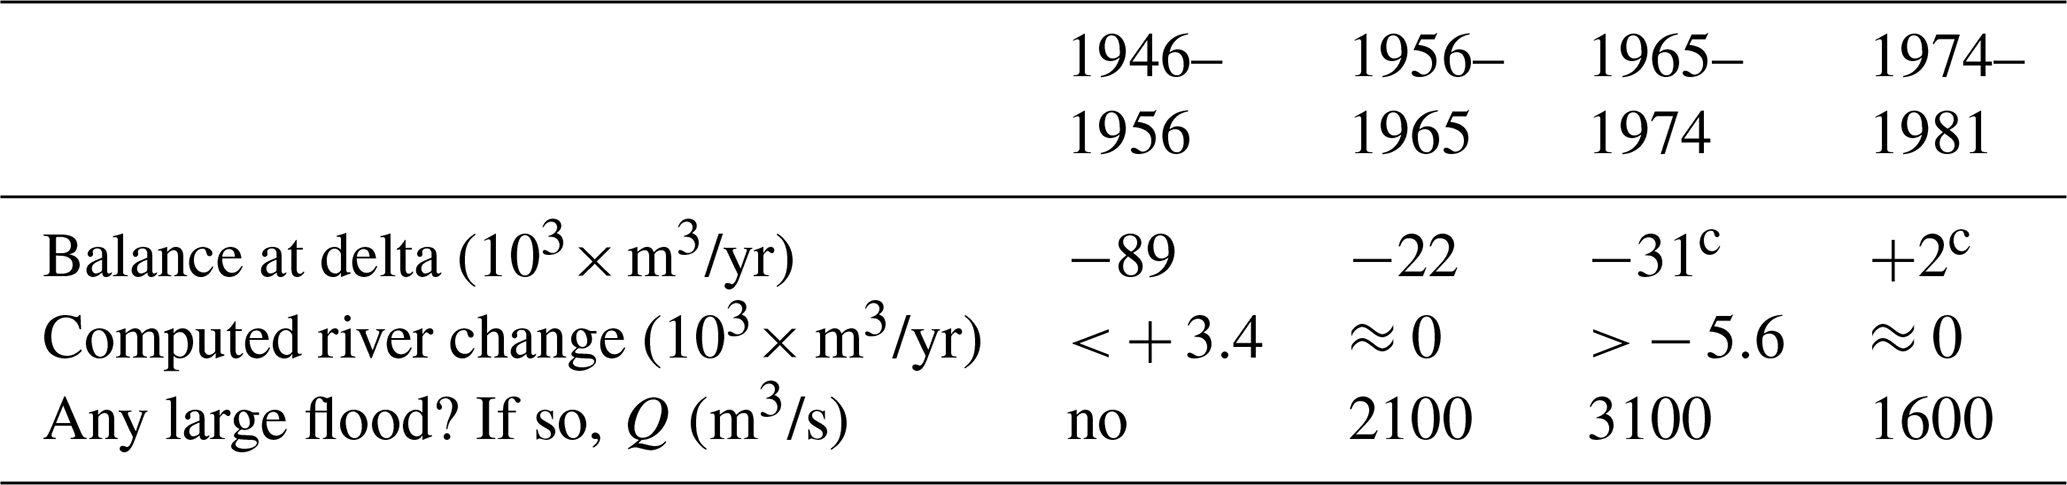
c See Table 1.
Table 7 provides an estimate of the sand sediment yield into the sea in the last column, i.e., m3/yr in the period 1956–1965 but m3/yr in 1974–1981. If the river had not been regulated by dams, the yield in 1974–1981 would have raised to m3/yr (see Table 5), i.e., 3.5×10³ m3/yr more without dams than with them.
By comparing Table 7 with Table 1, the computed annual river yield decreasing from in 1956 to m3/yr in 1981 is found to be a substantial factor for the delta evolution. It is of the same order of magnitude but lower than the delta balance in 1946–1981 ( m3/yr). Its variation of m3/yr between 1956 and 1981 due to the river encroachment by infrastructures is less substantial, but it still accounts for ≈16 % of the balance. The role of the regulation by dams, i.e., a variation of m3/yr, accounts for some 9 % of the balance. It must be recalled that the computation is based upon mean flows and annual floods, not including large floods, whereas the delta evolution (Sect. 2) encompasses all phenomena. The role of large floods is explored next.
Just after the building of the left dike (highway) in 1970 (Sect. 8), the largest flood of the 20th century in 1971 caused a general bed degradation in reaches 2 and 3. A historical bridge close to town D in Fig. 8 failed due to that event (Batalla, 2003). Similarly, the 2000 flood with a peak of 1500 m3/s (Sect. 7) came just after the construction of the right dike in 1998. In addition to the dikes, the river channel had been dug to increase hydraulic capacity. The 1998 “as-built” bed profile has been compared with a survey after the 2000 flood, resulting in incisions of 0.6 m along 2.5 km of reach 1, a minor amount in reach 2 and 0.5 m along 3.0 km of reach 3. Therefore, the volume scoured was m3 in 1 and m3 in 3. A sum of m3 was issued, at least, by the valley reaches (1–3) to the delta (4–5) and ultimately to the coast. It is clear, therefore, after comparing this amount to those in Tables 1 and 7, that large floods may be dominant in the sediment yield. The river bed supplied particles, as theory claims, at the cost of incision. By inductive reasoning, incision will happen again as long as the alluvium does not get exhausted.
Our computation of 16×103–10×103 m3/yr is a large underestimation in years with large floods, which can act as pulses driving the delta evolution. It is a challenge to know to what extent this is so with our scarce data. One can hardly make a count of nine large floods similar to the 2000 one in the 20th century (Sect. 7), so that a rough average amount “per year” of the century would be 14×103 m3/yr. Thus, the total yield in the long term, including large floods, would double our computation for normal flows and annual floods. In this way, the river yield (+30–24×103 m3/yr) would be close to match, with opposite sign, the delta balance ( m3/yr), both in the range 20–40×103 m3 in absolute value.
Table 8 shows the high variability when considering the same comparison by periods of analysis (decades). Deficit at delta (from Table 1), computed river change (Table 7) and flood occurrence (Sect. 7) are compared. Most interesting is the maximum delta retreat in a decade of no floods (1946–1956), after years 1942–1943–1944 of large floods and general aggradation (even causing an increase in river sediment yield m3/yr afterwards). This suggests that the “normal” river yield is largely insufficient to counteract wave action. On the contrary, the agreement in the last period (1974–1981) suggests that floods larger than, but similar to, the 10-year return period (Sect. 7) can be sufficient to keep the delta almost at balance. However, the middle decades (1956–1965 and 1965–1974) contradict the last suggestion, since larger floods, close to the 50-year return period, did not produce delta aggradation, not even a balance, but rather a retreat. This discrepancy highlights the obvious role of the storms as special events of wave action on the sea side, similar to floods on the river side.
Nevertheless, we can extract more information from Table 8: the difference in the balance between decades with floods (the last 3) and without floods (the first), which amounts to the range 58–91×103 m3/yr for the last 3 decades, confirms the order of magnitude of the river yield by one large flood ( m3/yr), already obtained with data of the 2000 flood. More importantly, note that the largest impact of the encroachment by infrastructures (channelization) in the period 1965–1974, depriving the delta of 5.6×10³ m3/yr (at most), produces an increase in the delta deficit in a similar amount of 9×10³ m3/yr (difference 31–22), both with respect to the period 1956–1965. Thus, the contribution of channelization to the delta retreat that seemed absent or hidden can be evaluated as a portion <5.6∕31, i.e., up to 18 % of the total balance, similar to ≈16 % by using average figures for the whole period 1946–1981 (Sect. 11.1).
A new mouth of the Llobregat River, moving the channel southwards to make more room for the port of Barcelona, was opened in 2004 (see Fig. 4). It is a very wide canal (width from 105 m inland to 215 m at the end) with a flat bottom excavated at an elevation of −2 m (below sea level). The new width is more than twice the original one (Table 4), so that its carrying capacity (Table 5) and, then, its sediment transport (Table 6) go down 1 order of magnitude. The bottom elevation is also much lower than the original one. Therefore, it was prone to alluviation and silting up.
It was not a surprise, then, that a survey in 2009 disclosed a sedimentation of 700×103 m3 in the new mouth (or 0.5 m of aggradation throughout), i.e., an average of 140×103 m3/yr in 2004–2009. Material trapped in the new mouth is not only sand, of course, but the finer suspended load as well. In other terms, it is the sum of bed load and suspended load, or the sum of bed material load and wash load, i.e., a total load. Moreover, the suspended load has been estimated through measurements of concentration of suspended sediment in the abovementioned gauging station (Fig. 4 for location) in 1995–2002, resulting in a total suspended yield of m3/yr (Liquete et al., 2009), assuming a sediment density of 1.1 t = m3 for fresh sediments (Batalla, 2003). These daily measurements could not monitor in detail the 2000 flood. The comparison of these figures of suspended and total load proves that the bed load component is not negligible.
The ratio of the bed load computed above (for years with no floods, i.e., 10–16×103 m3/yr) and the total sediment load trapped per year in the new mouth is ≈10 %. For six Mediterranean rivers, Ebro (Spain), Rhône and Var (France), and Arno, Pescara and Po (Italy), this ratio goes from 2 % to 17 % with an average of 7 %. For the subset of Arno, Pescara and Var, the most similar in size to Llobregat River, the average ratio is 9 % (Syvitski and Saito, 2007). This result brings confidence to the computation of this paper on the grounds of (i) the total load trapped in the new mouth and (ii) the typical ratio of bed load to total load in Mediterranean rivers of similar size.
The bed material yield in the last decades has been influenced by the channelization works in the lower Llobregat, which is close enough to the sea for their disturbance to be felt in the delta. The source of alluvial bed sediment got reduced from its 1946 level to just 38 % thereof in 1981 and to just 22 % in 2016, in reaches 1–3 (Table 4). The channelization also reduced the sediment carrying capacity (Tables 5, 6), for example to 67 % in reaches 1–3 (2016) with respect to 1946. This carrying capacity determines the actual (computed) sediment yield, going from 16×103 m3/yr in 1956 down to 10×103 m3/yr in 1981. This amount means some 10 % of the total sediment yield, measured accidentally in a dysfunctional new river mouth. The agreement with the literature on the subject of the ratio of bed load to total load confirms the computation. All this is based on normal flows and annual floods, whereas large floods exceed the previous amounts by far (1 order of magnitude). An estimate of another 14×103 m3/yr in average over a century, with the discussion on their crucial role in driving the delta balance (either retreat or aggradation) in 1946–1981, is included in Sect. 13.
The customary assumption of a “steady river” (no floods) by coastal specialists is equally as wrong as the customary assumption of a “steady sea” (no storms) by river specialists. It could even be argued that the equilibrium of a delta is elusive, since the delta either progrades, in the case of floods and no storms, or retreats, in the case of storms and no floods. The fluvial input to the delta (sediment yield, notably in high flows and floods) is controlled by intrinsic river variables, such as alluvial width and bed gradient, that have nothing to do with intrinsic coastal variables, such as beach profile, that respond to the maritime input to the delta (wave energy, notably in storms).
The sediment yield to the delta has not been reduced more heavily so far, because alluvial beds have provided much material, instead of the alluvial plains excluded from the channelized river, at the cost of incision in several reaches. Since its opening in 2004 the new mouth has further hampered the exit of sand to the coast because it acts as a sediment trap, in such a way that the current yield is indeed reduced in 1 order of magnitude to m3/yr (Table 7). The likely future exhaustion of the bed in the channelized river together with the sediment trap, worsened if it is dug out for maintenance, is a future scenario of more severe sediment cut for the delta and its beaches.
It has been demonstrated that the sediment trapping at the dams may not be as influential on the coarse sediment yield as the effect of flow regulation due to them, which implies a reduction of carrying capacity amounting to 38 %. However, some moderate effects of sediment trapping at dams should appear in the long term. A consequence for management aimed at providing sand to the beaches is that it is more effective to dismantle channelization than the efforts to pass sediment at dams. This statement points to what controls the coarse sediment yield in the river.
However, despite all the analysis shown so far, the influence of the modern river channelization on the delta evolution is overrun by a much larger long-term trend of the Llobregat delta, which seems irreversible as we will see. In fact, the contribution of the channelization to the total retreat in the period of analysis, 1946–1981, has been evaluated over 16 %–18 %. The retreating trend was clear in Fig. 2, updated several times to add new historical data while the effect of channelization was being analyzed. The most advanced delta coastline must have occurred around the turn of the 20th century, between 1891 and 1907. The question is why the delta was prograding in the 19th century, at least since 1862, but retreating continuously during the 20th century. Is there any explanation for the trend shift around 1900?
Case studies of rivers in southeastern France (Liébault and Piegay, 2002) suggest that a reforestation policy in the last 150 years, applied to Catalan basins as in the French examples, may be influential in narrowing river channels and so, indirectly, in the retreat of deltas. However, the decrease in sediment sources (less agriculture and more forest) seems very modest in this case (Table 2), even more modest in the context of recent research that proves a weak signature of deforestation on delta size, because fine sediments contribute little to delta progradation (Ibáñez et al., 2019).
A second reason stems from a particular hydrological regime in the 19th century. Following documentary research, the period 1830–1870 was marked by a high frequency of floods in the Llobregat and other rivers of Mediterranean Catalonia (Llasat et al., 2005; Barriendos et al., 2019). The most severe floods occurred in 1837, 1842, 1853 and 1866 (Barriendos and Rodrigo, 2006). The 20th century has been less active: 6 catastrophic events in the 19th century versus only 1 in the 20th century (Llasat et al., 2005). A natural origin of this anomaly is accepted in the literature on the grounds of its temporary course and the corresponding climatic oscillations between several European regions. It can be assumed that these flood pulses produced an advance of the delta.
A third reason is the development of garment factories on the banks of the Llobregat River to profit from waterpower, in the 19th century (Alayo, 2017). This can be asserted for 91 factories in the middle reaches of the river (see “small dams” in Fig. 1), consisting of a diversion dam with an average height of 4.2 m ± 2.9 m (standard deviation). Some 62 % of them were built between 1850 and 1900 and most are still in operation as small hydro plants. More specifically, Fig. 9 is the graph of the cumulated height (m) versus the date of the insertion (calendar years) of small dams in the river. Following the progressive dam insertion, the span in height that keeps free for flow of water and sediment in the river profile is reduced accordingly. Recalling that the bed load carrying capacity is a monotonically increasing function of this free span, Fig. 9 also serves as a surrogate of the reduction in carrying capacity over the years. These 91 small dams date from 1816 till 1963 and stand from 4 to 100 km away from the upper border of the lower Llobregat reach (Fig. 1). The delayed effect of the farthest dams, and the quick effect of the closest, in the way to reach this border is taken into account by a disturbance velocity. The graphs for velocities 2, 1 and 0.5 km/year are plotted in Fig. 9. Note that the latter has been used in the sediment routing through the five reaches of the lower Llobregat in Sect. 11.1 These graphs express the pace of the decrease in sediment supply at this border due to the space and time dispersion of the factories.
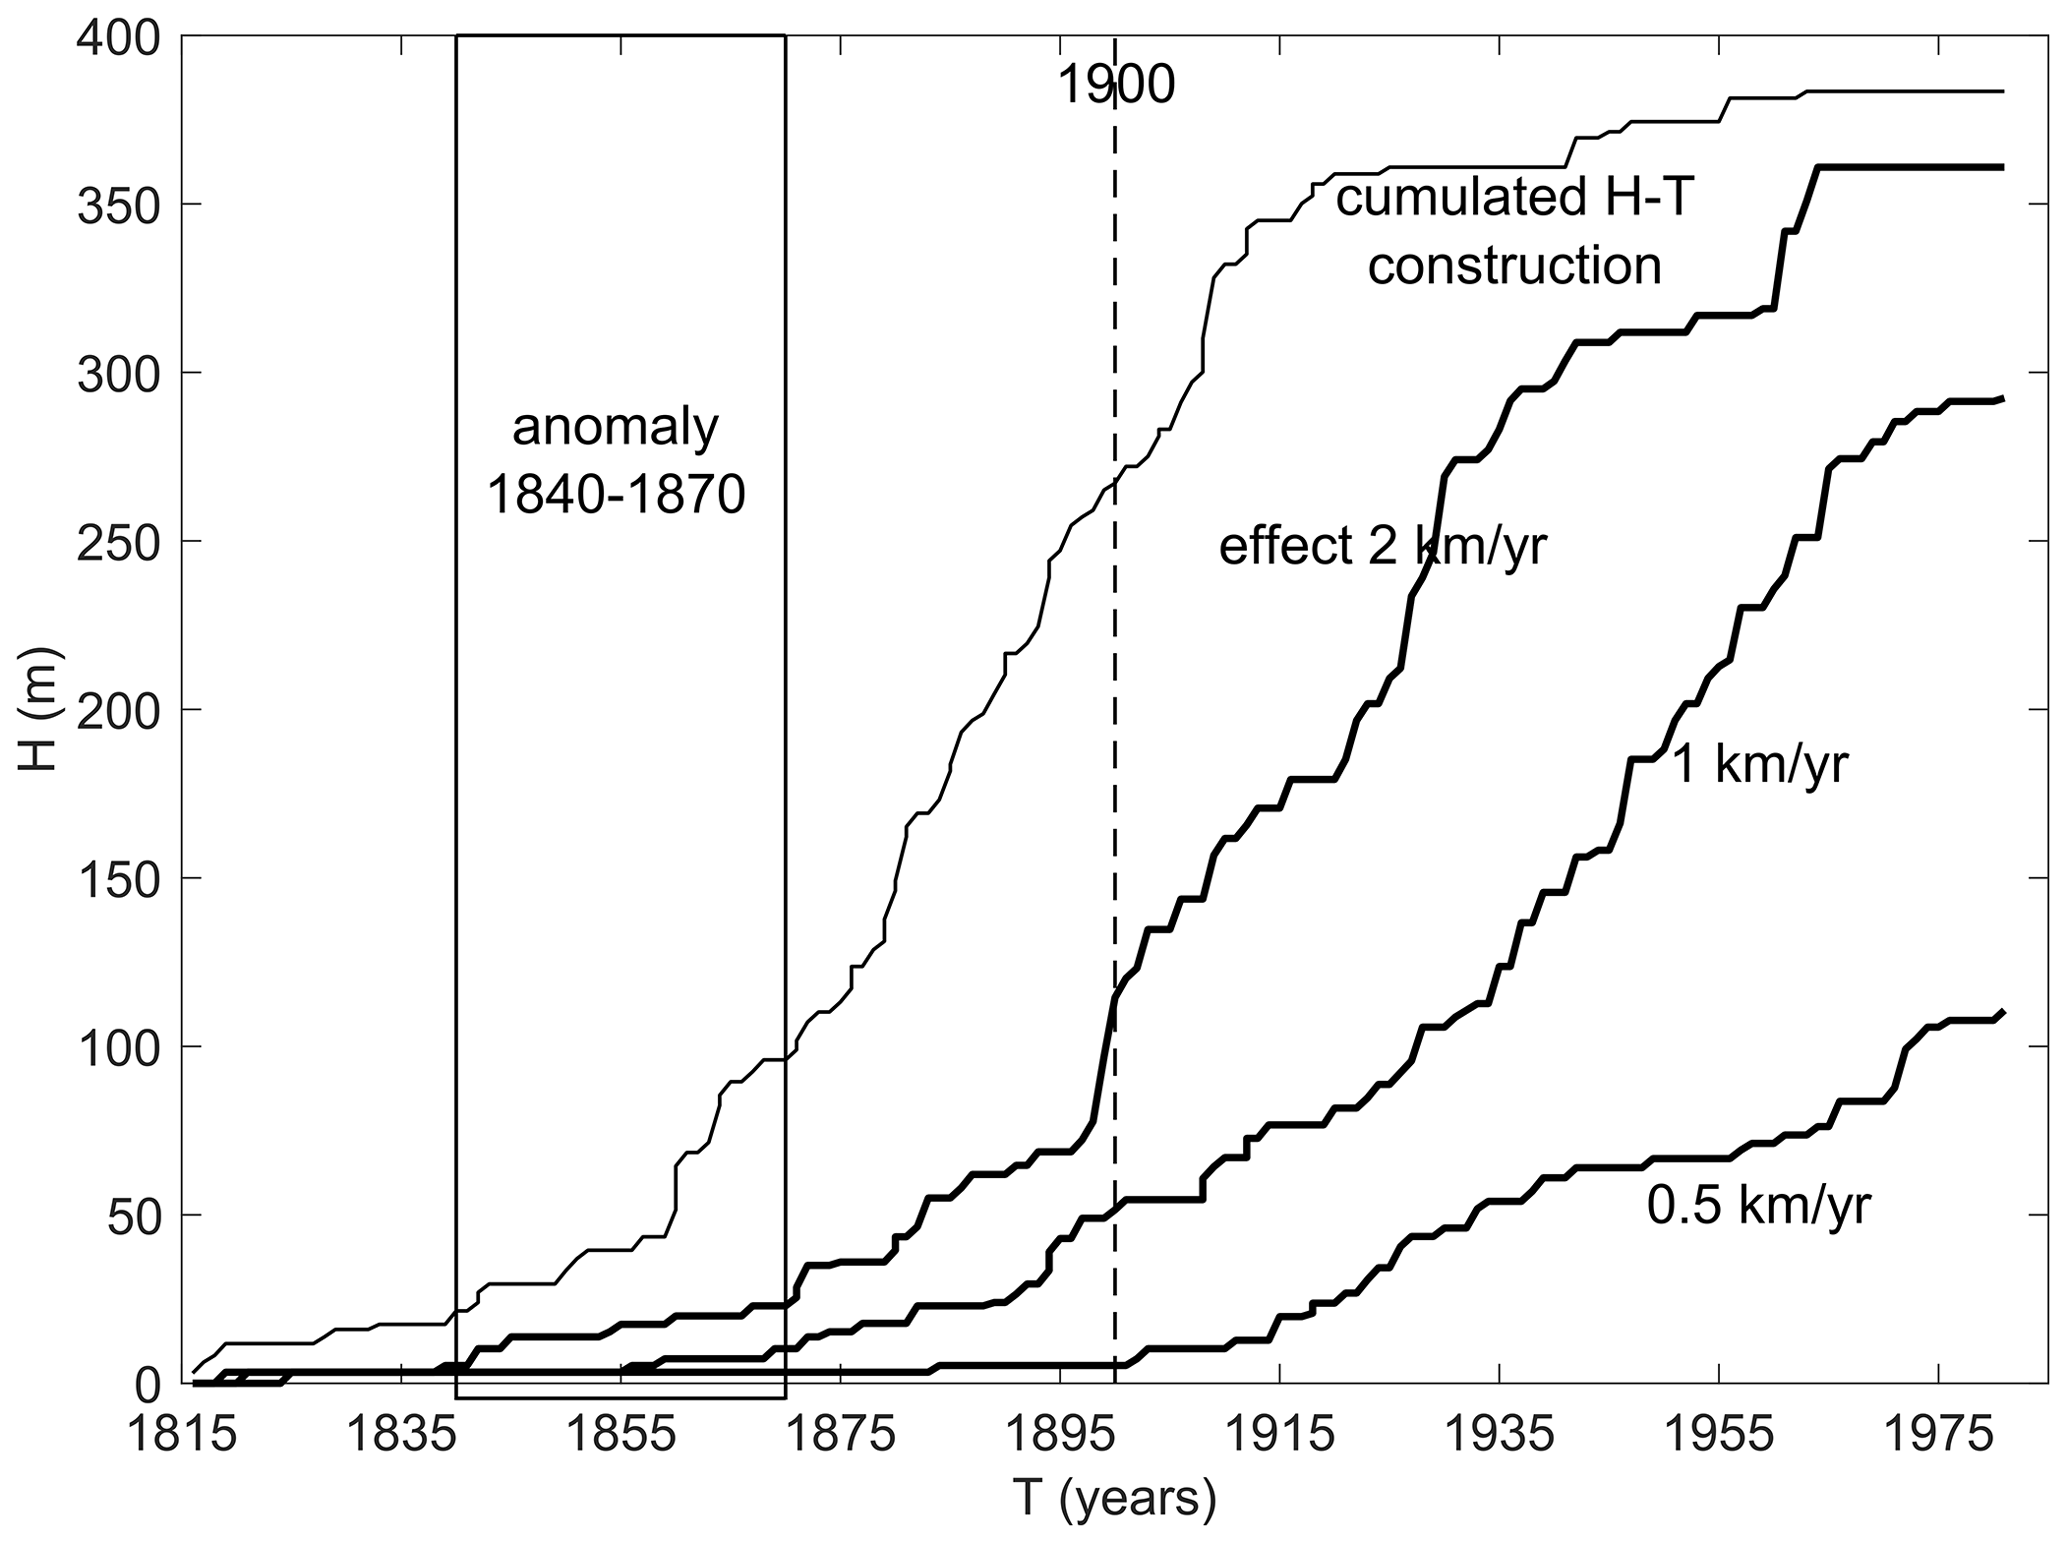
Figure 9Cumulative height H (m) versus calendar date for the installation of factories in the middle reaches of the river (data in Alayo, 2017) and its effects at the upper border of the lower Llobregat, under three assumptions of disturbance velocity.
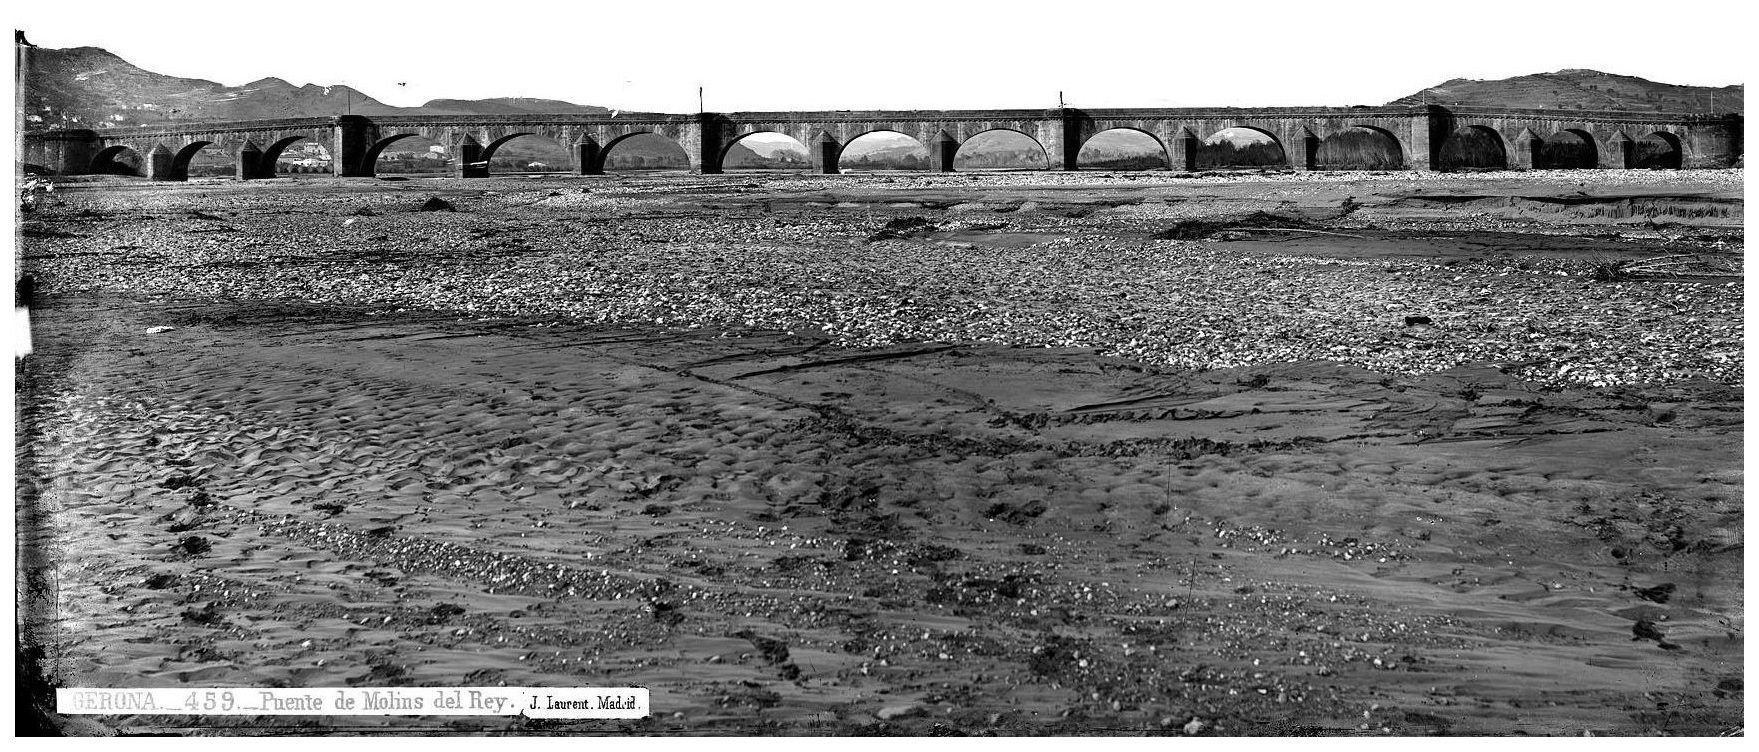
Figure 10Bridge close to town D, shot by well-known French photographer Jean Laurent probably in 1866–1867. The only bridge in lower Llobregat at that time had a total length of 334.36 m, with 15 arches, the central nine of which spanned 19.22 m each. It failed in 1971. Note the extremely wide alluvial area full of sand and gravel.
Two points are worth discussion in Fig. 9. (i) The hydrological anomaly of 1830–1870 finds the middle reaches of the river before the heyday of the garment factory building; therefore, the severe floods of this period must have brought large amounts of sediment to the lower Llobregat. (ii) The increasing effect of factory building on the sediment supply to reach 1 spreads throughout the 19 and 20 centuries, including the period 1946–1981 of our main analysis, and even beyond. The turn of the century (1900) may be spotted as the fastest increasing supply cut in the case of a 2 km/yr disturbance (or the incipient cut for a 0.5 km/yr disturbance) in order to explain the shift from progradation to retreat in the delta. Obviously, the recovery of free span in height in the middle river by removing small dams would be effective to increase the sediment delivery to the delta, in the long term (Ibisate et al., 2016).
In the event of a more active Llobregat in the middle years of the 19th century, and mostly free of factories in the middle reaches, the alluvial channel in the lower river should have been much wider at that time. Very fortunately, two plans of the lower Llobregat at reach 3, dated 1846 and 1854 just in the years of the hydrological anomaly, do exist in the national archives to check our hypothesis. They can be scaled by means of landmarks in towns C and D and especially thanks to the historical bridge close to D that failed in 1971 (Sect. 12). Moreover, Fig. 10 is a photograph dated 1866–1867 of this bridge, a very telling picture of the largest alluvial width known and the large amount of sand and gravel there at that time, completely lost today. The average widths within reach 3 from the two plans are 272 m (both 1846 and 1854), with maxima of 447 m (1846) and 579 m (1854) and minima of 155 m (1846) and 123 m (1854). Compare this with an average width of 150 m for reach 3 in 1946 (Table 4). The heyday of the sediment yield to the delta was the middle of the 19th century. In 1900 things had started to change.
The decrease in coarse sediment yield, causing the continuous retreat of the Llobregat delta throughout the 20th century, must be attributed in some 80 % to the frequency and intensity of large floods (“anomalous” hydrology) in the 19th century and the large number of small dams built at that time, while the contribution of the land use change is minor. For the first reason (hydrology), the retreat is probably irreversible. Modern encroachment by infrastructures (from 1970 to present day) in combination with flow regulation by large dams (1954 to present day) explains the remaining 20 %. The future is challenging in view of the new mouth (2004 to present day), the depletion of the bed alluvium (by floods under river encroachment rather than by mining), the remaining effect of the past small dams and the long-term effect of modern large dams, let alone in view of the climatic change. It is more effective to dismantle channelization or a policy of removing small dams than the efforts to pass sediment at large dams, in order to provide sand to the beaches at the delta.
Natural Hazards and Earth Systems Sciences research sometimes stresses technological innovation in the field of data taking, continuous monitoring and digital communication. However, documentary research (such as that of Llasat et al., 2005, and others) and archival perusal in search of old maps and photographs should be encouraged as well. The fate of the Llobregat River could not have been disclosed without that kind of work.
No data sets were used in this article.
The second author did most of the basic research, oriented by the other two authors.
The authors declare that they have no conflict of interest.
We are grateful to Víctor Ténez, Vicenç Gràcia, Javier Martín-Vide, Carles Ibáñez and the National Archives of Catalonia (ANC). The third author is a Serra Húnter fellow at UPC.
This paper was edited by Maria-Carmen Llasat and reviewed by two anonymous referees.
Alayo, J. C.: Water and Energy. Hydropower in the Catalan rivers, Pagès ed., Barcelona, 936 pp., 2017 (in Catalan).
Allison, M. A., Demas, C. R., Ebersole, B. A., Kleiss, B. A., Little, C. D., Meselhe, E. A., Powell, N. J., Pratt, T. C., and Vosburg, B. M.: A water and sediment budget for the lower Mississippi-Atchafalaya River in flood years 2008–2010: Implications for sediment discharge to the ocean and coastal restoration in Louisiana, J. Hydrol., 432–433, 84–97, 2012.
Barriendos, M. and Rodrigo, F. S.: Study of historical flood events on Spanish rivers using documentary data, Hydrolog. Sci. J., 51, 765–783, 2006.
Barriendos, M., Gil-Guirado, S., Pino, D., Tuset, J., Pérez-Morales, A., Alberola, A., Costa, J., Balasch, J. C., Castelltort, X., Mazón, J., and Ruiz-Bellet, J. Ll.: Climatic and social factors behind the Spanish Mediterranean flood event chronologies from documentary sources (14th–20th centuries), Global Planet. Change, 182, 102997, https://doi.org/10.1016/j.gloplacha.2019.102997, 2019.
Batalla, R. J.: Sediment deficit in rivers caused by dams and instream gravel mining. A review with examples from NE Spain, Rev. C. & G., 17, 79–91, 2003.
Bridge, J. S.: River and Floodplains. Forms, Processes and Sedimentary Record, Blackwell Publishing, Oxford, 491 pp., 2003.
CIIRC: Catalan shoreline state, Department of Public Works, Generalitat of Catalonia, Barcelona, 2010 (in Catalan).
CIIRC: Dynamics of the Gavà and Viladecans beaches, UPC, Barcelona, 2012 (in Catalan).
Codina, J.: Flooding at the Llobregat delta, edited by: Dalmau, R., Barcelona, 1971 (in Catalan).
Einstein, H. A.: Sedimentation, Part II: River Sedimentation, in: Handbook of Applied Hydrology, edited by: Chow, V. T., McGraw-Hill, New York, 1964.
Galay, V. J.: Causes of river bed degradation, Water Resour. Res., 19, 1057–1090, 1983.
Gràcia, V and Calafat, A.: The southern lobe of the Llobregat delta: A natural system controlled by human activity”, X Jornadas de Geomorfología Litoral, Castelldefels, 2019 (in Spanish).
Himmelstoss, E. A., Henderson, R. E., Kratzmann, M. G., and Farris, A. S.: Digital. Shoreline Analysis System (DSAS) version 5.0 user guide: U.S. Geological Survey Open-File Report 2018–1179, U.S. Geological Survey, Falmouth, Massachusetts, 110 pp., https://doi.org/10.3133/ofr20181179, 2018.
Ibáñez, C., Alcaraz, C., Caiola, N., Prado, P., Trobajo, R., Benito, X., Day, J. W., Reyes, E., and Syvitski, J. P. M.: Basin-scale land use impacts on world deltas: Human vs natural forcings, Global Planet. Change, 173, 24–32, 2019
Ibisate, A., Ollero, A., Ballarín, D., Horacio, J., Mora, D., Mesanza, A., Ferrer-Boix, C., Acín, V., Granado, D., and Martín-Vide, J. P.: Geomorphic monitoring and response to two dam removals: Urumea and Leitzaran (Basque Country, Spain), Earth Surf. Proc. Land., 41, 2239–2255, 2016.
Liébault, F. and Piégay, H.: Causes of 20th century channel narrowing in mountain and piedmont rivers of southeastern France, Earth Surf. Proc. Land., 27, 425–444, 2002.
Liébault, F., Gomez, B., Page, M., Marden, M., Peacock, D., Richard, D., and Trotter, C. M.: Land-use change, sediment production and channel response in upland regions, River Res. Appl., 21, 739–756, 2005.
Liquete, C., Arnau, P., Canals, M., and Colas, S.: Mediterranean river systems of Andalusia, southern Spain, and associated deltas: A source to sink approach, Mar. Geol., 222–223, 471–495, 2005.
Liquete, C., Canals, M., Ludwig, W., and Arnau, P.: Sediment discharge of the rivers of Catalonia, NE Spain, and the influence of human impacts, J. Hydrol., 366, 76–88, 2009.
Llasat, M. C., Barriendos, M., Barrera, A., and Rigo, T.: Floods in Catalonia (NE Spain) since the 14th century. Climatological and meteorological aspects from historical documentary sources and old instrumental records, J. Hydrol., 313, 32–27, 2005.
Marcos Valiente, O.: Recent changes in the Llobregat delta coastline, Treballs de la Societat Catalana de Geografia, Barcelona, 1995 (in Catalan).
Marquès, M. A.: The Quaternary of the Llobregat delta, Inst. d'Estudis Catalans, Barcelona, 208 pp., 1984 (in Catalan).
Martín-Vide, J. P., Ferrer-Boix, C., and Ollero, A.: Incision due to gravel mining: modelling a case study from the Gállego River, Spain, Geomorphology, 117, 261–271, https://doi.org/10.1016/j.geomorph.2009.01.019, 2010.
Martín-Vide, J. P.: Andreatta A. Channel Degradation and Slope Adjustment in Steep Streams Controlled through Bed Sills, Earth Surf. Proc. Land., 34, 38–47, 2009.
Martín-Vide, J. P.: River Engineering, the official figures in the text come from the Water Authority, edited by: UPC, Barcelona, 2007 (in Spanish).
Orton, G. J. and Reading, H. G.: Variability of deltaic processes in terms of sediment supply, with particular emphasis on grain size, Sedimentology, 40, 475–512, 1993.
Paladella, F. and Faura Sans, M.: Experiences about the Llobregat delta progradation, Arxius de l'Escola Superior d'Agricultura, available at: https://upcommons.upc.edu/handle/2099/11137 (last access: 4 December 2020), 1935 (in Catalan).
Parker, G. and Cui, Y.: The arrested gravel front: stable gravel-sand transitions in rivers, J. Hydraul. Res., 36, 159–182, https://doi.org/10.1080/00221689809498631, 1998.
Prats Puntí, A.: Historical morphodynamic evolution of the lower Llobregat river, available at: https://upcommons.upc.edu (last access: 4 December 2020), 2018 (in Catalan).
Rinaldi, M. and Simon, A.: Bed-level adjustments of the Arno River, central Italy, Geomorphology 22, 57–71, 1998.
Simon, A. and Rinaldi, M.: Disturbance, stream incision, and channel evolution: The roles of excess transport capacity and boundary materials in controlling channel response, Geomorphology, 79, 361–383, 2006.
Syvitski, J. P. M. and Saito, Y.: Morphodynamics of deltas under the influence of humans, Global Planet. Change, 57, 261–282, 2007.
Vanoni, V.: Sedimentation Engineering, ASCE Manuals, nr. 54, New York, 1975.
Viparelli, E., Nittrouer, J. A., and Parker, G.: Modeling flow and sediment transport Dynamics in the lowermost Mississippi River, Louisiana, USA, with an upstream alluvial-bedrock transition and a downstream bedrock-alluvial transition: Implications for land building using engineered diversions, J. Geophys. Res.-Earth, 120, 534–563, 2015.
Wilkinson, B. H. and McElroy, B. J.: The impact of humans on continental erosion and sedimentation, Geol. Soc. Am. Bull., 119, 140–156, 2007.
Wong, M. and Parker, G.: Reanalysis and correction of bed-load relation of Meyer-Peter and Müller using their own database, J. Hydraul. Eng., 132, 1159–1168, 2006.
Xing, F., Kettner, A. J., Ashton, A., Giosan, L., Ibáñez, C., and Kaplan, J. O.: Fluvial response to climate variations and anthropogenic perturbations for the Ebro River, Spain in the last 4000 years, Sci. Total Environ., 473, 20–31, 2014.
- Abstract
- Introduction and objective
- Beach retreat
- River sediment yield
- Land uses and urbanization (cause a)
- Reservoirs: sediment trapping (cause b1)
- Reservoirs: flow regulation (cause b2)
- Data on the lower alluvial channel (information for cause c)
- Alluvial channel width and history of infrastructures (more information for cause c)
- River engineering: supply sources (cause c)
- River engineering: carrying capacity (cause c)
- Estimation of the real coarse sediment transport
- Incision in large floods
- The role of channelization in delta retreat
- The new mouth and closure of the computation with real data
- Discussion
- Conclusions
- Data availability
- Author contributions
- Competing interests
- Acknowledgements
- Review statement
- References