the Creative Commons Attribution 4.0 License.
the Creative Commons Attribution 4.0 License.
 | 10 Nov 2020
Uncertainty quantification of tsunami inundation in Kuroshio, Kochi Prefecture, Japan, using the Nankai–Tonankai megathrust rupture scenarios
Tomohiro Yasuda
Nobuhito Mori
Ario Muhammad
Raffaele De Risi
Flavia De Luca
Nankai–Tonankai megathrust earthquakes and tsunamis pose significant risks to coastal communities in western and central Japan. Historically, this seismic region hosted many major earthquakes, and the current national tsunami hazard assessments in Japan consider megathrust events as those having moment magnitudes between 9.0 and 9.1. In responding to the lack of rigorous uncertainty analysis, this study presents an extensive tsunami hazard assessment for the Nankai–Tonankai Trough events, focusing on the southwestern Pacific region of Japan. A set of 1000 kinematic earthquake rupture models is generated via stochastic source modelling approaches, and Monte Carlo tsunami simulations are carried out by considering high-resolution grid data of 10 m and coastal defence structures. Significant advantages of the stochastic tsunami simulation methods include the enhanced capabilities to quantify the uncertainty associated with tsunami hazard assessments and to effectively visualize the results in an integrated manner. The results from the stochastic tsunami simulations can inform regional and local tsunami risk reduction actions in light of inevitable uncertainty associated with such tsunami hazard assessments and complement conventional deterministic tsunami scenarios and their hazard predictions, such as those developed by the Central Disaster Management Council of the Japanese Cabinet Office.
- Article
(18367 KB) - Full-text XML
- BibTeX
- EndNote


Nankai–Tonankai megathrust earthquakes and tsunamis pose an imminent threat to people living in western and central Japan. Historically, the Nankai–Tonankai Trough hosted major earthquakes (Ando, 1975; Garrett et al., 2016; Fujino et al., 2018; Fujiwara et al., 2020; see Fig. 1). The most recent events in 1944 and 1946 ruptured the eastern (Tonankai) and western (Nankai) parts of the trough, respectively, and similar segmented ruptures occurred during the 1854 Ansei earthquakes on 23 and 24 December with 32 h apart. The moment magnitudes (M) of these events were in the range of M7.9 and M8.4 (Fujiwara et al., 2020). In contrast, older megathrust events in the Nankai–Tonankai Trough region, such as the 887 Ninna, 1361 Shohei, and 1707 Hoei events, ruptured multiple segments simultaneously based on geological surveys and historical records, resulting in greater moment magnitudes (M8.6 and above; Fujiwara et al., 2020), and causing wider impacts on coastal areas from western to central Japan (Fig. 1). The average recurrence period of these major events is approximately 150 years (nine events happened over 1336 years since 684 CE). In light of geological evidence (see Garrett et al., 2016, for a comprehensive review) and the 2011 Tohoku earthquake, which was originally thought to rupture in segments but resulted in the synchronized rupture of multiple segments (Stein and Okal, 2011), the Central Disaster Management Council (CDMC) of the Japanese Cabinet Office adopted 11 rupture scenarios of M9.0–9.1 that span from the Hyuga-nada region to Tokai region (CDMC, 2012; see Figs. 1 and 2). These scenarios are used for disaster risk management purposes in Japan, such as developing tsunami inundation maps for municipalities and constructing physical countermeasures.
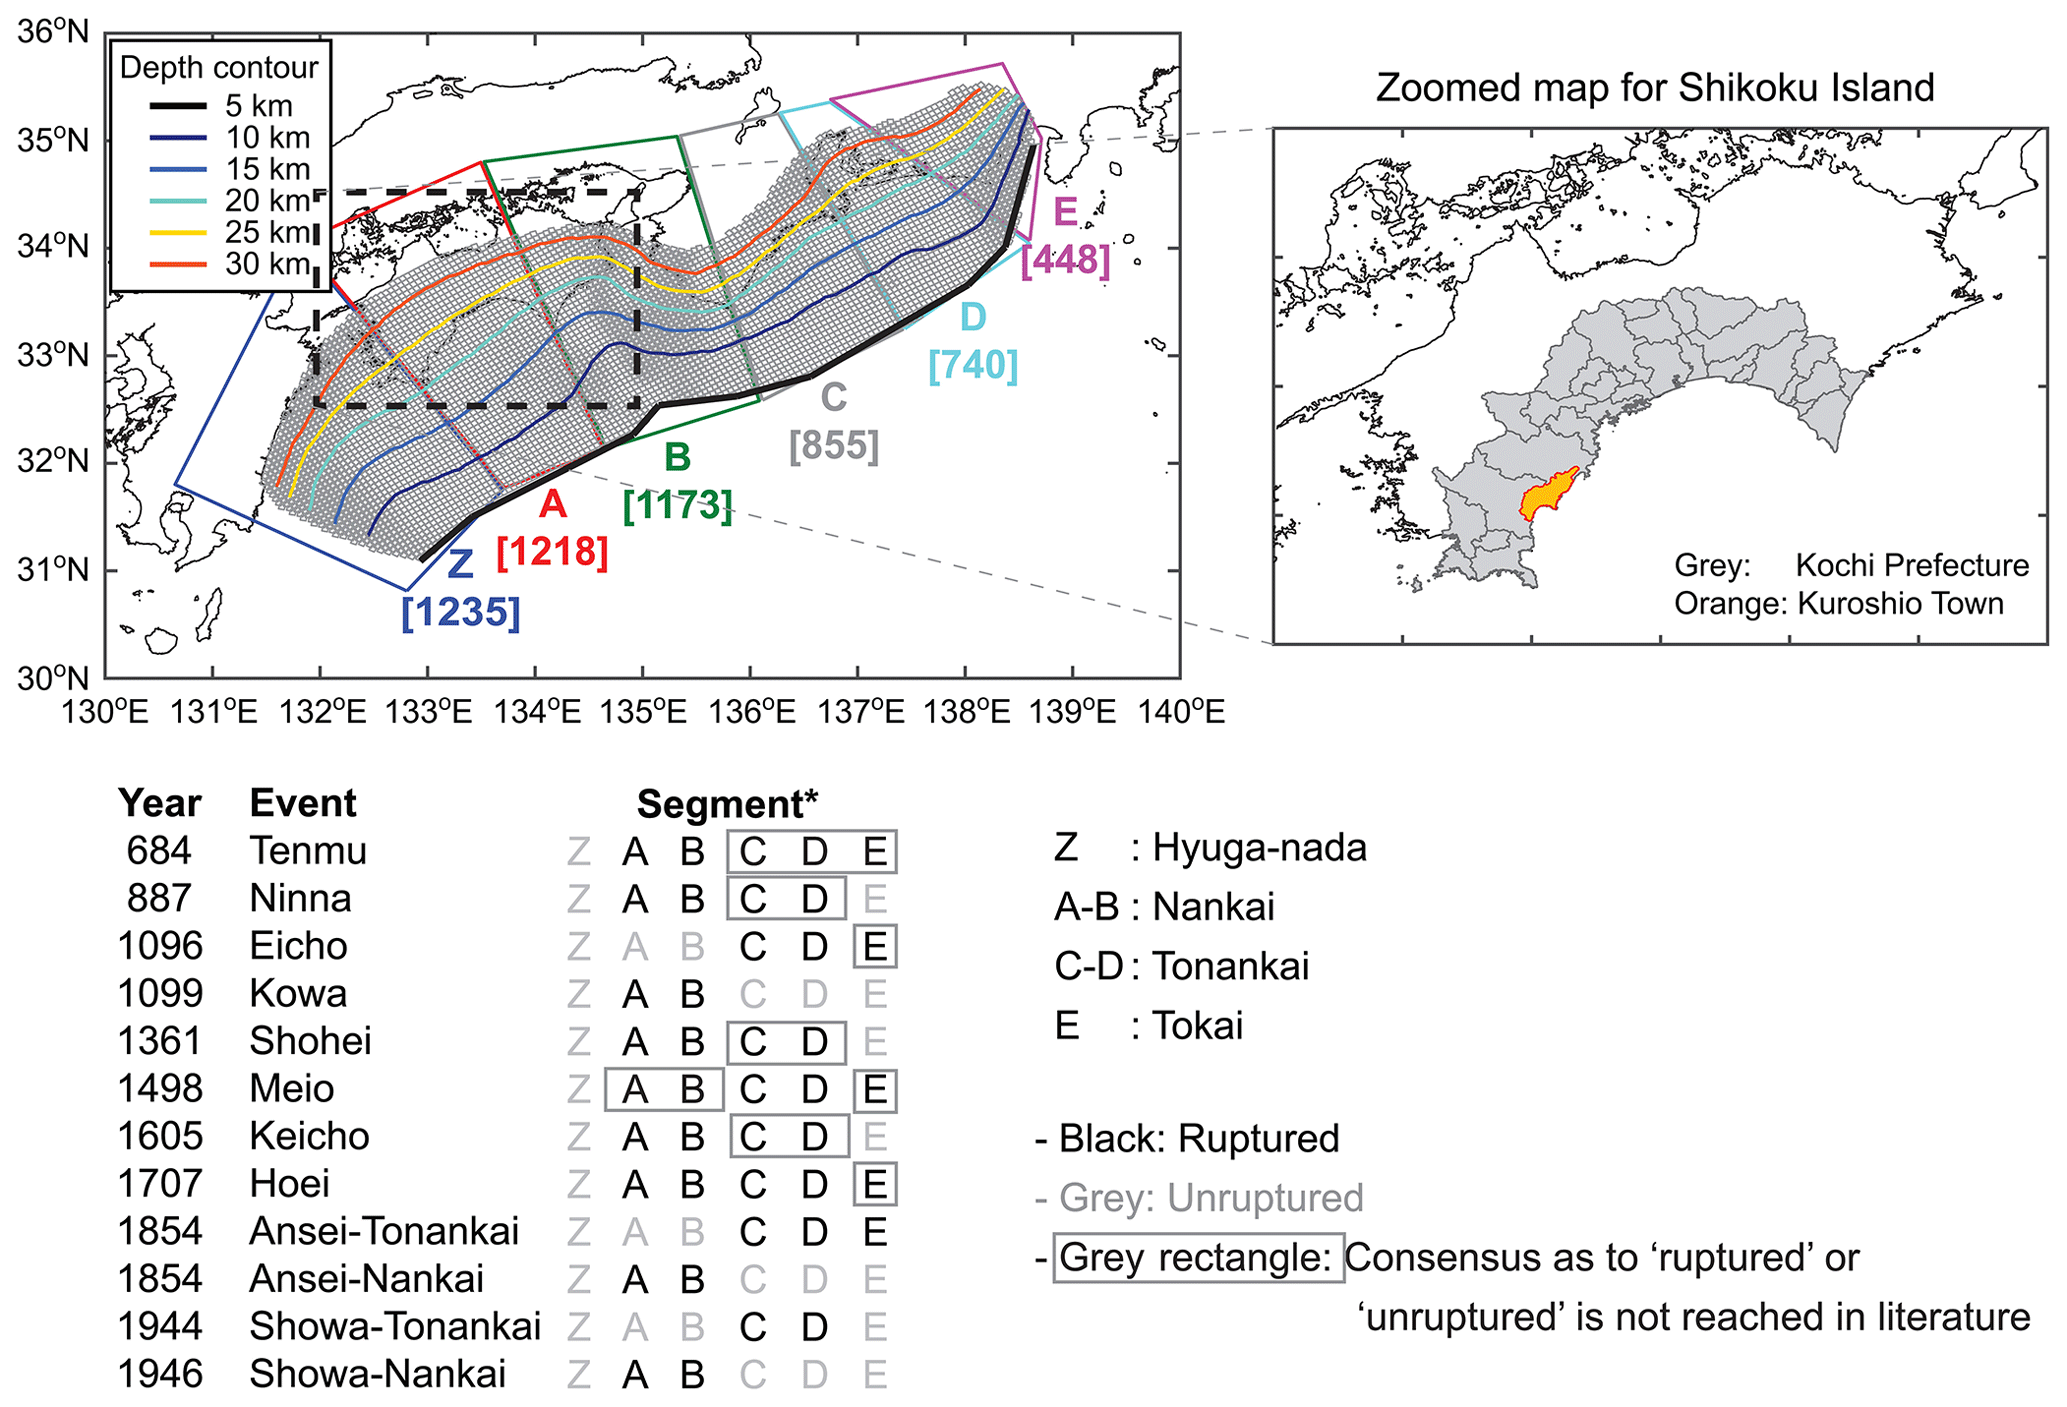
Figure 1Nankai–Tonankai Trough source region and history of tsunamigenic megathrust ruptures. The segment boundaries Z to E are based on Garret et al. (2016). The numbers in the square brackets correspond to the numbers of sub-faults of the 2012 Central Disaster Management Council tsunami source model falling within the segments. The rupture history is based on Garret et al. (2016), Fujino et al. (2018), and Fujiwara et al. (2020).
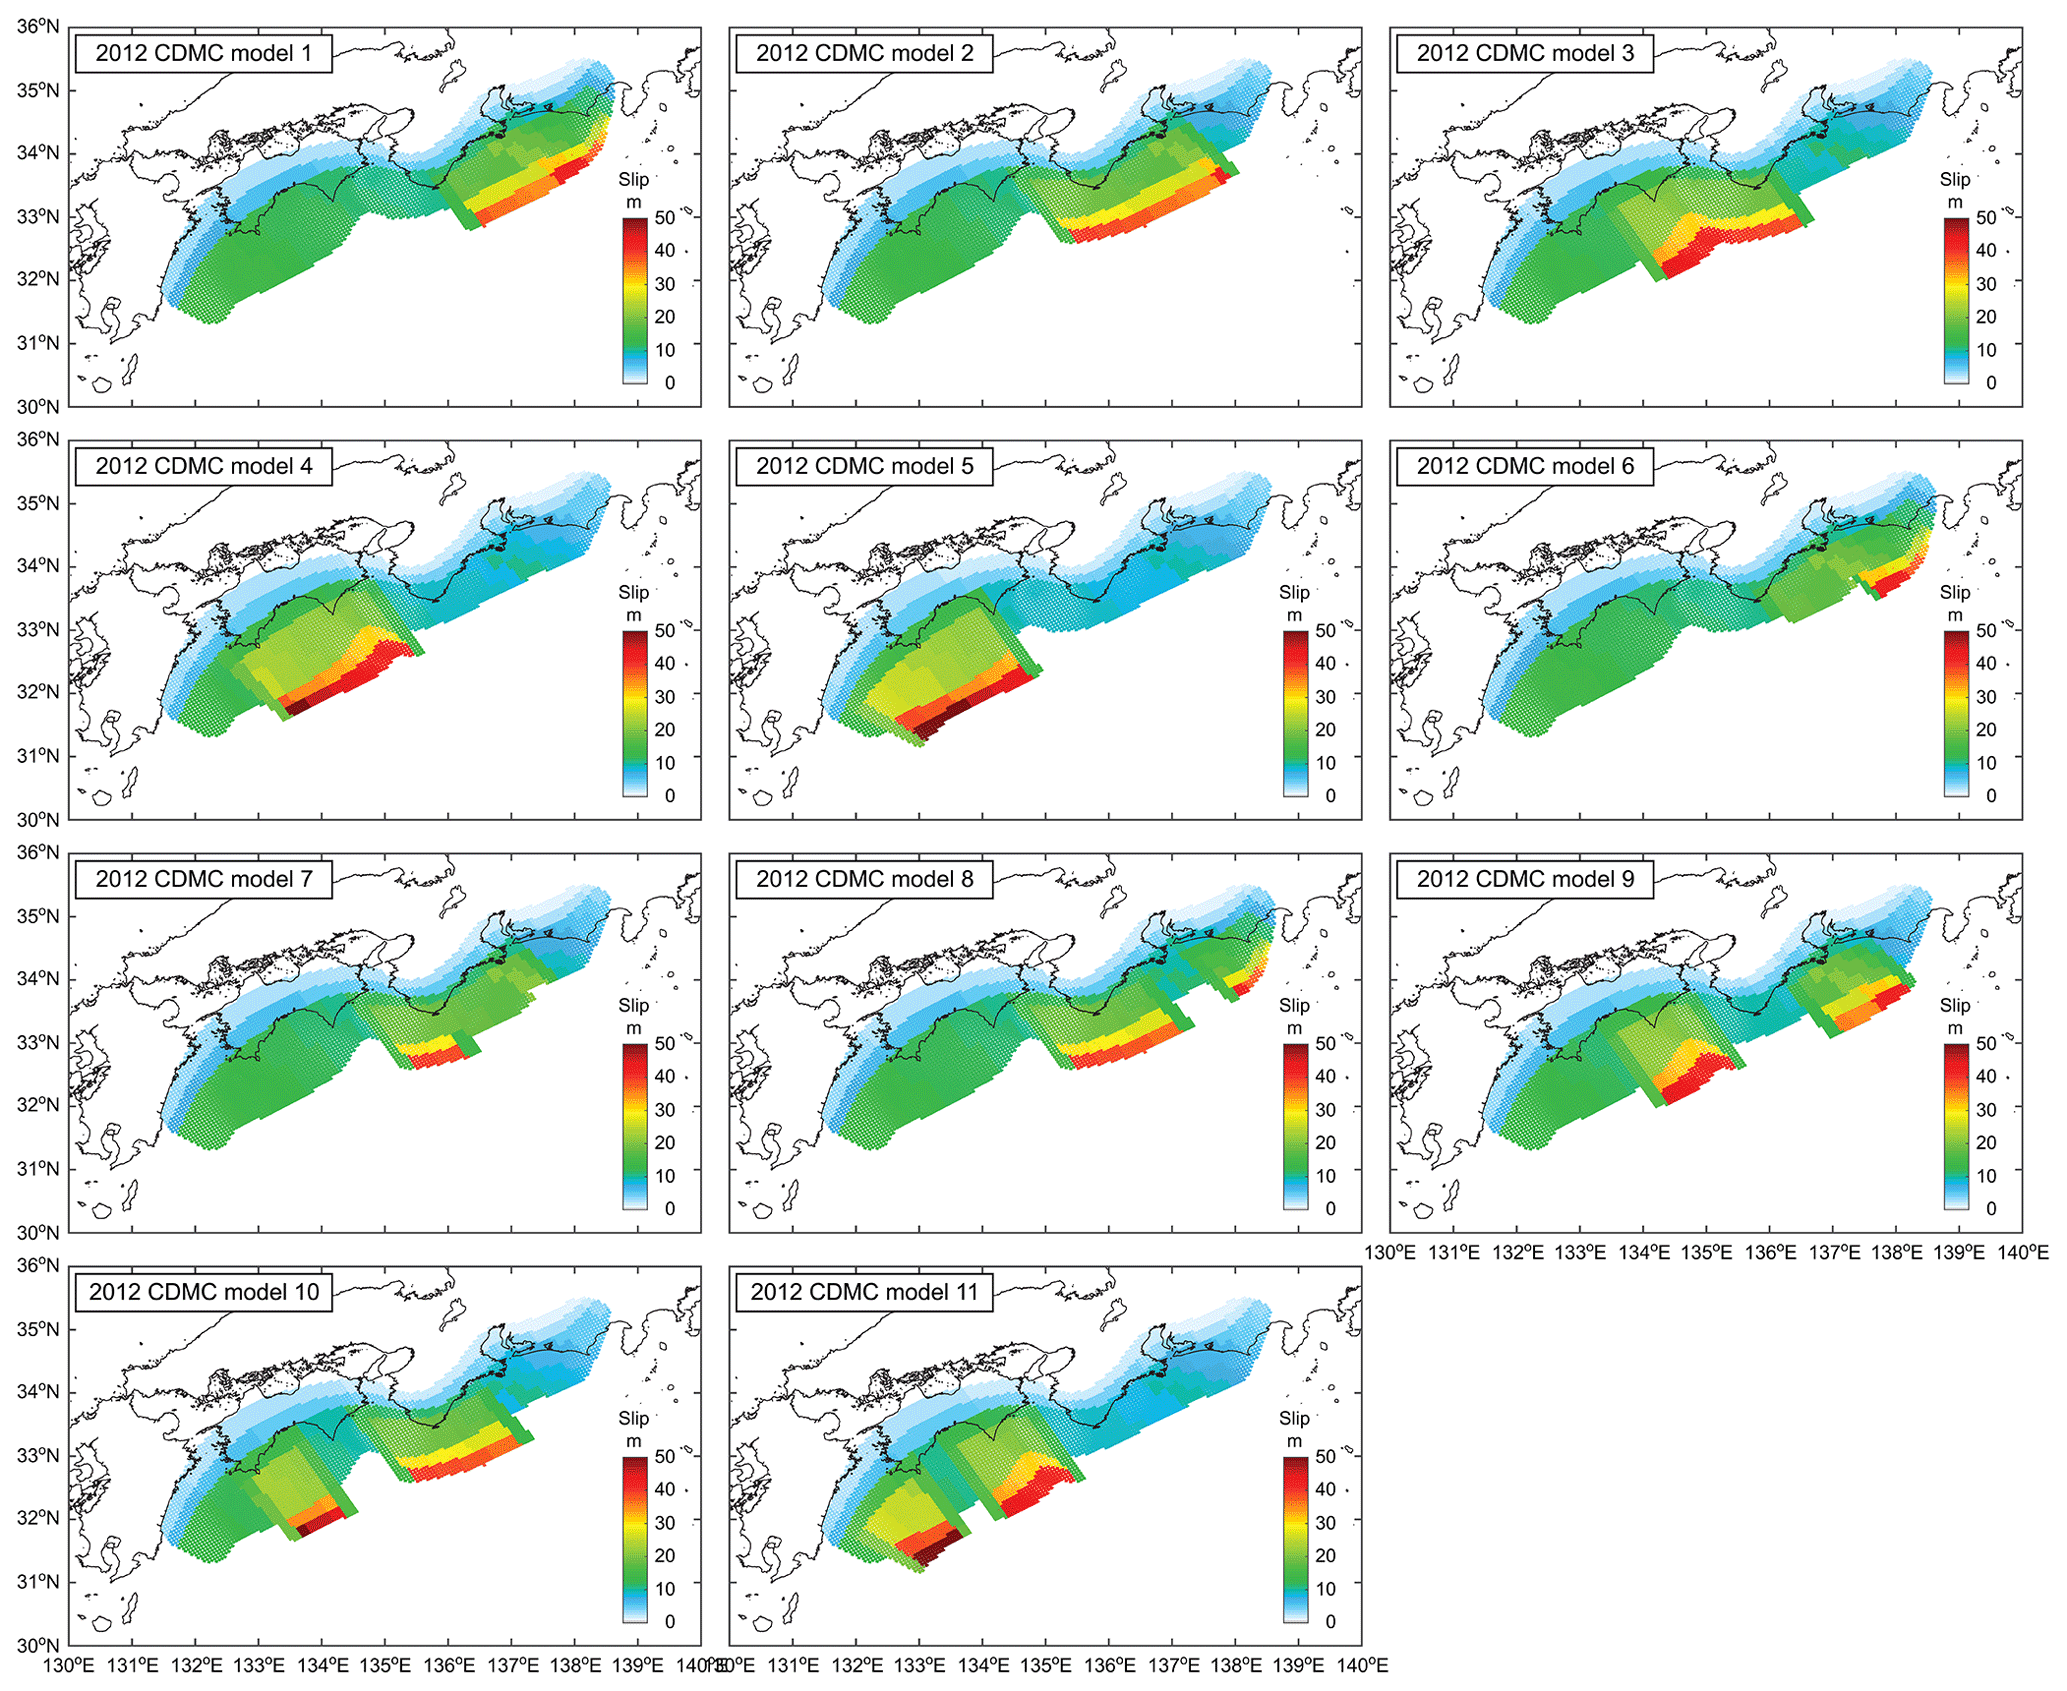
Figure 2The 2012 Central Disaster Management Council tsunami source models.
The 2012 CDMC tsunami source models take into account different rupture and asperity patterns across the entire region of the Nankai–Tonankai Trough through expert judgement (Fig. 2). The ruptures reach the accretionary wedge of the Nankai–Tonankai Trough, and the largest slip values of circa 52 m are considered. The significant movements of the accretionary wedge at the shallow part of the subduction interface are capable of generating massive tsunamis, as inferred from the 2011 Tohoku earthquake and tsunami (Lotto et al., 2019). The earthquake slip distributions of the 2012 CDMC models are spatially broader than inverted source models for the 2011 Tohoku earthquake and tsunami that show more concentrated slips (Iinuma et al., 2012; Satake et al., 2013) and are consistent with current geodetic estimates of inter-seismic coupling (e.g., Baranes et al., 2018; Watanabe et al., 2018). It is noteworthy that the 2012 CDMC models are intended for representing extreme rupture scenarios at national scale and are not sufficient for encompassing the variability of tsunami hazards at regional and local scales. Such variability is of critical importance when tsunami hazards at municipality and township levels are concerned. In other words, local extreme situations may not be captured by such national-level earthquake rupture scenarios. These considerations are essential for developing effective tsunami risk reduction and evacuation strategies for local municipalities.
Since one cannot predict how future megathrust events will unfold, evaluating tsunami hazards based on a broad set of possible earthquake rupture scenarios is a viable strategy for better disaster preparedness. Regional and local tsunami risk reduction actions should be informed by rigorous uncertainty analysis (e.g., Fukutani et al., 2015; Mueller et al., 2015; Park et al., 2017). However, there is no study for the Nankai–Tonankai megathrust events that evaluates the variability of tsunami profiles and inundation extents by considering numerous rupture scenarios and high-resolution elevation data. A study by Goda et al. (2018) may be considered as an exception which employs a stochastic source modelling method of Mai and Beroza (2002) for tsunami hazard assessments of the Nankai–Tonankai megathrust; however, that study is based on a coarse grid resolution of 90 m and 100 source models alone.
This study presents an extensive tsunami hazard assessment for the Nankai–Tonankai Trough events, focusing on the southwestern Pacific region of Japan. Numerical simulations are conducted for two magnitude ranges M8.9–9.1 and M8.7–8.9, each with 500 rupture models (1000 source models in total). Tsunami simulations are conducted at 90 and 10 m grid resolutions for Kochi Prefecture and the town of Kuroshio, respectively (Fig. 1). Kuroshio is one of the most exposed municipalities to a future Nankai–Tonankai megathrust event. The 10 m grid simulations allow detailed evaluations of tsunami inundation in coastal communities of Kuroshio. This is a significant improvement compared to Goda et al. (2018) whose source parameters were set to imitate the 2012 CDMC models and whose tsunami simulations were based on a 90 m grid resolution. In this study, rupture models for the Nankai–Tonankai earthquake are generated from statistical scaling relationships of earthquake source parameters and stochastic synthesis of earthquake slip distributions (Goda et al., 2016). The newly generated source models are more suitable for capturing the full range of possible earthquake ruptures of the Nankai–Tonankai megathrust, which is in agreement with a broad set of inverted source models for global subduction earthquakes (Mai and Thingbaijiam, 2014). The tsunami simulations are conducted by considering kinematic rupture processes, as well as the effects of defence structures along the coast. In this regard, estimated inundation results are more accurate than other studies that are based on coarse grid resolutions and ignore the coastal defence structures. To benchmark our tsunami simulation results, the 11 rupture models by CDMC (2012) are employed.
2.1 Tectonic characteristics
The Nankai–Tonankai Trough is the primary source of major offshore subduction earthquakes and tsunamis in western and central Japan. The driving tectonic mechanism of these seismic activities is the Philippines Sea Plate subducting underneath the Eurasian Plate with slip rates between 40 and 55 mm yr−1 (Loveless and Maede, 2010; Yokota et al., 2016). A megathrust subduction event occurs when the accumulated slips are released forcefully, and it is capable of triggering intense ground shaking and a massive tsunami. The potential rupture region of a future event can be inferred based on spatial distributions of slip deficit rates (Yokota et al., 2016; Baranes et al., 2018; Kimura et al., 2019). A large portion of the Nankai–Tonankai Trough has high slip deficit rates (i.e., locked) and thus can be used to determine the future tsunami scenarios (Watanabe et al., 2018).
The Nankai–Tonankai Trough region can be divided into six segments (Garret et al., 2016) as shown in Fig. 1. The geological evidence of the Hyuga-nada segment (Z in Fig. 1) is limited, and the current seafloor geodetic observations and numerical results indicate relatively low coupling in this segment (Yokota et al., 2016; Kimura et al., 2019). The Nankai segments (A–B in Fig. 1) ruptured many times in the past, and abundant evidence has shown that they are capable of producing high tsunami waves and large-scale coastal inundations (e.g., Tanigawa et al., 2018). The rupture history of the Tonankai segments (C and D in Fig. 1) is also well studied (e.g., Fujino et al., 2018); ruptures have resulted in widespread shaking and tsunami effects in the central Pacific region of Japan. Seismic imaging surveys conducted by Kodaira et al. (2006) indicated that the shallow fractured portion of the crust off the Kii Peninsula (between segment B and segment C) can serve as a physical boundary between the Nankai and Tonankai segments (e.g., the 1854 Ansei and 1944 and 1946 Showa events). On the other hand, the same study also indicated that the deeper portion of the crust underneath the Kii Peninsula is strongly coupled, and thus a large-scale synchronized rupture, such as the 1498 Meio and 1707 Hoei events, is possible, which would be analogous to the case of the 2011 Tohoku event. The Tokai segment (E in Fig. 1) ruptured synchronously with the Tonankai segments in the past and generated widespread geological evidence of large seismic events (e.g., Fujiwara et al., 2020).
2.2 2012 Central Disaster Management Council models
For tsunami hazard mapping of a future Nankai–Tonankai megathrust event, the CDMC developed 11 tsunami source models by considering that the synchronized rupture over multiple segments is possible and that the magnitude of a future Nankai–Tonankai earthquake can be as large as M9.1 (Fig. 2). The models are intended to represent extreme scenarios that can be used for coordinating various disaster preparedness actions (i.e., coastal defence structures and evacuation planning). Since the 2012 CDMC models are relevant for tsunami hazard and risk assessments in western and central Japan and since stochastic source models for future Nankai–Tonankai megathrust events are developed in Sect. 3 by referring to the fault plane geometry of the 2012 CDMC models, their key features are summarized in the following.
The entire fault plane of the 2012 CDMC models is represented by a set of 5773 sub-faults, each sub-fault having a size of 5 km by 5 km. The fault plane consists of the main subduction interface (5669 sub-faults) and the Kumano splay fault (104 sub-faults, which are located in segment C around a depth contour of 5 km), and geometrical parameters (i.e., strike, dip, and rake) of these sub-faults are variable over the curved, steepening fault plane along the dip direction. The total fault-plane area is approximately 1.44×10⁵ km2. The top-edge depths of sub-faults along the Nankai–Tonankai Trough are set to 0 km (see Fig. 1). The shallow parts of the fault plane represent the accretionary wedge of the Nankai–Tonankai Trough. In determining the average slip D over the fault plane via (i.e., circular crack model; Madariaga and Ruiz, 2016), where S is the fault-plane area and μ is the rock rigidity (=40.9 GPa), the average stress drop Δσ of 3.0 MPa is used based on the past M8–9 subduction-type events (i.e.,the 1944 Tonankai, 1946 Nankai, 2003 Tokachi-oki, 2004 Sumatra, 2010 Chile, and 2011 Tohoku events). The average slips of the 11 source models range between 8.8 and 11.2 m. The moment magnitude is approximately 9.1, with the corresponding seismic moment ranging between 5.3×10²² and 6.7×10²² Nm.
To determine the slip distributions of the 2012 CDMC source models, two types of asperity, i.e., large and very large, are considered. The large slip areas take up circa 20 % of the entire fault plane with an average slip value twice as large as the average slip over the fault plane, whereas the very large slip areas take up circa 5 % of the entire fault plane with an average slip value 4 times as large as the overall average slip. The large slip areas are positioned at depths shallower than 20 km, and the very large slip areas are positioned at depths less than 10 km within the large slip areas. Among the 11 models (Fig. 2), models 1 to 5 have a single asperity region (i.e., large and very large slip areas) with slips concentrated in segments C–E, B–D, B and C, A–B, and Z–B, respectively. Models 6 and 7 take into account the splay fault in Kumano Sea with the asperity in segments D and E or in segment B. Models 8 to 11 consider two asperities in segments C–E, B–D, A and C, and Z–B, respectively. The rupture nucleation is set to occur near the center of an asperity region at a depth of about 20 km, and it varies for individual cases. The slip values for individual sub-faults are determined based on spatially varying convergence rates at the sub-faults given that the total slip amount (or seismic moment) within the large slip and very large slip areas is conserved according to the above-mentioned average slip values. In the tsunami source models, a kinematic rupture is represented by a set of earthquake slip distributions (with temporal interval of 10 s) by considering the rupture propagation velocity equal to 2.5 km s−1 and the rise time of individual sub-faults equal to 60 s. The rupture durations of the 11 models are between 4 and 5 min.
Stochastic tsunami simulations for the Nankai–Tonankai megathrust events require the generation of multiple earthquake rupture models that are suitable for representing geometrical characteristics and spatial slip distributions for the target region. The rupture geometry, such as length and width, and average and maximum slips over a fault plane typically scale with earthquake magnitude (e.g., Murotani et al., 2013; Thingbaijiam et al., 2017), whereas the spatial slip distributions can be specified by wavenumber spectral functions (e.g., Mai and Beroza, 2002). To determine the main source parameters, statistical scaling relationships of the eight source parameters (i.e., fault length, fault width, mean slip, maximum slip, power transformation parameter for the marginal slip values, along-strike correlation length, along-dip correlation length, and Hurst number) that are developed based on a large number of inverted source models of the past major earthquakes can be employed (Goda et al., 2016). Subsequently, the stochastic simulation of constrained random slip distributions is performed to generate 500 earthquake rupture models for the two magnitude ranges M8.9–9.1 and M8.7–8.9. The synthesized earthquake rupture models are used to conduct tsunami run-up simulations for coastal communities in Kochi Prefecture and to quantify the anticipated variability of tsunami inundation due to the future tsunamigenic earthquakes. This section outlines numerical methods to perform stochastic tsunami simulations for the Nankai–Tonankai megathrust events. Because these procedures were explained elsewhere (e.g., Goda et al., 2016, 2018) in detail, explanations are kept succinct. Figure 3 outlines the numerical steps of the stochastic tsunami simulations.
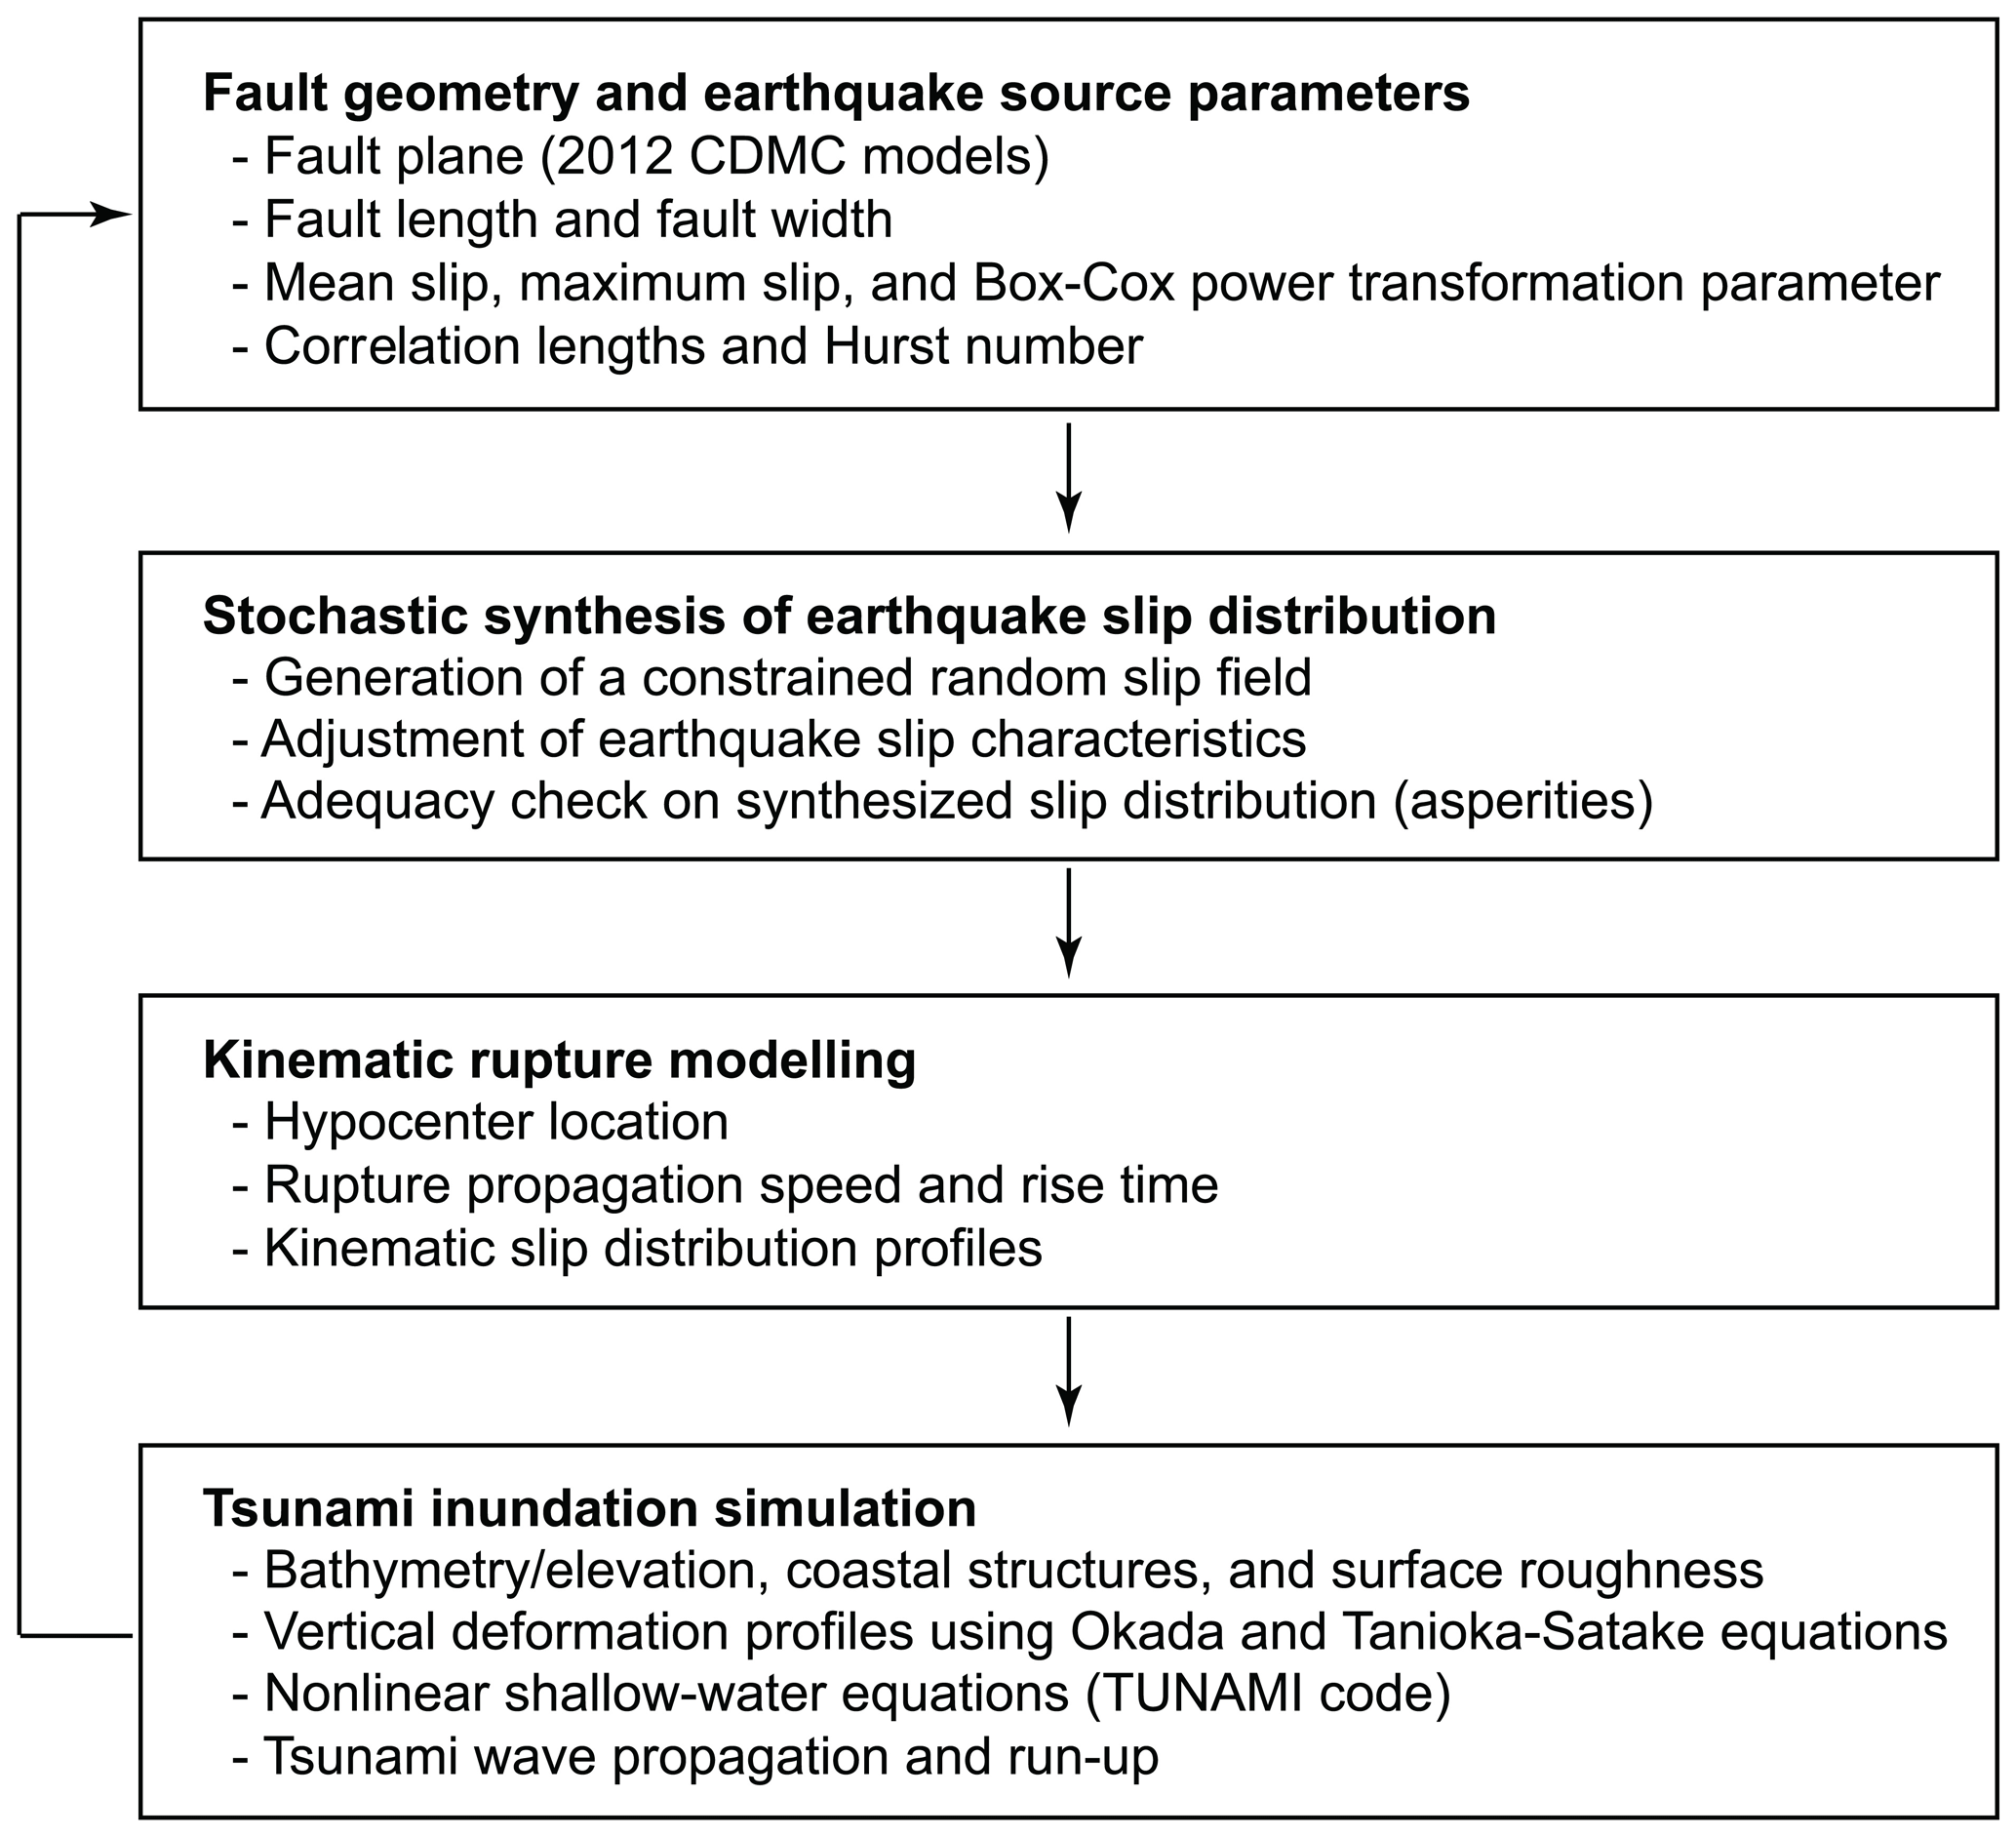
3.1 Stochastic rupture model
In generating the stochastic rupture models for the Nankai–Tonankai megathrust events, the 2012 CDMC fault plane (Fig. 1) is adopted as a baseline. Both strike and dip angles of sub-faults, each having a dimension of 5 km by 5 km, are variable and reflect the current tectonic setting in the Nankai–Tonankai Trough region (Hirose et al., 2008). These features are retained in the stochastic rupture models. Specifically, the sub-faults of the 2012 CDMC model are mapped onto a 2D (rectangular) matrix, noting that sub-faults for the Kumano splay fault are excluded. The size of the 2D matrix is 153 (along-strike) by 53 (down-dip), and its origin is set to the southwestern corner (upper-left) of the fault plane.
Because the fault length L, fault width W, and mean slip D are interrelated for a given seismic moment via M0=μLWD, values of these source parameters and other related earthquake slip distribution parameters, such as maximum slip, power parameter for the marginal slip distribution, along-strike and along-dip correlation lengths, and Hurst number, are generated from the statistical scaling relationships developed by Goda et al. (2016). These parameters are represented by the multi-variate lognormal distribution with a correlation structure that is determined based on the existing inverted source models of the major earthquakes (Mai and Thingbaijiam, 2014). We do not allow extreme realizations of these source parameters; for this purpose, if any of the eight source parameters falling outside of an interval between mean ±2 standard deviations, the values of the source parameters are resampled. Moreover, additional checks of the sampled source parameters are made by ensuring that the aspect ratios of the fault plane are adequate for the Nankai–Tonankai Trough (i.e., falling between 0.75 and 4.0) and that the ratios of correlation lengths to fault dimensions are consistent with empirical ranges of 0.15 and 0.6 for the strike direction and 0.15 and 0.45 for the dip direction. Once a suitable fault geometry is determined, the fault plane is placed by randomly selecting a location in the upper-left corner of the simulated fault plane such that it fits within the overall fault plane of the 153 by 53 rectangular matrix.
For a given fault plane geometry, the earthquake slip distribution is determined based on marginal slip statistics and spatial slip distribution parameters. A candidate slip distribution is first simulated from an anisotropic 2D von Kármán wavenumber spectrum with its amplitude spectrum being parameterized by along-strike correlation length, along-dip correlation length, and Hurst number and its phase being randomly distributed between 0 and 2π (Mai and Beroza, 2002). The simulated slip distribution is modified via a Box–Cox power transformation to achieve the desirable right-skewed feature of the slip marginal distribution (Goda et al., 2016). At this stage, a taper function is applied to deeper segments of the fault plane similar to the 2012 CDMC models. In particular, slip values for sub-faults having top-edge depths of 25–27, 27–29, 29–31, 31–33, and 33–35 km are multiplied by the reduction factors of 0.9, 0.7, 0.5, 0.3, and 0.1, respectively. Subsequently, slip values of the sub-faults that are not within the original 2012 CDMC models are set to zero, and all eligible slip values are scaled to match the mean slip.
To ensure that the simulated earthquake slip distribution has realistic characteristics for the Nankai–Tonankai megathrust events, several checks on the simulated slip distribution are conducted. The maximum slip of the simulated earthquake slip distribution is required to be less than 77 and 57 m for M8.9–9.1 and M8.7–8.9 scenario magnitudes, respectively. The above threshold values of the maximum slip correspond to the mean plus 2 standard deviations of the predicted maximum slip using the scaling relationship by Goda et al. (2016) for the central magnitude values (i.e., M9.0 and M8.8). These maximum slip values are large but are still consistent with those reported for the 2011 Tohoku earthquake (Iinuma et al., 2012; Satake et al., 2013). In addition, we ensure that the maximum slip does not occur at sub-faults deeper than 20 km and that at least 60 % of the total earthquake slip occurs within sub-faults shallower than 10 km (Fig. 1). In other words, the major asperities are constrained to occur in the shallow part of the subduction interface. This is consistent with how asperities are assigned in the 2012 CDMC models (Sect. 2.2) and is deemed suitable for generating stochastic rupture models for the megathrust subduction events. If the candidate slip distribution does not meet all criteria, this model is discarded, and another slip distribution is generated. This process is repeated until an acceptable source model is obtained.
In modelling the Nankai–Tonankai megathrust events, a kinematic rupture is taken into account (Goda et al., 2018). The probability density functions for hypocenter locations are defined based on the statistical models developed by Mai et al. (2005). The preliminary probability density functions for hypocenter locations are specified based on the fault dimensions and the mean and maximum slip ratios. Subsequently, further constraints are placed to exclude unlikely hypocenter locations for a given slip distribution using the empirical findings of Mai et al. (2005). By combining the preliminary probability density functions and the constraints, the final probability density function for hypocenter locations is obtained. This is used to sample the location of hypocenters. Using the randomly generated rupture propagation velocity and rise time, the kinematic rupture process of the synthesized slip distribution can be simulated. In this kinematic rupture modelling, the rupture propagation velocity is characterized by a truncated normal variable with mean equal to 2.5 km s−1 (based on the 2012 CDMC models), standard deviation equal to 0.5 km s−1, and lower and upper bounds equal to 2.0 and 3.0 km s−1 (note that the standard deviation and the lower and upper bounds are assumed). The rise time is characterized by a truncated normal variable with mean equal to 60 s (based on the 2012 CDMC models), standard deviation equal to 10 s, and lower and upper bounds equal to 50 and 70 s for the M8.9–9.1 scenarios (note that the standard deviation and the lower and upper bounds are assumed). The rise time for the M8.7–8.9 scenarios is modelled in a similar manner but with a reduced mean rise time of 50 s and lower and upper bound values of 40 and 60 s. The kinematic rupture parameters are set to be constant for all sub-faults. The kinematic rupture parameters are consistent with the 2012 CDMC models.
Finally, by repeating the above-mentioned procedure for earthquake rupture modelling 500 times for the two magnitude ranges M8.9–9.1 and M8.7–8.9, a set of 1000 earthquake rupture models is generated. These rupture models are used to perform Monte Carlo tsunami inundation simulations.
3.2 Tsunami inundation simulation
For a given earthquake rupture model, the following calculation steps are implemented to evaluate various tsunami hazard characteristics and parameters, such as wave profiles at offshore locations, maximum tsunami heights along coastal lines, and maximum inundation depths at onshore locations (see Sect. 4). The numerical tsunami inundation analysis follows a standard procedure, namely, computing a vertical dislocation of seawater triggered by an earthquake rupture (Okada, 1985; Tanioka and Satake, 1996) and solving nonlinear shallow water equations for tsunami wave propagation and run-up (Goto et al., 1997).
To represent a computational domain of the tsunami inundation simulations accurately, a complete dataset of bathymetry and elevation, coastal and riverside structures (e.g., breakwater and levees), and surface roughness is obtained from the Japanese Cabinet Office (same as the 2012 CDMC models). The data are provided in the form of six nested grids following a 1∕3 nesting ratio rule, i.e., 2430–810–270–90–30–10 m. The coarse grid regions of 2430 and 810 m cover the geographical regions of the Nankai–Tonankai Trough and western to central Japan (Fig. 1), whereas the fine grid regions of 30 and 10 m cover low-lying land areas along the coast. In this study, two grid levels are focused on. For regional offshore tsunami modelling in Kochi Prefecture, nested grid systems of up to 90 m resolution are adopted, whereas for local onshore inundation modelling in Kuroshio, nested grid systems of up to 10 m resolution are considered.
The ocean-floor topography data are based on the 1:50 000 bathymetric charts and JTOPO30 database developed by the Japan Hydrographic Association and the nautical charts developed by the Japan Coastal Guard. The land elevation data are based on the 5 m grid digital terrain model derived from airborne laser surveys and aerial photographic surveys by the Geospatial Information Authority of Japan. The terrain data are associated with measurement errors of standard deviations less than 1.0 m horizontally and of 0.3 to 0.7 m vertically. The reference elevation of the bathymetry and terrain data is the standard altitude in Japan (Tokyo Peil), and no variation of sea levels is taken into account in the tsunami simulations. Tokyo Peil is close to the mean sea level and is typically within 0.2 m differences, depending on location.
The elevation data of the coastal/riverside structures are provided by municipalities and supplemented by the national coastline database. In the coastal/riverside structural dataset, structures having dimensions less than 10 m are represented, whereas those having dimensions greater than 10 m are included in the elevation data. In the tsunami simulation, the coastal/riverside structures are represented by vertical walls at one or two sides of the computational cells. To evaluate the volume of water that overpasses these walls, overflowing formulae of Honma (1940) are employed for coastal breakwater modelling at sub-grid scales. The failures of the coastal/riverside structures are not considered in the simulations. On the other hand, the bottom friction is evaluated using Manning's formula following the Japan Society of Civil Engineers standard (JSCE, 2002). The Manning's coefficients are assigned to computational cells based on national land use data in Japan: 0.02 m s for agricultural land, 0.025 m s for ocean water, 0.03 m s for forest vegetation, and 0.04 m s for residential areas.
The vertical dislocation profile of seawater due to an earthquake rupture is computed using Okada equations (Okada, 1985) evaluated at a 810 m grid resolution. To account for the effects of horizontal movements of steep seafloor on the vertical dislocation of seawater, a method proposed by Tanioka and Satake (1996) is implemented. To alleviate the abrupt changes in the vertical dislocation of seawater, a spatial smoothing filter of 9 cells by 9 cells is employed in a similar way to the 2012 CDMC models. To represent the kinematic rupture process in a tsunami simulation, these vertical dislocation profiles are evaluated at every 10 s and are used as input in the simulation.
The tsunami modelling is carried out using a well-tested TSUNAMI code (Goto et al., 1997) that solves the nonlinear shallow water equations using a leap-frog staggered-grid finite difference scheme which is capable of generating offshore tsunami propagation and onshore run-up. The run-up calculation is based on a moving boundary approach (JSCE, 2002), in which a dry/wet condition of a computational cell is determined based on total water depth relative to its elevation. The numerical tsunami calculation is performed for a 3 h duration which is sufficient to model the most critical phase of tsunami waves for the Nankai–Tonankai scenarios. The multi-domain nesting from coarse to fine resolution is conducted to consider large to small scale tsunami waves, depending on water depth. The time-stepping intervals for the regional (90 m) and local (10 m) tsunami simulations are set to 0.5 and 0.1 s, respectively, to satisfy the Courant–Friedrichs–Lewy condition. Moreover, the effects of ground deformation are taken into account by adjusting the elevation data prior to the tsunami simulation run. However, the effects of tidal variations (e.g., mean high water level) are not considered in the simulations.
This section presents the uncertainty quantification of tsunami inundation assessments for Shikoku Island and Kochi Prefecture (regional focus) and for Kuroshio (local focus) subjected to stochastic rupture events originating from the Nankai–Tonankai Trough. The magnitude ranges of the stochastic rupture models are M8.9–9.1 and M8.7–8.9 (500 source models for each range) and are consistent with the synchronized ruptures of the historical events and the 2012 CDMC models. Figure 4 shows elevation maps of Shikoku Island (Kochi is a prefecture facing the Pacific) and Ogata and Saga districts (which are local communities in Kuroshio; see also Fig. 1). In the local maps of the Ogata and Saga districts, the locations of residential buildings are included to indicate the population exposure in these local communities. There are vertical evacuation towers in the Ogata and Saga districts, and their photos are shown in Fig. 4d and e.
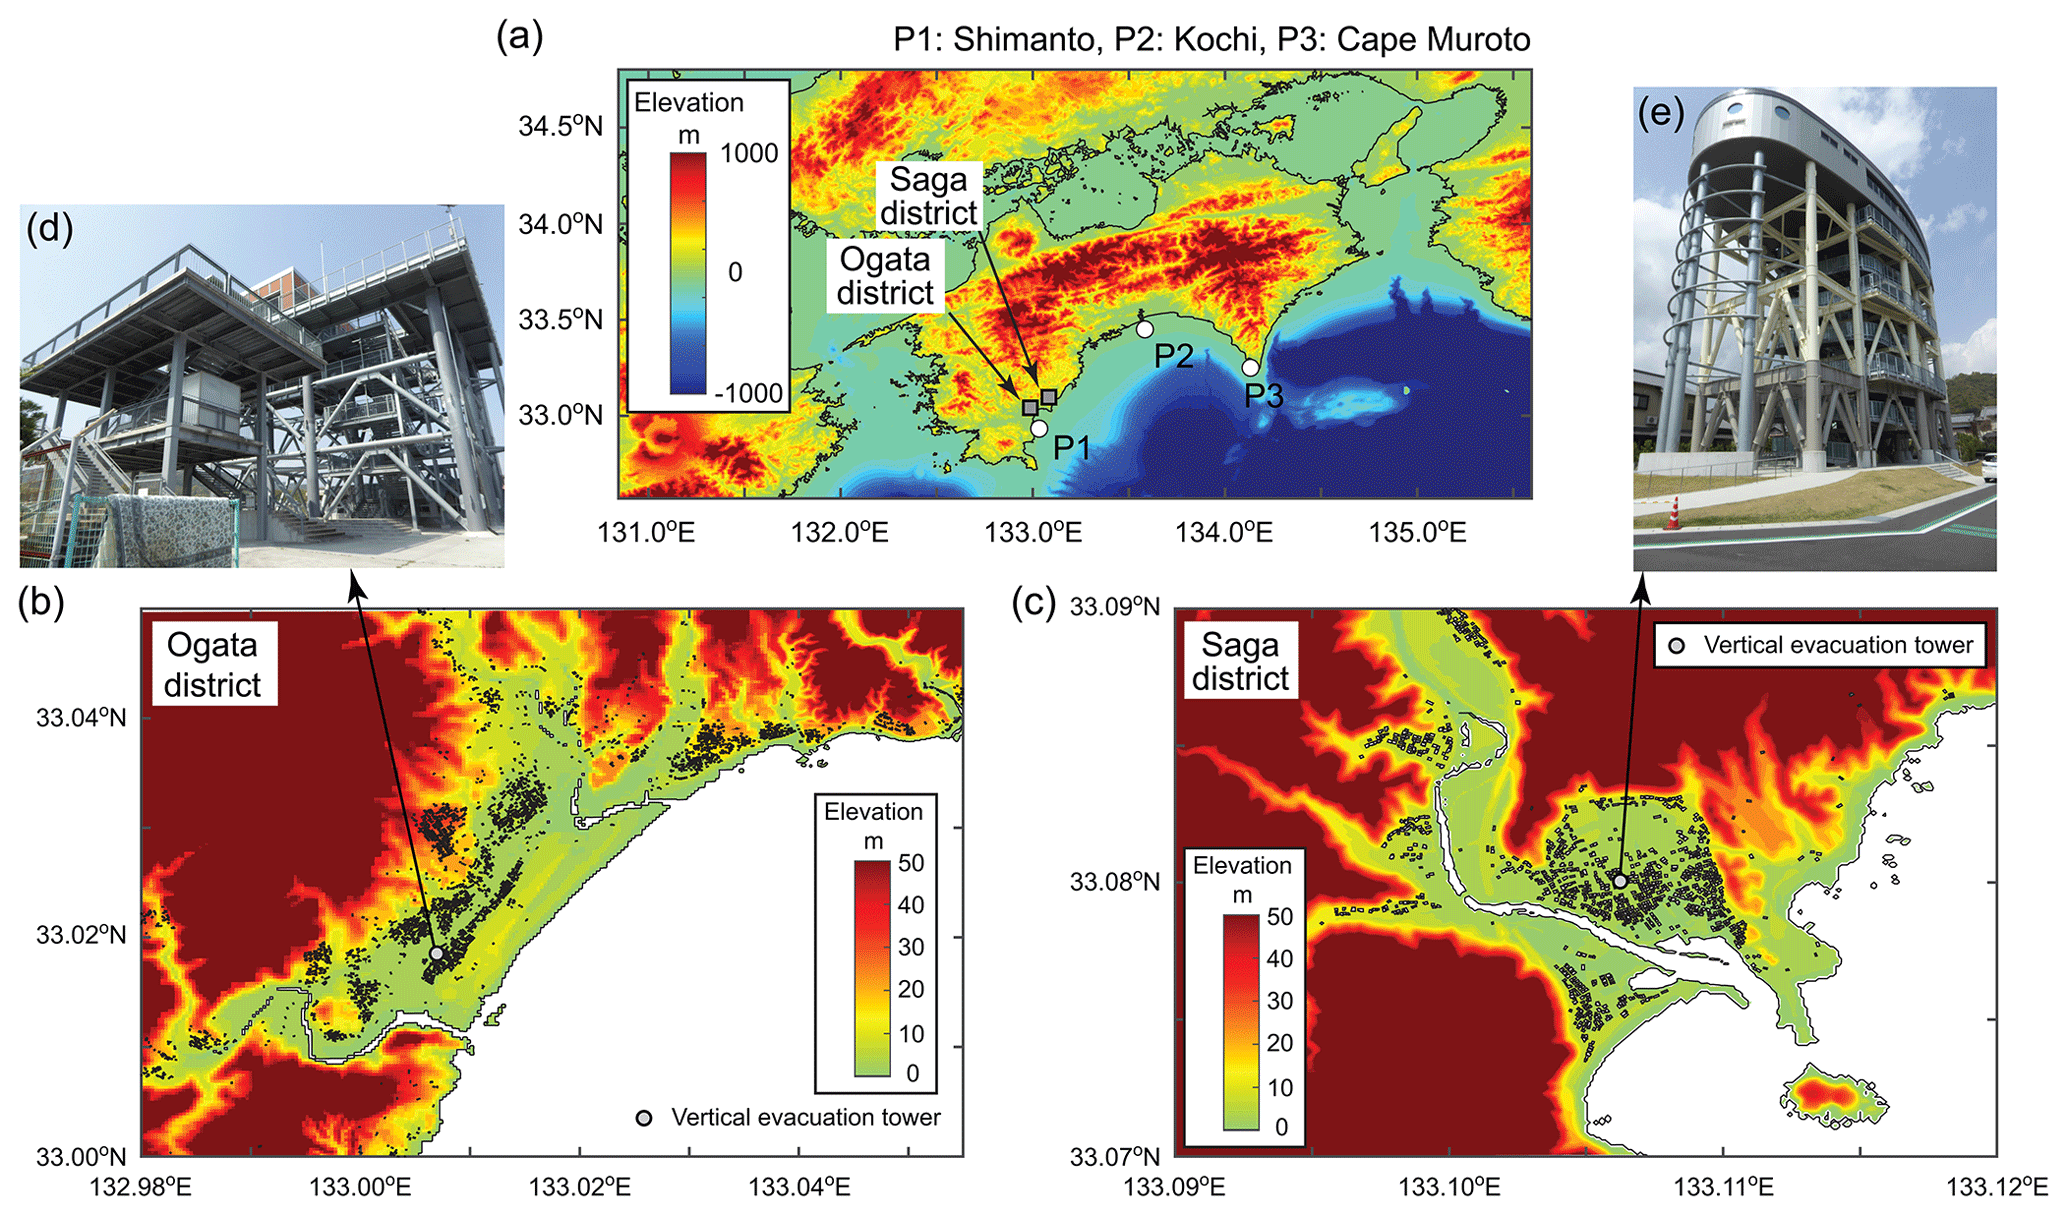
Figure 4Elevation maps of (a) Shikoku Island, (b) Ogata district, and (c) Saga district. In (b) and (c), the locations of residential buildings are shown as polygons. The photos in (d) and (e) are the vertical evacuation towers in the Ogata and Saga districts. The Ogata and Saga districts are located in Kuroshio, Kochi Prefecture. The locations of Kuroshio and Kochi Prefecture are indicated in Fig. 1.
In Sect. 4.1, offshore wave profiles and maximum tsunami heights of the stochastic tsunami simulations are discussed in comparison with the counterparts based on the 2012 CDMC models. In Sect. 4.2, tsunami inundation areas in Shikoku and Kuroshio are adopted as regional and local tsunami hazard metrics, respectively, and their relationships with earthquake source characteristics, such as moment magnitude and regional concentration of earthquake slip, are investigated. In Sect. 4.3, tsunami inundation characteristics in the Ogata and Saga districts are focused on. In particular, the severity of local tsunami hazards in these districts is examined by evaluating critical tsunami scenarios.
4.1 Offshore tsunami profiles and maximum tsunami heights
To evaluate the regional tsunami hazard characteristics for Shikoku Island (mainly Kochi Prefecture), offshore tsunami wave profiles at three locations, indicated as P1–P3 in Fig. 4a, are examined in Fig. 5. These locations are near the city of Shimanto, the city of Kochi, and Cape Muroto and are at sea depths of 36, 45, and 70 m, respectively. For each of the two magnitude ranges M8.9–9.1 and M8.7–8.9, tsunami wave profiles based on 500 stochastic models are shown with grey colours, the 50th percentile curve is shown with a solid red line, and the 10th and 90th percentile curves are shown with broken red lines, whereas the simulated wave profiles based on the 2012 CDMC models are shown with blue curves. The temporal surface wave profile results shown in Fig. 5 are based on a 90 m resolution.
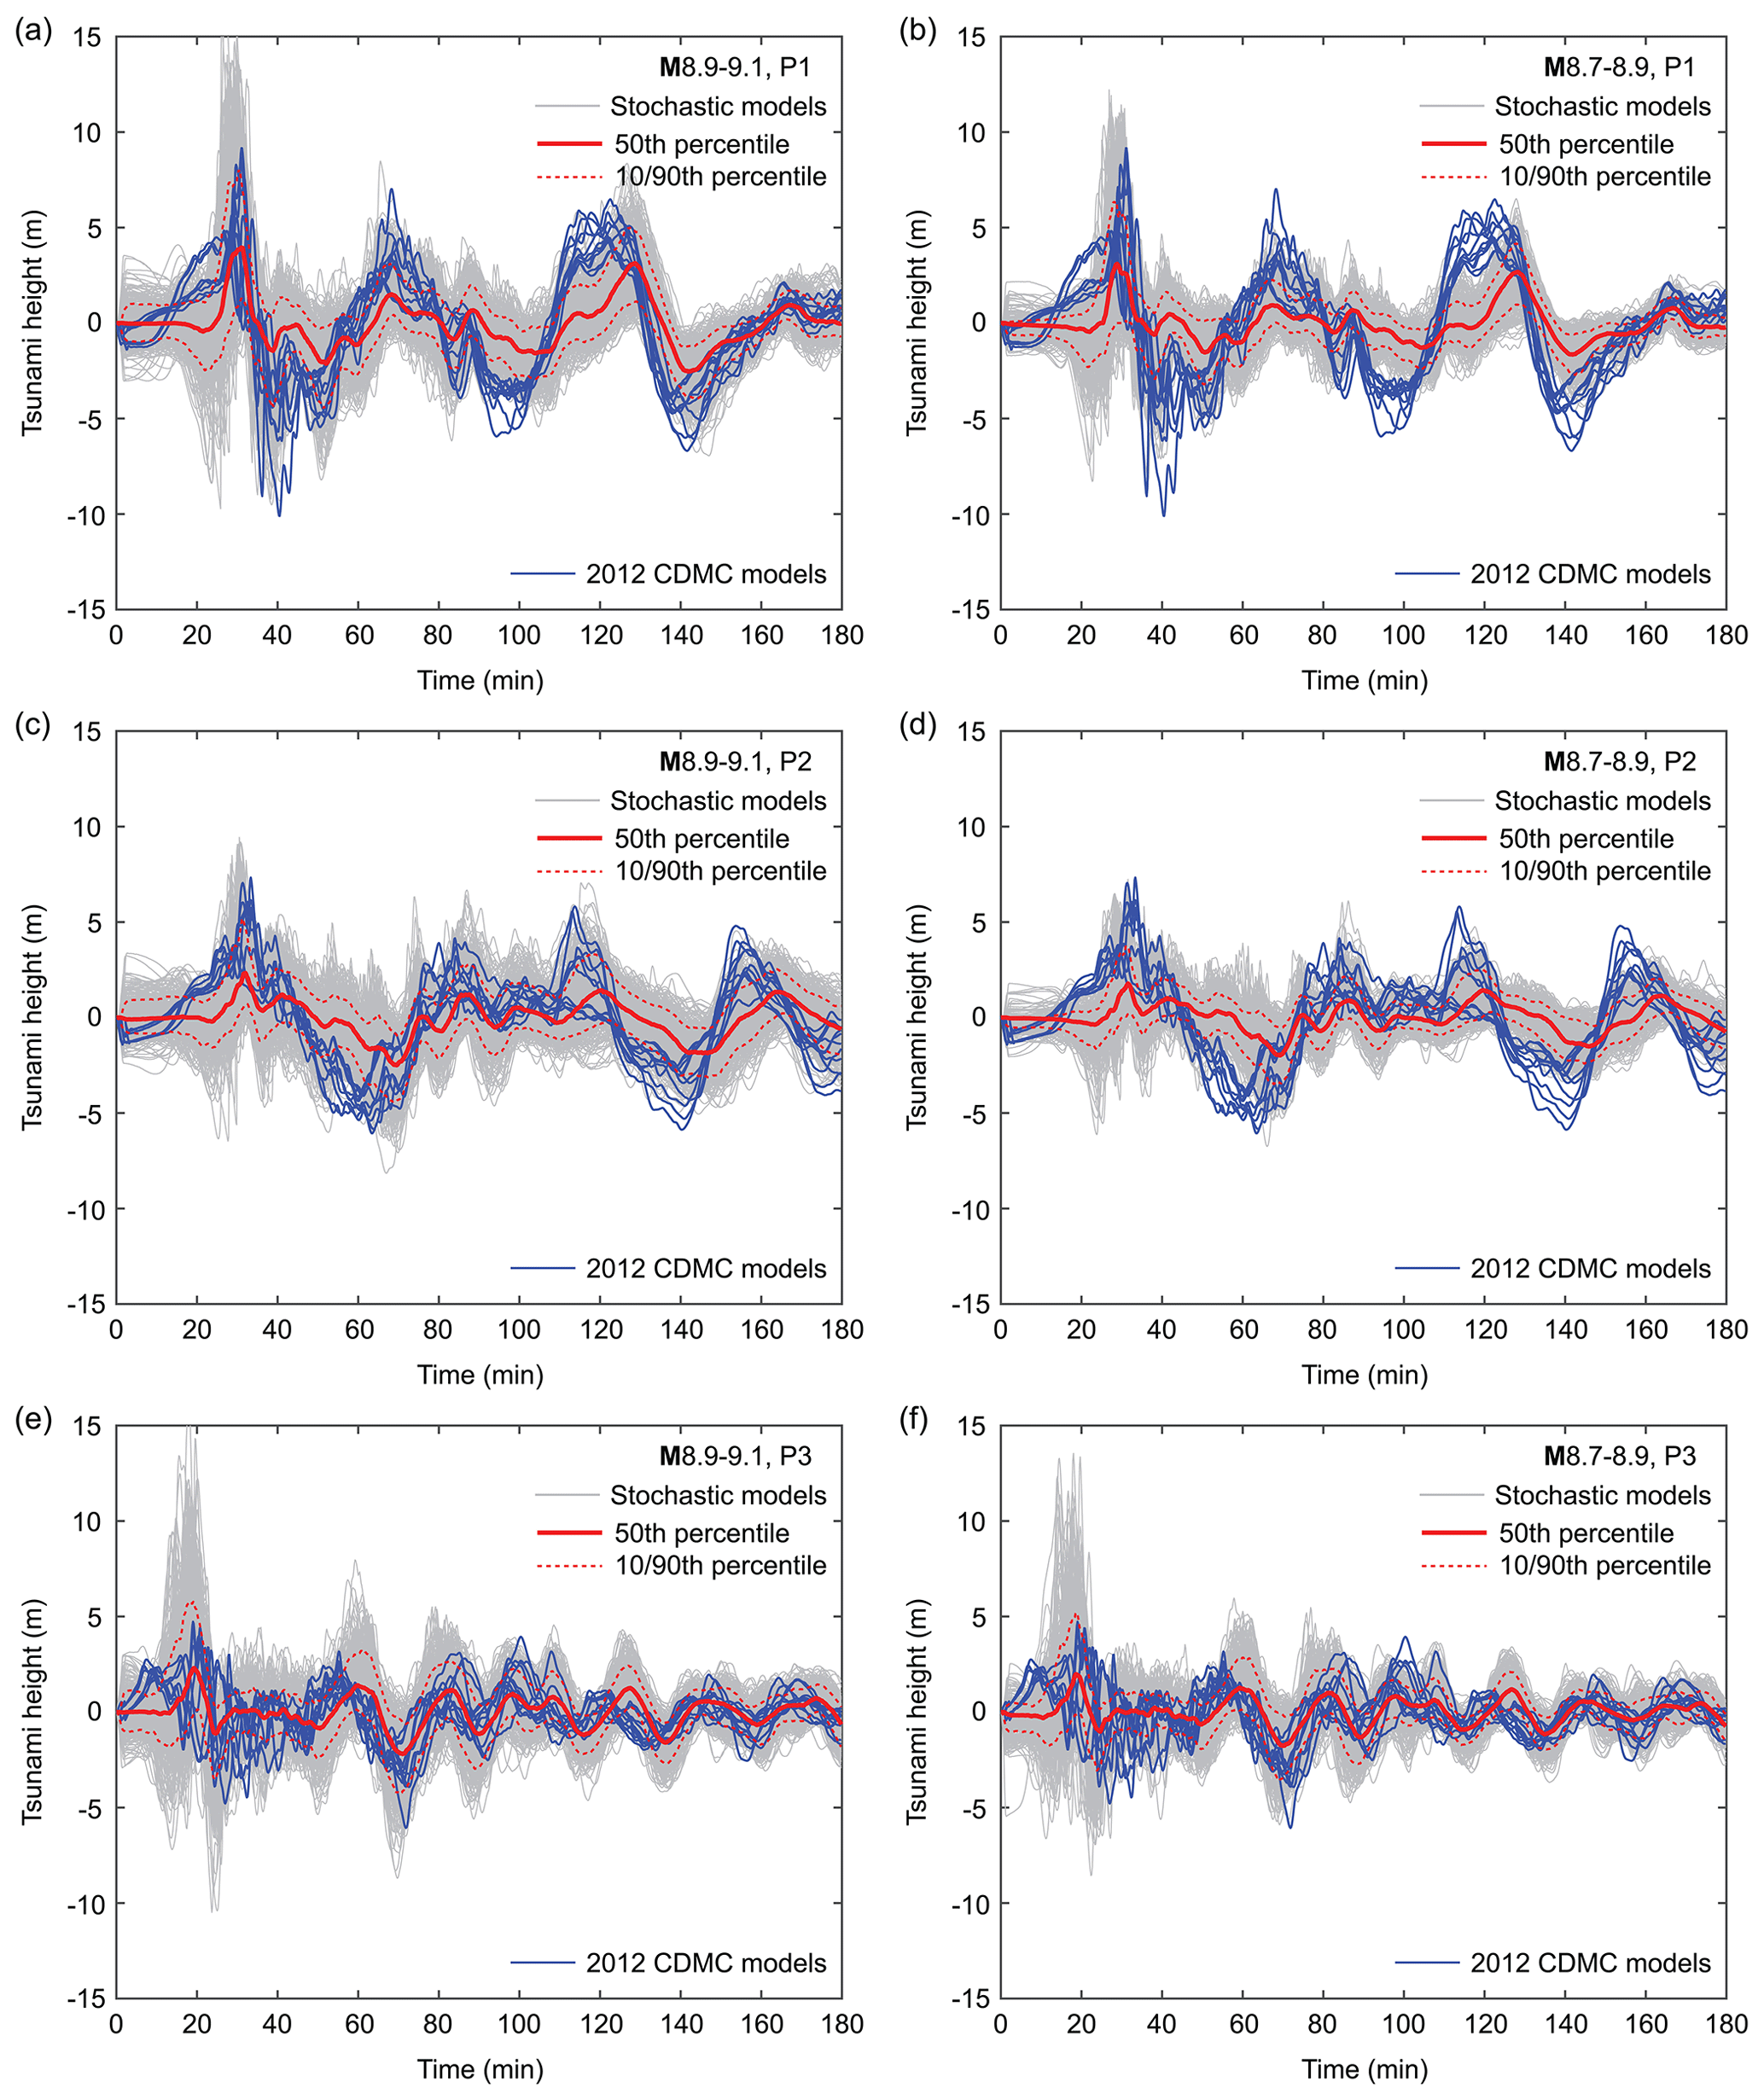
Figure 5Offshore tsunami wave profiles at P1–P3 (Fig. 4a) for the two magnitude ranges M8.9–9.1 (a, c, e) and M8.7–8.9 (b, d, f). In each figure panel, wave profiles based on 500 stochastic models are shown with grey colours, the 50th percentile curve is shown with solid red line, and the 10th and 90th percentile curves are shown with broken red lines. The blue curves correspond to the simulated wave profiles based on the 2012 CDMC models.
The largest first tsunami heights reach 16.8, 9.5, and 16.6 m at P1–P3, respectively, for the M8.9–9.1 cases. The maximum first tsunami heights for the M8.7–8.9 cases are smaller than those of the M8.9–9.1 cases (approximately 80 %), but these waves are still very large and destructive. The simulated wave profiles based on the 2012 CDMC models (blue curves) fall within the ranges of the stochastic simulation results for the M8.9–9.1 cases (grey curves). As expected, the former is closer to the maximum–minimum envelope of the latter. Moreover, the similarity of the stochastic simulation results and the 2012 CDMC model results depends on the locations. For instance, at P1 and P2, these two sets of the modelled wave profiles based on different approaches are similar, whereas they differ significantly at P3 (i.e., the 2012 CDMC simulation results are less than a half of the most extreme case of the stochastic simulation results). Hence, for these offshore locations, the stochastic tsunami simulation results can accommodate those based on the deterministic tsunami scenarios defined by the CDMC. This observation is generally applicable to other offshore locations that are inspected as part of this study. Although the 10th and 90th percentile wave profiles of the stochastic simulations (broken red curves) are generally smaller than those based on the 2012 CDMC models (blue curves) (Fig. 5), it should not be concluded that the results based on the 2012 CDMC models are more extreme than the top 10 % of the stochastic simulation results. This is because the phases of the tsunami wave profiles vary and depend on the earthquake rupture characteristics.
Subsequently, to compare the maximum tsunami heights at near-shore locations along the coast of Shikoku Island based on the stochastic tsunami models and the 2012 CDMC models, 154 observation points are set up starting from Sukumo in Kochi Prefecture to Naruto in Tokushima Prefecture (Fig. 6a). The extracted near-shore maximum tsunami height results shown in Fig. 6 are based on a 90 m resolution. The water depths at these observation points are at sea depths of approximately 5 to 10 m. Figure 6b and c plot the maximum tsunami heights along the coast for the two magnitude ranges M8.9–9.1 and M8.7–8.9, respectively. The plots of the maximum tsunami heights along the coast indicate that the stochastic tsunami simulation results exhibit significant variations of the maximum tsunami heights depending on the localities of the sites and reveal significant variability at individual locations. It can be observed that the maximum tsunami heights along the western coast of Kochi Prefecture (site ID 1 to 40) are generally greater than those along the central and eastern coasts of Kochi Prefecture (site ID 40 to 80 and site ID 80 to 130, respectively). On the other hand, the maximum tsunami heights in Tokushima Prefecture (site ID 130 to 154) are significantly lower than those in Kochi Prefecture (site ID 1 to 130) because tsunami waves from the main earthquake source regions are less likely to hit Tokushima Prefecture directly.
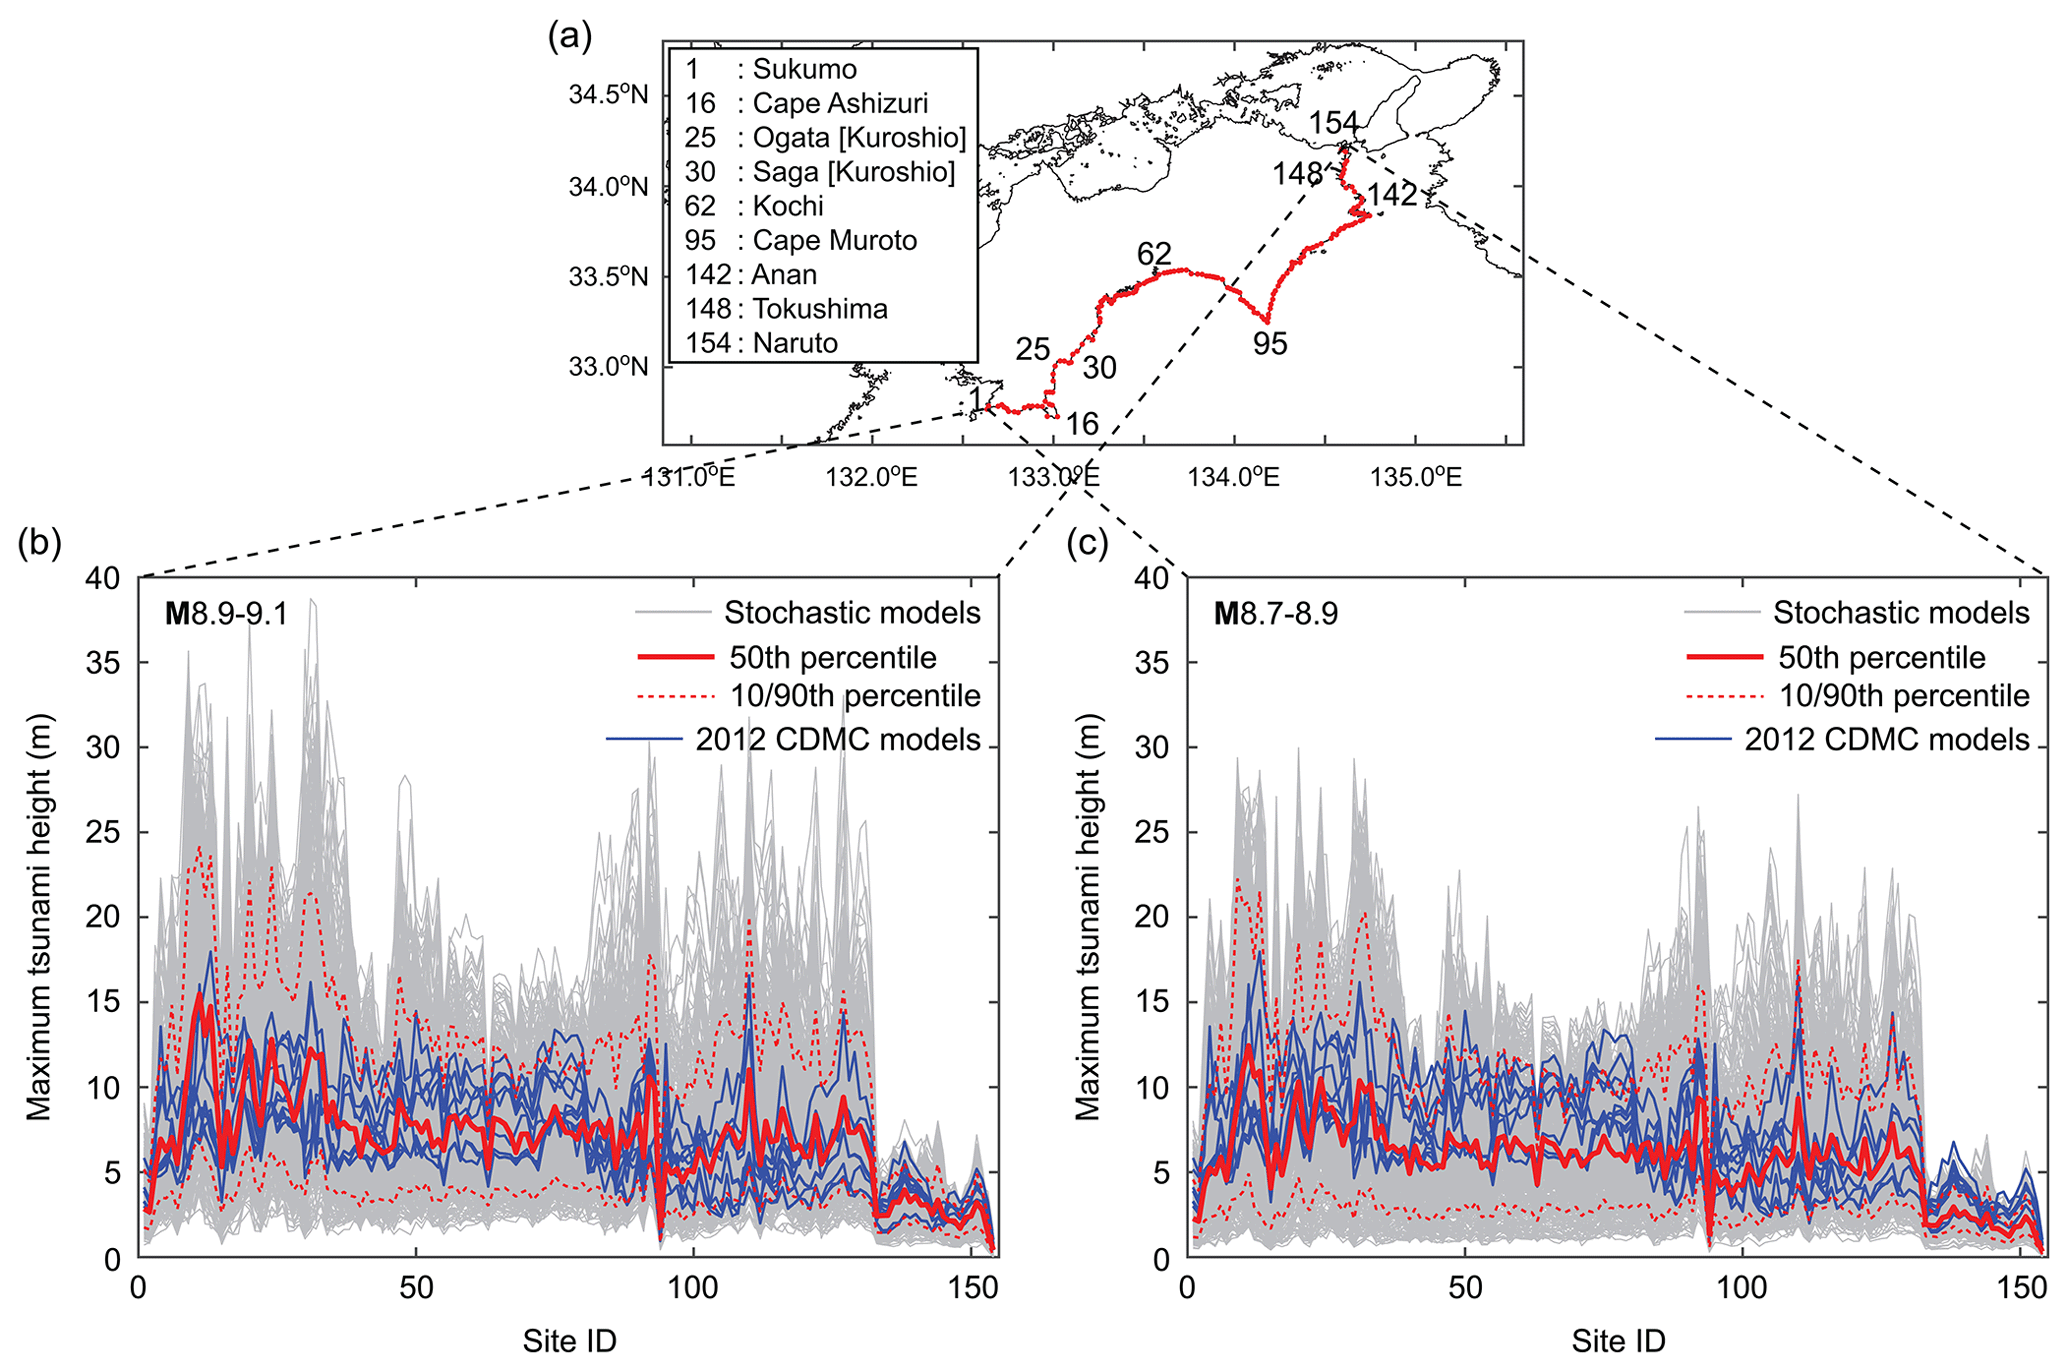
Figure 6Maximum tsunami heights along the coast of Kochi and Tokushima prefectures (a) for the two magnitude ranges M8.9–9.1 (b) and M8.7–8.9 (c). In (b) and (c), maximum tsunami heights based on 500 stochastic models are shown with grey colours, the 50th percentile curve is shown with solid red lines, and the 10th and 90th percentile curves are shown with broken red lines. The blue curves correspond to the simulated maximum tsunami heights based on the 2012 CDMC models.
To facilitate the comparisons of the stochastic tsunami simulation results and the 2012 CDMC results, the ratios of the three percentiles of the maximum tsunami heights based on the stochastic tsunami simulations and the average of the 2012 CDMC results are shown in Fig. 7. The maximum tsunami heights based on the 2012 CDMC models are closer to the 50th percentiles of the stochastic tsunami simulation results for both M8.9–9.1 and M8.7–8.9 cases, indicating an overall similarity of the tsunami hazard levels along the coastal line of Kochi and Tokushima prefectures. The comparisons shown in Figs. 6 and 7 indicate that the largest of the 2012 CDMC results does not exceed the 90th percentiles of the stochastic tsunami simulation results for the majority of the locations, and thus the 2012 CDMC results are among the realizations but are unable to capture extreme scenarios of local tsunami hazards and their variability.
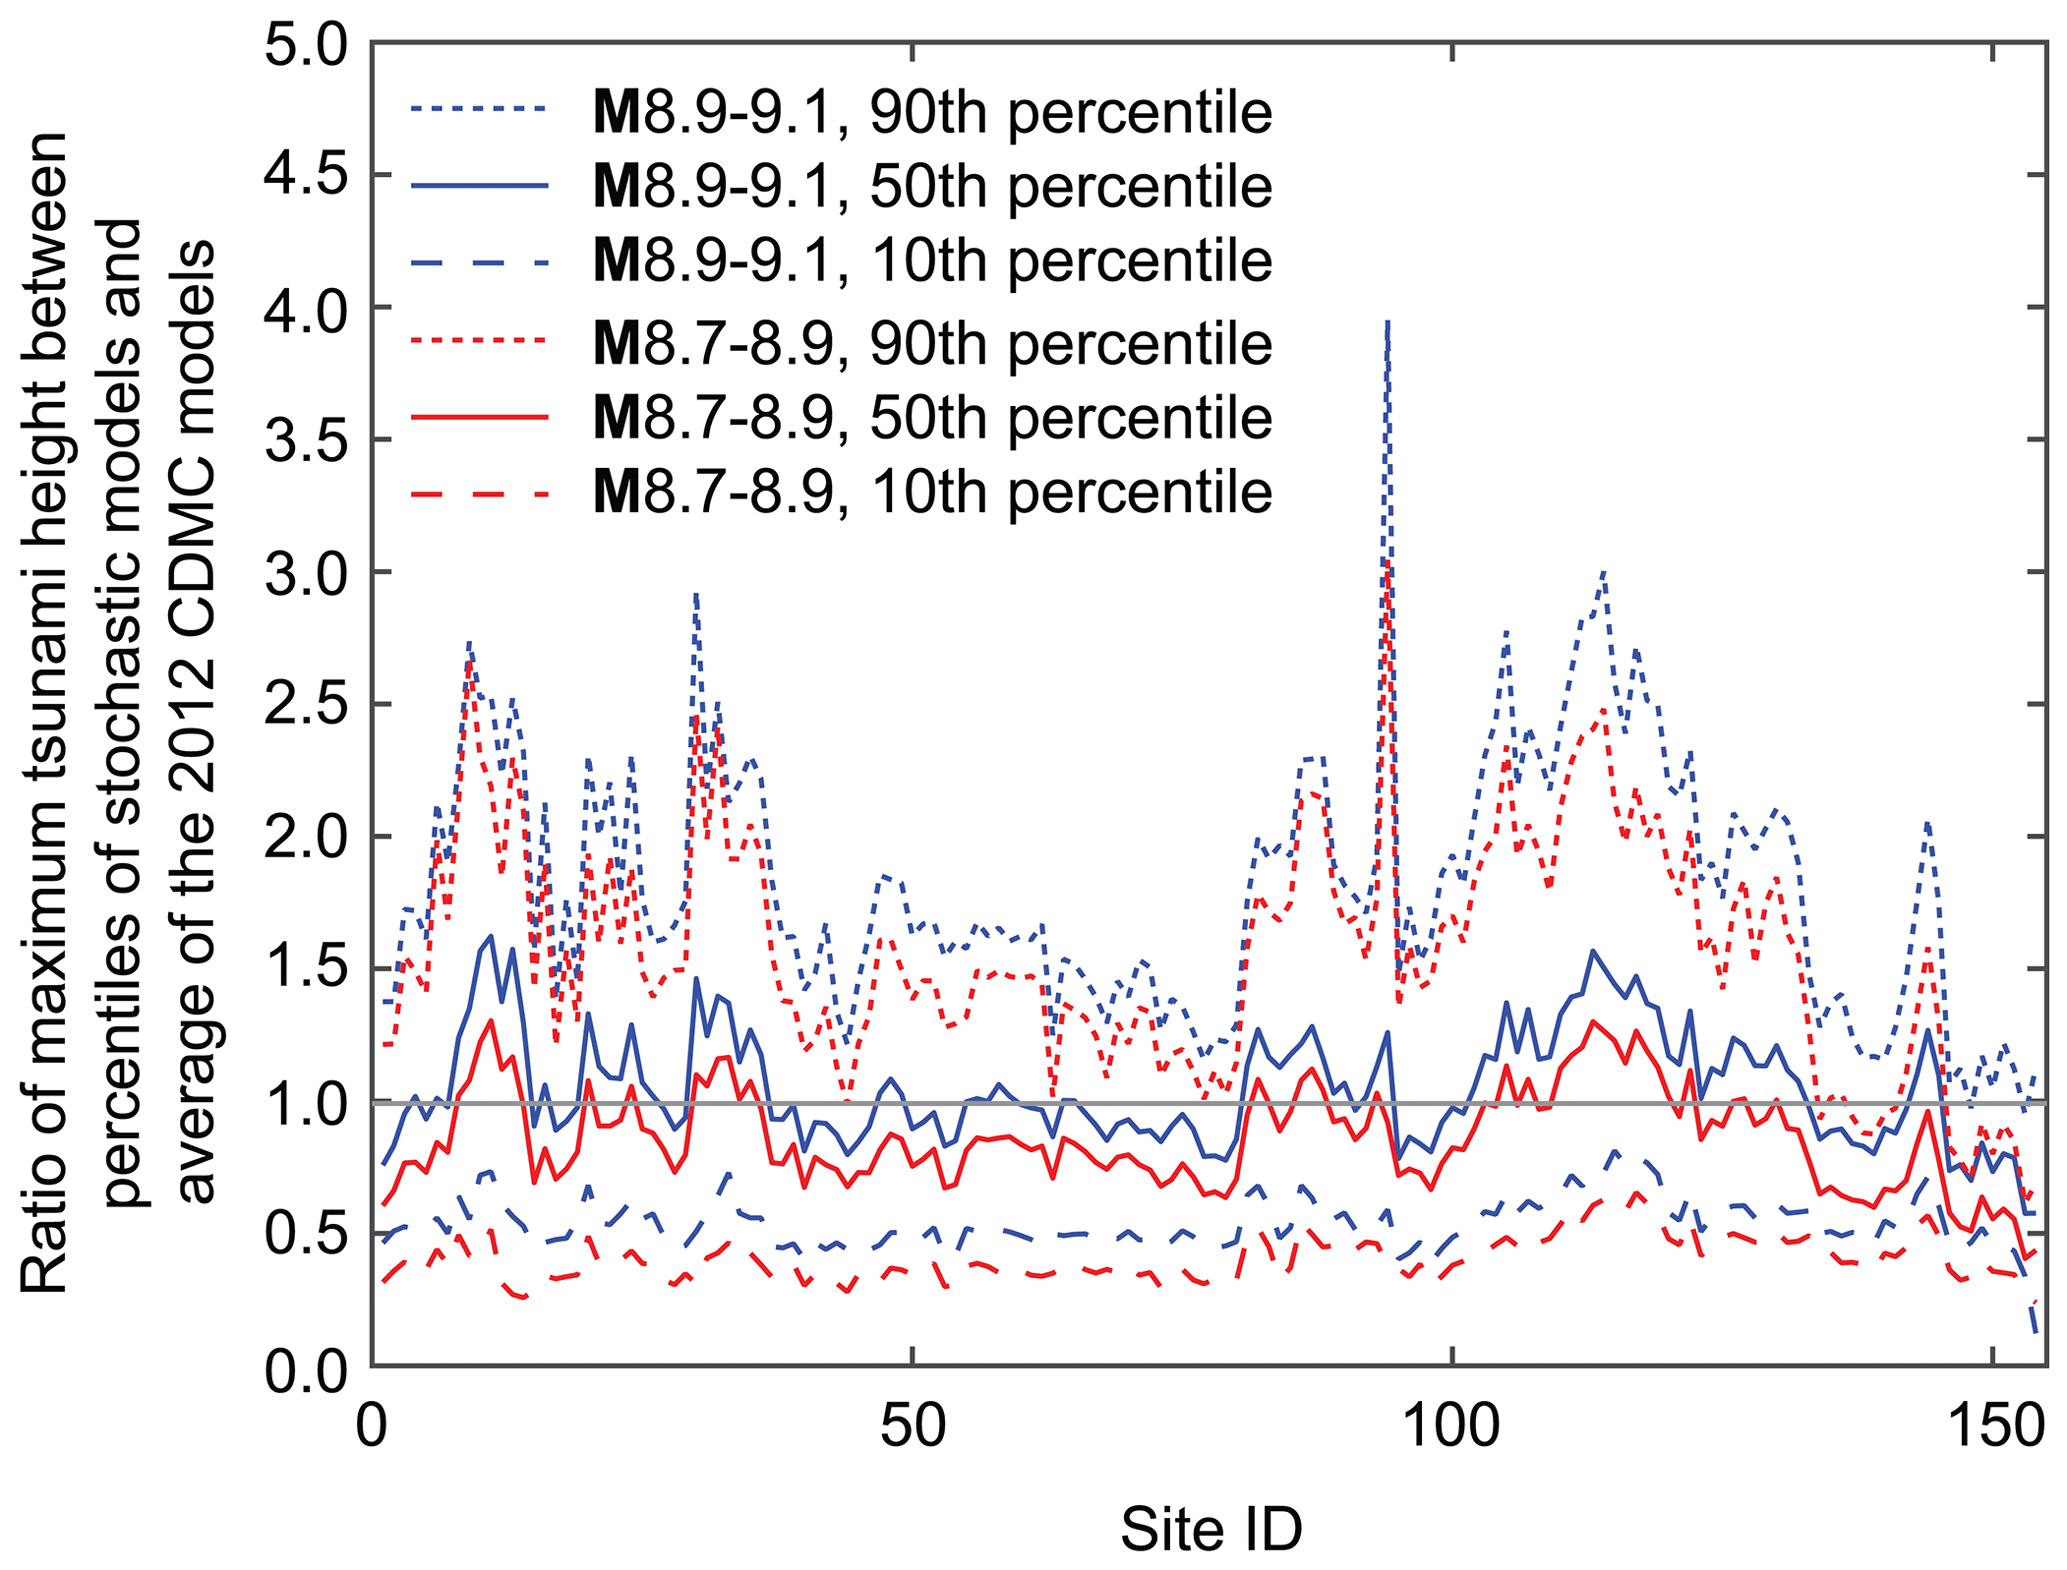
Figure 7Ratio of maximum tsunami heights between three percentiles of the stochastic source models and the average of the 11 CDMC models along the coast of Kochi and Tokushima prefectures for the two magnitude ranges M8.9–9.1 and M8.7–8.9.
4.2 Tsunami inundation areas and earthquake source characteristics
The extent of onshore tsunami inundation is a useful hazard metric for damage and loss (e.g., Goda et al., 2019). It is thus essential to investigate the characteristics of regional and local inundation area metrics and to relate these to the corresponding earthquake characteristics. In this section, we study the relationships between inundation area parameters and three types of earthquake source parameters. The first source parameter is the moment magnitude, which captures the macroscopic feature of released energy and is proportional to the total slip over a fault plane. The second source parameter is the slip ratio, which is calculated as the summed slip within a specified segment divided by the total slip over the entire fault plane. For instance, the slip ratio can be calculated for individual or combined segments of the Nankai–Tonankai fault plane model (Fig. 1). The third source parameter is the tsunami potential energy ET and is defined as follows (Melgar et al., 2019):
where η is the initial sea surface dislocation due to an earthquake rupture, g is the gravitational acceleration, ρ is the density of seawater, and x and y correspond to the two horizontal coordinates. ET is based on the sum of the squared sea surface dislocation values over the entire computational domain. Therefore, this parameter accounts for the combined effects of various source parameters, such as slip, depth, strike, dip, and rake, on the sea surface dislocation (i.e., tsunami simulation input).
Figure 8 shows histograms of the tsunami inundation areas in Shikoku and Kuroshio for the two magnitude ranges M8.9–9.1 and M8.7–8.9. The inundation areas for Shikoku and Kuroshio are computed based on 90 and 10 m resolution grids, respectively, and when grids are flooded by tsunamis greater than 0.1 m depth, these are included in the calculation of the inundation area. From regional perspectives (Fig. 8a and c), inundation areas in Shikoku based on the 2012 CDMC models correspond to higher percentiles of the stochastic tsunami simulation results for the M8.9–9.1 and M8.7–8.9 cases. On the other hand, inundation areas in Kuroshio based on the 2012 CDMC models are more consistent with average inundation areas of the stochastic tsunami simulation results.

Figure 8Histograms of tsunami inundation areas in Shikoku (a, c) and Kuroshio (b, d) for the two magnitude ranges M8.9–9.1 and M8.7–8.9. The sum of the vertical bin heights is 1.
To examine the relationships between regional and local inundation areas and earthquake slip distributions in segments, tsunami inundation areas in Shikoku and Kuroshio are plotted against slip ratios in segments Z (Hyuga-nada), A–B (Nankai), and C–E (Tonankai–Tokai) in Fig. 9. It is noted that for a given earthquake source model, the slip ratios in segments Z, A–B, and C–E sum to 1. From the scatter plots, positive and negative trends can be recognized for segments A–B and C–E, respectively, whereas no clear trends can be identified for segment Z (see also the Pearson's linear correlation coefficient r indicated in the figure). Although some of the identified trends between the inundation areas and slip rations are weak (e.g., Fig. 9a and b), the slope coefficients of these relationships are found to be significant (i.e., non-zero) based on the p values. These observations are consistent with intuitions that when more earthquake slips are concentrated near the target region or location (i.e., Nankai segments A–B for this case), inundation areas become larger. These results demonstrate the importance of taking into account the asperity characteristics of an earthquake rupture in predicting the tsunami impact.
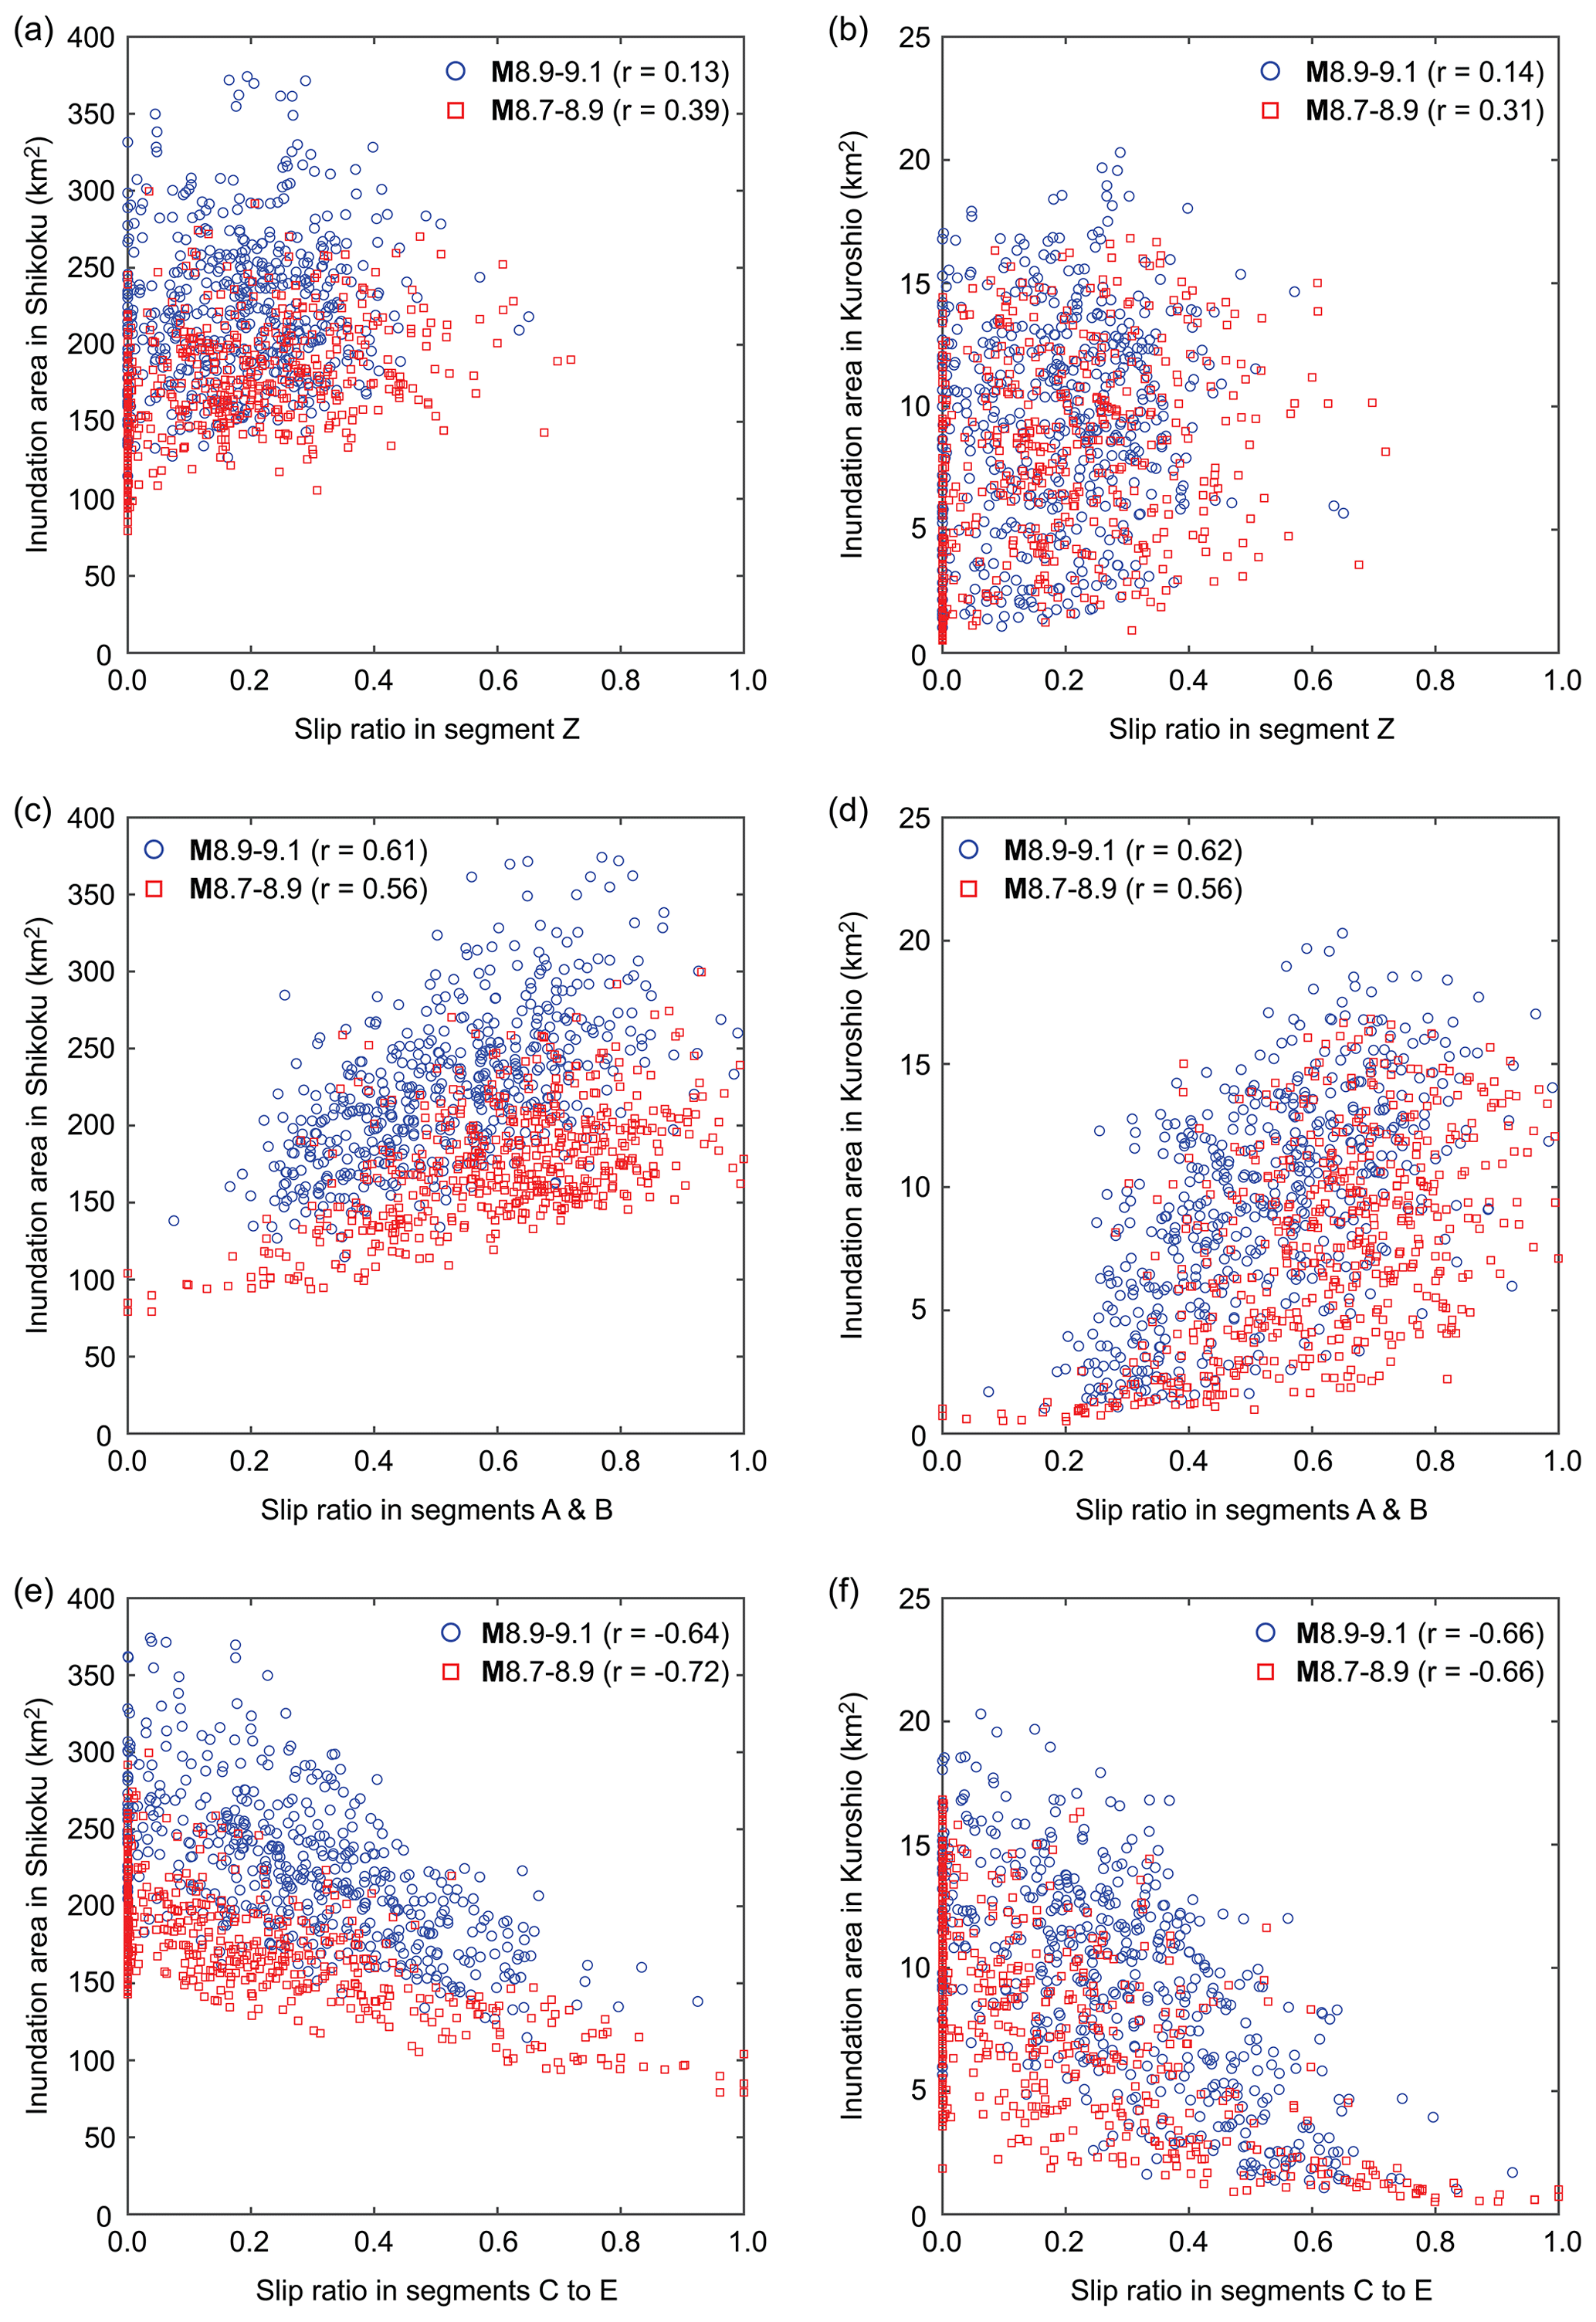
Figure 9Scatter plots of slip ratios in segments Z (Hyuga-nada), A–B (Nankai), and C–E (Tonankai–Tokai) versus tsunami inundation areas in Shikoku (a, c, e) and Kuroshio (b, d, f) for the two magnitude ranges M8.9–9.1 and M8.7–8.9.
For investigating the effects of spatial earthquake slip distribution on the severity of tsunami hazard, the tsunami potential energy (Eq. 1) is an ideal metric because it consolidates the effects of various features of earthquake sources into a single parameter. Figure 10 presents scatter plots of moment magnitude versus tsunami inundation area, as well as those of tsunami potential energy versus tsunami inundation area. Figure 10a and b exhibit moderate positive relationships between moment magnitude and inundation areas (which can also be inspected in Fig. 8). In contrast, Fig. 10c and d show stronger positive relationships (i.e., linear correlation coefficients of 0.6 to 0.7) between logarithmic tsunami potential energy (with base 10) and inundation areas. The positive correlation is more pronounced for the regional inundation area in Shikoku than for the local inundation in Kuroshio because there is a greater chance that elevated tsunami potential energy will affect the target region or location.

Figure 10Scatter plots of moment magnitude versus tsunami inundation area in Shikoku and Kuroshio for the two magnitude ranges M8.9–9.1 (a) and M8.7–8.9 (b). Scatter plots of tsunami potential energy versus tsunami inundation area in Shikoku and Kuroshio for the two magnitude ranges M8.9–9.1 (c) and M8.7–8.9 (d).
Although not presented in this study, similar correlation analyses are also carried out for other earthquake source parameters, such as fault length and width and maximum slip. These results indicate that tsunami potential energy shows high degrees of correlation with regional and local inundation areas and thus can be used as an effective tsunami source predictor of regional and local inundation extents.
4.3 Tsunami inundation in Ogata and Saga districts
Assessing tsunami inundation hazards and quantifying their uncertainty at local community levels require an integrated modelling and analysis of stochastic earthquake sources and tsunami run-up simulations. This section focuses on (1) site-specific evaluations of tsunami inundation depths at two vertical evacuation towers in the Ogata and Saga districts (Fig. 4) and (2) the identification of critical tsunami scenarios based on local inundation metrics and their comparisons with the 2012 CDMC model cases. The former is crucially important to ensure that the current evacuation plans for the local population in these districts are effective in the case of extreme situations beyond the current tsunami hazard scenarios by the CDMC. The latter facilitates the risk communication of tsunami hazard threat by recognizing different possible tsunami hazard scenarios explicitly in light of inevitable uncertainty associated with tsunami hazard assessment.
The evacuation space of the tower (usually the top floor or the roof) in the Ogata district is at 18.2 m a.m.s.l. (above mean sea level) (Fig. 4d); by taking into account the land elevation of 3.87 m at the tower, the critical inundation depth at the tower is 14.33 m. On the other hand, the evacuation space of the tower in the Saga district is at 25.3 m (Fig. 4e); therefore, the critical inundation depth at the tower is 21.92 m when considering the land elevation of 3.38 m. These critical water depths are used for evaluating the sufficiency of these two towers as vertical refuge facilities. To carry out such assessments, histograms of maximum inundation depth at the vertical evacuation towers in the Ogata and Saga districts are shown in Fig. 11 for the two magnitude ranges M8.9–9.1 and M8.7–8.9. In Fig. 11, the inundation results based on the 11 CDMC source models are also presented, noting that the vertical evacuation tower in the Saga district is inundated for three cases out of the 11 models (i.e., models 4, 5, and 10; see Fig. 2), and thus only three square markers are shown in Fig. 11b and d. Out of all 1000 scenarios, there are five cases and one case when the maximum inundation depths at the vertical evacuation towers in the Ogata and Saga districts exceed the critical water depths, respectively. The chances of such exceedance are low, and these scenarios can be regarded as very extreme. From tsunami hazard viewpoints, the existing two vertical evacuation towers are judged to be satisfactory. Nevertheless, there are other aspects, such as evacuation times of the local population, that need to be evaluated to conclude that these towers are sufficient from a broader perspective. This is beyond the scope of the current study.
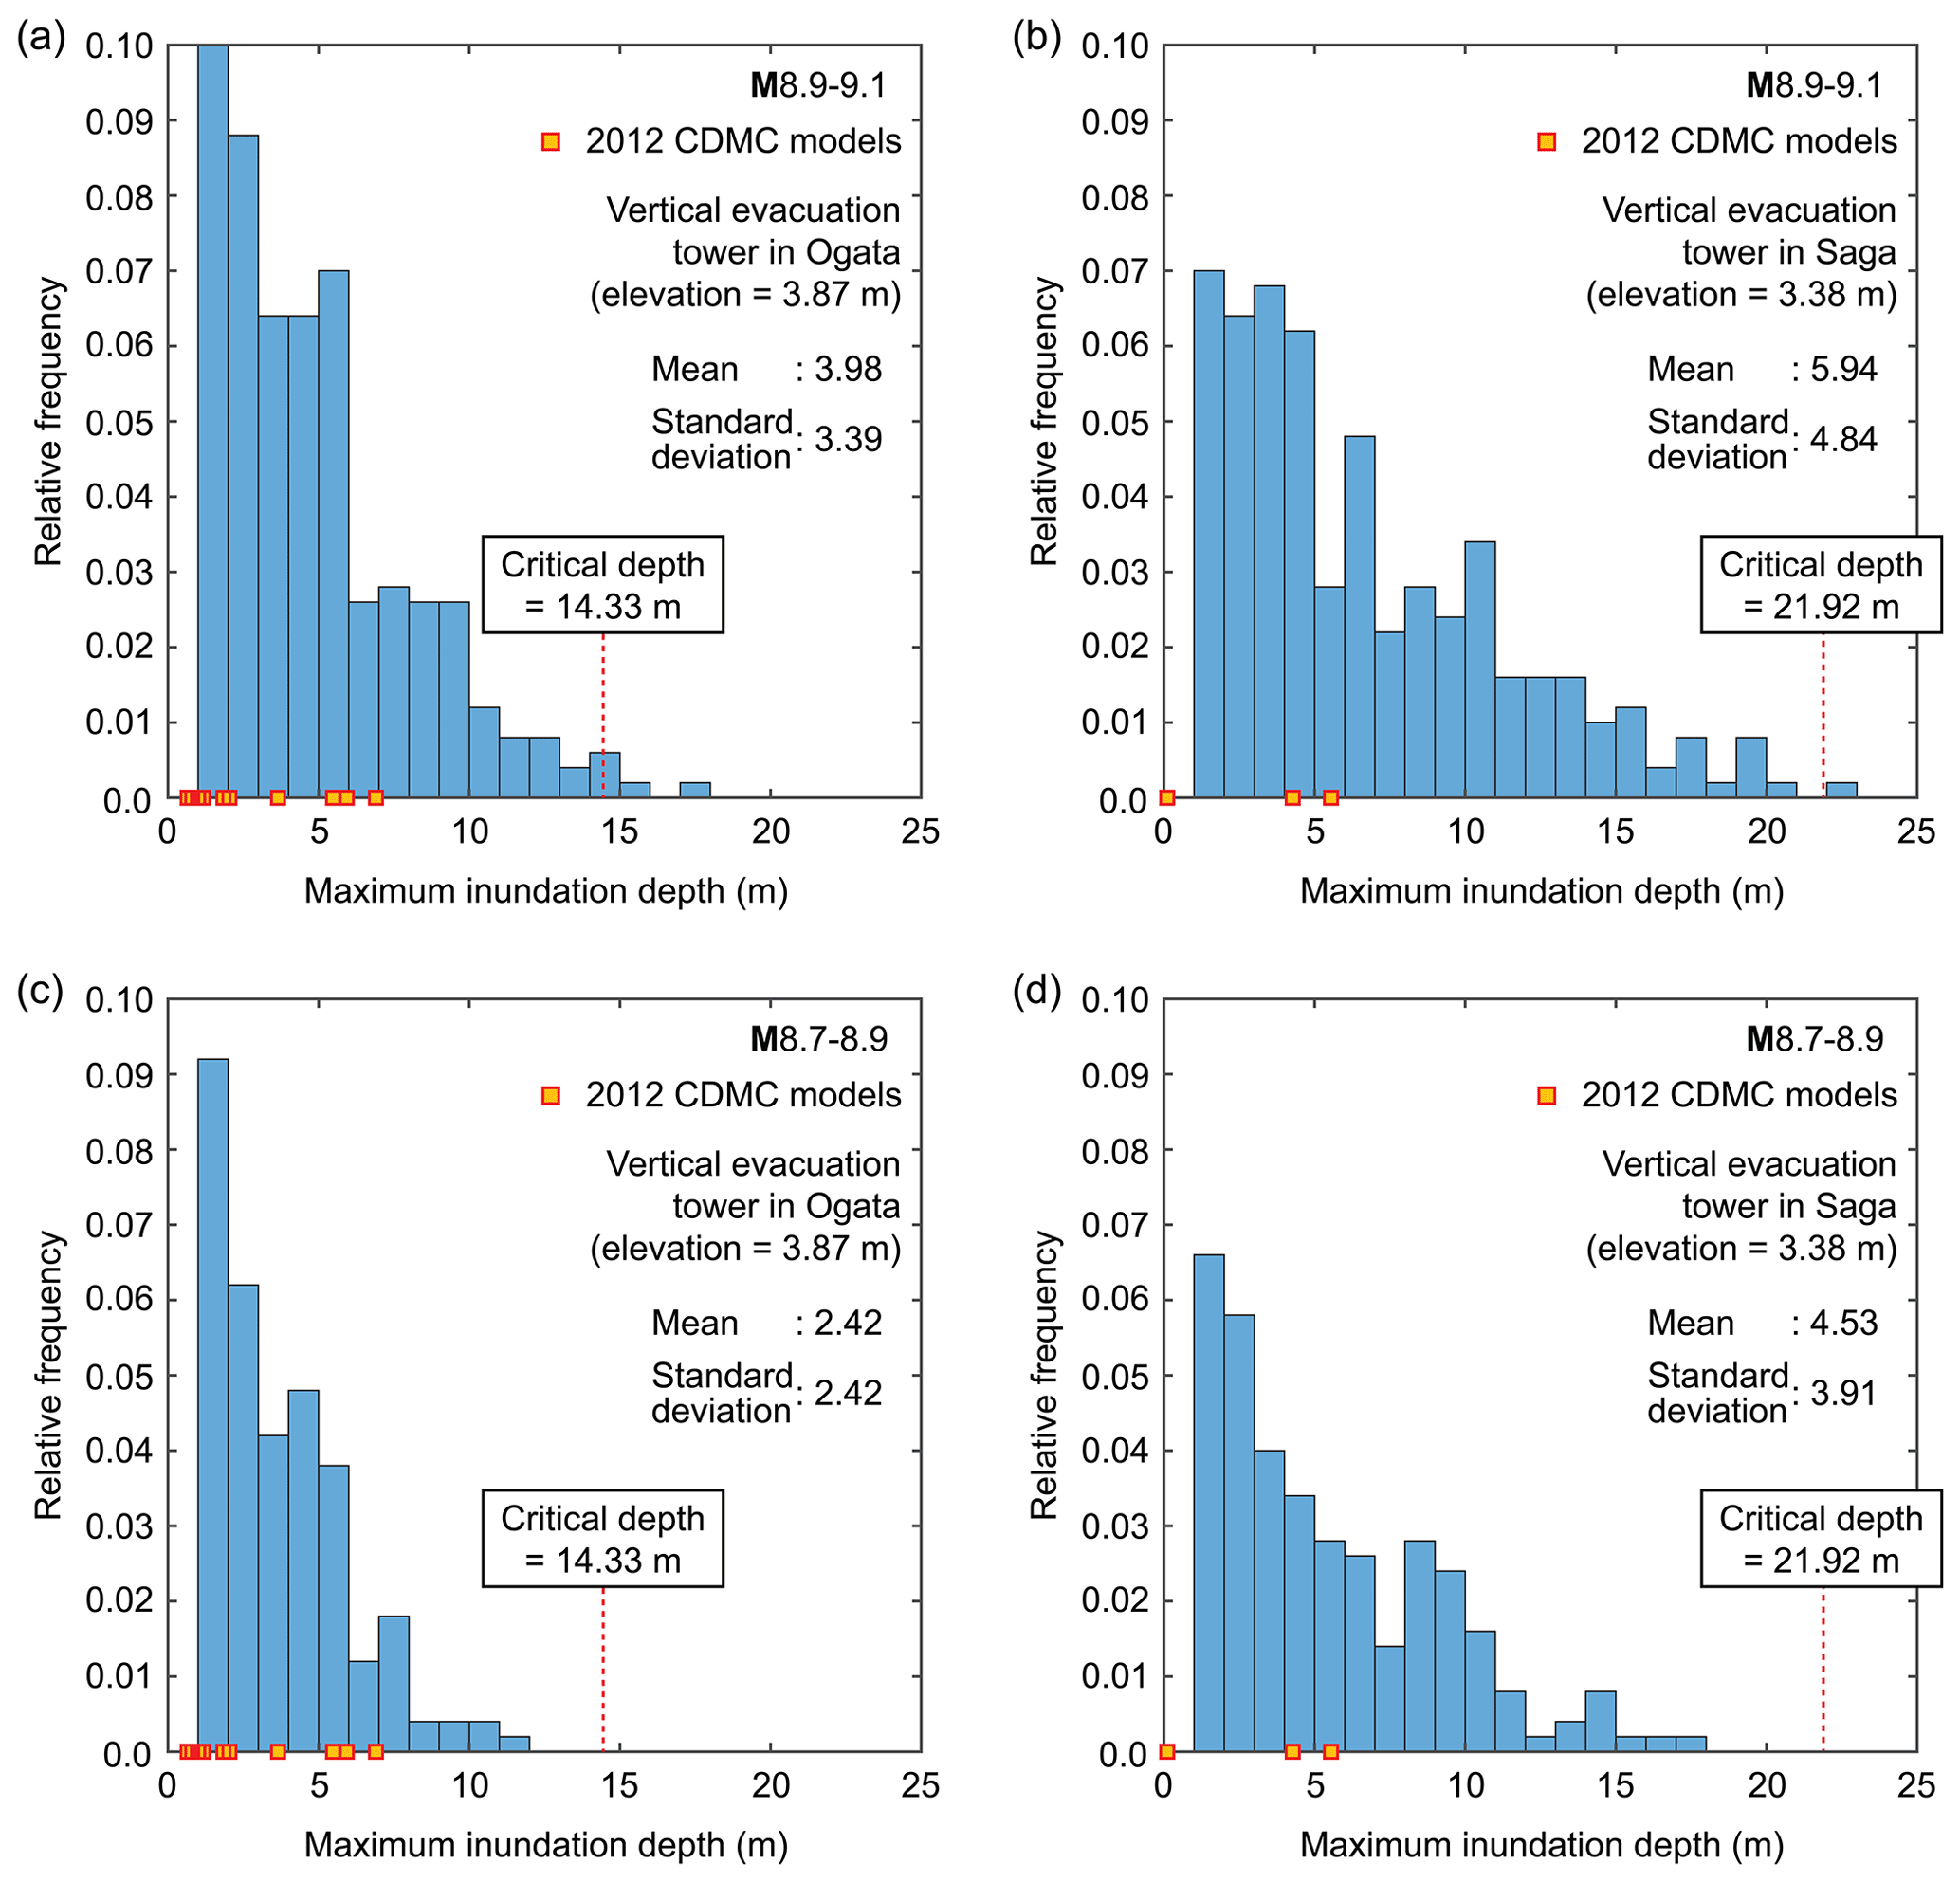
Figure 11Histograms of maximum inundation depth at the vertical evacuation towers in the Ogata and Saga districts (see Fig. 4) for the two magnitude ranges M8.9–9.1 (a, b) and M8.7–8.9 (c, d). The sum of the vertical bin heights is 1.
Next, to derive critical tsunami hazard scenarios based on local inundation areas, inundation areas in the Ogata and Saga districts are investigated, and histograms of these inundation parameters are shown in Fig. 12. Note that the areas that are considered for these local communities are smaller than those considered for Kuroshio (i.e., Fig. 8b and d). Based on the histograms shown in Fig. 12 and by taking the 50th and 90th percentiles as critical scenario levels (note that other percentiles can be adopted), the critical inundation areas obtained are 2.20 and 3.71 km2, respectively, for the M8.9–9.1 cases and 1.80 and 3.34 km2, respectively, for the M8.7–8.9 cases. For comparison, the 2012 CDMC model 5 is adopted as the most critical scenario among the 11 models shown in Fig. 2. The inundation area in the Ogata and Saga districts obtained is 3.33 km2.

Figure 12Histograms of inundation areas in the Ogata and Saga districts for the two magnitude ranges M8.9–9.1 (a) and M8.7–8.9 (b). In each figure panel, inundation areas that are used to define local critical tsunami scenarios are indicated by the 50th and 90th percentile lines. The sum of the vertical bin heights is 1.
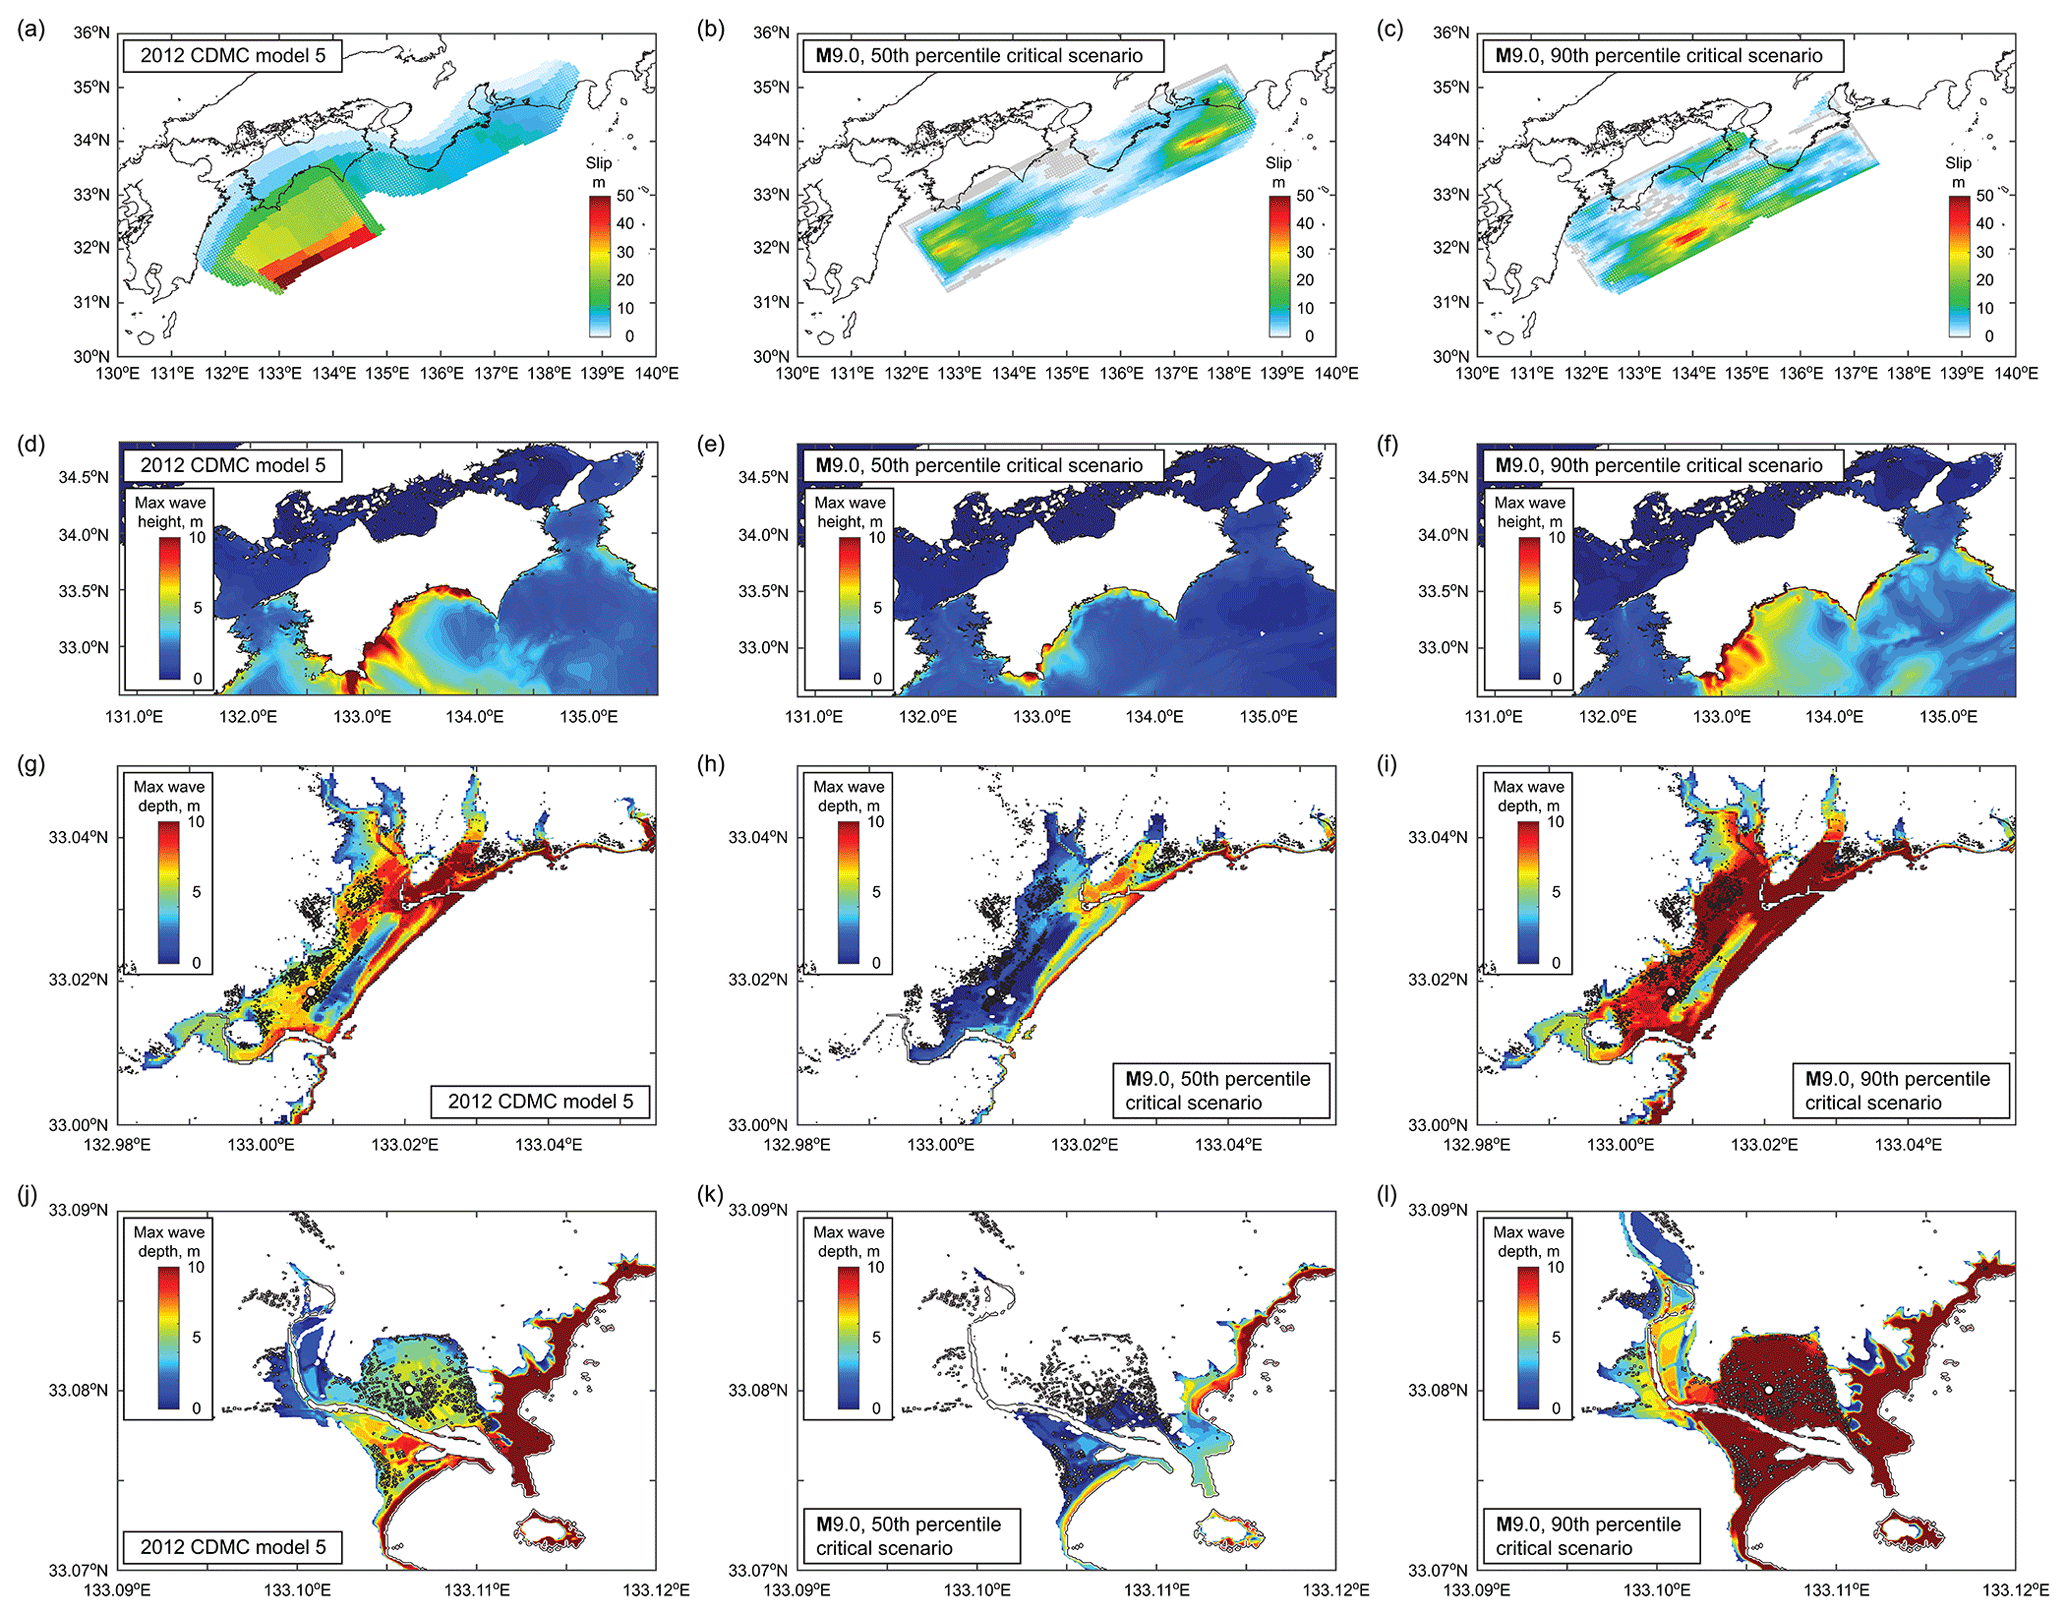
Figure 13Critical tsunami hazard scenarios for the Ogata and Saga districts for the M8.9–9.1 magnitude range. Panels (a, d, g, j) correspond to the most critical scenario based on the 2012 CDMC models (i.e., model 5). Panels (b, e, h, k) and (c, f, i, l) correspond to the 50th and 90th percentiles of inundation areas in the Ogata and Saga districts (Fig. 12).
Once the earthquake rupture models that correspond to the identified critical inundation areas have been completed, various stochastic tsunami simulation results, such as regional maximum tsunami heights and local maximum inundation depths, can be extracted. For such purposes, the earthquake slip distribution, the maximum tsunami height distribution, the maximum inundation depth in the Ogata district, and the maximum inundation depth in the Saga district for the 50th and 90th percentile inundation levels are displayed in Fig. 13 for the M8.9–9.1 cases and in Fig. 14 for the M8.7–8.9 cases. As a benchmark for comparison, the counterpart results based on the 2012 CDMC model 5 are included in both figures. The results shown in Fig. 13 indicate that the extents of local tsunami inundation in the Ogata and Saga districts for the 2012 CDMC model 5 are between those for the 50th and 90th percentile scenarios of the M8.9–9.1 cases. On the other hand, for the cases of M8.7–8.9, the results based on the 2012 CDMC model 5 exceed or are close to those based on the 90th percentile critical scenario. By inspecting the corresponding earthquake slip distribution, as well as maximum tsunami height distribution (i.e., 1st and 2nd rows of Figs. 13 and 14), the local inundation results can be better related to earthquake source and asperity characteristics and regional tsunami wave characteristics. For instance, the 50th percentile scenario is less critical for the Ogata and Saga districts because it is a two-asperity earthquake slip distribution in segments Z and A and D (Fig. 13b), whereas the 90th percentile scenario causes severe consequences in the Ogata and Saga districts because its asperity is concentrated in segments A–B (Fig. 13c), similar to the 2012 CDMC model 5 (Fig. 13a), although detailed slip patterns shown in Fig. 13a and c are different.
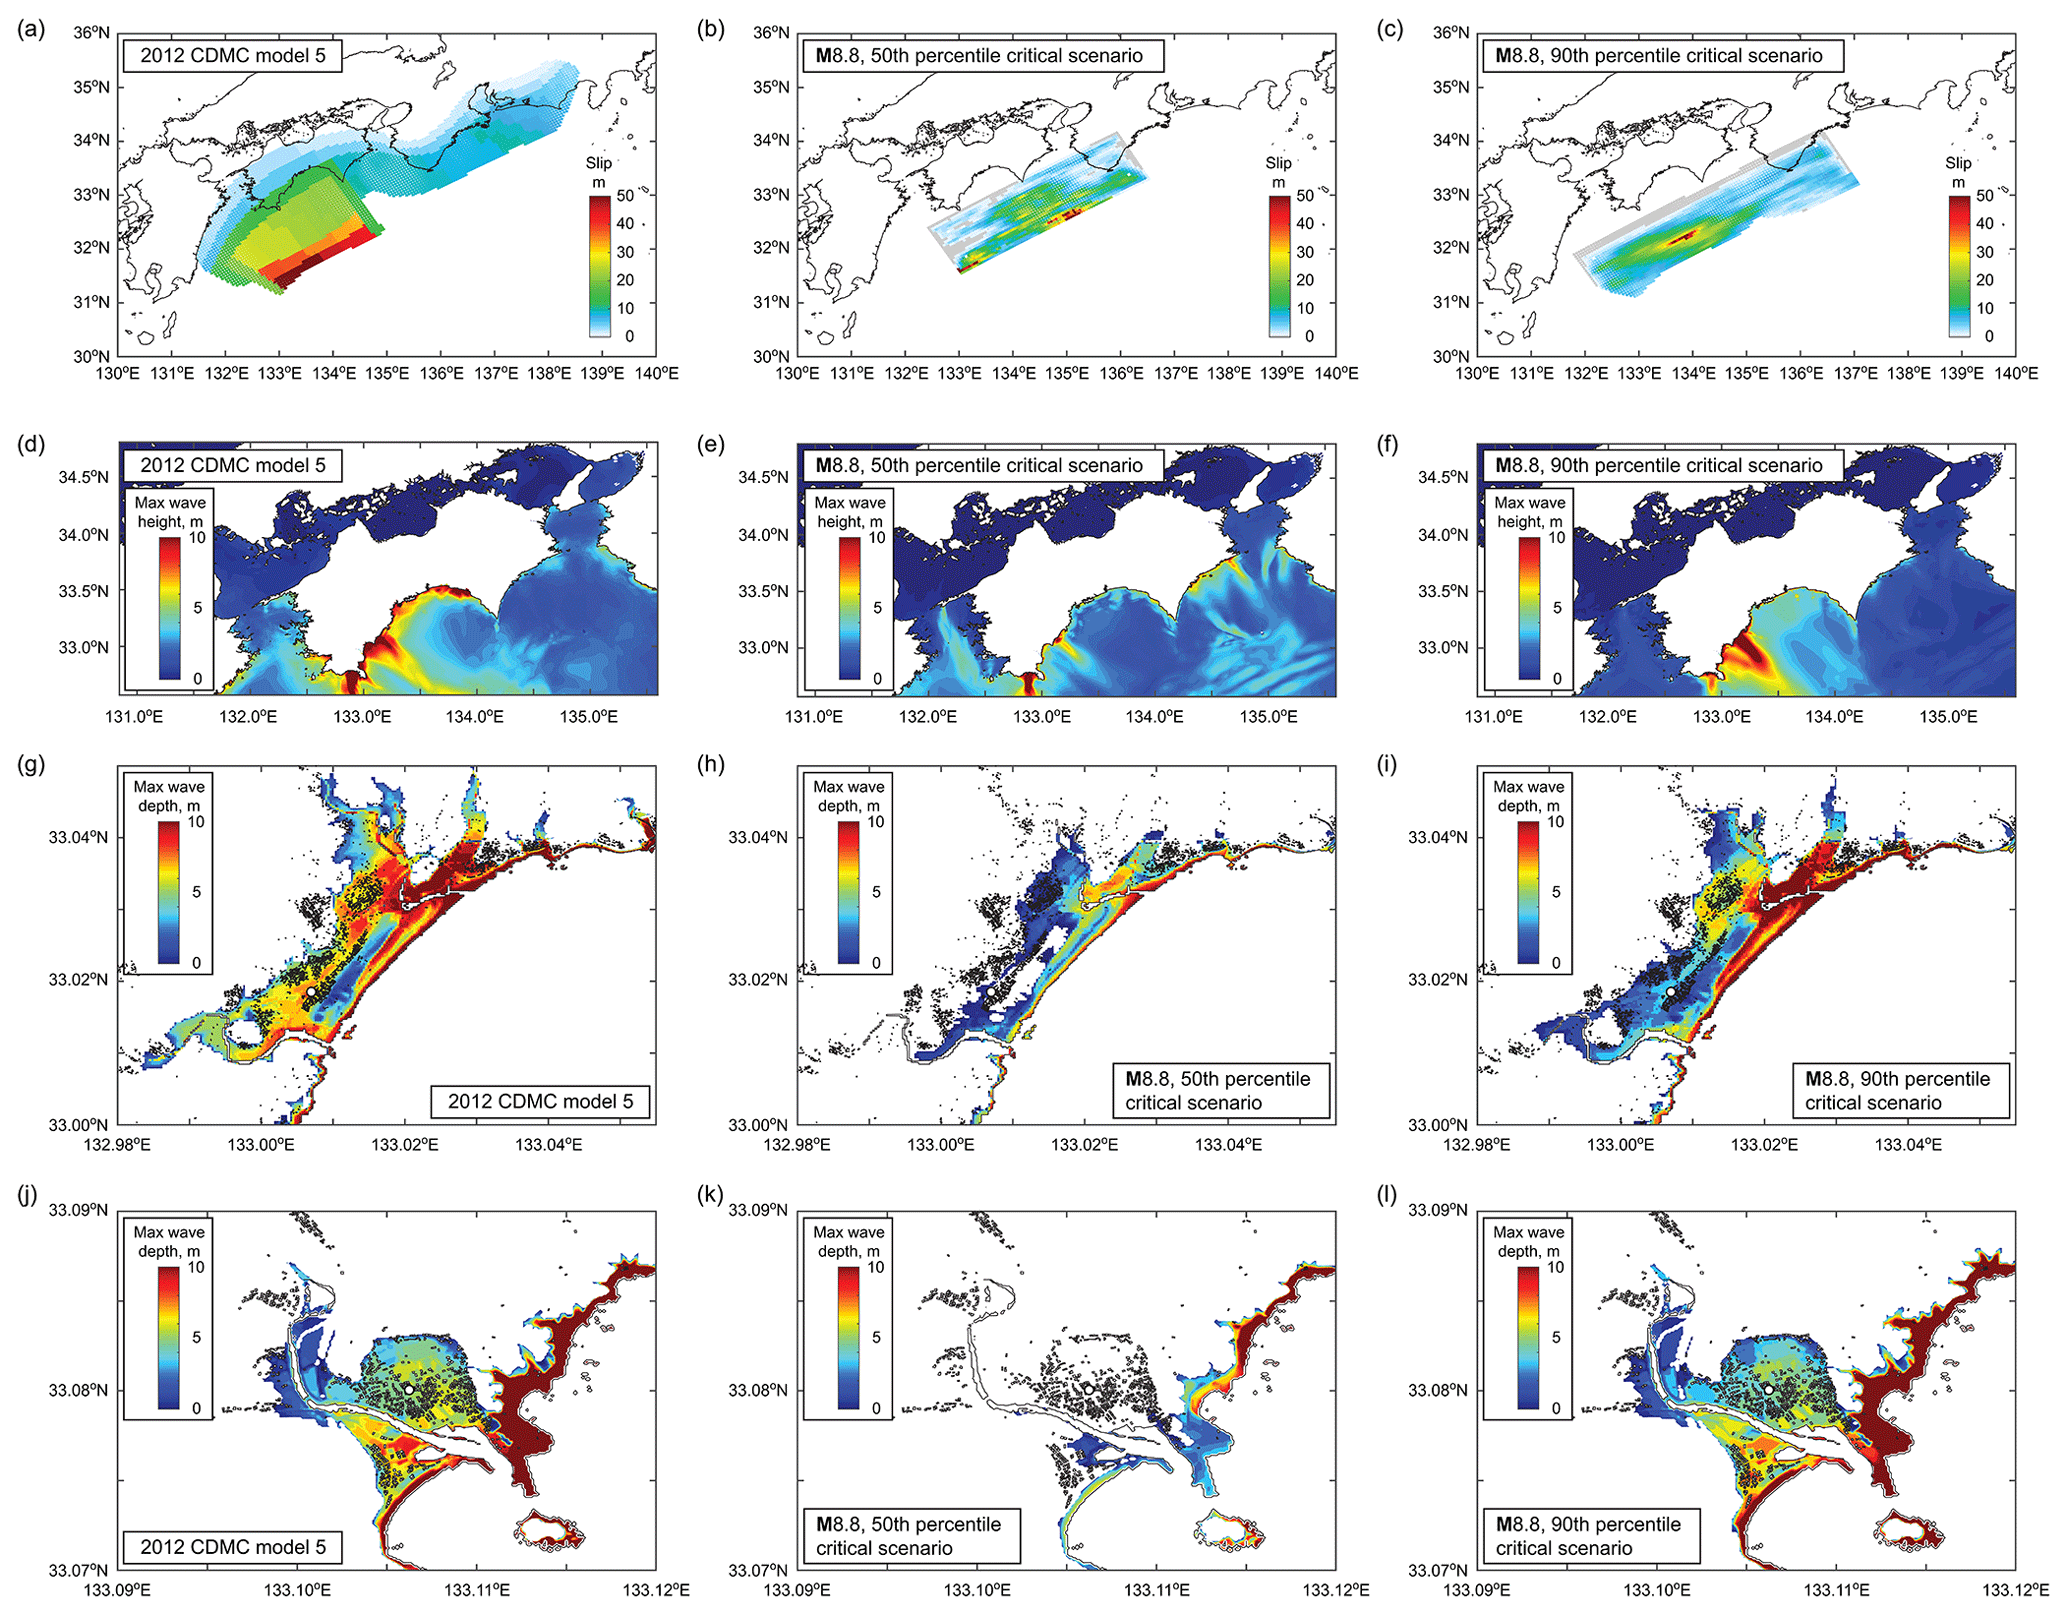
Figure 14Critical tsunami hazard scenarios for the Ogata and Saga districts for the M8.7–8.9 magnitude range. Panels (a, d, g, j) correspond to the most critical scenario based on the 2012 CDMC models (i.e., model 5). Panels (b, e, h, k) and (c, f, i, l) correspond to the 50th and 90th percentiles of inundation areas in the Oagata and Saga districts (Fig. 12).
Significant advantages of the stochastic tsunami simulation methods and their use in deriving critical tsunami scenarios and related tsunami hazard maps are the enhanced capabilities to quantify the uncertainty associated with tsunami hazard assessments and to visualize the results in an integrated manner more effectively. It is also important to point out that the deterministic tsunami scenarios, such as the 2012 CDMC models, and the stochastic tsunami scenarios, such as the 1000 rupture models, are complementary. Typically, deterministic scenarios are derived based on current geodetic and available geological data, whereas stochastic scenarios are more inclined to statistical features of earthquake source models of past events. The systematic comparison of these results will improve the understanding of different modelling approaches and their key assumptions and will allow hazard modellers to gain confidence in the derived results.
Tsunami hazard assessments based on stochastic tsunami simulations offer valuable insights into the degree of uncertainty associated with such investigations. To evaluate tsunami inundation hazards and quantify their variability at local community levels, this study presented an integrated modelling and analysis of stochastic earthquake sources and tsunami run-up simulations for future Nankai–Tonankai megathrust events. For this purpose, 1000 kinematic tsunami rupture models were generated for the moment magnitudes ranging from 8.7 to 9.1, and tsunami simulations were performed with high-resolution grid data of 10 m by taking into account the effects of existing coastal defence structures in Japan. To benchmark the results from the stochastic tsunami simulations, a set of tsunami source models developed by the CDMC of the Japanese Cabinet Office was employed. Our motivations in comparing the stochastic tsunami inundation results with the deterministic 2012 CDMC models were to quantify the variability of tsunami hazards at municipality and township levels and to account for local extreme situations. To enable a consistent comparison with the CDMC tsunami source models (M9.0 to M9.1) in terms of released seismic moment, the lower magnitude limit of the stochastic sources was chosen as M8.7.
The numerical investigations focused on the southwestern Pacific region of Japan, i.e., Shikoku Island and Kuroshio, for regional and local viewpoints. The comparisons of the offshore wave profiles and maximum tsunami heights along the coast of Shikoku Island based on the stochastic tsunami simulations and the 2012 CDMC models indicated that the 2012 CDMC results are consistent with the typical stochastic simulation results for the same magnitude range but are unable to capture extreme scenarios of local tsunami hazards and their variability.
To relate the regional and local inundation extents to earthquake source characteristics, correlations between inundation area metrics and moment magnitude, slip ratio in segments, and tsunami potential energy were examined. The results indicated that tsunami potential energy could be used as an effective tsunami source predictor of regional and local inundation extents. Moreover, to evaluate the sufficiency of the two existing vertical evacuation towers in the local communities of Ogata and Saga in Kuroshio, the critical inundation depths of these towers were compared to the stochastic tsunami simulation results. Since the exceedance of the critical inundation depths was rare (i.e., 5 and 1 out of 1000 cases for the towers in the Ogata and Saga districts, respectively), the existing two vertical evacuation towers were judged to be satisfactory. Finally, critical tsunami scenarios for the local communities in Ogata and Saga were identified based on the local inundation metrics, and their tsunami inundation extents were compared with those of the 2012 CDMC models. The use of stochastic tsunami simulation methods improved the quantification and visualization of uncertain tsunami hazard assessments and was able to complement the tsunami hazard predictions based on conventional deterministic tsunami scenarios. Future investigations should extend the hazard assessments into tsunami evacuation problems, as well as into multi-hazard risk assessments.
The bathymetry and elevation data were obtained from the Central Disaster Management Council of the Japanese Cabinet Office. The tsunami simulation code is not available because its copyright does not belong to the authors.
KG carried out the analysis and writing. KG, NM, TY, RDR, AM, and FDL all participated in the study site visit and a series of meetings and verified the analysis set-up, as well as the results.
The authors declare that they have no conflict of interest.
The tsunami simulations were performed using BlueCrystal Phase 3, which was supported by the Advanced Computing Research Centre of the University of Bristol.
This research has been supported by the Leverhulme Trust (grant no. RPG-2017-006), the Canada Research Chairs (grant no. 950-232015), the Natural Sciences and Engineering Research Council of Canada (grant no. RGPIN-2019-05898), and the Japan Society for the Promotion of Science Joint Research Project (grant no. 19039901-000829).
This paper was edited by Maria Ana Baptista and reviewed by Thomas Ulrich, Reza Amouzgar, and four anonymous referees.
Ando, M.: Source mechanisms and tectonic significance of historical earthquakes along the Nankai Trough, Japan, Tectonophysics, 27, 119–140, https://doi.org/10.1016/0040-1951(75)90102-X, 1975.
Baranes, H., Woodruff, J. D., Loveless, J. P., and Hyodo, M.: Interseismic coupling-based earthquake and tsunami scenarios for the Nankai Trough, Geophys. Res. Lett., 45, 2986–2994, https://doi.org/10.1002/2018GL077329, 2018.
CDMC – Central Disaster Management Council: Working group report on mega-thrust earthquake models for the Nankai Trough, Japan, Cabinet Office of the Japanese Government, Tokyo, available at: http://www.bousai.go.jp/jishin/nankai/taisaku/pdf/20120829_2nd_report01.pdf, last access: December 2012.
Fujino, S., Kimura, H., Komatsubara, J., Matsumoto, D., Namegaya, Y., Sawai, Y., and Shishikura, M.: Stratigraphic evidence of historical and prehistoric tsunamis on the Pacific coast of central Japan: Implications for the variable recurrence of tsunamis in the Nankai Trough, Quaternary Sci. Rev., 201, 147–161, https://doi.org/10.1016/j.quascirev.2018.09.026, 2018.
Fujiwara, O., Aoshima, A., Irizuki, T., Ono, E.,Obrochta, S. P., Sampei, Y., Sato, Y., and Takahashi, A.: Tsunami deposits refine great earthquake rupture extent and recurrence over the past 1300 years along the Nankai and Tokai fault segments of the Nankai Trough, Japan, Quaternary Sci. Rev., 227, 105999, https://doi.org/10.1016/j.quascirev.2019.105999, 2020.
Fukutani, Y., Suppasri, A., and Imamura, F.: Stochastic analysis and uncertainty assessment of tsunami wave height using a random source parameter model that targets a Tohoku-type earthquake fault, Stoch. Environ. Res. Risk A., 29, 1763–1779, https://doi.org/10.1007/s00477-014-0966-4, 2015.
Garrett, E., Fujiwara, O., Garrett, P., Heyvaert, V. M. A., Shishikura, M., Yokoyama, Y., Hubert-Ferrari, A., Brückner, H., Nakamura, A., De Batist, M., and the QuakeRecNankai team: A systematic review of geological evidence for Holocene earthquakes and tsunamis along the Nankai-Suruga Trough, Japan, Earth-Sci. Rev., 159, 337–357, https://doi.org/10.1016/j.earscirev.2016.06.011, 2016.
Goda, K., Yasuda, T., Mori, N., and Maruyama, T.: New scaling relationships of earthquake source parameters for stochastic tsunami simulation, Coast. Eng. J., 58, 1650010, https://doi.org/10.1142/S0578563416500108, 2016.
Goda, K., Yasuda, T., Mai, P. M., Maruyama, T., and Mori, N.: Tsunami simulations of mega-thrust earthquakes in the Nankai–Tonankai Trough (Japan) based on stochastic rupture scenarios, Tsunamis: Geology, Hazards and Risks, edited by: Scourse, E. M., Chapman, D. R. Tappin, S. R. Wallis, Geol. Soc. Lond. Spec. Publ., 456, 55–74, https://doi.org/10.1144/SP456.1, 2018.
Goda, K., Mori, N., and Yasuda, T.: Rapid tsunami loss estimation using regional inundation hazard metrics derived from stochastic tsunami simulation, Int. J. Disast. Risk Reduct., 40, 101152, https://doi.org/10.1016/j.ijdrr.2019.101152, 2019.
Goto, C., Ogawa, Y., Shuto, N., and Imamura, F.: Numerical method of tsunami simulation with the leap-frog scheme, in: IOC Manuals and Guides, 35. UNESCO, Paris, France, 1997.
Hirose, F., Nakajima, J., and Hasegawa, A.: Three-dimensional seismic velocity structure and configuration of the Philippine Sea slab in southwestern Japan estimated by double-difference tomography, J. Geophys. Res.-Solid, 113, B09315, https://doi.org/10.1029/2007JB005274, 2008.
Honma, J.: Discharge coefficient for trapezoidal weir, J. Jpn. Soc. Civ. Eng., 26, 635–645, 1940.
Iinuma, T., Hino, R., Kido, M., Inazu, D., Osada, Y., Ito, Y., Ohzono, M., Tsushima, H., Suzuki, S., Fujimoto, H., and Miura, S.: Coseismic slip distribution of the 2011 off the Pacific Coast of Tohoku Earthquake (M9.0) refined by means of seafloor geodetic data, J. Geophys. Res.-Solid, 117, B07409, https://doi.org/10.1029/2012JB009186, 2012.
JSCE – Japan Society of Civil Engineers: Tsunami assessment method for nuclear power plants in Japan, available at: https://www.jsce.or.jp/committee/ceofnp/Tsunami/eng/JSCE_Tsunami_060519.pdf (last access: December 2012), 2002.
Kimura, H., Tadokoro, K., and Ito, T.: Interplate coupling distribution along the Nankai Trough in southwest Japan estimated from the block motion model based on onshore GNSS and seafloor GNSS/A observations, J. Geophys. Res.-Solid, 124, 6140–6164, https://doi.org/10.1029/2018JB016159, 2019.
Kodaira, S., Hori, T., Ito, A., Miura, S., Fujie, G., Park, J. O., Baba, T., Sakaguchi, H., and Kaneda, Y.: A cause of rupture segmentation and synchronization in the Nankai trough revealed by seismic imaging and numerical simulation, J. Geophys. Res.-Solid, 111, B09301, https://doi.org/10.1029/2005JB004030, 2006.
Lotto, G. C., Jeppson, T. N., and Dunham, E. M.: Fully coupled simulations of megathrust earthquakes and tsunamis in the Japan Trench, Nankai Trough, and Cascadia subduction zone, Pure Appl. Geophys., 176, 4009–4041, https://doi.org/10.1007/s00024-018-1990-y, 2019.
Loveless, J. P. and Meade, B. J.: Geodetic imaging of plate motions, slip rates, and partitioning of deformation in Japan, J. Geophys. Res.-Solid, 115, B02410, https://doi.org/10.1029/2008JB006248, 2010.
Madariaga, R. and Ruiz, S.: Earthquake dynamics on circular faults: a review 1970–2015, J. Seismol., 20, 1235–1252, https://doi.org/10.1007/s10950-016-9590-8, 2016.
Mai, P. M. and Beroza, G. C.: A spatial random field model to characterize complexity in earthquake slip, J. Geophys. Res.-Solid, 107, 2308, https://doi.org/10.1029/2001JB000588, 2002.
Mai, P. M. and Thingbaijam, K. K. S.: SRCMOD: An online database of finite-fault rupture models, Seismol. Res. Lett., 85, 1348–1357, https://doi.org/10.1785/0220140077, 2014.
Mai, P. M., Spudich, P., and Boatwright, J.: Hypocenter locations in finite-source rupture models, Bull. Seismol. Soc. Am., 95, 965–980, https://doi.org/10.1785/0120040111, 2005.
Melgar, D., Williamson, A. L., and Salazar-Monroy, E. F.: Differences between heterogeneous and homogeneous slip in regional tsunami hazards modelling, Geophys. J. Int., 219, 553–562, https://doi.org/10.1093/gji/ggz299, 2019.
Mueller, C., Power, W. L., Fraser, S., and Wang, X.: Effects of rupture complexity on local tsunami inundation: implications for probabilistic tsunami hazard assessment by example, J. Geophys. Res.-Solid, 120, 488–502, https://doi.org/10.1002/2014JB011301, 2015.
Murotani, S., Satake, K., and Fujii, Y.: Scaling relations of seismic moment, rupture area, average slip, and asperity size for M∼9 subduction-zone earthquakes, Geophys. Res. Lett., 40, 5070–5074, https://doi.org/10.1002/grl.50976, 2013.
Okada, Y.: Surface deformation due to shear and tensile faults in a half-space, Bull. Seismol. Soc. Am., 75, 1135–1154, 1985.
Park, H., Cox, D. T., and Barbosa, A. R.: Comparison of inundation depth and momentum flux based fragilities for probabilistic tsunami damage assessment and uncertainty analysis, Coast. Eng., 122, 10–26, https://doi.org/10.1016/j.coastaleng.2017.01.008, 2017.
Satake, K., Fujii, Y., Harada, T., and Namegaya, Y.: Time and space distribution of coseismic slip of the 2011 Tohoku earthquake as inferred from tsunami waveform data, Bull. Seismol. Soc. Am., 103, 1473–1492, https://doi.org/10.1785/0120120122, 2013.
Stein, S. and Okal, E. A.: The size of the 2011 Tohoku earthquake need not have been a surprise, EOS Trans. Am. Geophys. Union, 92, 227–228, https://doi.org/10.1029/2011EO270005, 2011.
Tanigawa, K., Shishikura, M., Fujiwara, O., Namegaya, Y., and Matsumoto, D.: Mid- to late-Holocene marine inundations inferred from coastal deposits facing the Nankai Trough in Nankoku, Kochi Prefecture, southern Japan, Holocene, 28, 867–878, https://doi.org/10.1177/0959683617752837, 2018.
Tanioka, Y. and Satake, K.: Tsunami generation by horizontal displacement of ocean bottom, Geophys. Res. Lett., 23, 861–864, https://doi.org/10.1029/96GL00736, 1996.
Thingbaijam, K. K. S., Mai, P. M., and Goda, K.: New empirical earthquake-source scaling laws, Bull. Seismol. Soc. Am., 107, 2225–2246, https://doi.org/10.1785/0120170017, 2017.
Watanabe, S., Bock, Y., Melgar, D., and Tadokoro, K.: Tsunami scenarios based on interseismic models along the Nankai trough, Japan, from seafloor and onshore geodesy, J. Geophys. Res.-Solid., 123, 2448–2461, https://doi.org/10.1002/2017JB014799, 2018.
Yokota, Y., Ishikawa, T., Watanabe, S., Tashiro, T., and Asada, A.: Seafloor geodetic constraints on interplate coupling of the Nankai Trough megathrust zone, Nature, 534, 374–377, https://doi.org/10.1038/nature17632, 2016.