the Creative Commons Attribution 4.0 License.
the Creative Commons Attribution 4.0 License.
 | 03 Nov 2020
Macrozonation of seismic transient and permanent ground deformation of Iran
Saeideh Farahani
Behrouz Behnam
Ahmad Tahershamsi
Iran is located on the Alpide earthquake belt, in the active collision zone between the Eurasian and Arabian plates. This issue makes Iran a country that suffers from geotechnical seismic hazards associated with frequent destructive earthquakes. Also, according to the rapid growth of population and demands for construction lifelines, risk assessment studies which should be carried out in order to reduce the probable damages are necessary. The most important destructive effects of earthquakes on lifelines are transient and permanent ground displacements. The availability of the map of the displacements caused by liquefaction, landslide, and surface fault rupture can be a useful reference for researchers and engineers who want to carry out a risk assessment project for each specific region of the country. In this study, these precise maps are produced and presented by using a considerable number of GIS-based analyses and by employing the HAZUS methodology. It is important to note that a required accuracy for risk assessment is approximately around the macro scale. So, in order to produce a suitable map for risk assessment goals, in terms of accuracy, the GIS-based analyses are employed to map all of Iran.
- Article
(39135 KB) - Full-text XML
- BibTeX
- EndNote


As the plate tectonic configuration of Iran in Fig. 1 shows, the country, which is located on the Alpide earthquake belt, is one of the most highly earthquake-prone zones of the world (Taherian and Kalantari, 2019). In addition, Iran has various geographical conditions that can cause landslide and liquefaction, in mountainous and coastal areas, respectively. The first earthquake effect, which can damage lifelines and infrastructure, is the transient ground displacement (TGD), which is caused by seismic wave propagation. The second one is the permanent ground displacement (PGD), which may result in liquefaction, landslide, and ground failure. For risk assessment of lifelines and infrastructure which are widespread throughout the country, investigating the TGD and PGD is of vital importance. Many studies have proposed technical methods for evaluating TGD and PGD and for specific cases in different regions of the country, some of which are discussed in the following paragraphs.
While landslides are considered as one of the most disastrous natural hazards in Iran, there is a lack of precise information on them for most parts of the country, and only a small percentage of the country's area has been specifically investigated to provide data for landslide susceptibility maps. Tangestani (2004) investigated the landslide susceptibility mapping using the fuzzy gamma approach in a GIS basis for the Kakan catchment area, south-west Iran. Babakan et al. (2009) proposed a seismo-geotechnical zonation mapping of the southern Caspian Sea coastline. Daneshvar and Bagherzadeh (2011) evaluated the landslide hazard zonation using GIS analysis at Golmakan Watershed, north-east of Iran. Moradi et al. (2012) implemented a GIS-based landslide susceptibility mapping by employing the analytical hierarchy process (AHP) method for Dena City. A landslide hazard zonation was carried out by employing statistical-based methods for Pishkuh region in Fereydonshahr by Shirani and Seif (2012). Aghda and Bagheri (2015) evaluated an earthquake-induced landslide hazard zonation method for the Sarein earthquake in 1997. A landslide hazard zonation and risk analysis in Goloord region, north of Iran, was carried out using the AHP method by Adib and Afzal (2018). Arjmandzadeh et al. (2019) presented a GIS-based landslide susceptibility mapping for Qazvin Province in Iran. Mokhtari and Abedian (2019) investigated the spatial prediction of landslide susceptibility in the Taleghan basin. Vakhshoori et al. (2019) studied the landslide susceptibility mapping of Bandar Torkaman by employing GIS-based data mining algorithms.

Figure 1Schematic tectonic map of Iran (Alavi, 1994).
There have also been investigations on landslides using remote sensing tools. Esmali and Ahmadi (2003) evaluated a mass movement hazard zonation using GIS and remote sensing (RS) in Germichay Watershed, Ardebil. A monitoring of the massive slow Kahrod landslide in the Alborz range was implemented using GPS and synthetic aperture radar interferometry by Peyret et al. (2008). Akbarimehr et al. (2013) assessed the slope stability of the Sarcheshmeh landslide, north-east Iran, by using interferometric synthetic aperture radar (InSAR) and GPS observations. Mirzaee et al. (2017) evaluated three InSAR time-series methods to assess the creep motion of the Masouleh landslide in north Iran. Pirasteh et al. (2018) used a lidar-derived digital elevation model (DEM) and a stream length-gradient index approach for investigating the landslides in the Zagros Mountains. A landslide hazard mapping using a radial basis function neural network model was performed for a case study in Semirom, Isfahan, by Yavari et al. (2019).
From a different view, liquefaction is also one of the seismic geohazards which can significantly affect the performance of lifelines during or after earthquakes. Studies have addressed liquefaction through different methods for different regions of Iran. Askari et al. (2006) evaluated the liquefaction potential of the south of Tehran using the standard penetration test and the shear wave velocity measurement. Naghizadehrokni et al. (2018) presented liquefaction maps in Babol City using probabilistic- and deterministic-based approaches. Risk assessment of existing structures due to the liquefaction potential of Astaneh-ye Ashrafiyeh City was performed by Ziabari et al. (2017). Liquefaction assessment using micro-tremor measurements and artificial neural networks was carried out by Rezaei and Choobbasti (2014) for Babol City. Sakvand et al. (2011) investigated liquefaction risk zoning in the Silakhor plain. Liquefaction-induced lateral spreading displacement was evaluated probabilistically for a site in the south of Iran by Kavand and Haeri (2009). Koike et al. (2004), Mousavi et al. (2014), and Farahani et al. (2020) also evaluated liquefaction-induced displacement of Tehran, Azerbaijan, and Asaluyeh, respectively, in order to assess the risk of the gas pipelines.
The majority of large earthquakes are associated with surface ruptures, which cause secondary hazards to arise. Fault rupture hazard is defined as a displacement imposed by fault rupture on structures and objects during an earthquake (Perrin and Wood, 2003). There are empirical equations which are established based on the global and regional records of seismic events and are used to predict geometrical and kinematic characteristics of the potential ruptures along active faults, including surface rupture length (SRL), maximum displacement (MD), and average displacement (AD) (e.g. Öztürk et al., 2018; Manighetti et al., 2007; Dowrick and Rhoades, 2004; Mason, 1996; Wells and Coppersmith, 1994). SRL and MD are correlated with each other and earthquake magnitudes and provide the most well-known equations for deterministic evaluation of earthquake hazards imposed by faults as significant sources of seismic energy. Stramondo et al. (2005) investigated the surface displacements and source parameters of the 2003 Bam earthquake using Envisat advanced synthetic aperture radar imagery. Surface displacement and fault modelling for the 2003 Bam earthquake were evaluated using the InSAR method by Stramondo et al. (2005).
However, there are few studies that have addressed all the ground displacements caused by earthquakes for all the regions of Iran. Moreover, there is no comprehensive study presenting a map of surface-rupture-induced displacement of Iran. Some studies proposed only empirical relations between different parameters of Iran's faults. However, these parameters have never been calculated for all of Iran's faults in order to estimate the rupture-induced displacements in a widespread zone of the country. In this study, PGD is calculated and mapped using the HAZUS methodology (FEMA, 2012). Also, a map of ground displacement due to surface rupture is produced via a GIS-based approach and the HAZUS methodology. Hence, the novelty of this study is not only the macro zonation of the PGD caused by earthquakes all over Iran, but also the presentation of the first map of fault displacement, which can affect the lifelines it is near to or crosses. As well, all mapping of displacements is carried out on a macro scale. This is due to the fact that from a risk assessment perspective, macro zonation is useful enough and that there is no need to study the issues using a micro-scale approach. Therefore, the HAZUS methodology is employed here in order to take advantage of its straightforward equations and fragility curves, which were obtained by a huge number of analytical and experimental studies worldwide. It is important to note that although the HAZUS methodology can be used as a functional tool for loss estimation in almost all countries, it is rare to find a comprehensive study to present macrozonation of seismic ground deformation of any country around the world. The majority of the previous studies were carried out for specific small regions in the countries. The exhaustive maps presented in the current study can facilitate future seismic risk assessment projects, which will study any lifeline systems in all areas of the country. Hence, the authors of this study believe that such a comprehensive endeavour to present practical maps can be useful for other countries which suffer from seismic hazards.
Table 1Correlations between topographic gradient and VS30 using the NED 9c digital elevation models for the National Earthquake Hazard Reduction Program (NEHRP) site classes (Allen and Wald, 2009).
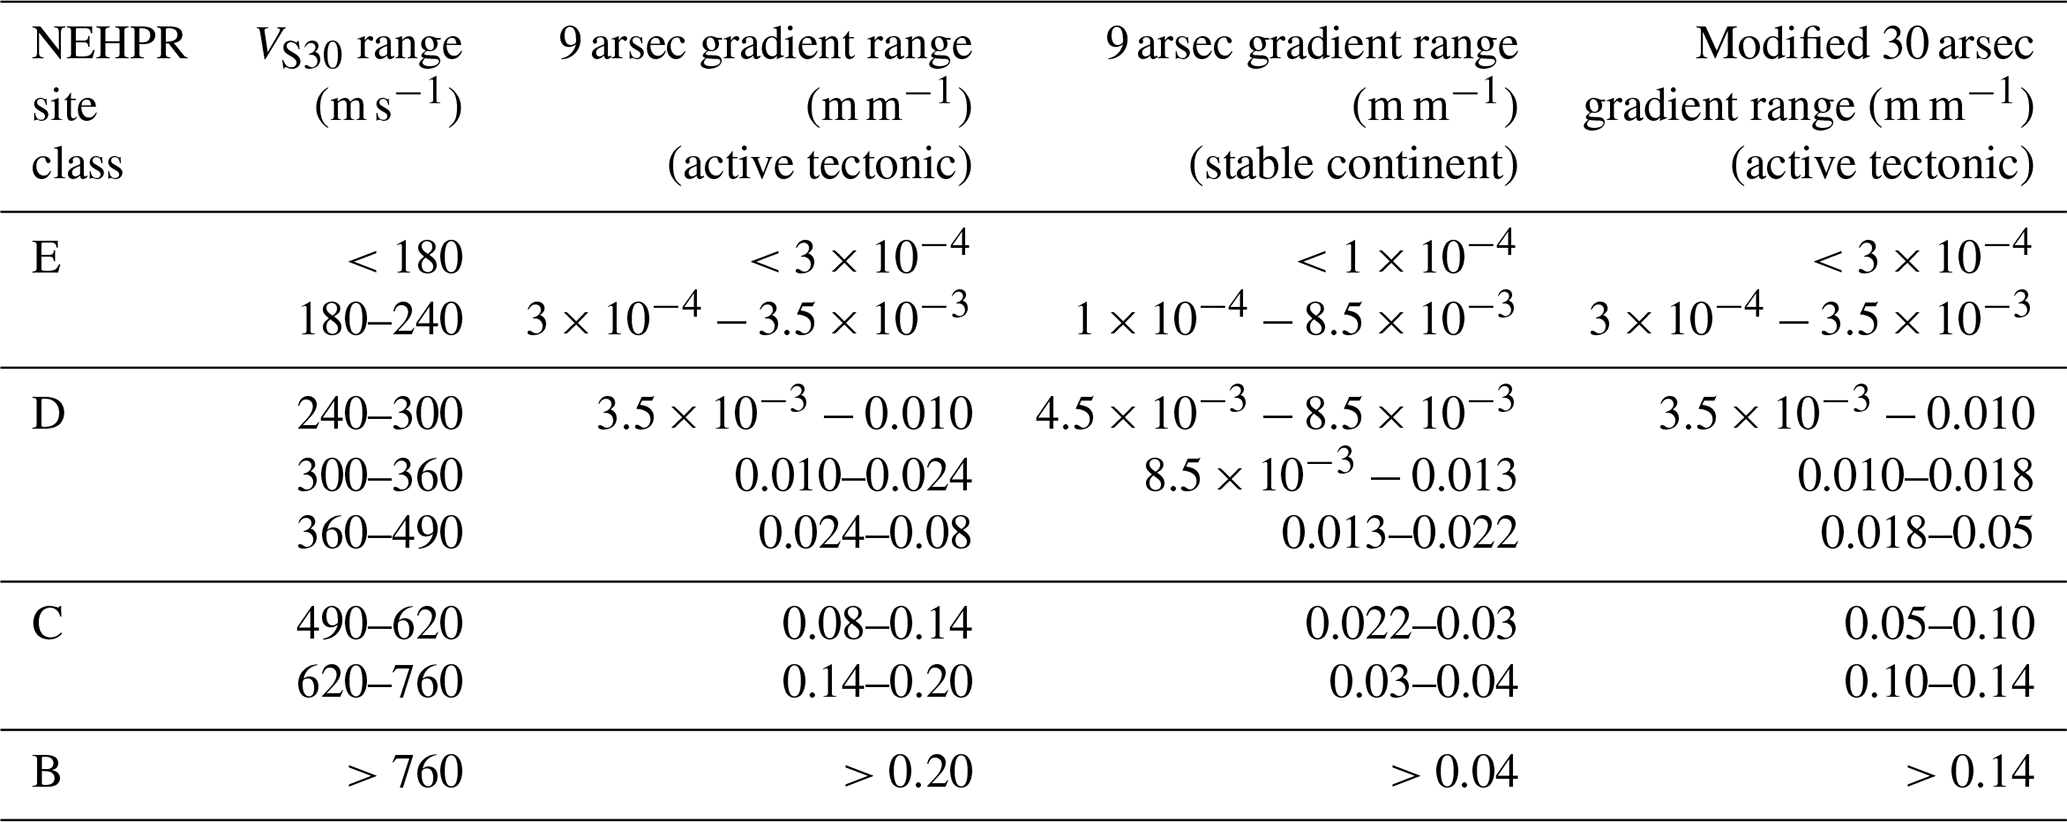
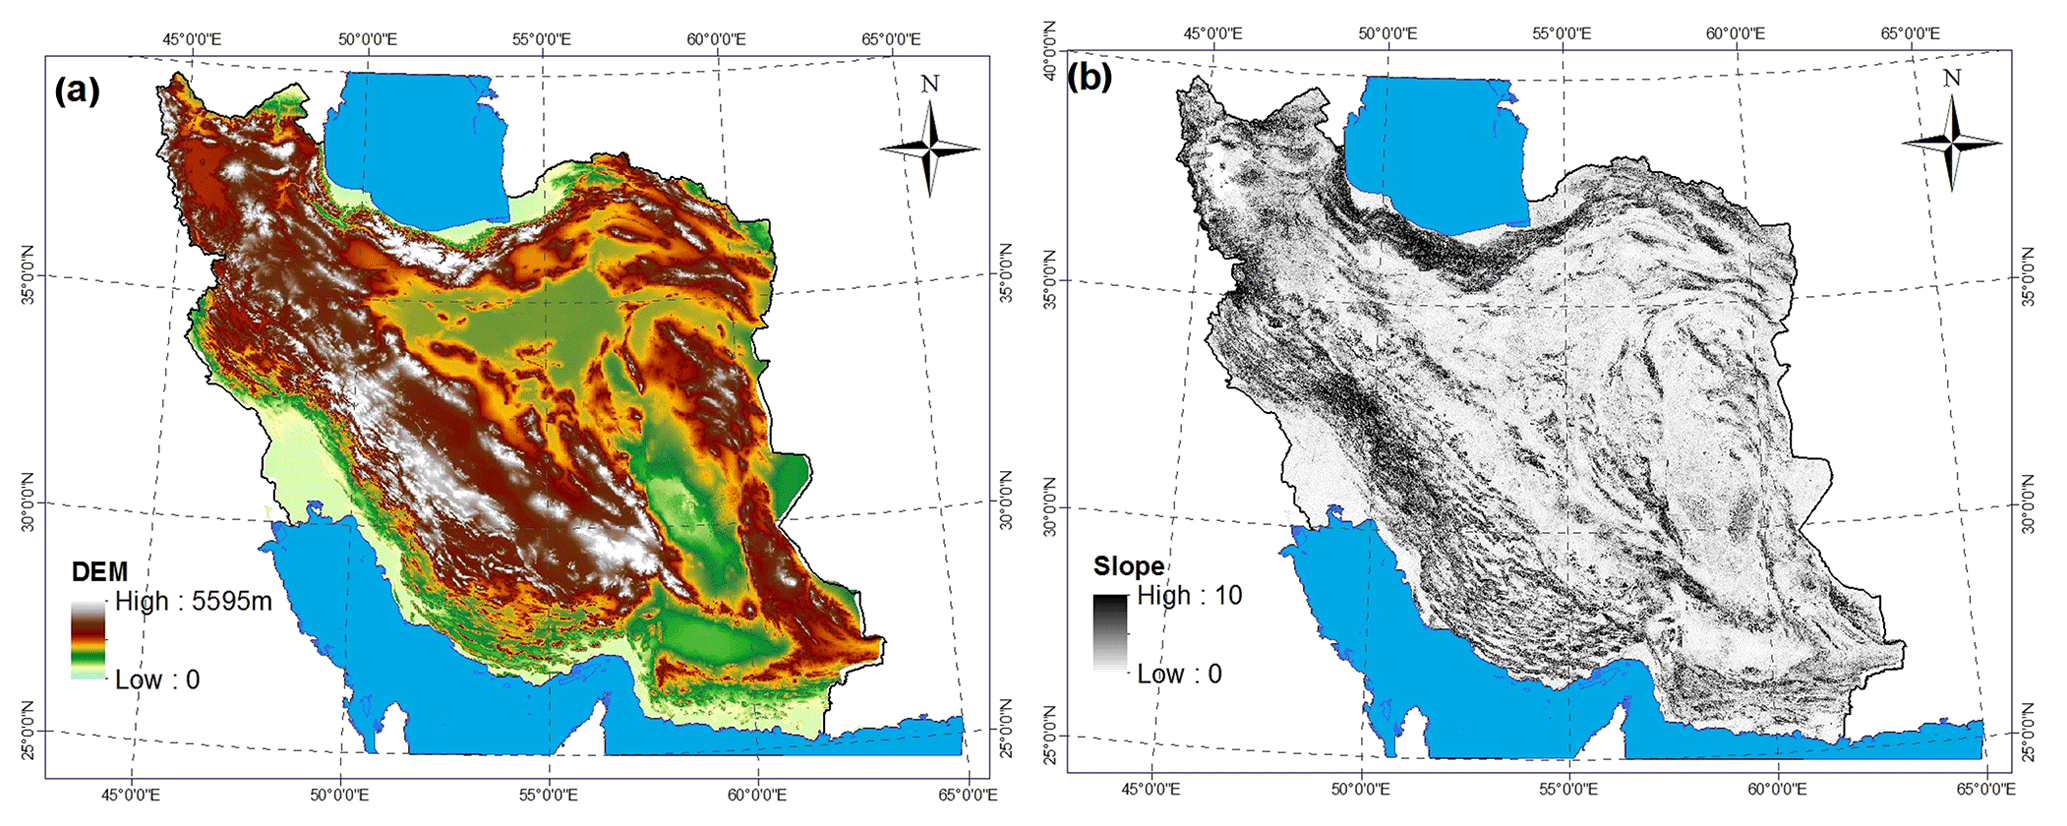
Figure 3(a) Global 1 arcsec (30 m) SRTM digital elevation model (DEM) of Iran, (b) slope map of Iran.
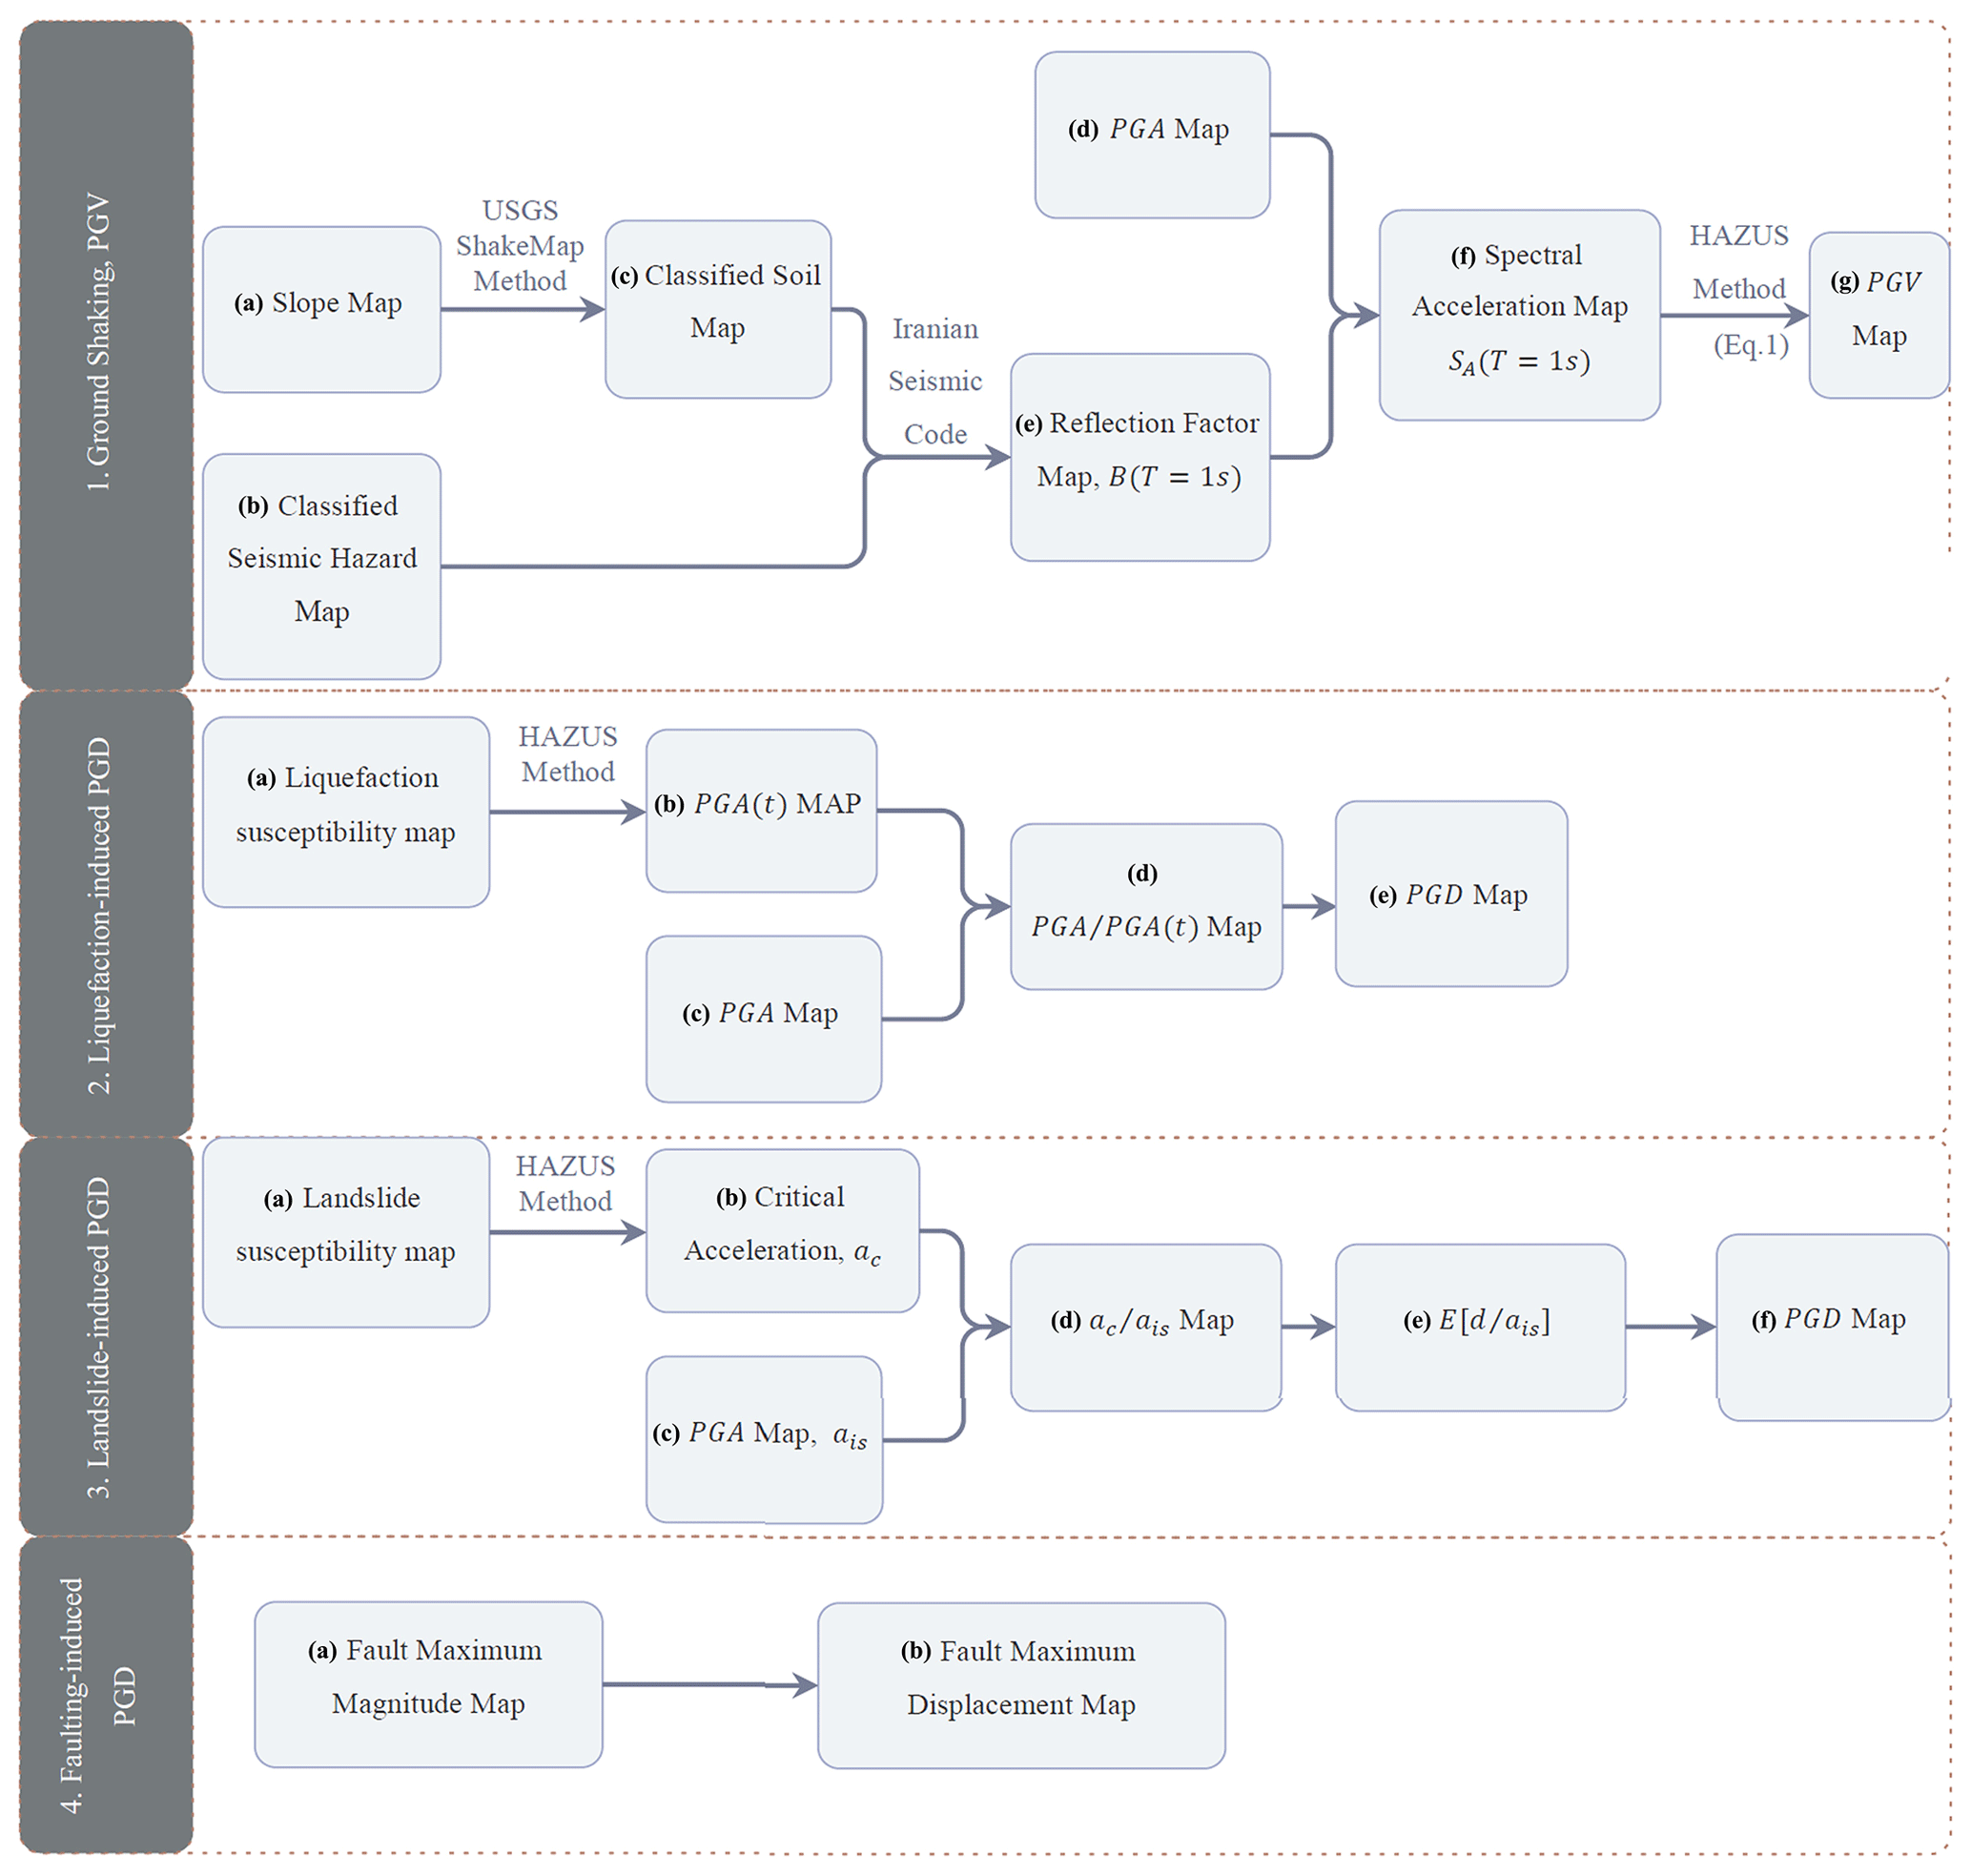
As we know, a rough estimation of the severity and geographic distribution of lifeline seismic risks can help risk managers to allocate critical resources in disaster management, mitigation, and preparedness processes. Since investigating and quantifying the seismic hazards is the first step to evaluating the seismic-induced damages to any lifelines, the output of the current study, in the form of PGD and TGD maps, can be considered as one of the most important input data for the lifeline seismic risk assessment projects. As shown in Fig. 2, in order to produce a peak ground velocity (PGV) map, a classified soil map was produced using the USGS ShakeMap method and by employing an available slope map of the country. According to the Iranian seismic code, a reflection factor map and after that a spectral acceleration map was produced in order to generate the PGV map of the country. In addition, an available liquefaction and landslide susceptibility map was employed to produce the PGD maps using HAZUS methodology and GIS-based analyses. Finally, the fault maximum displacement map is produced using a fault maximum magnitude map, which was presented previously by Karimiparidari (2014).
For estimating the TGD caused by seismic waves propagation (ground shaking), PGV is needed. As HAZUS proposed, for obtaining PGV, the first step is to calculate the spectral acceleration by having a soil classification of a region in terms of dynamic properties. According to the ShakeMap (Wald et al., 2005) method, for regions lacking Vs30 maps, including most of the globe, the approach of Allen and Wald (2007), which was revised by Allen and Wald (2009) and provides estimations of Vs30 as a function of more available topographic slope data, can be employed. It is important to note that some validation studies were performed by researchers like Shahvar (2013), in order to evaluate the merit of the Allen and Wald (2009) study for the geological situation of Iran. In this study, soil classification is carried out using a topographic gradient map. As shown in Fig. 3a, a global 1 arcsec (30 m) SRTM DEM of Iran is used for producing a slope map (stated in Fig. 2(1a)) as shown in Fig. 3b. After that, the soil classification map (stated in Fig. 2(1c)) is produced as shown in Fig. 4 and using Table 1, which presents correlations between topographic gradient and VS30.
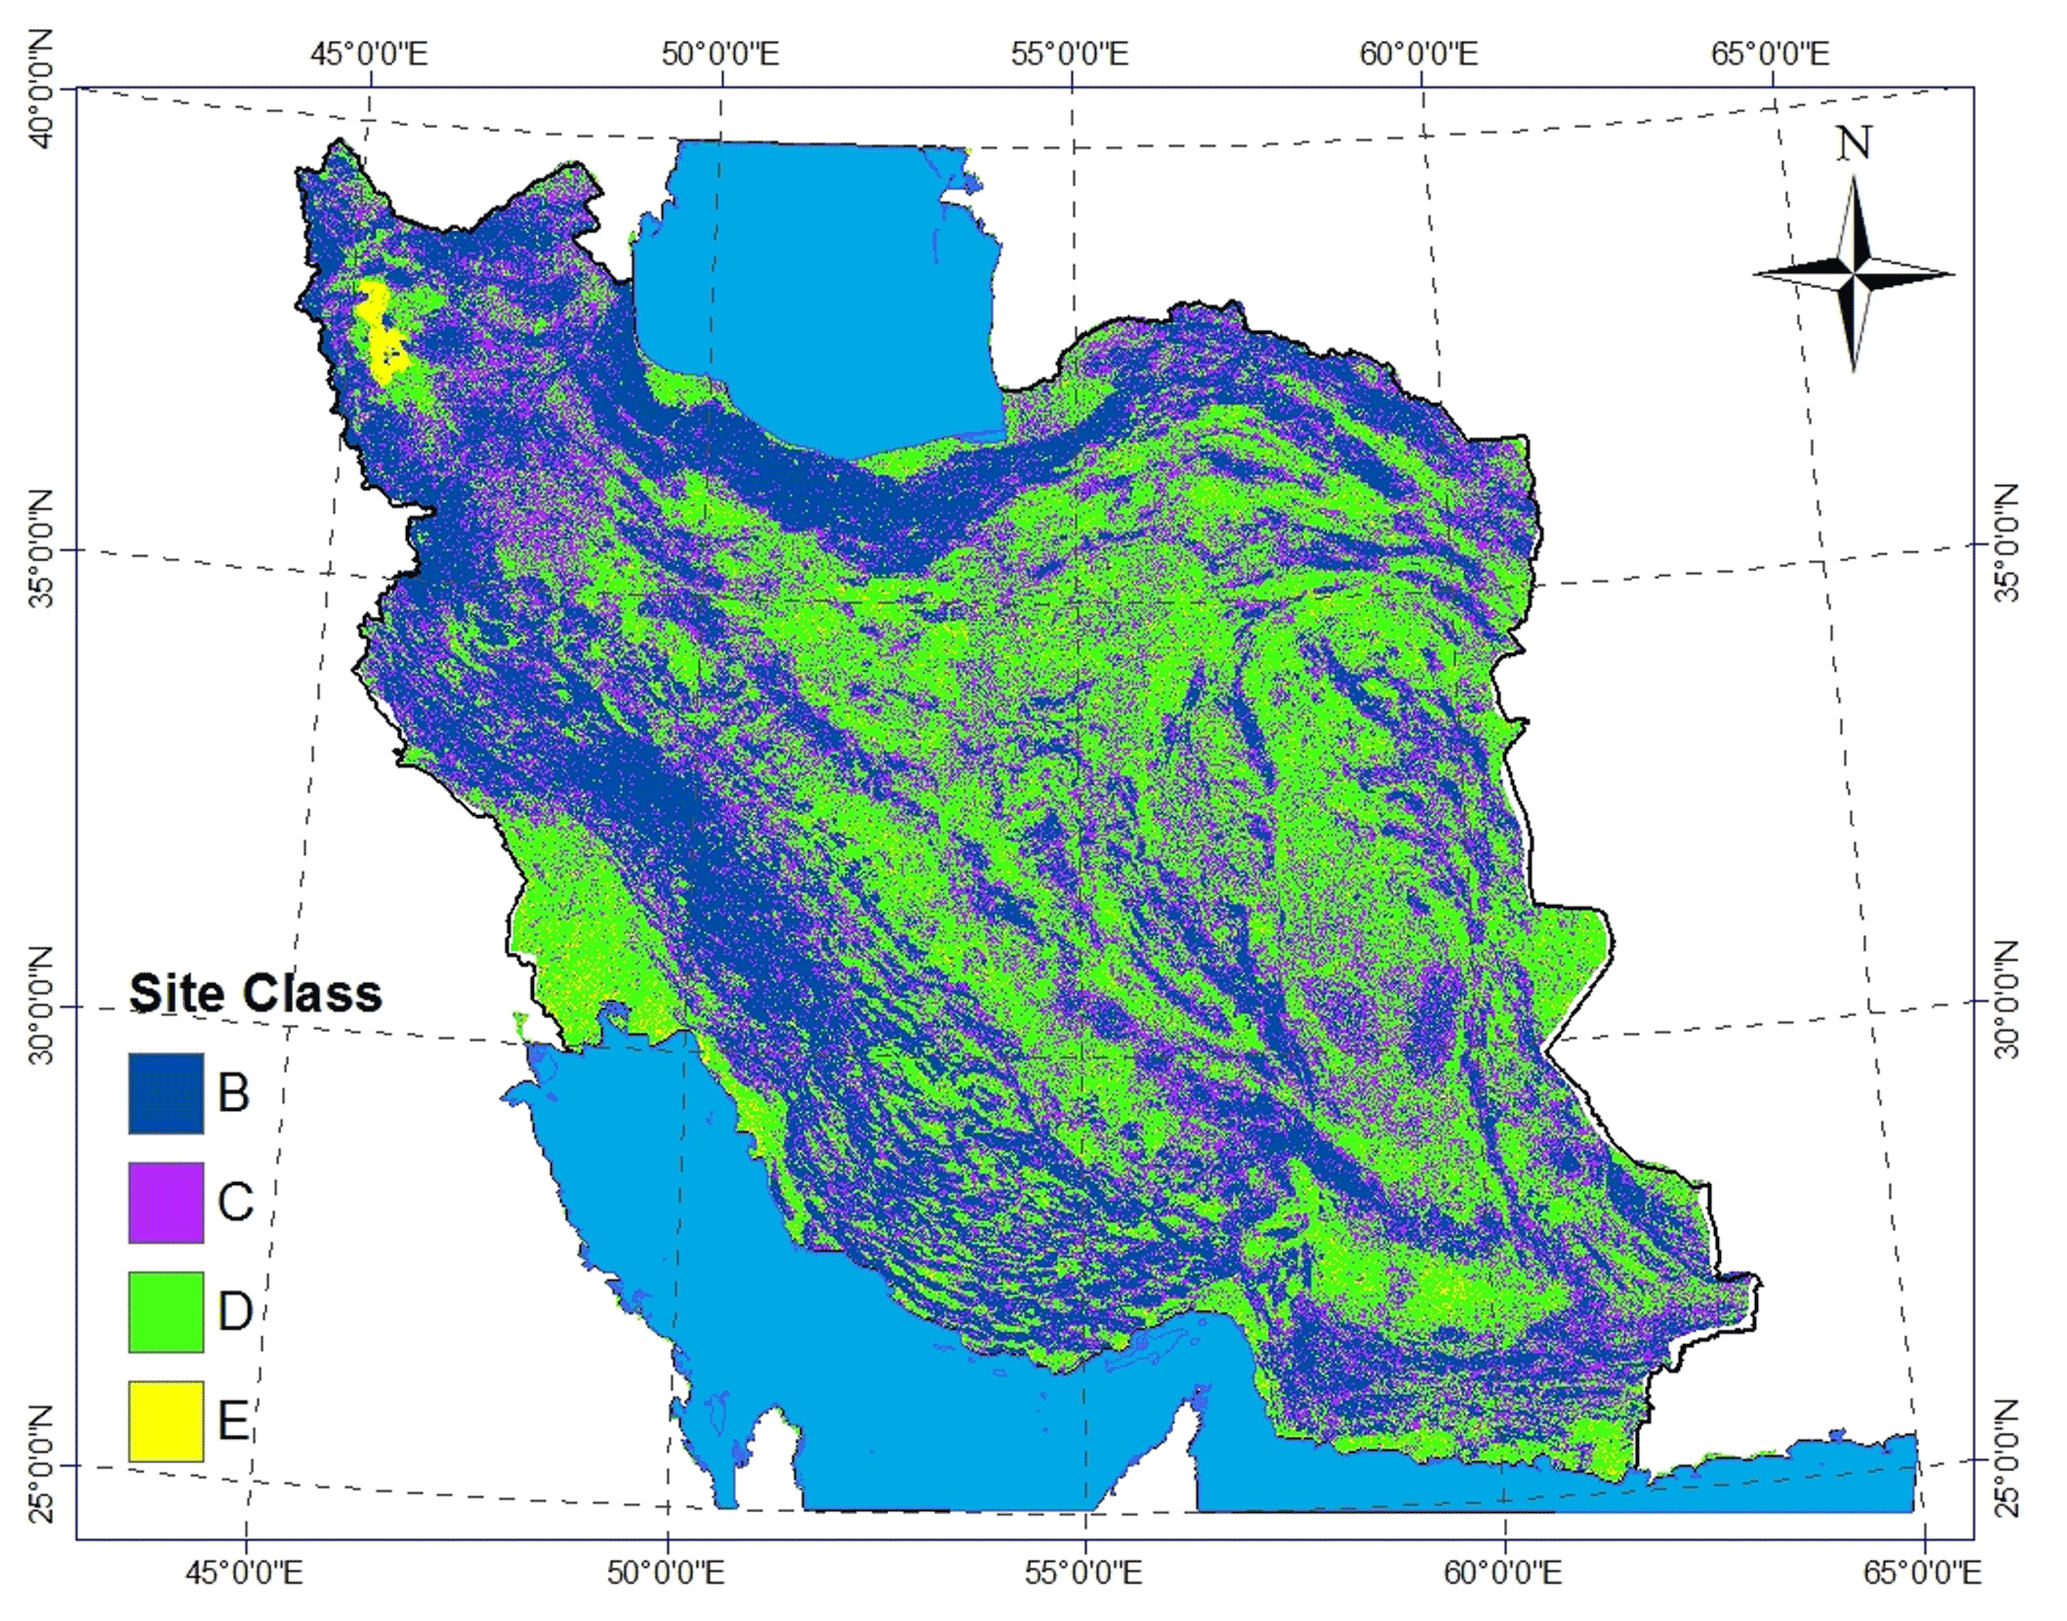
Figure 4Produced soil classification map of Iran, using Allen and Wald (2009) method.
According to the Iranian seismic code (also known as the Standard No. 2800) (BHRC, 2015), for calculating spectral acceleration, a reflection factor should be obtained. Reflection factor (known as B factor) is considered to account for the resonating effect of soft soil on ground movement at bedrock level; its value increases as the soil gets softer. The value of the reflection factor is relevant to two main parameters consisting of B1, spectrum shape factor, and N, spectrum modification factor. The parameters mentioned are correlated to the soil type and level of seismicity. According to the Iranian seismic code, Iran is divided into four seismic zones, including low, moderate, high, and very high seismicity levels. Also, the soil types consisting of types B–E are presented for the country. Hence, by merging the zonation of seismicity level and the soil classification map, the soil and seismic hazard class map is produced as shown in Fig. 5.
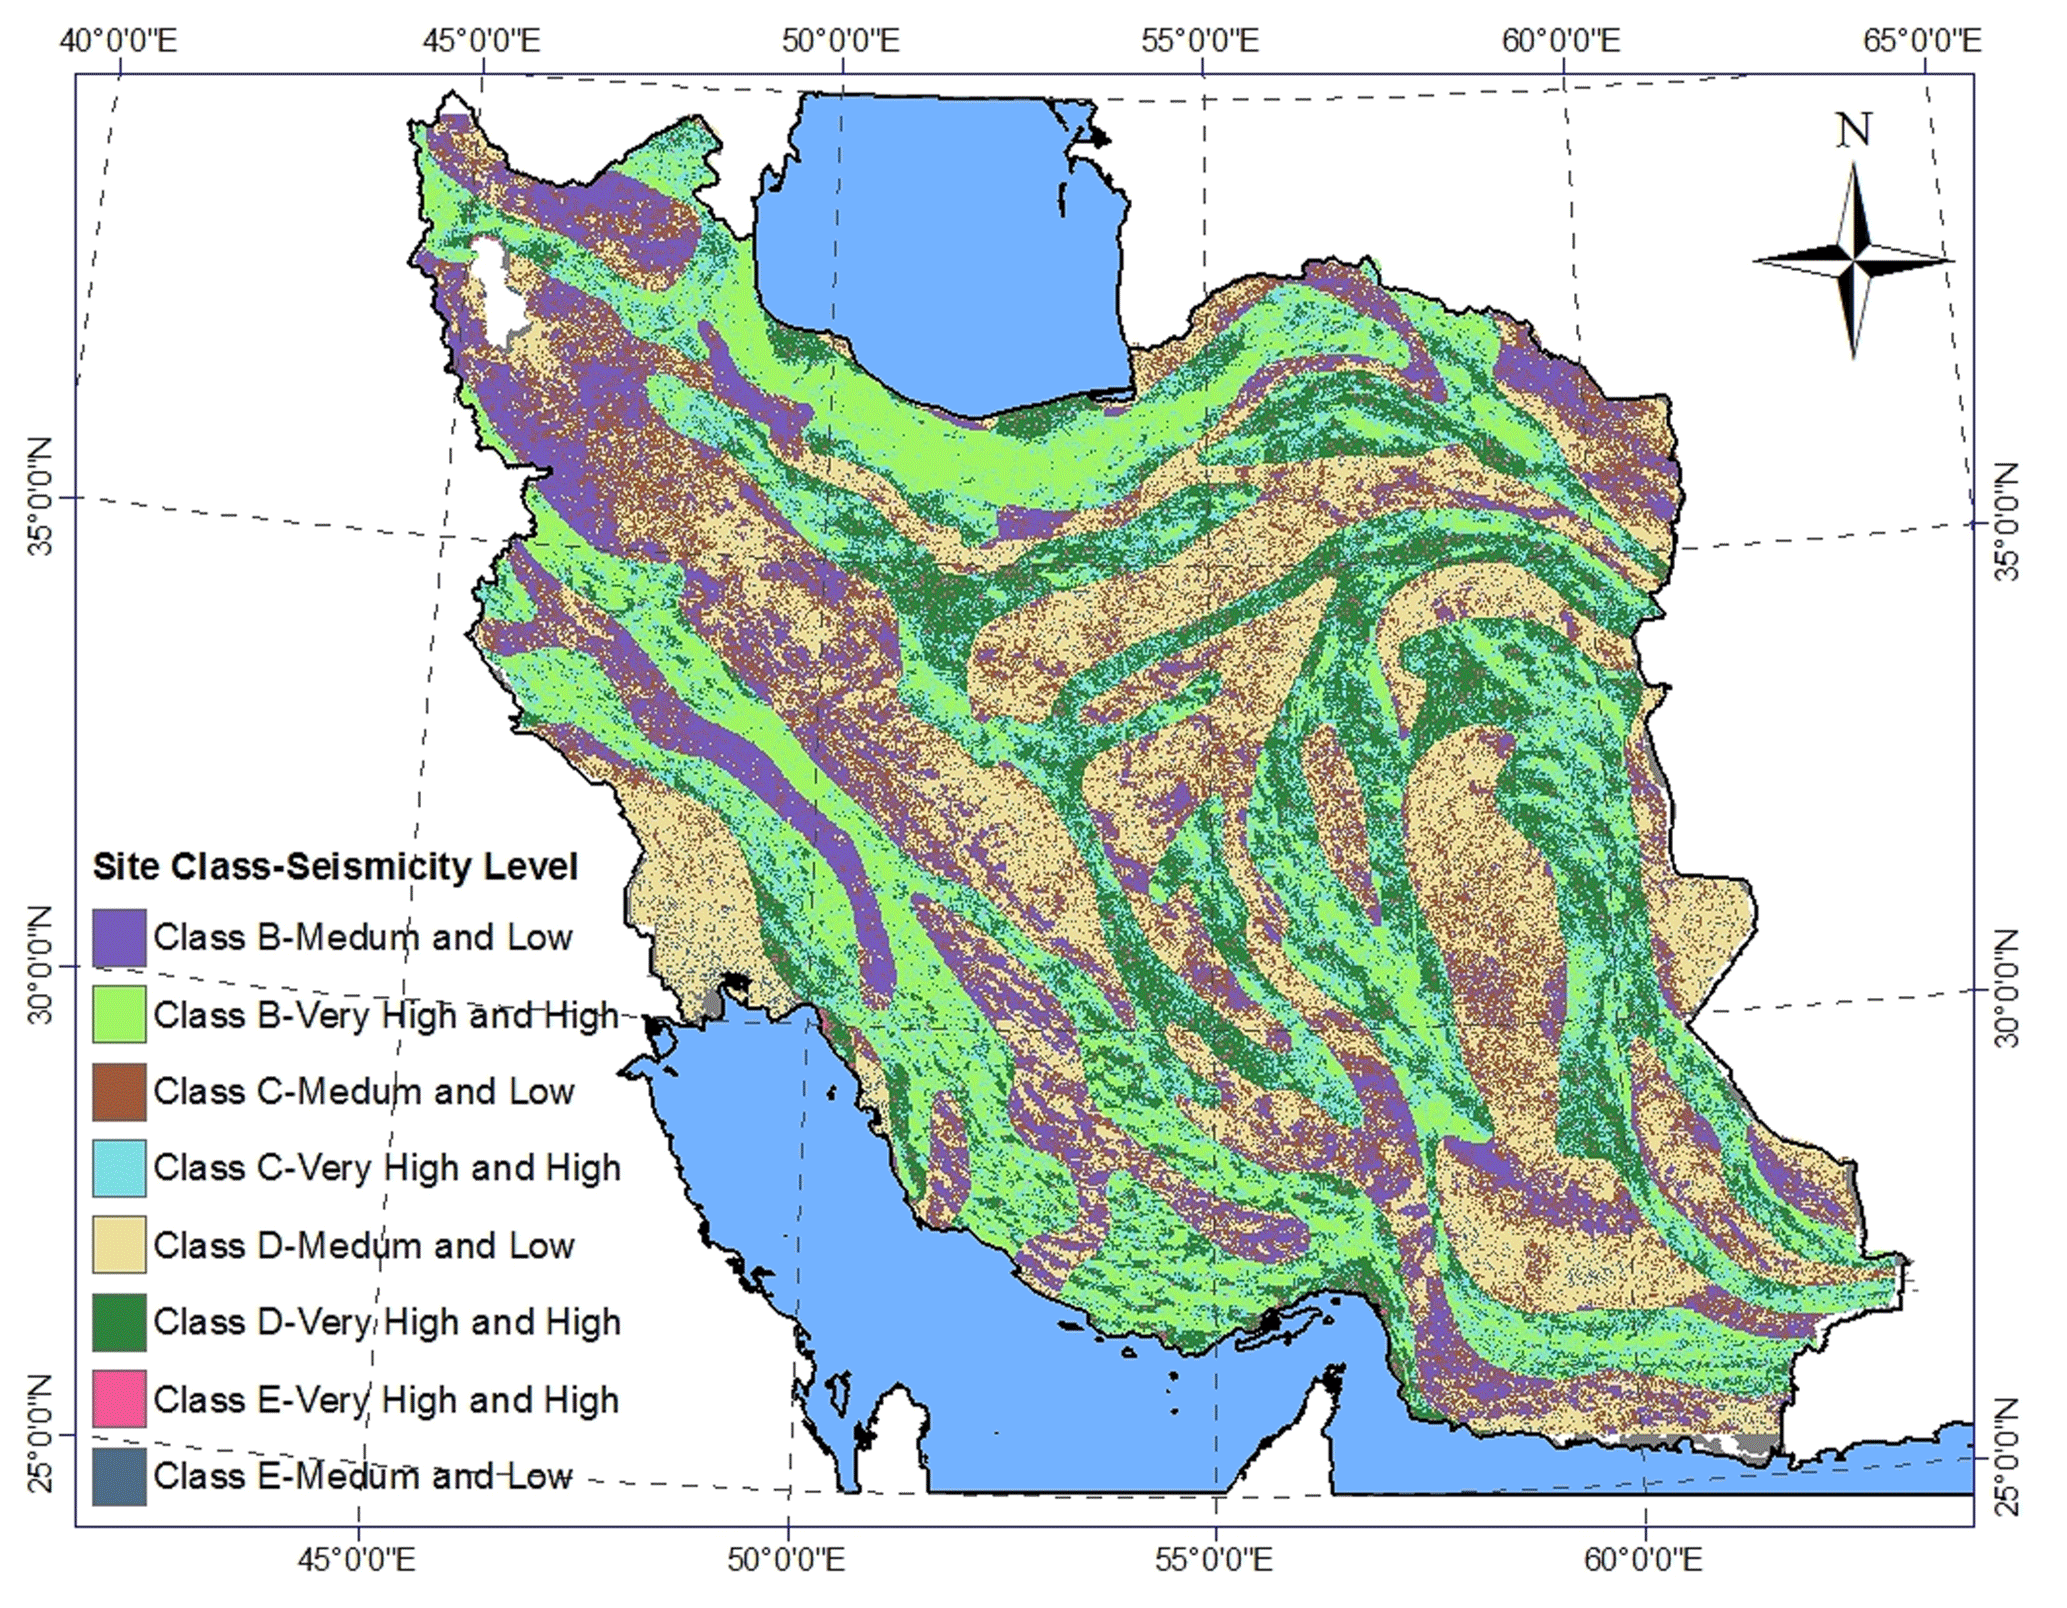
Figure 5Soil class and seismicity level map of Iran.
The value of B is obtained in eight different combinations of soil type and seismicity level by using the reflection factor spectrum (see Fig. 6) in order to calculate the PGV inferred from 1 s spectral response. The results are shown in Table 2. Therefore, the map of the reflection factor for the 1 s period (stated in Fig. 2(1e)) is obtained, as shown in Fig. 7a. Finally, by multiplying the reflection factor to a peak ground acceleration (PGA) map, the 1 s spectral acceleration (stated in Fig. 2(1f)) is produced as shown in Fig. 7b.
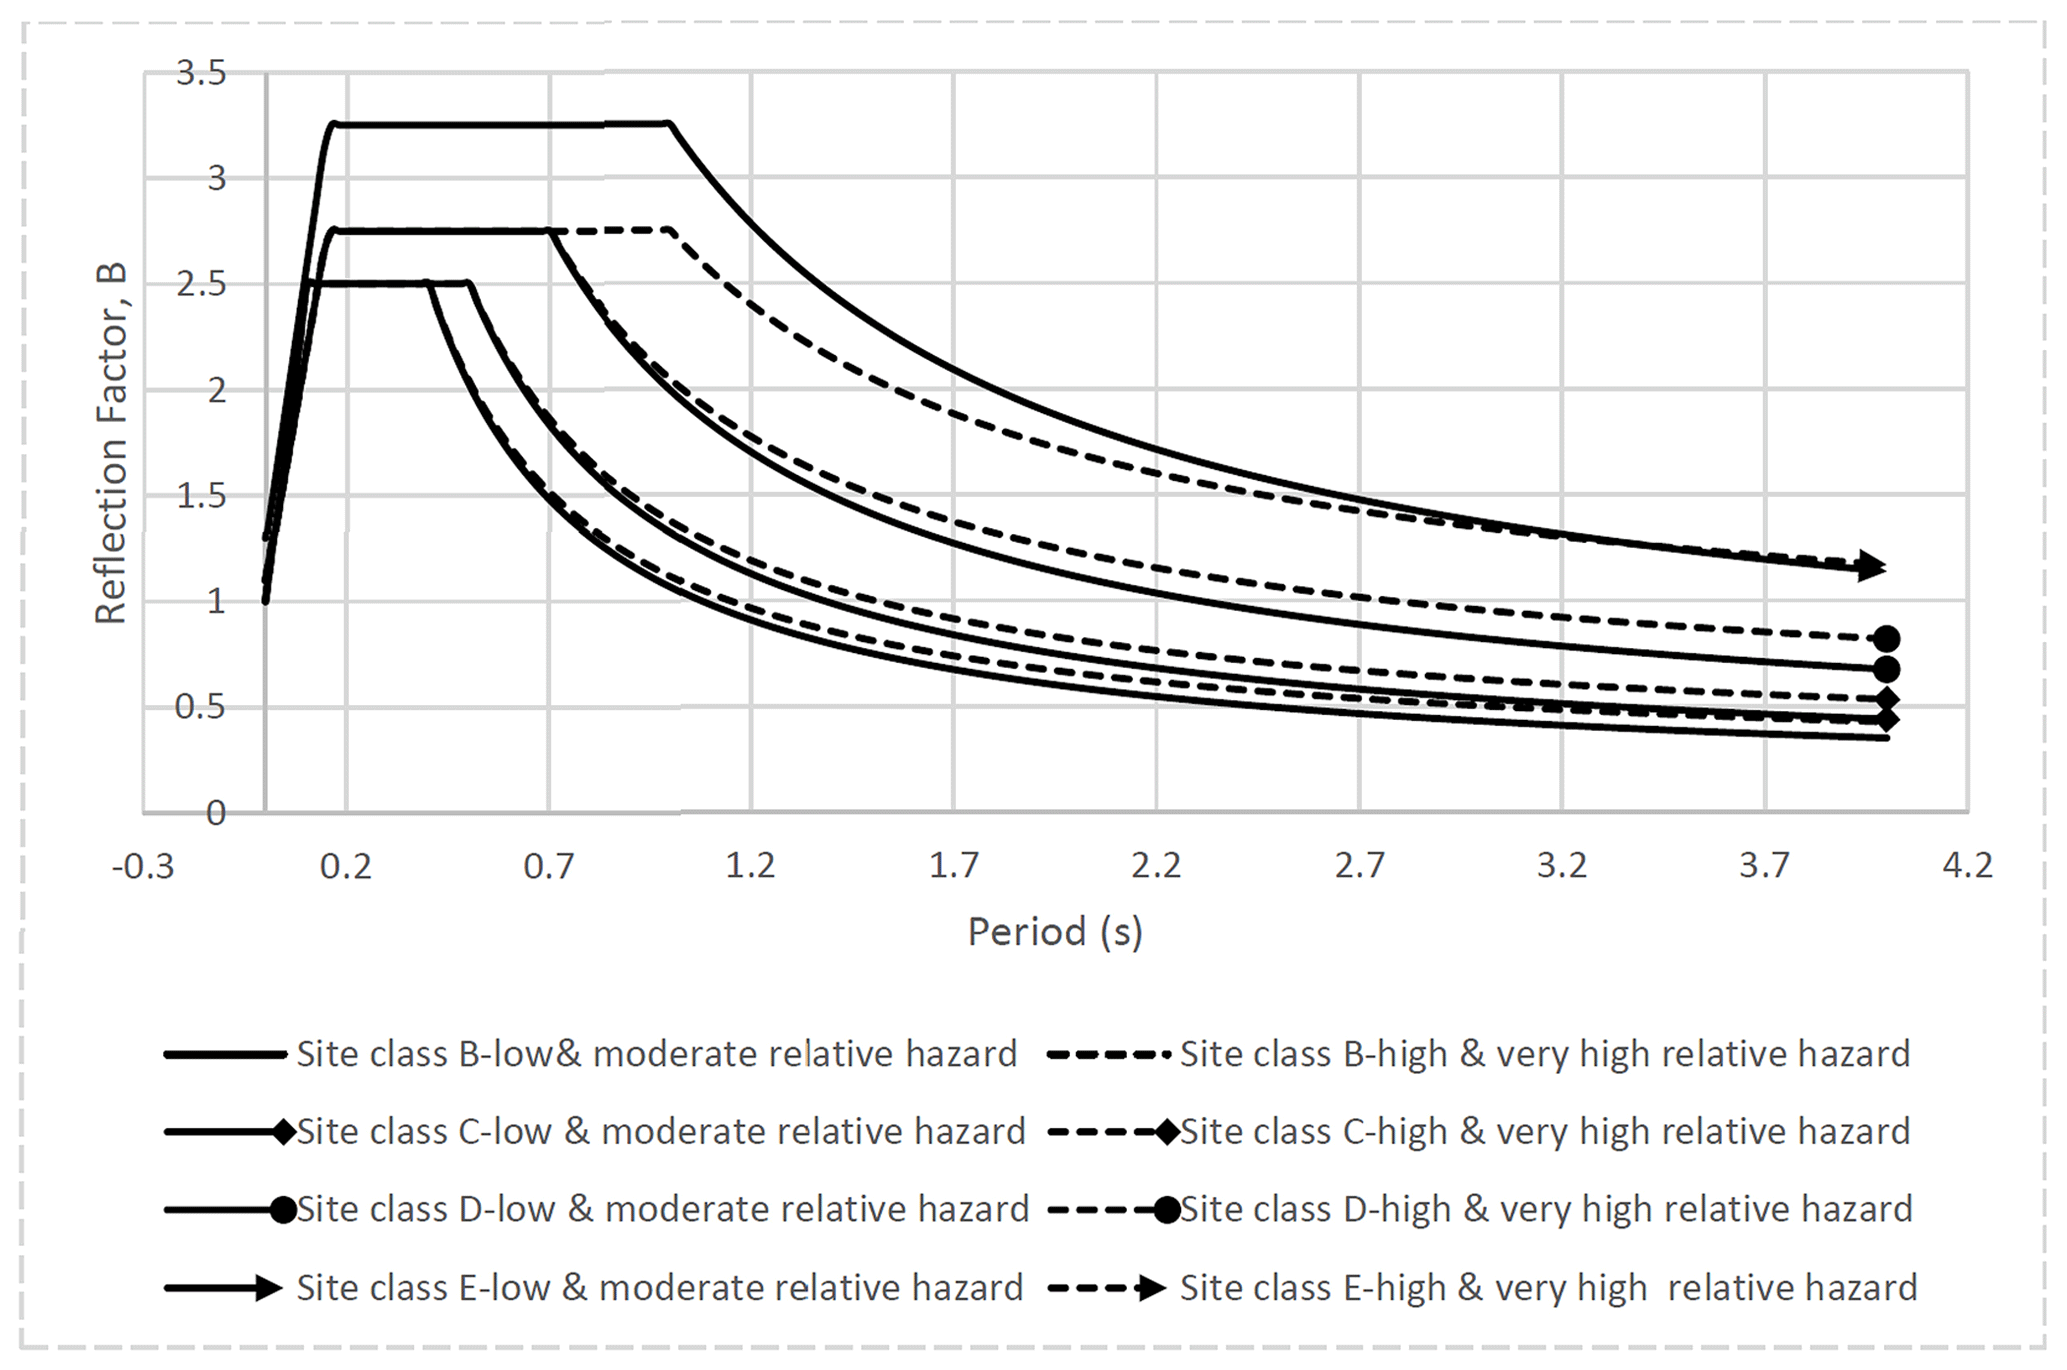
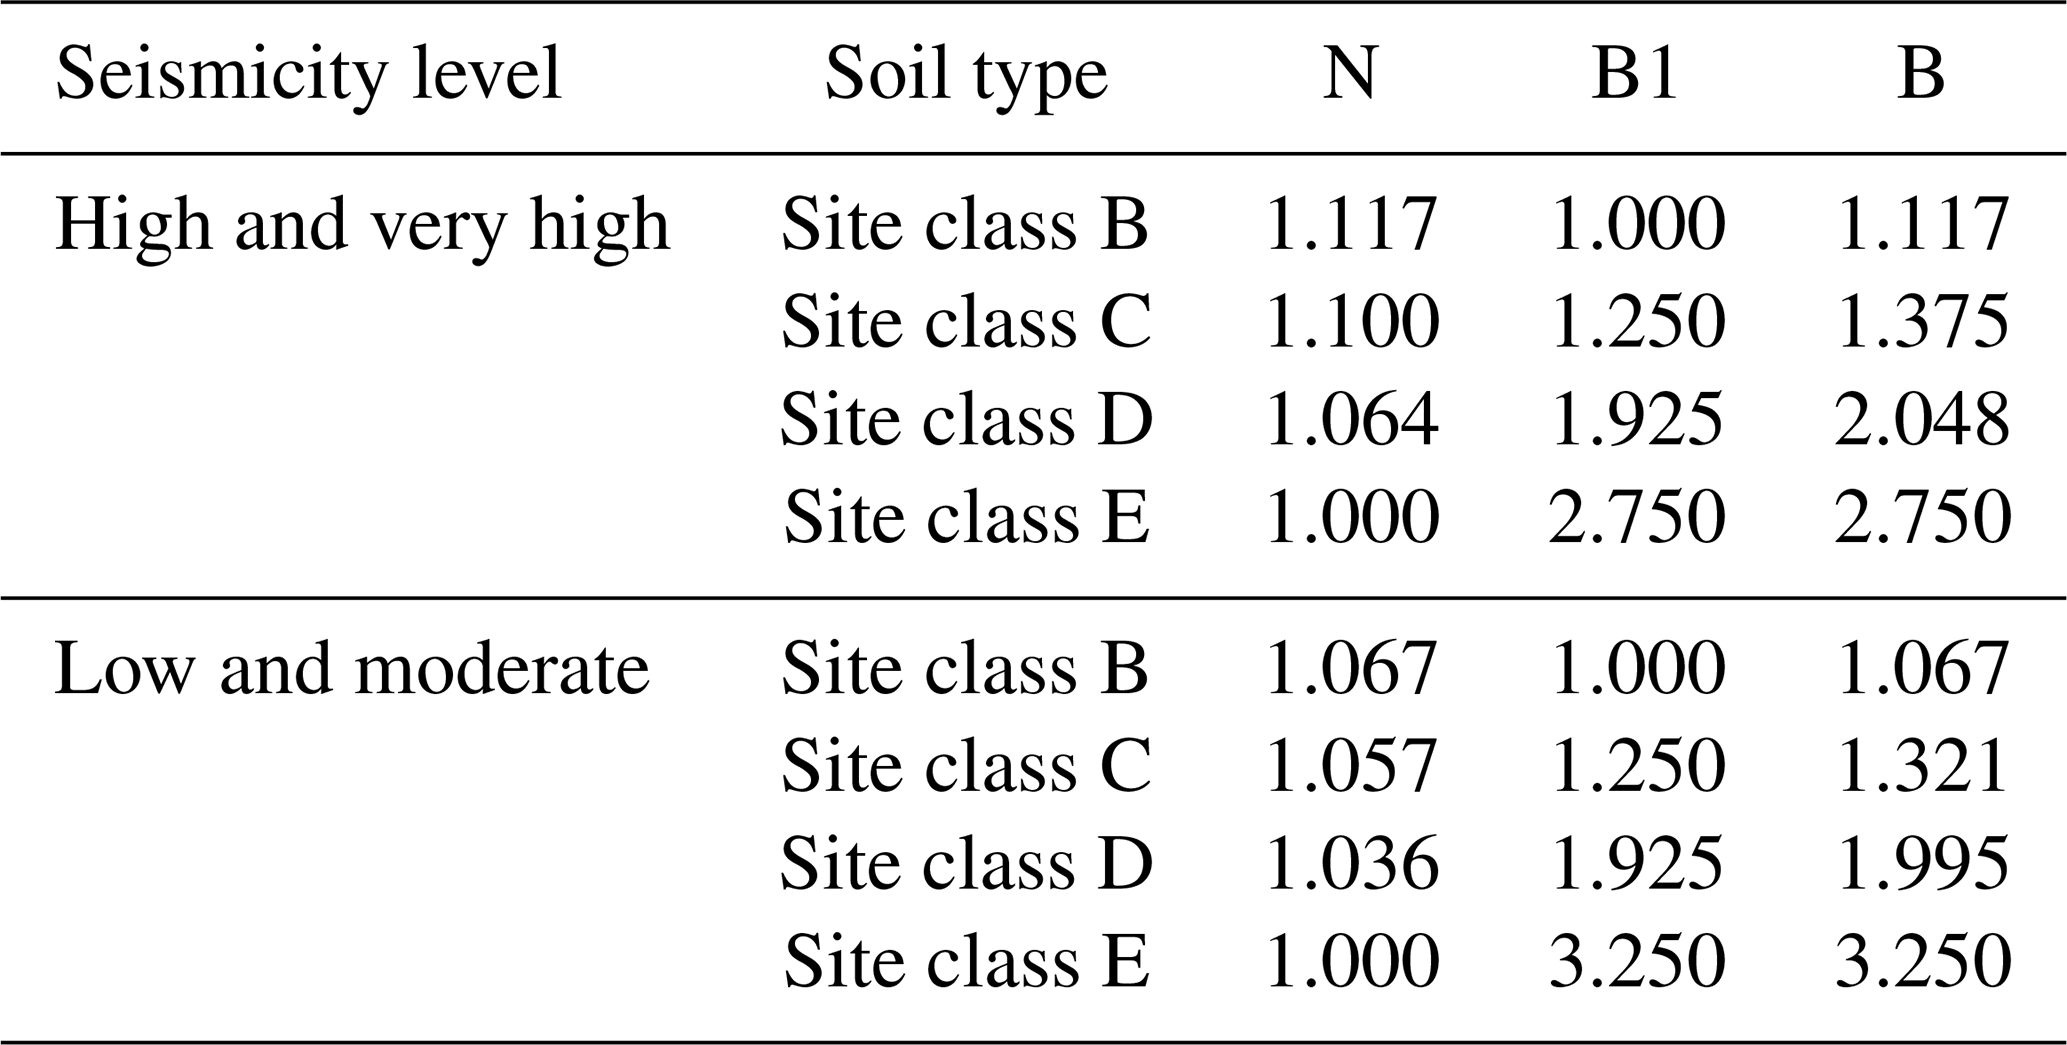
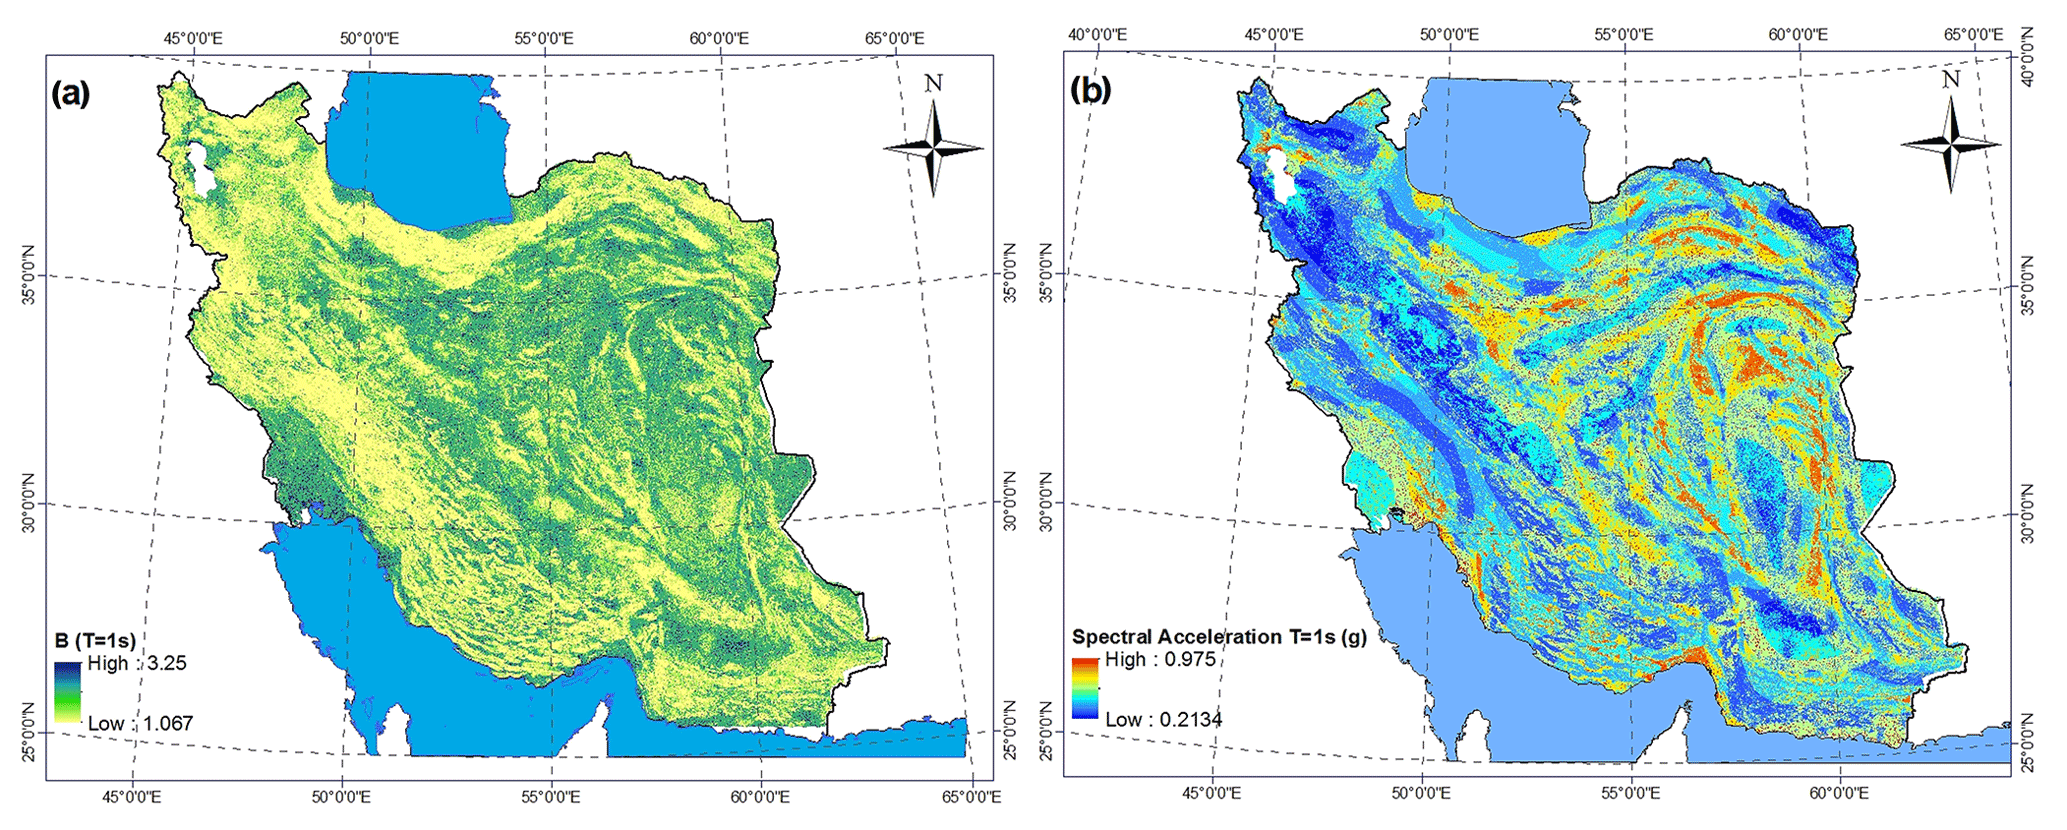
Figure 7(a) Map of the reflection factor in 1 s period, (b) map of the 1 s spectral acceleration.
PGV is inferred from 1 s spectral acceleration using Eq. (1).
The constant value of 1.65 in Eq. (1) represents the amplification assumed to exist between peak spectral response (1 s) and PGV. This value is based on the median spectrum amplification, as given in Newmark (1982), for a 5 % damped system whose period is within the velocity-domain region of the response spectrum. A PGV map (stated in Fig. 2(1g)) of Iran is presented in Fig. 8.
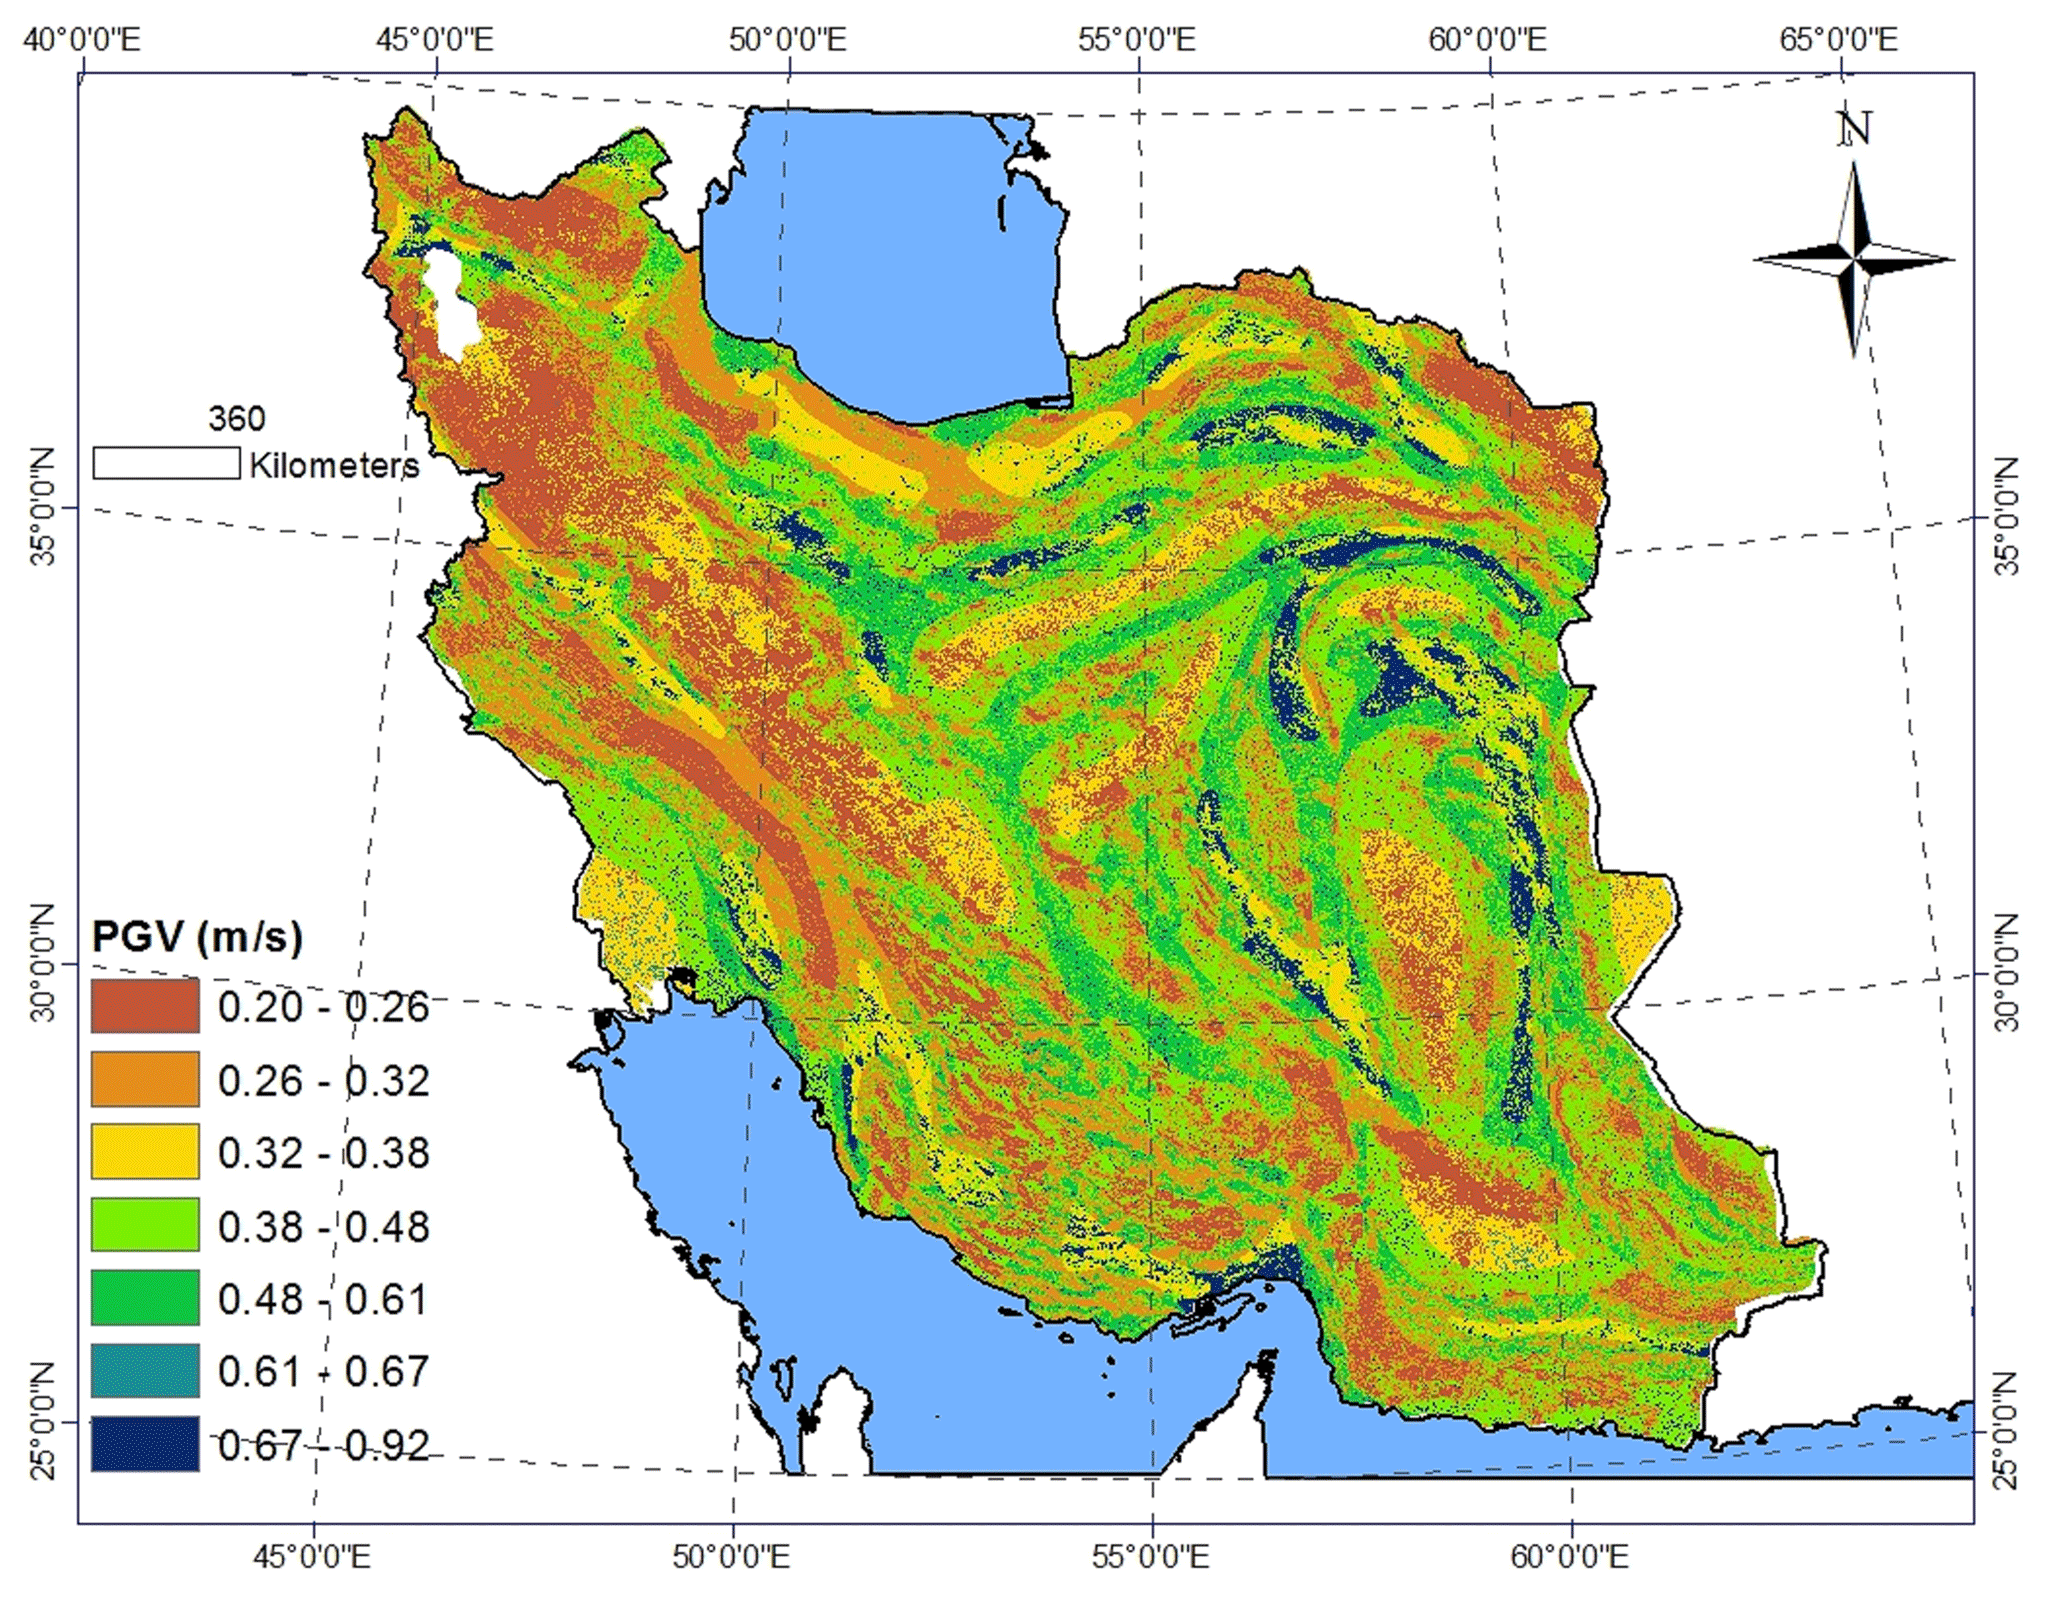
Figure 8PGV map of the Iran by using Eq. (1) and GIS-based analyses.
The ground failure is divided into the three main categories: liquefaction, landslide, and faulting. Each of these types of ground failure is quantified by PGD. Methods and alternatives for determining PGD due to each mode of ground failure are discussed below.
3.1 Liquefaction
Liquefaction is the most important hazard due to ground failure that often threatens infrastructures. Liquefaction is a soil behaviour phenomenon in which a saturated soil loses a substantial amount of strength due to high excess pore-water pressure generated by and accumulated during strong earthquake ground shaking (FEMA, 2012). In this study, in order to consider the failure caused by soil liquefaction, the Iran liquefaction susceptibility map (stated in Fig. 2(2a)) is used. This map is provided by the International Institute of Earthquake Engineering and Seismology (IIEES) and based on previous studies by Komakpanah and Farajzadeh (1995), as shown in Fig. 9a. The likelihood of experiencing liquefaction at a specific location is primarily influenced by the susceptibility of the soil, amplitude, duration of ground shaking, and depth of groundwater. Based on the HAZUS methodology, the probability of liquefaction for a given susceptibility category can be determined using Eq. (2):
where is the conditional liquefaction probability for a given susceptibility category at a specified level of PGA, KM is the correction factor for moment magnitudes other than M=7.5 as presented in Eq. (3), KW is the groundwater correction factor, and Pml is the proportion of the map unit susceptible. In terms of the values of KW and KM factors, the kW parameter is ignored due to the lack of a groundwater-level map of the country. However, the KM factors are calculated using the moment magnitudes of seismic provinces of the country, which was presented by Karimiparidari (2014). The values of Pml and are assigned according to HAZUS recommendations for each susceptibility class, as presented in Table 3. Zonation of the probability of liquefaction for all susceptibility categories is carried out, as shown in Fig. 9b–d.
Table 3Liquefaction susceptibility dependent parameters (FEMA, 2012).
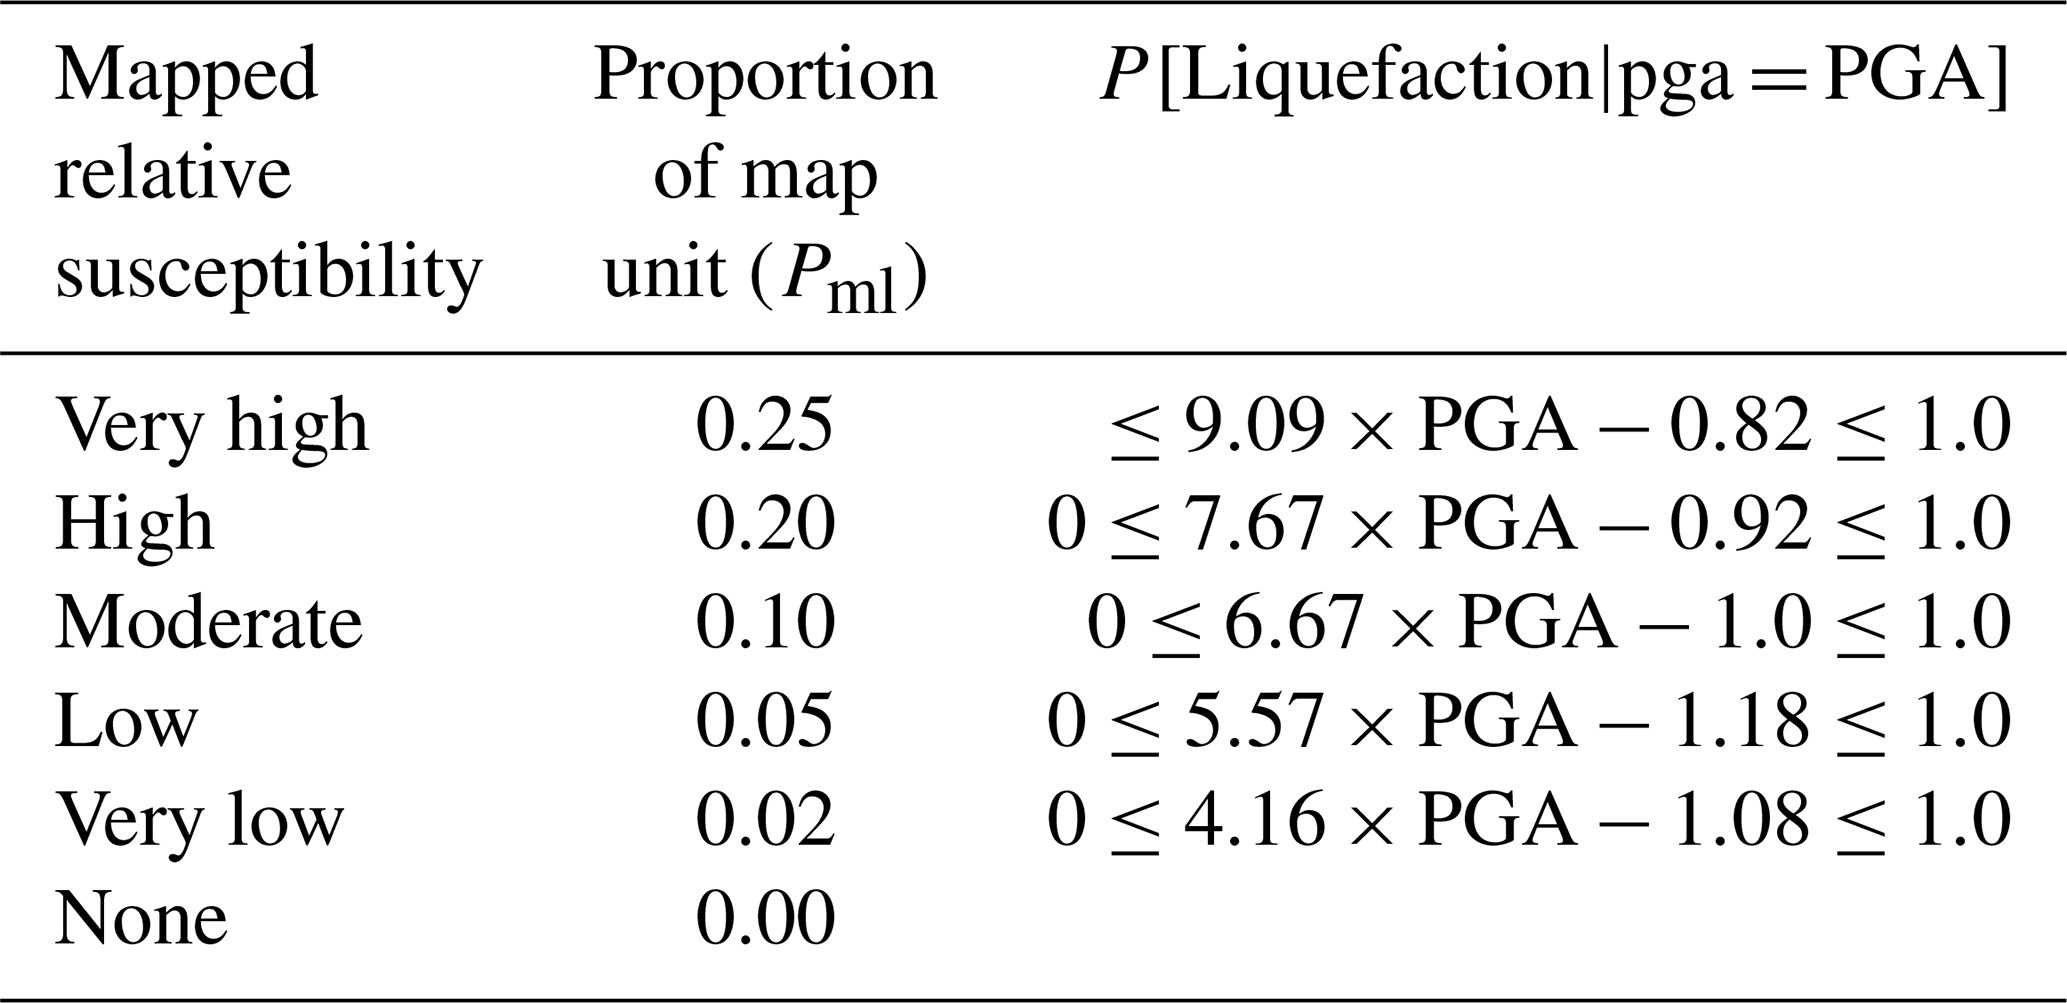

Figure 9(a) Liquefaction susceptibility map, (b) conditional liquefaction probability map, (c) proportion of map unit susceptible to liquefaction, (d) liquefaction probability map.
The expected value of PGD conditioned to the occurrence of liquefaction can be stated as a function of PGA (Sadigh et al., 1986), as presented in Eq. (4).
where PGA(t), which is presented in Table 4, is the threshold ground acceleration corresponding to zero probability of liquefaction, and KΔ is the displacement correction factor given by Eq. (5). Mapping of the threshold ground acceleration (stated in Fig. 2(2b)) is shown in Fig. 10. As a final result, Fig. 11 presents the liquefaction-induced displacement map (stated in Fig. 2(2e)) of Iran.
Table 4Threshold ground acceleration PGA(t) (FEMA, 2012).
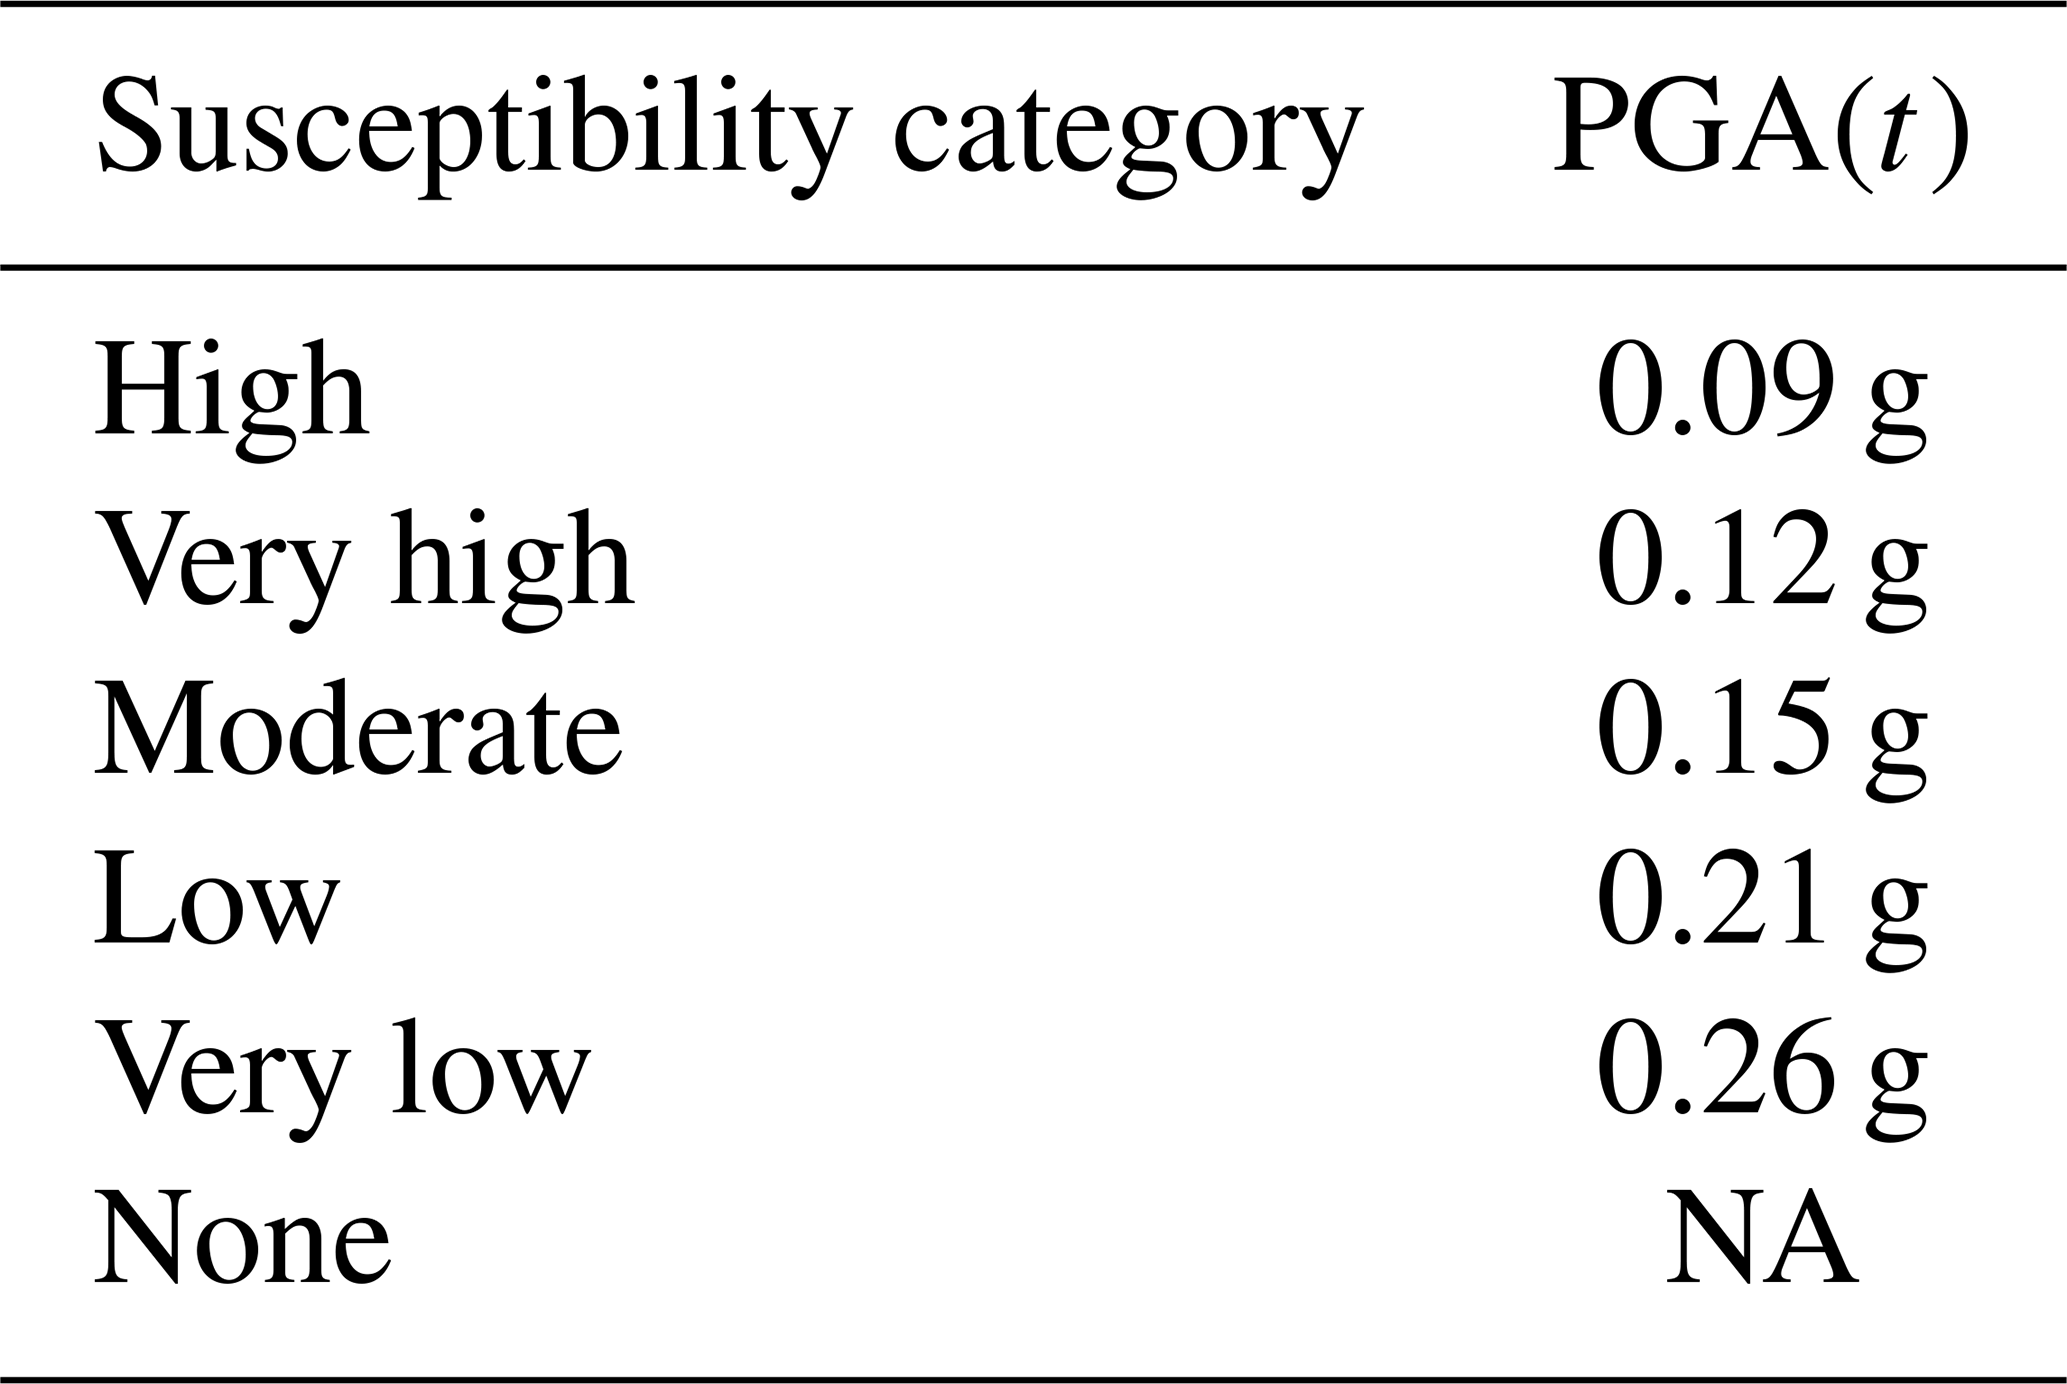
NA stands for not available.
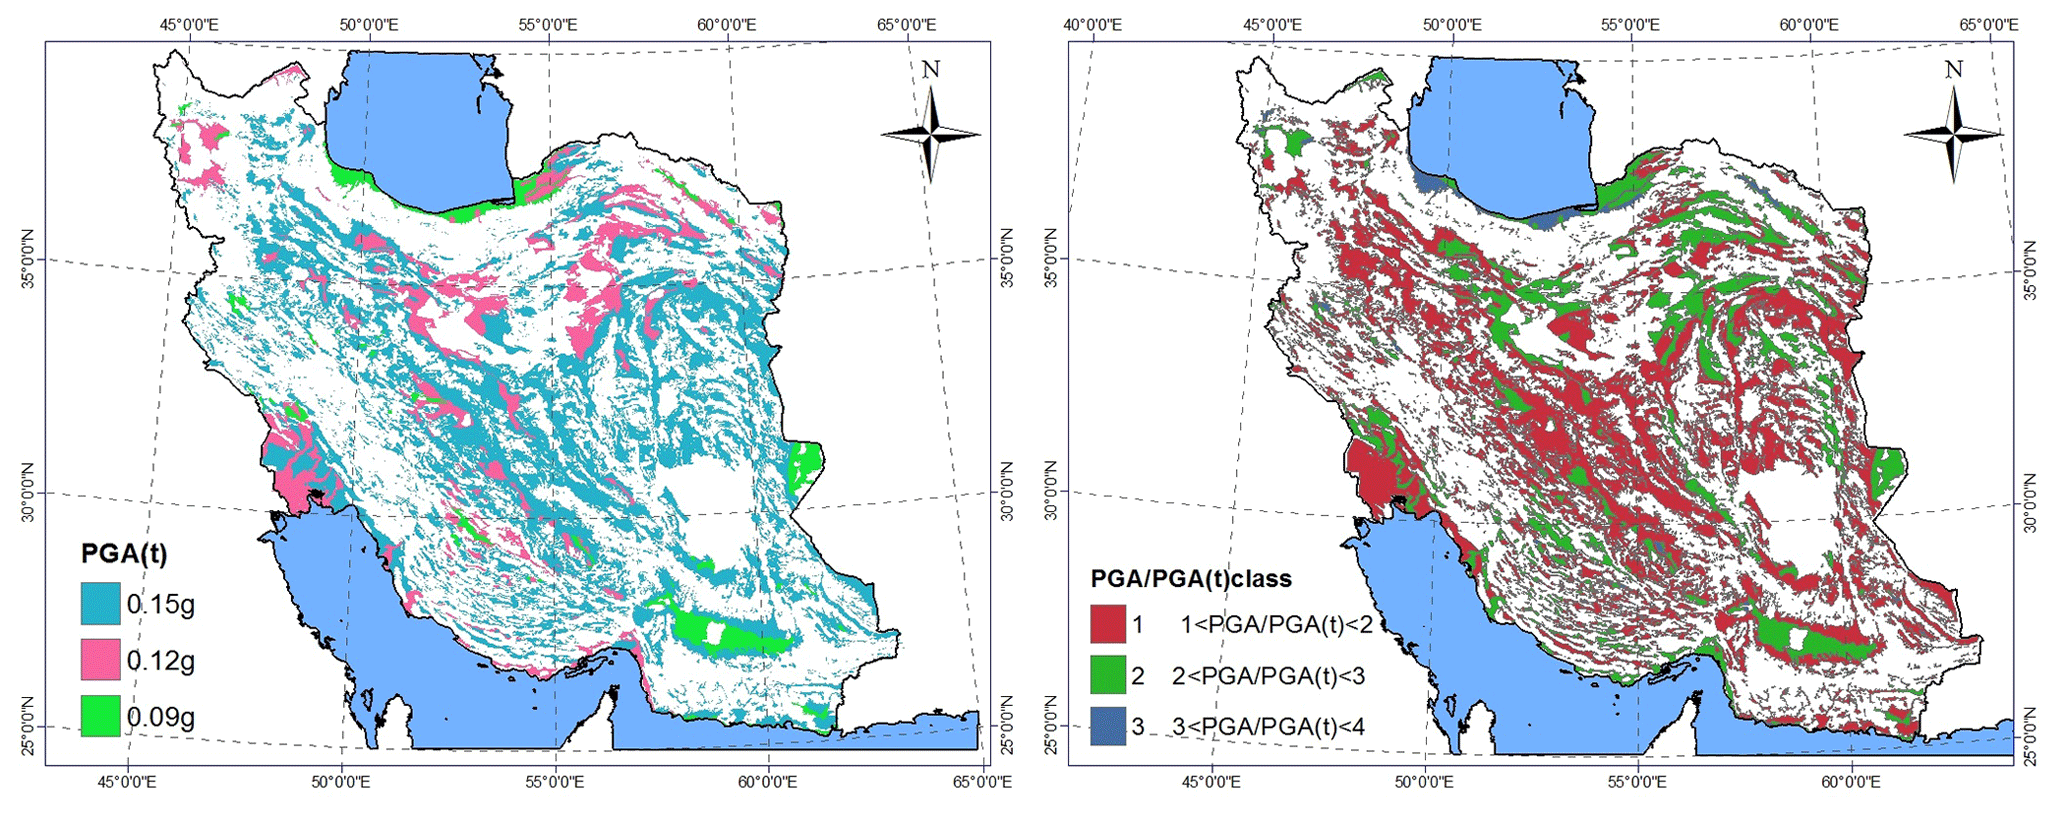
Figure 10Mapping of the threshold ground acceleration PGA(t).
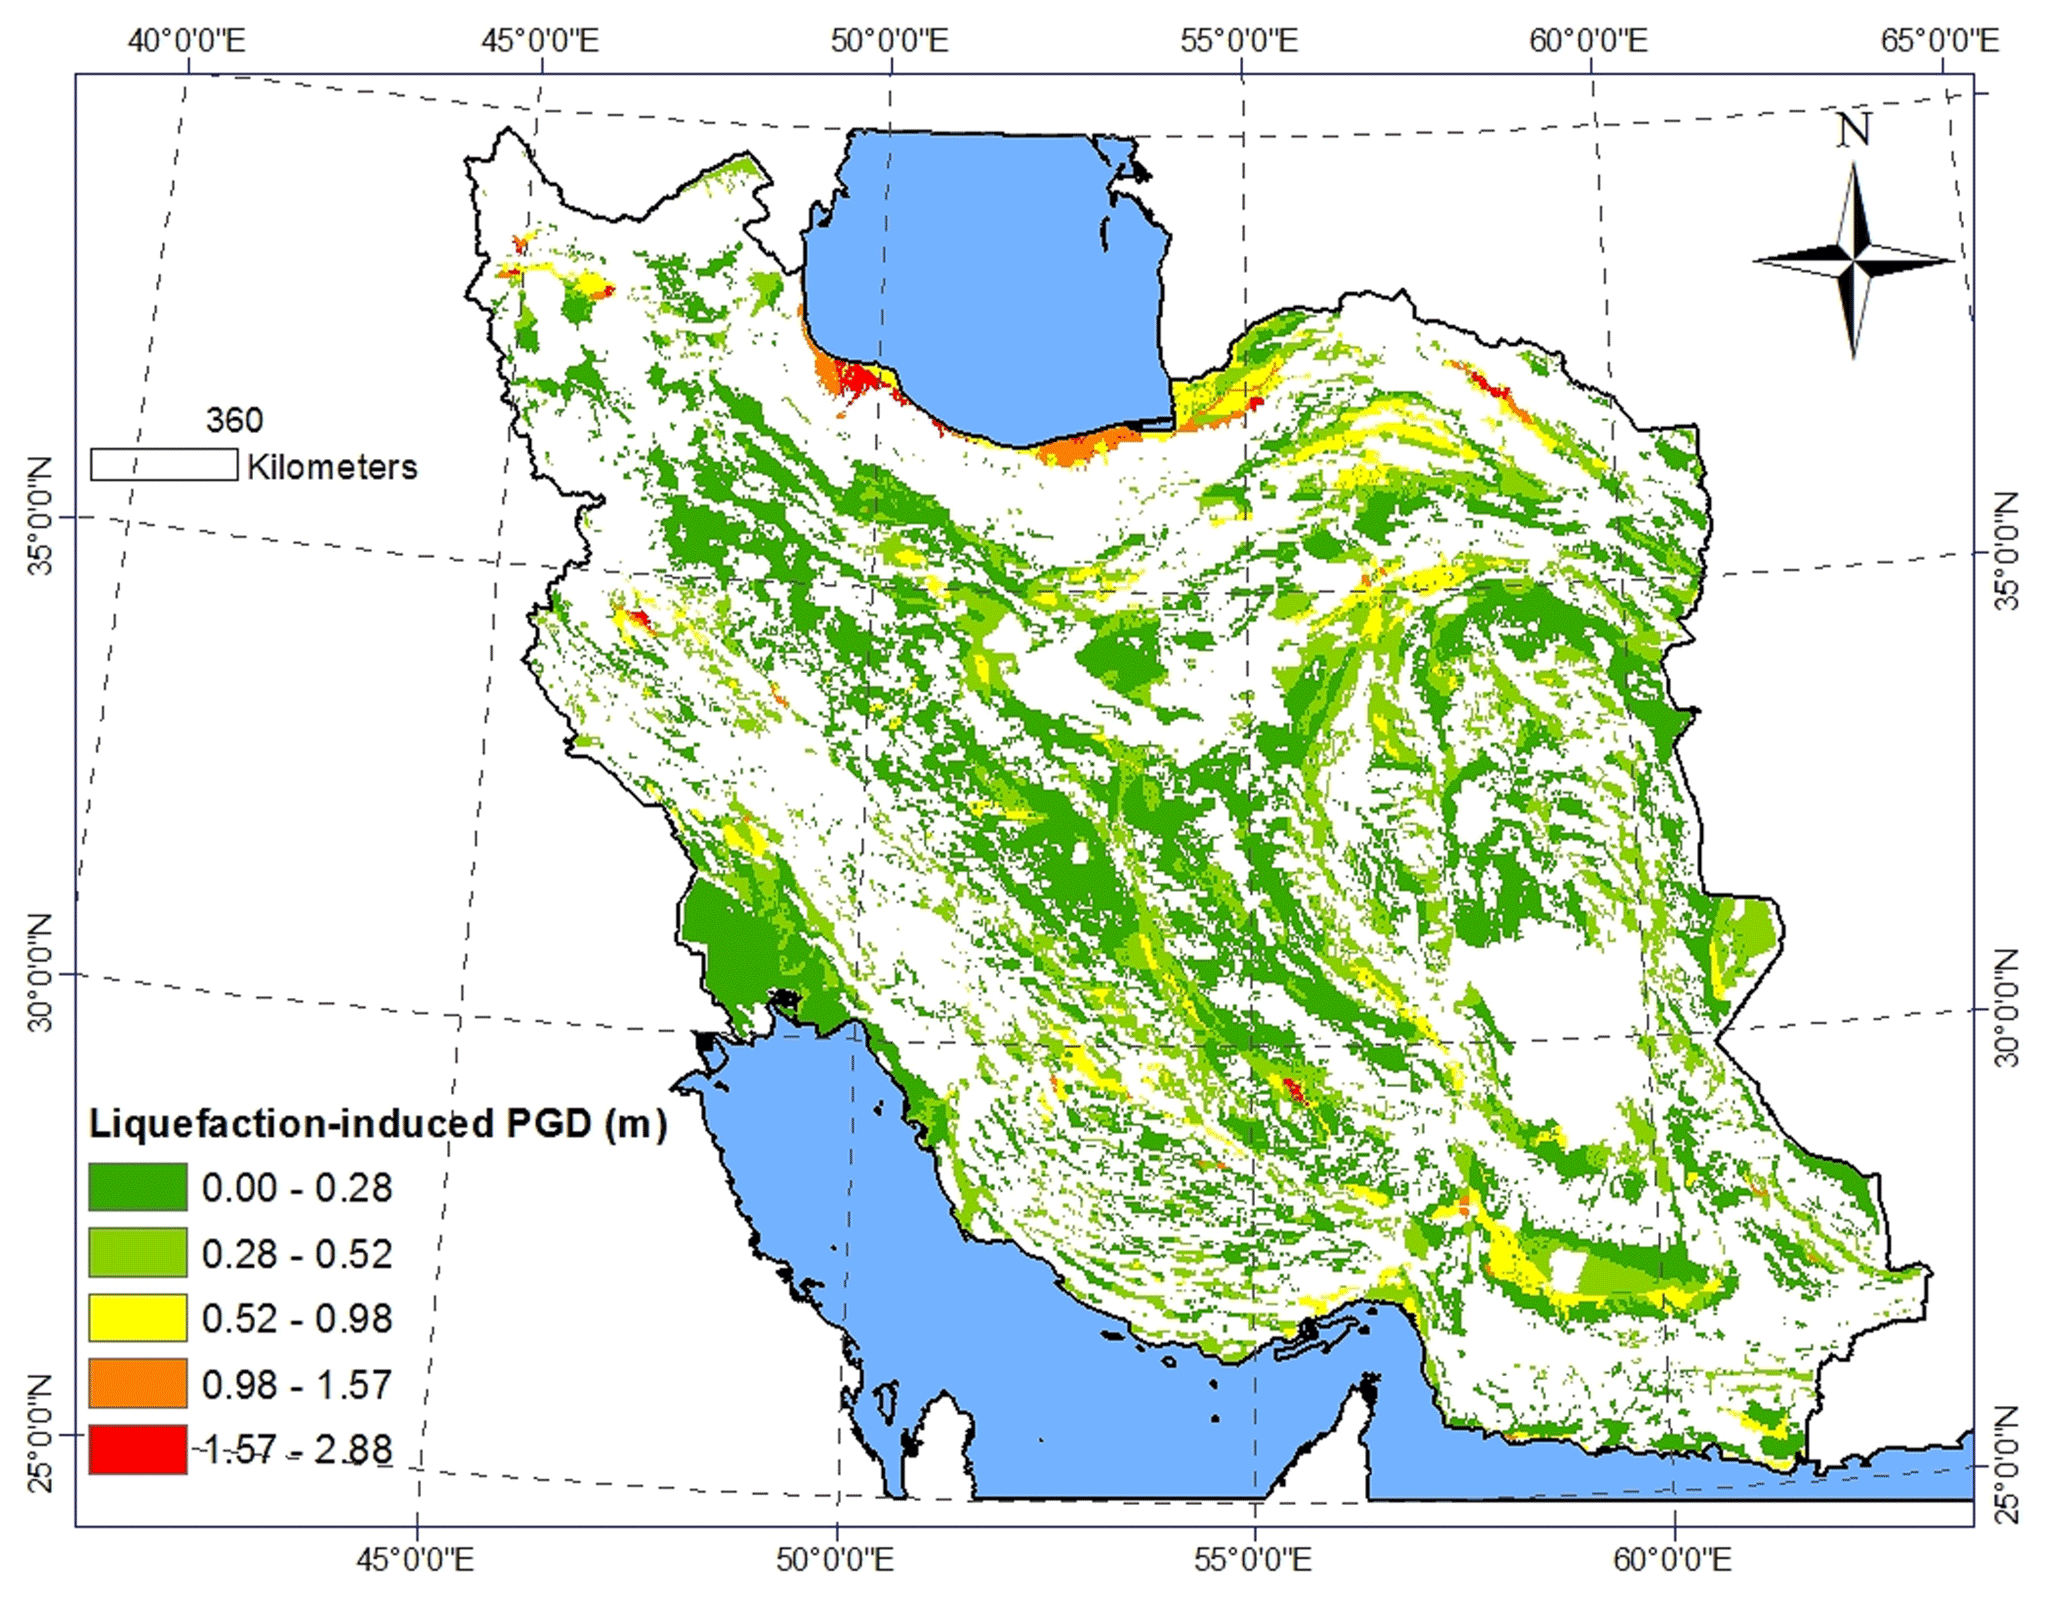
Figure 11Liquefaction-induced displacement map of Iran.
3.2 Landslide
Earthquake-induced landslide of a hillside slope occurs when the static plus inertia forces within the slide mass cause the factor of safety to drop below 1.0 temporarily (FEMA, 2012). The value of the PGA within the slide mass required to cause the factor of safety to drop to 1.0 is denoted by the critical or yield acceleration (ac). This value of acceleration is determined based on pseudo-static slope stability analyses and/or empirically based on observations of slope behaviour during past earthquakes.
The landslide hazard evaluation requires the characterization of the landslide susceptibility of the soil and geologic conditions of a region or sub-region. For this purpose, the Iran landslide susceptibility map (stated in Fig. 2(3a)), provided by Geological Survey and Mineral Explorations of Iran (GSI, 2018), is used as shown in Fig. 12. Also, critical acceleration (stated in Fig. 2(3b)) at any location proposed by HAZUS for susceptibility categories is presented in Table 5 and Fig. 13.
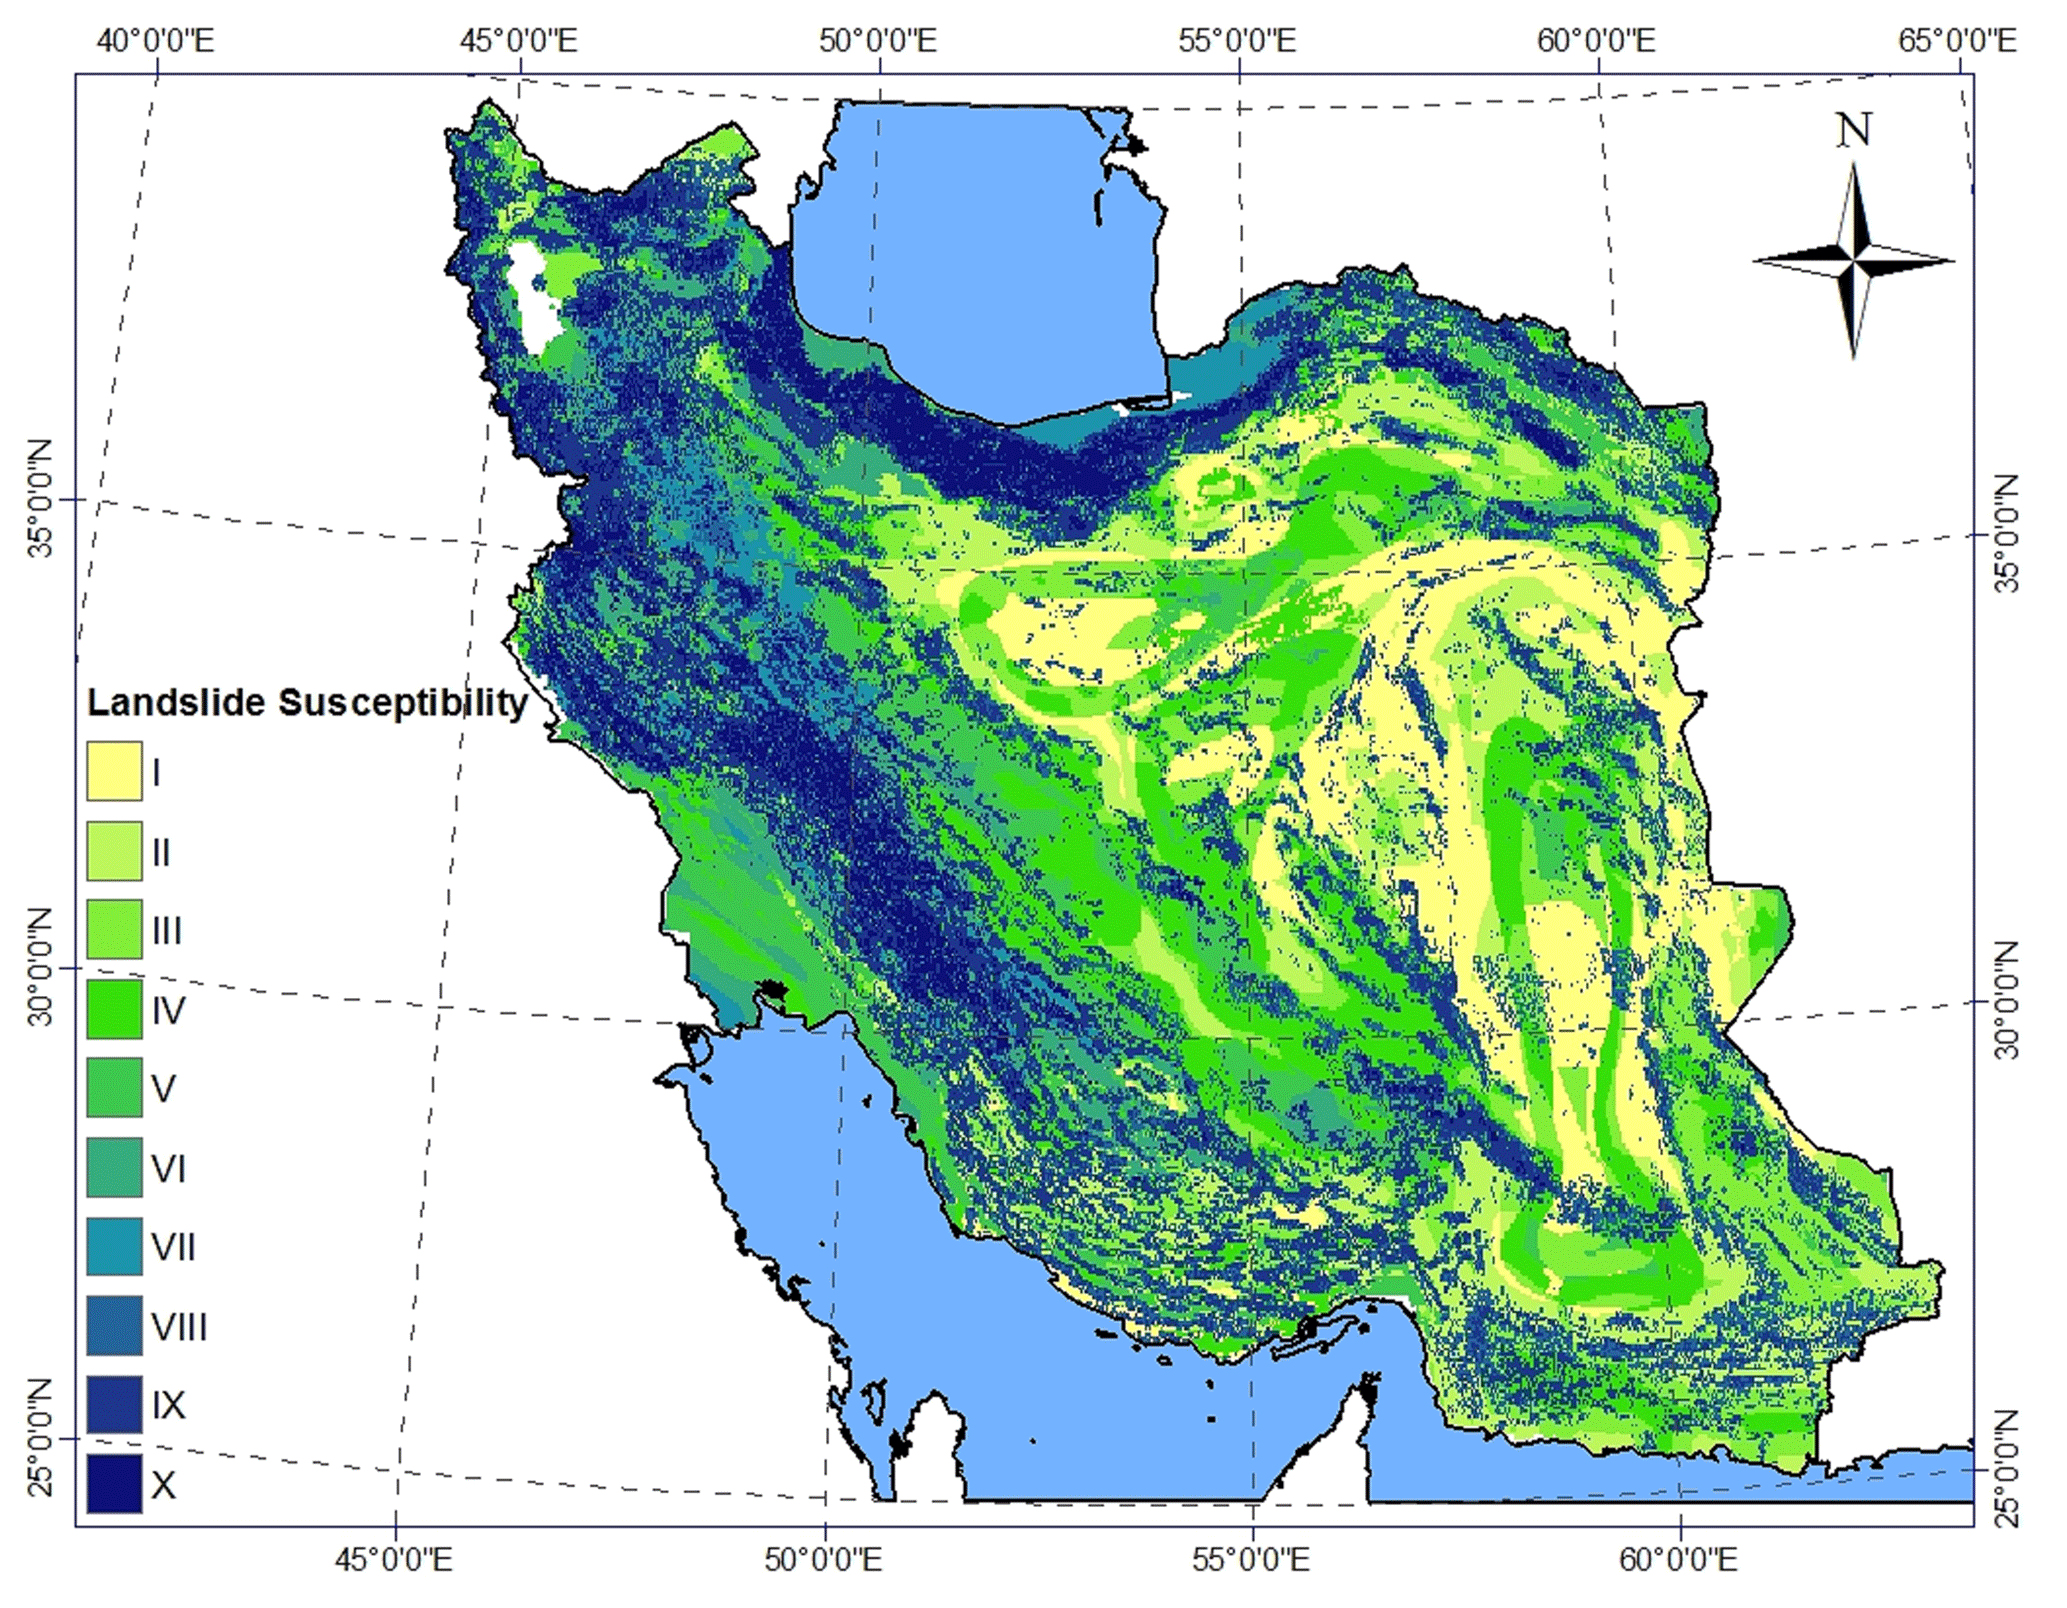
Figure 12Landslide susceptibility map of Iran (GSI, 2018).
Table 5Critical acceleration at any location proposed by HAZUS for susceptibility categories.

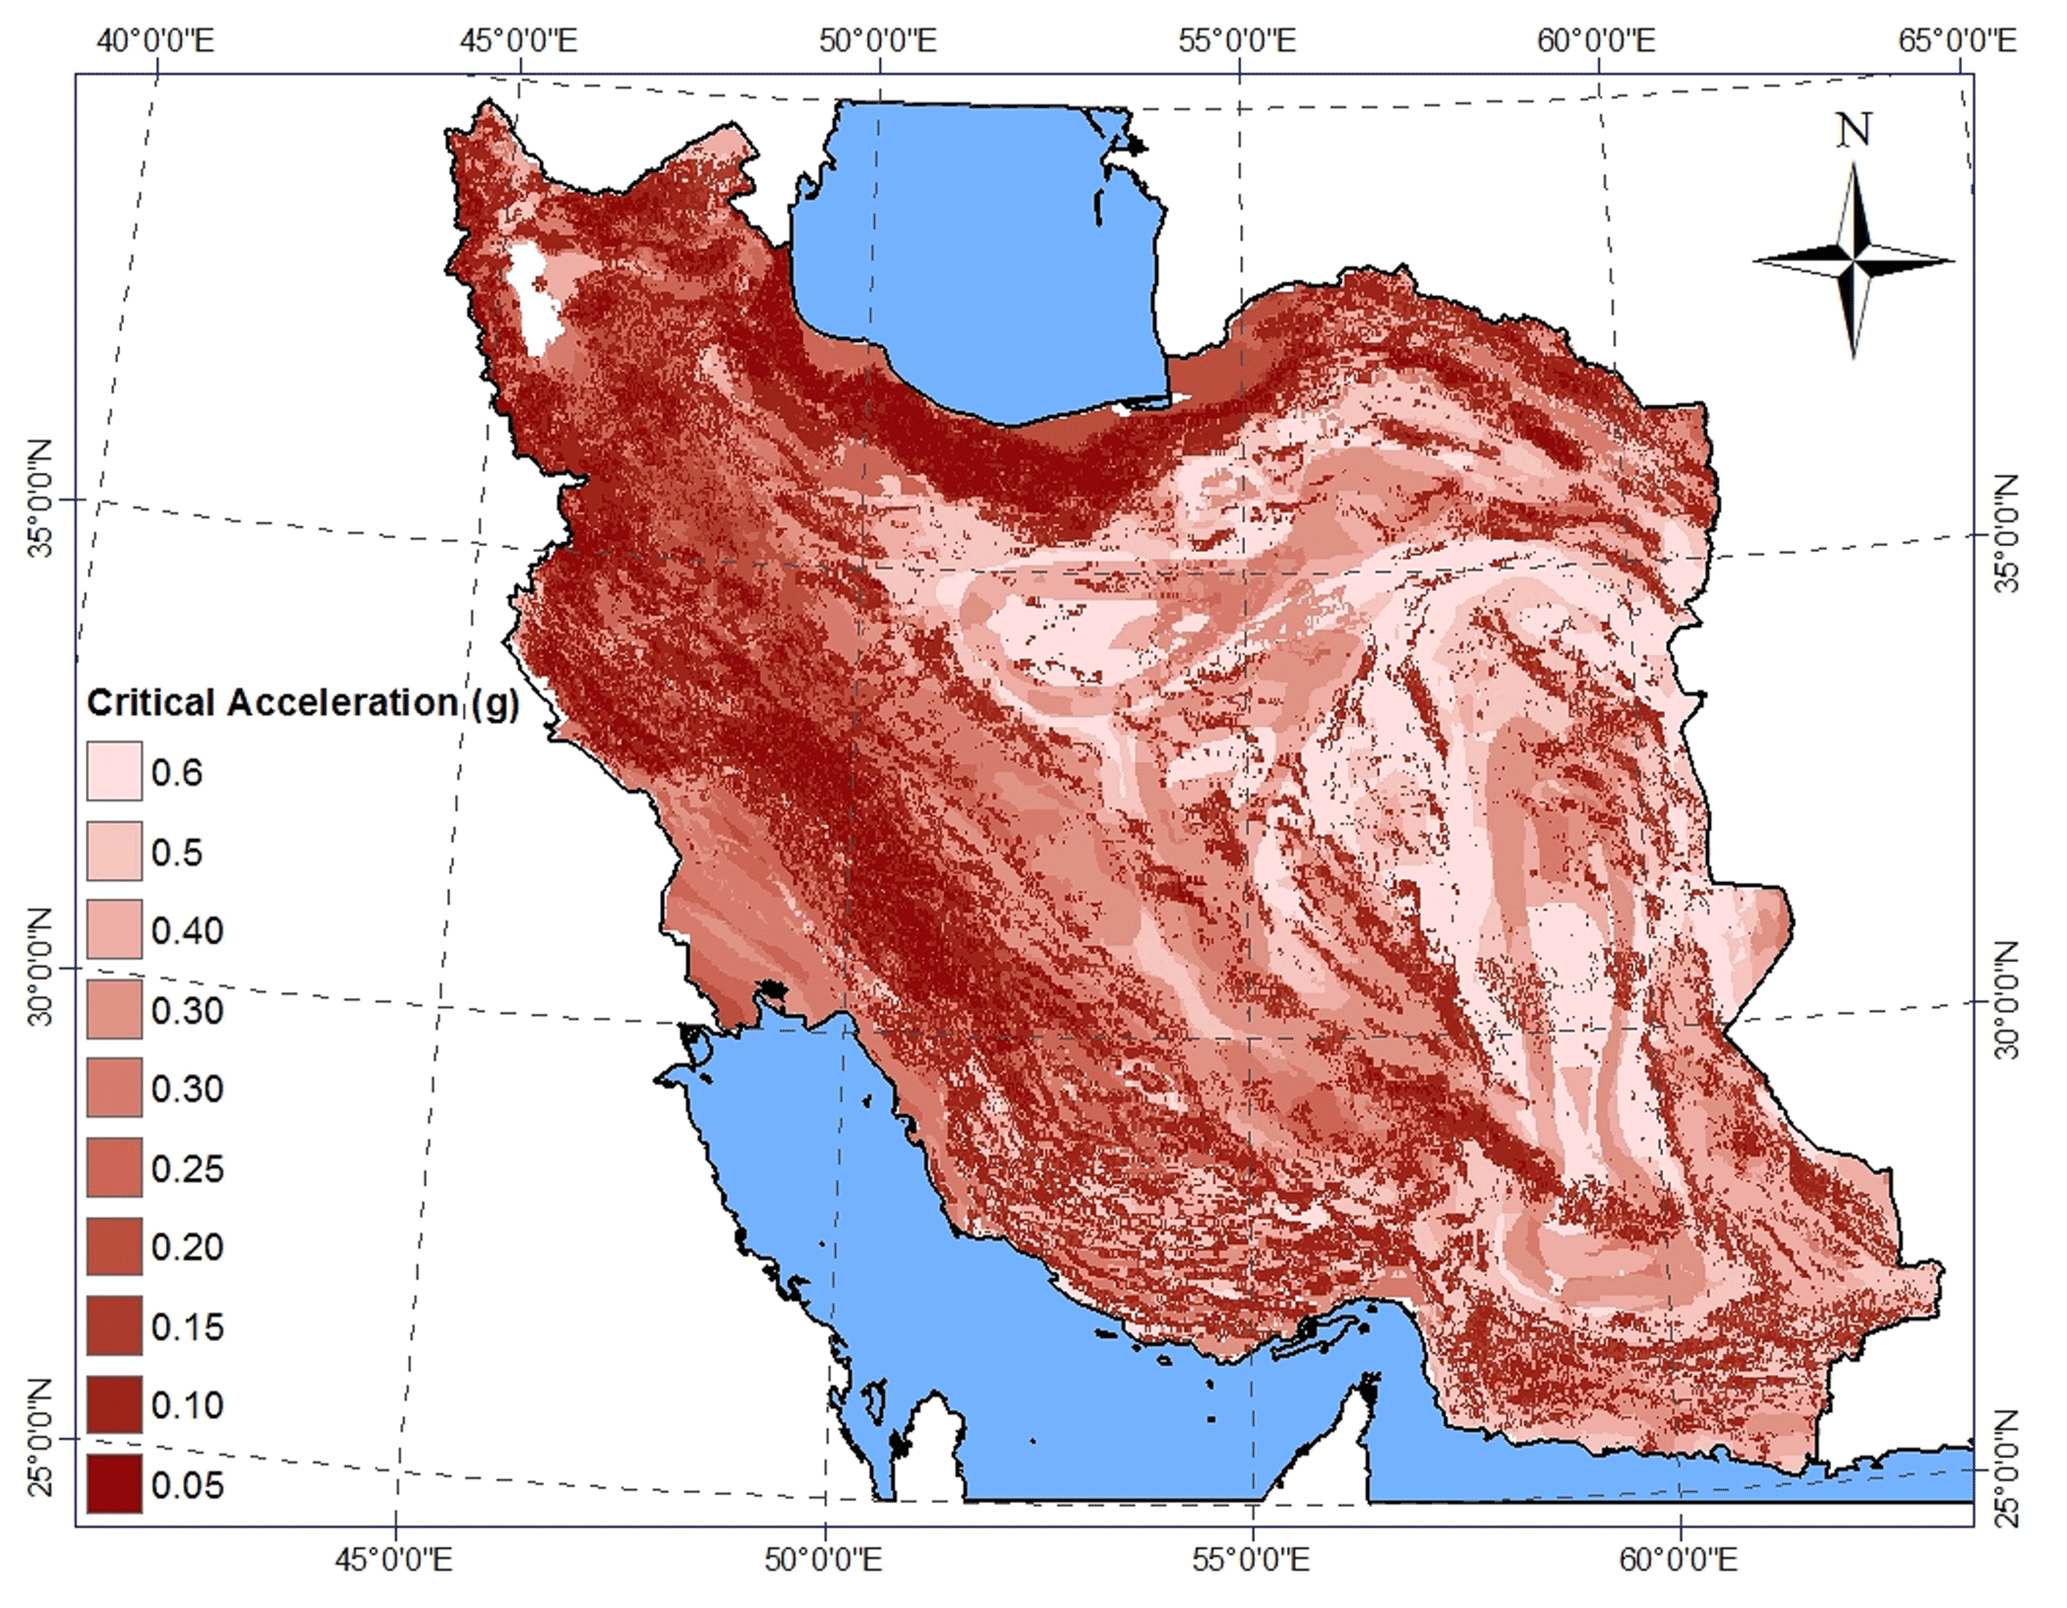
Figure 13Critical acceleration map of Iran.
The permanent ground displacements are determined using Eq. (6):
where E[d∕ais] is the expected displacement factor, ais is the induced acceleration (in a decimal fraction of g's), and n is the number of cycles of ground shaking. A relation derived from the results of Makdisi and Seed (1978) is used to calculate downslope displacements. In this relation, shown in Fig. 14, the displacement factor d∕ais is calculated as a function of the ratio ac∕ais using the upper bound values, in order to be conservative. Also, Eq. (7), which represents the relationship between the number of cycles and earthquake moment magnitude based on Seed and Idriss (1982), is used for calculating the number of cycles of ground shaking (n). As a result, maps of the ratios of critical to induced acceleration (ac∕ais) (stated in Fig. 2(3d)) and displacement factor (d∕ais) (stated in Fig. 2(3e)) are presented in Fig. 15. Finally, the zonation of landslide-induced displacement (stated in Fig. 2(3f)) is carried out using GIS-based analyses and presented in Fig. 16.
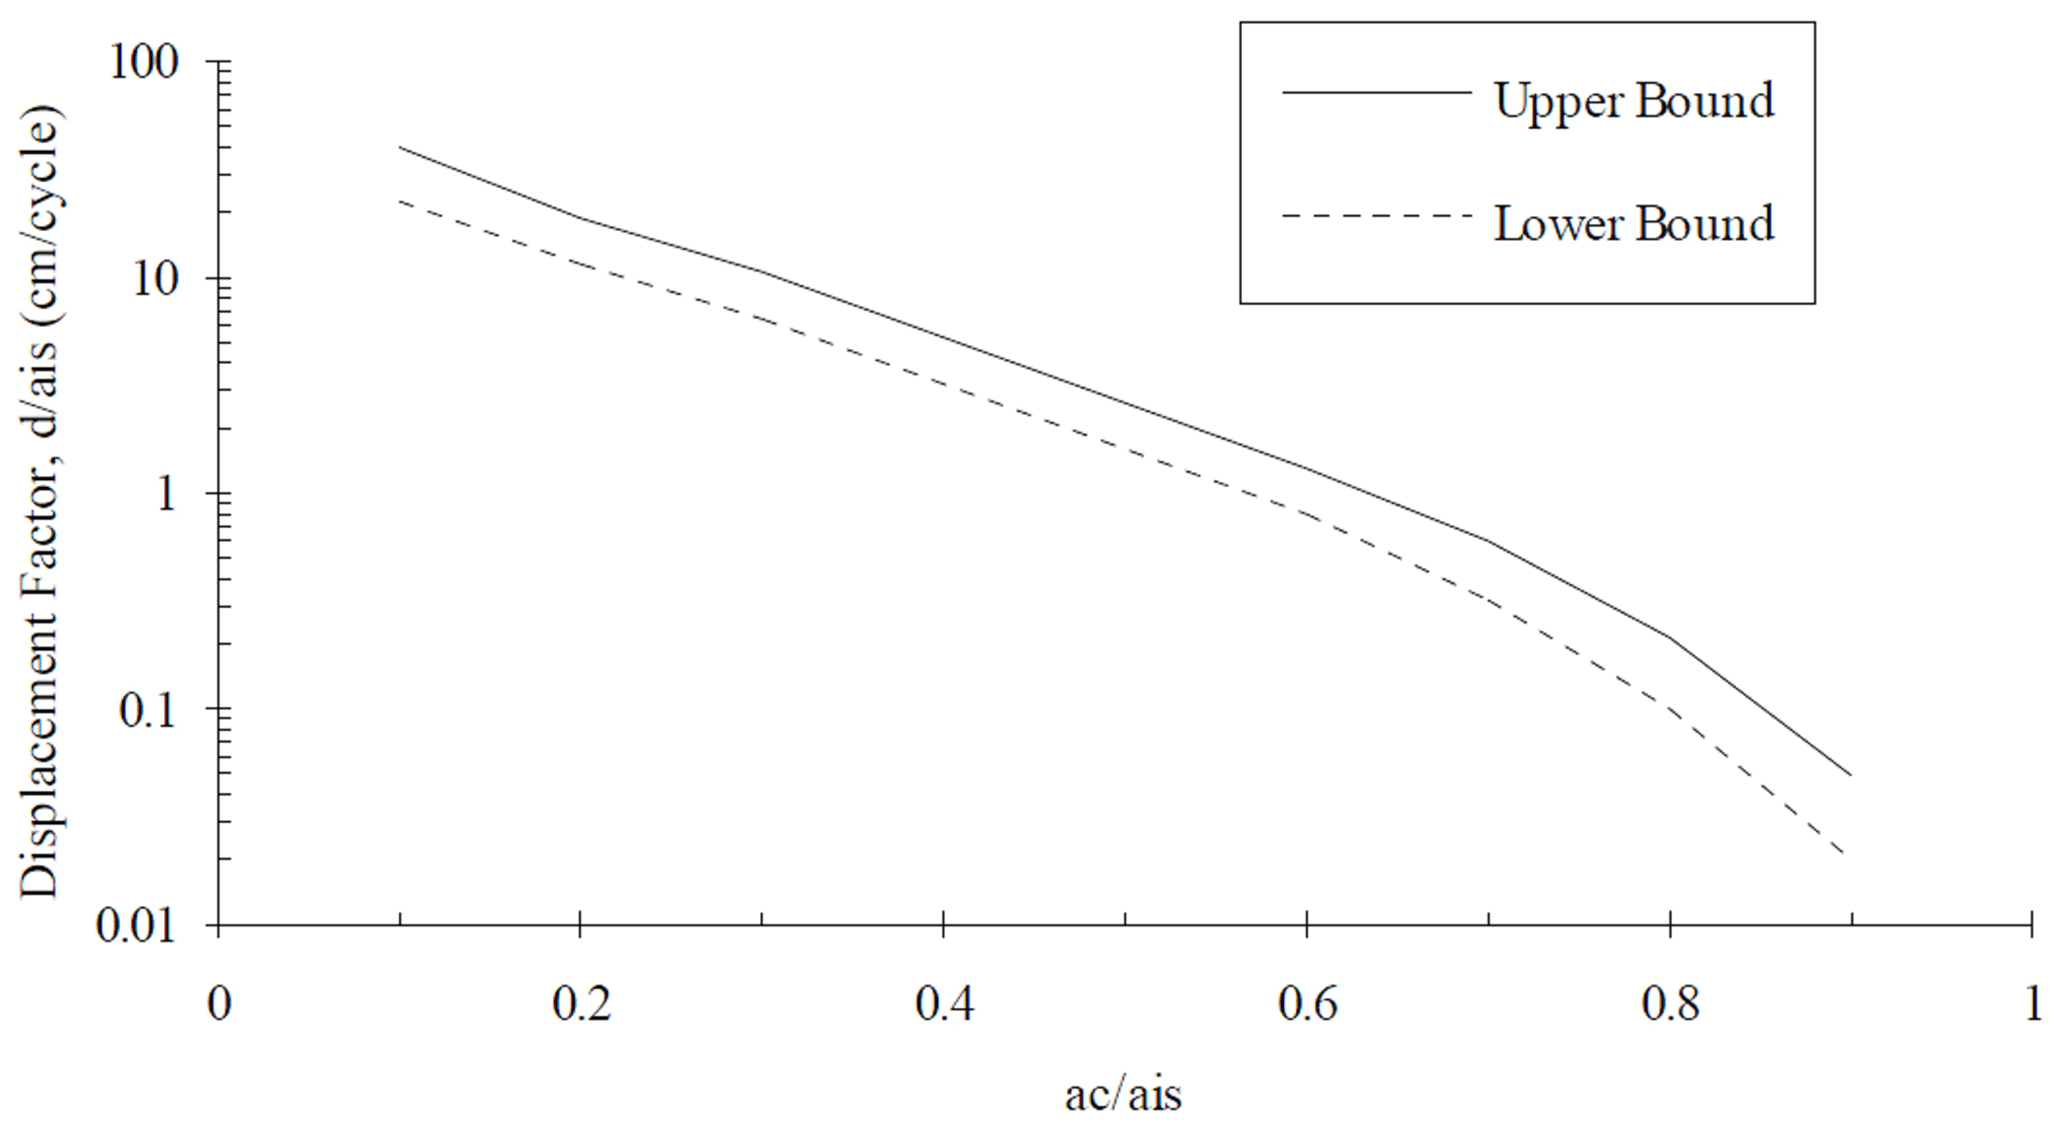
Figure 14The relation between displacement factor and ratio of critical acceleration and induced acceleration.
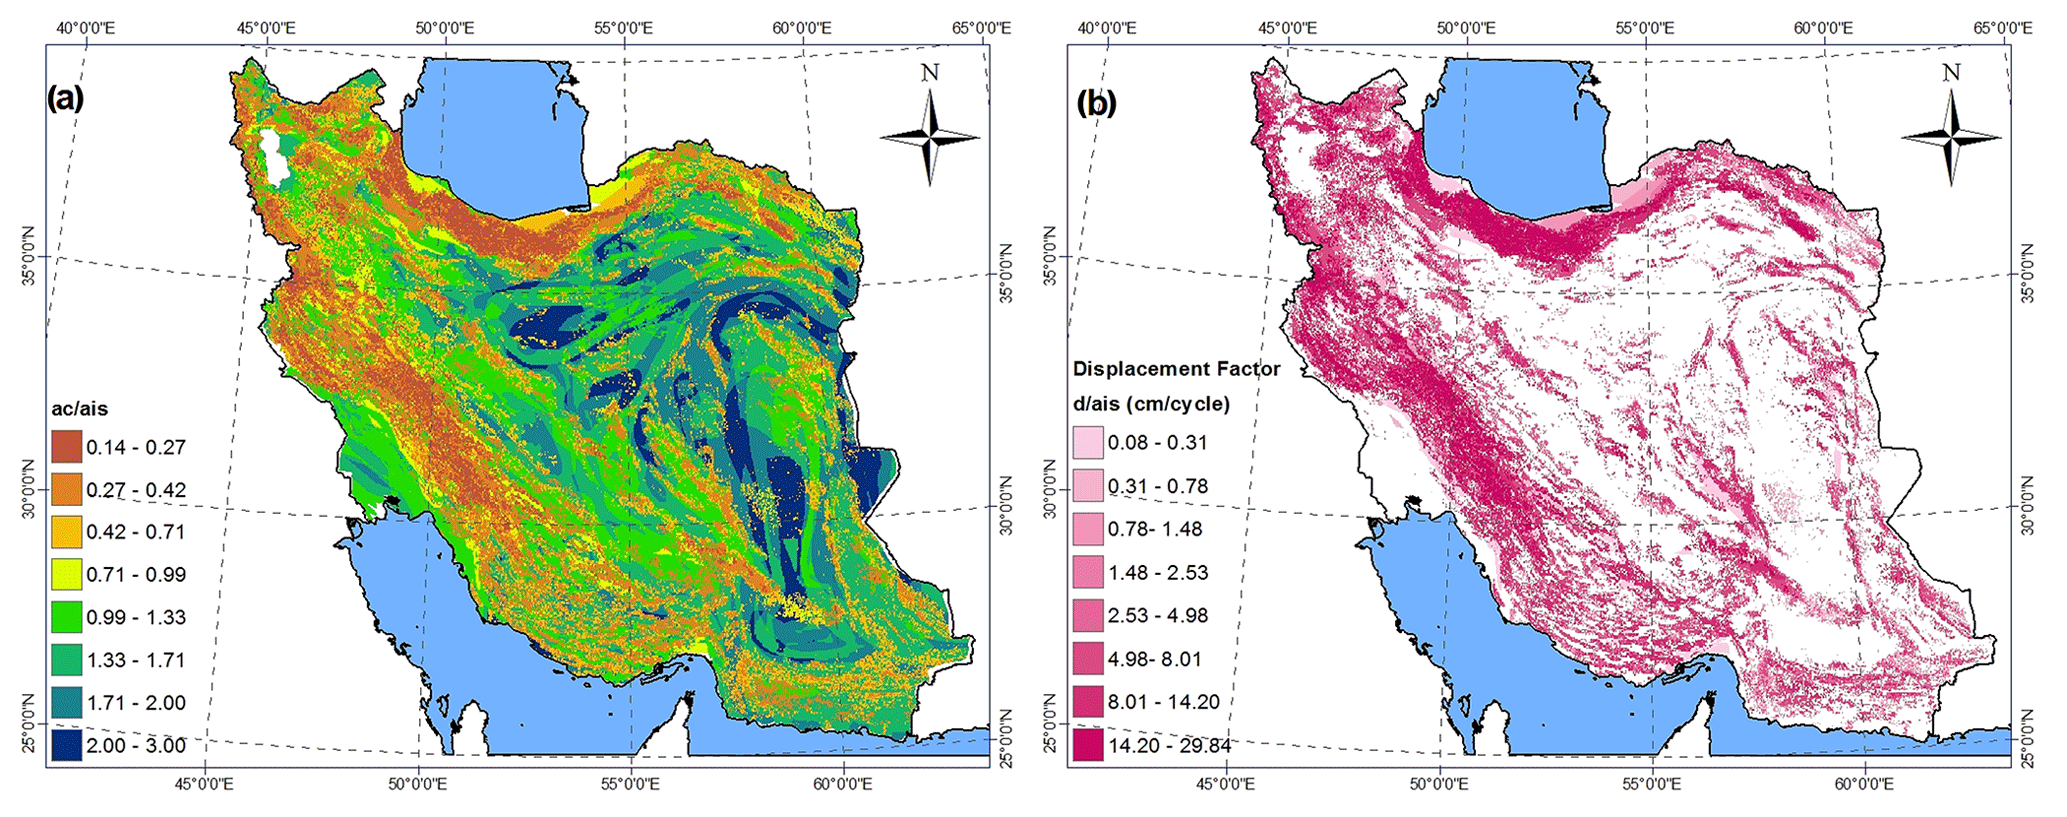
Figure 15(a) The ratio of the critical and the induced acceleration map (ac∕ais), (b) displacement factor map (d∕ais).
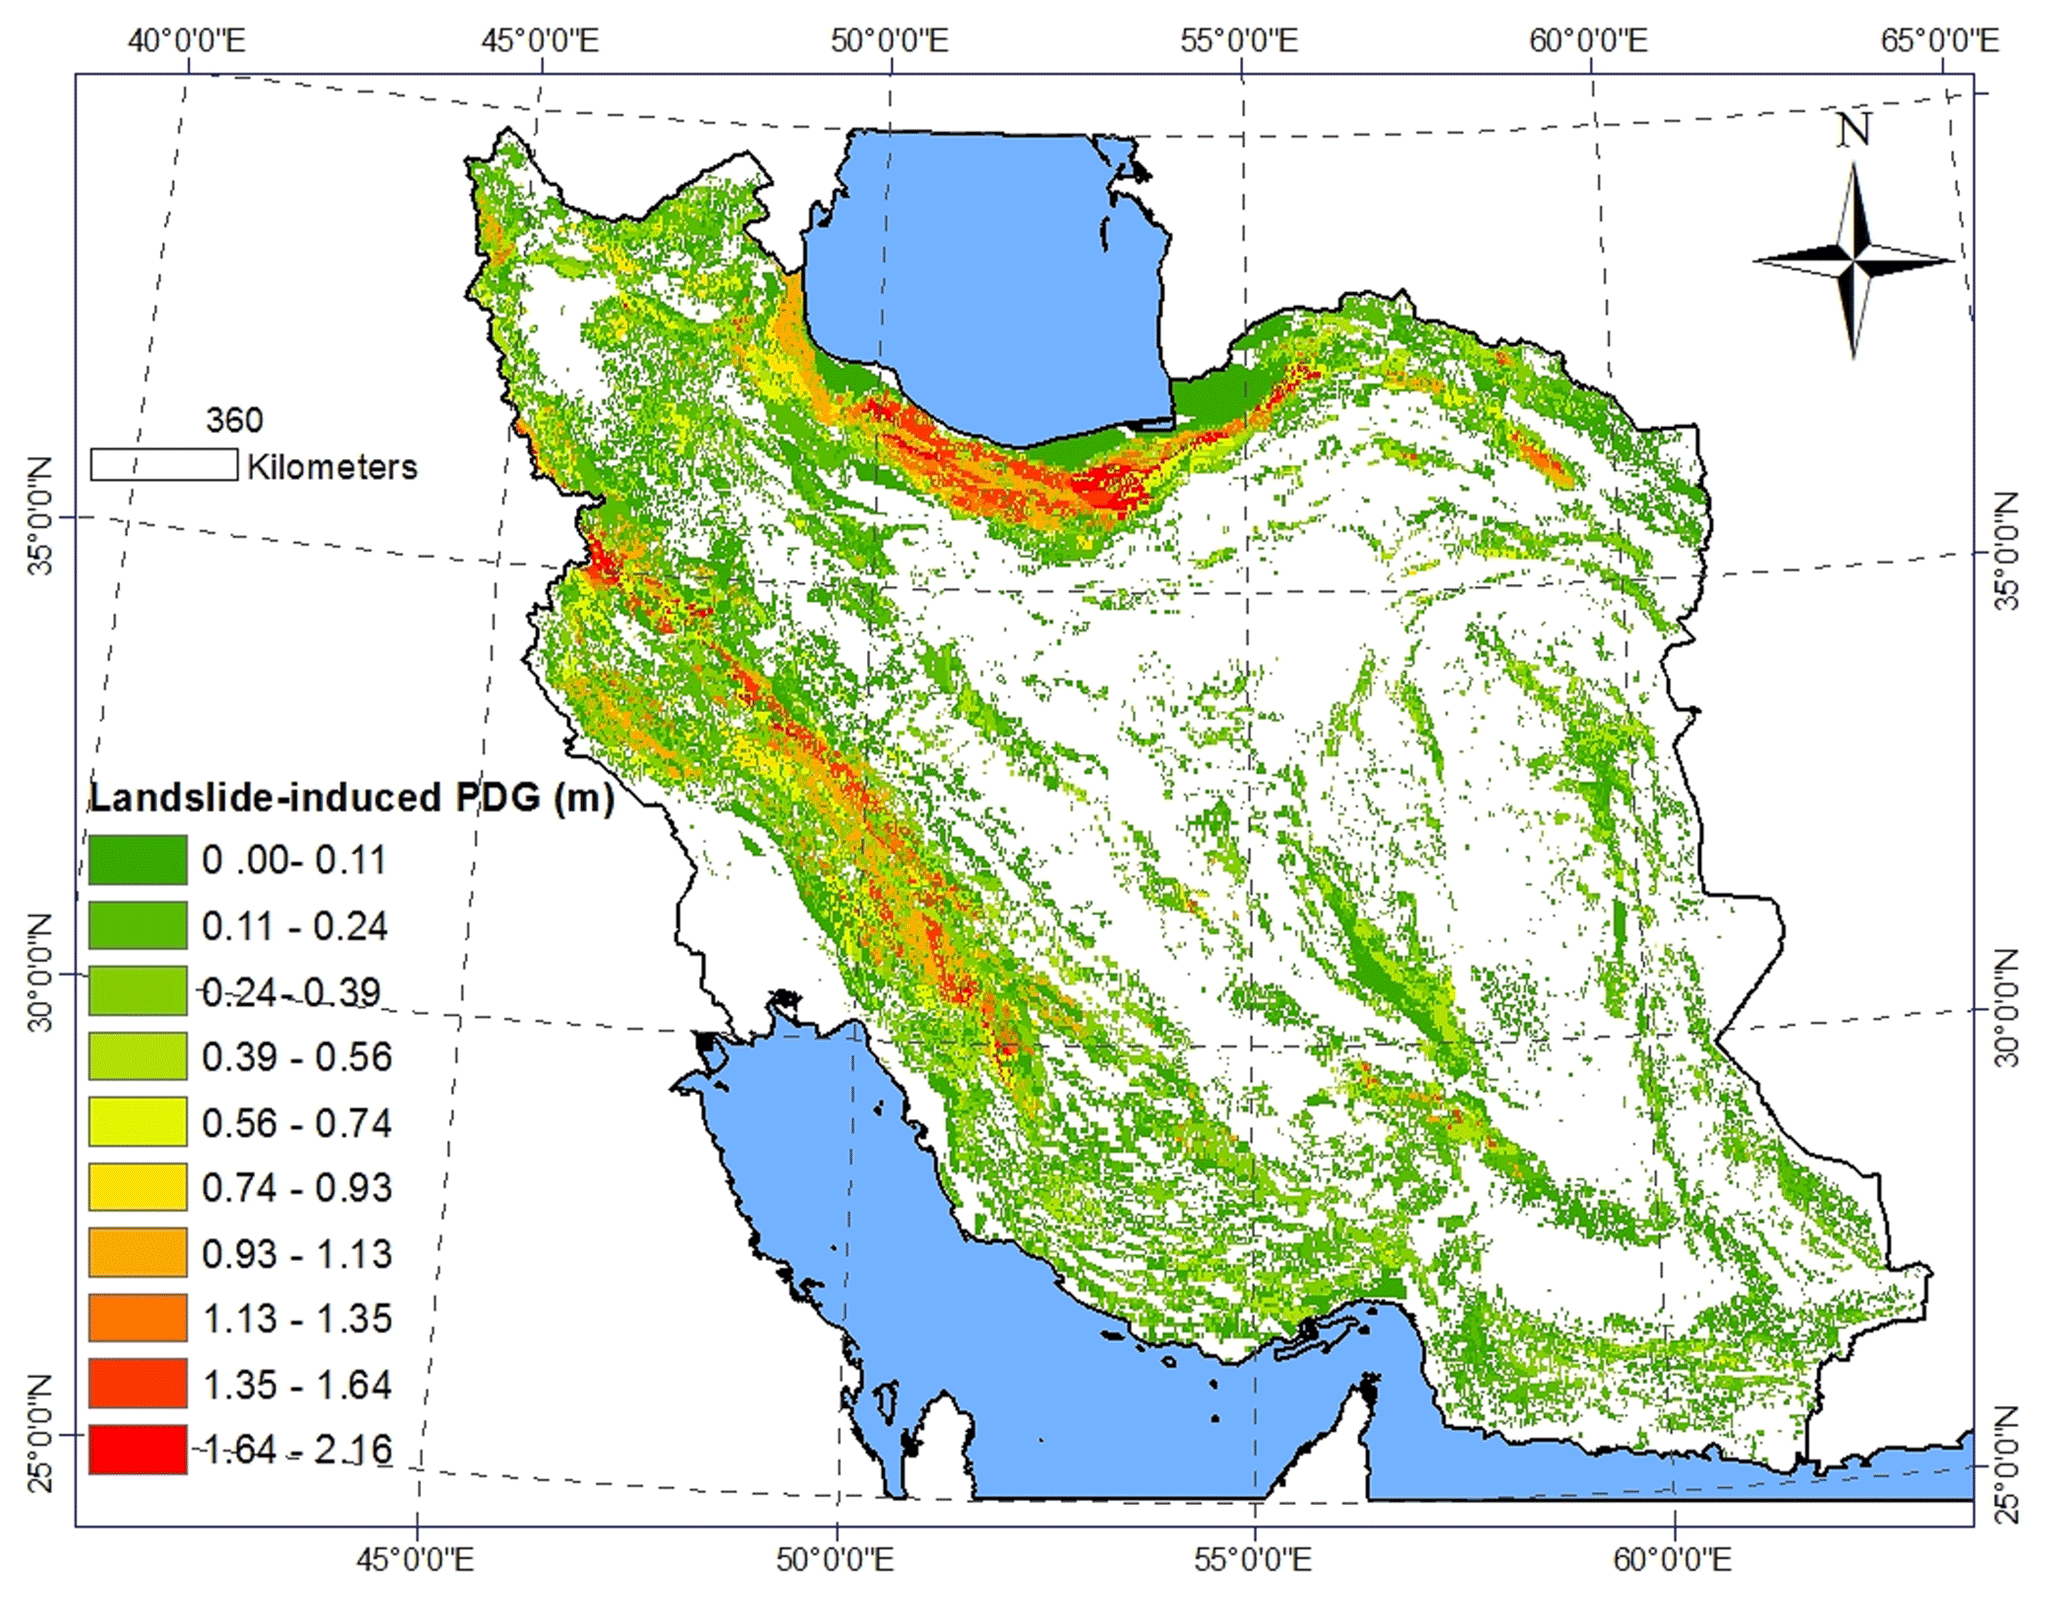
Figure 16Landslide-induced displacement map of Iran.
3.3 Surface fault rupture
Active faulting in Iran is a direct indicator of active crustal deformation due to the convergence between Arabia and Eurasia, which occurs at 2.1–2.5 cm yr−1. During the last 500 years surface ruptures associated with large earthquakes have appeared or been documented in various places in Iran. Most of these ruptures occurred along the active faults which moved repeatedly in the Quaternary period, thus constituting evidence that these active faults have the potential of reactivating in the future (Hessami and Jamali, 2006).
The most recent seismic hazard map of Iran was developed by Karimiparidari (2014) using the available data and based on PSHA approach. This covers a wide time span of earthquakes history and contains uniform scaled magnitudes. Karimiparidari (2014) has also developed new seismic source models and seismotectonic zoning maps of Iran. The seismotectonic models were developed based on the latest data of active tectonics, topography, magnetic intensity, and seismicity catalogue. These new maps divide the country into 27 seismotectonic zones and demonstrate two models for linear and regional seismic sources. As shown in Fig. 17, seismicity parameters of 104 seismic regions, presented in 27 seismotectonic zones, are assigned to the faults. The mentioned parameters are considered to estimate the most probable maximum magnitude of each fault in order to calculate the rupture-induced displacement.
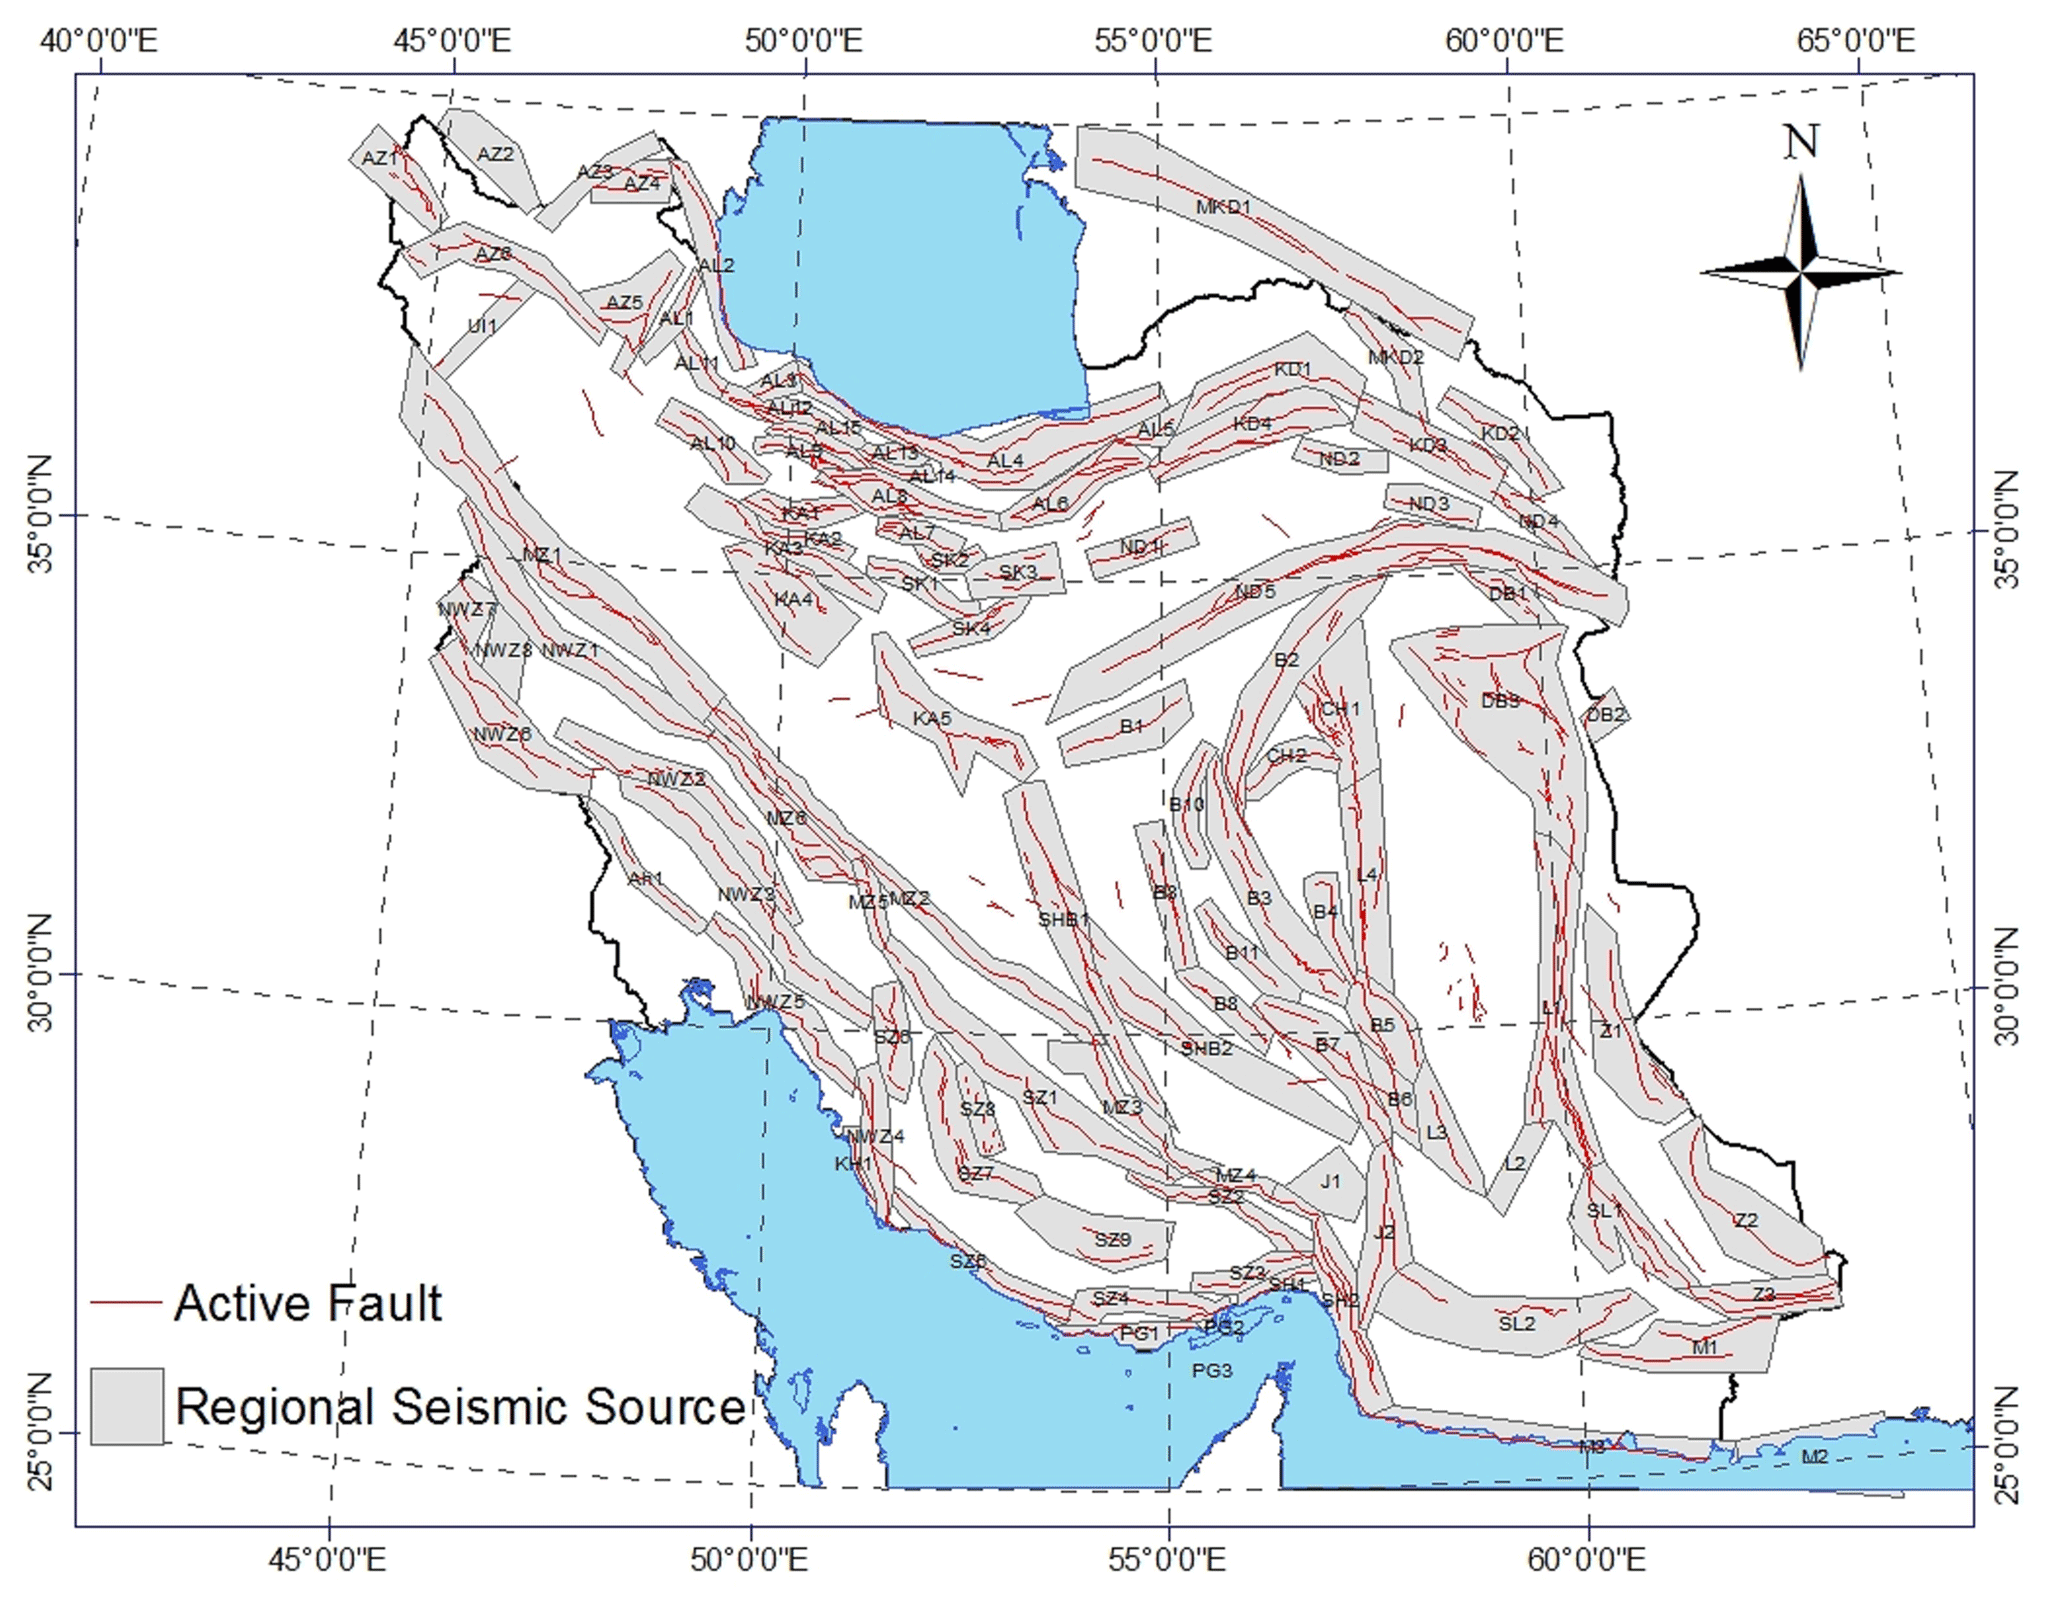
Figure 17Regional seismic sources of Iran (Karimiparidari, 2014).
By using the database of the surface ruptures of Iran, empirical relations are established for moment magnitude and maximum displacement (MD), as given in Table 6. Coefficients of the relations are separately calculated for the thrust, strike-slip faults, and all of the fault types. It is worth noting that active normal faults are rare in Iran, and surface ruptures associated with this kind of earthquake faulting are even more scarce (Ghassemi, 2016). As a result of the surface fault rupture study and using the empirical equation (Eq. 8) the map of surface-rupture-induced displacement (stated in Fig. 2(4b)) is produced by employing GIS-based analyses as presented in Fig. 18.
where Mw is moment magnitude. Also, the regression coefficients used, a and b, are presented in Table 6.
Table 6Recommended coefficients of Eq. (5) (Öztürk et al., 2018).

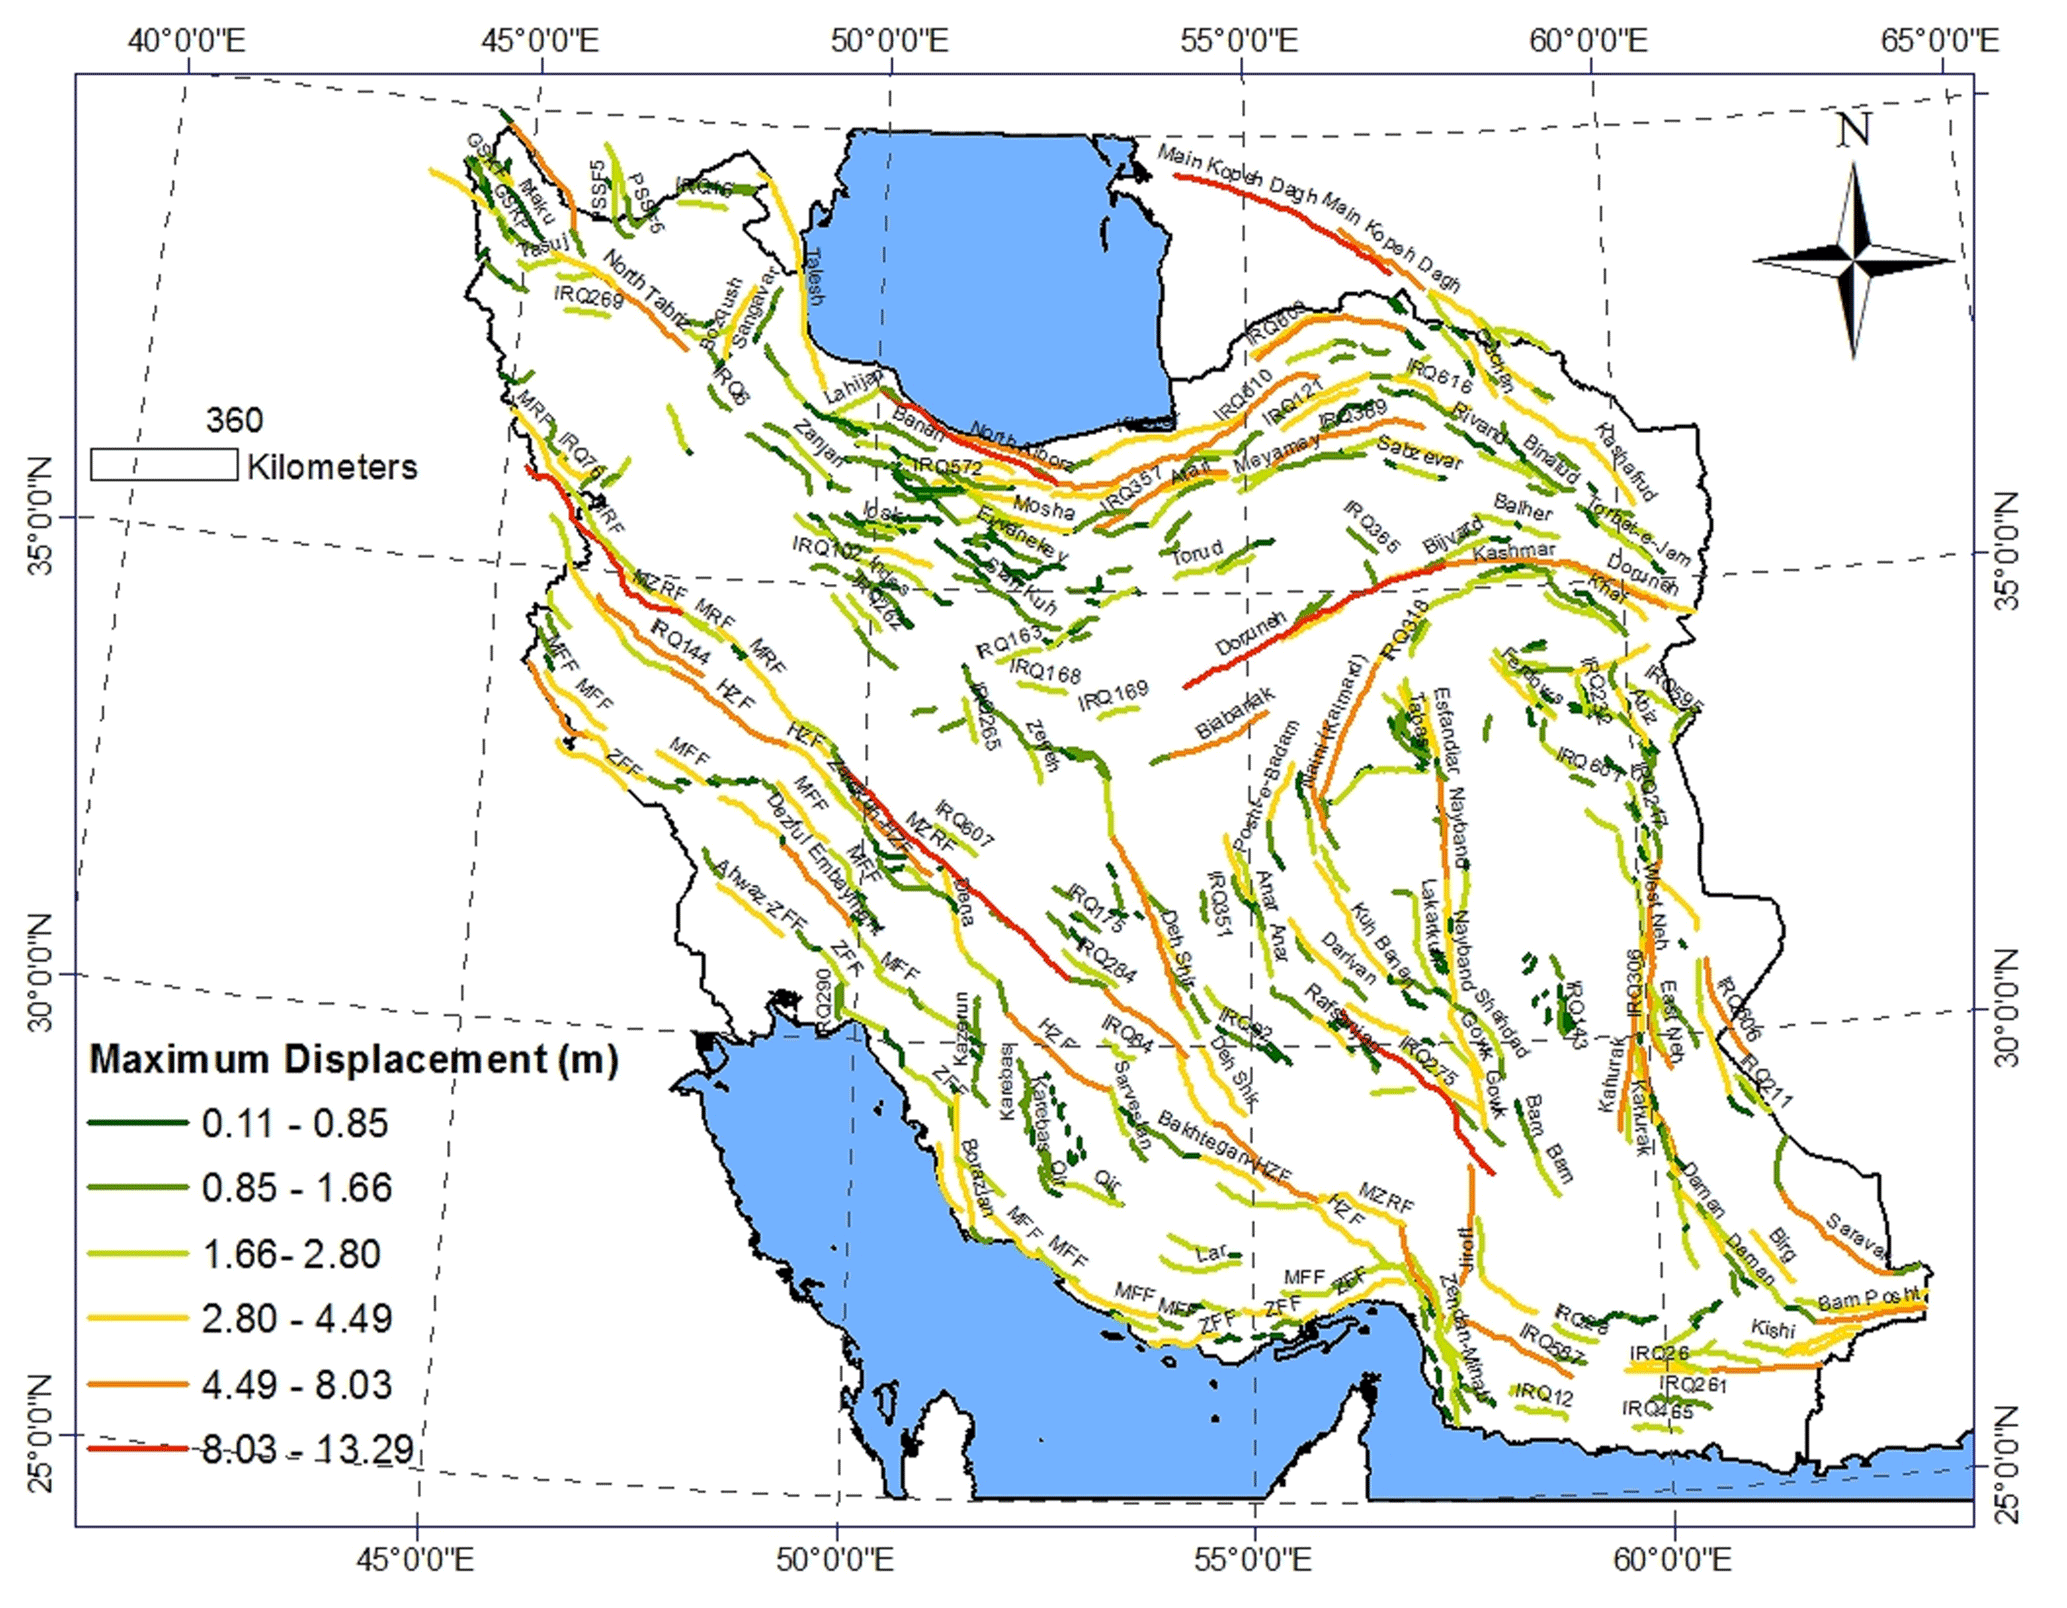
Figure 18Surface-rupture-induced displacement map of Iran.
Being located in the active collision zone between the Eurasian and Arabian plates, Iran is a country that suffers from hazards associated with frequent destructive earthquakes. The susceptibility assessment of infrastructures is crucial in the modern era due to the very rapid growth of population and major cities, which are mostly located on or in the vicinity of earthquake faults, and also demands the construction of infrastructure that is susceptible to earthquake hazards. The geotechnical seismic hazard which can affect the serviceability of lifelines during or after earthquakes can be classified into two categories: transient ground displacement (TGD) caused by seismic wave propagation (ground shaking) and permanent ground displacement (PGD), which refers to liquefaction, landslide, and surface fault rupture.
There are many theoretical, experimental, and numerical methods for evaluating earthquake-induced displacements, which can affect lifelines significantly. For example, in order to investigate the landslide and liquefaction potential of a specific limited region, geotechnical-based field experimental studies and finite-element-based methods can be implemented. However, from a risk assessment point of view, empirical–theoretical-based methods are even more useful for macro-scale regions. This is because the number of required parameters for empirical equations is lower than the number of parameters which are required for numerical analyses. Hence, from a risk assessment point of view, the zonation of earthquake-induced displacements can help researchers and engineers to carry out their research more rapidly by using the prepared map of displacements in the country. Therefore, the main goal of this paper is to produce and present maps of earthquake-induced displacements.
For creating the precise maps, GIS-based analyses were carried out by employing the HAZUS methodology. A peak ground velocity (PGV) map of Iran was produced using soil classification estimation based on topographical data, spectral acceleration calculation, and the HAZUS equations. Although the PGV can be obtained using attenuation relationships, the proposed method by HAZUS is selected for being employed in this study. Investigating the liquefaction-induced displacements, the probability of liquefaction for each susceptibility category was calculated using the HAZUS equations, and a map capable of presenting the most probable displacements was produced. GIS-based analyses, Makdisi and Seed's equation, and a landslide susceptibility map were used for preparing the landslide-induced displacement maps. Also, a seismotectonic zoning map was employed to estimate the most probable maximum magnitude of each fault and to evaluate the surface fault rupture based on displacement. A map of the surface-rupture-induced displacements was also produced.
In this study, there are some limitations which the authors faced. The first one is the accuracy of the available DEM of the country. As was discussed, the accuracy of the used DEM is around 1 arcsec (30 m) and can affect the produced PGV map of the country. The other limitation is the Iran liquefaction susceptibility map, which is respectfully old fashioned (1996). The Iran liquefaction susceptibility map should be updated periodically because the level of the groundwater has continuously varied in recent decades due to the severe climate changes. Consequently, having a more accurate DEM and employing up-to-date liquefaction susceptibility zonation can help produce a cutting-edge version of the result of this research in the future.
B is the reflection factor that is obtained from a smoothed-elastic design response spectrum in the following form:
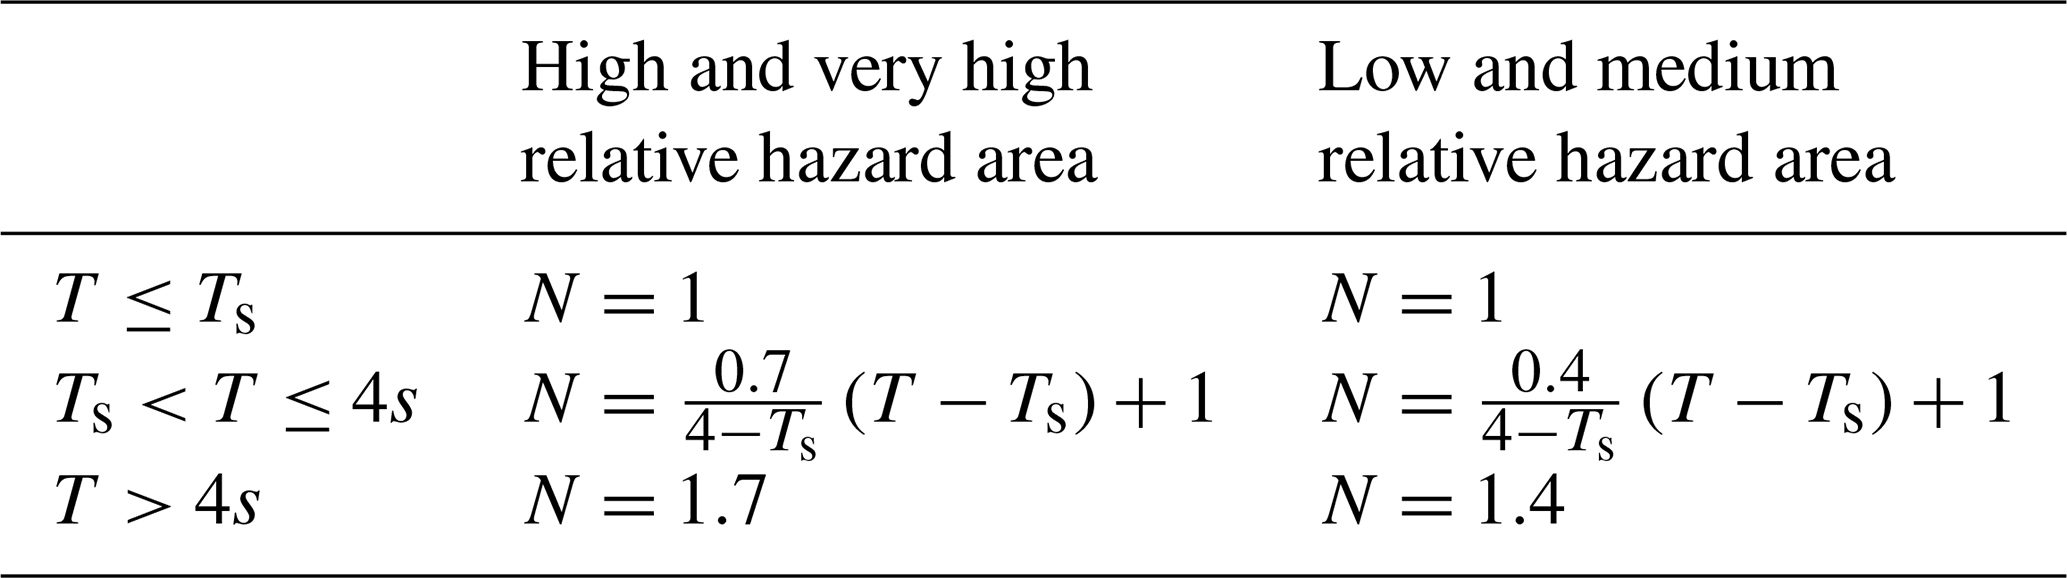
where B1 is the spectral shape factor, which is calculated by Eqs. (A2) to (A4), and N is the spectral modification factor, which is evaluated by equations presented in Table A3.
In these equations, T is the structural fundamental period of vibration (in s); T0, Ts, and S are parameters related to the site soil conditions and seismic potential of the region as given in Table A2.
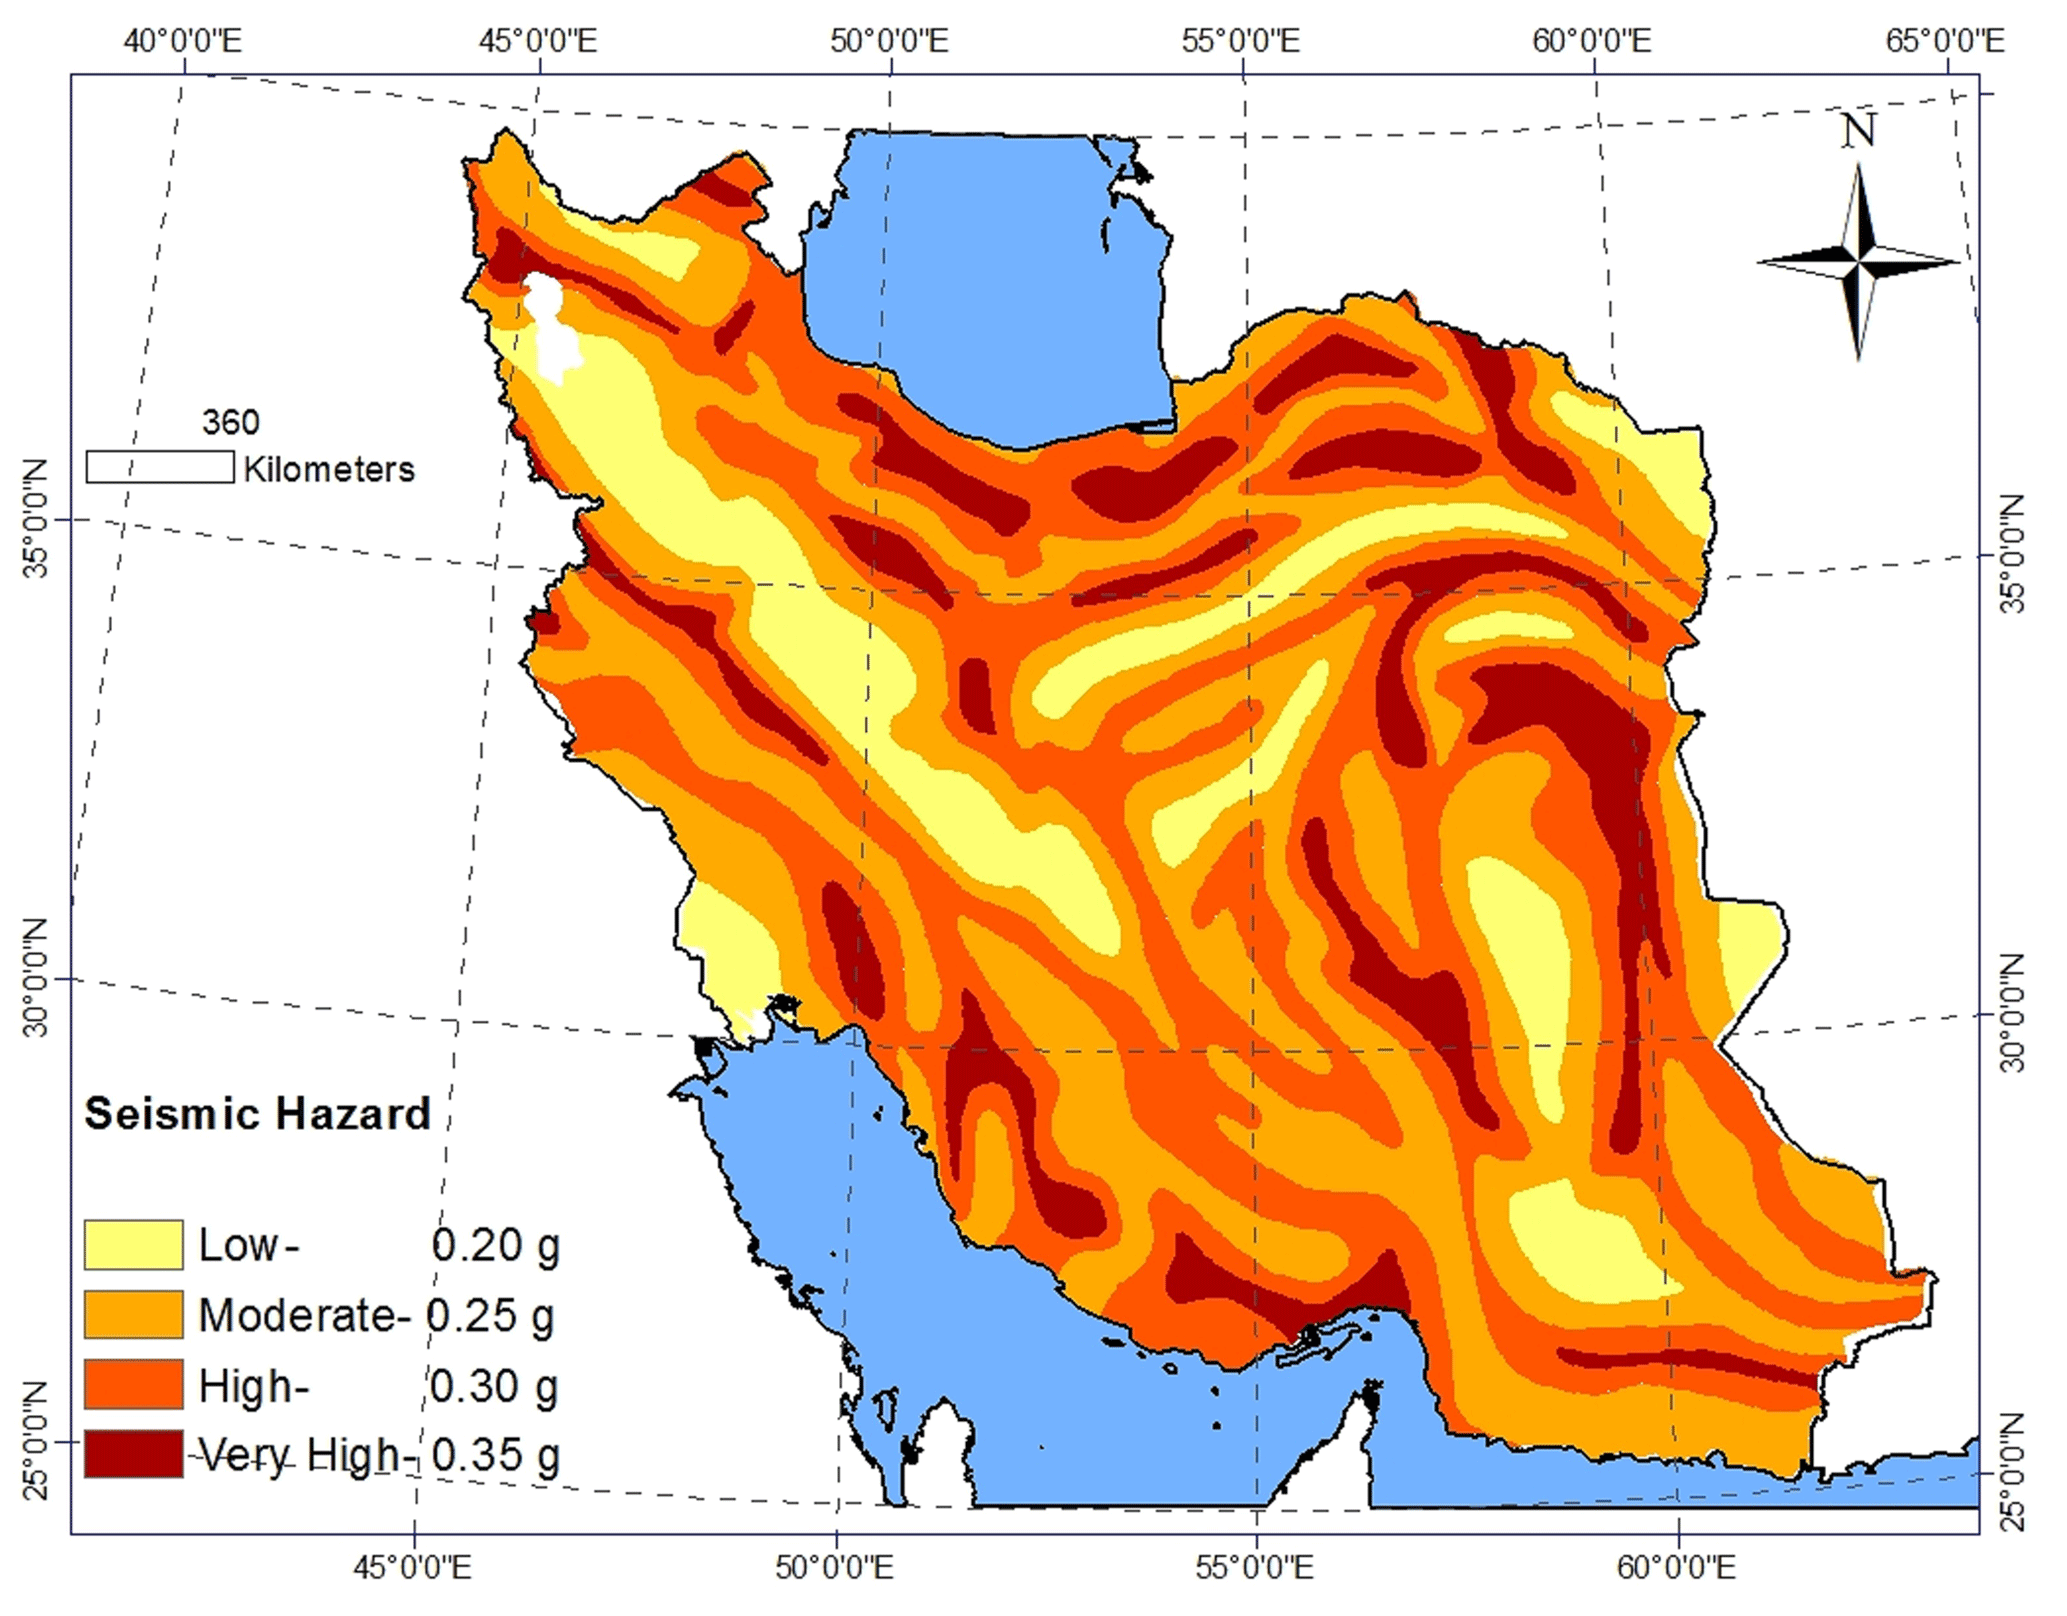
Figure A1Seismic hazard map of Iran (BHRC, 2015).
Table A1Moment magnitude of 104 seismic regions (Karimiparidari, 2014).


Table A3N (spectral modification factor) calculation equations (BHRC, 2015).
The work here is based on a PhD thesis by Saeideh Farahani (supervisors: Behrouz Behnam and Ahmad Tahershamsi) at AUT. The thesis is available via http://library.aut.ac.ir/ (last access: 1 November 2020).
SF wrote and compiled the paper (70 %), established the methodology (100 %), did the analysis, and prepared the figures (100 %). BB and AT supervised and assisted with the manuscript completion, editing and co-authoring of paper (30 %).
The authors declare that they have no conflict of interest.
This paper was edited by Oded Katz and reviewed by Chrysanthos Maraveas and one anonymous referee.
Adib, A., and Afzal, P.: Landslide Hazard Zonation And Risk Analysis In Goloord Region (North Of Iran) Using AHP Method, in: International Multidisciplinary Scientific GeoConference, SGEM – Surveying Geology & mining Ecology Management, Bulgaria, 18, 449–456, 2018.
Aghda, S. F. and Bagheri, V.: Evaluation of earthquake-induced landslides hazard zonation methods: a case study of Sarein, Iran, earthquake (1997), Arab. J. Geosci., 8, 7207–7227, 2015.
Akbarimehr, M., Motagh, M., and Haghshenas-Haghighi, M.: Slope stability assessment of the Sarcheshmeh Landslide, Northeast Iran, Investigated using InSAR and GPS observations, Remote Sens., 5, 3681–3700, 2013.
Alavi, M.: Tectonics of the Zagros orogenic belt of Iran: new data and interpretations, Tectonophysics, 229, 211–238, 1994.
Allen, T. I. and Wald, D. J.: Topographic slope as a proxy for seismic site-conditions (VS30) and amplification around the globe, US Geological Survey 2331-1258, US Geological Survey, USA, 2007.
Allen, T. I. and Wald, D. J.: On the use of high-resolution topographic data as a proxy for seismic site conditions (VS 30), Bull. Seismol. Soc. Am., 99, 935–943, 2009.
Arjmandzadeh, R., Sharifi Teshnizi, E., Rastegarnia, A., Golian, M., Jabbari, P., Shamsi, H., and Tavasoli, S.: GIS-Based Landslide Susceptibility Mapping in Qazvin Province of Iran, Iran. J. Sci. Technol. T. Civ. Eng., 44, 619–647, https://doi.org/10.1007/s40996-019-00326-3, 2020.
Askari, F., Dabiri, R., and Keshavarz Bakhashayesh, M.: Liquefaction Evaluation By Standard Penetration Tests And Shear Wave Velocity Measurments In South Of Tehran, J. Seismol. Earthq. Eng., 8, 95–103, 2006.
Babakan, S., Zare, M., and Memarian, H.: Seismo-geotechnical zonation mapping of Caspian Sea shores, J. Facul. Eng., 43, 229–238, 2009.
BHRC: Building and Housing Research Center, Iranian Code of Practice for Seismic Resistant Design of Buildings, Standard No. 2800, 4th Edn., BHRC, Tehran, 2015.
Daneshvar, M. R. M. and Bagherzadeh, A.: Landslide hazard zonation assessment using GIS analysis at Golmakan Watershed, northeast of Iran, Front. Earth Sci., 5, 70–81, 2011.
Dowrick, D. J. and Rhoades, D. A.: Relations between earthquake magnitude and fault rupture dimensions: How regionally variable are they?, Bull. Seismol. Soc. Am., 94, 776–788, 2004.
Esmali, A. and Ahmadi, H.: Using GIS & RS in mass movements hazard zonation – a case study in Germichay Watershed, Ardebil, Iran, in: Proceeding of the Map Asia2003 conference, 13–15 October 2003, Kuala Lumpur, Malaysia, 2003.
Farahani, S., Tahershamsi, A., and Behnam, B.: Earthquake and post-earthquake vulnerability assessment of urban gas pipelines network, Nat. Hazards, 101, 327–347, https://doi.org/10.1007/s11069-020-03874-4, 2020.
FEMA – Federal Emergency Management Agency: Multi-Hazard Loss Estimation Methodology, Earthquake Model, HAZUS-MH2.1, Washington, D.C., 2012.
Ghassemi, M. R.: Surface ruptures of the Iranian earthquakes 1900–2014: Insights for earthquake fault rupture hazards and empirical relationships, Earth-Sci. Rev., 156, 1–13, 2016.
GSI: Geological Survey and Mineral Explorations of Iran (GSI), available at: http://gsi.ir/en (last access: November 2020), 2018.
Hessami, K. and Jamali, F.: Explanatory notes to the map of major active faults of Iran, J. Seismol. Earthq. Eng., 8, 1–11, 2006.
Karimiparidari, S.: Seismic Hazard Analysis in Iran (475 Years Return Period), PhD Thesis, IIEES – International Institute of Earthquake Engineering and Seismology, Tehran, Iran, 2014.
Kavand, A., and Haeri, S.: Probabilistic evaluation of liquefaction-induced lateral spreading displacement for a site in south of Iran, in: International Conference on Performance-Based Design in Earthquake Geotechnical Engineering, Tokyo, 2009.
Koike, T., Takada, S., Ogawa, Y., Matsumoto, M., Tajima, T., and Hassani, N.: Seismic damage predictions for the gas distribution systems in great Tehran, Iran, in: 13th World Conference on Earthquake Engineering, Vancouver, BC, Canada, 2004,
Komakpanah, A. and Farajzadeh, M.: Liquefaction susceptibility and opportunity macrozonation of Iran, in: Second international conference on seismology and earthquake engineering, Tehran, Iran, 1651–1658, 1995.
Makdisi, F. I. and Seed, H. B.: Simplified procedure for estimating dam and embankment earthquake-induced deformations, J. Geotech. Geoenviron. Eng., 104, 849–867, 1978.
Manighetti, I., Campillo, M., Bouley, S., and Cotton, F.: Earthquake scaling, fault segmentation, and structural maturity, Earth Planet. Sc. Lett., 253, 429–438, 2007.
Mason, D. B.: Earthquake magnitude potential of the Intermountain seismic belt, USA, from surface-parameter scaling of late Quaternary faults, Bull. Seismol. Soc. Am., 86, 1487–1506, 1996.
Mirzaee, S., Motagh, M., Akbari, B., Wetzel, H.-U., and Roessner, S.: Evaluating Three InSAR Time-Series Methods To Assess Creep Motion, Case Study: Masouleh Landslide In North Iran, in: ISPRS Annals of Photogrammetry, Remote Sensing & Spatial Information Sciences, IV-1/W1, 223-228, https://doi.org/10.5194/isprs-annals-IV-1-W1-223-2017, 2017.
Mokhtari, M. and Abedian, S.: Spatial prediction of landslide susceptibility in Taleghan basin, Iran, Stoch. Environ. Res. Risk A., 33, 1297–1325, 2019.
Moradi, M., Bazyar, M. H., and Mohammadi, Z.: GIS-based landslide susceptibility mapping by AHP method, a case study, Dena City, Iran, J. Basic Appl. Scient. Res., 2, 6715–6723, 2012.
Mousavi, M., Hesari, M., and Azarbakht, A.: Seismic risk assessment of the 3rd Azerbaijan gas pipeline in Iran, Nat. Hazards, 74, 1327–1348, 2014.
Naghizadehrokni, M., Choobbasti, A. J., and Naghizadehrokni, M.: Liquefaction maps in Babol City, Iran through probabilistic and deterministic approaches, Geoenviron. Disast., 5, 2–17, https://doi.org/10.1186/s40677-017-0094-9, 2018.
Newmark, N. M.: Earthquake spectra and design, Earthquake Eng. Research Institute, Berkeley, CA, 1982.
Öztürk, S., Ghassemi, M. R., and Sari, M.: Empirical Relations Among The Parameters Associated With Earthquake Rupture Mechanisms For Iranian Earthquakes, Sigma, 36, 301–310, 2018.
Perrin, N. and Wood, P.: Defining the Wellington Fault within the urban area of Wellington City, Institute of Geological & Nuclear Science Client Report 6-49, Institute of Geological & Nuclear Science Client, Wellington, 2003.
Peyret, M., Djamour, Y., Rizza, M., Ritz, J.-F., Hurtrez, J.-E., Goudarzi, M., Nankali, H., Chery, J., Le Dortz, K., and Uri, F.: Monitoring of the large slow Kahrod landslide in Alborz mountain range (Iran) by GPS and SAR interferometry, Eng. Geol., 100, 131–141, 2008.
Pirasteh, S., Li, J., and Chapman, M.: Use of LiDAR-derived DEM and a stream length-gradient index approach to investigation of landslides in Zagros Mountains, Iran, Geocarto Int., 33, 912–926, 2018.
Rezaei, S. and Choobbasti, A. J.: Liquefaction assessment using microtremor measurement, conventional method and artificial neural network (Case study: Babol, Iran), Front. Struct. Civ. Eng., 8, 292–307, 2014.
Sadigh, K., Egan, J., and Youngs, R.: Specification of ground motion for seismic design of long period structures, Earthq. Notes, 57, 13–25, 1986.
Sakvand, H., Shayan, S., and Sharifikia, M.: Liquefaction Risk Zoning In Silakhor Plain, J. Appl. Res. Geogr. Sci., 18, 51–68, 2011.
Seed, H. and Idriss, I.: Ground motions and soil liquefaction during earthquakes: engineering monographs on earthquake criteria, structural design, and strong motion records, MNO-5, Earthquake Engineering Research Institute, Oakland, Calif, 1982.
Shahvar, M.: ShakeMaps implementions for Iran, PhD Thesis, IIEES – International Institute of Earthquake Engineering and Seismology, Tehran, Iran, 2013.
Shirani, K. and Seif, A.: Landslide hazard zonation by using statistical methods (Pishkuh Region in Fereydonshahr Province), Geosciences, 22, 149–158, 2012.
Stramondo, S., Moro, M., Tolomei, C., Cinti, F., and Doumaz, F.: InSAR surface displacement field and fault modelling for the 2003 Bam earthquake (southeastern Iran), J. Geodynam., 40, 347–353, 2005.
Taherian, A. R. and Kalantari, A.: Risk-targeted seismic design maps for Iran, J. Seismol., 23, 1299–1311, 2019.
Tangestani, M.: Landslide susceptibility mapping using the fuzzy gamma approach in a GIS, Kakan catchment area, southwest Iran, Aust. J. Earth Sci., 51, 439–450, 2004.
Vakhshoori, V., Pourghasemi, H. R., Zare, M., and Blaschke, T.: Landslide Susceptibility Mapping Using GIS-Based Data Mining Algorithms, Water, 11, 2292, https://doi.org/10.3390/w11112292, 2019.
Wald, D. J., Worden, B. C., Quitoriano, V., and Pankow, K. L.: ShakeMap manual: technical manual, user's guide, and software guide 2328-7055, 2005.
Wells, D. L. and Coppersmith, K. J.: New empirical relationships among magnitude, rupture length, rupture width, rupture area, and surface displacement, Bull. Seismol. Soc. Am., 84, 974–1002, 1994.
Yavari, H., Pahlavani, P., and Bigdeli, B.: Landslide Hazard Mapping Using A Radial Basis Function Neural Network Model: A Case Study In Semirom, Isfahan, Iran, in: International Archives of the Photogrammetry, Remote Sensing & Spatial Information Sciences, Karaj, Iran, 2019.
Ziabari, S. H., Ghafoori, M., and Moghaddas, N. H.: Liquefaction potential evaluation and risk assessment of existing structures: A case study in Astaneh-ye Ashrafiyeh City, Iran, Euras. J. Biosci., 11, 52–62, 2017.