the Creative Commons Attribution 4.0 License.
the Creative Commons Attribution 4.0 License.
 | 11 May 2020
Erosion after an extreme storm event in an arid fluvial system of the southern Atacama Desert: an assessment of the magnitude, return time, and conditioning factors of erosion and debris flow generation
Albert Cabré
Victor Fredes
Bruno Villela
The contribution of an individual extreme storm event to long-term erosion rates has been estimated for the first time in the Atacama Desert. A mean erosion of 1.3 mm has been calculated for the March 2015 event that impacted the southernmost part of the Atacama Desert. The estimated erosion is consistent with millennial erosion rates and the previously reported return times of high-sediment-discharge events in the study area. This is significant because erosion rates, related to events of high sediment discharge in arid fluvial systems, are difficult to measure with sediment loading due to destruction of gauges by devastating flash floods and therefore have not been directly measured yet. During the March 2015 storm, debris flows were reported as the main sediment transport process, while gullies and channels erosion were the main source of sediments that generated debris flows reaching the tributary junctions and the trunk valleys. Sediment yield at tributary outlets is highly dependent on the ability of catchments to store sediments in stream networks between storms. The largest tributary catchments, the high hydrological hierarchy, the low topographic gradient and the gentle slopes are the most determining factors in generating debris flows capable of reaching alluvial fans in any storm event from large sediment volumes stored in the stream networks. Our findings better assess the susceptibility to debris flow of arid catchments, which is significant for the southernmost valleys of the Atacama Desert because human settlements and industries are mostly established in alluvial fans.
- Article
(34416 KB) - Full-text XML
-
Supplement
(725 KB) - BibTeX
- EndNote


The hydrology of the Atacama Desert is characterized by rivers that flow from the high Andean mountain ranges fed by snow, glaciers and permafrost melting (Favier et al., 2009; Gascoin et al., 2011). In this scenario, the presence of perennial rivers is restricted to the trunk valleys, while the tributary valleys of the midmountainous region and of the Andean foothills host ephemeral stream networks. High runoff and sediment discharges in these ephemeral stream networks are triggered by intense rare rainfall events. The influence of extreme storms has resulted in significant erosion runoff events in the past recorded by coarse-grain-size layers in lacustrine and marine archives covering the past 5500 years in the Atacama Desert (Ortlieb, 1994, 1995; Veit, 1996; Rein et al., 2005; Maldonado and Villagrán, 2006; Vargas et al., 2006; Martel-Cea et al., 2016; Tiner et al., 2018; Ortega et al., 2012, 2019). The return time of extreme runoff erosive events decreased from one event per 210 years to one event per 40 years during the last 1000 years. This is interpreted as an intensification of El Niño–Southern Oscillation (ENSO) storm activity in northern Chile (Ortega et al., 2019, and references therein).
The Atacama Desert has historically been impacted by extreme storms that generally occur during Southern Hemisphere winters. Almost all records available are from local newspapers and have recently been compiled in Ortega et al. (2019) and Vargas et al. (2018). Most of the events triggered flash floods and debris flows that affected preferred sites for human settlements, such as fluvial plains and alluvial fans. In March 2015, a storm impacted a large area of the Atacama Desert (Barret et al., 2016; Wilcox et al., 2016; Bozkurt et al., 2016; Jordan et al., 2019). This event occurred during the Southern Hemisphere summer in an area where the highest mountain ranges are above 3500 m a.s.l. and generally experience precipitation in the form of snow. The high elevation of the zero isotherm during the March 2015 event caused erosion in areas where snow usually delays runoff (Wilcox et al., 2016; Jordan et al., 2019). This catastrophic hydrometeorological event caused human casualties and considerable economic losses in the main cities located at the Salado River, Copiapó River, Huasco River and Elqui River.
Extreme storm events contribute greatly to erosion in arid zones (Tarr, 1890; Coppus and Imeson, 2002). Their influence in the Andean catchments of Chile has been highlighted in Carretier et al. (2018). This has been reinforced by the differences in the concentration of terrestrial cosmogenic nuclides between sediments supplied by debris flows and sediments supplied by the combination of fluvial processes in the Huasco River valley (Aguilar et al., 2014) and in other arid fluvial systems in Chile (Carretier et al., 2015). Therefore, the magnitude and distribution of erosion after extreme storms are of great interest for both modeling landscape evolution and for analyzing sediment cascade dynamics in the southernmost part of the Atacama Desert. However, the precise quantification of catchment erosion during a major flood event has not yet been established. This might be explained because of the lack of high-resolution digital elevation models (e.g., lidar point clouds in Anderson et al., 2015) and due to the absence of detailed topography available for the Atacama Desert. The problem is compounded by the lack or scarcity of meteorological and fluviometric stations to measure the intensity of the hourly rain and the sediment load yielding, respectively.
The aim of this study is to evaluate erosion during the March 2015 storm in catchments of the Huasco River valley (Fig. 1). We have calculated the erosion within the tributary catchments (total area of 1500 km2) based on volumes of debris flow deposits measured in tributary junction alluvial fans after the storm. The calculated erosion agrees with the Holocene erosion rates presented in Aguilar et al. (2014) using the concentrations of terrestrial cosmogenic nuclides in stream sediments. Therefore, we illustrate how erosion in this arid area is dictated by the repetition of individual extreme storm events such as the March 2015 event. In addition, the statistical evaluation proves that the topographic attributes of the catchments facilitate the storage of debris within them, which is ultimately significant for the generation of debris flow. These results suggest that debris storage should be considered to adequately define susceptibility to the generation of debris flows within the catchments, and these are significant for the assessment of hydrometeorological hazards.

Figure 1Topography extracted from a digital elevation model courtesy of the NASA JPL Caltech with a nominal spatial pixel resolution of 30 m×30 m (https://asterweb.jpl.nasa.gov/gdem.asp, last access: 6 May 2020) and modeled hydrology of the Huasco River valley. Dotted red lines show the isohyets of daily accumulated rains during the 23–26 March storm by kriging interpolation of meteorological data from the Dirección General de Aguas, Chile. Cyan points show the accumulated rainfall in each meteorological station during the March 2015 storm. The box outlined with a dashed white line shows the studied region.
The Huasco River valley (29∘ S) is one of the main fluvial systems in the climatic transition area between the hyperarid core of the Atacama Desert and the semiarid region of central Chile. This river has a hydrological basin of 9800 km2 from the continental water division in the east to the Pacific Ocean in the west (Fig. 1). Three main physiographic units are present at this latitude for the western slope of the Andes: the Coastal Cordillera (CC), which is located at the lowest elevations in the western area of the Huasco River watershed; the Principal Cordillera (PC) in the middle elevations; and the Frontal Cordillera (FC) in the high mountain ranges to the east. The Huasco River takes its name from the union of two main rivers on the border between the Coastal and the Principal cordilleras: the Carmen and the Tránsito rivers. These two rivers have permanent runoff from snowmelt and permafrost melt from the highest tributaries located in the Frontal Cordillera with summits rising 6000 m a.s.l. Glaciers and permafrost have been reported in the Frontal Cordillera above ∼4000 m a.s.l. and the largest record of glacial advance in the late Pleistocene does not go beyond 3200 m a.s.l. (Aguilar, 2010). Rainfall in the Principal Cordillera provides additional runoff that generally occurs during the Southern Hemisphere winter.
The study area (1500 km2) on which this paper focuses is situated in the Principal Cordillera. In this physiographic unit, the igneous–metamorphic Permotriassic and Mesozoic rocks exhumed during the Cenozoic represent the highest mountain ranges. These Paleozoic rocks are subdivided based on Salazar et al. (2013) into the Pampa Gneisses, the Tránsito Metamorphic Complex and the Chanchoquín Plutonic Complex. Volcano-sedimentary lithological units from the Mesozoic are also present between these Permotriassic tectonic blocks. These are the San Félix Formation, the Lautaro Formation and the Lagunillas Formation. These lithological units are intruded by several Cenozoic plutons and are covered in some areas by Cenozoic unconsolidated gravel deposits (e.g., the Atacama Gravels) and volcanic deposits (Salazar et al., 2013). Five geological groups were defined by Fredes (2016) considering a rock strength classification (González de Vallejo, 2002) of the geological units (Salazar et al., 2013; Fig. 2). Geo1 corresponds to intrusive rocks; Geo2 corresponds to volcanic and coarse sedimentary rocks; Geo3 corresponds to metamorphic rocks; Geo4 corresponds to fine-grained rocks (shales and siltstones), and Geo5 corresponds to unconsolidated Pleistocene–Holocene deposits.
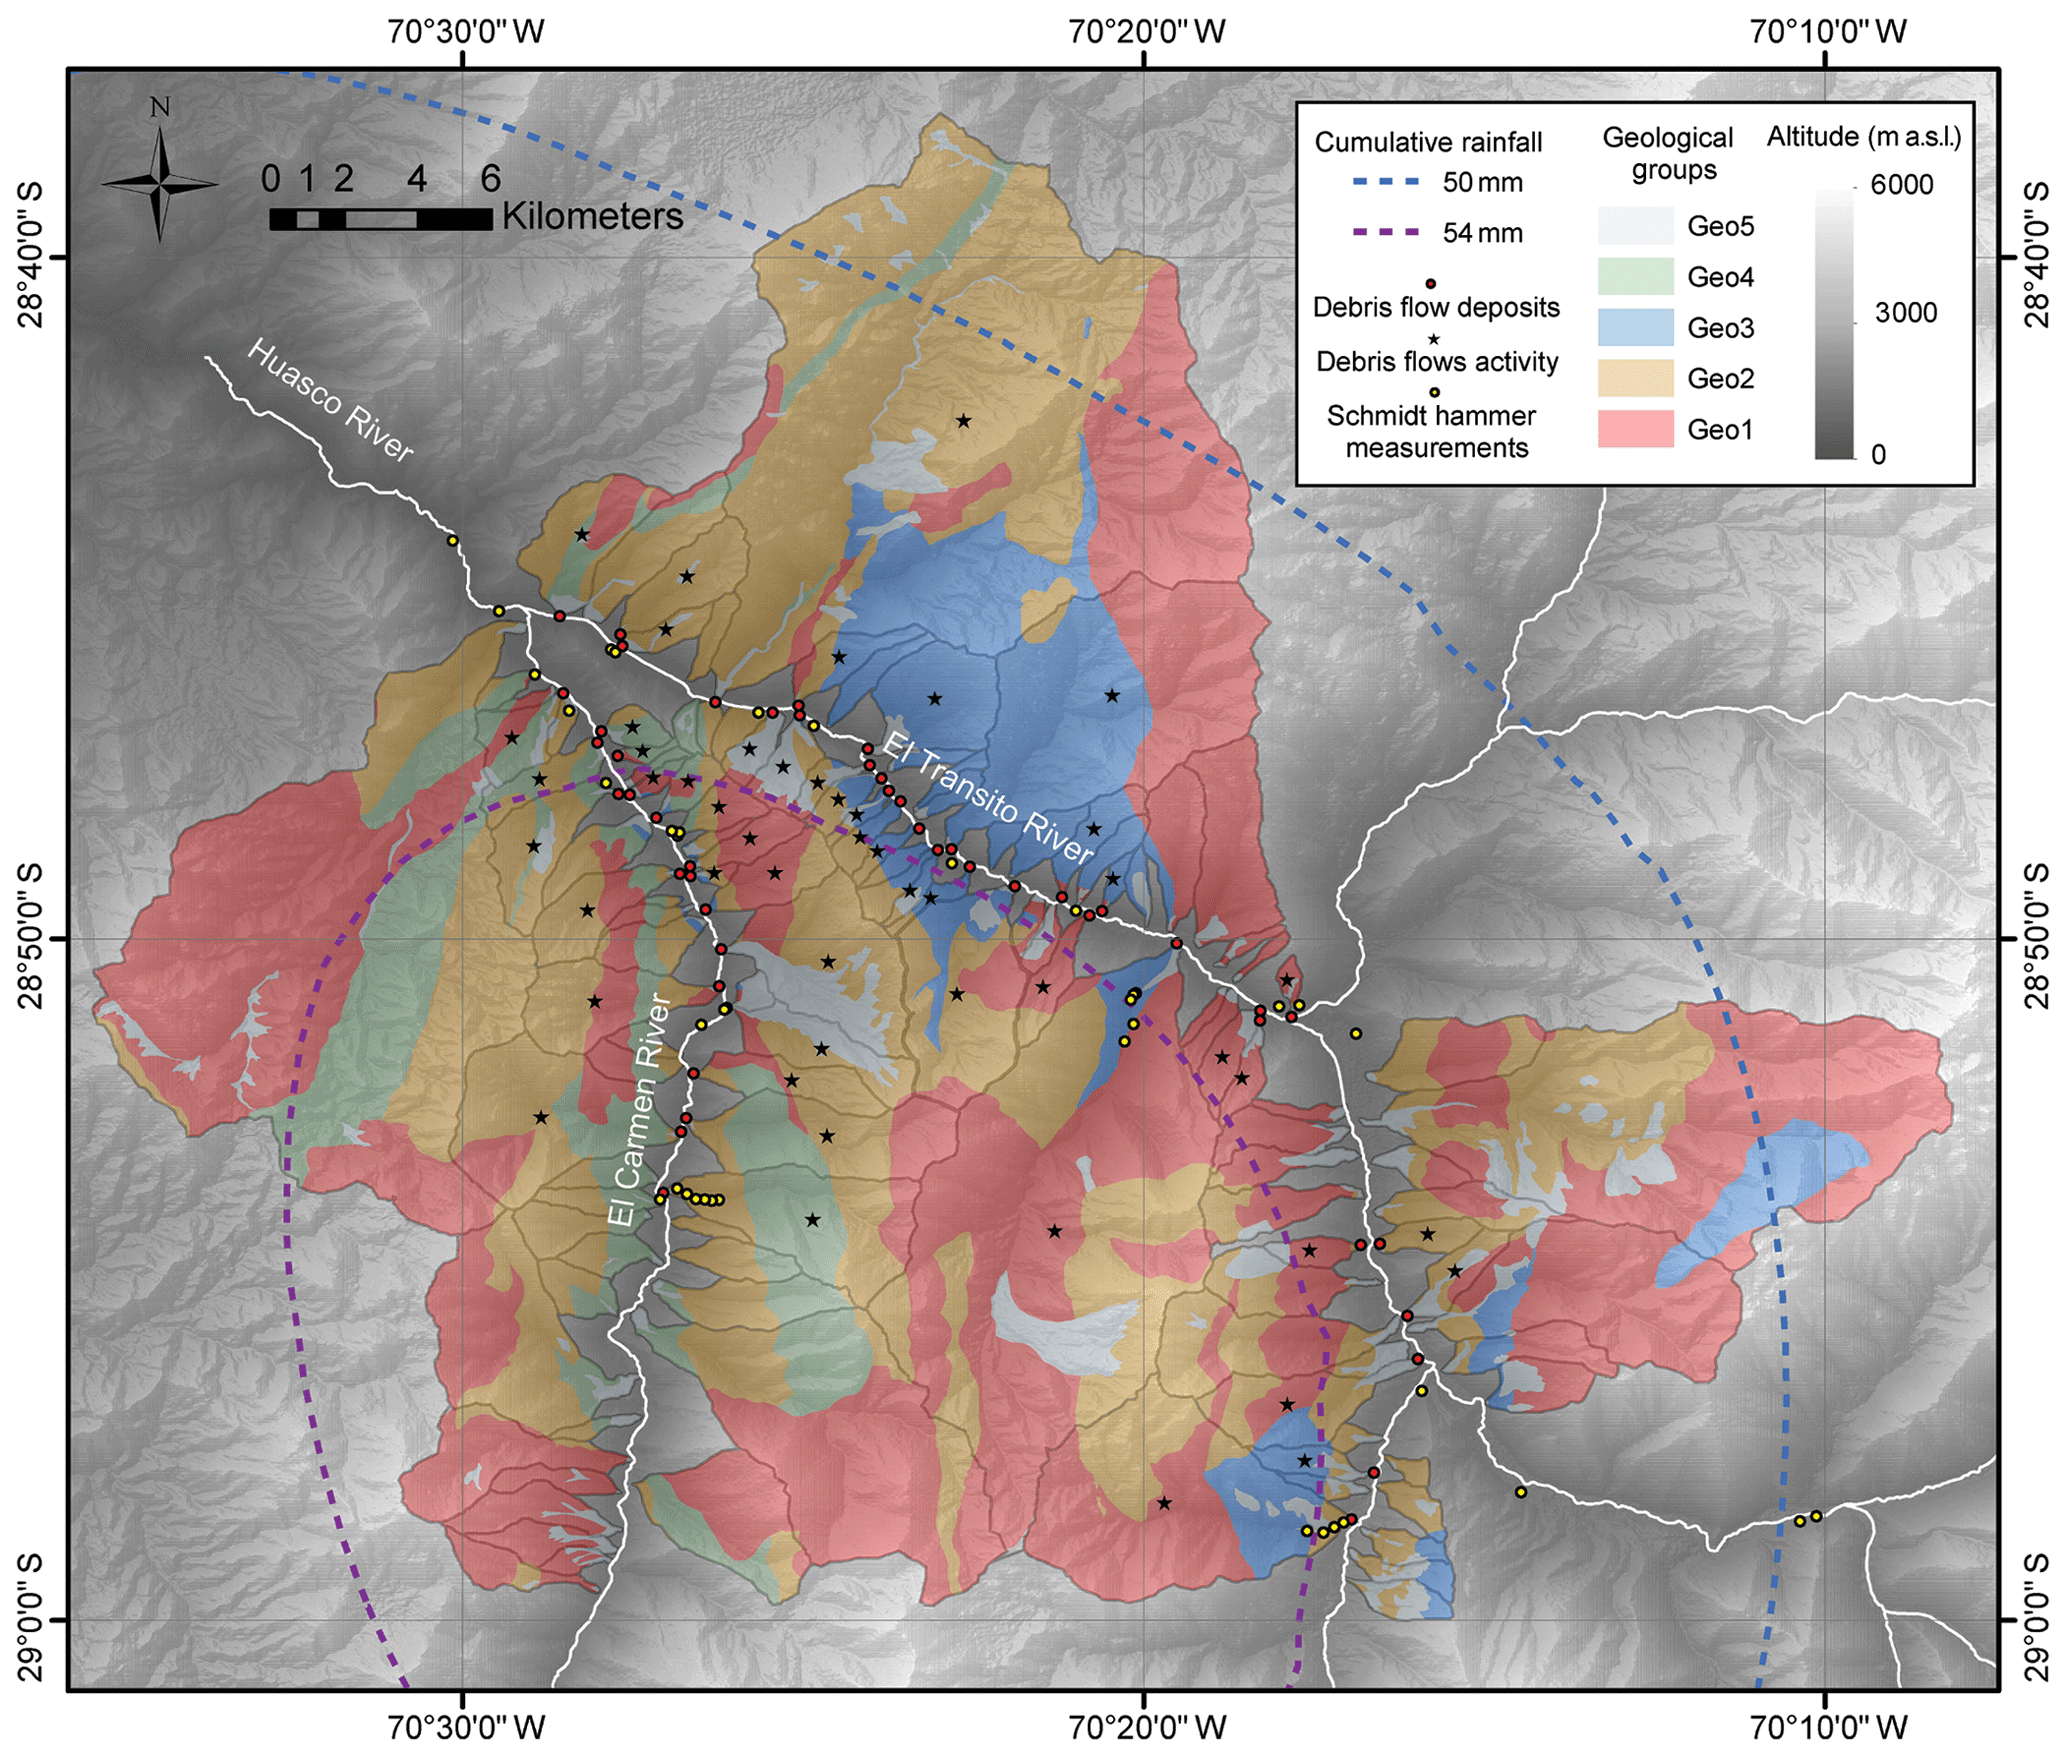
Figure 2Map that shows the distribution of geological groups defined in the Huasco River valley after Salazar et al. (2013) with the location of Schmidt hammer stations. The map includes the distribution of debris flow deposits during March 2015 and isohyets of accumulated rains created by kriging interpolation of meteorological data during the storm. Topography extracted from a digital elevation model courtesy of NASA JPL Caltech with a nominal spatial pixel resolution of 30 m×30 m (https://asterweb.jpl.nasa.gov/gdem.asp, last access: 6 May 2020).
The quantification and characterization of erosion and sedimentation in the Huasco River valley has been interpreted by different authors as an induced climatic and tectonic signal (Aguilar et al., 2011, 2013, 2014; Rossel et al., 2018). On a 106 year timescale, tectonic and climatic factors combining aridization and Andean uplift are coupled to develop a transient landscape organization (Aguilar et al., 2013). The calculated mean erosion rates of 0.03–0.08 mm yr−1 during the last 6–10 Myr do not reach the total degradation of the Miocene surfaces located at the highest altitudes (Aguilar et al., 2011). Millennial erosion rates (104 years) measured by concentrations of terrestrial cosmogenic nuclides (TCN) in river sediments are consistent with erosion rates of 106 years (Aguilar et al., 2014). The grain-size-dependent concentration of TCN in the alluvial stream sediments would have been induced by the contribution of gravels from the debris flows in the Holocene (Aguilar et al., 2014). Episodic erosion and sedimentation associated with debris flow deposits are recorded in the Holocene stratigraphic arrangements of the tributary junction alluvial fans situated at the Principal Cordillera (Veit, 1996; Aguilar, 2010; Cabré et al., 2017, 2019).
The Principal Cordillera is an area that is generally impacted by extreme storm events that trigger debris flows in the tributary catchments (Cabré et al., 2020). These storms are spatially heterogeneous, and their influence on the landscape is evidenced by multiple rills and gullies on the hillslopes together with erosion of channels within drainage networks (Figs. 3 and 4). The March 2015 storm event lasted 4 d in the Huasco River watershed (23–26 March) although it was not until 24 March that locals reported debris flows (Cabré et al., 2020). Figure 1 presents the precipitation map linked to the storm event of March 2015 that affected the Huasco River valley. This precipitation map shows that the most impacted areas were the Principal Cordillera and in particular the area studied with accumulated daily rainfall greater than 50 mm.

Figure 3(a) Field evidence of high-density rill formation during the March 2015 storm on hillslopes of the Huasco River valley. (b) Example of a deeply incised alluvial channel within a tributary catchment. Dashed line indicates pre-March 2015 storm surface with covered vegetation lying down overlain by a 30 cm layer of debris flow (DF) deposits triggered by the storm inland subsequently incised by more diluted flows. The person for scale is 180 cm tall. White arrow indicates the flow direction downwards. Panels (c) and (d) indicate pre- and postlandscape configuration showing rills, gullies and debris flows. (e) Debris flows (DF) with lateral levees deposited within the tributary catchment alluvial channels with subsequent incision. (f) Oblique aerial view of debris flow deposits on a tributary junction alluvial fan and the upstream zone which was ponded by the damming with the distal depositional lobe. (g) Front view of the tributary junction alluvial fan of (f).
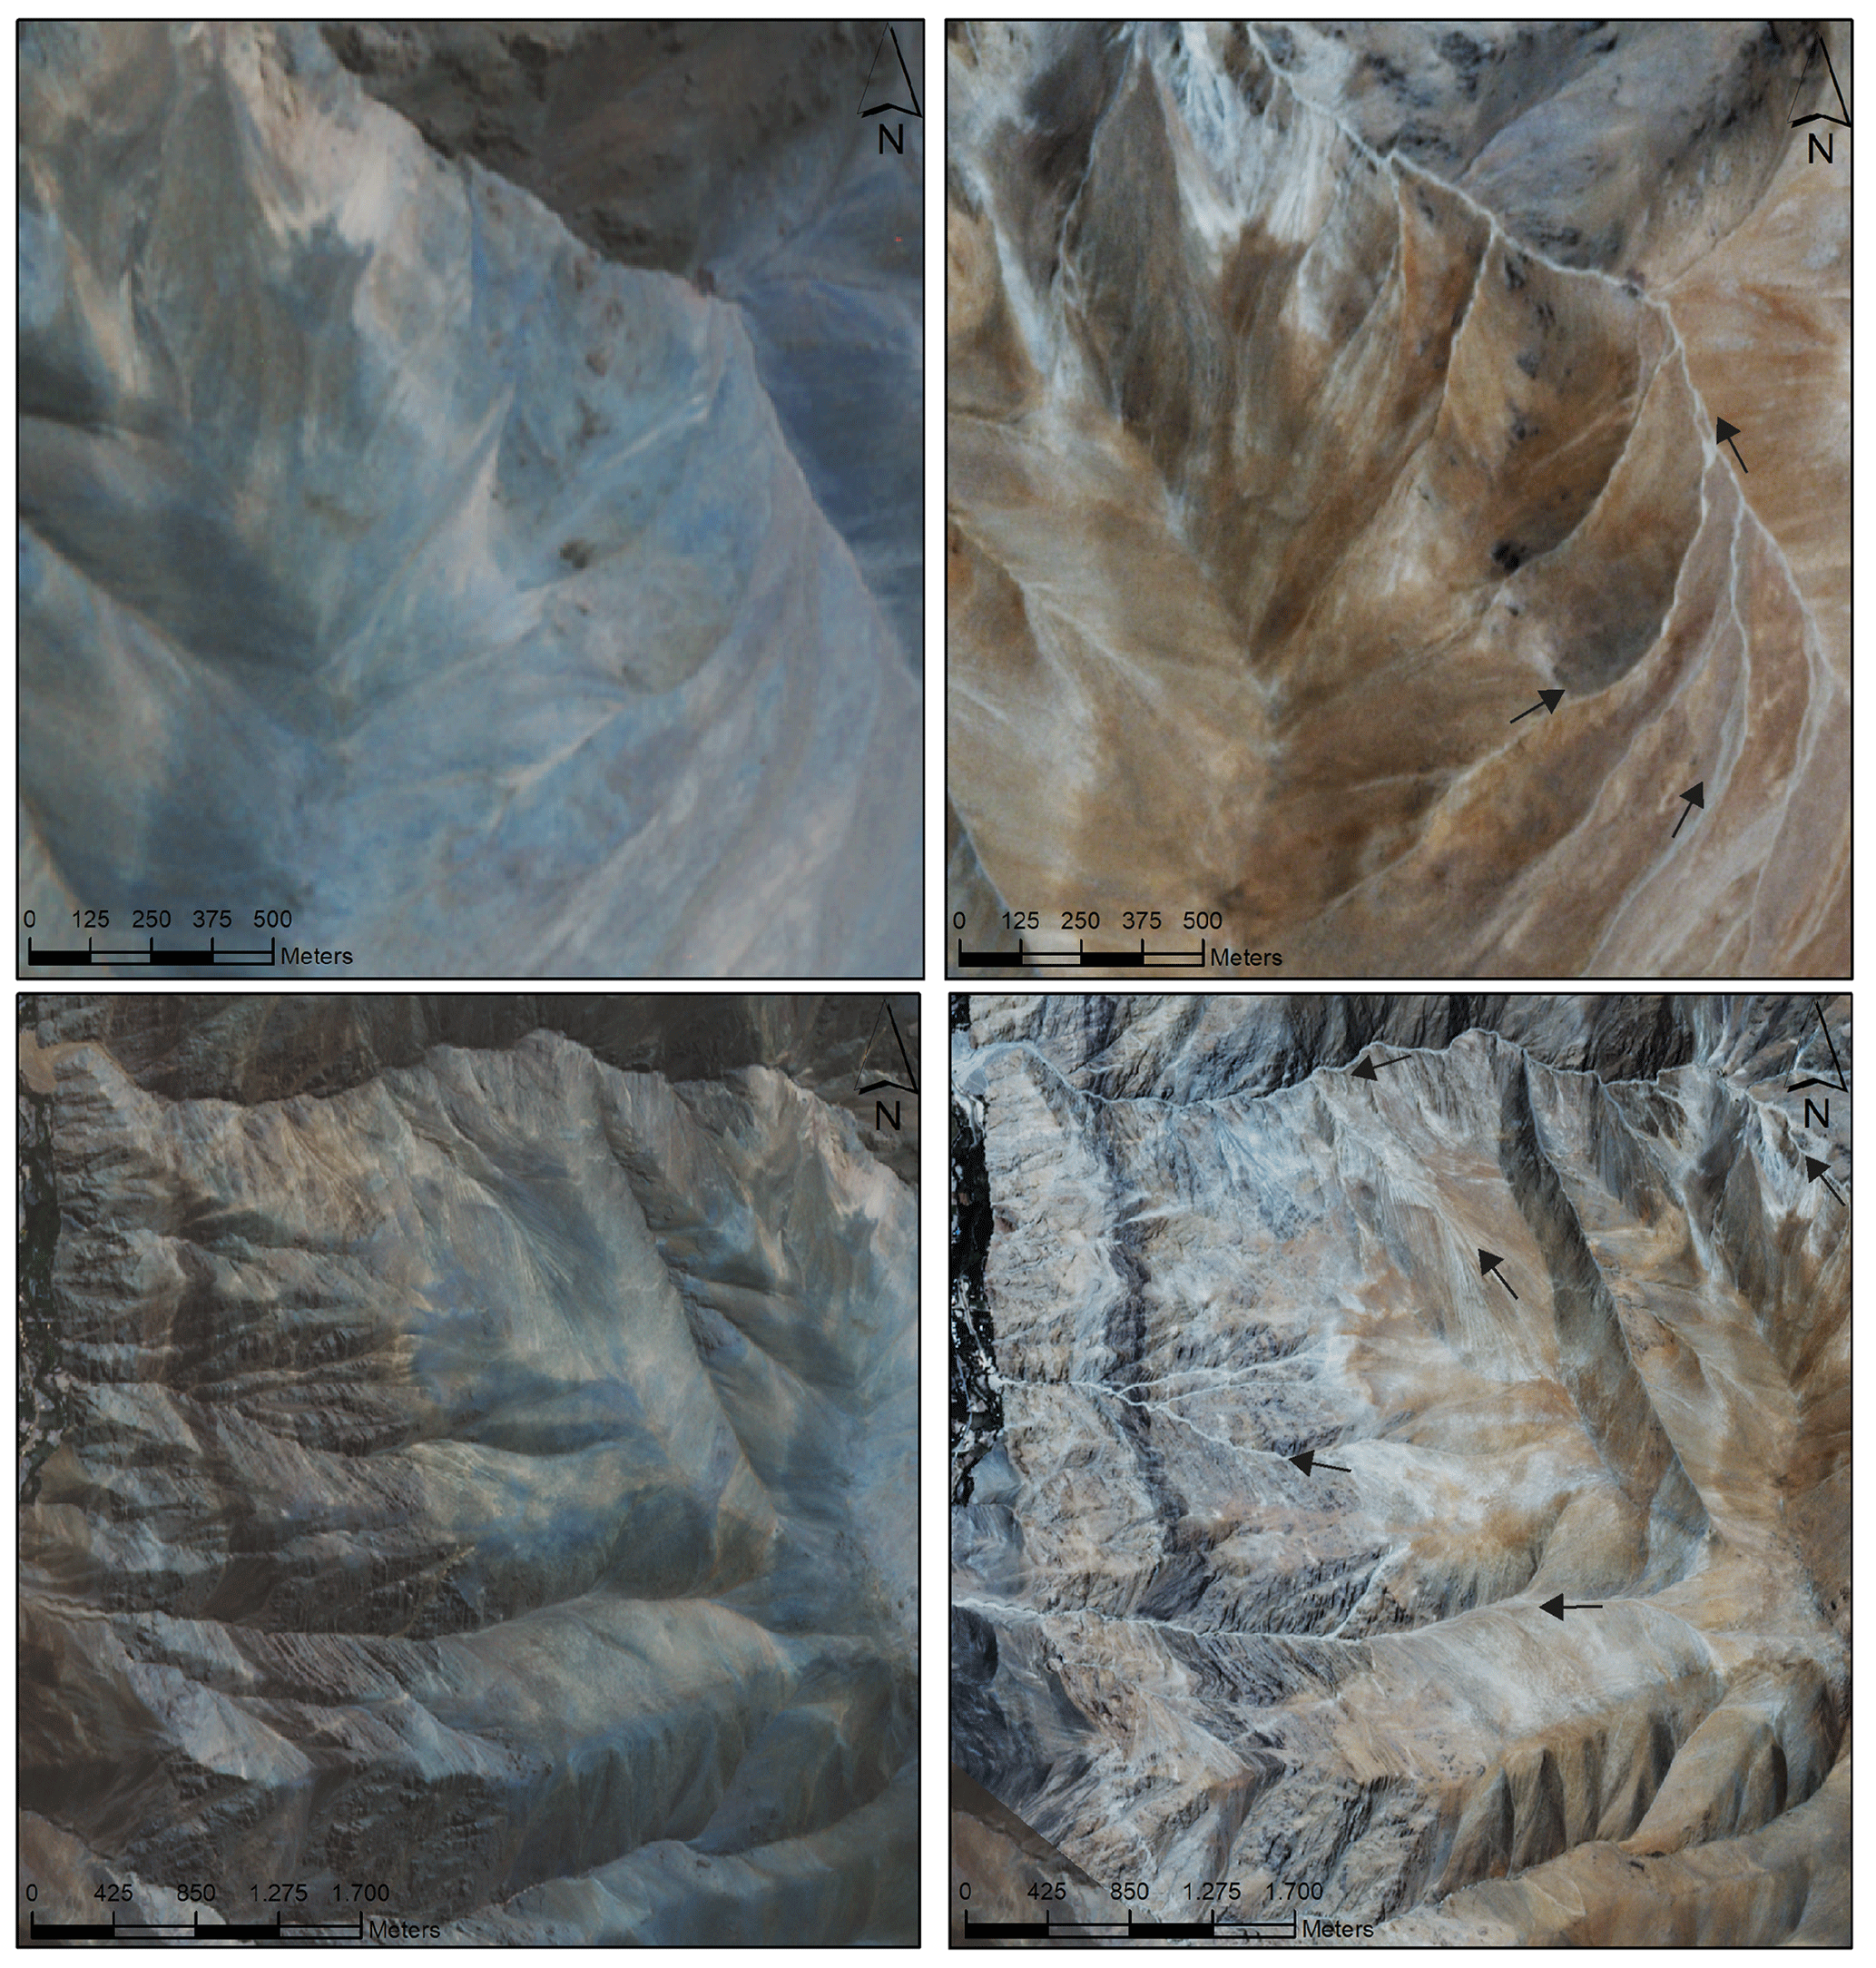
Figure 4Optical imagery retrieved from Planet Team (2017) before and after March 2015 storm. Left-hand images are before the March 2015 storm and right-hand images are after. Arrows indicate different physical evidence of erosion processes due to the event and gully presence after March 2015 storm. The general color tone change merely indicates different sun illumination.
Hillslopes of tributary catchments of the Huasco River were impacted by a combination of water erosion processes during the 23–26 March 2015 storm, in which, above all, the erosion of the upper layer of mantled hillslopes was produced when the water was concentrated and formed rills or gullies (Figs. 3 and 4). Rills begin to form from the overland flow when a critical shear stress is reached (Horton, 1945). If overland flow meets bare hillslopes characteristically of arid zones, hillslope erosion occurs in any mean average storm because of the high erodibility of the upper soil layer. On the other hand, narrow and deep channels (gullies) are relatively permanent on the hillslopes and usually allow the transmission of water and sediment from high areas of the hillslope to the main drainage network within the catchments.
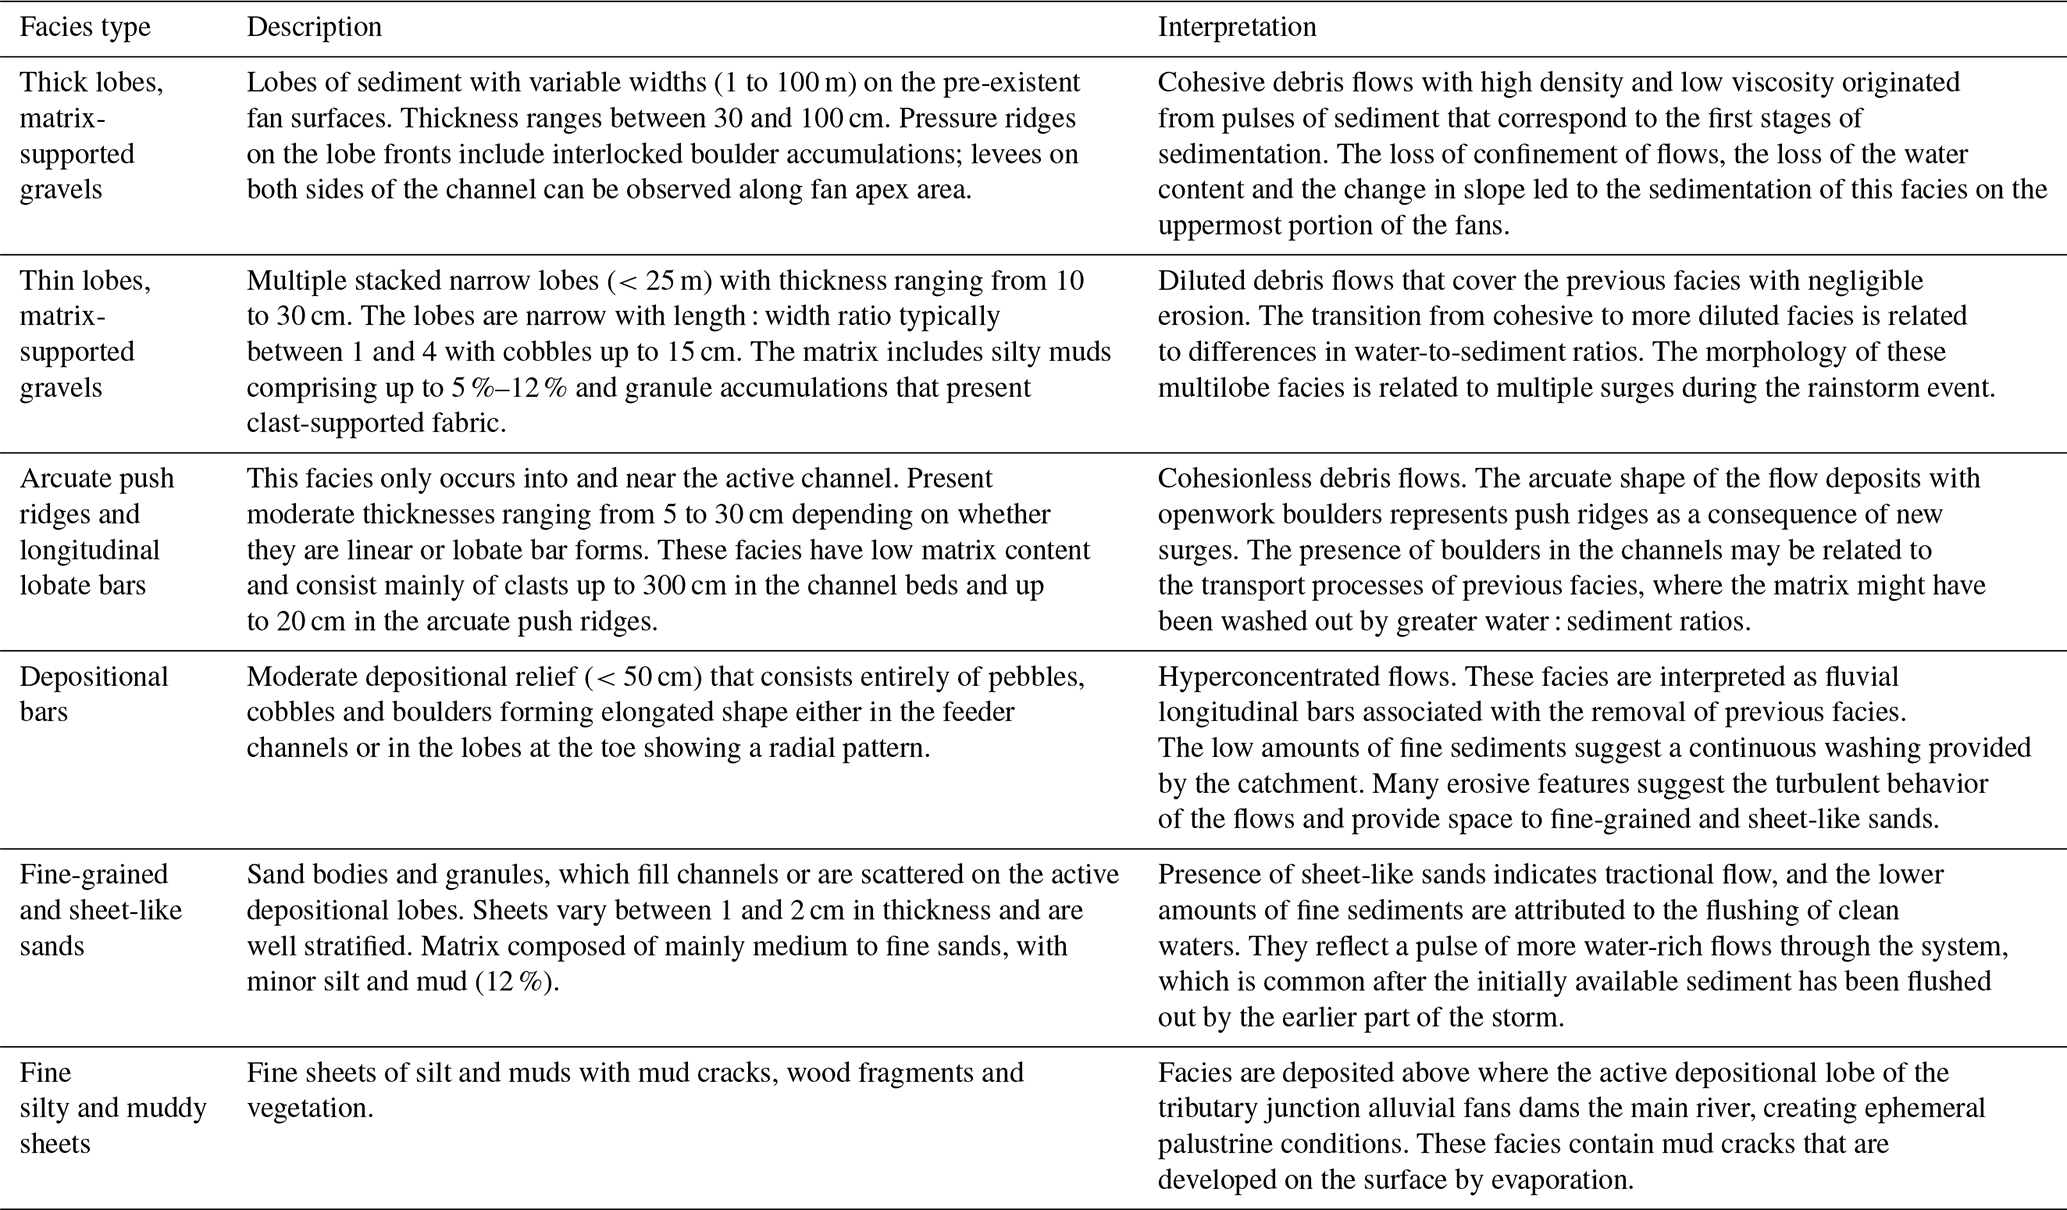
The March 2015 storm event severely impacted the alluvial channels of the stream network that store large volumes of sediment within the tributary catchments (Fig. 3b). Sediment entrainment resulted in different debris flows pulses with different sediment-to-water ratios. The debris flows were followed by a strong incision that facilitated the transport of sediment from alluviated channels downsystem. When these debris flows lost confinement at the outlet of the tributary catchments, their deposition occurred (Fig. 3f and g). Table 1 presents the main characteristics of sedimentary facies of debris flows deposited during the storm in the tributary junction alluvial fans (Cabré et al., 2020). For details on the spatial and temporal distribution of debris flows pulses in the fans, readers are referred to Cabré et al. (2020).
4.1 Debris flow deposit volumes and erosion measures
Immediately after the March 2015 storm, we conducted a field survey in the Huasco River valley. We have characterized the erosion processes within the catchments, both from fieldwork observations and from the analysis of optical satellite images retrieved from Planet Team (2017). Unfortunately, the available 3 m per pixel images for PlanetScope images and 6.5 m per pixel for RapidEye images do not help in identifying rills and small gullies. Therefore, field observations are crucial to identify these erosion indicators. We observed debris flow deposition on the alluvial fan surfaces and the formation of alluvial fan at the confluence of the tributaries with the trunk valley. The analysis of the deposits showed different rheology of the debris flows, ranging from cohesive debris flows and hyperconcentrated flows to mud flows. Here, to simplify statistical analysis, we do not differentiate between flow types and henceforth we will include all under the term “debris flow” sensu stricto. The debris flow deposit volumes were estimated using Eq. (1). This equation calculates the volume of the fans assuming a simplistic cone geometry and is adapted from the Campbell and Church (2003) equation for the colluvial fan volume calculations.
The width (w) and thickness (t) of 15 debris flow deposits in the alluvial fans were measured in the field with a measuring tape, while their axial length (l) was measured on the available satellite images. The width and length of the 33 debris flow deposits on fans were measured from RapidEye images. Based on the fieldwork measurements, a thickness between 0.5 and 1.5 m was considered for the debris flows whose length and width were measured on RapidEye images. The volumes have been corrected with a bulking factor that considers a porosity value of 30 % (Nicoletti and Sorriso-Valvo, 1991). The data used for the volume calculations of debris flow deposits and their accuracy are available in the Supplement (Table S1).
Table 1Table that summarizes the main characteristics of sedimentary facies of debris flows deposited during the storm in the tributary junction alluvial fans (Cabré et al., 2020).
We have calculated the mean erosion (mean surface lowering in millimeters) after the March 2015 storm event for each of the tributary catchments and for all the catchments within the study area with the volumes of debris flow deposits (Fig. 1, tributaries inside the box with a dashed white outline). The tributary catchments were extracted in a geographic information system environment. The digital elevation model used was retrieved from NASA JPL Caltech with a nominal spatial pixel resolution of 30 m×30 m (https://asterweb.jpl.nasa.gov/gdem.asp, last access: 6 May 2020) and a nominal vertical resolution of 1.0 m. The data used for the erosion calculations are available in Table S2.
4.2 Topographic attributes of catchments
Topographic attributes of 124 catchments were selected in order to analyze their influence on debris flow generation and erosion processes after the March 2015 storm. In order to characterize the tributary catchments, the topographic attributes were selected based on their influence on different processes such as peak flow generation and debris storage (Strahler, 1958; Melton, 1965; Howard and Kerby, 1983; Wilford et al., 2004): area, length (straight line between outlet and headwater of tributary catchments), maximum elevation, gradient (inclination of length), average slope, Gravelius index (shape), hypsometry, Melton ratio (index of roughness that normalizes relief by area; Melton, 1957), drainage density, maximum Strahler order, concavity and steepness index of the main thalweg. The data used are available in Table S2.
A statistical analysis was calculated in order to find outliers or anomalies in the topographic attributes that might control debris flow generation in tributary catchments. The significance of each attribute in debris flow generation is determined by an analysis of variance (ANOVA). The ANOVA determines if the mean values are similar between the catchment classes that generated debris flows and catchments that did not generate debris flows. The proposed tests consisted of splitting the total data variance into several components (between groups and within groups) and of comparing these components with Fisher's exact test with a critical value of 0.05 (Box et al., 1978; Davis, 2002). Principal component analysis (PCA) was performed to group the variables related to debris flow generation into common factors that might explain the variance in the catchments' attributes, reducing the number of variables and providing a weighting factor for each attribute within the group (Levy and Varela, 2003). A normalized classification of catchment clustering was performed by the weighted mean of the attributes that control the debris flow generation on each catchment.
4.3 Geological attributes of catchments
Geological groups were defined in order to analyze the influence of the rock units on the debris flow generation based on the map of Salazar et al. (2013). Eight hundred and forty Schmidt hammer (SH) rebound values were measured in little-weathered bedrock outcrops in 41 selected field stations to provide a rock strength classification of the geological groups as similarly presented in Stokes and Mather (2015) for tributary catchments in Morocco. We did not measure unconsolidated sediments because SH values are below instrumental detection (SH < 10; Selby, 1993). The rock strength classification includes more than 100 measurements for each of the geological groups. Additionally, a statistical analysis was performed for each geological group. Finally, we calculated the normalized SH values for the catchments considering areal percentage of the geological groups, mean Schmidt hammer values (MeanSHn) and interquartile range Schmidt hammer values (IQRSHn). The MeanSHn values represent a little-weathered-rock strength index for the catchments, while IQRSHn values represent an index of the weathering and cracking status of the bedrock as suggested in Roda-Boluda et al. (2018). The data used are available in Table S2.
5.1 Debris flow volumes and mean erosion
Field data used for the volume calculations of debris flow deposits and their accuracy are available in Table S1. Debris flows that reached the tributary junctions with the trunk valley and produced deposits greater than 500 m3 during the March 2015 event were identified in 49 of the 124 tributary junctions in the studied area. The remaining 75 catchments did not present debris flow deposits greater than 500 m3 of sediments in the tributary junctions. The volumes of the debris flow deposits vary between 530 and 234 000 m3. The propagation of errors entails an uncertainty of −19 % and +22 % for the volumes calculated with field measurements and −63 % and +93 % for volumes estimated by satellite image measurements. The total sediment yield by debris flows to the tributary junction alluvial fans is approximately 106 m3 (−34 % and +46 %). The mean erosion values (mean surface lowering) for the tributary catchments were obtained from the calculated volumes of debris flow deposits that reached the alluvial fans. These erosion values vary between 0.3 and 35 mm (Fig. 5). If we consider the total area of the tributary catchments (including the catchments where debris flow were absent in the tributary junctions), the total mean erosion reported for the extreme storm event of March 2015 is 1.3 mm for an area of 1500 km2.
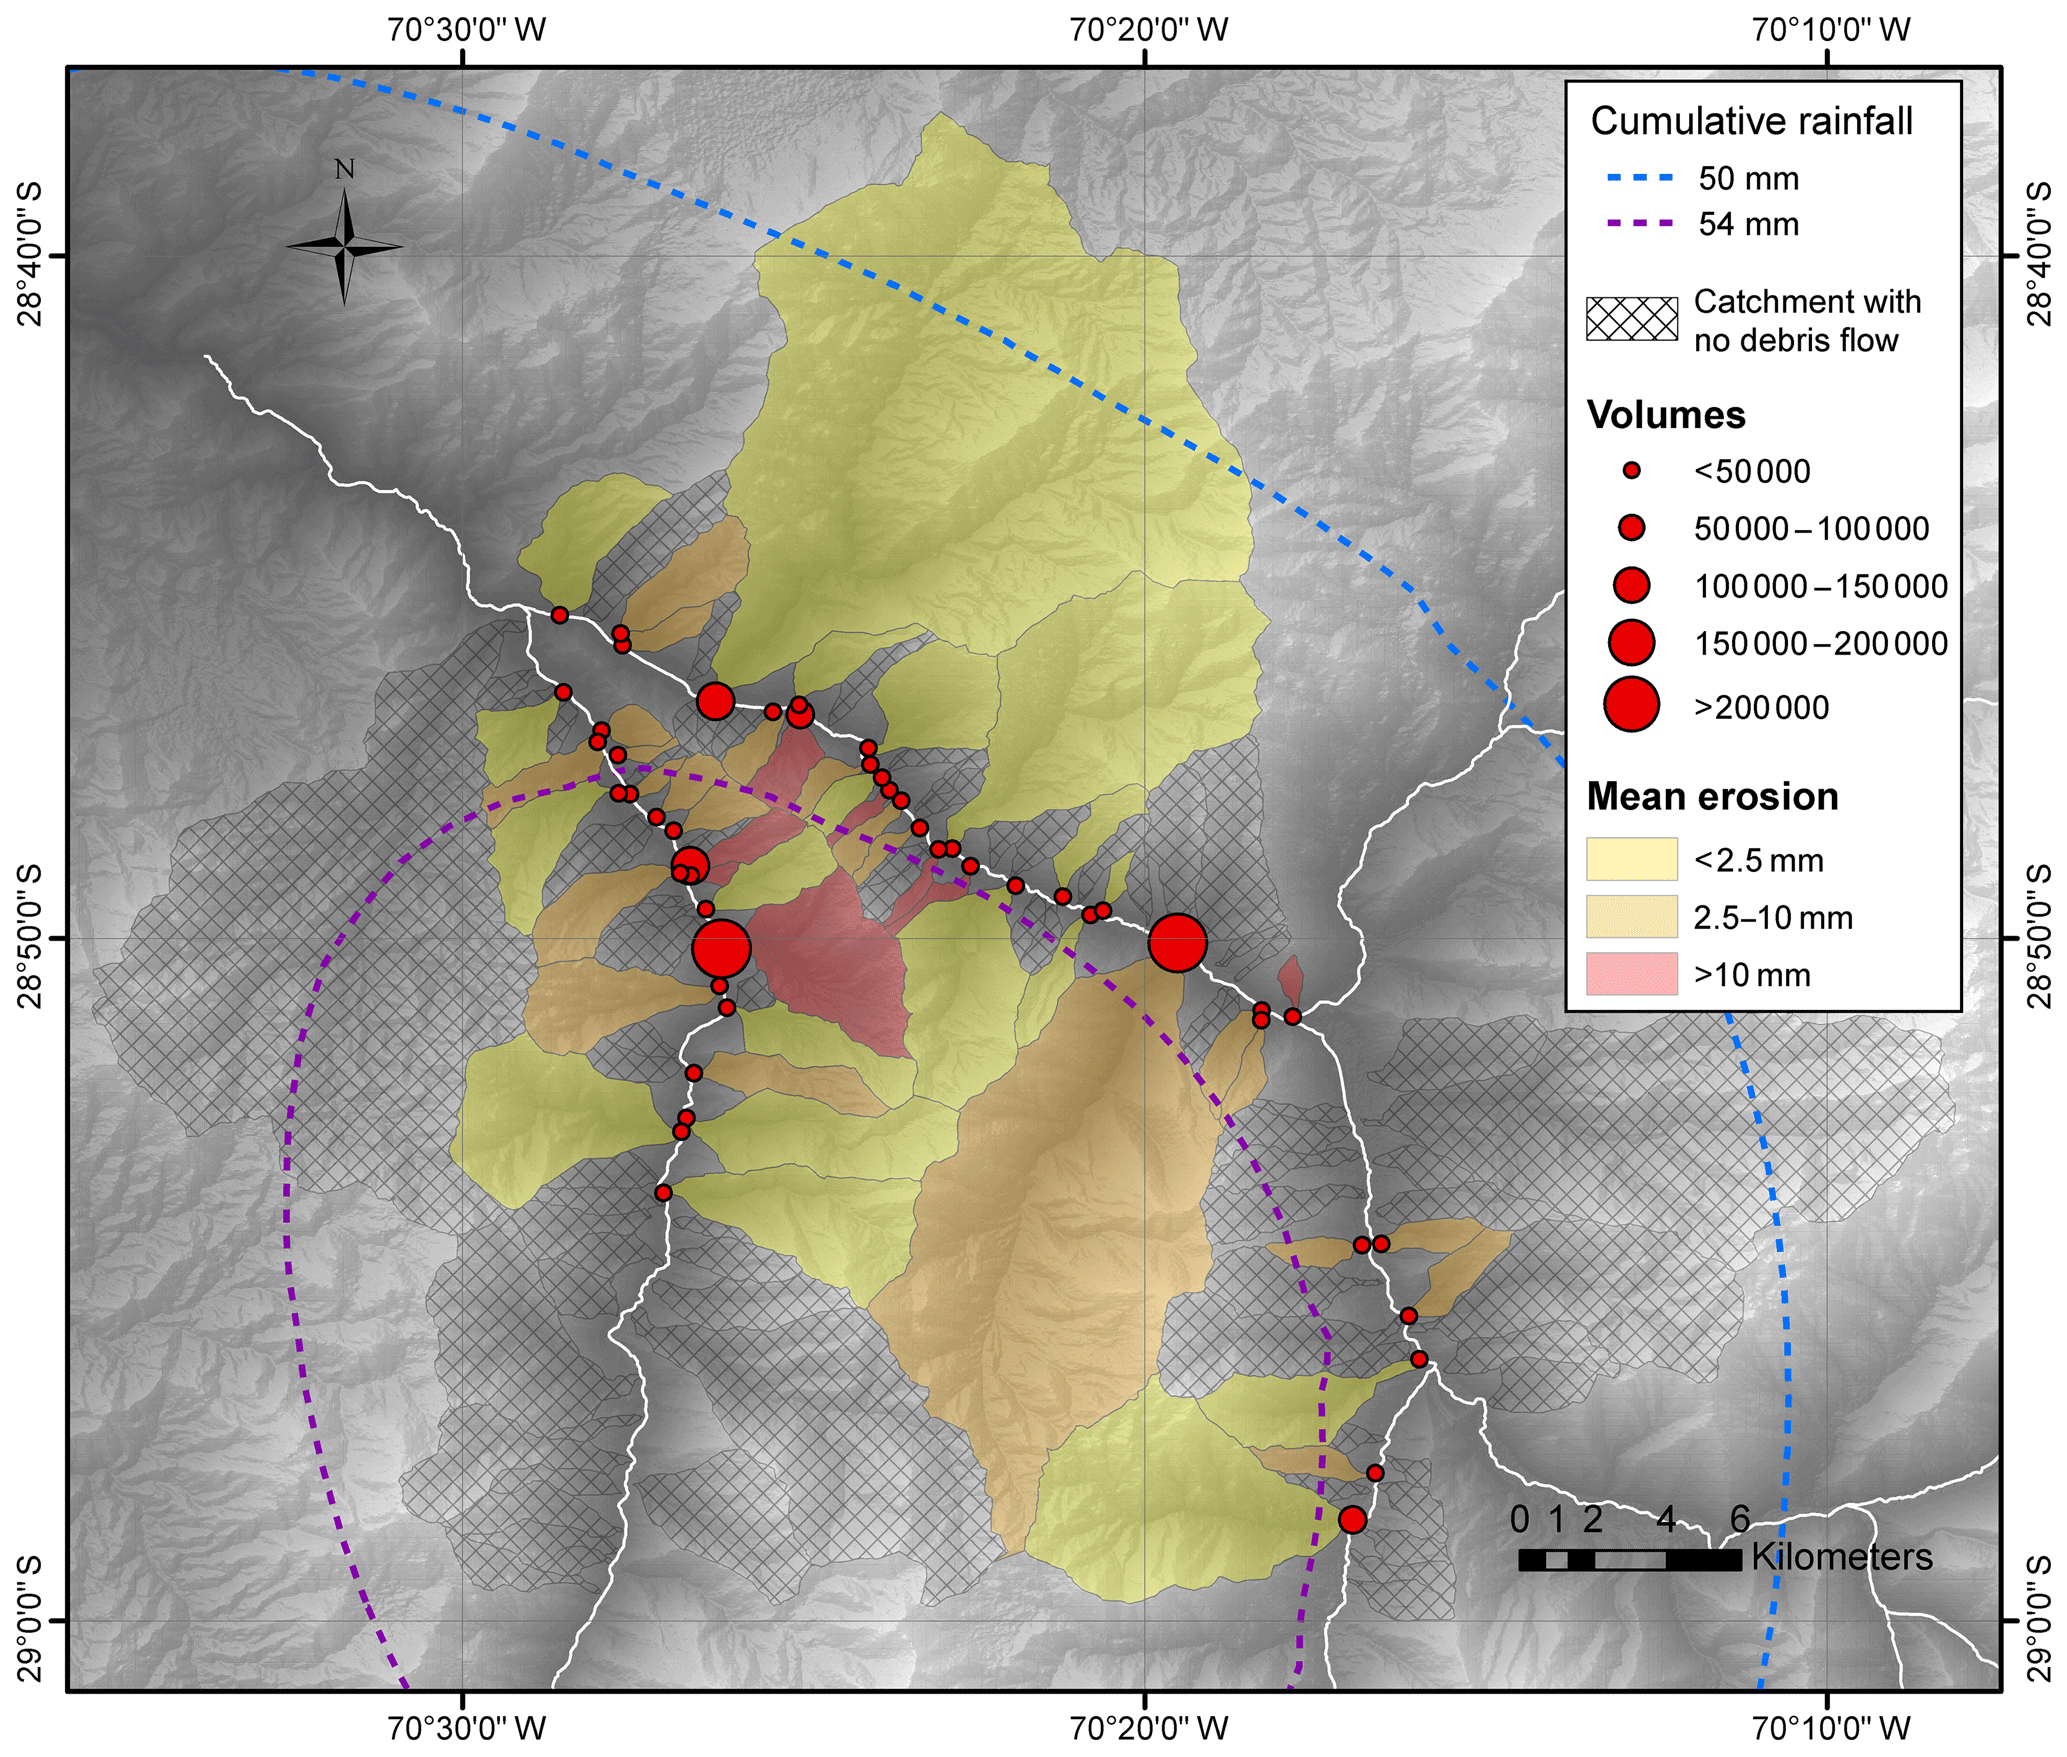
Figure 5Distribution and volumes of debris flow deposits during the March 2015 storm event in the Huasco River valley and identification of catchments where these flows were generated. Map shows the distribution of calculated mean erosion of tributary catchments and isohyets of accumulated rains by kriging interpolation of meteorological data during the storm. Topography extracted from a digital elevation model courtesy of NASA JPL Caltech with a nominal spatial pixel resolution of 30 m×30 m (https://asterweb.jpl.nasa.gov/gdem.asp, last access: 6 May 2020). The area of the map is the box with the dashed white outline in Fig. 1.
5.2 Catchment topographic attributes
Topographic attribute values for 124 tributary catchments and the statistical analysis are available in Table S2. Six topographic attributes (area, length, Strahler order, slope, Melton ratio and relief ratio) were proved to be significant in the generation of debris flow, with a level of significance below 0.05 in the ANOVA. Two groups resulted from the PCA, and each includes three topographic attributes. Group 1 integrates the size of the catchment and the hydrological hierarchy of the drainage network that includes area (A), length (L) and Strahler order (O). Group 2 integrates the catchment relief and includes average slope (S), gradient (G) and Melton ratio (M). From these two groups, two conditioning factors were calculated: size factor and relief factor. These factors correspond to a linear combination of the resulting PCA attributes, and the weight of each attribute is set by its weight. Therefore, two conditioning-factor values resulted from the addition of three normalized attribute values (Xn) weighted by the weighting factor calculated by the PCA.
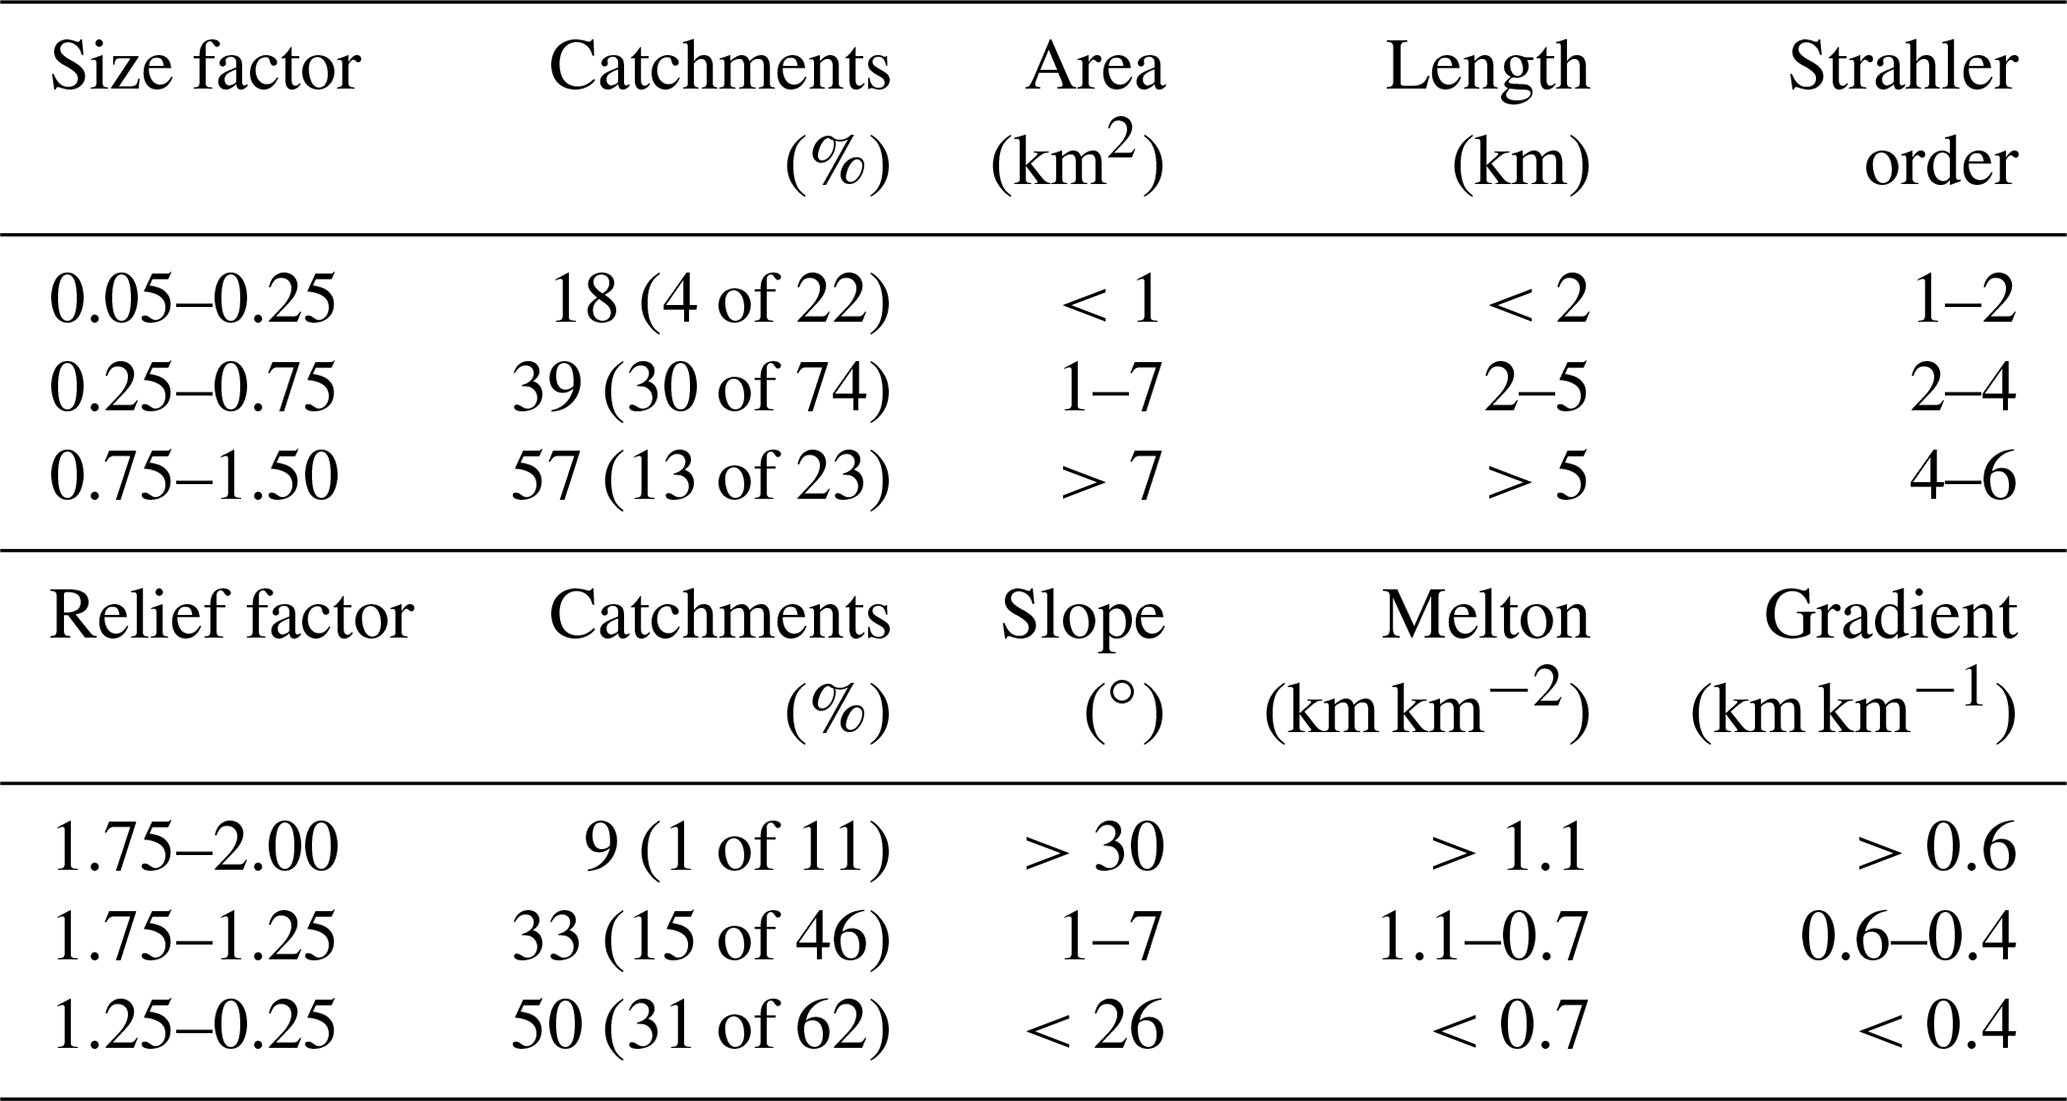
The size factor and relief factor show an inverse correlation for catchments that generated debris flows (49 catchments) and for catchments where clean-water flows were flushed downsystem in the tributary junctions (75 catchments without debris flow generation; Fig. 6a). The inverse correlation is also observed in the percentage of catchments with different factor ranges, because the percentage of catchments that generated debris flows in the tributary junctions increases with size factor, while it decreases with relief factor (Fig. 7a and b). In fact, debris flows were present only in 18 % of very small and low hierarchical catchments (low values of size factor, 0.05–0.25). In contrast, debris flows were present in 57 % of large and high hierarchical catchments (high values of size factor, 0.75–1.50). Debris flows occurred only in 9 % of the catchments with high mean slope values and high topographic gradient (high relief factor, 1.75–2.00) while in 50 % of the catchments with low slope values and low topographic gradients, debris flow occurred (low relief factor, 0.25–1.25). These results suggest that debris flows were generated in the tributary junctions from larger and more hierarchical catchments with low topographic gradients and lower mean slopes, whereas they were sparsely generated from smaller and steeper catchments (Table 2).
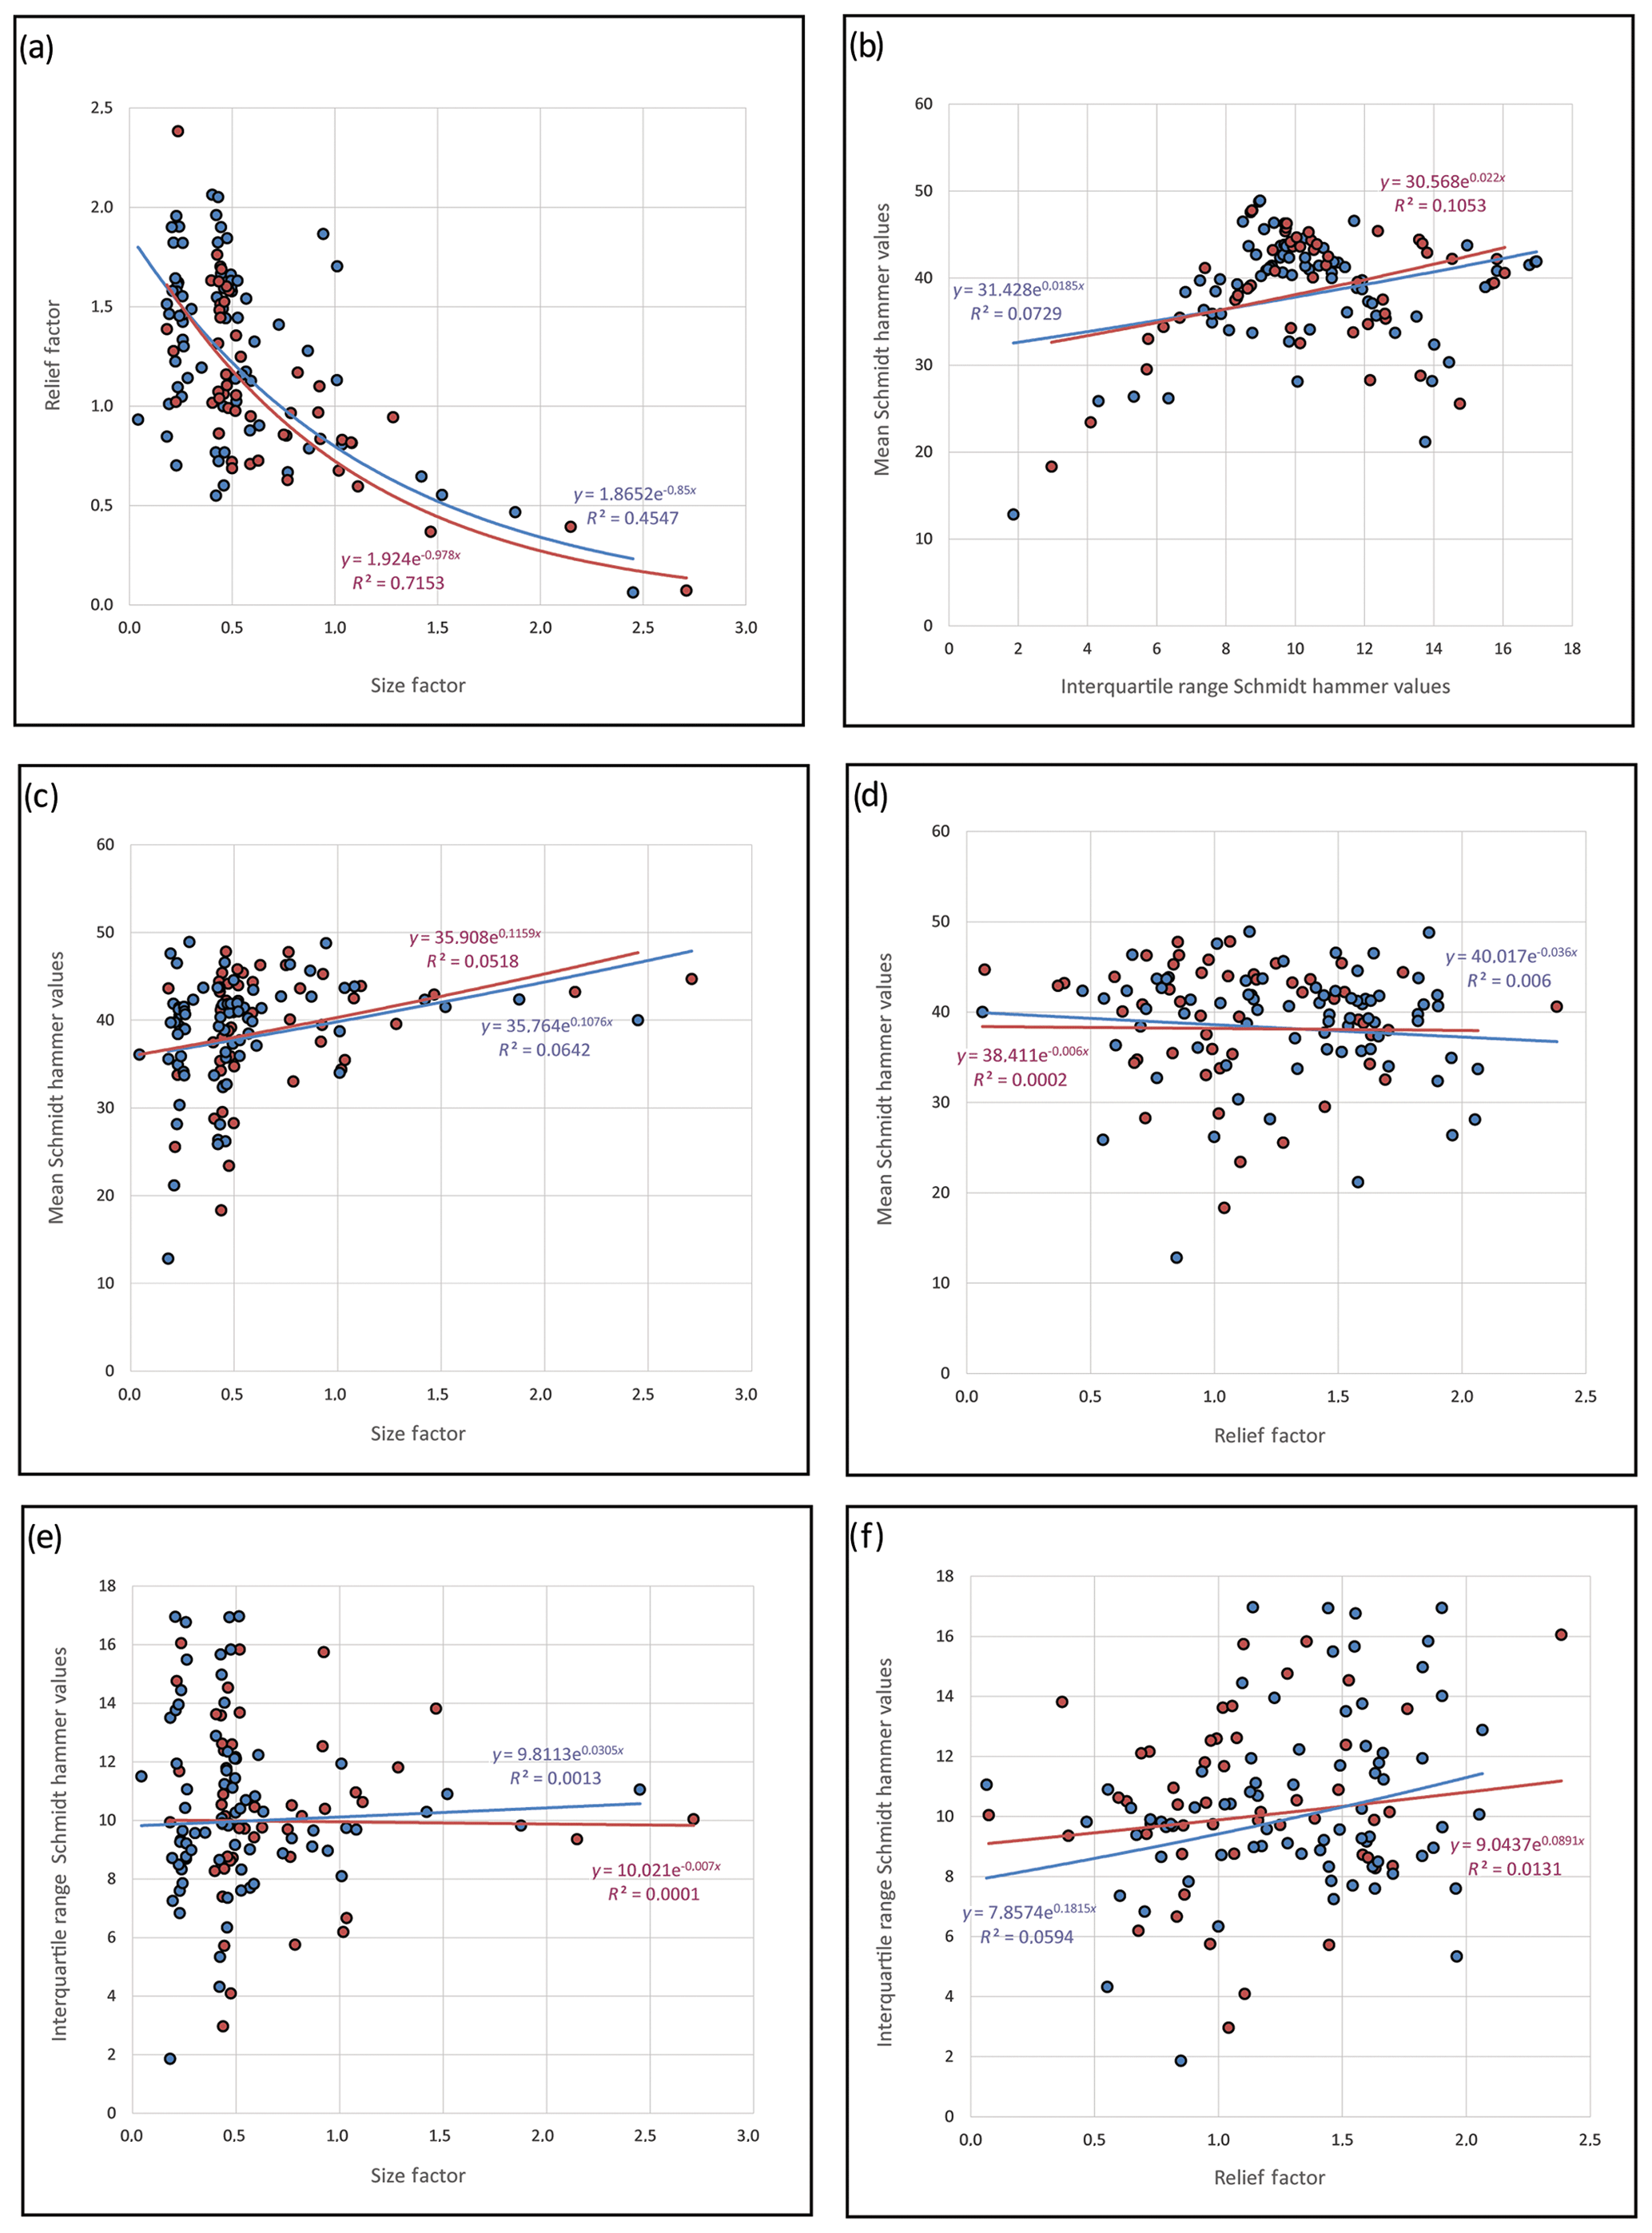
Figure 6Graphics show relationship between different studied factors in catchments with debris flow generation in red and nongeneration in blue. (a) Relationship between size factor and relief factor. (b) Relationship between mean and interquartile range of Schmidt hammer values. (c) Relationship between mean Schmidt hammer values and size factor. (d) Relationship between mean Schmidt hammer values and relief factor. (e) Relationship between interquartile range of Schmidt hammer values and size factor. (f) Relationship between interquartile range of Schmidt hammer values and relief factor.
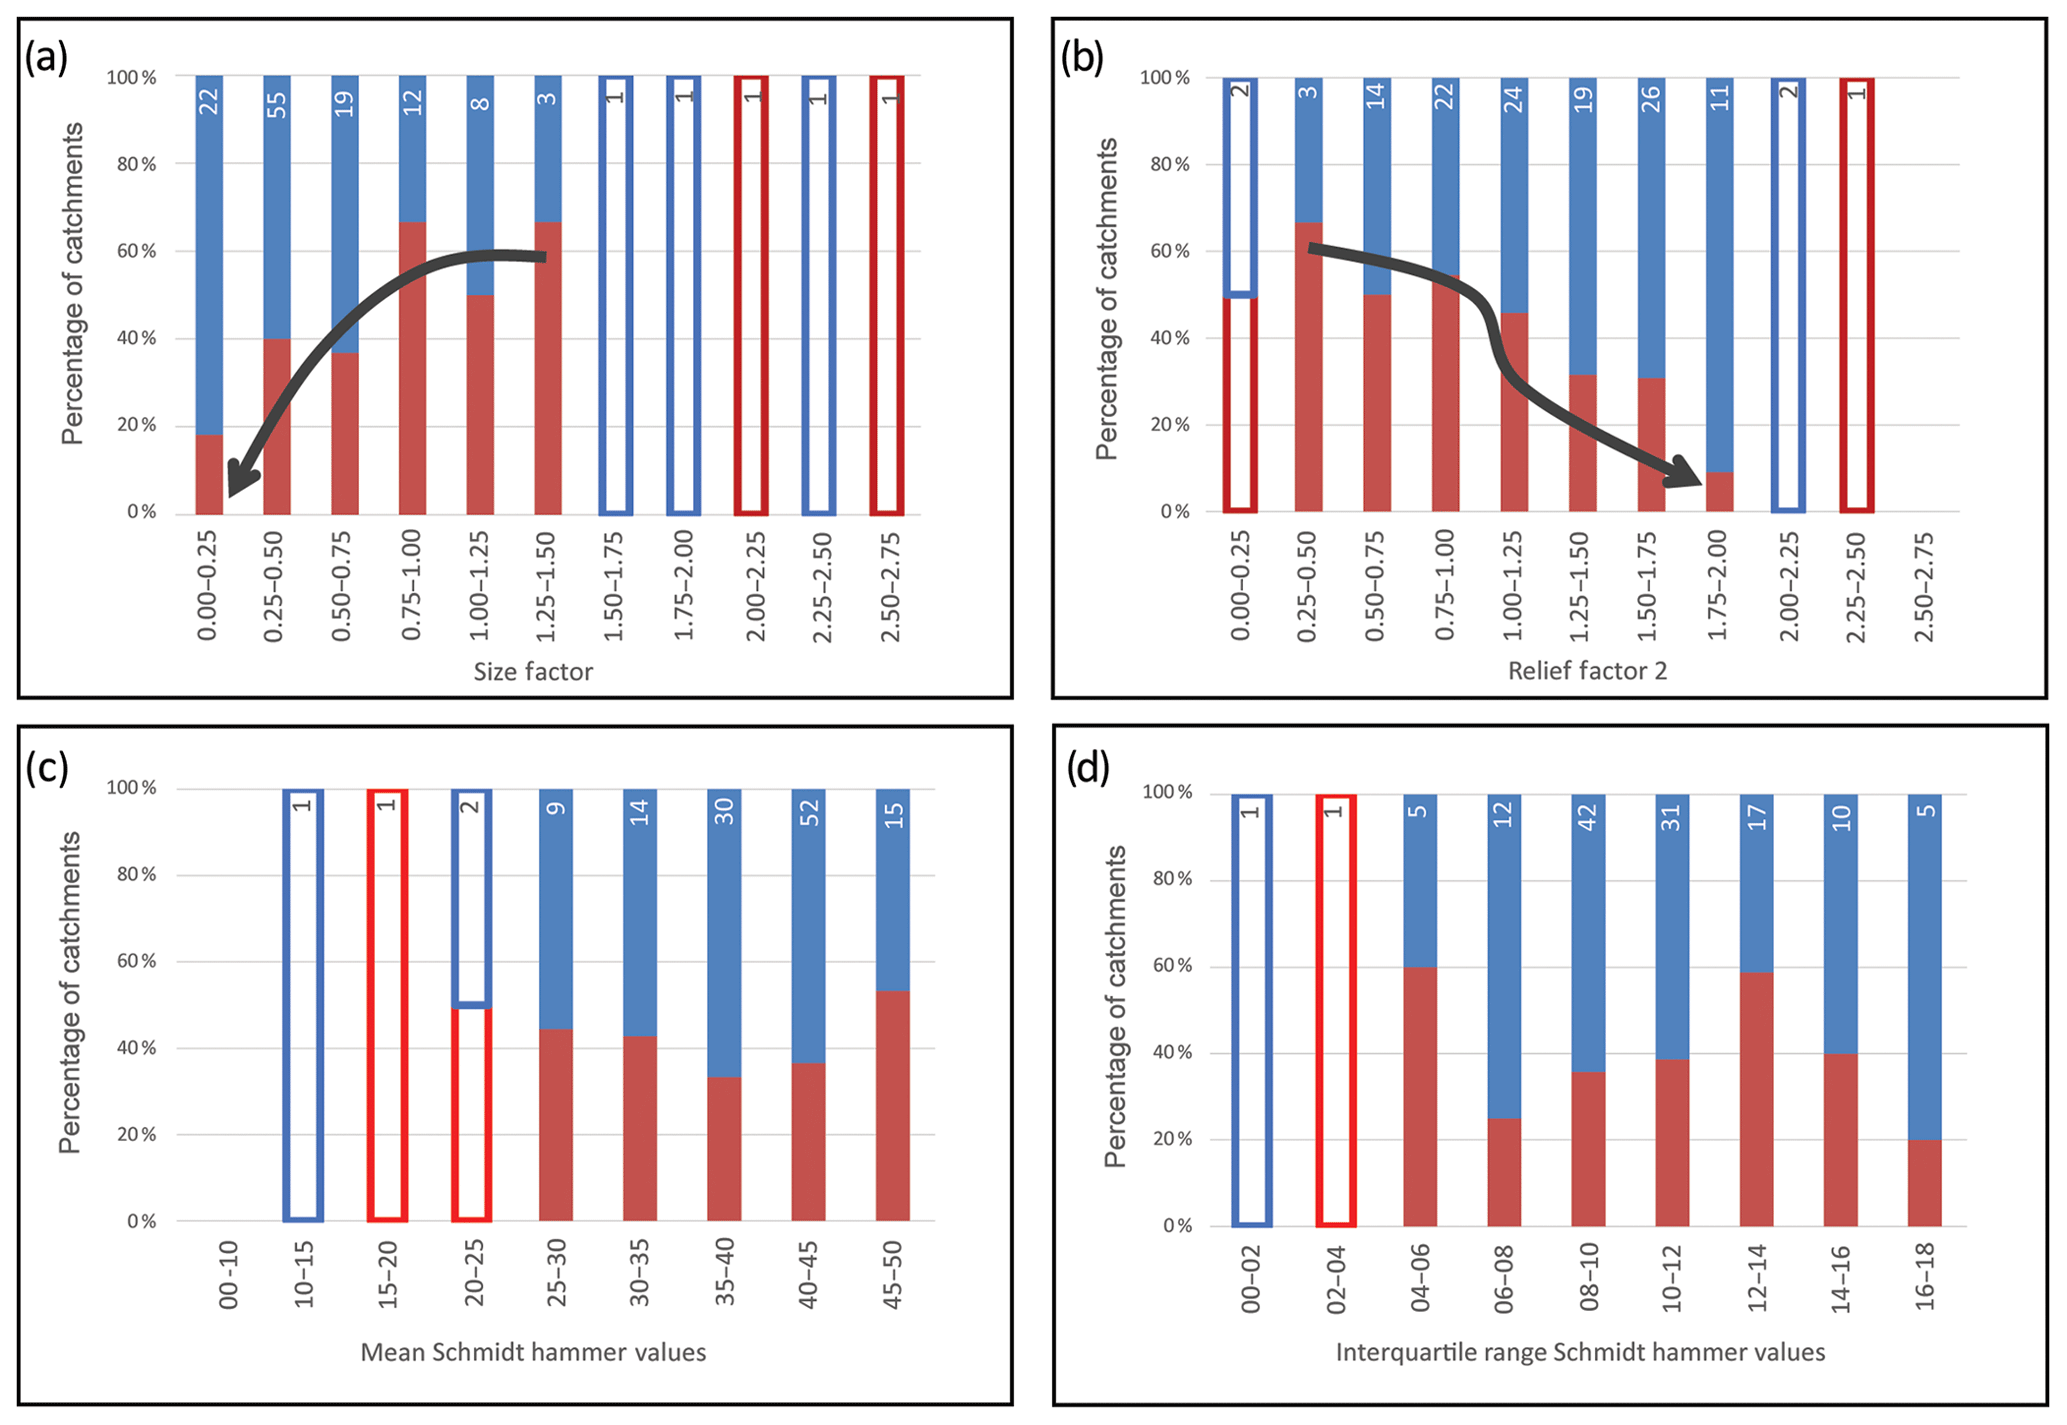
Figure 7Histograms with the relative percentage of catchments with debris flow generation in red and nongeneration in blue considering range of values for (a) size factor, (b) relief factor, (c) normalized mean Schmidt hammer values and (d) normalized interquartile range Schmidt hammer values. Each bar includes a number indicating the quantity of analyzed catchments. Open bars indicate ranges without enough data to justify a statistical analysis (fewer than 5 catchments for range). Arrows indicate a trend in the histograms.
Table 2Table that summarizes the percentages of catchments prone to generate debris flows and presents thresholds of topographic attributes that contribute within each factor.
The six topographic attributes (area, length, Strahler order, average slope, gradient and Melton ratio) considered in the two conditioning factors are reclassified to 0, 1 and 2 according to the percentage of catchments favorable to the generation of debris flow. Finally, the weighting factor calculated by the PCA resulted in a normalized catchment clustering. This catchment clustering is added to a geographic information system and results in a susceptibility map (Fig. 8).
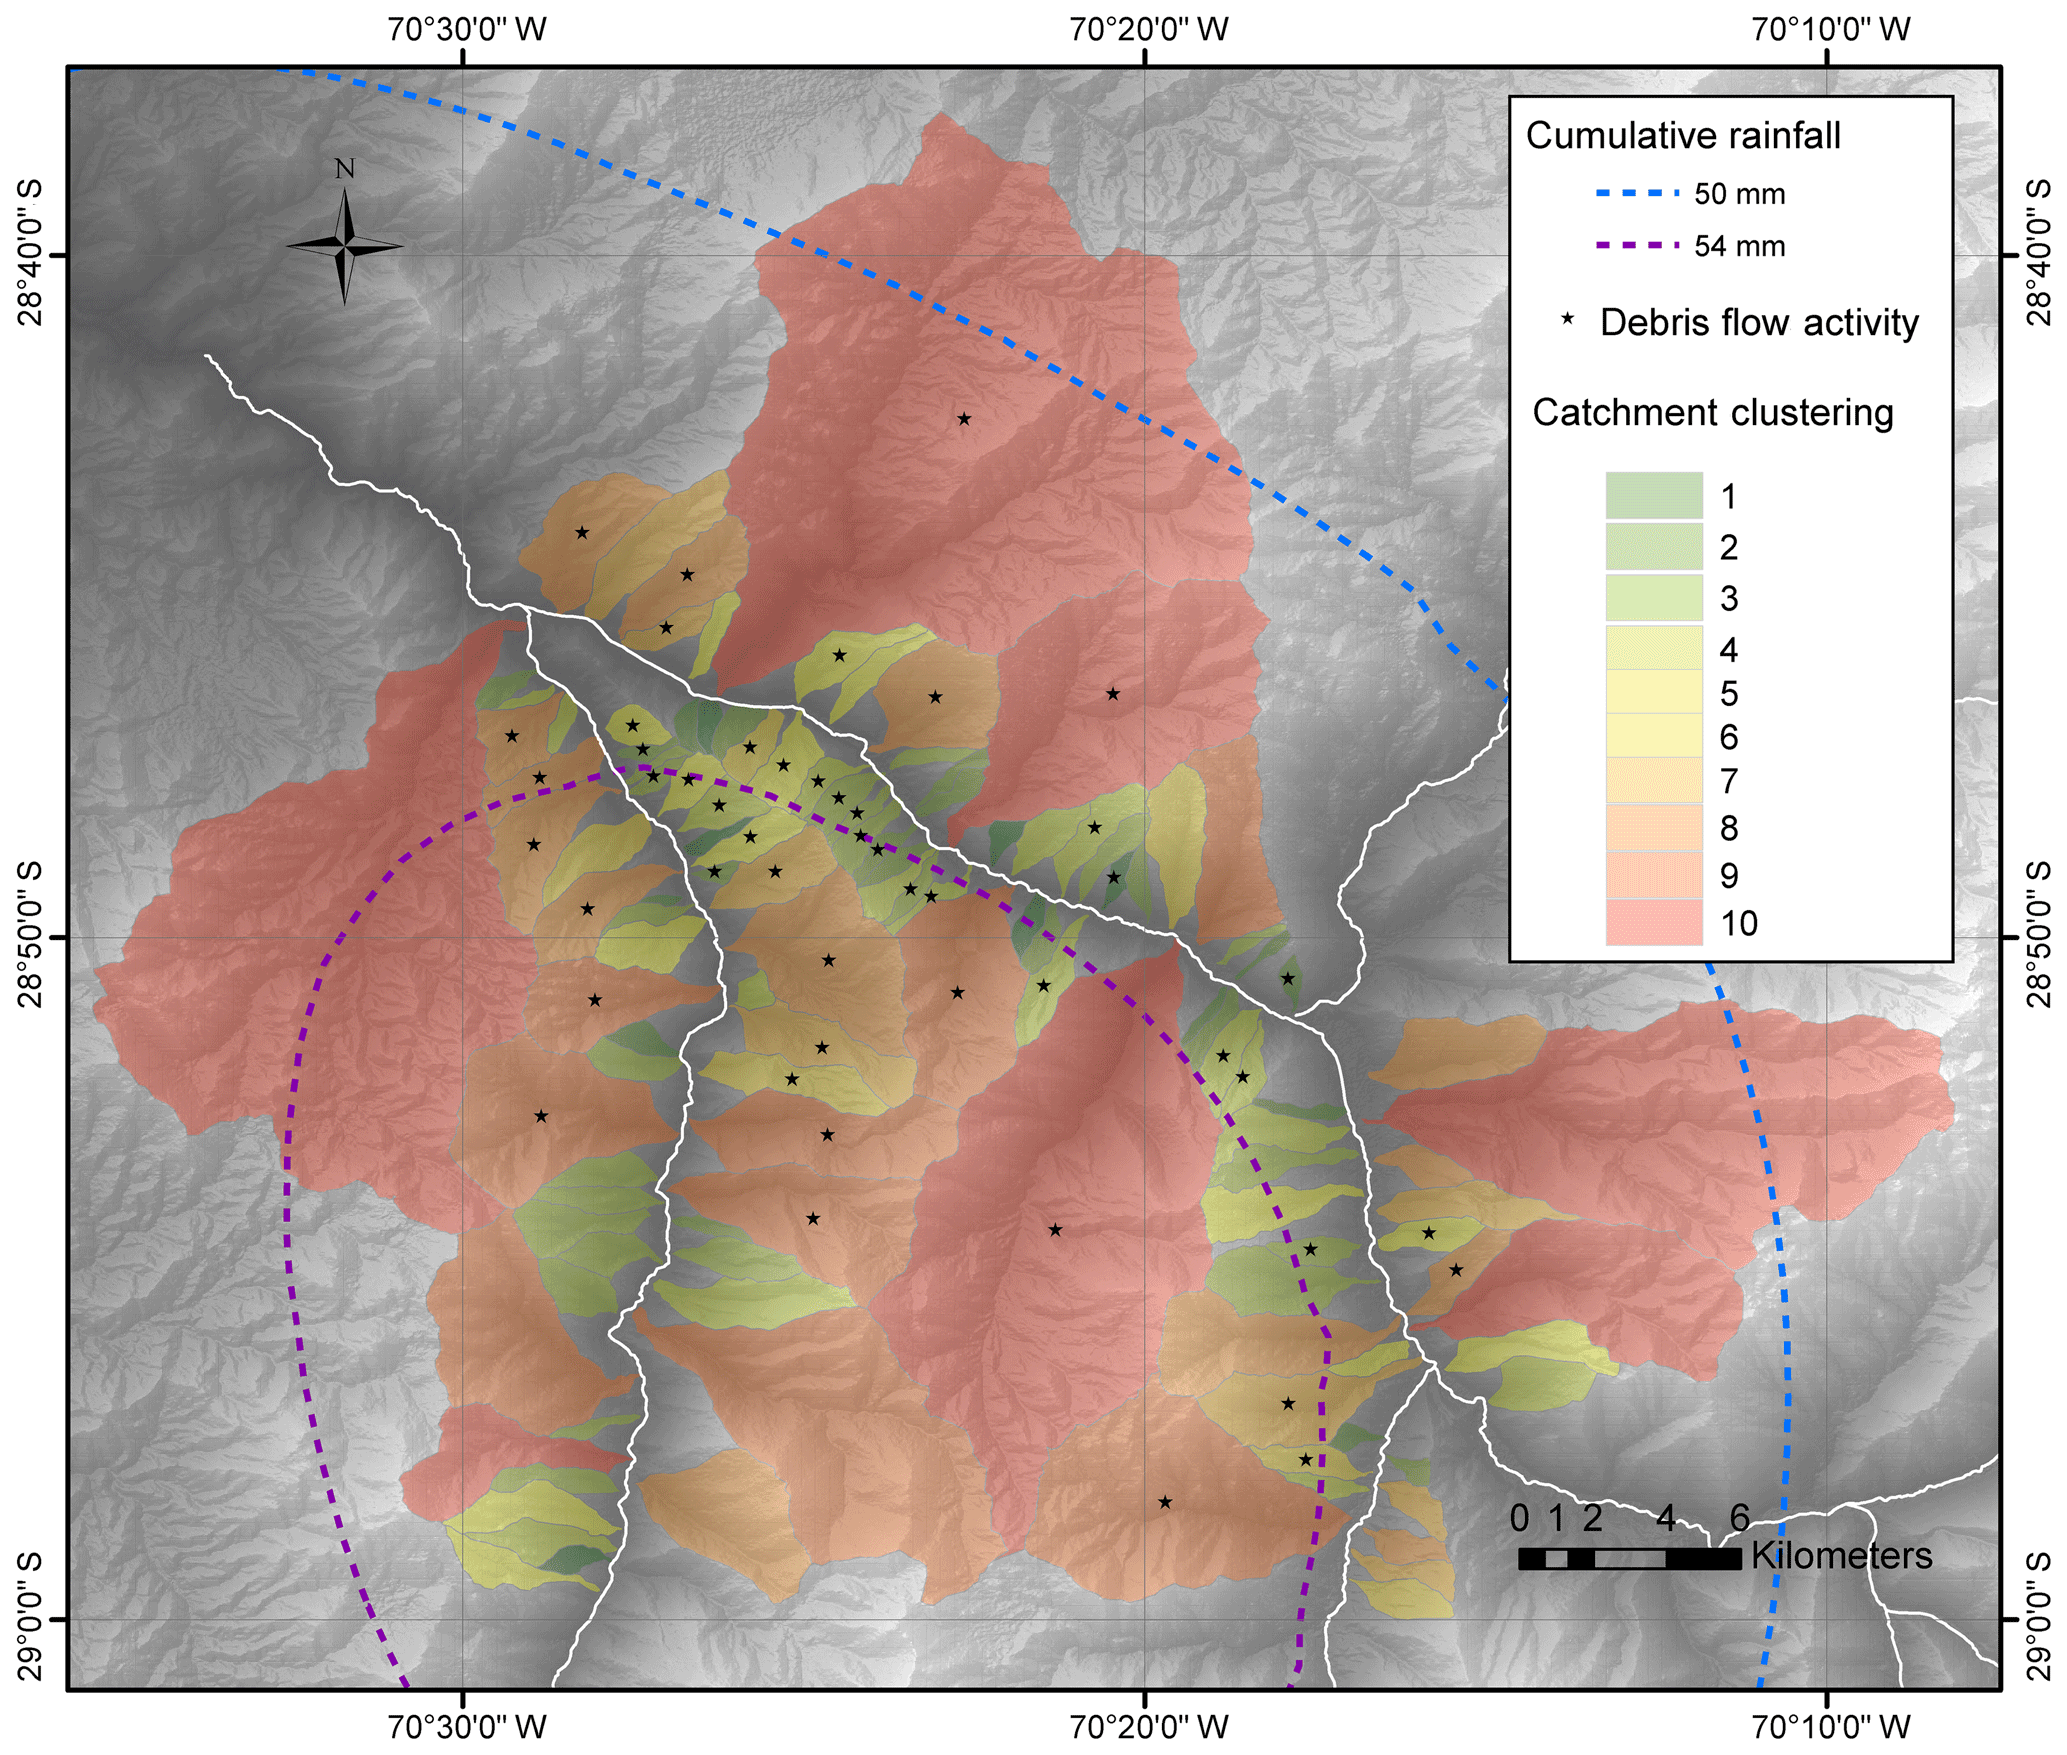
Figure 8Map of the normalized classification of catchment clustering considering the six topographic attributes (area, length, Strahler order, slope, Melton ratio and relief ratio) involved in conditioning factors of debris flow generation. Topography extracted from a digital elevation model courtesy of NASA JPL Caltech with a nominal spatial pixel resolution of 30 m×30 m (https://asterweb.jpl.nasa.gov/gdem.asp, last access: 6 May 2020).
The size factor and relief factor also show a correlation with the volumes of debris flow deposits (Fig. 9a and b). Sediment volumes of less than 6000 m3 were supplied from small, low-hierarchical catchments (low values of size factor, less than 0.25), whereas from large, high-hierarchical catchments (high values of size factor, greater than 0.75) volumes were higher than 6000 m3. On the other hand, sediment supply was lower in catchments with high mean slope values and high topographic gradients (high relief factor, greater than 1.75) instead of catchments with low slope values and low topographic gradients (low relief factor, less than 1.25). Therefore, topographic attributes involved in both conditioning factors are also significant for debris flow deposit volumes.
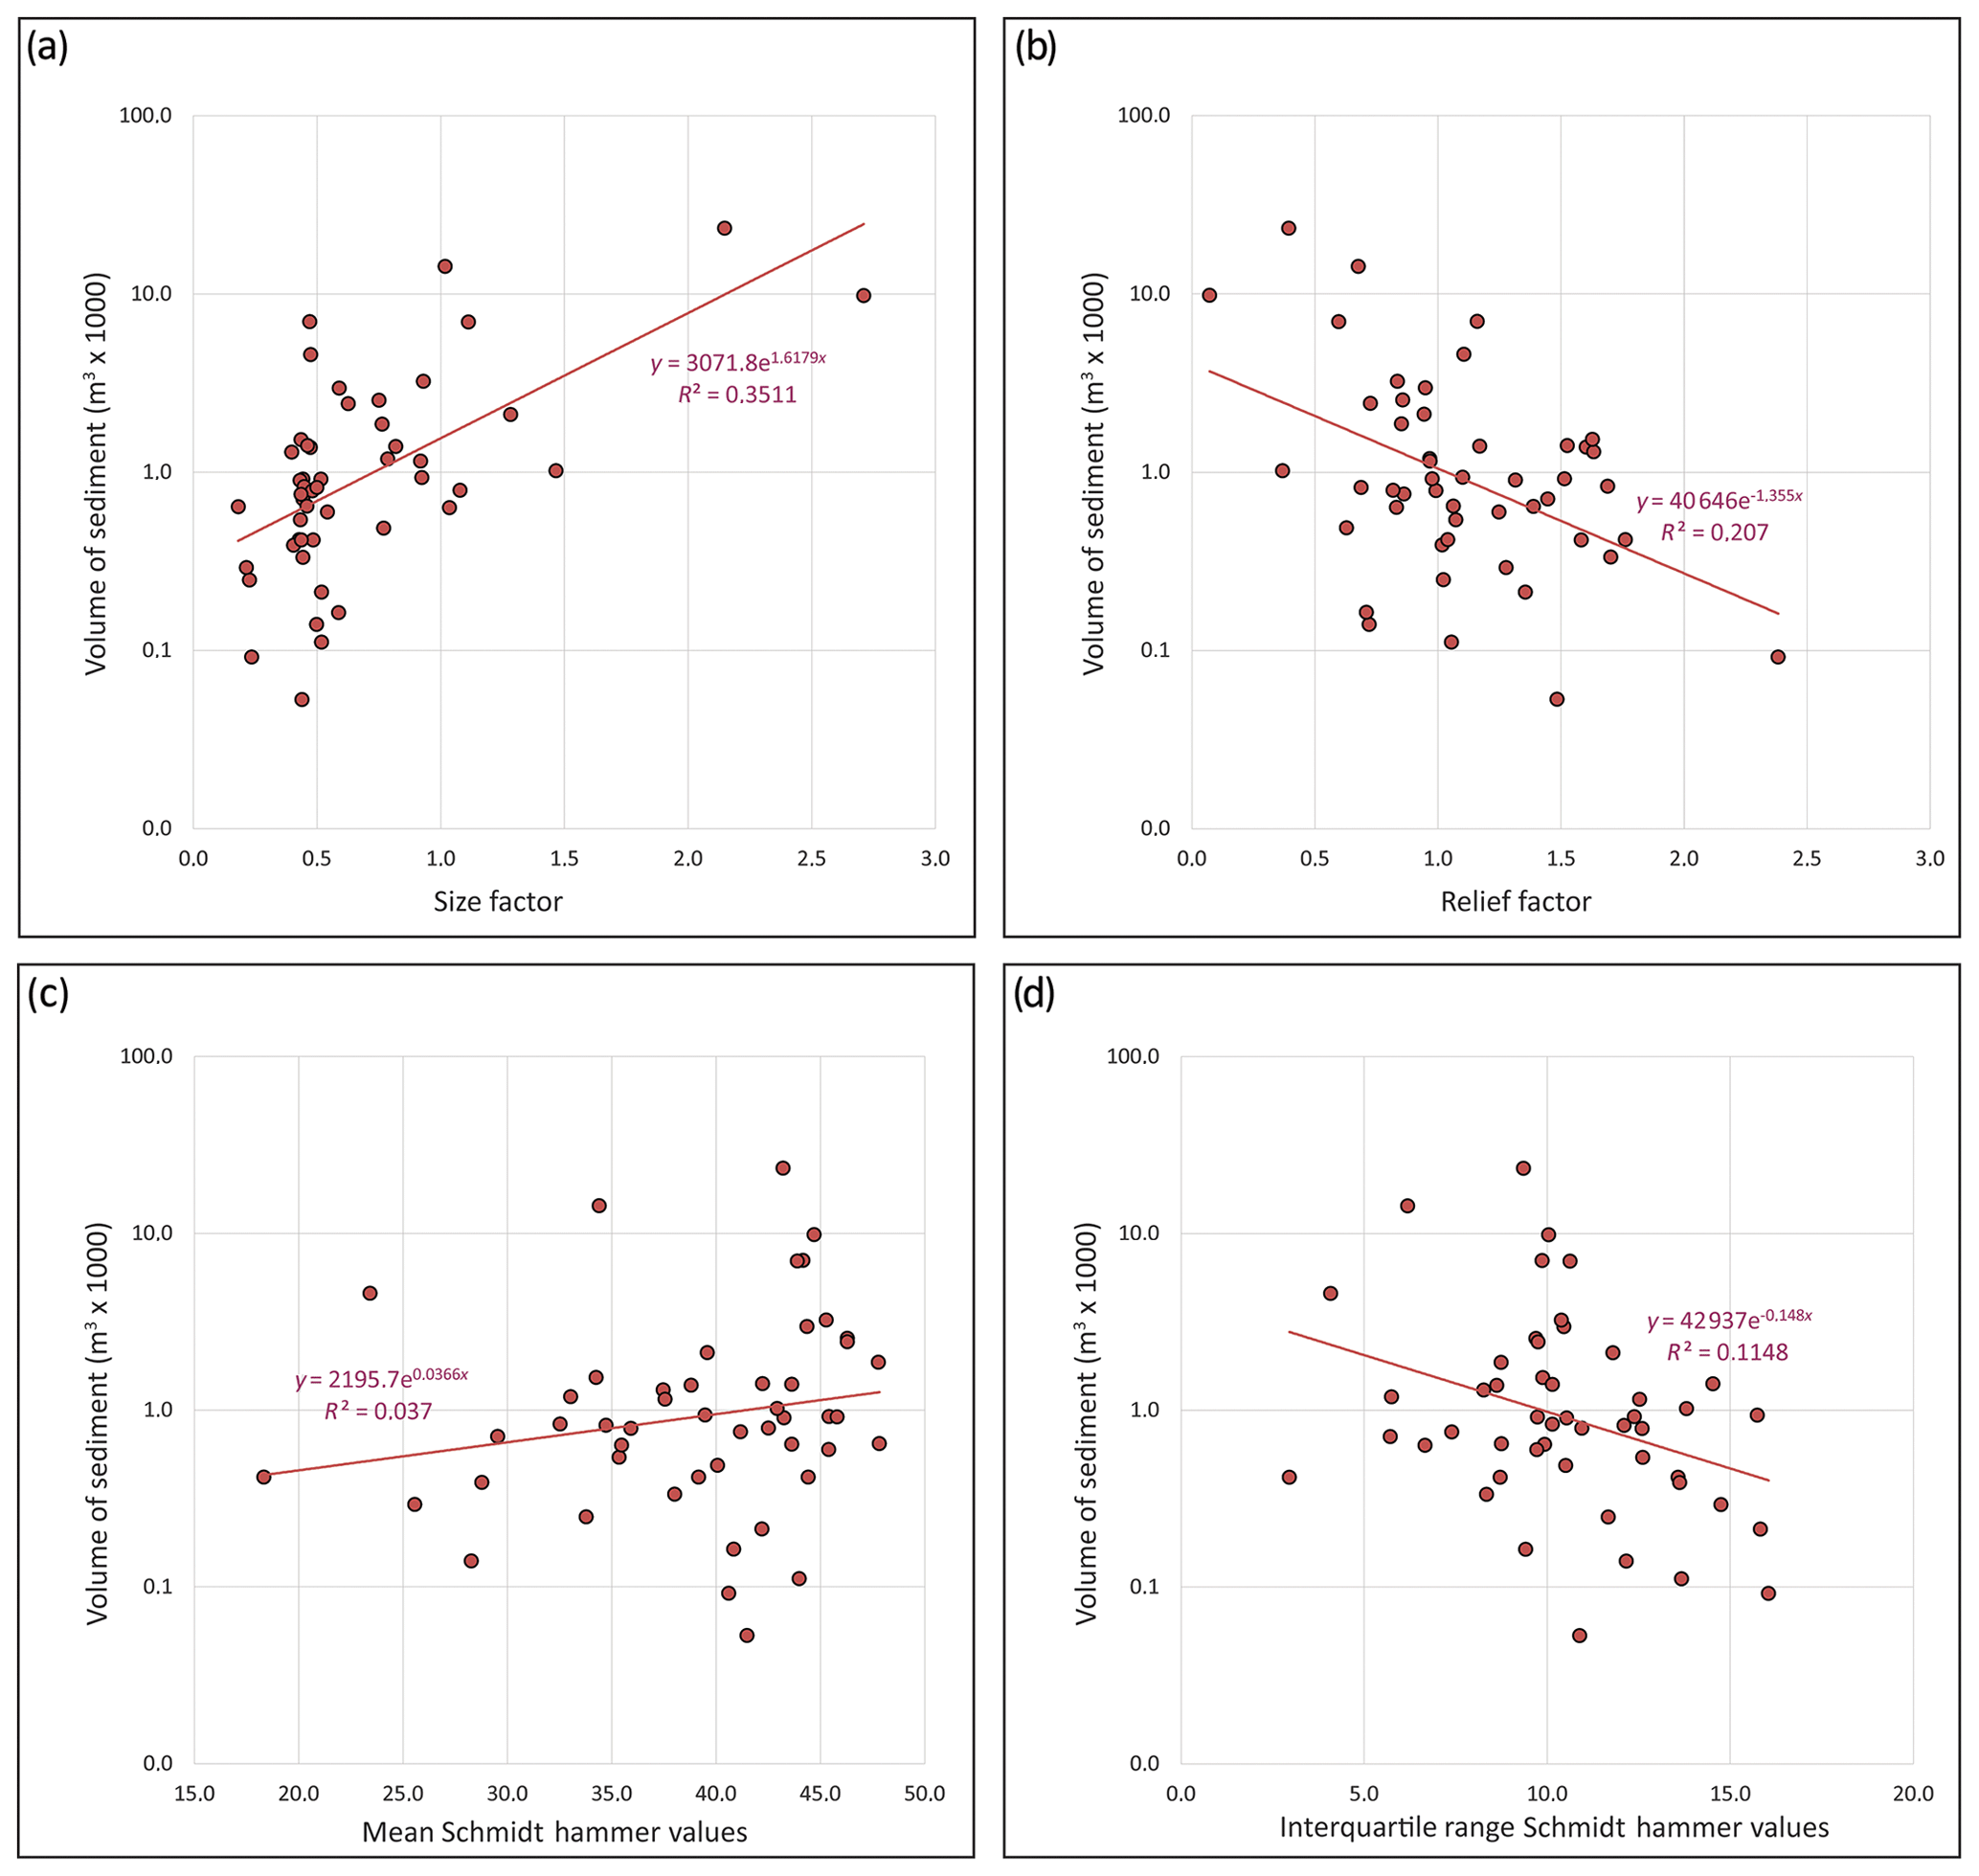
Figure 9Graphics showing the relationship between different studied factors in catchments with sediment volumes of debris flow deposits. (a) Relationship between size factor and sediment volumes. (b) Relationship between relief factor and sediment volumes. (c) Relationship between mean Schmidt hammer values and sediment volumes. (d) Relationship between interquartile range Schmidt hammer values and sediment volumes.
5.3 Catchment lithological attributes
One hundred and sixty Schmidt hammer (SH) rebound values were measured in Geo1, 240 in Geo2, 280 in Geo3 and 160 in Geo4. Data outside the standard deviation at each station were excluded to eliminate data that could be affected by operator handling errors. Box-and-whisker plots show the distribution values for each geological group (Fig. 10). The values of the 50th percentile (Q2) and the interquartile range (IQR = Q3−Q1) represent the dispersion of values between the 75th and 25th percentiles.
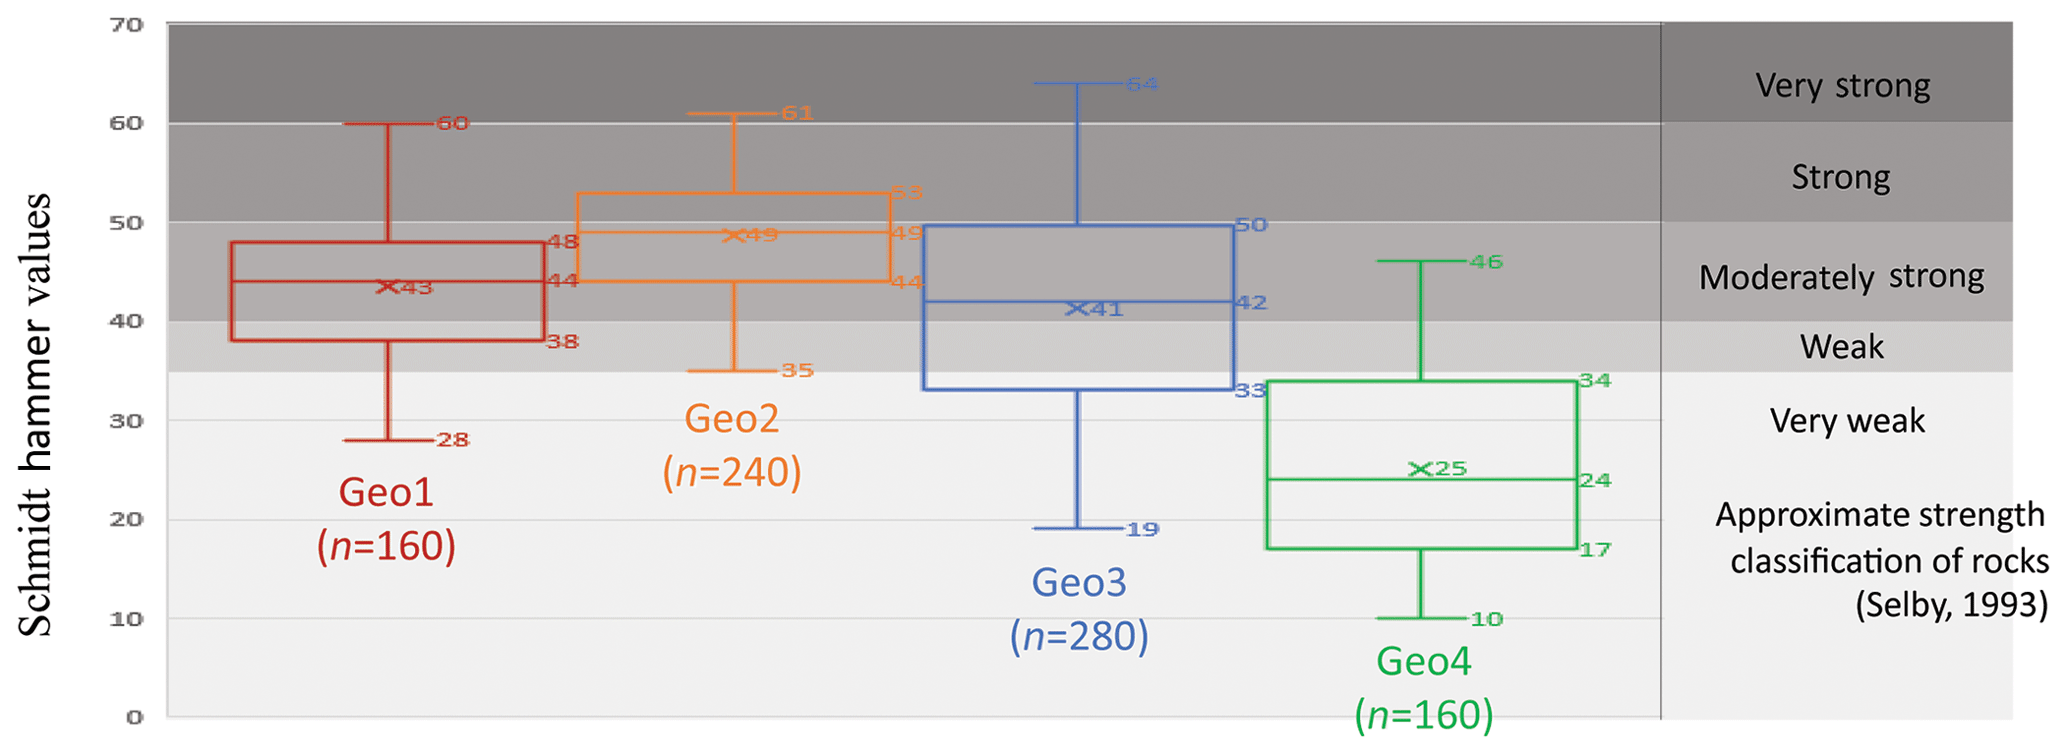
Figure 10Box-and-whisker plots of Schmidt hammer values for geological groups of the studied zone where n represent the number of measurements. Graphic shows maximum, minimum and mean values for each geological group and also the values of the 75th, 50th and 25th percentiles for each group. Graphic shows the approximate strength classification of rocks by Schmidt hammer values after Selby (1993).
We used the normalized values of the mean Schmidt hammer (MeanSHn) and the interquartile range of Schmidt hammer (IQRSHn) to evaluate the strength of the unaltered rocks and the degree of weathering of the rocks within the catchments. The data used are available in Table S2. MeanSHn and IQRSHn resulted from the addition of SH mean and SH IQR values for each geological group weighted by their percentage of area for each catchment (GeoX).
MeanSHn and IQRSHn show a weak correlation in both catchment types (49 catchments that generated debris flows and 75 that did not; Fig. 6b). Furthermore, no correlation emerged between MeanSHn–IQRSHn and size–relief factors (Fig. 6c–f). The percentage of catchments that generate debris flows does not vary significantly in relation to the range of MeanSHn and IQRSHn (Fig. 7c and d). The latter suggests that unaltered rock strength represented by MeanSHn and the degree of weathering or the degree of fracture of the rocks represented by the IQRSHn of geological units are not significant in the generation of debris flows for the catchments impacted by the March 2015 storm event. Moreover, MeanSHn and IQRSHn do not show a clear correlation with the volumes of debris flow deposits (Fig. 9c and d).
6.1 Conditioning factors for the generation of debris flows
The results show a selective generation of debris flows from the tributary catchments within the Huasco valley during the March 2015 storm under similar amounts of rain. According to the results, the selective activation of the tributary catchments could have been related to the topographic attributes that controlled the entrainment of sediments from the drainage network towards the alluvial fans during the March 2015 storm. On the contrary, the lithological attributes of the tributary catchments do not show any correlation with selective activations. The selective activation of catchments has also been reported for the Elqui River valley situated 130 km south of the study area (Vergara Dal Pont et al., 2018). Vergara Dal Pont et al. (2018) also highlight that the intensity of the 1 h peak storm precipitation had a low significance in the distribution of debris flow generation during the storms. The results of the logistic regression model in the Elqui River valley (Vergara Dal Pont et al., 2018) support that the prediction of high-discharge events does not depend on the accumulated rainfall. These selective activations have been previously reported in other Andean catchments (Colombo, 2010; Lauro et al., 2017), which is explained by different coupling statuses between tributary catchments and trunk valleys (Fryirs et al., 2007; Mather and Stokes, 2017).
Previous studies in geomorphology had shown that the measurement of rock strength can be used to indirectly determine weathering rates and to predict volumes and grain-size supply within the catchments (Roda-Boluda et al., 2018, and references therein). Both approaches assist in evaluating the rate of debris production on the hillslopes and debris distributions in the catchments (Bovis and Jakob, 1999). However, the measurement of rock strength in the Huasco River valley does not show any correlation with the selective generation of debris flows in the tributary catchments during the March 2015 storm. We propose, based on the field observations and on the statistical results, that the low significance of lithological attributes in the debris flow activation is due to the fact that debris supply from hillslopes is not a significant source of sediments during storms. Field observations in this study, and also reported by Cabré et al. (2020), show that the main source of debris flows during the March 2015 storm is sediments stored in the drainage networks. The large volume of sediments in drainage networks is enhanced by the low frequency of extreme storm events that usually impact the area (one event per ∼40–200 years; Ortega et al., 2019, and references therein), facilitating the storage of sediments in interstorm periods and thus preparing these channels to yield sediment downsystem in any extreme storm event that impacts the area. This geomorphological “behavior” is described in the literature as transport-limited catchments (Bovis and Jakob, 1999), which are characteristic of arid landscapes and occur independently of the local lithological variability.
In the Huasco River valley, landslides during the March 2015 storm were rare on the debris-mantled hillslopes (Cabré et al., 2020). Recent studies to assess debris flow generation show that shallow debris-mantled failures on the hillslopes are not required to trigger debris flows in arid catchments during intense and low-frequency storm events (Vergara Dal Pont et al., 2018). Hillslope stability is favored by the transport-limited conditions characteristic of arid catchments. In addition, the transport-limited condition favors the storage of sediment in the alluvial channels, where sediment entrainment towards tributary junction alluvial fans due to runoff can occur in any storm that affects the area (Coe et al., 2008; Kean et al., 2013). The latter is in agreement with our field evidence that considers the available debris in the alluvial channels as the main entrainment source areas of sediment that were able to generate debris flows during the March 2015 storm event in the Huasco River valley. In that direction, similar interpretations were deduced based on field observations in catchments situated ∼300 km north of the study area, where flash floods were reported as the main erosion agents in the alluvial channels while hillslopes remained surprisingly stable during the March 2015 storm event (Wilcox et al., 2016).
Extensive gully formation caused by runoff on the hillslopes in the study area was reported during the March 2015 storm. These observations are consistent with previous reports that have quantified the gullies' contribution as 50 % to 80 % of the overall sediment yield induced by rainfall in arid zones (Poesen et al., 2003) and shown that the landslides on hillslopes make little contribution. In fact, landslides on hillslopes are related to the largest rainfall events worldwide (e.g., Coppus and Imeson, 2002; Berti et al., 2012) in monsoon-impacted zones (e.g., Marc et al., 2018) and rainfalls of southern Chile that exceed the accumulated rainfall during the March 2015 event in the Atacama Desert by 10 times (Jordan et al., 2019). Debris flows, hyperconcentrated flows and mud flows during intense rains in central and southern Chile are generally linked to an increase in the pore pressure of the surficial loose debris layer that results in shallow landslides on the hillslopes (e.g., Sepúlveda and Padilla, 2008). However, in view of the result presented in this work, stream networks would be the main source of sediment during a storm in the arid Andes of northern Chile. These stream networks, including gullies, are previously filled prior to the storm with sediment entrainment from the gravitational landslides and rockslides of hillslopes during the interstorm period. This mechanism is efficient only when the topographic conditions of the drainage networks allow it.
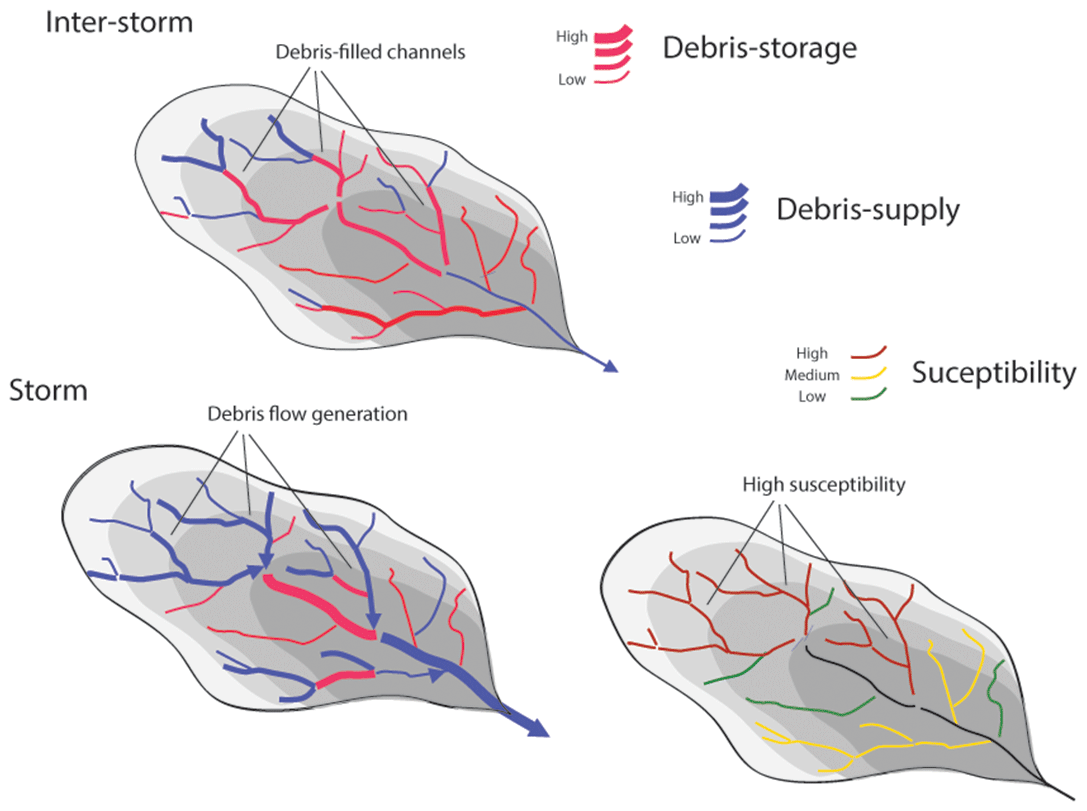
Figure 11Conceptual model of the relation between hydraulic capacity during the intense long-lived rainfalls of an extraordinary storm and debris storage over a previous time span that explains different levels of debris flow susceptibility depending on catchment topography.
We have shown that topographic attributes play an important role in the generation of debris flow and distribution of debris flows during extreme storm events. Consequently, the largest tributary catchments, with highly developed drainage networks and relatively low mean slopes, were activated during the March 2015 event. Large volumes of sediment stored in drainage networks resulted in various debris flows during the storm that yielded large volumes of sediment to the outlets (Fig. 11). In contrast, small, steep catchments, with low-developed drainage networks, store lower sediment volumes in the channels and, therefore, during extreme storms, generate flows with lower sediment-to-water concentrations. The high altitude of the zero isotherm during the March 2015 storm explains the abundant generation of debris flow in the studied area. A larger area with effective water capture results in extensive runoff impact in large tributary catchments where it generally snows at the head of catchments.
6.2 The role of individual extreme storm events in erosion rates in the southernmost part of the Atacama Desert
In this work, a mean erosion of 1.3 mm is calculated for the entire study area in the Huasco River valley during the March 2015 storm based on the volumes of the debris flow deposits in the alluvial fans. The volumes calculated from the debris flow deposits in the alluvial fans have an uncertainty of −34 % and +46 %, and these volumes are the minimum values of erosion in the catchments due to the loss of sediment due to the river toe-cutting of alluvial fans. Therefore, volumes of approximately ∼106 m3 and mean erosion of 1.3 mm during the March 2015 storm in the Huasco River valley should be considered with caution, and rather their order of magnitude should be considered. Limitations to studying erosion associated with an individual storm event include the lack of pre-event high-resolution topography (e.g., available high-resolution digital elevation models; DEMs). The lack of detailed topographic surveys before the storm makes it difficult to quantify the volume balance of the DEMs of difference (DoDs) to represent the geomorphic change caused by gullies and rills on the hillslopes and erosion in the alluvial channels (e.g., Cavalli et al., 2017). The sediment eroded and transported downsystem through the main rivers might be recognized in the concentrations of suspended sediment measured at river gauges. However, these records also underestimate the maximum discharge associated with the storm because the gauging stations are commonly damaged by flash floods.
The contribution of an individual extreme storm event to long-term erosion rates should only be considered for data spanning large areas because focused assessments may not be representative. In this work, the study area impacted by the storm of March 2015 is 1500 km2. A return of 116 years can be proposed for storms like that of March 2015 as an average for the southern Atacama Desert during the last 5500 years based on Ortega et al. (2019). The proposed return time for the southern Atacama Desert is similar to the 100 years return time estimated by Houston (2006) on the Salado River, a tributary of the Loa Valley in the Altiplano. An erosion rate of 10−2 mm yr−1 could be estimated based on the 1.3 mm mean erosion measurement during the March 2015 storm by this work, and the return time of this type of event could be estimated from the paleoclimatic record of one event every 100 years. This value agrees in terms of order of magnitude with the Holocene erosion rates in the Huasco River valley calculated from the concentration of terrestrial cosmogenic nuclides in stream sediments and Plio-Quaternary erosion rates calculated from missing volumes of the deep valleys incised below Miocene pediments and paleovalleys (0.03–0.08 mm yr−1 calculated by Aguilar et al., 2011, and Aguilar et al., 2014, respectively). These two independent proxies of long-term denudation show a great significance of erosion linked to extreme storms on a scale of 106–104 years. The latter is in agreement with a significant geomorphological contribution to the millennial erosion rates of extreme storm events deduced from the comparison of erosion rates at different timescales in arid and semiarid mountainous ranges (Kirchner et al., 2001; Kober et al., 2013; Carretier et al., 2013).
The occasional humid spells reported for the Middle Holocene (8–4 kyr BP; Grosjean, 1997) or stormy conditions during this period (Tiner et al., 2018) produced the runoff necessary to entrain sediment from the alluvial channels and hillslopes within tributary catchments of the Atacama Desert. This has been evidenced in the Holocene stratigraphy of the alluvial fans of the Huasco River valley by a number of cohesive debris flow layers and by radiocarbon age, interpreted as a result of episodic high-water discharge events during the last 8 kyr BP (Cabré et al., 2017). Therefore, storm conditions and high-sediment discharge occurred at least after 8 ka in the Atacama Desert. The increase in layers with coarse sediment in lacustrine and marine archives during the last 5500 yr BP is interpreted as high-sediment-discharge events associated with more frequent extreme storms in the southern Atacama Desert (Rein et al., 2005; Tiner et al., 2018; Ortega et al., 2019). Recurrence time decreased from one event per 210 years towards one event per 40 years in the last 1000 yr BP in the southern Atacama Desert (Ortega et al., 2019). However, the increase in coarse-sediment layers could be showing more summer austral storms, with as high a zero isotherm altitude as the March 2015 storm. Therefore, this sedimentary record does not necessarily show changes in interdecennial storm return time linked to ENSO as recently interpreted by Ortega et al. (2019).
The generation of debris flows in the arid valleys of the southernmost part of the Atacama Desert is controlled by the amount of available sediments stored within the catchments. The efficiency of the catchments in storing sediments depends on their topographic attributes that ultimately determine whether the catchments are activated or not during extreme storm events. The sediment is stored during the interstorm periods and, therefore, is susceptible to being transferred by debris flows during any extreme storm that impacts the area. Drainage networks are the main entrainment sediment zones during extreme storms, while the supply of sediment from landslides on hillslopes is not observed for the generation of debris flows in these catchments during extreme storm events. The instantaneous increase in runoff during a storm and the entrainment of sediment have been associated with the high altitude of the zero isotherm and the presence of storm cells. Evaluations of the susceptibility to debris flow in arid catchments of the Atacama Desert that incorporate the topographic classification of catchment clustering as predictors could be easily implemented, avoiding extensive fieldwork observations.
Recently, there has been some consensus that storms like the March 2015 event in the Atacama Desert occur on average every ∼100 years (Ortega et al., 2019). Therefore, the erosion rates associated with these storms are on the order of 10−2 mm yr−1 in the Huasco River valley if we consider the erosion measurements after the March 2015 storm. The order of magnitude of erosion is the same as the calculated long-term erosion rates in the Huasco River valley (Aguilar et al., 2014). This indicates that these storms have a significant influence on the erosion and evolution of these arid fluvial systems of the Atacama Desert. However, the influence of different surface processes on sediment preparation in the period between storms has not yet been characterized. New direct data, including quantitative geomorphological analysis of erosion, sedimentation and soil formation, are required to quantify and improve the knowledge of the rates, routes and magnitudes of each of the processes involved in the landscape evolution of the Atacama Desert.
Assessment of susceptibility to the generation of debris flow and the estimation of the return time of large-scale alluvial episodes should be included in studies of hydro-meteorological hazard in populated areas (Wilford et al., 2004). The susceptibility of debris flow generation in the southern Atacama Desert is linked to the storage capacity in a drainage network during the interstorm period. Furthermore, susceptibility is linked to the percentage of the catchment below the zero isotherm altitude during the storm. The unusual altitude of the zero isotherm above the topography during the March 2015 storm explains the lack of similar sedimentary behavior in the historical records and the extensive runoff of debris flows from the sediment source. However, alluvial episodes such as the March 2015 storm control the evolution of the landscape of the fluvial systems of the Atacama Desert. The return times of one event every 100 years are adjusted to the millennial erosion rates. Considering the altitude of the zero isotherm during storms in debris flow susceptibility assessments is essential because recent literature has predicted its progressive increase in mountainous areas of Chile (Carrasco et al., 2005; Boiser et al., 2016) and worldwide (Mountain Research Initiative EDW Working Group, 2015).
The following data are available in the Supplement related to this article: (1) measurement of debris flow deposits and volume and (2) morphometric and geological features of catchments.
The supplement related to this article is available online at: https://doi.org/10.5194/nhess-20-1247-2020-supplement.
GA contributed to the problem conceptualization, definition of investigation, selection of methodology, analysis of data and writing of the original draft. AC contributed to the definition of investigation, analysis of data and writing of the original draft. VF contributed to the definition of investigation, selection of methodology and analysis of data. BV contributed to the analysis of data.
The authors declare that they have no conflict of interest.
This work is based on the undergraduate thesis of Víctor Fredes and is part of the PhD thesis of Albert Cabré. We gratefully acknowledge Rodrigo Riquelme, Anne Mather, Marisol Lara and Sergio Sepúlveda for their contributions to these theses. We also acknowledge a Planet Team grant (https://www.planet.com/, last access: 6 May 2020) given to Albert Cabré. This paper is a result of valuable contributions during the preprint phase in Natural Hazards and Earth System Sciences discussions (NHESSD). We give special thanks to the referees Martin Mergili, Teresa Jordan and Juan Luis García and to one other anonymous referee for their participation in revising the early version of this paper.
This research has been supported by the Basal Project of the Advanced Mining Technology Center financed by CONICYT Project AFB180004 and CONICYT PAI, Concurso nacional de tesis de doctorado en el sector productivo, 2017 Folio (T7817110003), both of the government of Chile.
This paper was edited by Paolo Tarolli and reviewed by Juan Luis García, Teresa Jordan, Martin Mergili and one anonymous referee.
Aguilar, G.: Érosion et transport de matière sur le versant occidental des Andes semiàrides du Nord du Chili (27–32S): d'une approche à grande échelle temporelle et spatiale, jusqu'à l'évolution quaternaire d'un systẽme fluvial, Thẽse doctoral, Université de Toulouse, Toulouse, France, p. 204, 2010. a, b
Aguilar, G., Riquelme, R., Martinod, J., Darrozes, J., and Maire, E.: Erosion rates variability on landscape’s transience state in the semiarid Chilean Andes, Earth Surf. Proc. Land., 36, 1736–1748, 2011. a, b, c
Aguilar, G., Riquelme, R., Martinod, J., and Darrozes, J.: Role of climate and tectonics in the geomorphologic evolution of the Semiarid Andes between 27–32∘ S, Andean Geol., 40, 79–101, 2013. a, b
Aguilar, G., Carretier, S., Regard, V., Vassallo, R., Riquelme, R., and Martinod, J.: Grain size dependent 10Be concentrations in alluvial stream sediment of the Huasco Valley, a semi-arid Andes region, Quatern. Geochron., 19, 163–172, 2014. a, b, c, d, e, f, g
Anderson, S. W., Anderson, S. P., and Anderson, R. S.: Exhumation by debris flows in the 2014 Colorado front range storm, Geology, 43, 391–394, https://doi.org/10.1130/G36507.1, 2015. a
Barrett, B. S., Campos, D. A., Veloso, J. V., and Rondanelli, R.: Extreme temperature and precipitation events in March 2015 in central and northern Chile, J. Geophys. Res.-Atmos., 121, 4563–4580, 2016. a
Berti, M., Martina, M. L. V., Franceschini, S., Pignone, S., Simoni, A., and Pizziolo, M.: Probabilistic rainfall thresholds for landslide occurrence using a Bayesian approach, J. Geophys. Res., 117, F04006, https://doi.org/10.1029/2012JF002367, 2012. a
Boisier, J. P., Rondanelli, R., Garreaud, R. D., and Muñoz, F.: Anthropogenic and natural contributions to the Southeast Pacific precipitation decline and recent megadrought in Central Chile, Geophys. Res. Lett., 43, 413–421, 2016. a
Bovis, M. and Jakob, M.: The role of debris supply conditions in predicting debris flow activity, Earth Surf. Proc. Land., 24, 1039–1054, 1999. a, b
Box, G. E. P., Hunter, W. G., and Hunter, J. S.: Statistics for Experimenters: An Introduction to Design, Data Analysis and Model Building, John Wiley and Sons Inc., New York, USA, ISBN-13: 9780471093152, 653 pp., 1978. a
Bozkurt, D., Rondanelli, R., Garreaud, R., and Arriagada, A.: Impact of warmer eastern tropical Pacific SST on the March 2015 Atacama floods, Mon. Weather Rev., 144, 4441–4460, 2016. a
Cabré, A., Aguilar, G., and Riquelme, R.: Holocene evolution and geochronology of a semiarid fluvial system in the western slope of the Central Andes: AMS 14C data in El Tránsito River Valley, Northern Chile, Quatern. Int., 438, 20–32, 2017. a, b
Cabré, A., Aguilar, G., and Colombo, F.: Abanicos aluviales tributaries en un valle fluvial desarrollado en un context árido. Andes de Chile a los 29∘ S, Geogaceta, 66, 35–38, 2019. a
Cabré, A., Aguilar, G., Mather, A. E., Fredes, V., and Riquelme, R.: Tributary-junction alluvial fan response to an ENSO rainfall event in the El Huasco watershed, northern Chile, Prog. Phys. Geogr.: Earth Environ., https://doi.org/10.1177/0309133319898994, in press, 2020. a, b, c, d, e, f, g
Campbell, D. and Church, M.: Reconnaissance sediment budgets for Lynn Valley, British Columbia: Holocene and contemporary time scales, Can. J. Earth Sci., 40, 701–713, https://doi.org/10.1139/E03-012, 2003. a
Carrasco, J. F., Casassa, G., and Quintana, J.: Changes of the 0 ∘C isotherm and the equilibrium line altitude in central Chile during the last quarter of the 20th century, Hydrolog. Sci. J. – des Sciences Hydrologiques, 50, 933–948, https://doi.org/10.1623/hysj.2005.50.6.933, 2005. a
Carretier, S., Regard, V., Vassallo, R., Aguilar, G., Martinod, J., Riquelme, R., Pepin, E., Charrier, R., Herail, G., Farias, M., Guyot, J. L., Vargas, G., and Lagane, C.: Slope and climate variability control of erosion in the Andes of Central Chile, Geology, 41, 195–198, https://doi.org/10.1130/G33735.1, 2013. a
Carretier, S., Regard, V., Vassallo, R., Aguilar, G., Martinod, J., Riquelme, R., Christophoul, F., Charrier, R., Gayer, E., Farías, M., Audin, L., and Lagane, C.: Differences in 10Be concentrations between river sand, gravel and pebbles along the western side of the central Andes, Quatern. Geochronol., 27, 33–51, https://doi.org/10.1016/j.quageo.2014.12.002, 2015. a
Carretier, S., Tolorza, V., Regard, V., Aguilar, G., Bermúdez, M. A., Martinod, J., Guyot, J. L., Hérail, G., and Riquelme, R.: Review of erosion dynamics along the major N-S climatic gradient in Chile and perspectives, Geomorphology, 300, 45–68, 2018. a
Cavalli, M., Goldin, B., Comiti, F., Brardinoni, F., and Marchi, L.: Assessment of erosion and deposition in steep mountain basins by differencing sequential digital terrain models, Geomorphology, 291, 4–16, https://doi.org/10.1016/j.geomorph.2016.04.009, 2017. a
Coe, J. A., Kinner, D. A., and Godt, J. W.: Initiation conditions for debris flows generated by runoff at Chalk Cliffs, central Colorado, Geomorphology, 96, 270–297, 2008. a
Colombo, F.: Sedimentología, in: Del proceso físico a la Cuenca sedimentaria, Textos Universitarios 46, edited by: Arche, A., CSIC, Madrid, 2010. a
Coppus, R., and Imeson, A. C.: Extreme events controlling erosion and sediment transport in a semi-arid sub-andean valley, Earth Surf. Proc. Land., 27, 1365–1375, 2002. a, b
Davis, J.: Statistics and Data Analysis in Geology, 3rd Edn., Wiley, New Delhi, 656 pp., ISBN 978-0-471-17275-8, 2002. a
Favier, V., Falvey, M., Rabatel, A., Praderio, E., and López, D.: Interpreting discrepancies between discharge and precipitation in high-altitude area of Chile's Norte Chico region (26–32∘ S), Water Resour. Res., 45, 1–20, 2009. a
Fredes, V.: Evaluación estadística de factores generadores de flujos de detritos durante el evento del 25 de Marzo de 2015 en la cuenca del valle del Huasco, Comuna de Vallenar, III Región de Atacama. Mamoria para optar al Título de Geólogo, Universidad de Chile, Santiago, 62 pp., available at: http://repositorio.uchile.cl/handle/2250/140357 (last access: 6 May 2020), 2016. a
Fryirs, K. A., Brierley, G. J., Preston, N. J., and Kasai, M.: Buffers, barriers and blankets: the (dis)connectivity of catchment-scale sediment cascades, Catena, 70, 49–67, https://doi.org/10.1016/j.geomorph.2009.11.015, 2007. a
Gascoin, S., Kinnard, C., Ponce, R., Lhermitte, S., MacDonell, S., and Rabatel, A.: Glacier contribution to streamflow in two headwaters of the Huasco River, Dry Andes of Chile, The Cryosphere, 5, 1099–1113, https://doi.org/10.5194/tc-5-1099-2011, 2011. a
González de Vallejo, L.: Ingeniería Geológica, Pearson, Prentice-Hall, Madrid, 715 pp., 2002. a
Grosjean, M., Valero-Garces, B. L., Geyh, M., Messerli, B., Schotterer, U., Schreier, H., and Kelts, K. Mid- and late Holocene limnogeology of Laguna del Negro Francisco, northern Chile, and its paleoclimatic implications, Holocene, 7, 151–159, https://doi.org/10.1177/095968369700700203, 1997. a
Horton, R.: Erosional Development of Streams and their Drainage Basins; hydrophysical approach to quantitative Morphology, Bull. Geol. Soc. Am., 56, 275–370, 1945. a
Houston, J.: Variability of precipitation in the Atacama Desert: Its causes and hydrological impact, Int. J. Climatol., 26, 2181–2198, 2006. a
Howard, A. D. and Kerby, G.: Channel changes in badlands, Geol. Soc. Am. Bull., 94, 739–752, 1983. a
Jordan, T. E., Herrera, C., Godfrey, L. V., Colucci, S. J., Gamboa, C., Urrutia, J., González, G., and Paul, J. F.: Isotopic characteristics and paleoclimate implications of the extreme precipitation event of March 2015 in northern Chile, Andean Geol., 46, 1–31, 2019. a, b, c
Kean, J. W., McCoy, S. W., Tucker, G. E., Staley, D. M., and Coe, J. A.: Runoff-generated debris flows: Observations and modeling of surge initiation, magnitude, and frequency, J. Geophys. Res.-Earth, 118, 2190–2207, https://doi.org/10.1002/jgrf.20148, 2013. a
Kirchner, J. W., Finkel, R. C., Riebe, C. S., Granger, D. E., Clayton, J. L., King, J. G., and Megahan, W. F.: Mountain erosion over 10 yr, 10 k.y., and 10 m.y. time scales, Geology, 29, 591–594, 2001. a
Kober, F., Hippe, K., Salcher, B., Ivy-Ochs, S., Kubik, P. W., Wacker, L., and Hählen, N.: Debris-flow-dependent variation of cosmogenically derived catchment-wide denudation rates, Geology, 40, 935–938, 2012. a
Lauro, C., Moreiras, S. M., Junquera, S., Vergara, I. P., and Toural, R.: Summer rainstorm associated with a debris flow in the Amarilla gully affecting the international Agua Negra Pass (30∘20′ S), Argentina, Environ. Earth Sci., 76, 1–12, 2017. a
Levy, J. and Varela, J.: Análisis multivariable para las ciencias sociales, Prentice Hall, Madrid, p. 862, 2003. a
Maldonado, A. and Villagrán, C.: Climate variability over the last 9900 cal yr BP from a swamp forest pollen record along the semiarid coast of Chile, Quatern. Res., 66, 246–258, 2006. a
Marc, O., Stumpf, A., Malet, J. P., Gosset, M., Uchida, T., and Chiang, S. H.: Initial insights from a global database of rainfall‐inducedlandslide inventories: The weak influence of slope and strong influence of total storm rainfall, Earth Surf. Dynam., 6, 903–922, https://doi.org/10.5194/esurf‐6‐903‐2018, 2018. a
Martel-Cea, A., Maldonado, A., Grosjean, M., Alvial, I., de Jong, R., Fritz, S. C., and von Gunten, L.: Late Holocene environmental changes as recorded in the sediments of high Andean Laguna Chepical, Central Chile (32∘ S; 3050 m a.s.l.), Paleogeogr. Palaeocl., 461, 44–54, https://doi.org/10.1016/j.palaeo.2016.08.003, 2016. a
Mather, A. E. and Stokes, M.: Bedrock structural control on catchment-scale connectivity and alluvial fan processes, High Atlas Mountains, Morocco, in: Geology and Geomorphology of Alluvial and Fluvial Fans: Terrestrial and Planetary Perspectives, edited by: Ventra, D. and Clarke, L. E., Geol. Soc. Lond. Spec. Publ., 440, 103–128, https://doi.org/10.1144/SP440.15, 2017. a
Melton, M.: An analysis of the relation among elements of climate, surface properties and geomorphology, No. CU-TR-11, Columbia University, New York, 1957. a
Melton, M.: The Geomorphic and Paleoclimatic Significance of Alluvial Deposits in Southern Arizona, J. Geol., 73, 1–38, 1965. a
Mountain Research Initiative EDW Working Group: Elevation-dependent warming in mountain regions of the world, Nat. Clim. Change, 5, 424–430, https://doi.org/10.1038/nclimate2563, 2015. a
Nicoletti, P. G. and Sorriso-Valvo, M.: Geomorphic controls of the shape and mobility of rock avalanches, Geol. Soc. Am. Bull., 103, 1365–1373, 1991. a
Ortega, C., Vargas, G., Rutllant, J. A., Jackson, D., and Méndez, C.: Major hydrological regime change along the semiarid western coast of South America during the early Holocene, Quatern. Res., 78, 512–527, 2012. a
Ortega, C., Vargas, G., Rojas, M., Rutllant, J. A., Muñoz, P., Lange, C. B., Pantoja, S., Dezileau, L., and Ortlieb, L.: Extreme ENSO-driven torrential rainfalls at the southern edge of the Atacama Desert during the late Holocene and their projection into the 21th century Global Planet. Change, 175, 226–237, 2019. a, b, c, d, e, f, g, h, i
Ortlieb, L.: Las mayores precipitaciones históricas en Chile central y la cronología de eventos ENOS en los siglos XVI–XIX, Rev. Chile. Hist. Nat., 67, 463–485, 1994. a
Ortlieb, L.: El Niño events and rainfall episodes in the Atacama desert: the record of the last two centuries in Eaux, glaciers and changements climatiques dans les Andes tropicales, edited by: Ribstein, P., Francou, B., Coudrain-Ribstein, A., and Mourguiart, P., Bulletin de l'institute français d'études Andines, 24, 519–537, 1995. a
Planet Team: Planet Application Program Interface: In Space for Life on Earth, San Francisco, CA, available at: https://api.planet.com (last access: 6 May 2020), 2017. a, b
Poesen, J., Nachtergaele, J., Verstraeten, G., and Valentin, C.: Gully erosion and environmental change: importance and research needs, Catena, 50, 91–133, 2003. a
Rein, B., Lückge, A., Reinhardt, L., Sirocko, F., Wolf, A., and Dullo, W. C.: El Niño variability off Peru during the last 20,000 years, Paleoceanography, 20, PA4003, https://doi.org/10.1029/2004PA001099, 2005. a, b
Roda-Boluda, D., D'Arcy, M., McDonald. J., and Whittaker, A.: Lithological controls on hillslope sediment supply: insights from landslide activity and grain size distributions, Earth Surf. Proc. Land., 43, 956–977, https://doi.org/10.1002/esp.4281, 2018. a, b
Rossel, K., Aguilar, G., Salazar, E., Martinod, J., Carretier, S., Pintgo, L., and Cabré, A.: Chronology of Chilean Frontal Cordillera building from geochronological, stratigraphic and geomorphological data insights from Miocene intramontane-basin deposits, Basin Res., 30, 289–310, 2018. a
Salazar, E., Coloma, F., and Creixell, C.: Geología del área El Tránsito-Lagunillas, Región de Atacama, Carta Geológica de Chile, Serie Geología Básica 149, 1 mapa escala 1:100 000, Servicio Nacional de Geología y Minería, Santiago de Chile, 2013. a, b, c, d, e
Selby, M. J.: Hillslope Materials and Processes, 2nd Edn., Oxford University Press, Oxford, 1993. a, b
Sepúlveda, S. A. and Padilla, C.: Rain-induced debris and mudflow triggering factors assessment in the Santiago cordilleran foothills, Central Chile, Nat, Hazards, 47, 201–215, https://doi.org/10.1007/s11069-007-9210-6, 2008. a
Stokes, M. and Mather, A. M.: Controls on modern tributary-junction alluvial fan occurrence and morphology: high Atlas Mountains, Morocco, Geomorphology, 248, 344–362, 2015. a
Strahler, A.: Dimensional analysis applied to fluvially eroded landforms, Geol. Soc. Am. Bull., 69, 279–300, https://doi.org/10.1130/0016-7606(1958)69[279:DAATFE]2.0.CO;2, 1958. a
Tarr, R. S.: Erosive agents in the arid regions, Am. Nat., 24, 455–459, 1890. a
Tiner, R. J., Negrini, R. M., Antinao, J. L., McDonald, E., and Maldonado, A.: Geophysical and geochemical constraints on the age and paleoclimate implications of Holocene lacustrine cores from the Andes of central Chile, J. Quaternary Sci., 33, 150–165, 2018. a, b, c
Vargas, G., Rutllant, J., and Ortlieb, L.: ENSO tropical-extratropical climate teleconnections and mechanisms for Holocene debris flows along the hyperarid coast of western South America (17∘–24∘ S), Earth Planet. Sc. Lett., 249, 467–483, 2006. a
Vargas, G., Pérez, S., and Aldunce, P.: Aluviones y resiliencia en Atacama, in: Construyendo saberes sobre riesgos y desastres, Social-Ediciones, Santiago de Chile, 359 pp., available at: http://repositorio.uchile.cl/handle/2250/170281 (last access: 6 May 2020), 2018. a
Veit, H.: Southern Westerlies during the Holocene deduced from geomorphological and Pedological Studies in the Norte Chico, Northern Chile (27–33∘ S), Palaeogeogr. Palaeocl., 123, 107–119, 1996. a, b
Vergara Dal Pont, I. P., Santibañez-Ossa, F. A., and Araneo, D.: Determination of probabilities for the generation of high-discharge flows in the middle basin of Elqui River, Chile, Nat. Hazards, 93, 531–546, https://doi.org/10.1007/s11069-018-3313-0, 2018. a, b, c, d
Wilcox, A. C., Escauriaza, C., Agredano, R., Mignot, E., Zuazo, V., Otarola, S., Castro, L., Gironas, J., Cienfuegos, R., and Mao, L.: An integrated analysis of the March 2015 Atacama floods, Geophys. Res. Lett., 43, 8035–8043, https://doi.org/10.1002/2016GL069751, 2016. a, b, c
Wilford, D., Sakals, M., Innes, J., Sidle, R., and Bergerud, W.: Recognition of debris flow, debris flood and flood hazard through watershed morphometrics, Lanslides, 1, 61–66, 2004. a, b