the Creative Commons Attribution 4.0 License.
the Creative Commons Attribution 4.0 License.
 | 18 Dec 2019
Changes in flood damage with global warming on the eastern coast of Spain
Marco Turco
Philip Ward
Josep A. Sánchez-Espigares
Lorenzo Alfieri
Maria Carmen Llasat
Flooding is one of the main natural hazards in the world and causes huge economic and human impacts. Assessing the flood damage in the Mediterranean region is of great importance, especially because of its large vulnerability to climate change. Most past floods affecting the region were caused by intense precipitation events; thus the analysis of the links between precipitation and flood damage is crucial. The main objective of this paper is to estimate changes in the probability of damaging flood events with global warming of 1.5, 2 and 3 ∘C above pre-industrial levels and taking into account different socioeconomic scenarios in two western Mediterranean regions, namely Catalonia and the Valencian Community. To do this, we analyse the relationship between heavy precipitation and flood-damage estimates from insurance datasets in those two regions. We consider an ensemble of seven regional climate model (RCM) simulations spanning the period 1976–2100 to evaluate precipitation changes and to drive a logistic model that links precipitation and flood-damage estimates, thus deriving statistics under present and future climates. Furthermore, we incorporate population projections based on five different socioeconomic scenarios. The results show a general increase in the probability of a damaging event for most of the cases and in both regions of study, with larger increments when higher warming is considered. Moreover, this increase is higher when both climate and population change are included. When population is considered, all the periods and models show a clearly higher increase in the probability of damaging events, which is statistically significant for most of the cases.
Our findings highlight the need for limiting global warming as much as possible as well as the importance of including variables that consider change in both climate and socioeconomic conditions in the analysis of flood damage.
- Article
(5678 KB) - Full-text XML
- BibTeX
- EndNote


In the Mediterranean region, intense precipitation events constitute a real danger to the population. Heavy precipitation, sometimes associated with strong winds, can cause floods, with dire consequences for people and the environment (Fourrie et al., 2016) particularly during the autumn season. Most of these events are a consequence of short and local heavy rains in small catchments, often near the coast in densely populated areas (Thiébault, 2018). The relief surrounding the Mediterranean Sea forces the convergence of low-level atmospheric flows and the uplift of warm wet air masses that drift from the Mediterranean Sea to the coasts, thereby creating active convection. In addition, population growth is particularly high along the Mediterranean coasts, leading to a rapid increase in urban settlements and populations exposed to flooding (Gaume et al., 2016).
In the last few years, much research has focused on the study of climate change in the Mediterranean region, an area that is identified as highly vulnerable to climate change according to the “Fifth Assessment Report” of the Intergovernmental Panel on Climate Change (IPCC, 2014). Some studies have found an increase in precipitation extremes with global warming projections in the Mediterranean region (Colmet-Daage et al., 2018; Drobinski et al., 2018), although a general decrease in the annual precipitation is projected (Jacob et al., 2014; Cramer et al., 2018; Sillmann et al., 2013; Rajczak and Schär, 2017). Cramer et al. (2018) state that future warming in the Mediterranean region is expected to exceed the global mean rates by 25 %, with peaks of 40 % in summer. As a result, flood risk associated with extreme precipitation events is expected to increase due to climate change in this area but also due to non-climatic factors such as increasingly sealed surfaces in urban areas and ill-conceived storm-water management systems (Cramer et al., 2018).
A large number of floods affecting the western Mediterranean region are surface water floods (Llasat et al., 2014; Cortès et al., 2018). This type of flood can be regarded as coming under the most general definition of rainfall-related floods (Bernet et al., 2017; Cortès et al., 2018). For this reason, precipitation is the main hazard driver of the damage caused by these events.
Nevertheless, flood disasters are the result of both societal and climatological factors; hence several other drivers other than climate must be considered for the assessment of flood-damage trends (Barredo, 2009). Bouwer (2011) analyses 22 disaster loss studies around the globe, showing that economic losses from various weather-related natural hazards have increased. However, most of these studies have not found a trend in disaster losses after normalization for changes in population and wealth, pointing towards increasing concentrations and values of assets as the principle cause of the increasing damage and losses from natural disasters. In Spain, the findings of Barredo et al. (2012) align with these results; they find no significant trend in adjusted insured flood losses between 1971 and 2008. Other studies such as López-Martínez et al. (2017) and Pérez-Morales et al. (2018) also mention the vulnerability and exposure components as possible drivers responsible for the increasing flood risk in Mediterranean regions of Spain. Specifically, these studies mention the institutional vulnerability (Raschky, 2008), which represents the sensitivity of public administrations to dealing with hazards as one of the main causes. Also, Pérez-Morales et al. (2018) demonstrated that the exposure in flood-prone areas in the south-east of Spain (part of the region of study) has increased in the last decades due to poor management of these areas by government institutions and the regulation adopted by them. These studies show the need to include exposure and vulnerability changes in future risk projections, which clearly contribute substantially to changing risks.
Insurance data may provide a good proxy for describing flood damage (Barredo et al., 2012), and several studies note their potential for describing economic damage caused by surface water and urban floods (Spekkers et al., 2013; Torgersen et al., 2015; Cortès et al., 2018). However, there are still few studies that relate flooding to insurance data, since these companies are reluctant to provide their databases, and some of them are not even available due to confidentiality restrictions (André et al., 2013; Leal et al., 2019). Nevertheless, in the Mediterranean region, 20 years of flood-related insurance damage claims are available from the Spanish public reinsurer, the Insurance Compensation Consortium (Consorcio de Compensación de Seguros – CCS), for the Spanish regions of Catalonia and the Valencian Community. CCS is a public institution that compensates homeowners for damage caused by floods, playing a role similar to that of a reinsurance company (Barredo et al., 2012). Therefore, in this study, insurance data are used as a proxy for flood damage.
The main objective of this paper is to estimate changes in the probability of damaging flood events with global warming of 1.5, 2 and 3 ∘C above the pre-industrial levels, taking into account different socioeconomic scenarios. To do this, we analyse the relationship between heavy precipitation and flood-damage estimates from insurance datasets in two western Mediterranean regions, namely the Valencian Community and Catalonia regions of Spain. We use an ensemble of seven regional climate model (RCM) simulations and five different socioeconomic scenarios to study future changes in these relationships.
This article is organized as follows. After an Introduction, the Methods section describes the study region, the data used and the methodology describing the model developed for the present climate, and the treatment applied for the future precipitation and population projections. Then, the Results and discussion section presents the statistical models developed, the analysis of the future data, and the probability of flood damage with global warming, comparing our results with those obtained in other studies. Finally, a section describing the limitations of the study and possible future research is presented, followed by the Conclusions, which summarize the main findings of this study.

Figure 1 describes the overall methodology followed in this study and the data used. After selecting the flood events that have affected the region of study, we collected information on damage (insurance payments), hazard (precipitation) and exposure (population) for each basin affected by these events (panel 1). These data have been used to develop generalized linear mixed models in order to assess the probability of damaging events for the present climate (panel 2). Precipitation and population data from future projections were corrected (further information in Sect. 2.4) and aggregated at the river-basin scale (panel 3). Finally, we assessed changes in the probability of a damaging event with respect to the reference period (1976–2005) with global warming of 1.5, 2 and 3 ∘C above the pre-industrial levels (panel 4) using the relationships found in the present climate (panel 2) and the data from future projections (panel 3). In Sect. 2.2, the data and their sources are explained in detail.
2.1 Region of study
The domain of this study is the eastern coast of Spain and consists of Catalonia and the Valencian Community (Fig. 2). The Mediterranean presents a complex orography and particular location – at the transition area between extratropical and subtropical influence (Giorgi and Lionello, 2008) – that lead to a great variety of climates with both Atlantic and Mediterranean influences. Thus, precipitation is characterized by a complex spatial pattern, with a strong seasonal cycle and strong interannual (Trigo and Palutikof, 2001) and spatial variability (Rodriguez-Puebla et al., 1998; Romero et al., 1998; Martin-Vide, 2004; Rodrigo and Trigo, 2007; Quintana-Seguí et al., 2016, 2017). Due to this strong variability, this region represents a challenging area for the downscaling of precipitation studies (e.g. Turco et al., 2011). Catalonia, situated in the north-east of the Iberian Peninsula, has a surface of 32 108 km2 and a population of more than 7.5 million people (IDESCAT, 2018). The coastal zone is a very vulnerable area, since it is very densely populated, with municipalities such as Barcelona that have a population density around 16 000 inhabitants km−2. Catalonia is characterized by three mountain ranges (Fig. 2, no. 1): the Pyrenees in the north (maximum altitude above 3000 m a.s.l.), a range parallel to the Mediterranean coast (SW–NE) named the Catalan Pre-Coastal Range (maximum altitude around 1800 m a.s.l.) and the Catalan Coastal Range (maximum altitude around 600 m a.s.l.). This marked orography is one of the key reasons for producing floods, both from a hydrological point of view, since it presents small torrential catchments, and from a meteorological point of view, as the orography forces wet air to rise from the Mediterranean (Llasat et al., 2016). The presence of the Pyrenees can also lead to remarkable effects in the mesoscale pressure distribution, giving place to processes such as convergence lines and orographic dipoles. For example, the flood event of October 1987, when more than 400 mm of rainfall was recorded in 24 h near Barcelona, was favoured by a mesohigh created at the south of the Pyrenees (Ramis et al., 1994). For the 1996–2015 period, a total of 166 flood events were recorded in Catalonia: 13 of them caused catastrophic impacts, 87 caused extraordinary impacts and 66 caused ordinary impacts (Cortès et al., 2018), following the methodology explained in Llasat et al. (2016) and Cortès et al. (2017).
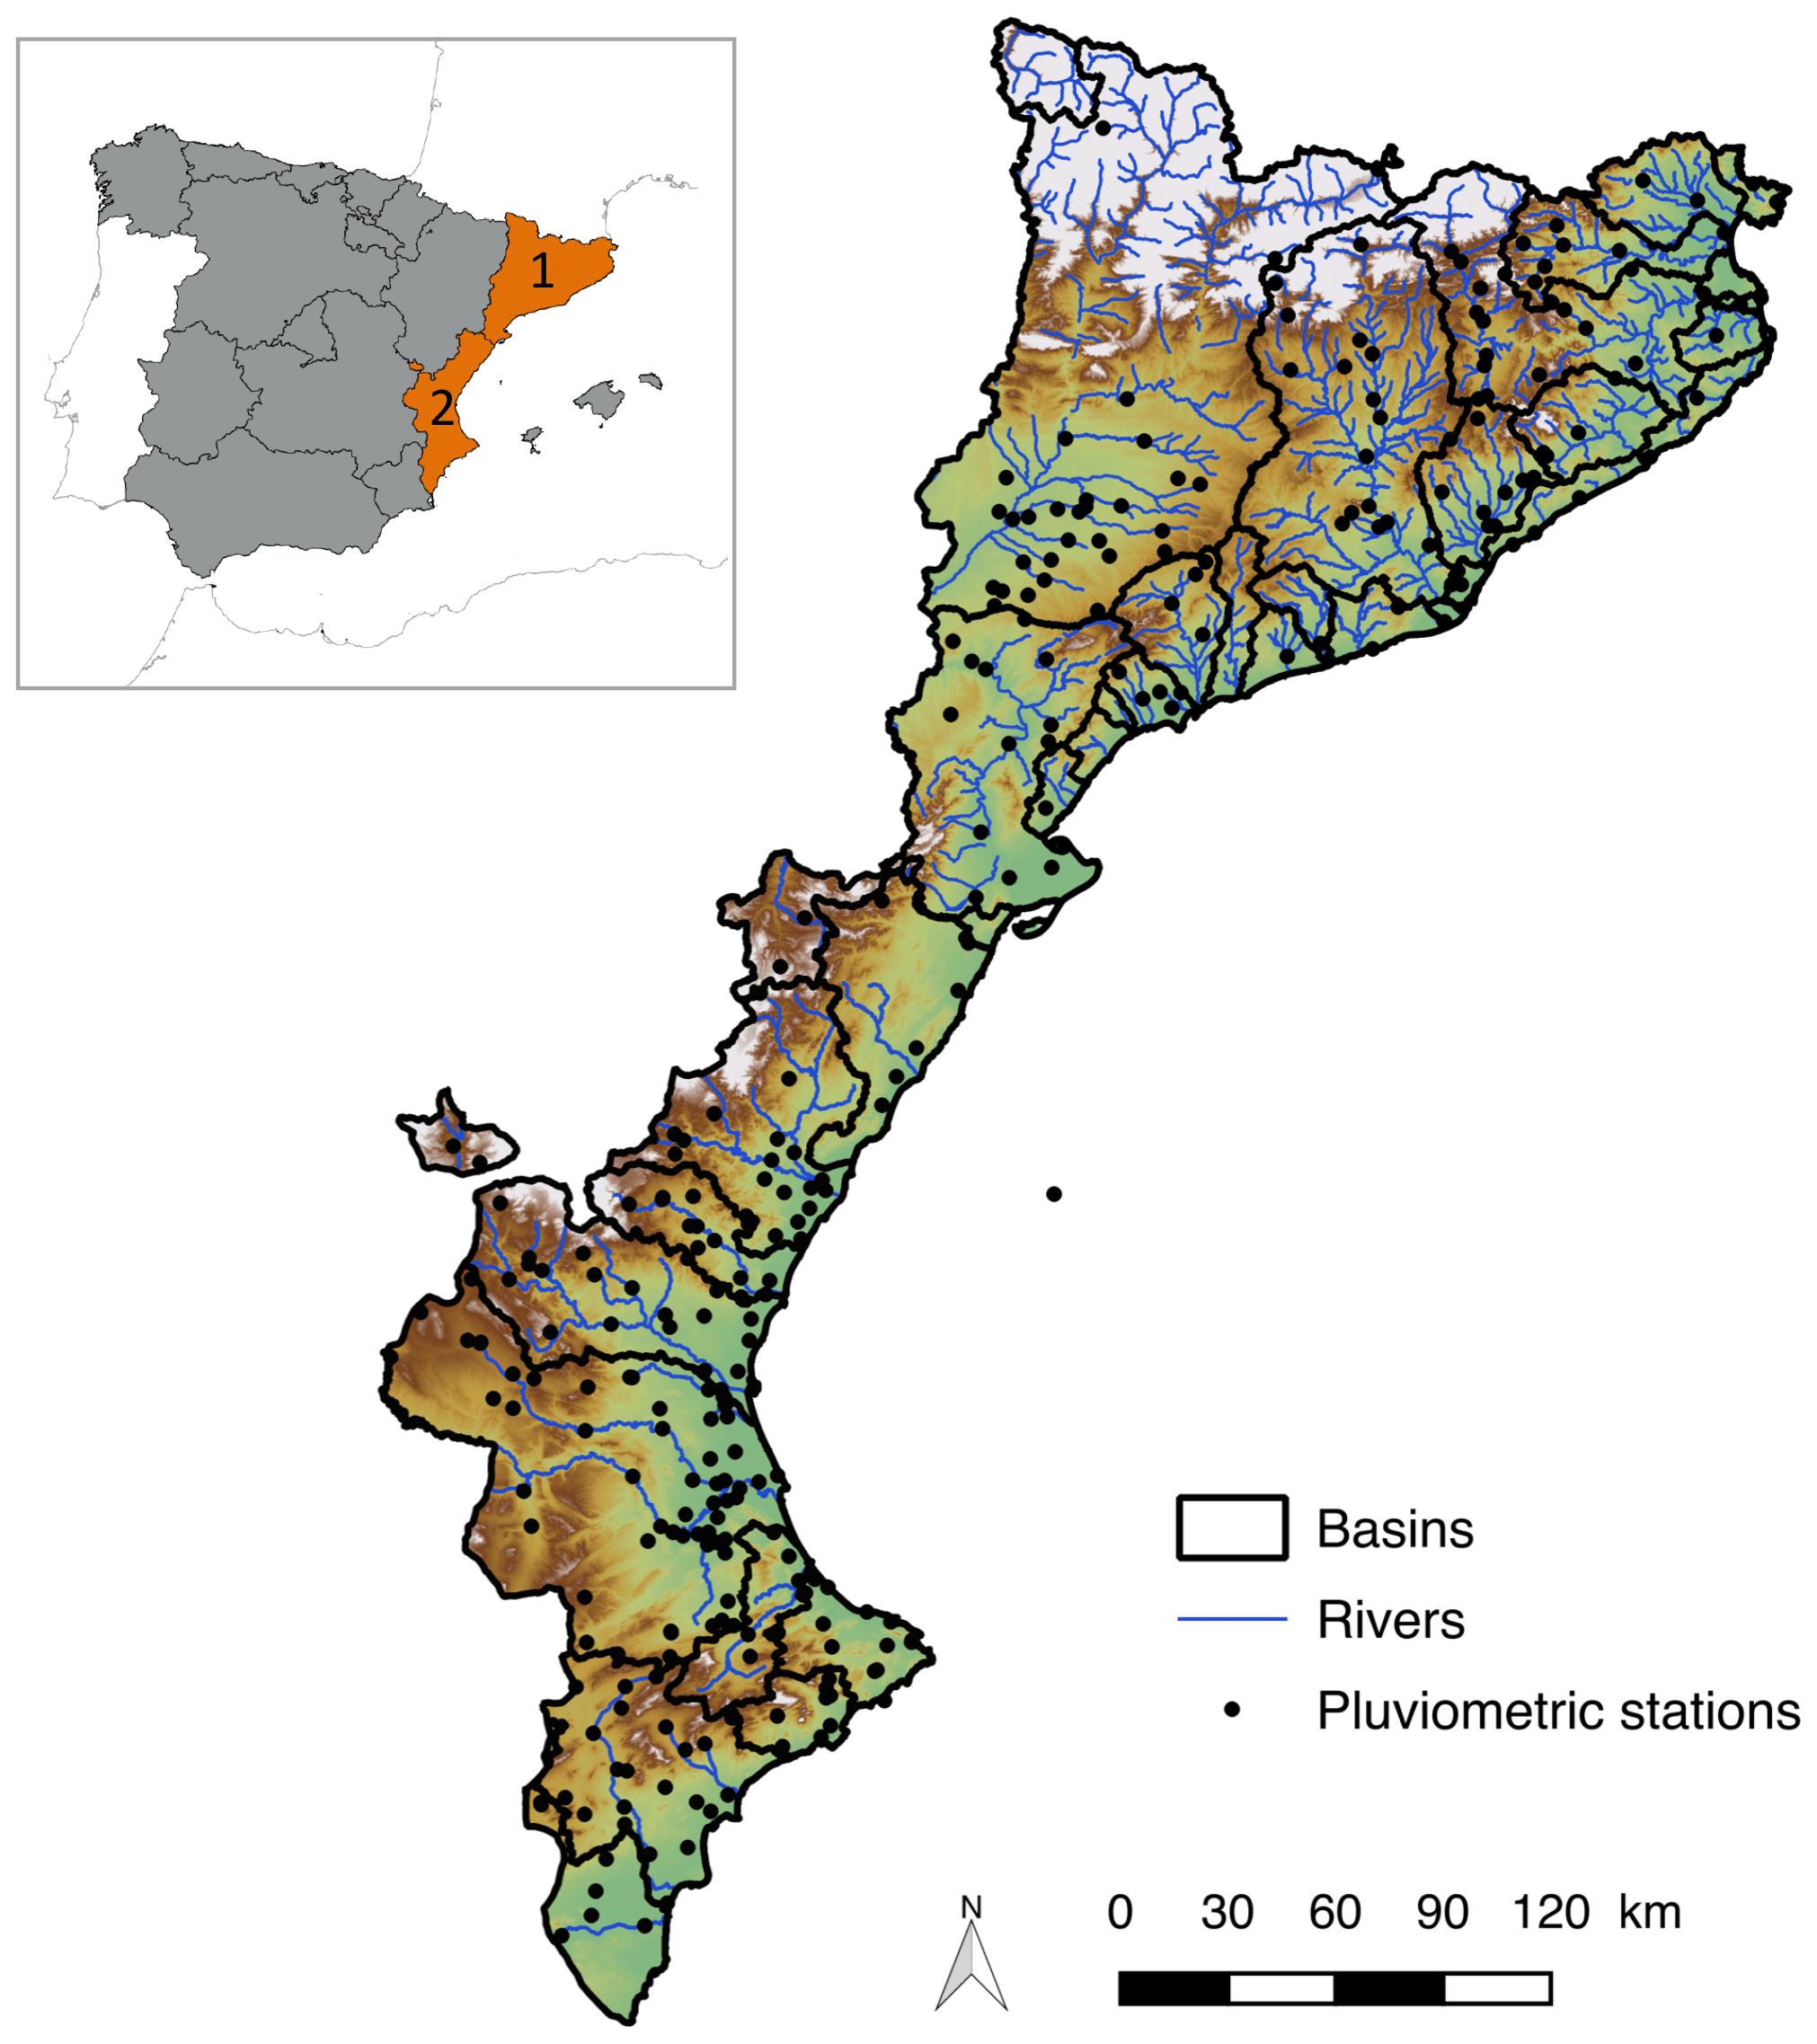
Figure 2Map of both regions of study (1: Catalonia; 2: Valencian Community), showing the aggregated basins (black lines), the main rivers (blue lines) and the pluviometric stations used (black points).
The second region of the study is the Valencian Community (Fig. 2, no. 2), with a population around 5 million people and a total surface of 23 255 km2 (INE, 2018). Similar to the Catalonia region, the coastal plains are crossed by torrential non-permanent streams, around which intense urbanization has taken place. In the south of the region, the mountains almost reach the coastline (maximum altitude around 1560 m a.s.l.), favouring heavy precipitation that can exceed 700 mm in 24 h. This was the case in November 1987, when more than 800 mm of rainfall was recorded in 24 h in Oliva (Valencia; Ramis et al., 2013). The Valencian Community recorded a total of 69 flood events for the 1996–2015 period, 11 of which were catastrophic, 26 were extraordinary and 32 were ordinary (Cortès et al., 2018).
2.2 Data
We used three different databases to select the flood events that affected the regions of study (Catalonia and Valencian Community): INUNGAMA (Barnolas and Llasat, 2007; Llasat et al., 2016), PRESSGAMA (Llasat et al., 2009) and FLOODHYMEX (Llasat et al., 2013). INUNGAMA is a database of the GAMA (Grup d'Anàlisi de situacions Meteorològiques Adverses) group, which reports the flood events that have occurred in Catalonia from 1900 to 2015 on a municipal, county and basin level. Information contained in the database includes hydrometeorological data, the impacts caused and the affected areas for each of the events. The major part of this information is provided by PRESSGAMA, a database formed from press data, and other data sources such as official reports. This database, which includes more than 15 000 news items, systematically collected information on natural risks and climate change in the newspaper La Vanguardia from 1981 to 2015. Finally, for the flood events recorded in the Valencian Community, we used the FLOODHYMEX database, which contains both hydrometeorological and impact information produced by flood events that have affected different Mediterranean regions for the period 1980–2015.
Population data for both regions were obtained from the municipal register of inhabitants provided by the Spanish National Statistics Institute (Instituto Nacional de Estadística; INE, 2018). The population data correspond to the year when the flood event took place.
We have used daily precipitation data provided by the Spanish State Meteorological Agency (Agencia Estatal de Meteorología – AEMET), which has an extensive network of automatic meteorological stations spread throughout the entire region of study collecting the accumulated daily precipitation between 07:00 and 07:00 UTC of the following day. To ensure temporal homogeneity, we only consider the stations with more than 90 % valid data over the 1996–2015 period (Fig. 2).
Table 1EURO-CORDEX climate models used, their characteristics, and the periods of each GCM for the three warming levels considered in this study.

Flood damage data were obtained from the insurance compensation due to floods, paid by the Spanish Insurance Compensation Consortium. The CCS compensates for damage caused to people and property by floods and other adverse weather events covered by an insurance policy. These data are provided at the postcode level and with a daily temporal resolution. The CCS database includes around of 58 000 records of claims paid for floods in Catalonia and more than 100 000 in the Valencian Community for the 1996–2015 period (no previous information is available with this level of detail). To compare these data with other variables, we aggregated the damage in each postcode to the municipality level and then calculated the total amount per flood event and basin affected. This process was carried out while taking into account the claims made for the days on which the event occurred (according to INUNGAMA and FLOODHYMEX databases) and the following 7 d. We used this 7 d window, as this is the period of time that the CCS allows insurance claims to be made. When the time difference between the two events is less than 7 d, damage is associated with the first event if the date of the claim was before the first day of the second event. Finally, damage data were adjusted to 2015 values, following the methodology defined by the Spanish National Statistics Institute (INE, 2018). This consists of using the exchange rate in the consumer price index (CPI) between the 2 years to adjust the values shown in Euros.
Daily precipitation data for seven climate projections were obtained from an ensemble of simulations developed within the EURO-CORDEX project (Jacob et al., 2014), which covers the whole of Europe with a spatial resolution of 0.11∘ in latitude and longitude (around 12 km). Tramblay et al. (2013) observed an improvement in the representation of precipitation and its extremes at this resolution compared with previous simulations at the 25 and 50 km resolution. Overall, the seven climate projections are combinations of three different general circulation models (GCMs), which were then downscaled with four RCMs, as shown in Table 1. The models chosen are the ones that had the necessary variables at the moment of the design of our study, and they have been extensively validated in previous studies (e.g. Jacob et al., 2014; Alfieri et al., 2015b, 2018; Jerez et al., 2018) and used to study climate change impacts (Jerez et al., 2015). The Representative Concentration Pathway 8.5 (RCP8.5) from the Intergovernmental Panel on Climate Change (IPCC, 2014) is the scenario used from 2006 to 2100 for the future projections. For the historical simulations (or reference period) the 1976–2005 period has been used.
The five shared socioeconomic pathways (SSPs) have been applied for the estimation of the population change in the future. The SSP projections (O'Neill et al., 2014) have been developed by the research community to facilitate integrated assessments of climate impacts, vulnerabilities, adaptation and mitigation. These socioeconomic pathways include projections for population, urbanization and gross domestic product at global and national scales. In order to obtain this information at the spatial resolution required for the study (basin level), gridded data were used from the 2UP (Towards an Urban Preview) model, developed by the Netherlands Environmental Assessment Agency. The core of the 2UP model, and its primary objective, is to disaggregate the scenario-based projected national-level urban population to 30 arcsec (approximately 1 km near the Equator) and simulate urban expansion for 194 countries and territories. This high-spatial-resolution grid has been used to calculate the future total population in each basin of the regions of study and for the different SSPs.
2.3 Modelling damage probabilities for the present climate
2.3.1 Generalized linear mixed model
The aim of this section is to develop a model that is able to gauge the probability of large damaging events occurring given a certain precipitation amount and taking into account other variables related to the exposure of the territory. That is, our aim is not to estimate the precise amount of the monetary compensation but to estimate when a “large” damaging event will occur given a certain precipitation amount. Since there is not a standard definition of a large damaging event, we tested several cases, corresponding to insurance compensation exceeding the 10th, 20th, 30th, 40th, 50th, 60th, 70th, 80th and 90th percentile of the total sample. The minimum geographical unit of the study is the river-basin scale, and we only consider the flood cases that recorded a mean precipitation in the basin higher than 40 mm in 24 h. Therefore, the model estimates the probability of having economic damage exceeding different damage thresholds (percentiles) when mean precipitation in the basin exceeds 40 mm in 24 h. Barbería et al. (2014) suggest that with a threshold of 40 mm d−1, social impacts are expected for rain events in urban areas of Catalonia, and Cortès et al. (2018) found a strong relationship between insurance data and precipitation when using this threshold for assessing the flood damage in the whole Catalan region. Population data were also taken into account to model flood exposure in the region. Therefore, we sampled the response variable (i.e. the compensation series) and both explanatory variables (the mean 24 h – 1 d – precipitation recorded for each basin and the total population of the basin) and pooled them into one sample for each entire region (Catalonia and Valencian Community) to correlate them. For each event there can be more than one set of values, depending on the number of affected catchments. From now on we will use the expression “flood case” for each set of values corresponding to a basin affected by a flood event. This area is large enough to have a fairly large sample size for the analysis yet small enough so that the causes of flood damage are related to the same weather pattern.
In order to accomplish this objective, a generalized linear mixed model (GLMM) has been applied for both regions and all the percentiles of damage. The GLMMs are a powerful class of statistical models that combine the characteristics of linear mixed models (models that include both fixed and random predictor variables) and generalized linear models (which handle non-normal data by using link functions and exponential family distributions – e.g. Poisson or binomial). Thus, GLMMs are the best tool for analysing non-normal data that involve random effects (Bolker et al., 2009). That is the case with the data used in this research, which are of the binary type (event or non-event), and there are random effects related to space and time: each of the basins can be affected by different flood events for the whole time period, and moreover each event can affect different basins at the same time. This implies that the observations are grouped by random factors, not guaranteeing the independence requirement of the generalized linear models (GLMs).
The generalized linear mixed model follows Eq. (1):
where π is the response variable (the probability to exceed a specific threshold of damage), P and R are the predictors (precipitation recorded in 24 h and the total population of the basin in our case), and bi and bj are the random effects related to the basins and the events. The value of the β coefficient is determined using GLMs. The Wald χ2 statistic is used to assess the statistical significance of individual regression coefficients (Harrell Jr., 2015).
2.3.2 Validation method
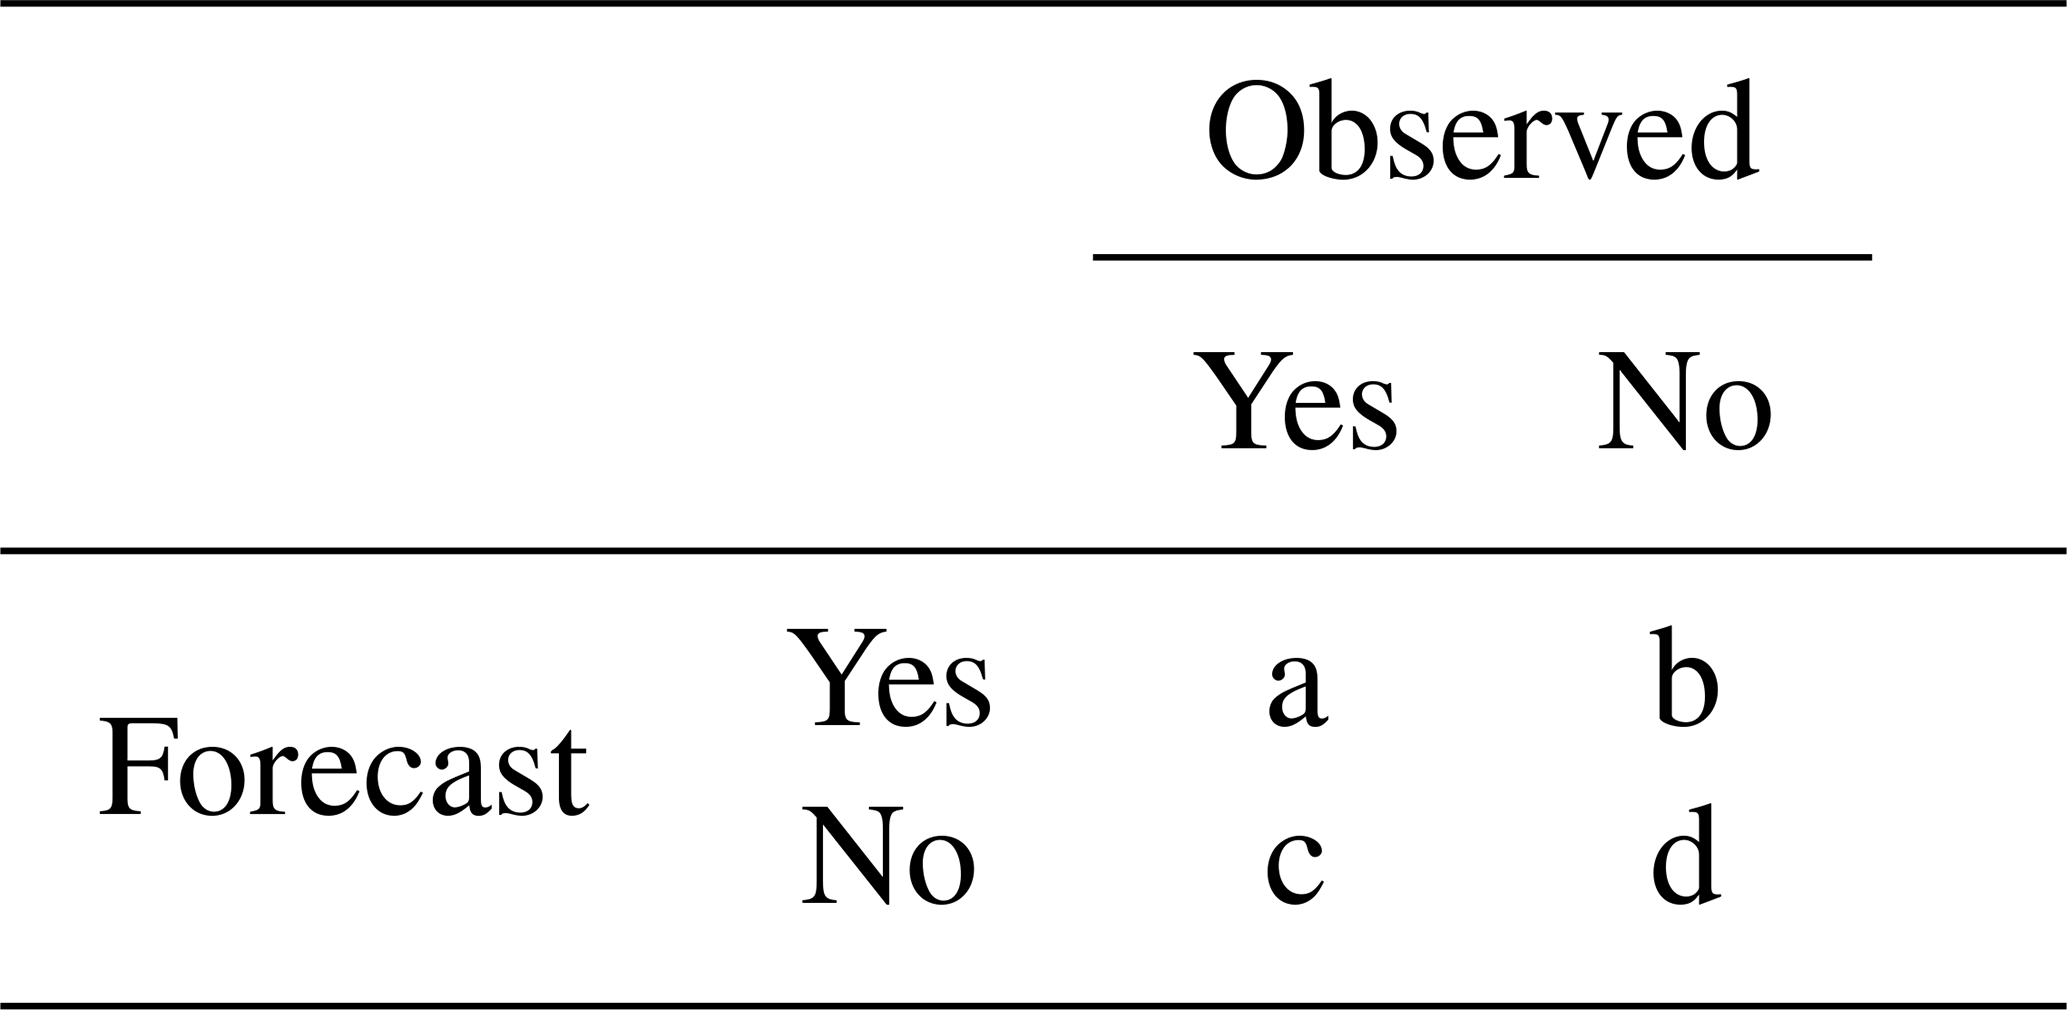
We plotted the relative operating characteristic (ROC) diagram, a commonly used logistic prediction diagnostic, showing the hit rate (i.e. the relative number of times a forecasted event actually occurred) against the false-alarm rate (i.e. the relative number of times an event had been forecasted but did not actually happen) for different potential decision thresholds (Mason and Graham, 2002). Thus, for each insurance compensation percentile, we first calculated the forecast probabilities for that event and then grouped the probability forecasts into batches (here 100, with a width of 0.01) to count the observed occurrences or non-occurrences. That is, we converted the observed and forecasted series, expressed as continuous amounts, into exceedance categories (yes or no statements indicating whether the data equal or exceed a selected probability). We then plotted the resulting elements on a standard contingency table (see Table 2). The model validation has been carried out using both in-sample and out-of-sample (i.e. leave-one-out cross validation) methods. The ROC diagram shows the hit rate (H) against the false-alarm rate (F). These indices are defined as
2.4 Future probability of flood damage
2.4.1 Precipitation extremes in future climate change scenarios
In this study, we analysed changes in daily precipitation data from the EURO-CORDEX simulations, assuming global warming scenarios of 1.5, 2 and 3 ∘C above pre-industrial levels (1881–1910; Vautard et al., 2014). For each simulation, the year when a 20-year running mean of global average temperature exceeds 1.5, 2 and 3 ∘C in the RCP8.5 dataset is identified, and then a 30-year time window is applied for each warming period and model. Therefore, for each simulation we have three periods of 30 years, described in Table 1, as well as the reference period 1976–2005. This method is based on the guidelines of the HELIX project (Betts et al., 2018).
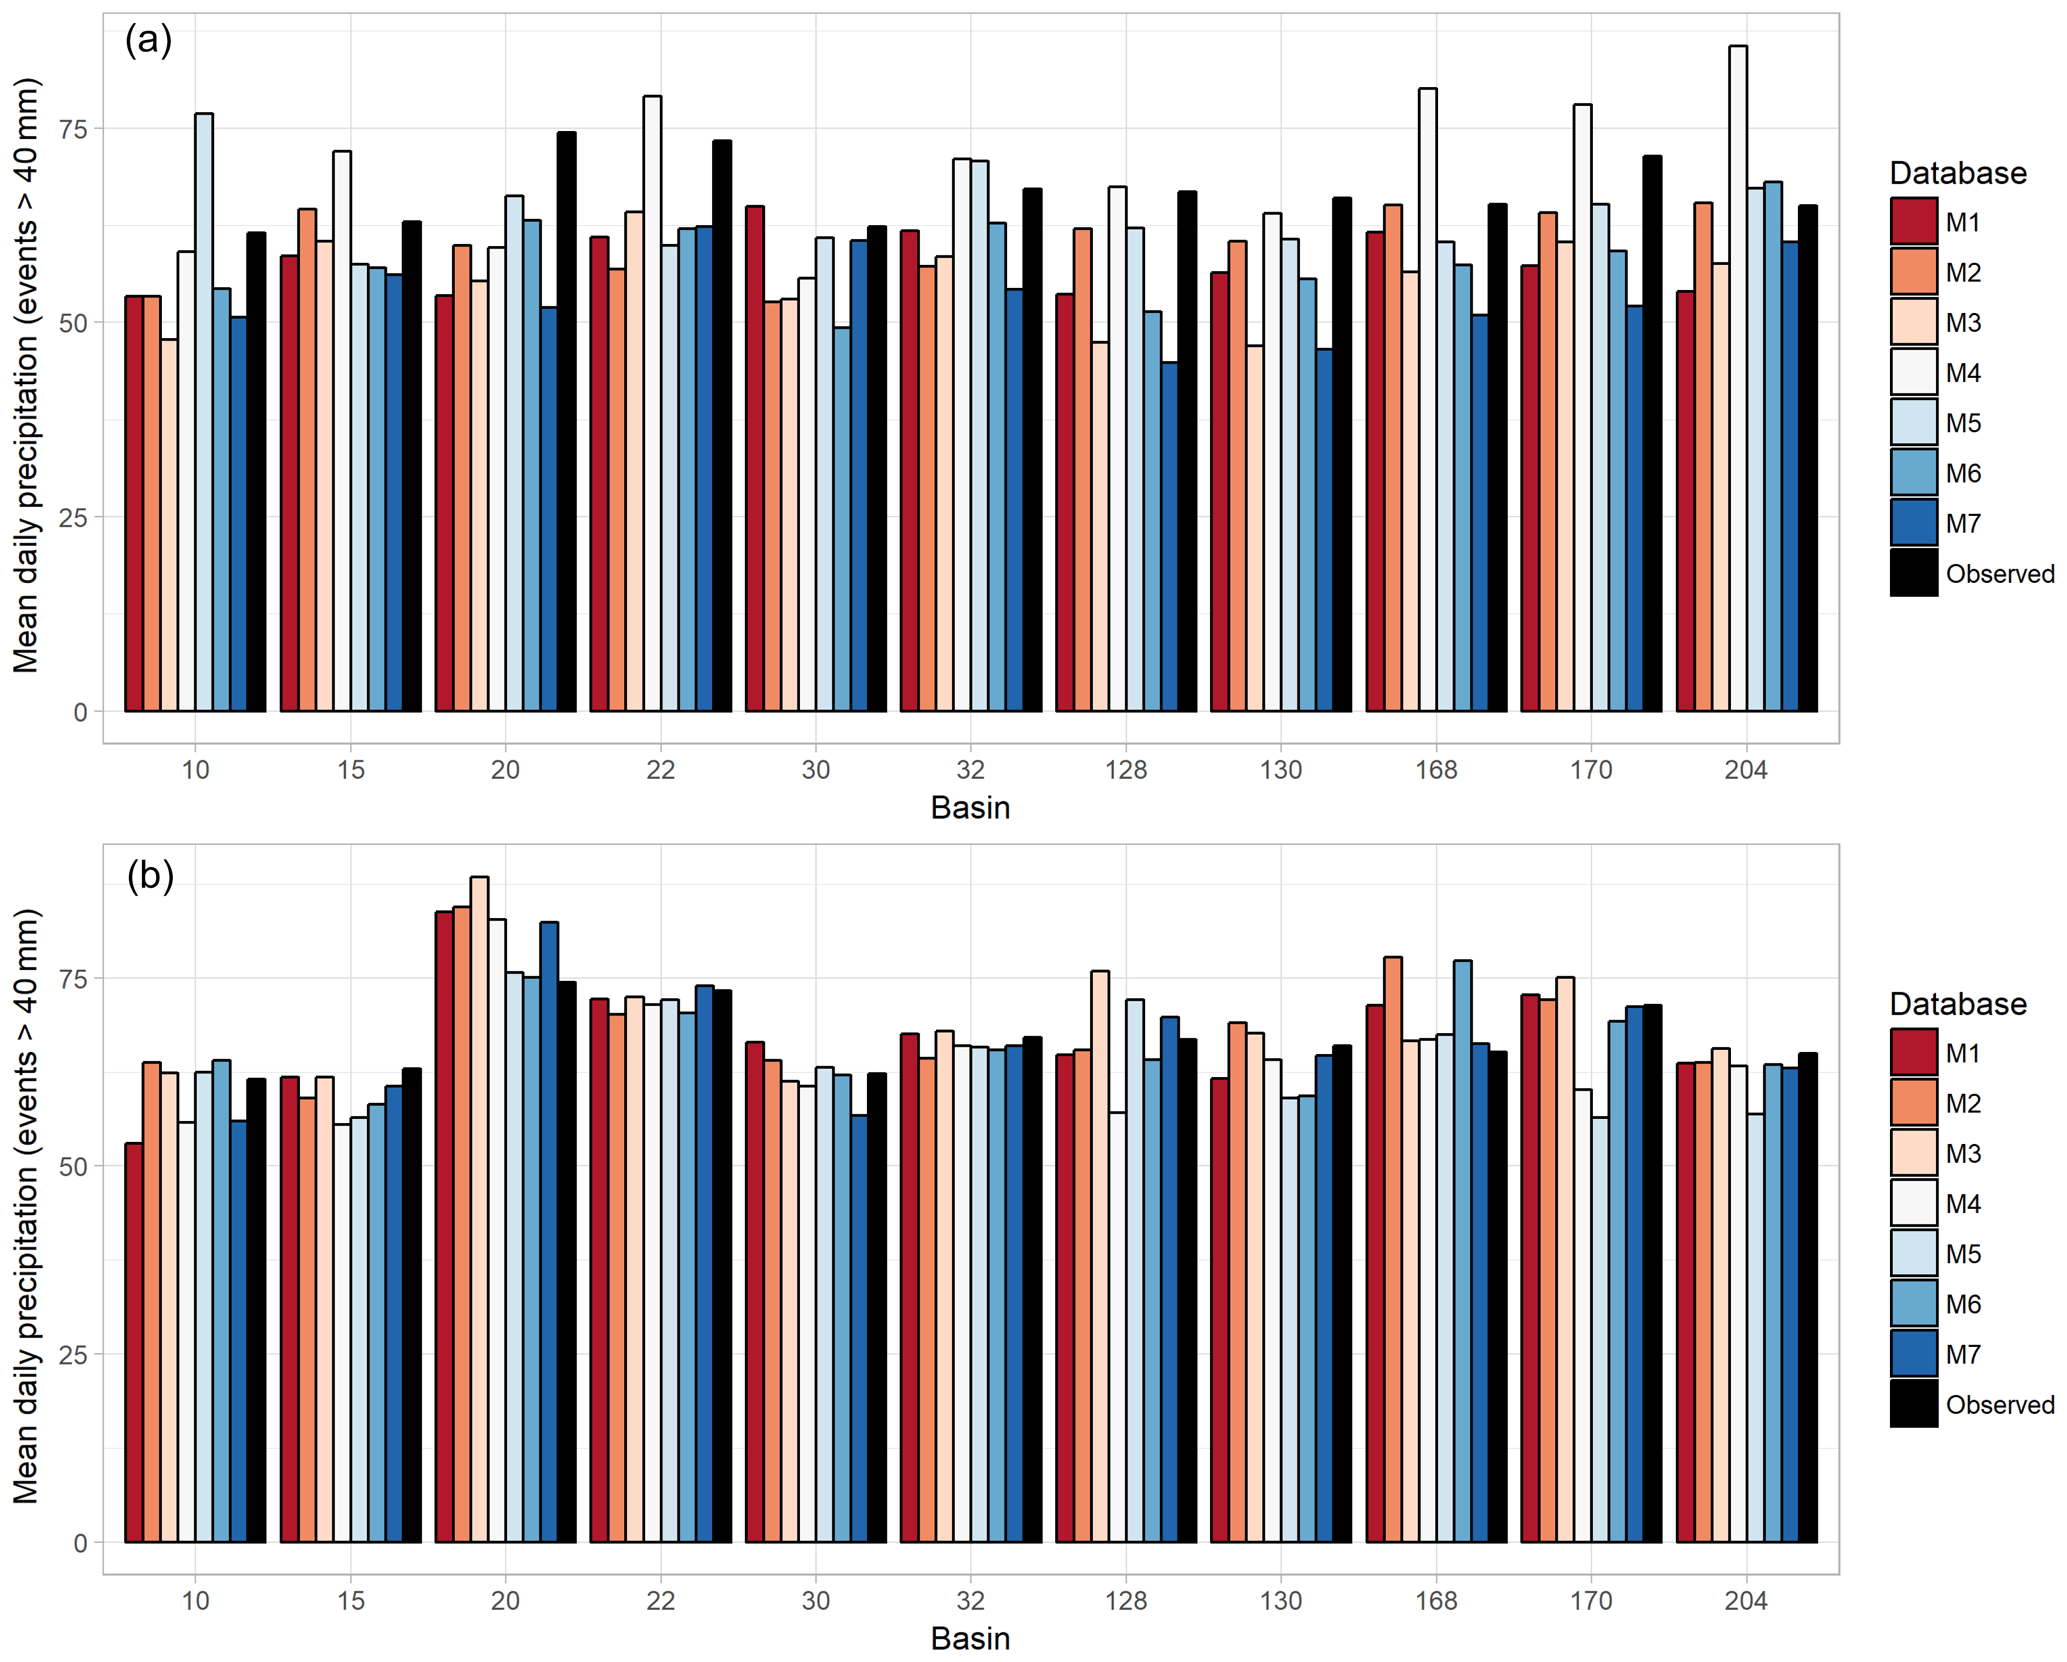
Figure 3Comparison of the mean precipitation value (cases with average daily precipitation exceeding 40 mm) for each basin of the Valencian Community between the observations and the different models with (b) and without (a) correction for the common period 1996–2005. M1 to M7 refer to the seven EURO-CORDEX simulations used (Table 1). The numbers on the x axis indicate the code of each basin (see Table A2 in the Appendix).
To select the precipitation data to be used in the analysis, we first aggregate all the time series to the river-basin level, calculating the mean of the grid cells belonging to each of the basin polygons. Then, we applied a bias correction to smooth the differences between observations and simulations. To this end, we selected the common period 1996–2005. The data from the simulations come from the historical data series of each model, while the data from the observations are the daily precipitation data from the AEMET weather stations with an effectiveness higher than 90 %. Both datasets are aggregated to the river-basin scale, using the mean value. Once the two pairs of comparable series are available for each model, the differences between them are estimated by applying a quantile-mapping bias correction method, specifically with non-parametric quantile mapping using the robust empirical quantile method (Gudmundsson et al., 2012). This method estimates the values of the quantile–quantile relation of observed and modelled time series for regularly spaced quantiles using local linear least-square regression. In order to check the suitability of the method chosen, the differences between the observations and simulations for the period 1996–2005 have been compared with and without the correction applied. This was done for the cases that recorded a mean precipitation in the basin higher than 40 mm, since it is the same sample used in the development of the model for the present climate.
Figure 3 shows an example for the Valencian Community, with a comparison between the simulations and observed precipitation for the common period 1996–2005 for the flood cases that exceeded the 40 mm d−1 precipitation threshold without (Fig. 3a) and with (Fig. 3b) the correction applied. The homogenization achieved with the bias correction process is clearly reflected in Fig. 3b.
The same bias correction method has been applied for the three future periods (1.5, 2 and 3 ∘C), using the specific correction of each basin and model. Finally, only the cases that recorded a mean precipitation in the basin higher than 40 mm d−1 were selected in order to use the same data as those that were introduced to build the damage model for the present climate (Sect. 2.3).
2.4.2 Population projections
The SSPs, together with the 2UP model (van Huijstee et al., 2018), have been used to estimate the total population of each of the basins of the study for the future projections. The main objective of the 2UP model is to disaggregate the scenario-based projected national-level urban population to 30 arcsec data and simulate urban expansion for 194 countries and territories. In order to incorporate these data into the damage model, three main processes have been applied: (i) temporal downscaling from a 10-year resolution to a yearly resolution, (ii) river-basin-level aggregation and (iii) bias correction.
For the temporal downscaling, simple linear regression has been applied in order to obtain yearly population data for each of the SSPs. The 2UP model estimates the population every 10 years from 2010 to 2080. When climate projections for the +3 ∘C scenario exceed the year 2080, the same population change coefficient for the last 10-year period (2070–2080) is applied.
After obtaining the yearly population data for all SSPs, the data were aggregated to the river-basin level by summation. Therefore, each basin will have five different yearly population series (corresponding to each SSP) from 2010 to 2084 (the last year of the precipitation simulations).
Finally, a bias correction process is also required for the population data. The year 2010 was chosen for carrying out the comparison between the population data from the observations and those from the 2UP model. Figures A1 and A2 from the Appendix show the 2010 population aggregated at the basin and region level for Catalonia and the Valencian Community, respectively. As can be observed in both cases, differences between the projections are negligible, though a significant disagreement exists with the observations. For this reason we used a scaling bias correction method to correct the population projection data. This means that the ratio for each basin and SSP between the observed and simulated population for the year 2010 were applied to the future population projections.
Therefore, after these processes, each basin has a yearly population series corrected from 2010 to 2084 for the five SSPs.
After both precipitation and population data for future scenarios have been corrected, the model developed for the present climate is used to estimate the probability of a damaging event in the future. Since the number of flood events and their nature in the future are unknown, the average model has been applied for the prediction.
3.1 Present climate
3.1.1 Catalonia
We applied the generalized linear mixed model to all the flood events that affected Catalonian basins within 1996–2015, which resulted in a total of 596 flood cases, 177 of which recorded an average precipitation in the basin higher than 40 mm.
The regression coefficients for all the percentiles of damage obtained by applying the GLMM are given in Table 3. In all cases both of the predictors have positive values, showing that the probability of a damaging event increases not only with precipitation recorded in 24 h but also with the population of the basin.
Table 3Parameters of the generalized linear mixed model and the area under the ROC curve (RAIN: in-sample validation; RAOUT: out-of-sample validation) values for all the percentiles of damage for Catalonia. β0, β1 and β2 represent the regression coefficients of the model (intercept, precipitation and population, respectively). * shows the non-significant regression coefficients (p value > 0.05).
The formula considering the 70th percentile of damage is shown as an example in Eq. (4):
where π is the probability of exceeding the 70th percentile of damage (in this case), P is the mean precipitation accumulated in the basin in 24 h, R is the total population of the basin, and bi and bj are the random effects related to the basin and the flood event.
Both precipitation and population are statistically significant, meaning that they are useful variables for explaining the probability of exceeding the 70th percentile of damage (EUR 0.38 M). This can be observed in the examples in Fig. 4, which show the effect of each explanatory variable in the case of probability exceeding the 70th percentile of damage. For both variables, this probability increases rapidly. However, in the case of population a break point can be observed around 0.5 million people, above which the rate of increase is much lower.
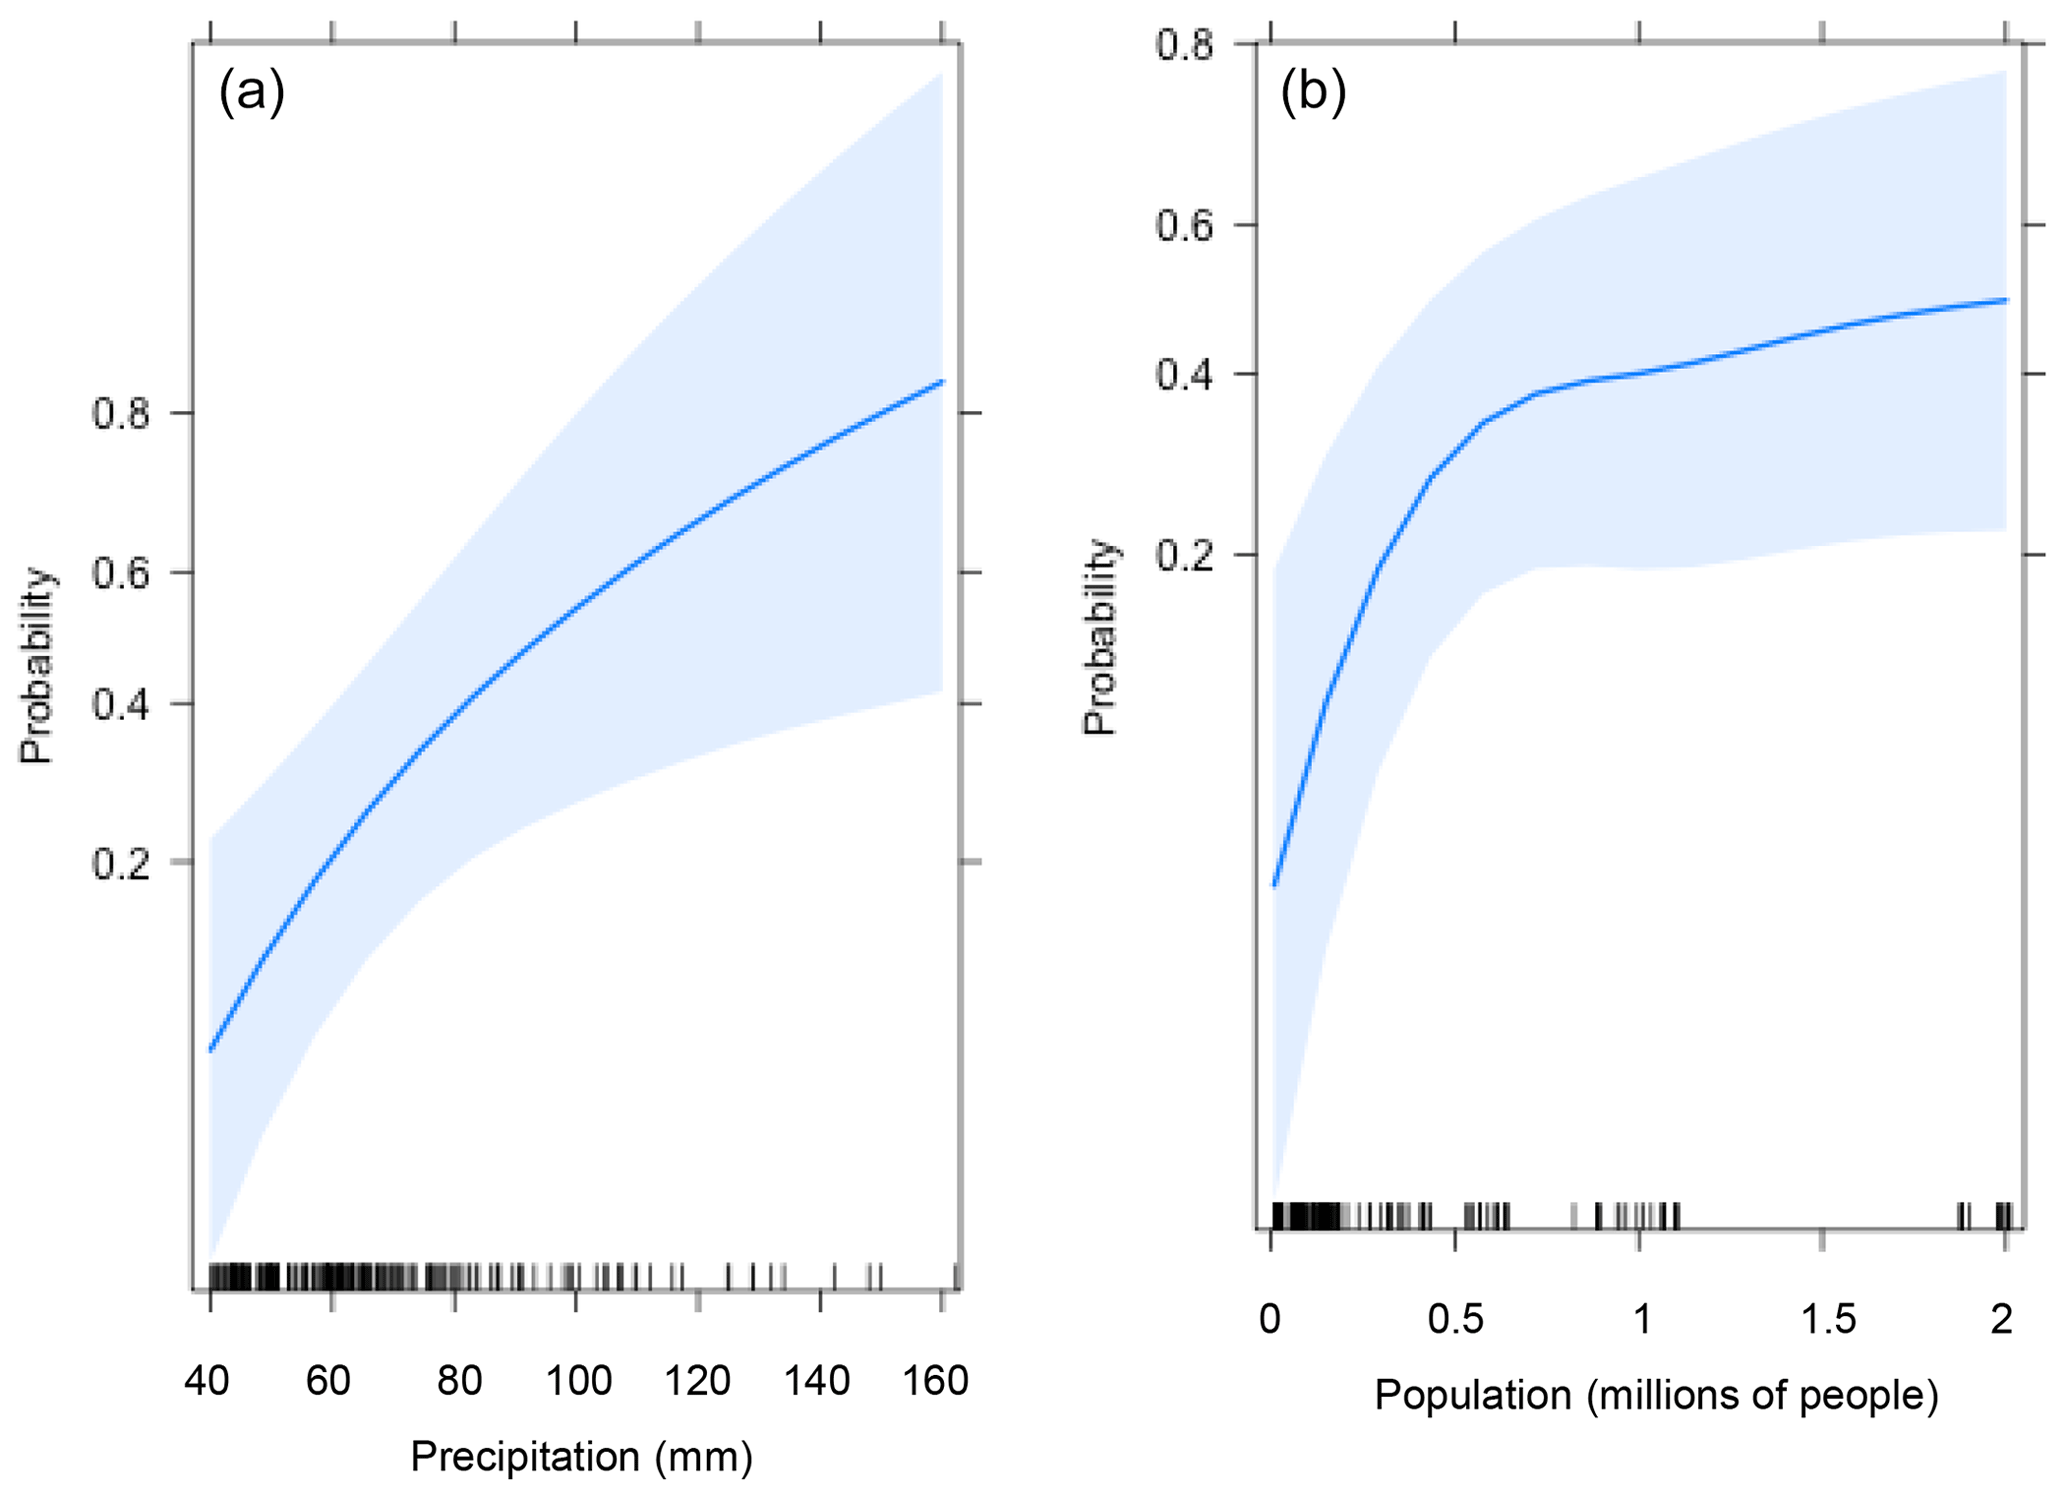
Figure 4Effect of the explanatory variables (a: mean precipitation recorded in 24 h; b: total population of the basin) on the probability of exceeding the 70th percentile of damage in Catalonia. The solid line indicates the best estimate, while the shaded blue bands indicate the 95 % confidence interval. The black marks at the bottom of each graph represent the values of the independent variable for each flood case.
The area under the ROC curve (RA) has been used to validate the model, since it is a useful measure for summarizing the skill of a model. RA ranges from 0 for a forecast with no hits and only false alarms to 1 for a perfect forecast. Models with an RA above 0.5 have more skill than random forecasts. Figure B1 (Appendix) shows the ROC diagrams for the example shown in Equation 4, when using both in and out-of-sample validation. RA values (RAIN=0.95 and RAOUT=0.89) indicate that our model has good fit to simulate the probability of a damaging event (defined as the 70th percentile of damage in this case). In this example, with respect to in-sample validation, if the user wants to maximize the difference between the hit rate (0.94) and the false-alarm rate (0.17), a probability value of 0.22 is needed (which we called best threshold). The RA indicators for the different damage percentiles used are presented in Table 3, with values close to 1 for all the cases.
3.1.2 Valencian community
The same analysis has been carried out for the Valencian Community region, which was affected by 69 flood events between 1996 and 2015, resulting in 171 flood cases (72 if we take into account only the cases where the mean precipitation accumulated in 24h in the basin exceeded the threshold of 40 mm d−1).
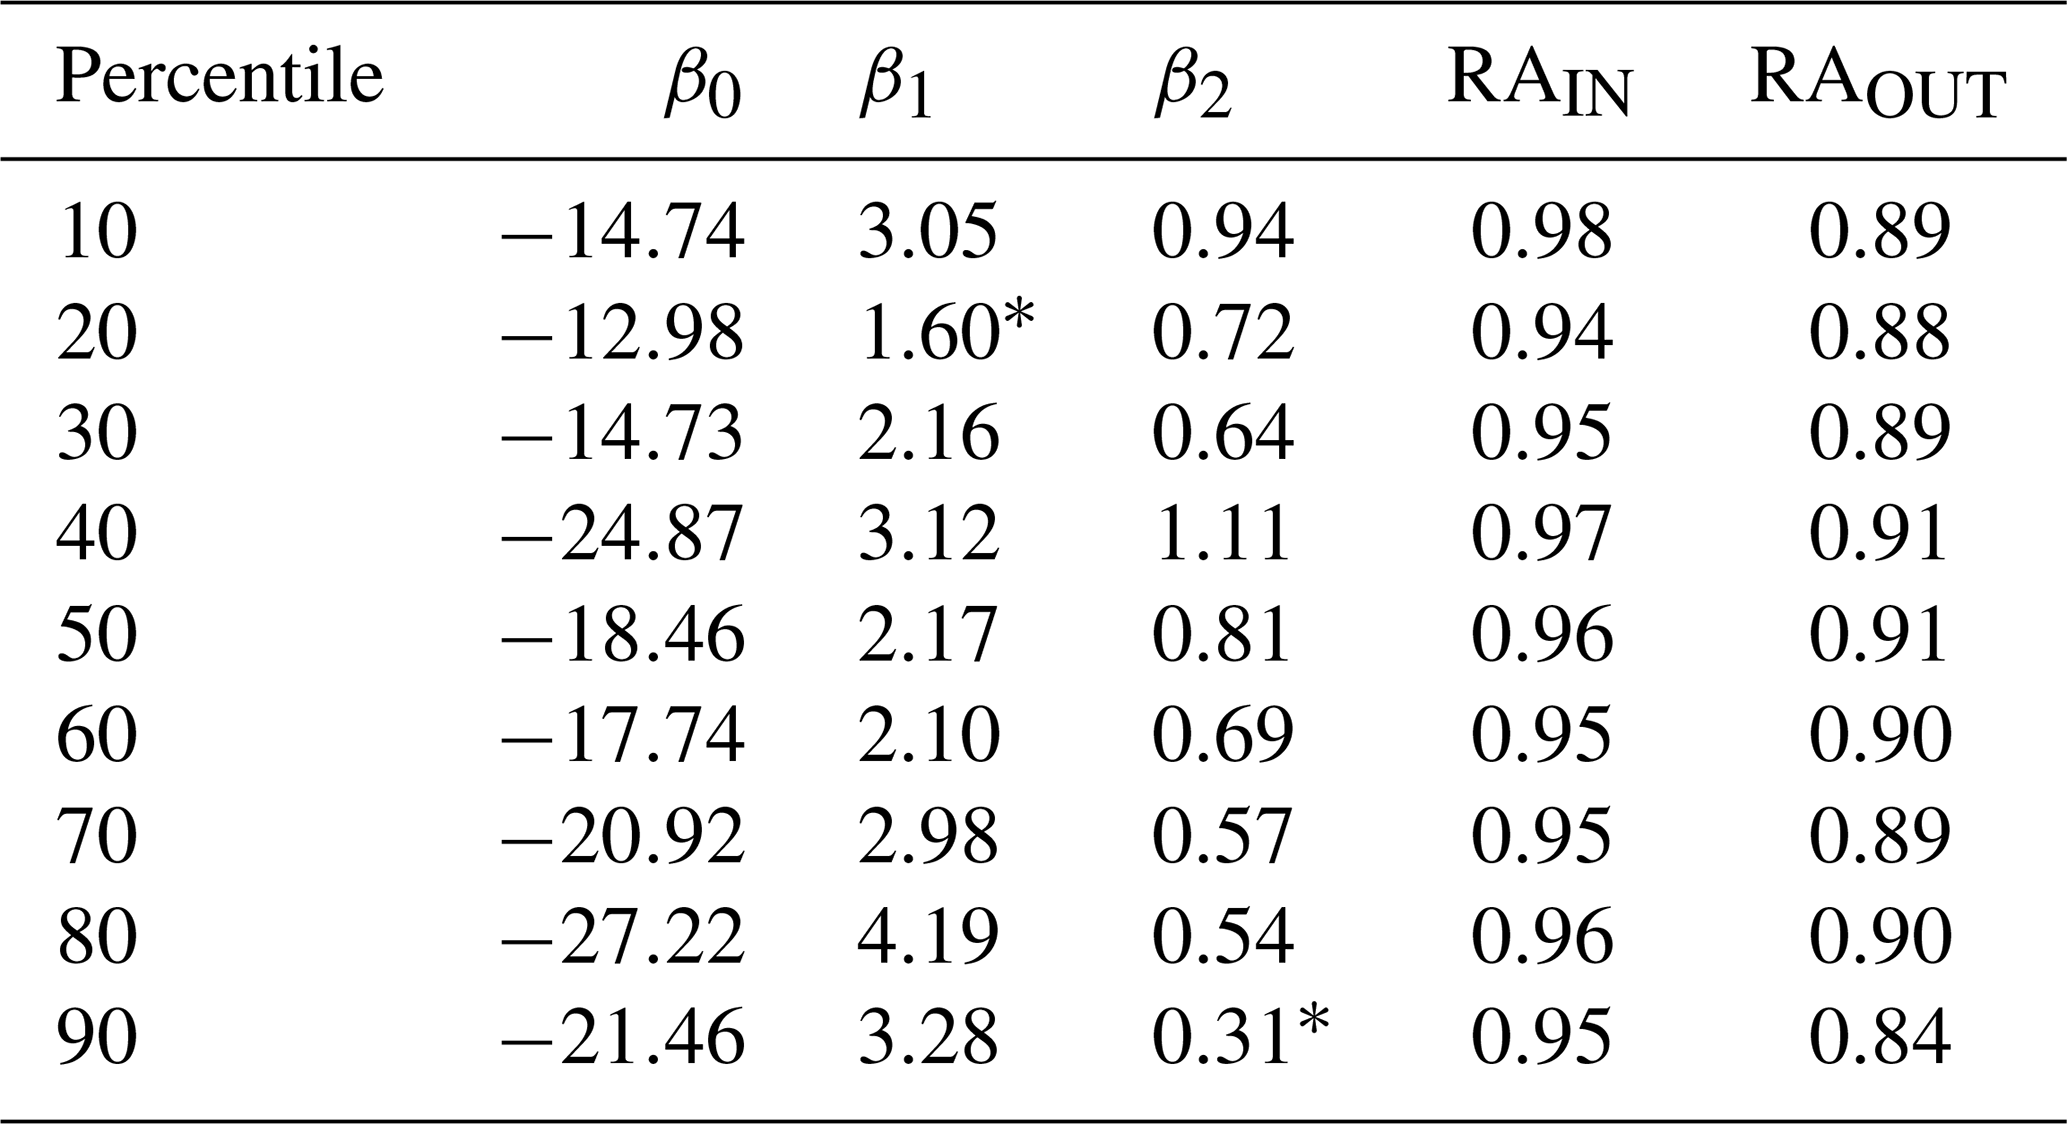
Table 4 shows the regression coefficients for all the damage percentiles used. As in the case of Catalonia (Sect. 3.1.1), both mean precipitation accumulated in 24 h and the total population of the basin are statistically significant predictors and have positive regression coefficients for all the cases.
As an example, the model follows Eq. (5) when the damaging event is defined using the 70th percentile of damage:
Figure 5 corroborates these results, showing the effect of precipitation (Fig. 5a) and population (Fig. 5b) on the probability of exceeding the 70th percentile of damage. In both cases this relationship is described by a concave curve, indicating that the increase in the probability per unit of increase in the predictor is larger when considering lower predictor values.
Table 4Parameters of the generalized linear mixed model and the area under the ROC curve (RAIN: in-sample validation; RAOUT: out-of-sample validation) values for all the percentiles of damage for the Valencian Community. β0, β1 and β2 represent the regression coefficients of the model (intercept, precipitation and population, respectively). In this case, all the regression coefficients are statistically significant (p value < 0.05).
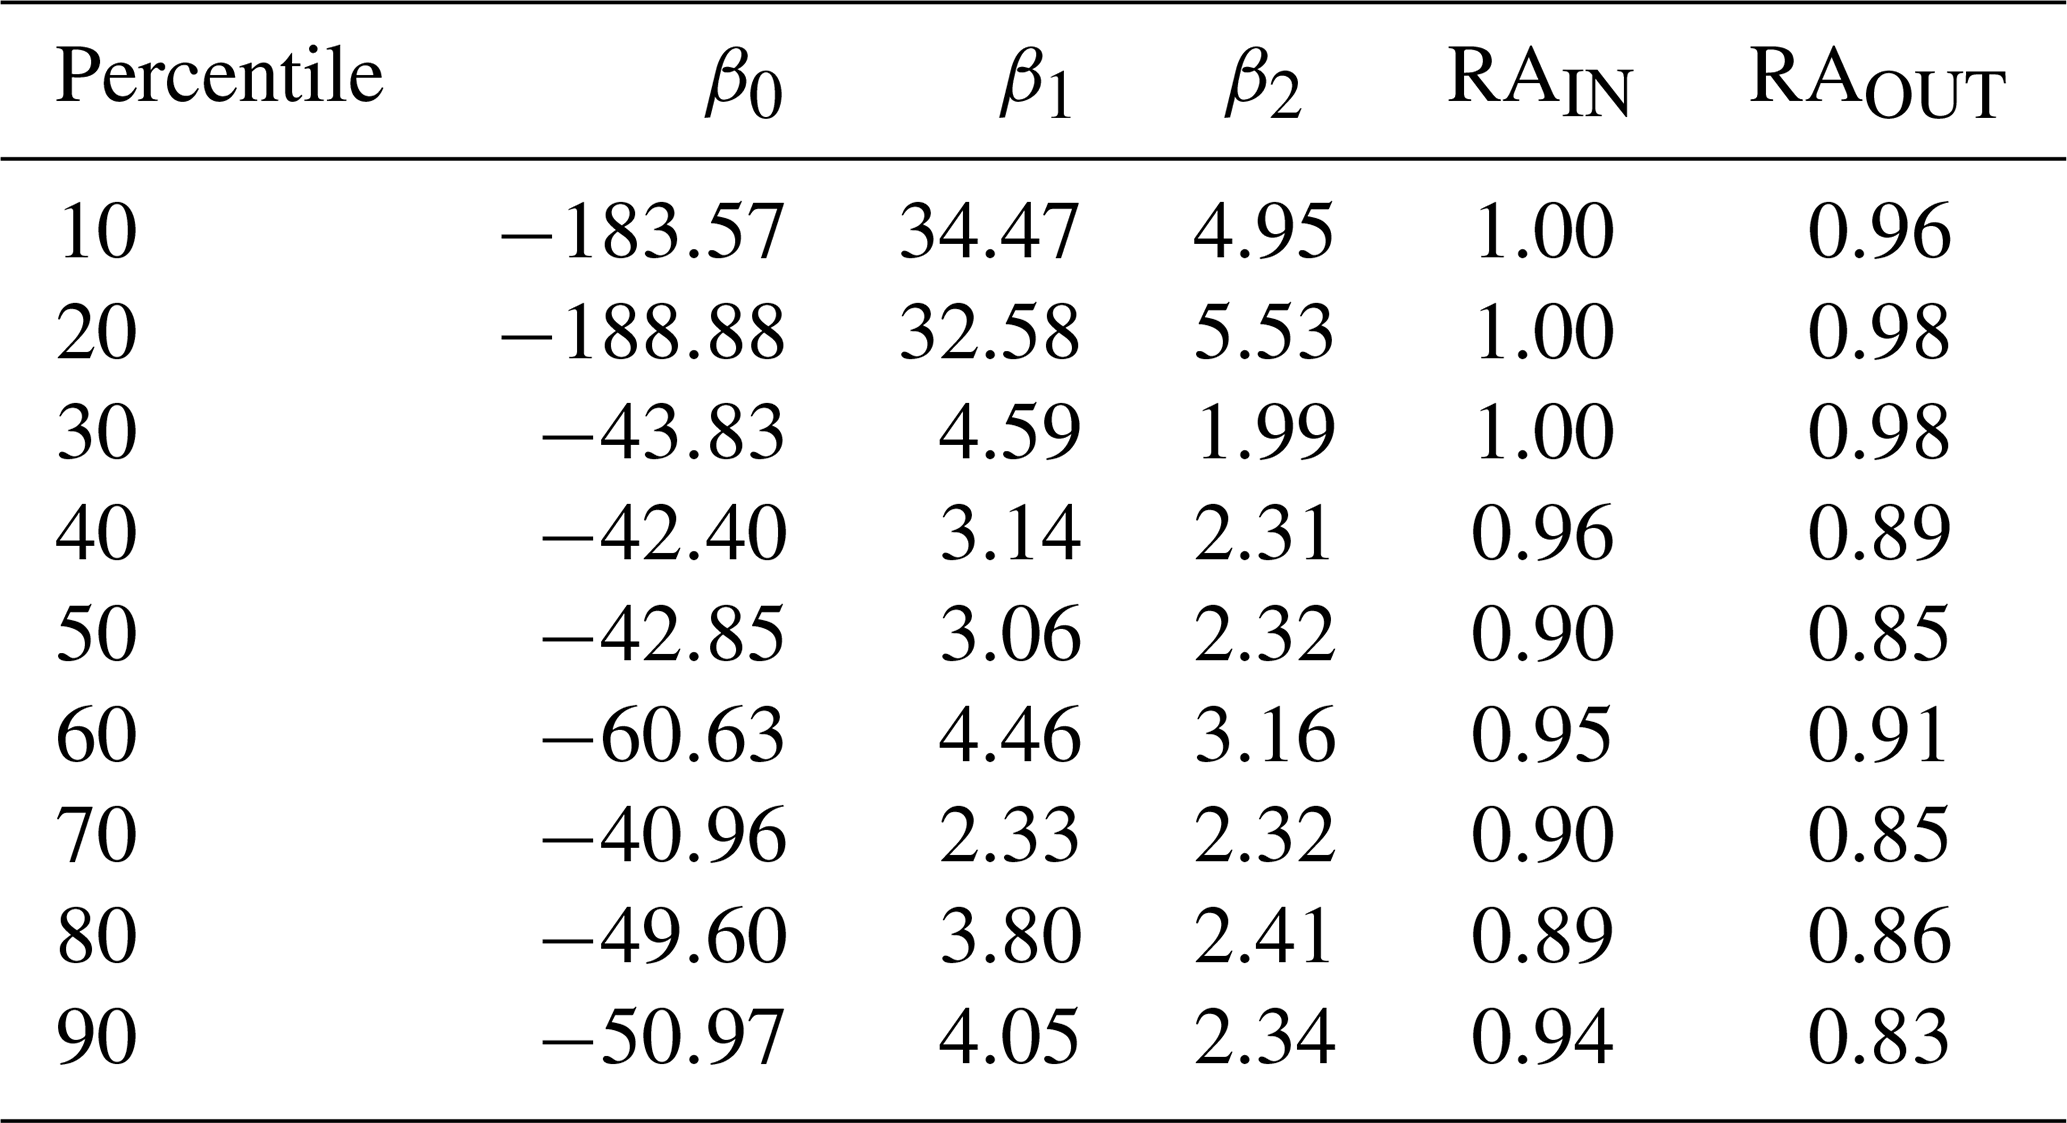
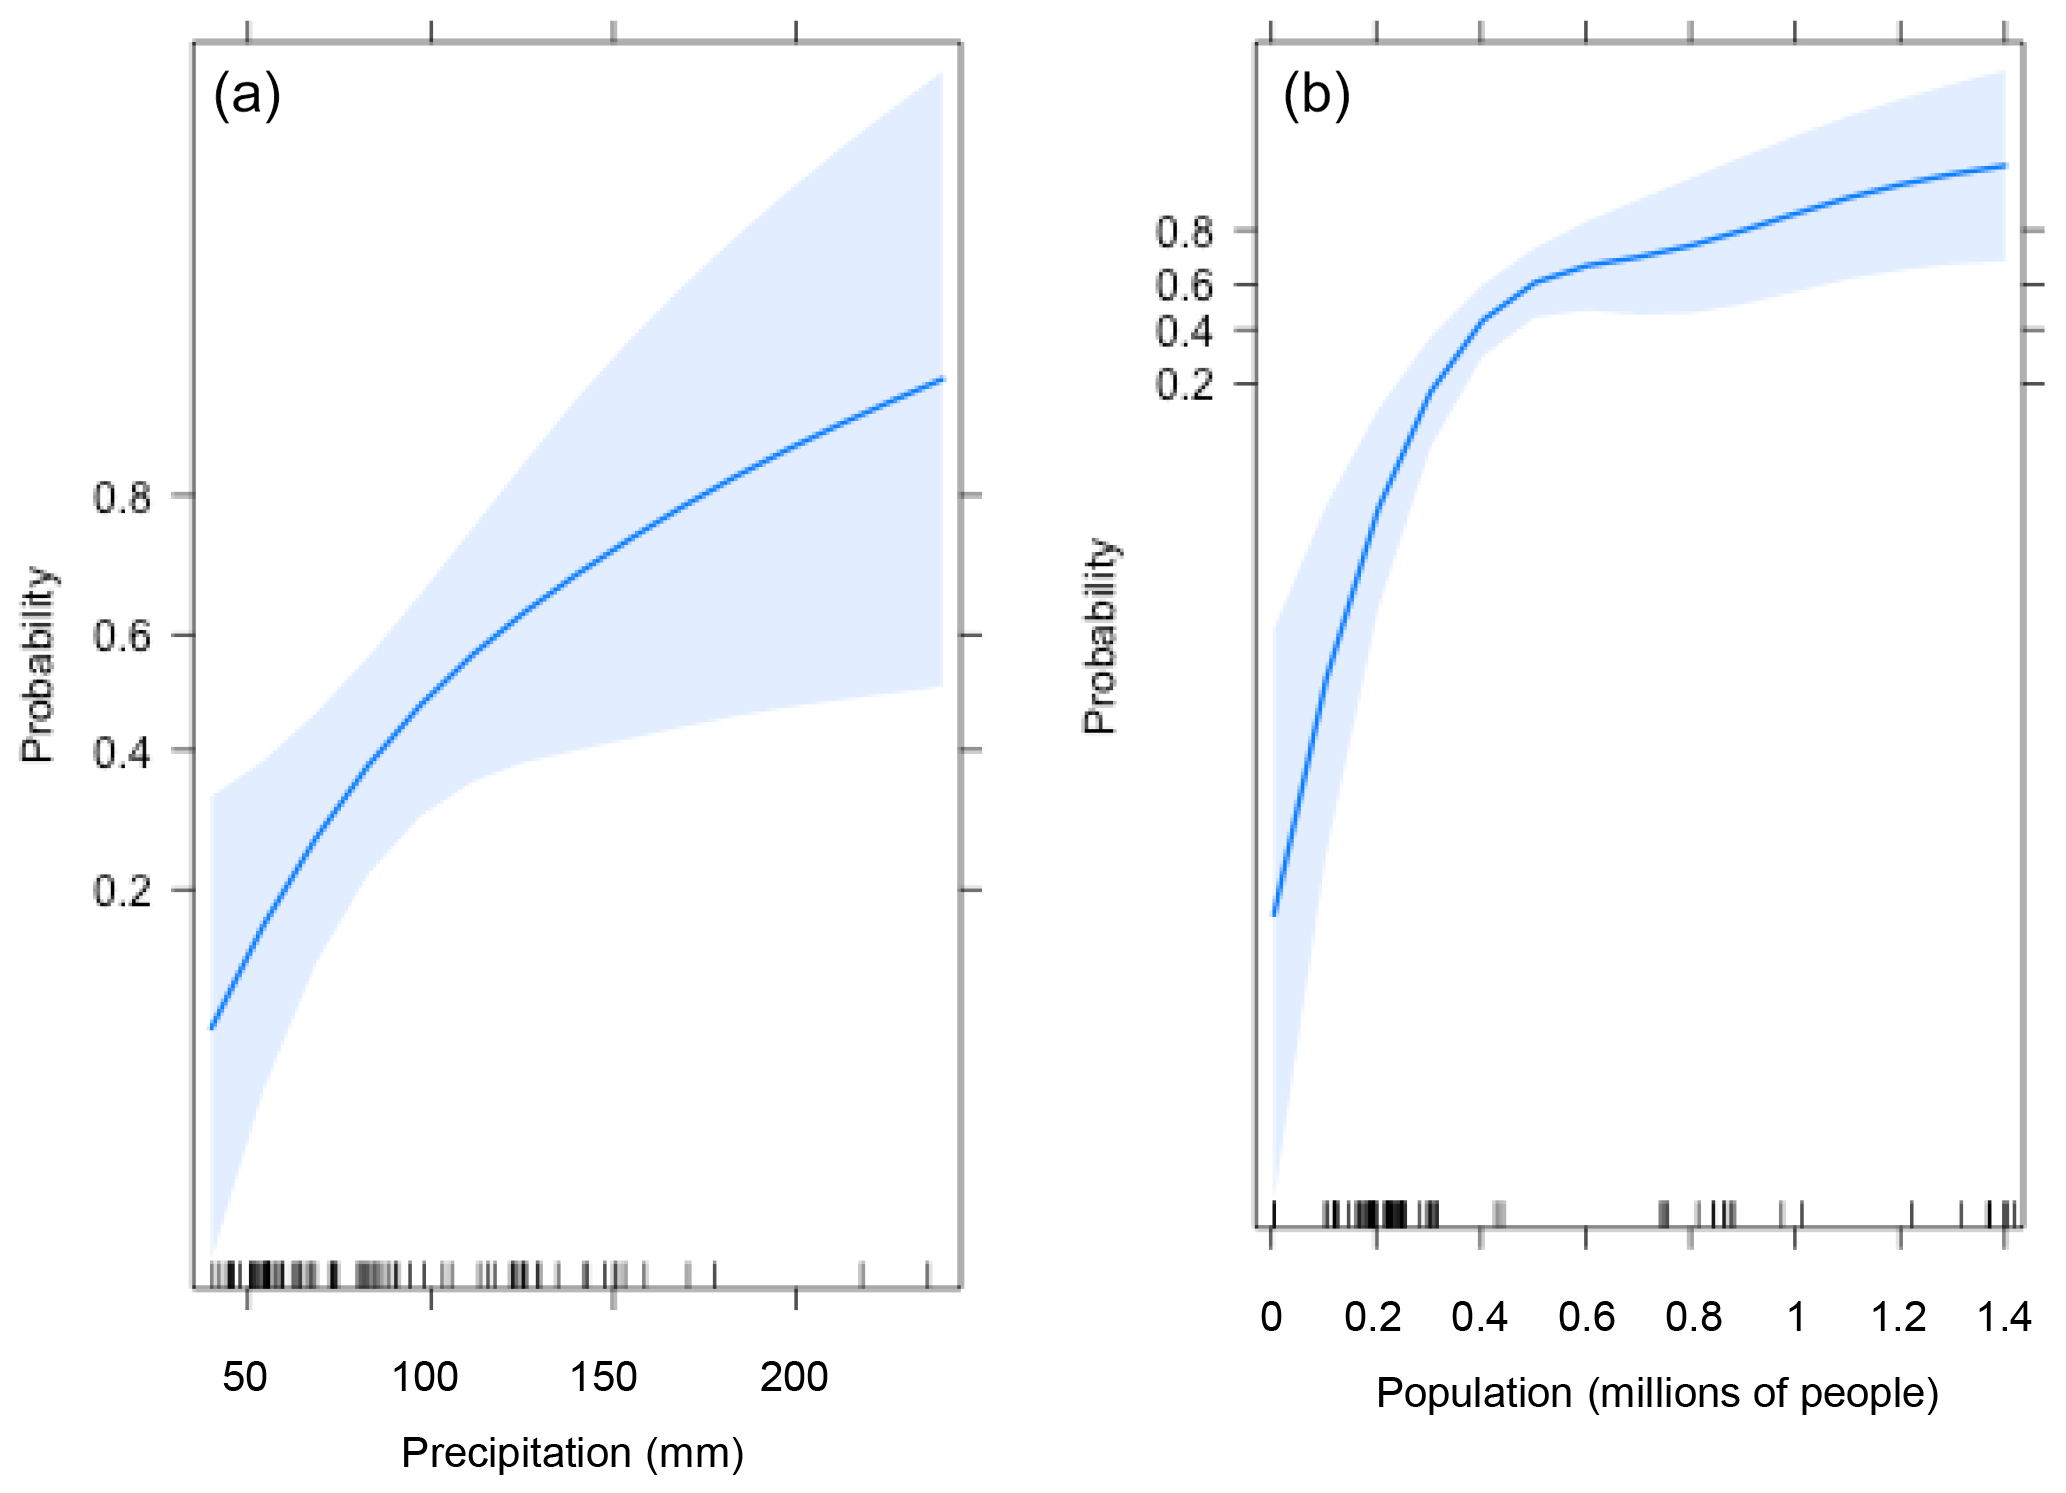
Figure 5Effect of the explanatory variables (a: mean precipitation recorded in 24 h; b: total population of the basin) on the probability of exceeding the 70th percentile of damage in the Valencian Community. The solid line indicates the best estimate, while the shaded blue bands indicate the 95 % confidence interval. The black marks at the bottom of each graph represent the values of the independent variable for each flood case.
The shaded blue bands of Fig. 5 show the confidence level of the prediction at 95 %. In this case, these bands are narrower than in the Catalonia case (see Fig. 4), showing that the model estimation is more precise for the Valencian Community region. Figure B2 (Appendix) displays the ROC diagrams for the example of Eq. (5), demonstrating that the model has a significant goodness of fit with high RA values for both validation methods used (RAIN=0.9 and RAOUT=0.85). As shown in Table 4, the model has good performance for all the damage percentiles, with RA values close to 1 in all cases.
In this section we have shown that precipitation is a key factor in explaining the damage caused by flood events in regions in which water surface floods are the main type of flood, as is the case in the Mediterranean region of study. Studies like Zhou et al. (2013) and Torgersen et al. (2015) also apply regression models to observe the relationship between different precipitation observation measures and the compensation paid by insurance companies. In both studies, a good correlation is observed between these two variables in the case of surface water floods, and it is shown that it is feasible to build models that explain the costs of damage as a simple function of precipitation (Zhou et al., 2013). Moreover, the incorporation of population data in the model, with statistically significant and positive relationships with damage, has shown the importance of considering the exposure of the territory in flood risk analysis. Saint Martin et al. (2016) have also shown the benefits of including indicators that explain the exposure to assess the risk of flood-related damage in real time in French Mediterranean basins.
Our findings also align with the results of previous studies (Spekkers et al., 2013; Zhou et al., 2013; Wobus et al., 2014; Torgersen et al., 2015) and further indicate that insurance databases are a promising source for flood-damage assessment at the local (Garrote et al., 2016; Le Bihan et al., 2017; Zischg et al., 2018; Zhou et al., 2013) and regional scale (Barredo et al., 2012; Kim et al., 2012; Wobus et al., 2014; Zhou et al., 2017). However, using insurance data as a unique source for defining flood damage leads to only considering the direct and tangible damage. Indirect damage is more difficult to calculate, and few studies take it into account (Elmer et al., 2010), especially at the regional scale (Przyluski and Hallegatte, 2011). In spite of this, some exhaustive studies can be found in the literature that incorporate indirect damage indicators such as, for example, the loss of working hours (Petrucci and Llasat, 2013) or the number of fire service operations done in flooded properties (Papagiannaki et al., 2015).
3.2 Future model
The results presented in this section are divided into three parts. In the first and second part, the data obtained from the precipitation projections (Sect. 3.2.1) and population scenarios (Sect. 3.2.2) are analysed. Then, the last part (Sect. 3.2.3) shows the results obtained by applying the models developed in Sect. 3.1 using the data from the projections. Therefore, in the last part, the probability of a damaging event is estimated for global warming of 1.5, 2 and 3 ∘C and taking into account different socioeconomic scenarios.
3.2.1 Extreme precipitation projections
Figure 6 shows the ensemble mean of the relative changes in the total annual precipitation (Fig. 6a–c) and the number of days with daily precipitation higher than 40 mm (Fig. 6d–f) for the entire Iberian Peninsula and for global warming of 1.5, 2 and 3 ∘C above pre-industrial levels.
Results show a general decrease in the total annual precipitation in most of the Iberian Peninsula, especially in the central and southern part. The decrease becomes larger with higher levels of global warming. This pattern is also observable in other studies of the Mediterranean region (Jacob et al., 2014; Cramer et al., 2018; Sillmann et al., 2013; Rajczak and Schär, 2017; Turco et al., 2017). For example, Kjellström et al. (2018) found an increase in mean precipitation in the north of Europe but a reduction in the south, especially during summer months. In addition, they found a likely decrease in the mean precipitation with global warming in mountain regions, such as the Pyrenees and Cantabrian Mountains. In terms of extremes, our results show projected increases in the number of days with daily precipitation exceeding 40 mm in the centre, north and north-west of the region (Fig. 6d–f). This is also in line with other studies on projections of extreme precipitation in the region (Drobinski et al., 2018; Colmet-Daage et al., 2018; Tramblay and Somot, 2018; Cramer et al., 2018), which show a likely increase in the extreme precipitation events in Europe and the Mediterranean area with increasing global temperature, mostly during the winter months (Kjellström et al., 2018; Vautard et al., 2014; Rajczak and Schär, 2017; Jacob et al., 2014).

Figure 6Ensemble mean of the relative changes of total annual precipitation (a–c) and number of days with daily precipitation more than 40 mm (d–f) for 1.5, 2 and 3 ∘C global warming levels (columns) at annual scale. Dotted areas indicate where at least 50 % of the simulations show a statistically significant change and more than 66 % agree on the direction of the change. Coloured areas (without dots) indicate that changes are small compared to natural variations, and white regions (if any) indicate that no agreement between the simulations is found (similar to Tebaldi et al., 2011).
Figure 7 shows the change (in %) of the mean 24 h precipitation, averaged across all basins, in the future simulations compared to the reference period (1976–2005), when taking into account the cases that overpassed the 40 mm d−1 precipitation threshold for the different models and warming periods (global warming at 1.5, 2 and 3 ∘C). In the case of Catalonia (Fig 7a), most of the models and warming periods show an increase in the mean daily precipitation with the exception of Model 3 (EC-EARTH-RCA4), which projects a decrease for the 2 ∘C global warming level. Most of the models (four out of seven) indicate greater precipitation values when the highest warming level is taken into account (3 ∘C), agreeing with several studies that point to an increase in precipitation extremes with global warming (Drobinski et al., 2018; Colmet-Daage et al., 2018; Tramblay and Somot, 2018; Cramer et al., 2018).
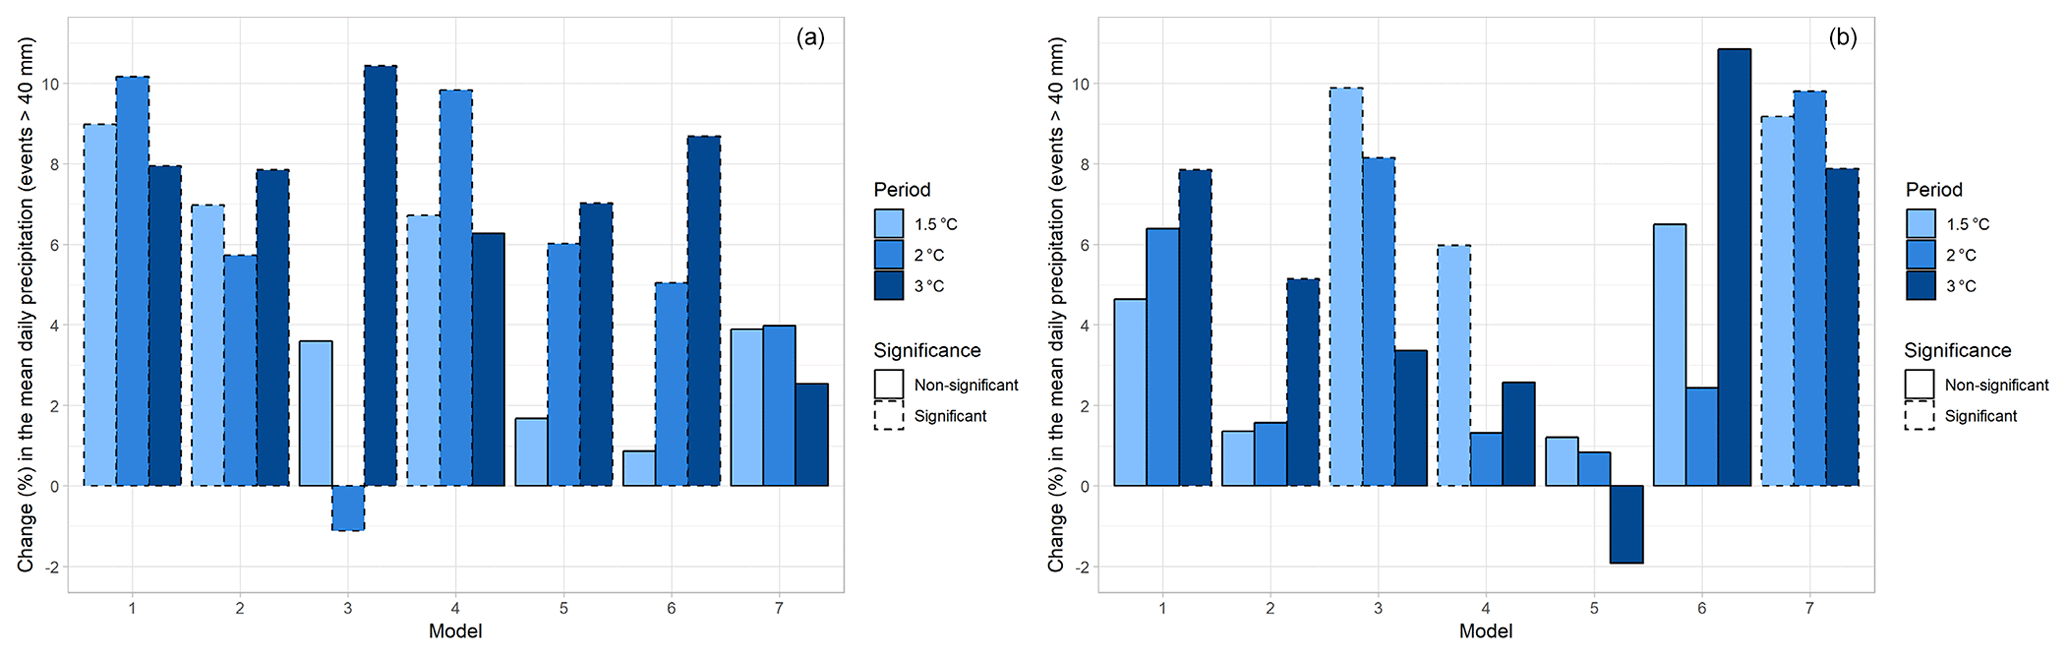
Figure 7Change in the mean daily precipitation compared to the reference period (1976–2005) for cases exceeding the 40 mm d−1 threshold for the seven models and the three levels of warming in Catalonia (a) and the Valencian Community (b). Dashed hatching around bars indicates significant changes (p value < 0.05; Mann–Whitney test) with respect to the reference period.
In the case of the Valencian Community region, the change in the mean daily precipitation for the future periods is lower (Fig. 7b). However, apart from one case which is non-significant (3 ∘C; Model 5: MPI-ESM-LR-CCLM4-8-17), all the models and periods show an increase in the mean precipitation of the basin when the events with daily precipitation exceeding the 40 mm are taken into account. In this case, there is no clear pattern of larger increases in extreme precipitation with higher warming levels.
The greater positive changes in precipitation values in the case of Catalonia were expected if we take into account the results shown in Fig. 6. The east of the Iberian Peninsula (where the Valencian Community is placed) presents a greater decrease in both annual precipitation and in the number of days with daily precipitation higher than 40 mm in comparison to the north-eastern part (Catalonia). Nevertheless, from these results we can conclude that heavy daily precipitation is likely to increase with global warming in both regions of study.
3.2.2 Population projections
The SSPs describe plausible alternative changes in aspects of society such as demographic, economic, technological, social, governance and environmental factors (O'Neill et al., 2017). The SSPs are based on five narratives describing alternative socioeconomic developments, including sustainable development (SSP1), middle-of-the-road development (SSP2), regional rivalry (SSP3), inequality (SSP4) and fossil-fuelled development (SSP5) (Riahi et al., 2017).
Figure 8 shows the projections in the population in each entire region of study (Fig. 8a: Catalonia; Fig. 8b: Valencian Community) after applying the data treatment processes explained in Sect. 2.4.2.
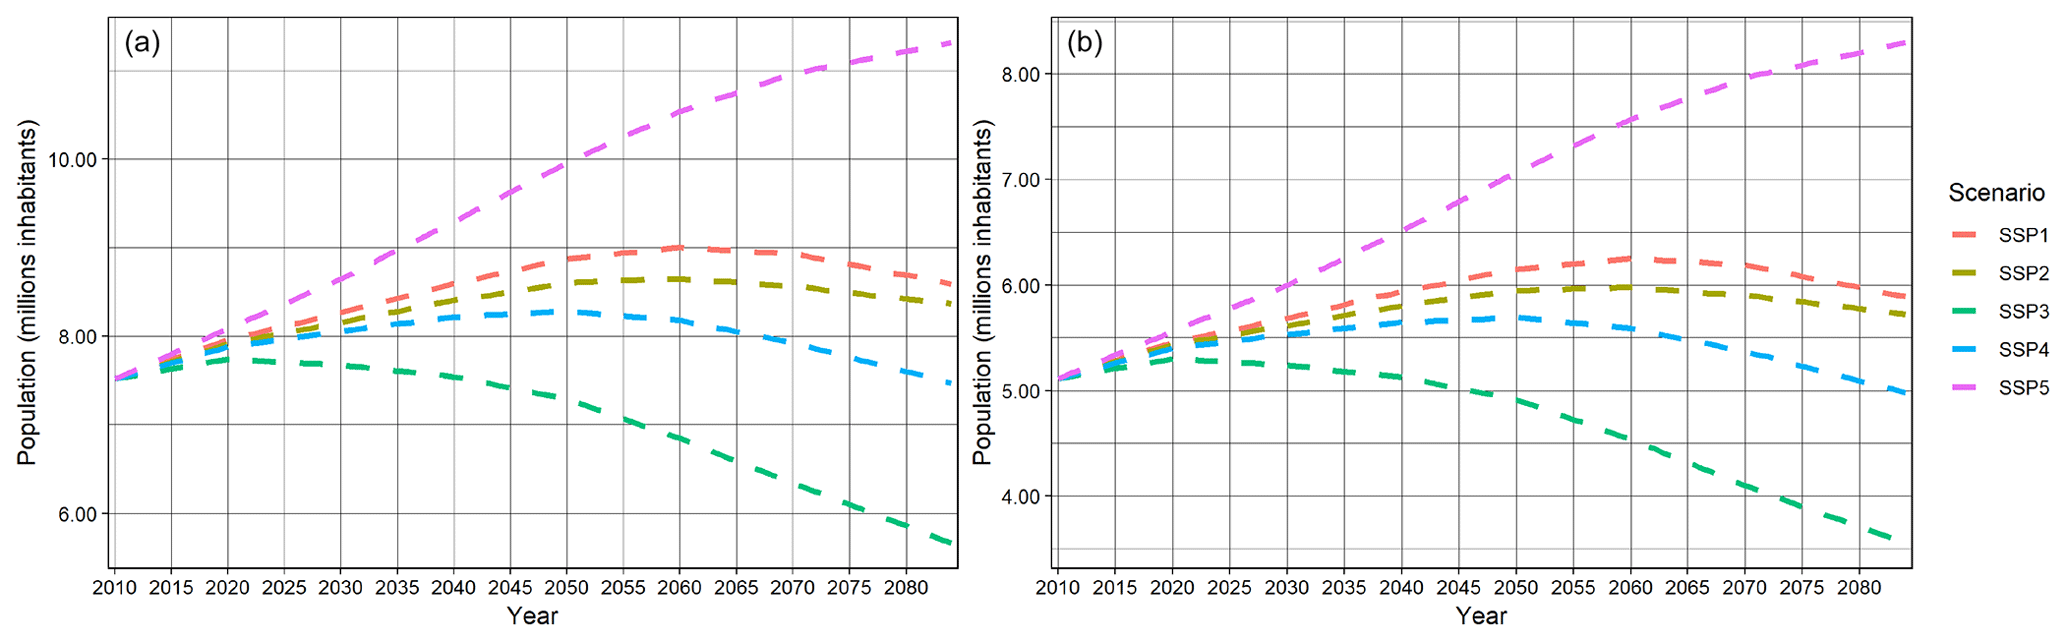
Figure 8Future population projections for the different SSPs in Catalonia (a) and the Valencian Community (b).
For both regions, the largest increase in population is in SSP5, with population growth around 50 % for Catalonia and 62 % for the Valencian Community by the end of the 21st century with respect to 2010. SSP5 is defined by the push for economic and social development coupled with the exploitation of abundant fossil fuel resources and the adoption of resource and energy intensive lifestyles around the world (O'Neill et al., 2017). Though fertility declines rapidly in developing countries, fertility levels in high-income countries are relatively high. For this reason, despite being the scenario that projects the second lowest population by the end of the 21st century in terms of global population (Samir and Lutz, 2017), in our region of study it projects the highest increase (high-income economy).
On the other hand, SPP3 depicts the largest decrease in the total population in Catalonia and the Valencian Community, with a reduction of 25 % and 30 %, respectively. In this scenario low population growth is expected in industrialized countries, while a high increase can be found in developing countries (O'Neill et al., 2017). This explains the difference between the results found in studies such as Samir and Lutz (2017), in which the highest global population expected growth is found for this scenario.
SSP5 assumes a society that keeps relying heavily on fossil fuels. This implies that we may expect high emissions, and therefore the combination with RCP8.5 (the only RCP used in this study) is very plausible. For this reason, the main results of this study will focus on the RCP8.5–SSP5 combination. However, some analysis will also be performed considering all the SSPs in order to show the differences between the socioeconomic projections (see Sect. 3.2.3).
3.2.3 Future probability of damaging events
Finally, changes in the probability of damaging events for both regions have been assessed when considering global warming of 1.5, 2 and 3 ∘C. In this case, only three damage percentiles (50th, 60th and 70th) were selected for defining a “large damaging event”. Figure 9 shows the change in this probability for Catalonia for all the three percentiles of damage and taking into account the mean precipitation recorded in 24 h and the population considering the SSP5 socioeconomic scenario. As can be observed, this probability increases with respect to the reference period (1976–2005) for all the models and warming periods. The increase is higher when greater warming is considered in most of the cases (the increase is usually larger with 3 ∘C than with 1.5 and 2 ∘C), which emphasizes the importance of limiting global warming as much as possible. Furthermore, the increase in probability is greater for higher percentiles of damage.
Table 5Change in the probability of a damaging event in Catalonia for the 70th damage percentile and the three warming periods with the mean 24 h precipitation as explanatory variable (left) and mean 24 h precipitation and population (SSP5) as explanatory variables (right). The marked cells show statically significant (p value < 0.05) increases (bold) and decreases (italic) in relation to the reference period (1976–2005).
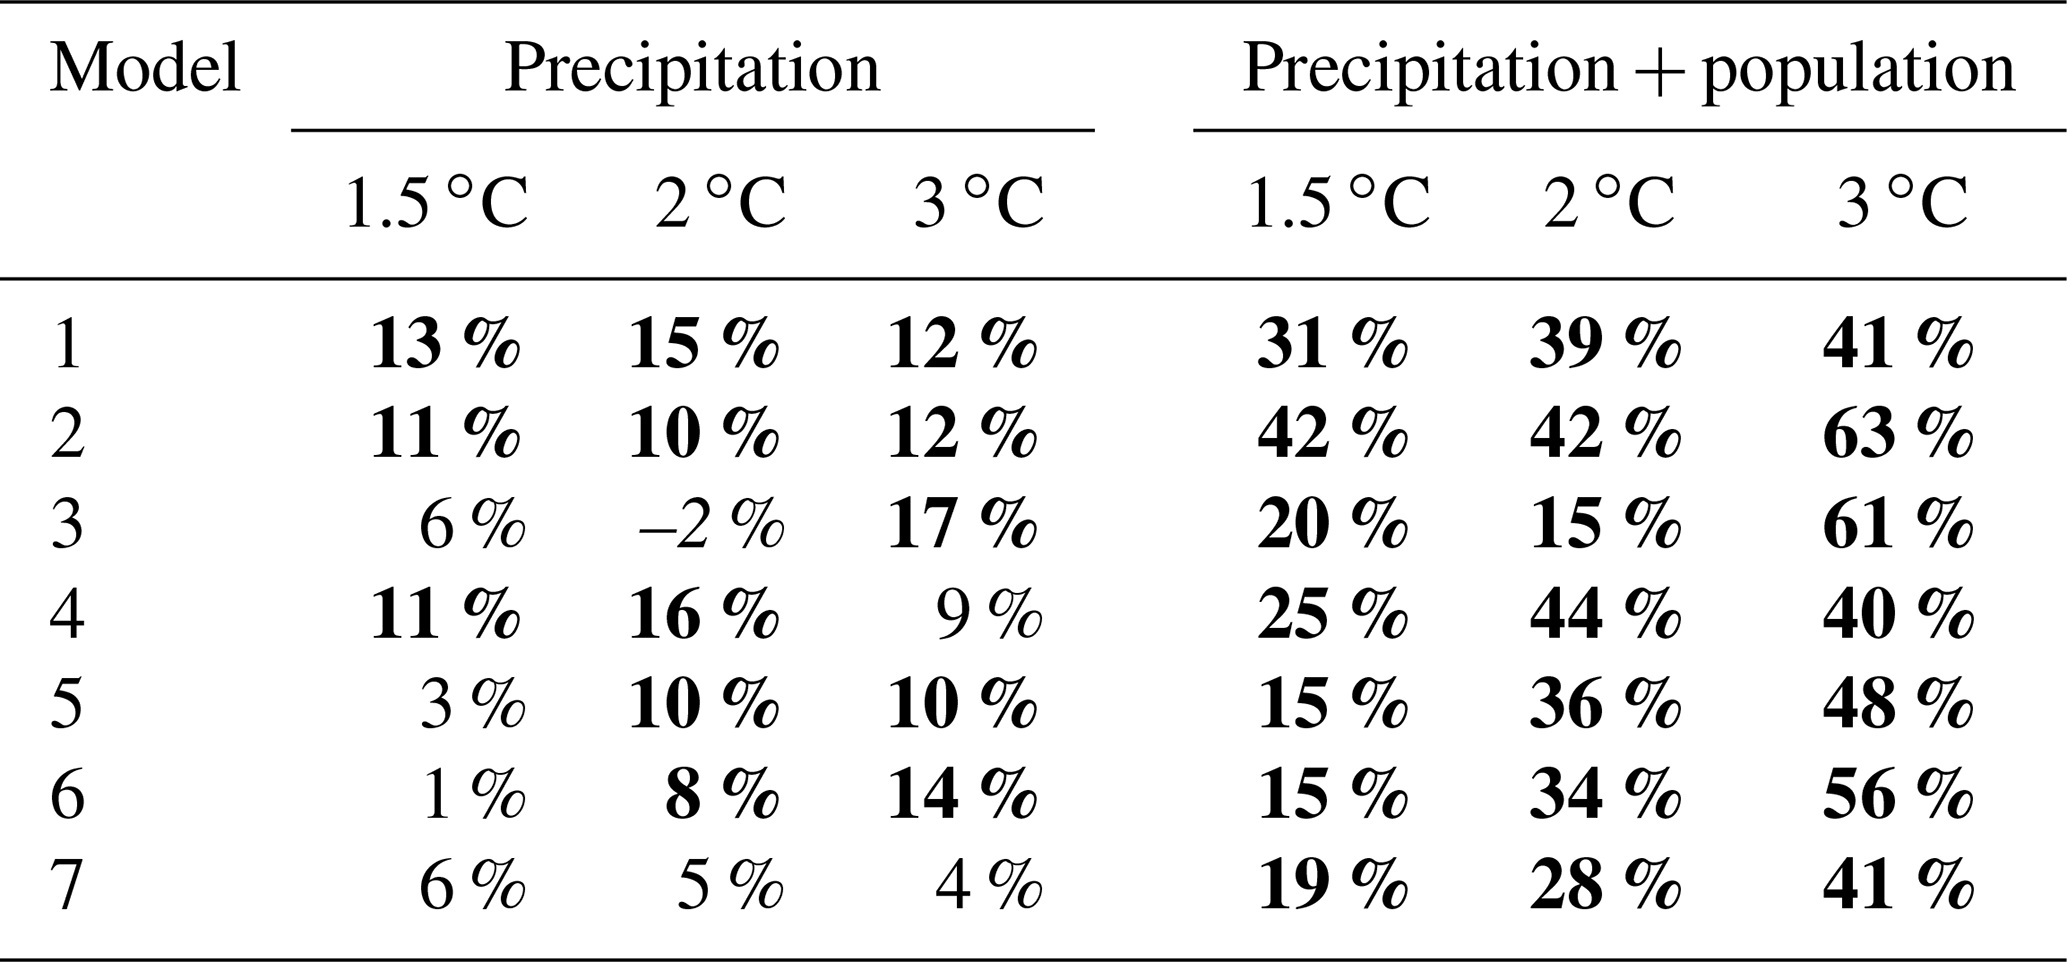
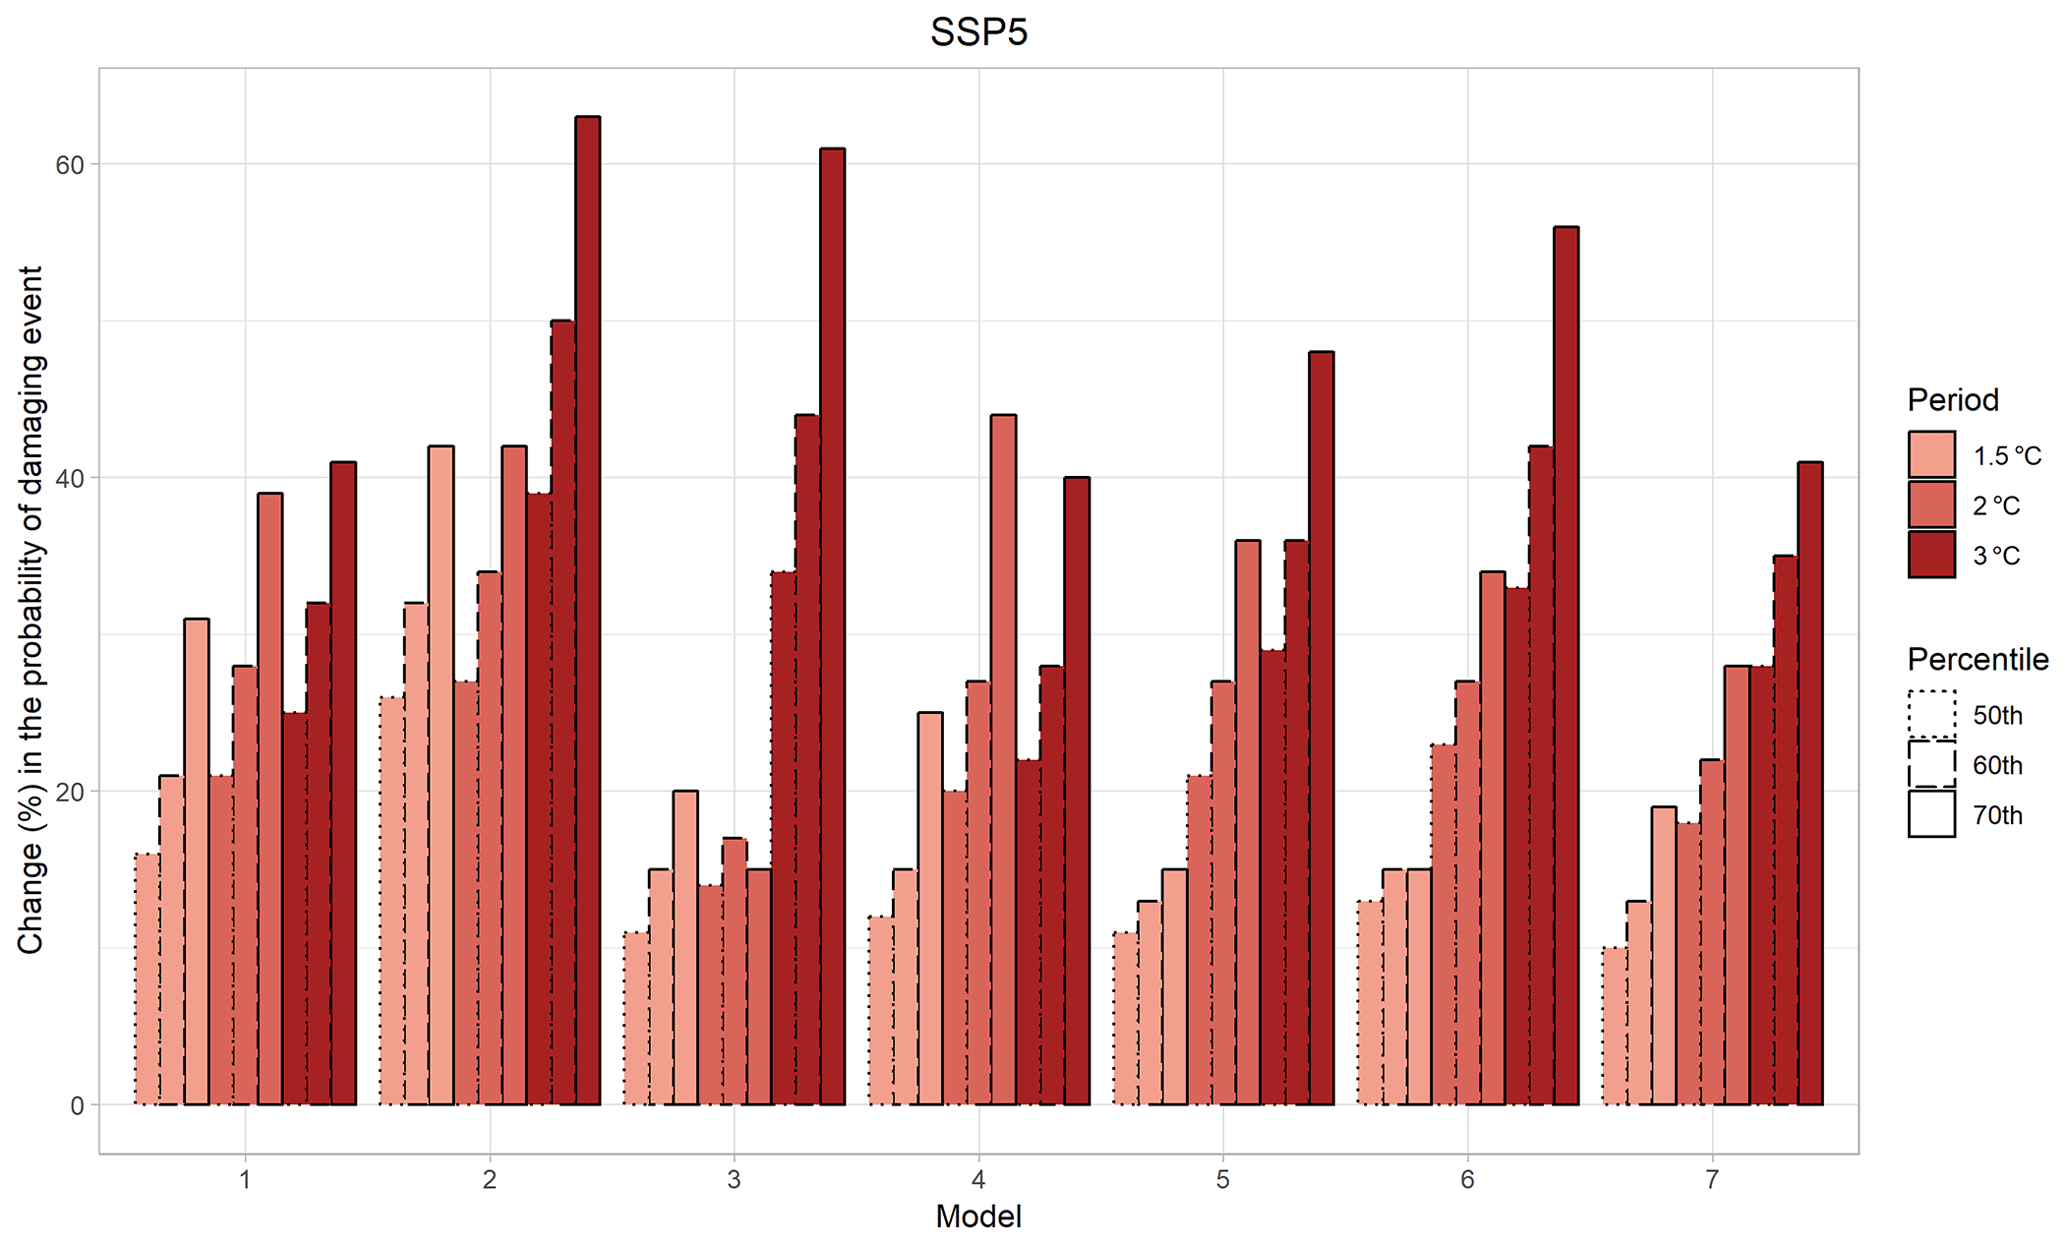
Figure 9Change in the probability of a damaging event in Catalonia with respect to the reference period (1976–2005) for the 50th, 60th and 70th damage percentiles and for all models when using the SSP5 socioeconomic scenario. Different hatching around bars shows the different percentiles of damage.
The results presented above show the change in probability of damaging events due to both climate change and increasing exposure (i.e. increasing population), both of which have been shown to have a significant relationship with flood damage in Sect. 3.1.1. In Table 5, the change in the probability of damaging events is shown for the 70th damage percentile, when keeping population constant at today's levels (left) compared to when using the SSP5 population data (right). The results show that the increase in probability is higher when both climate and population change are included. When population is considered, all the periods and models clearly show a higher increase in the probability of a damaging event, which is statistically significant for all cases. Nevertheless, when mean precipitation accumulated in 24 h is used as the sole independent variable of the model, not all the models show an increase in the probability of damaging events. These results point out the importance of including variables that represent change in both the climate and socioeconomic conditions.
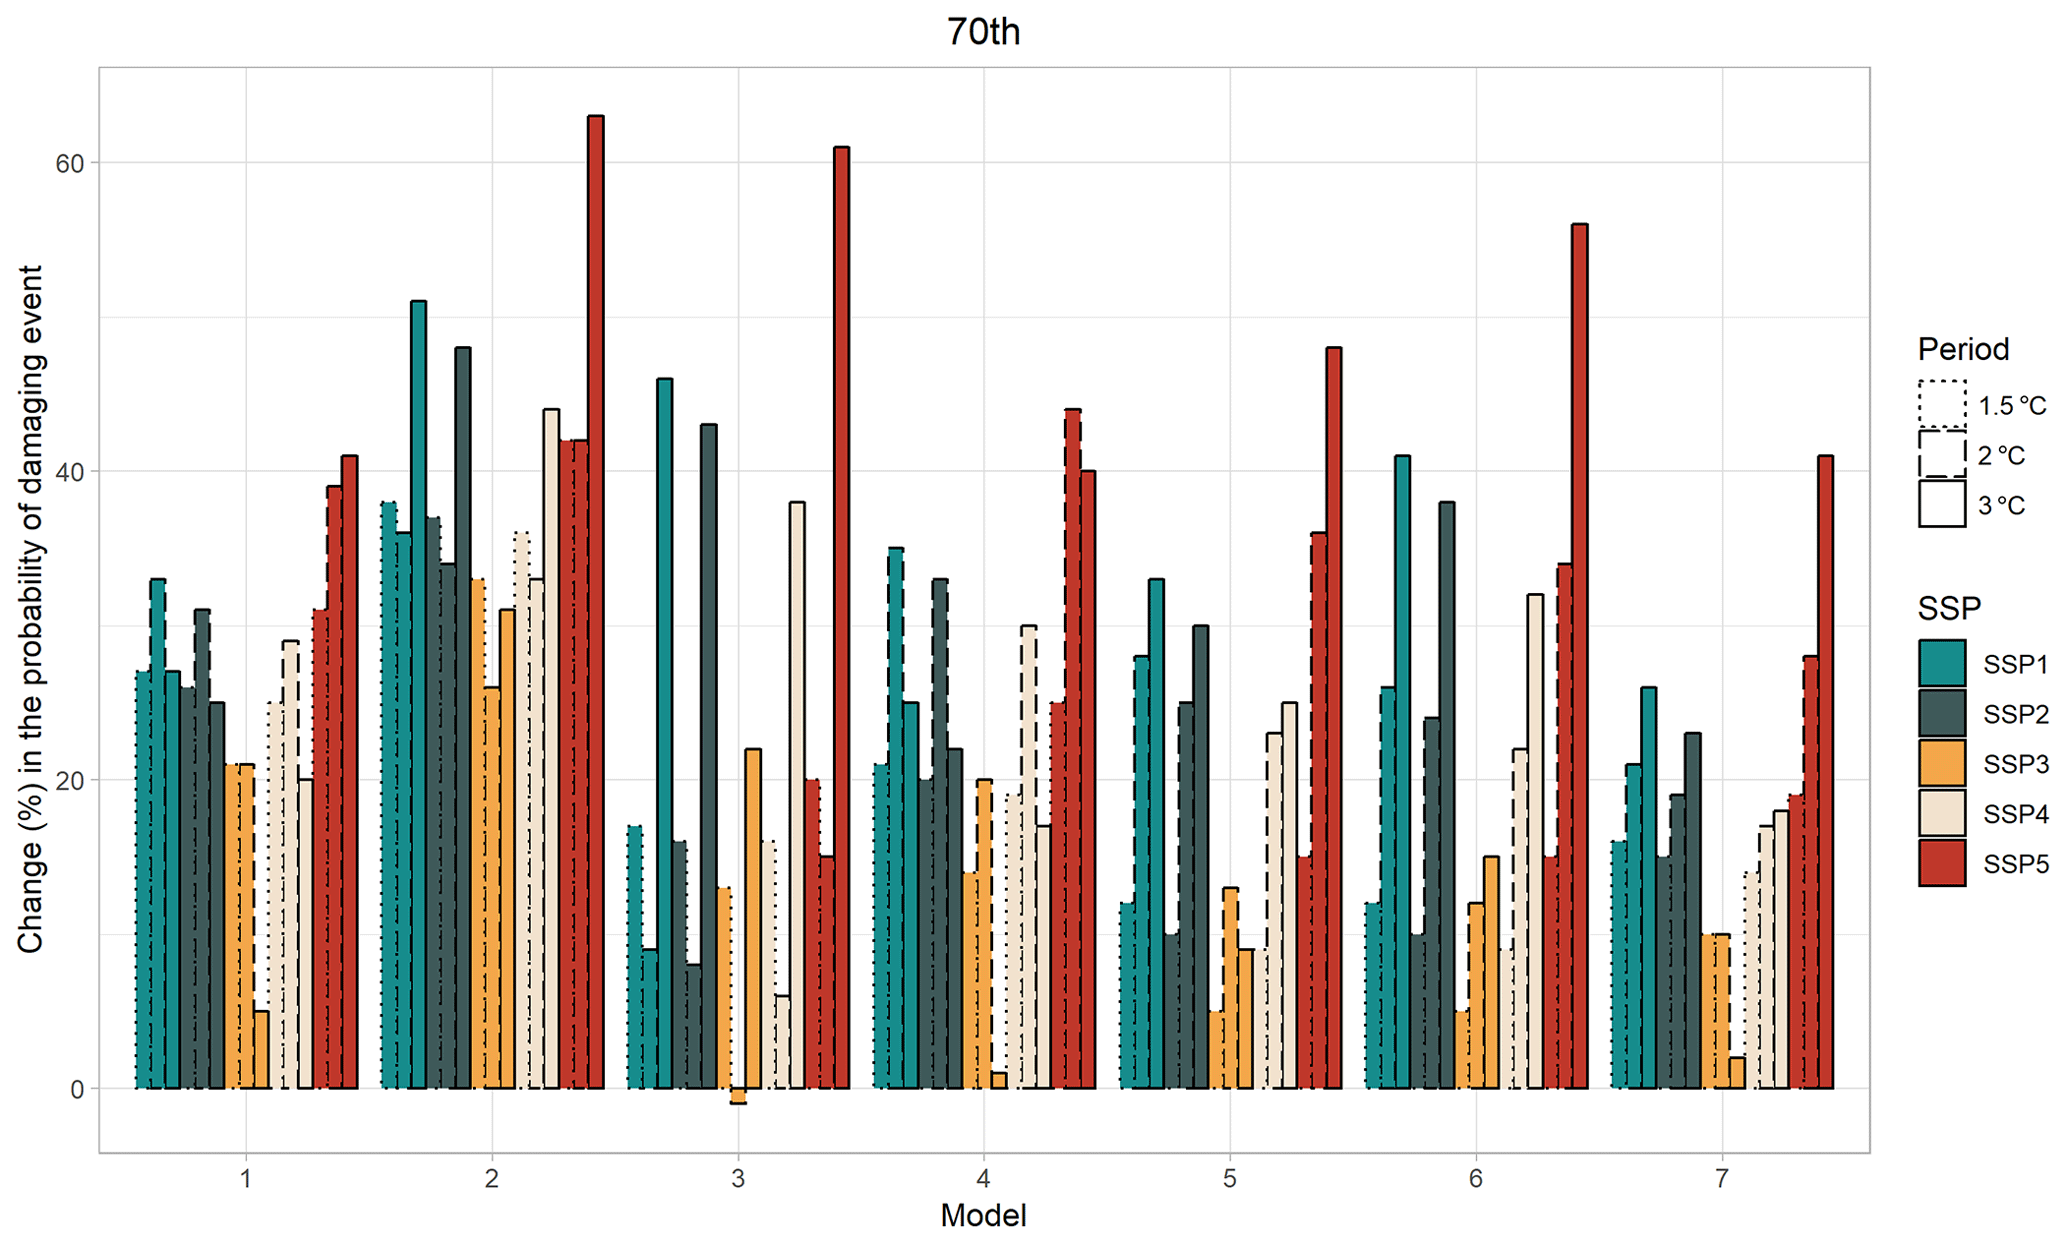
Figure 10Change with respect to the reference period (1976–2005) of exceeding the 70th percentile of damage in Catalonia for all the models, warming periods and socioeconomic scenarios (SSPs). Different hatching around bars shows different warming levels.

Figure 11Change in the probability of a damaging event in the Valencian Community with respect to the reference period (1976–2005) for the 50th, 60th and 70th damage percentiles and for all models when using the SSP5 socioeconomic scenario. Different hatching around bars shows the different percentiles of damage.

Figure 12Change with respect to the reference period (1976–2005) of exceeding the 70th percentile of damage in the Valencian Community for all the models, warming periods and socioeconomic scenarios (SSPs). Different hatching around bars shows different warming levels.
Finally, in order to see the differences between the socioeconomic scenarios (SSPs), the probability of exceeding the 70th percentile of damage in Catalonia for all the periods, models and SSPs is plotted in Fig. 10. Results show an increase in the probability of a damaging event in almost all cases, pointing out that even with lower exposure than in the SSP5 scenario, increases in flood damage are evident. The only exception is for Model 3 in combination with the 2 ∘C warming period and the SSP3 scenario. This scenario refers to a fragmented world with an emphasis on security at the expense of international development. In rich OECD countries (defined by OECD membership and the World Bank category of a high-income country), to which both regions of our study belong, the SSP3 scenario depicts a low fertility rate, high mortality rate and low immigration rate (Samir and Lutz, 2017). Therefore, the population is assumed to decrease in these countries (see Fig. 8). On the other hand, the largest increases in probability are found under SSP5, since this has the largest increase in population (see Fig. 8). As mentioned before, this scenario refers to a world that emphasizes technological progress and where economic growth is fostered by the rapid development of human capital. In rich OECD countries a low mortality rate, high immigration rate and a relatively high fertility rate are expected due to advanced technology and a very high standard of living that allows for easier combination of work and family (Samir and Lutz, 2017).
The same analysis has been carried out for the Valencian Community, based on the relationships found for the present climate for this region (see Sect. 3.1.2). Figure 11 shows the change in the probability of a damaging event (defined by the three percentiles of damage) based on the mean precipitation recorded in 24 h and the population (SSP5 scenario). As can be observed, all models and periods show an increase in this probability with respect to the reference period. Therefore, an increase in the probability of a damaging event occurrence is likely to happen with global warming and with the expected growth of the population, becoming higher when greater warming is considered. Actually, with a global temperature of 3 ∘C above pre-industrial conditions, the change in probability is considerably higher than the other two warming periods (1.5 and 2 ∘C) in most cases, becoming twice as high in some of them. Furthermore, this probability becomes larger for higher percentiles of damage.
The change in the probability of a damaging event when considering the 70th percentile of damage is shown in Table 6. When population is considered constant at today's levels (left), the range of values goes from −4 to 26 %, but only the positive and highest ones are statistically significant. However, when the change in population according to SSP5 is also taken into account (right), all values become positive and greater, and most of them become statistically significant, highlighting the importance of considering the population while analysing flood damage.
Table 6Change in the probability of a damaging event in the Valencian Community for the 70th damage percentile and the three warming periods with the mean 24 h precipitation as explanatory variable (left) and mean 24 h precipitation and population (SSP5) as explanatory variables (right). The marked cells show statically significant (p value < 0.05) increases (bold) and decreases (italic) in relation to the reference period (1976–2005).

The probability of exceeding the 70th percentile of damage for the Valencian Community for all the periods, models and SSPs is shown in Fig. 12. Although most of the cases show an increase in the probability of a damaging event, this increase is not as clear as that of the Catalonia region. When the SSP3 socioeconomic scenario is taken into account, substantial decreases can be found in most models. As in the case of Catalonia, the largest increases are found under the SSP5 scenario, when higher population growth rates are expected (see Fig. 8). These results once again underline the importance of considering socioeconomic changes in flood risk analysis.
Overall, results show a general and marked increase in the probability of a damaging event with global warming with respect to the reference period when considering the RCP8.5 climate change scenario and the SSP5 socioeconomic scenario. Other studies, such as Wobus et al. (2014), also show an increase in monetary damage from flooding in nearly all regions of the United States and a total increase in damage by the end of the 21st century of approximately 30 %, although without taking into account other factors involved such as changes in demographics or infrastructure. In the Mediterranean area, other authors found an increase in flood risk associated with extreme precipitation events due to climate change (Cramer et al., 2018; Alfieri et al., 2015a); however the projections in flood hazards in Europe vary a lot regionally (Kundzewicz et al., 2017). Most of the studies of future flood projections refer to river floods (Alfieri et al., 2015a; Roudier et al., 2016; Rojas et al., 2012), without taking into account other types of floods. Therefore, this study ends with a substantial contribution towards assessing the future flood damage caused by other types of flood events, such as those caused by heavy precipitation episodes (surface water floods) and also taking into account the changes in the population in the analysis.
The main contribution of this study is the assessment of the probability of future damaging events in two western Mediterranean regions, considering both climate change and changes in exposure according to different socioeconomic scenarios. Although the results show a promising methodology for predicting flood damage, several limitations should be taken into account.
Firstly, it should be noted that flood risk analysis is very complex and needs to be treated from a holistic perspective using techniques that take into account all the factors involved, both those related to the hazard of the phenomenon and those related to exposure of the territory. In this study only precipitation and population were taken into account, and although the results show the good performance of the model for simulating the probability of a damaging event, other variables such as soil physical conditions or preventive measures should be considered. For instance, in Garrote et al. (2016) different simulation scenarios were defined considering the modifications to the terrain due to the construction of fluvial defence structures in the area. Future research should focus on incorporating further variables into the model to reproduce the complexity of flood risk, not only regarding hazard drivers but also considering more variables related to the exposure and vulnerability, as for example those related to the buildings present in the study region. Furthermore, the present study only focuses on daily precipitation data, while several studies point out the possible better relationship found between sub-daily data and insurance data in the case of surface water floods (Spekkers et al., 2013; Torgersen et al., 2015; Cortès et al., 2018). Nevertheless, the analysis of sub-daily extremes would require convection-permitting regional climate models (Tramblay and Somot, 2018), and studies such as Beranová et al. (2018) have shown that convection is not captured realistically. Therefore, projected changes of sub-daily precipitation extremes in climate change scenarios based on RCMs not resolving convection need to be interpreted with caution (Beranová et al., 2018). Finally, an effort has to be made to incorporate indirect and intangible damage in flood-damage analysis, as this is crucial for evaluating the full impacts caused by natural hazards (Petrucci and Llasat, 2013).
Despite these limitations, this work has provided a first assessment of the link between precipitation and flood damage in a Mediterranean region, also considering the exposure of the territory with the incorporation of the population in the model and the impacts of climate change projections.
The NW Mediterranean region experiences heavy precipitation every year and flash floods that occasionally produce catastrophic damage (Llasat et al., 2013). Both of the western Mediterranean regions covered in this study (Catalonia and the Valencian Community) are prone to these events, most of them caused by local heavy precipitation events (Llasat et al., 2016).
In this study, the relationship between heavy precipitation and flood damage for both regions has been analysed. Generalized linear mixed models have been used in order to estimate the probability of damaging events, taking into account both hazard and exposure. The results show that the probability of a damaging event increases with precipitation and population of the basin. For both regions of study the values under the ROC curve (RA) indicate that our model has good performance, with values close to 1 in all cases. These results improve those obtained by using a simple logistic model with precipitation recorded in 24 h as the only explanatory variable (see Cortès et al., 2018), pointing out the need of incorporating variables such as population that give information about the exposure of the territory for explaining flood damage.
Using the models developed in this study, we also assessed the future probability of damaging flood events under scenarios of climate and population change. We show that this probability increases with respect to the reference period (1976–2005) for most models and warming periods in both regions when considering the RCP8.5–SSP5 combination, being higher in the case of Catalonia. Furthermore, a remarkable result found in both areas is that this change is usually larger when greater warming is considered. This points out the importance of limiting the global warming to the lowest possible levels with mitigation actions. A reduction in the probability of damaging events is only found when considering SSP3 (and in some cases SSP4 for the Valencian Community), since this scenario shows a marked decrease in the population by the end of 21st century in both areas. Furthermore, in both regions the results show that the increase in probability is higher when both climate and population change are included, highlighting the importance of considering variables that take into account the exposure of the territory in flood-damage analysis.
To summarize, we have estimated the changes in the probability that a flood event causing large damage will occur based on the changes in precipitation expected with global warming and also considering the expected changes in demographics. The general increase found in the probability of damaging event should be taken into account in flood management strategies. Therefore, our results suggest the urgency to develop and apply adaptation and mitigation strategies, also considering that many areas in Spain already suffer from problems related to climate change (Quiroga et al., 2011; Turco and Llasat, 2011).
The data are partially available for research purposes by contacting the corresponding author.
A1 Future probability of flood damage
A1.1 Population projections
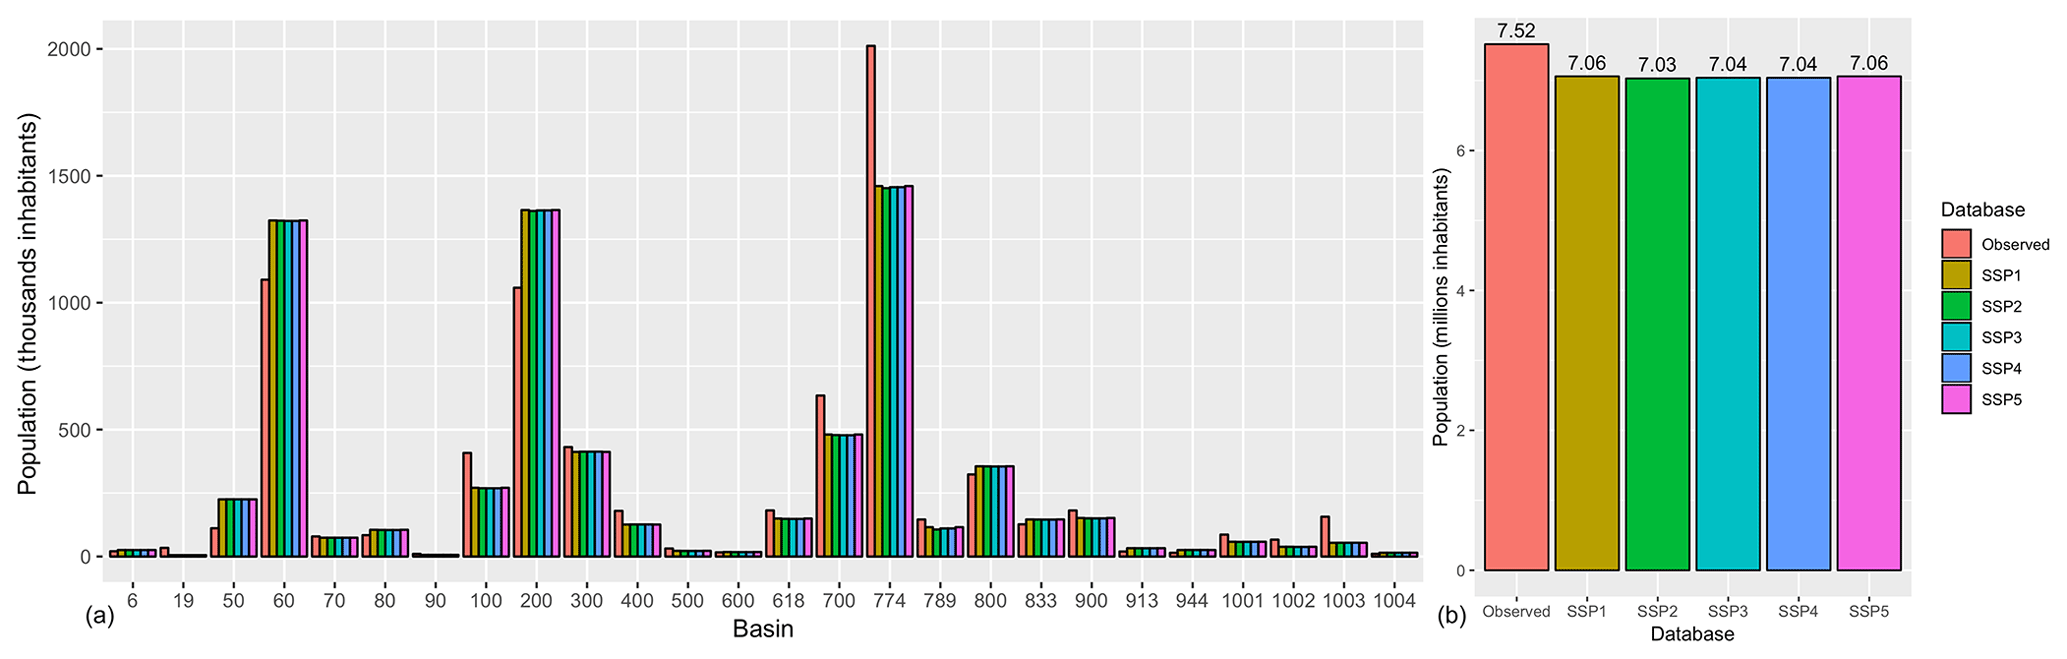
Figure A1Population (year 2010) for each basin of Catalonia (a) and for the whole region (b) for the different databases. The numbers on the x axis indicate the code of each basin (see Table A1).
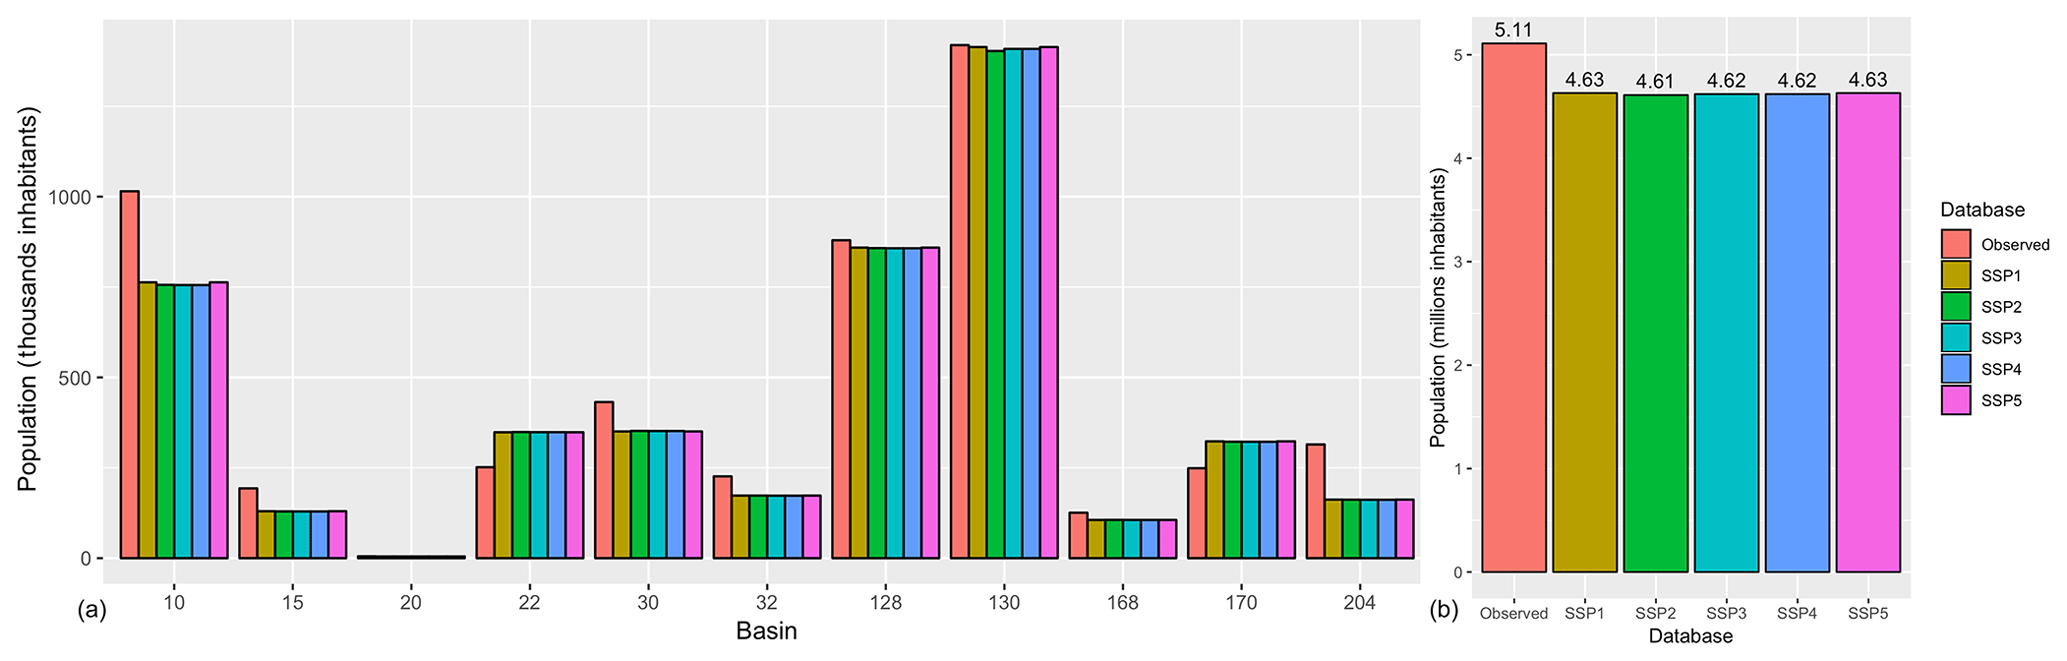
Figure A2Population (year 2010) for each basin of the Valencian Community (a) and for the whole region (b) for the different databases. The numbers on the x axis indicate the code of each basin (see Table A2).
Table A1Corresponding names of the codes of the basins of Catalonia region.
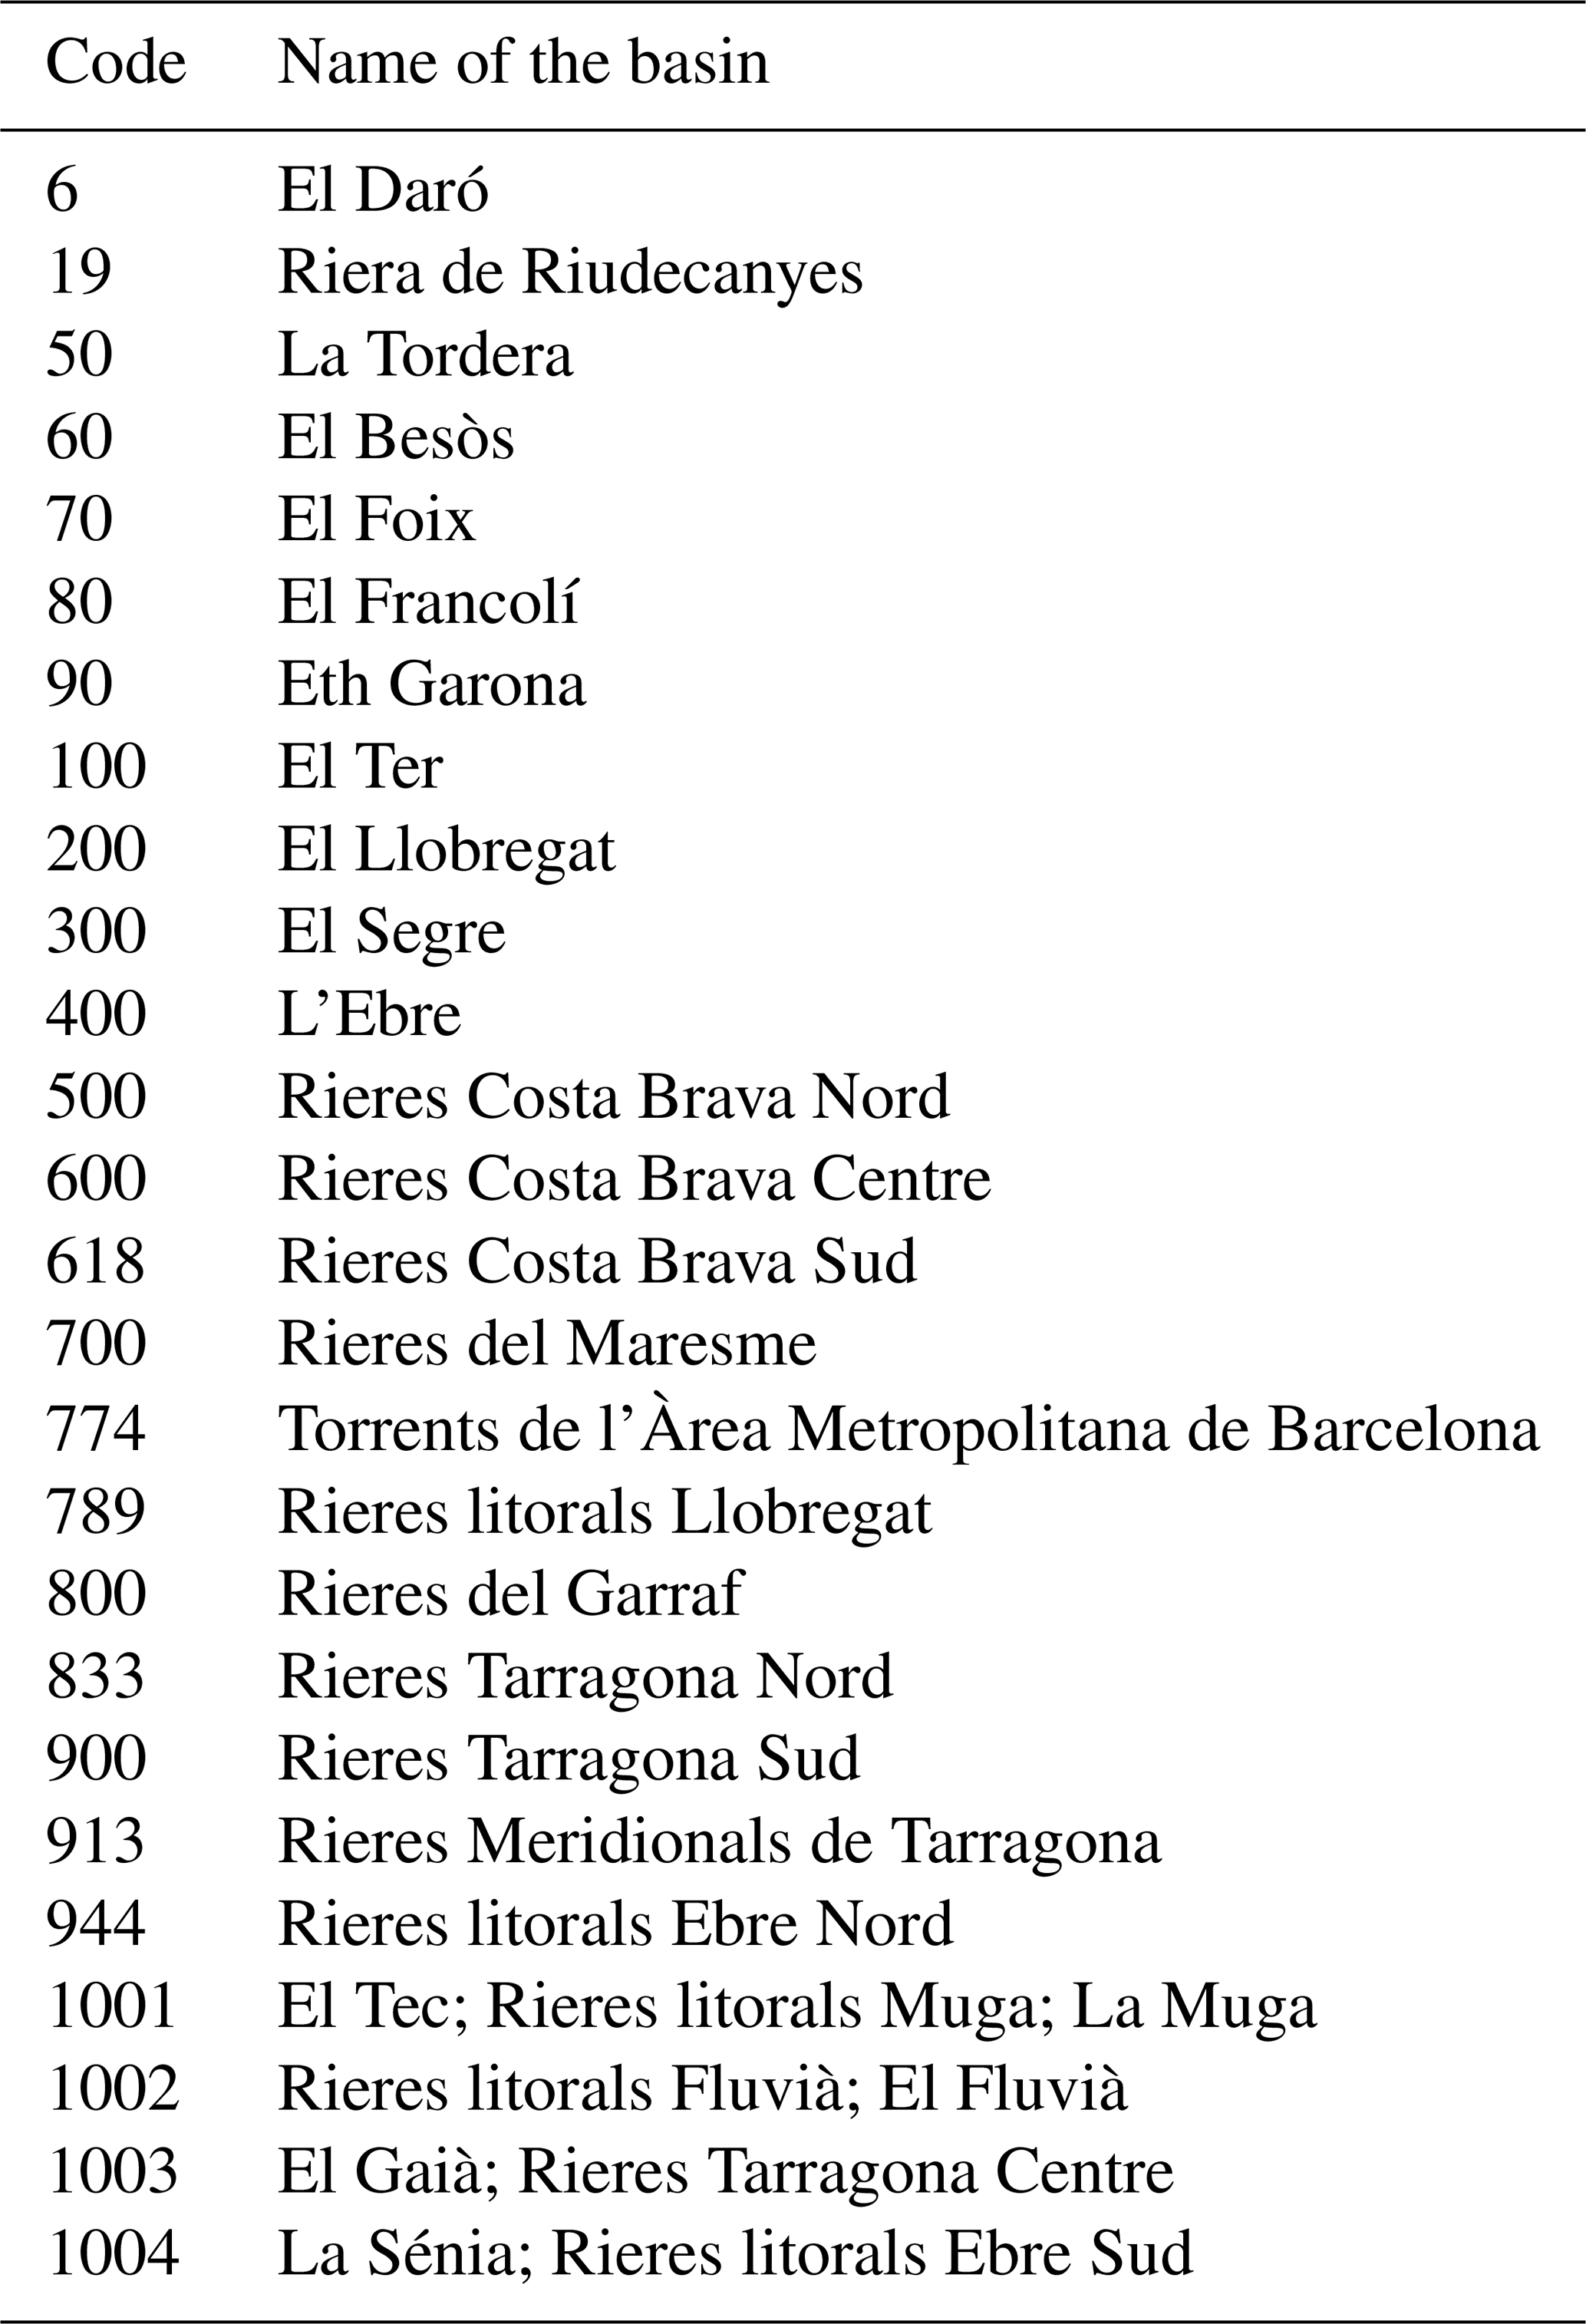
Table A2Corresponding names of the codes of the basins of the Valencian Community region.

B1 Present climate
B1.1 Catalonia
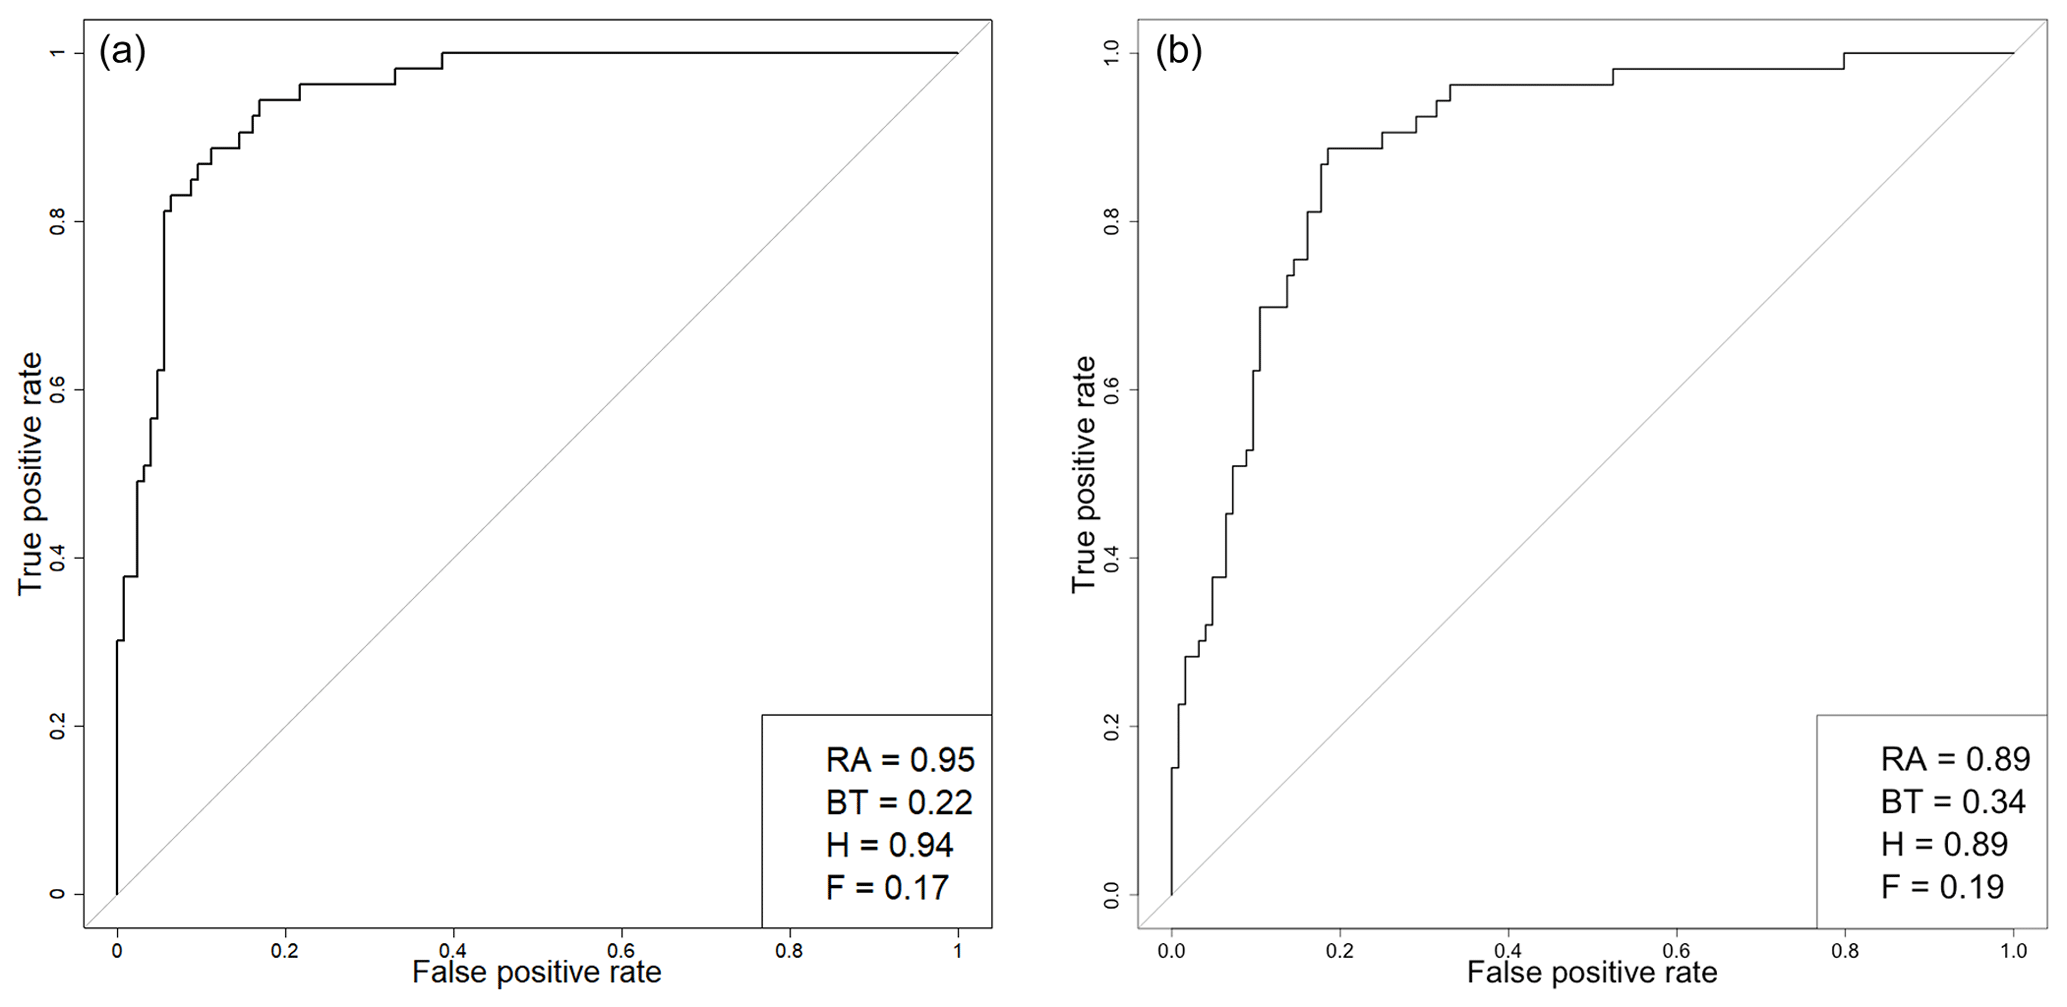
Figure B1Relative operating characteristic (ROC) diagrams (a: in-sample validation; b: out-of-sample validation) for above 70th percentile of damage predictions using Eq. (4) for Catalonia (P0=40 mm d−1). Each value of the ROC curves indicates a set of probability forecasts by stepping a decision threshold with 1 % probability through the modelling results. The numbers inside the plots are the ROC area (RA) and the best threshold (BT), here defined as the threshold that maximizes the difference between the hit rate (H) and the false-alarm rate (F).
B1.2 Valencian community
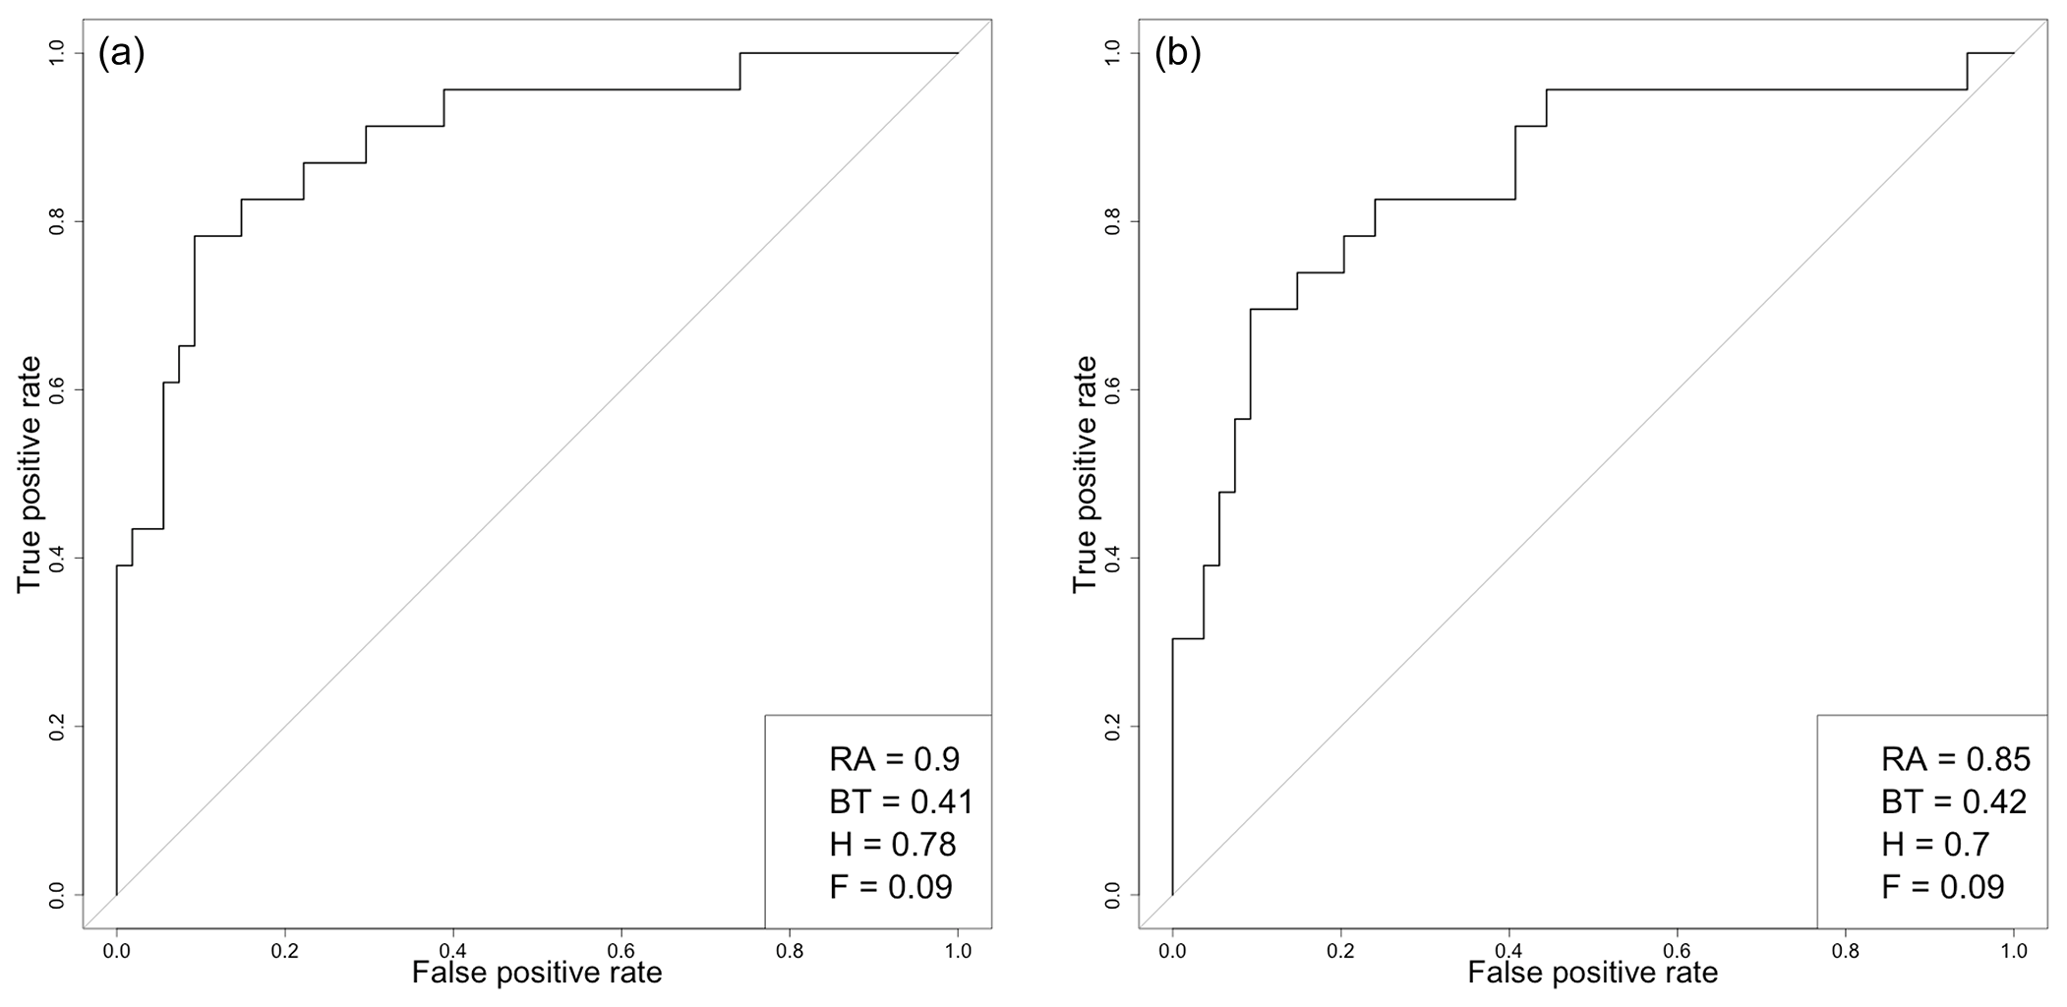
Figure B2Relative operating characteristic (ROC) diagrams (a: in-sample validation; b: out-of-sample validation) for above 70th percentile of damage predictions using Eq. (5) for the Valencian Community (P0=40 mm d−1). Each value of the ROC curves indicates a set of probability forecasts by stepping a decision threshold with 1 % probability through the modelling results. The numbers inside the plots are the ROC area (RA) and the best threshold (BT), here defined as the threshold that maximizes the difference between the hit rate (H) and the false-alarm rate (F).
MC, MT, PW, and JASE conceived and planned the presented idea. MC performed the computations. MT, MCL, and PW helped supervise the study. All authors discussed the results and commented on the manuscript. LA and MCL authors contributed to the final version of the paper.
The authors declare that they have no conflict of interest.
This article is part of the special issue “Hydroclimatic extremes and impacts at catchment to regional scales”. It is not associated with a conference.
This work has been supported by the Spanish project M-CostAdapt (CTM2017-83655-C2-R) of the FEDER/Ministry of Science, Innovation and Universities – AEI – for the project EFA210/16/PIRAGUA, INTERREG POCTEFA 2014-2020, and for the Water Research Institute (IdRA) of the University of Barcelona. It was conducted under the framework of the HyMeX programme (Hydrological cycle in the Mediterranean eXperiment) and the Panta Rhei WG Changes in Flood Risk. Philip Ward received funding from the Netherlands Organisation for Scientific Research (NOW) in the form of VIDI grant 016.161.324. Marco Turco has received funding from the European Union's Horizon 2020 research and innovation programme under the Marie Skłodowska-Curie grant agreement no. 740073 (CLIM4CROP project) and from the Spanish Ministry of Science, Innovation and Universities through the project PREDFIRE (RTI2018-099711-J-I00).
This research has been supported by the FEDER/Ministry of Science, Innovation and Universities – AEI (M-CostAdapt research project no. CTM2017-83655-C2-R).
This paper was edited by Sergio Martín Vicente Serrano and reviewed by Alfredo Perez and one anonymous referee.
Alfieri, L., Burek, P., Feyen, L., and Forzieri, G.: Global warming increases the frequency of river floods in Europe, Hydrol. Earth Syst. Sci., 19, 2247–2260, https://doi.org/10.5194/hess-19-2247-2015, 2015a. a, b
Alfieri, L., Feyen, L., Dottori, F., and Bianchi, A.: Ensemble flood risk assessment in Europe under high end climate scenarios, Global Environ. Change, 35, 199–212, 2015b. a
Alfieri, L., Dottori, F., Betts, R., Salamon, P., and Feyen, L.: Multi-model projections of river flood risk in Europe under global warming, Climate, 6, 6 https://doi.org/10.3390/cli6010006, 2018. a
André, C., Monfort, D., Bouzit, M., and Vinchon, C.: Contribution of insurance data to cost assessment of coastal flood damage to residential buildings: insights gained from Johanna (2008) and Xynthia (2010) storm events, Nat. Hazards Earth Syst. Sci., 13, 2003–2012, https://doi.org/10.5194/nhess-13-2003-2013, 2013. a
Barbería, L., Amaro, J., Aran, M., and Llasat, M. C.: The role of different factors related to social impact of heavy rain events: considerations about the intensity thresholds in densely populated areas, Natu. Hazards Earth Syst. Sci., 14, 1843–1852, https://doi.org/10.5194/nhess-14-1843-2014, 2014. a
Barnolas, M. and Llasat, M.: Metodologıa para el estudio de inundaciones históricas en Espana e implementación de un SIG en las cuencas del Ter, Segre y Llobregat, CEH-CEDEX, Monografıas M-90, Ministerio de Fomento, Madrid, 2007. a
Barredo, J. I.: Normalised flood losses in Europe: 1970–2006, Nat. Hazards Earth Syst. Sci., 9, 97–104, https://doi.org/10.5194/nhess-9-97-2009, 2009. a
Barredo, J. I., Saurí, D., and Llasat, M. C.: Assessing trends in insured losses from floods in Spain 1971–2008, Nat. Hazards Earth Syst. Sci., 12, 1723–1729, https://doi.org/10.5194/nhess-12-1723-2012, 2012. a, b, c, d
Beranová, R., Kyselỳ, J., and Hanel, M.: Characteristics of sub-daily precipitation extremes in observed data and regional climate model simulations, Theore. Appl. Climatol., 132, 515–527, 2018. a, b
Bernet, D. B., Prasuhn, V., and Weingartner, R.: Surface water floods in Switzerland: what insurance claim records tell us about the damage in space and time, Nat. Hazards Earth Syst. Sci., 17, 1659–1682, https://doi.org/10.5194/nhess-17-1659-2017, 2017. a
Betts, R., Alfieri, L., Bradshaw, C., Caesar, J., Feyen, L., Friedlingstein, P., Gohar, L., Koutroulis, A., Lewis, K., Morfopoulos, C., Papadimitriou, L., Richardson, K. J., Tsanis, I., and Wyser, K.: Changes in climate extremes, fresh water availability and vulnerability to food insecurity projected at 1.5 ∘C and 2 ∘C global warming with a higher-resolution global climate model, Earth's Future, https://doi.org/10.1002/2017EF000714, in press, 2018. a
Bolker, B. M., Brooks, M. E., Clark, C. J., Geange, S. W., Poulsen, J. R., Stevens, M. H. H., and White, J.-S. S.: Generalized linear mixed models: a practical guide for ecology and evolution, Trends. Ecol. Evol., 24, 127–135, 2009. a
Bouwer, L. M.: Have disaster losses increased due to anthropogenic climate change?, B. Am. Meteorol. Soc., 92, 39–46, 2011. a
Colmet-Daage, A., Sanchez-Gomez, E., Ricci, S., Llovel, C., Borrell Estupina, V., Quintana-Seguí, P., Llasat, M. C., and Servat, E.: Evaluation of uncertainties in mean and extreme precipitation under climate change for northwestern Mediterranean watersheds from high-resolution Med and Euro-CORDEX ensembles, Hydrol. Earth Syst. Sci., 22, 673–687, https://doi.org/10.5194/hess-22-673-2018, 2018. a, b, c
Cortès, M., Llasat, M. C., Gilabert, J., Llasat-Botija, M., Turco, M., Marcos, R., Martín Vide, J. P., and Falcón, L.: Towards a better understanding of the evolution of the flood risk in Mediterranean urban areas: the case of Barcelona, Nat. Hazards, 93, 39–60, https://doi.org/10.1007/s11069-017-3014-0, 2017. a
Cortès, M., Turco, M., Llasat, M., and d. Llasat, M. C.: Estimación de los daños por inundaciones en el mediterráneo español a partir de la lluvia, in: El Clima: Aire, Agua, tierra y fuego, Asociación Española de Climatología, Murcia, España, 2018. a
Cortès, M., Turco, M., Llasat-Botija, M., and Llasat, M. C.: The relationship between precipitation and insurance data for floods in a Mediterranean region (northeast Spain), Nat. Hazards Earth Syst. Sci., 18, 857–868, https://doi.org/10.5194/nhess-18-857-2018, 2018. a, b, c, d, e, f, g
Cramer, W., Guiot, J., Fader, M., Garrabou, J., Gattuso, J.-P., Iglesias, A., Lange, M. A., Lionello, P., Llasat, M. C., Paz, S., Peñuelas, J., Snoussi, M., Toreti, A., Tsimplis, M. N., and Xoplaki, E.: Climate change and interconnected risks to sustainable development in the Mediterranean, Nat. Clim. Change, 8, 972–980, https://doi.org/10.1038/s41558-018-0299-2, 2018. a, b, c, d, e, f, g
Drobinski, P., Da Silva, N., Panthou, G., Bastin, S., Muller, C., Ahrens, B., Borga, M., Conte, D., Fosser, G., Giorgi, F., Güttler, I., Kotroni, V., Li, L., Morin, E., Önol, B., Quintana-Segui, P., Romera, R., and Torma, C. Z.: Scaling precipitation extremes with temperature in the Mediterranean: past climate assessment and projection in anthropogenic scenarios, Clim. Dynam., 51, 1237–1257, 2018. a, b, c
Elmer, F., Thieken, A. H., Pech, I., and Kreibich, H.: Influence of flood frequency on residential building losses, Nat. Hazards Earth Syst. Sci., 10, 2145—2159, https://doi.org/10.5194/nhess-10-2145-2010, 2010. a
Fourrie, N., Haddouch, H., Brousseau, P., Wattrelot, E., and Fisher, C.: Forecast of heavy precipitation events, in: The Mediterranean Region under Climate Change. A scientific update, chap. 3, IRD editions, Marseille, 577–585, 2016. a
Garrote, J., Alvarenga, F., and Díez-Herrero, A.: Quantification of flash flood economic risk using ultra-detailed stage–damage functions and 2-D hydraulic models, J. Hydrol., 541, 611–625, 2016. a, b
Gaume, E., Borga, M., Llassat, M. C., Maouche, S., Lang, M., and Diakakis, M.: Mediterranean extreme floods and flash floods, in: The Mediterranean Region under Climate Change. A scientific update, chap. 1, IRD editions, Marseille, 133–144, 016. a
Giorgi, F. and Lionello, P.: Climate change projections for the Mediterranean region, Global Planet. Change, 63, 90–104, 2008. a
Gudmundsson, L., Bremnes, J. B., Haugen, J. E., and Engen-Skaugen, T.: Technical Note: Downscaling RCM precipitation to the station scale using statistical transformations - a comparison of methods, Hydrol. Earth Syst. Sci., 16, 3383–3390, https://doi.org/10.5194/hess-16-3383-2012, 2012. a
Harrell Jr., F. E.: Regression modeling strategies: with applications to linear models, logistic and ordinal regression, and survival analysis, Springer, Switzerland, 2015. a
IDESCAT: Institut d'Estadística de Catalunya, available at: https://www.idescat.cat (last access: 26 April 2019), 2018. a
INE: Instituto Nacional de Estadística, available at: https://www.ine.es (last access: 26 April 2019), 2018. a, b, c
IPCC: Climate Change 2014: Synthesis Report, in: Contribution of Working Groups I, II and III to the Fifth Assessment Report of the Intergovernmental Panel on Climate Change, edited by: Core Writing Team, Pachauri, R. K., and Meyer, L. A., IPCC, Geneva, Switzerland, 151 pp., 2014. a, b
Jacob, D., Petersen, J., Eggert, B., Alias, A., Bøssing, O., Bouwer, L. M., Braun, A., Colette, A., Georgopoulou, E., Gobiet, A., Menut, L., Nikulin, G., Haensler, A., Kriegsmann, A., Martin, E., Meijgaard, E. V., Moseley, C., and Pfeifer, S.: EURO-CORDEX: new high-resolution climate change projections for European impact research, Reg. Environ. Change, 14, 563–578, https://doi.org/10.1007/s10113-013-0499-2, 2014. a, b, c, d, e
Jerez, S., Tobin, I., Vautard, R., Montávez, J. P., López-Romero, J. M., Thais, F., Bartok, B., Christensen, O. B., Colette, A., Déqué, M., Nikulin, G., Kotlarski, S., van Meijgaard, E., Teichmann, C., and Wild, M.: The impact of climate change on photovoltaic power generation in Europe, Nat. Commun., 6, 10014, https://doi.org/10.1038/ncomms10014, 2015. a
Jerez, S., López-Romero, J., Turco, M., Jiménez-Guerrero, P., Vautard, R., and Montávez, J.: Impact of evolving greenhouse gas forcing on the warming signal in regional climate model experiments, Nat. Commun., 9, 1304, https://doi.org/10.1038/s41467-018-03527-y, 2018. a
Kim, Y.-O., Seo, S. B., and Jang, O.-J.: Flood risk assessment using regional regression analysis, Nat. Hazards, 63, 1203–1217, 2012. a
Kjellström, E., Nikulin, G., Strandberg, G., Christensen, O. B., Jacob, D., Keuler, K., Lenderink, G., van Meijgaard, E., Schär, C., Somot, S., Sørland, S. L., Teichmann, C., and Vautard, R.: European climate change at global mean temperature increases of 1.5 and 2 ∘C above pre-industrial conditions as simulated by the EURO-CORDEX regional climate models, Earth Syst. Dynam., 9, 459–478, https://doi.org/10.5194/esd-9-459-2018, 2018. a, b
Kundzewicz, Z. W., Krysanova, V., Dankers, R., Hirabayashi, Y., Kanae, S., Hattermann, F. F., Huang, S., Milly, P. C. D., Stoffel, M. H., Driessen, P. P. J., Matczak, P., Quevauviller, P., and Schellnhuber, H. J.: Differences in flood hazard projections in Europe–their causes and consequences for decision making, Hydrolog. Sci. J., 62, 1–14, 2017. a
Leal, M., Boavida-Portugal, I., Fragoso, M., and Ramos, C.: How much does an extreme rainfall event cost? Material damages and relationships between insurance, rainfall, land cover and urban flooding, Hydrolog. Sci. J., 64, 673–689, 2019. a
Le Bihan, G., Payrastre, O., Gaume, E., Moncoulon, D., and Pons, F.: The challenge of forecasting impacts of flash floods: test of a simplified hydraulic approach and validation based on insurance claim data, Hydrol. Earth Syst. Sci., 21, 5911–5928, https://doi.org/10.5194/hess-21-5911-2017, 2017. a
Llasat, M. C., Llasat-Botija, M., and López, L.: A press database on natural risks and its application in the study of floods in Northeastern Spain, Nat. Hazards Earth Syst. Sci., 9, 2049–2061, https://doi.org/10.5194/nhess-9-2049-2009, 2009. a
Llasat, M. C., Llasat-Botija, M., Petrucci, O., Pasqua, A. A., Rosselló, J., Vinet, F., and Boissier, L.: Towards a database on societal impact of Mediterranean floods within the framework of the HYMEX project, Nat. Hazards Earth Syst. Sci., 13, 1337–1350, https://doi.org/10.5194/nhess-13-1337-2013, 2013. a, b
Llasat, M. C., Marcos, R., Llasat-Botija, M., Gilabert, J., Turco, M., and Quintana-Seguí, P.: Flash flood evolution in north-western Mediterranean, Atmos. Res., 149, 230–243, 2014. a
Llasat, M. C., Marcos, R., Turco, M., Gilabert, J., and Llasat-Botija, M.: Trends in flash flood events versus convective precipitation in the Mediterranean region: The case of Catalonia, J. Hydrol., 541, 24–37, https://doi.org/10.1016/j.jhydrol.2016.05.040, 2016. a, b, c, d
López-Martínez, F., Gil-Guirado, S., and Pérez-Morales, A.: Who can you trust? Implications of institutional vulnerability in flood exposure along the Spanish Mediterranean coast, Environ. Sci. Policy, 76, 29–39, 2017. a
Martin-Vide, J.: Spatial distribution of a daily precipitation concentration index in peninsular Spain, Int. J. Climatol., 24, 959–971, 2004. a
Mason, S. J. and Graham, N. E.: Areas beneath the relative operating characteristics (ROC) and relative operating levels (ROL) curves: Statistical significance and interpretation, Q. J. Roy. Meteorol. Soc., 128, 2145–2166, 2002. a
O'Neill, B. C., Kriegler, E., Riahi, K., Ebi, K. L., Hallegatte, S., Carter, T. R., Mathur, R., and van Vuuren, D. P.: A new scenario framework for climate change research: the concept of shared socioeconomic pathways, Climatic Change, 122, 387–400, 2014. a
O'Neill, B. C., Kriegler, E., Ebi, K. L., Kemp-Benedict, E., Riahi, K., Rothman, D. S., van Ruijven, B. J., van Vuuren, D. P., Birkmann, J., Kok, K., Levy, M., and Soleckim, W.: The roads ahead: Narratives for shared socioeconomic pathways describing world futures in the 21st century, Global Environ. Change, 42, 169–180, 2017. a, b, c
Papagiannaki, K., Lagouvardos, K., Kotroni, V., and Bezes, A.: Flash flood occurrence and relation to the rainfall hazard in a highly urbanized area, Nat. Hazards Earth Syst. Sci., 15, 1859–1871, https://doi.org/10.5194/nhess-15-1859-2015, 2015. a
Pérez-Morales, A., Gil-Guirado, S., and Olcina-Cantos, J.: Housing bubbles and the increase of flood exposure. Failures in flood risk management on the Spanish south-eastern coast (1975–2013), J. Flood Risk Manage., 11, S302–S313, 2018. a, b
Petrucci, O. and Llasat, M. C.: Impact of disasters in mediterranean regions: An overview in the framework of the HYMEX project, in: Landslide Science and Practice: Social and Economic Impact and Policies, vol. 7, Springer, Berlin, Heidelberg, 137–143, https://doi.org/10.1007/978-3-642-31313-4_18, 2013. a, b
Przyluski, V. and Hallegatte, S.: Indirect costs of natural hazards, CONHAZ report WP02, 383–398, available at: https://climate-adapt.eea.europa.eu/metadata/guidances/indirect-costs-of-natural-hazards (last access: 16 December 2019), 2011. a
Quintana-Seguí, P., Peral, C., Turco, M., d. Llasat, M. C., and Martin, E.: Meteorological analysis systems in North-East Spain: validation of SAFRAN and SPAN, J. Environ. Inform., 27, 116–130, https://doi.org/10.3808/jei.201600335, 2016. a
Quintana-Seguí, P., Turco, M., Herrera, S., and Miguez-Macho, G.: Validation of a new SAFRAN-based gridded precipitation product for Spain and comparisons to Spain02 and ERA-Interim, Hydrol. Earth Syst. Sci., 21, 2187–2201, https://doi.org/10.5194/hess-21-2187-2017, 2017. a
Quiroga, S., Garrote, L., Iglesias, A., Fernández-Haddad, Z., Schlickenrieder, J., de Lama, B., Mosso, C., and Sánchez-Arcilla, A.: The economic value of drought information for water management under climate change: a case study in the Ebro basin, Nat. Hazards Earth Syst. Sci., 11, 643–657, https://doi.org/10.5194/nhess-11-643-2011, 2011. a
Rajczak, J. and Schär, C.: Projections of Future Precipitation Extremes Over Europe: A Multimodel Assessment of Climate Simulations, J. Geophys. Res.-Atmos., 122, 10773–10800, https://doi.org/10.1002/2017JD027176, 2017. a, b, c
Ramis, C., Llasat, M. C., Genovés, A., and Jansà, A.: The October-1987 floods in Catalonia: Synoptic and mesoscale mechanisms, Meteorol. Appl., 1, 337–350, 1994. a
Ramis, C., Homar, V., Amengual, A., Romero, R., and Alonso, S.: Daily precipitation records over mainland Spain and the Balearic Islands, Nat. Hazards Earth Syst. Sci., 13, 2483–2491, https://doi.org/10.5194/nhess-13-2483-2013, 2013. a
Raschky, P. A.: Institutions and the losses from natural disasters, Nat. Hazards Earth Syst. Sci., 8, 627–634, https://doi.org/10.5194/nhess-8-627-2008, 2008. a
Riahi, K., Van Vuuren, D. P., Kriegler, E., Edmonds, J., O'neill, B. C., Fujimori, S., Bauer, N., Calvin, K., Dellink, R., Fricko, O., Lutz, W., Popp, A., Cuaresma, J. C., Samir, K. C., Leimbach, M., Jiang, L., Kram, T., Rao, S., Emmerling, J., Ebi, K., Hasegawa, T., Havlik, P., Humpenöder, F., Aleluia Da Silva, L., Smith, S., Stehfest, E., Bosetti, V., Eom, J., Gernaat, D., Masui, T., Rogelj, J., Strefler, J., Drouet, L., Krey, V., Luderer, G., Harmsen, M., Takahashi, K., Baumstark, L., Doelman, J., Kainuma, M., Klimont, Z., Marangoni, G., Lotze-Campen, H., Obersteiner, M., Tabeau, A., and Tavoni, M.: The shared socioeconomic pathways and their energy, land use, and greenhouse gas emissions implications: an overview, Global Environ. Change, 42, 153–168, 2017. a
Rodrigo, F. and Trigo, R. M.: Trends in daily rainfall in the Iberian Peninsula from 1951 to 2002, Int. J. Climatol., 27, 513–529, 2007. a
Rodriguez-Puebla, C., Encinas, A., Nieto, S., and Garmendia, J.: Spatial and temporal patterns of annual precipitation variability over the Iberian Peninsula, Int. J. Climatol., 18, 299–316, 1998. a
Rojas, R., Feyen, L., Bianchi, A., and Dosio, A.: Assessment of future flood hazard in Europe using a large ensemble of bias-corrected regional climate simulations, J. Geophys. Res.-Atmos., 117, D17109, https://doi.org/10.1029/2012JD017461, 2012. a
Romero, R., Guijarro, J., Ramis, C., and Alonso, S.: A 30-year (1964–1993) daily rainfall data base for the Spanish Mediterranean regions: First exploratory study, Int. J. Climatol., 18, 541–560, 1998. a
Roudier, P., Andersson, J. C., Donnelly, C., Feyen, L., Greuell, W., and Ludwig, F.: Projections of future floods and hydrological droughts in Europe under a +2 ∘C global warming, Climatic Change, 135, 341–355, 2016. a
Saint Martin, C., Fouchier, C., Javelle, P., Douvinet, J., and Vinet, F.: Assessing the exposure to floods to estimate the risk of flood-related damage in French Mediterranean basins, in: vol. 7, 3rd European Conference on Flood Risk Management (FLOODrisk 2016), 7–21 October 2016, Lyon, France, 04013, https://doi.org/10.1051/e3sconf/20160704013, 2016. a
Samir, K. and Lutz, W.: The human core of the shared socioeconomic pathways: Population scenarios by age, sex and level of education for all countries to 2100, Global Environ. Change, 42, 181–192, 2017. a, b, c, d
Sillmann, J., Kharin, V. V., Zwiers, F. W., Zhang, X., and Bronaugh, D.: Climate extremes indices in the CMIP5 multimodel ensemble: Part 2. Future climate projections, J. Geophys. Res.-Atmos., 118, 2473–2493, https://doi.org/10.1002/jgrd.50188, 2013. a, b
Spekkers, M. H., Kok, M., Clemens, F. H., and Ten Veldhuis, J. A.: A statistical analysis of insurance damage claims related to rainfall extremes, Hydrol. Earth Syst. Sci., 17, 913–922, https://doi.org/10.5194/hess-17-913-2013, 2013. a, b, c
Tebaldi, C., Arblaster, J. M., and Knutti, R.: Mapping model agreement on future climate projections, Geophys. Res. Lett., 38, 1–5, https://doi.org/10.1029/2011GL049863, 2011. a
Thiébault, S.: The Mediterranean Region under Climate Change. A scientific update: Abridged English/French Version, IRD editions, Marseille, 2018. a
Torgersen, G., Bjerkholt, J. T., Kvaal, K., and Lindholm, O. G.: Correlation between extreme rainfall and insurance claims due to urban flooding – case study Fredrikstad, Norway, J. Urban Environ. Eng., 9, 127–138, 2015. a, b, c, d
Tramblay, Y. and Somot, S.: Future evolution of extreme precipitation in the Mediterranean, Climatic Change, 151, 289–302, https://doi.org/10.1007/s10584-018-2300-5, 2018. a, b, c
Tramblay, Y., Ruelland, D., Somot, S., Bouaicha, R., and Servat, E.: High-resolution Med-CORDEX regional climate model simulations for hydrological impact studies: A first evaluation of the ALADIN-Climate model in Morocco, Hydrol. Earth Syst. Sci., 17, 3721–3739, https://doi.org/10.5194/hess-17-3721-2013, 2013. a
Trigo, R. M. and Palutikof, J. P.: Precipitation scenarios over Iberia: a comparison between direct GCM output and different downscaling techniques, J. Climate, 14, 4422–4446, 2001. a
Turco, M. and Llasat, M. C.: Trends in indices of daily precipitation extremes in Catalonia (NE Spain), 1951–2003, Nat. Hazards Earth Syst. Sci., 11, 3213–3226, https://doi.org/10.5194/nhess-11-3213-2011, 2011. a
Turco, M., Quintana-Seguí, P., Llasat, M., Herrera, S., and Gutiérrez, J. M.: Testing MOS precipitation downscaling for ENSEMBLES regional climate models over Spain, J. Geophys. Res.-Atmos., 116, D18109, https://doi.org/10.1029/2011JD016166, 2011. a
Turco, M., Llasat, M. C., Herrera, S., and Gutiérrez, J. M.: Bias correction and downscaling of future RCM precipitation projections using a MOS-Analog technique, J. Geophys. Res.-Atmos., 122, 2631–2648, 2017. a
van Huijstee, J., van Bemmel, B., Bouwman, A., and van Rijn, F.: Towards an Urban Preview: Modelling future urban growth with 2UP, Tech. rep., PBL Netherlands Environmental Assessment Agency, the Hague, 2018. a
Vautard, R., Gobiet, A., Sobolowski, S., and Kjellstr”om, E.: The European climate under a 2 ∘C global warming, Environ. Res. Lett., 9, 034006, https://doi.org/10.1088/1748-9326/9/3/034006, 2014. a, b
Wobus, C., Lawson, M., Jones, R., Smith, J., and Martinich, J.: Estimating monetary damages from flooding in the United States under a changing climate, J. Flood Risk Manage., 7, 217–229, 2014. a, b, c
Zhou, Q., Panduro, T. E., Thorsen, B. J., and Arnbjerg-Nielsen, K.: Verification of flood damage modelling using insurance data, Water Sci. Technol., 68, 425–432, https://doi.org/10.2166/wst.2013.268, 2013. a, b, c, d
Zhou, Q., Leng, G., and Feng, L.: Predictability of state-level flood damage in the conterminous United States: the role of hazard, exposure and vulnerability, Scient. Rep., 7, 5354, https://doi.org/10.1038/s41598-017-05773-4, 2017. a
Zischg, A. P., Mosimann, M., Bernet, D. B., and Röthlisberger, V.: Validation of 2D flood models with insurance claims, J. Hydrol., 557, 350–361, https://doi.org/10.1016/j.jhydrol.2017.12.042, 2018. a