the Creative Commons Attribution 4.0 License.
the Creative Commons Attribution 4.0 License.
 | 10 Dec 2019
Post-event field survey of 28 September 2018 Sulawesi earthquake and tsunami
Wahyu Widiyanto
Purwanto B. Santoso
Shih-Chun Hsiao
Rudy T. Imananta
An earthquake with a magnitude of Mw=7.5 that occurred in Sulawesi, Indonesia, on 28 September 2018 triggered liquefaction and tsunamis that caused severe damage and many casualties. This paper reports the results of a post-tsunami field survey conducted by a team with members from Indonesia and Taiwan that began 13 d after the earthquake. The main purpose of this survey was to measure the run-up of tsunami waves and inundation and observe the damage caused by the tsunami. Measurements were made in 18 selected sites, most in Palu Bay. The survey results show that the run-up height and inundation distance reached 10.7 m in Tondo and 488 m in Layana. Inundation depths of 2 to 4 m were common at most sites and the highest was 8.4 m in Taipa. The arrival times of the tsunami waves were quite short and different for each site, typically about 3–8 min from the time of the main earthquake event. This study also describes the damage to buildings and infrastructure and coastal landslides.
- Article
(9625 KB) - Full-text XML
-
Supplement
(2861 KB) - BibTeX
- EndNote


On Friday, 28 September 2018, at 18:02:44 central Indonesia time (UTC + 8), Palu Bay was hit by a strong earthquake with a magnitude of Mw= 7.5. The epicenter was located at −0.22∘ S and 119.85∘ E at a depth of 10 and 27 km northeast of Donggala City (BMKG, 2018). The major phenomena following the earthquake were liquefaction and tsunamis. As of 21 October 2018, as many as 2113 people were killed, 1309 missing, and 4612 injured (Hadi and Kurniawati, 2018). The source of the earthquake was the shift of the Palu-Koro strike-slip fault, one of the most active structures around Sulawesi island. After the earthquake, a series of tsunami waves hit Palu City and Donggala Regency. Low-amplitude tsunami waves were also detected in Mamuju, a city overlooking the Makassar Strait and outside Palu Bay. The tsunami hit the coast, leveled houses, washed away various objects and destroyed the coastal area of Palu Bay, Central Sulawesi Province.
Within the territory controlled by Indonesian authorities, the 2018 Sulawesi tsunami was the most devastating since the 2004 Indian Ocean tsunami. There were eight tsunami events after the 26 December 2004 Indian Ocean tsunami, namely Nias in 2005 (Mw=8.6; 1314 victims), Buru Island in 2006 (Mw=6.7; four victims), Java in 2006 (Mw=7.7; 668 victims), Bengkulu in 2007 (Mw=8.4; 23 victims), Manokwari in 2009 (Mw=7.6; four victims), 2009 Tasikmalaya (Mw=7.3; 79 victims), Mentawai in 2010 (Mw=7.8; 413 victims), and Sulawesi in 2018 (Mw=7.5; 2113 victims). These tsunami events are distributed in tsunami zones that cover all parts of Indonesia except Kalimantan island. Referring to the tsunami catalog and zones in Indonesia (Latief et al., 2000), the 2018 tsunami was on the border between zone D, which includes the Makassar Strait, and zone E, which includes the Maluku Sea. Zones D and E accounted for 9 % and 31 %, respectively, of the total tsunami events in Indonesia between 1600 and 2000. The Palu-Koro fault where the 2018 tsunami occurred is a very active source of earthquakes and tsunamis in zones D and E. The movement of rock formations is 35–44 mm yr−1 (Bellier et al., 2001). The Sulawesi region has a long history of earthquakes and tsunamis (Prasetya et al., 2001). On 30 January 1930, an earthquake occurred on the west coast of Donggala that caused a tsunami with a height of 8–10 m, 200 deaths, 790 houses damaged, and the flooding of all villages on the west coast of Donggala. On 1 January 1996, an earthquake in the Makassar Strait caused a tsunami that swept the west coast of Donggala and Toli-Toli districts. In the same year, an earthquake occurred in Bangkir Village, Tonggolobibi, and Donggala, causing a 3.4 m high tsunami that carried seawater 300 m inland; nine people were killed, and buildings in the three locations were badly damaged. On 11 October 1998, another earthquake occurred in Donggala, severely damaging hundreds of buildings. In 2005 and 2008, earthquakes also occurred but did not cause many casualties. The most recent earthquake occurred in Sigi Regency and Parigi Moutong Regency in August 2012, which left eight people dead.
The disaster area of the September 2018 tsunami includes Palu Bay, a bay on Sulawesi island, and Central Sulawesi Province. This bay has a length of 30 km, a width of 7 km, and a maximum depth of 700 m. Although the epicenter was at the outer boundary of Palu Bay, the most severe damage suffered in Palu City was at the end of the bay, about 70 km from the epicenter. Palu City, the capital of Central Sulawesi Province, has a population of 379 782 (BPS-Statistics of Palu Municipality, 2018). Most of the victims came from this city. In addition to Palu City, the disaster area also included Donggala Regency, with a population of 299 174 (BPS-Statistics of Donggala Regency, 2018), and Sigi District, with a population of 234 588 (BPS-Statistics of Sigi Regency, 2018). Sigi Regency did not suffer damage from the tsunami, but large-scale liquefaction led to a significant number of deaths and disappearances in this area.
This disaster in Central Sulawesi surprised the scientific community. For a strike-slip fault, the plates move horizontally and thus do not usually cause enough vertical deformation to trigger a huge tsunami. It is still uncertain whether the tsunami was caused by co-seismic deformation or non-tectonic sources. Ulrich et al. (2019) believe that a source related to earthquake displacements is probable and that landsliding may not have been the primary source of the tsunami. In contrast, Takagi et al. (2019), Sassa and Takagawa (2018), and Arikawa et al. (2018) believe that landslides produced the tsunami. Field surveys are important for determining the actual cause.
The focus of post-tsunami surveys depends on the data of interest (e.g., hydrodynamic, geological, geophysical, environmental, ecological, social, or economic). The field survey reported in the present study focuses on hydrodynamic data that include measurements of run-up height and inundation distance. Tsunami flow depth on land was also measured at some sites. In addition, tsunami arrival time was analyzed and observations of damage to buildings and infrastructure were conducted. The data can be used for the simulation of tsunamis caused by plate movements or underwater landslides. For instance, Lynett et al. (2003) employed the field survey data of the 1998 Papua New Guinea tsunami as validation for numerical models, namely the Boussinesq model and a nonlinear shallow water wave model. Yalciner et al. (2001) conducted a field survey and modeled the 1999 Izmit tsunami, which is similar in terms of geographical features, earthquake magnitude, and tsunami mechanism compared with the recent Sulawesi tsunami. More broadly, these data can be used to help formulate disaster risk management strategies and rebuild the areas affected by the 2018 Sulawesi tsunami.
Many groups have carried out field surveys of the Sulawesi tsunami event, also known as the Palu tsunami. Muhari et al. (2018) investigated the wave height and inundation depth at several points with a focus around the end of the bay. A UNESCO international tsunami survey team studied 125 km of coastline along Palu Bay up to the earthquake epicenter region. The team performed 78 tsunami run-up and inundation height measurements throughout the surveyed coastline (Omira et al., 2019; Yalciner et al., 2018). Mikami et al. (2019) measured run-up height and inundation depth of 22 points and discussed damage to coastal communities around Palu Bay. Putra et al. (2019) focused on tsunami deposits. Arikawa et al. (2018), Sassa and Takagawa (2018), and Takagi et al. (2019) each conducted a survey related to coastal subsidence, coastal liquefaction, or submarine landslides detected in Palu Bay. These survey data can be combined with data from other groups. In this study, we provide data of run-up height, inundation distance, flow depth/inundation depth, and damage at different points and coordinates.
A team from National Cheng Kung University, Taiwan, and Universitas Jenderal Soedirman, Indonesia, arrived at Sis Aljufri Airport in Palu City at 06:00 central Indonesia time on 11 October 2018, 13 d after the tsunami event. Studies have shown that surveys can be carried out successfully within 2 to 3 weeks of an event (Synolakis and Okal, 2005). Starting from the afternoon of 11 October, a field survey was conducted until the evening of 19 October, for a survey period of 9 d. The emergency response period for the disaster area was determined by the Indonesian government to be 1 month (28 September to 26 October 2018). The victim evacuation period was 2 weeks (28 September to 12 October). This means that the survey was conducted in the emergency response stage, 1 d before the victim evacuation period ended. During this period, the cleaning of area impacted by the tsunami was still in progress, and thus debris could be seen in the disaster area.
Our survey covered the following activities: (1) gathering information about disaster-affected locations and collecting videos and photos of tsunami events from the news, websites, social media, and personal collections of residents that had experienced the disaster; (2) tracing the road along the coast in Palu Bay to get an overview of the affected area; (3) choosing sites that were significantly impacted by the tsunami; (4) looking for evidence of run-up boundaries, inundation limits, and tsunami water level elevation from the subgrade; (5) measuring the profile of the beach at each site; (6) observing and documenting damage and specific phenomena; and (7) interviewing eyewitnesses.
Because many people have smartphones, documentation in the form of photos and videos is abundant. Such documentation was collected from the internet. Unfortunately, many people with valuable documentation did not upload it to the internet. Therefore, our team searched for video recordings and photographs made by local residents while conducting the measurement survey.
The tsunami affected the perimeter of Palu Bay. The survey area covers the entire coastal area in the bay, which falls under the authority of Central Sulawesi Province. The coastline in the bay is around 70 km. The road connecting the provinces on Sulawesi island, called the Trans-Sulawesi Highway, is mostly parallel to the coastline of the bay. The team traced the road from Donggala City to Sirenja Village, which is the limit of the tsunami disaster in Palu Bay. Tracing the Trans-Sulawesi Highway to see an overview of the impact of the tsunami is possible because the road is mostly located 50 to 200 m from the coastline, so the coastline can almost always be seen from the road. A camera on a moving car was operated to record the situation around the beach area. It produced a number of videos describing the damage (contained in the Supplement).
Table 1Measured sites (see also Figs. 1–5).
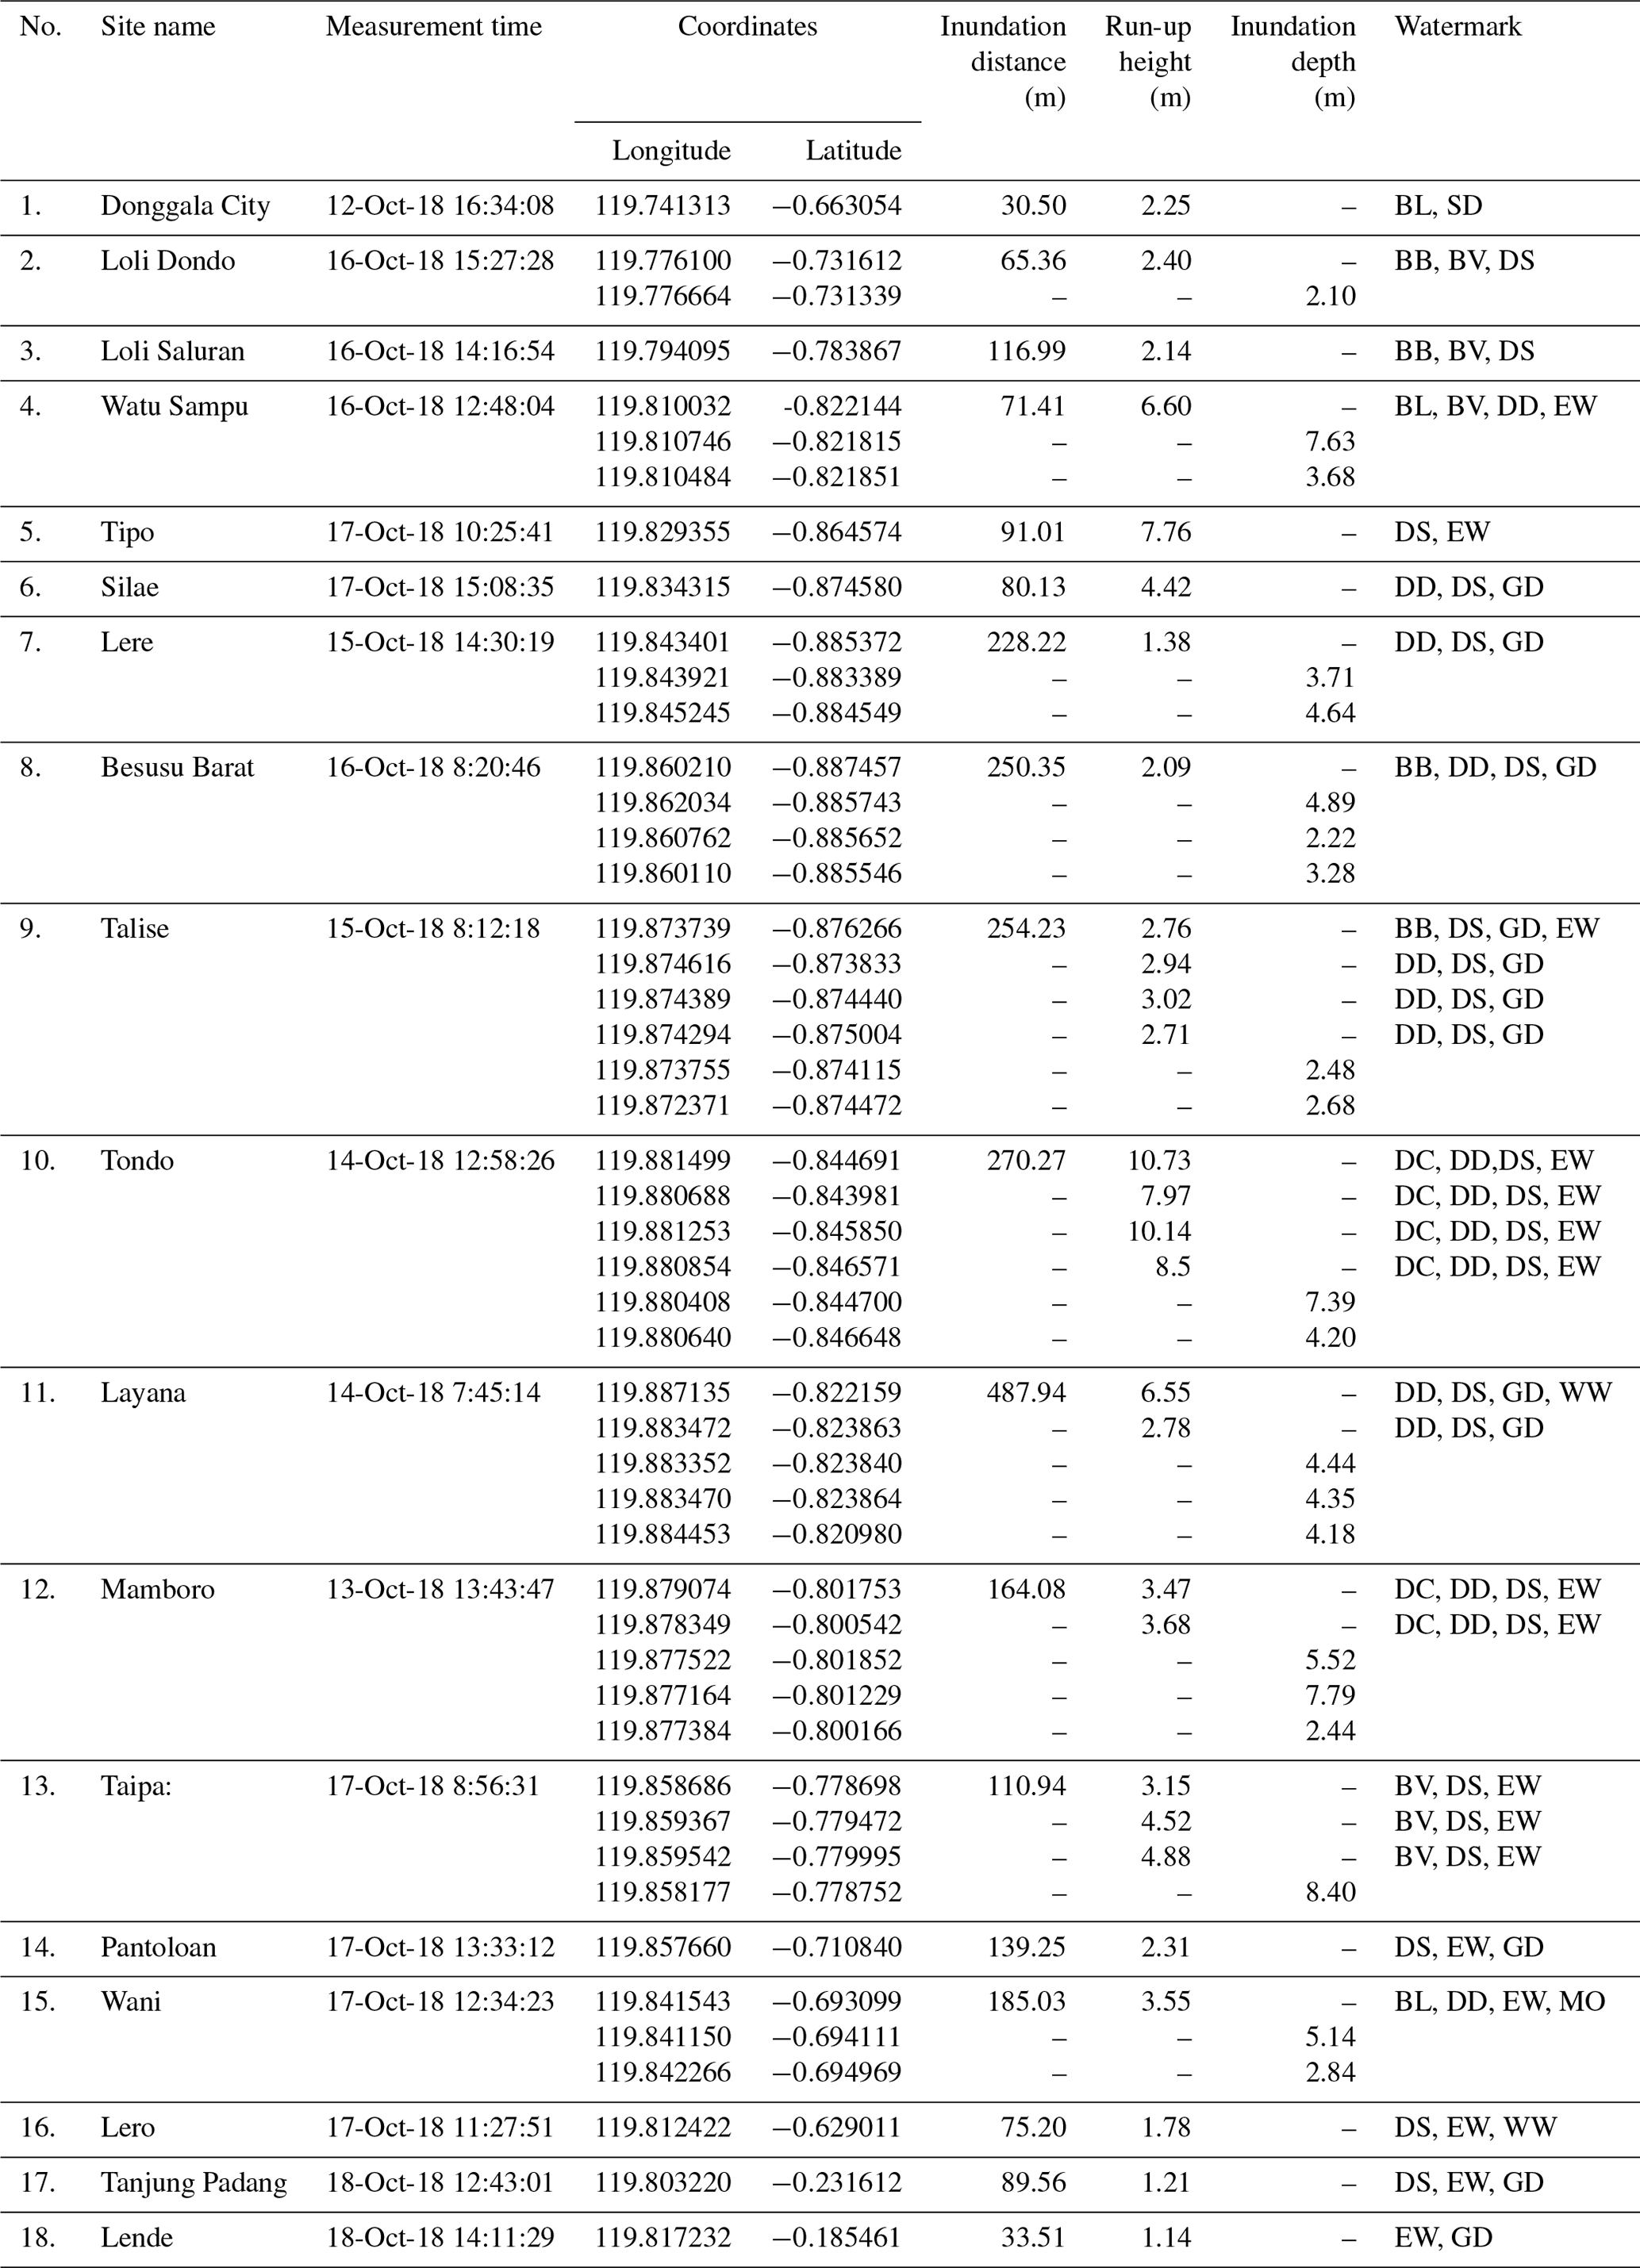
BB: broken tree branch; BL: boat on land surface; BV: brown vegetation; DC: debris caught; DD: debris deposition; DS: damaged structures; EW: eye witnesses; GD: garbage deposition; MO: marine-origin objects; SD: sediment deposition; WW: watermark on wall.
A total of 18 sites were selected for measurement (Fig. 1). At each site, the beach profile was measured using one to four transects or cross sections, for a total of 28 cross sections. Site selection was based on consideration of the level of damage, significance of run-up height and length of inundation, administrative boundaries, and resources and time. The measurement times and locations of the 18 sites are shown in Table 1. The table gives the run-up height and inundation distance, which are explained in Sect. 3.
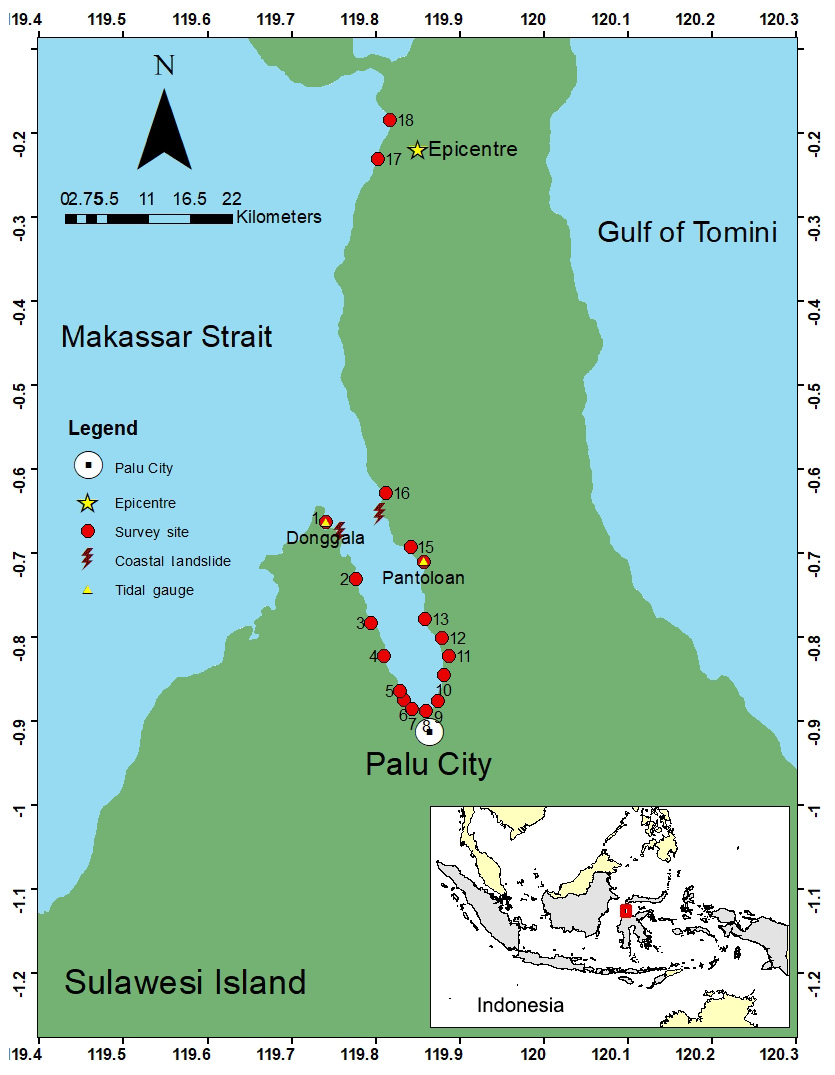
Figure 1Survey area of Palu Bay located on Sulawesi island. A camera in a moving car was used to record the tsunami-affected area following the Trans-Sulawesi Highway parallel to Palu Bay coastline from Site 1 to Site 18. Tidal stations were located at Site 1 (Donggala) and Site 14 (Pantoloan). Coastal landslides were detected at Site 1 (Donggala) and Site 16 (Lero).
Finding evidence of run-up heights, boundaries of inundation, and elevation of tsunami water levels is challenging. Some detective work is often necessary. October is the beginning of the rainy season in Indonesia, including Sulawesi. Palu City is located near the Equator, as shown in Table 1. It is one of the driest areas in Indonesia, with rainfall recorded at the Mutiara Meteorology Station in 2017 of 774.3 mm. From the time of the earthquake until the end of the survey it rained four times, three of which occurred during our survey period, with a duration of less than 2 h and with low to moderate intensity. It was challenging to find tsunami footprints on surfaces exposed to surface runoff caused by rain. The team collected hundreds of traces and water marks left by the tsunami. The tracks were in the form of (a) debris lines, (b) debris left on trees, (c) broken branches, (d) sand trapped in buildings, (e) damaged building elements, and (f) brown leaves (submerged in saltwater during the tsunami event). Figure 2 shows some evidence of run-up and inundation traces.
In addition to physical evidence that could be seen and documented in the field, eyewitnesses are important because of the information they can provide, which can help to corroborate the observations made during the field survey. Very often interviews provide unique information that cannot be obtained by any other means and are therefore much more than an auxiliary tool (Maramai and Tinti, 1997). In this survey, interviews were conducted with 56 people throughout the disaster area. Some of the interviews were recorded in video so the testimonies can be heard again. The authors obtained important information from the surveys, such as the arrival time of the tsunami, the number of waves coming in, the boundaries of run-up and water level, the situation in the area before and after the tsunami, and how people survived the tsunami. Witnesses stated that there were three tsunami waves. The first wave had the smallest amplitude. Then, two waves followed it. The first wave acted as a trigger for evacuation, with many people escaping the coastline. Without this first low-amplitude wave, there may have been more casualties.
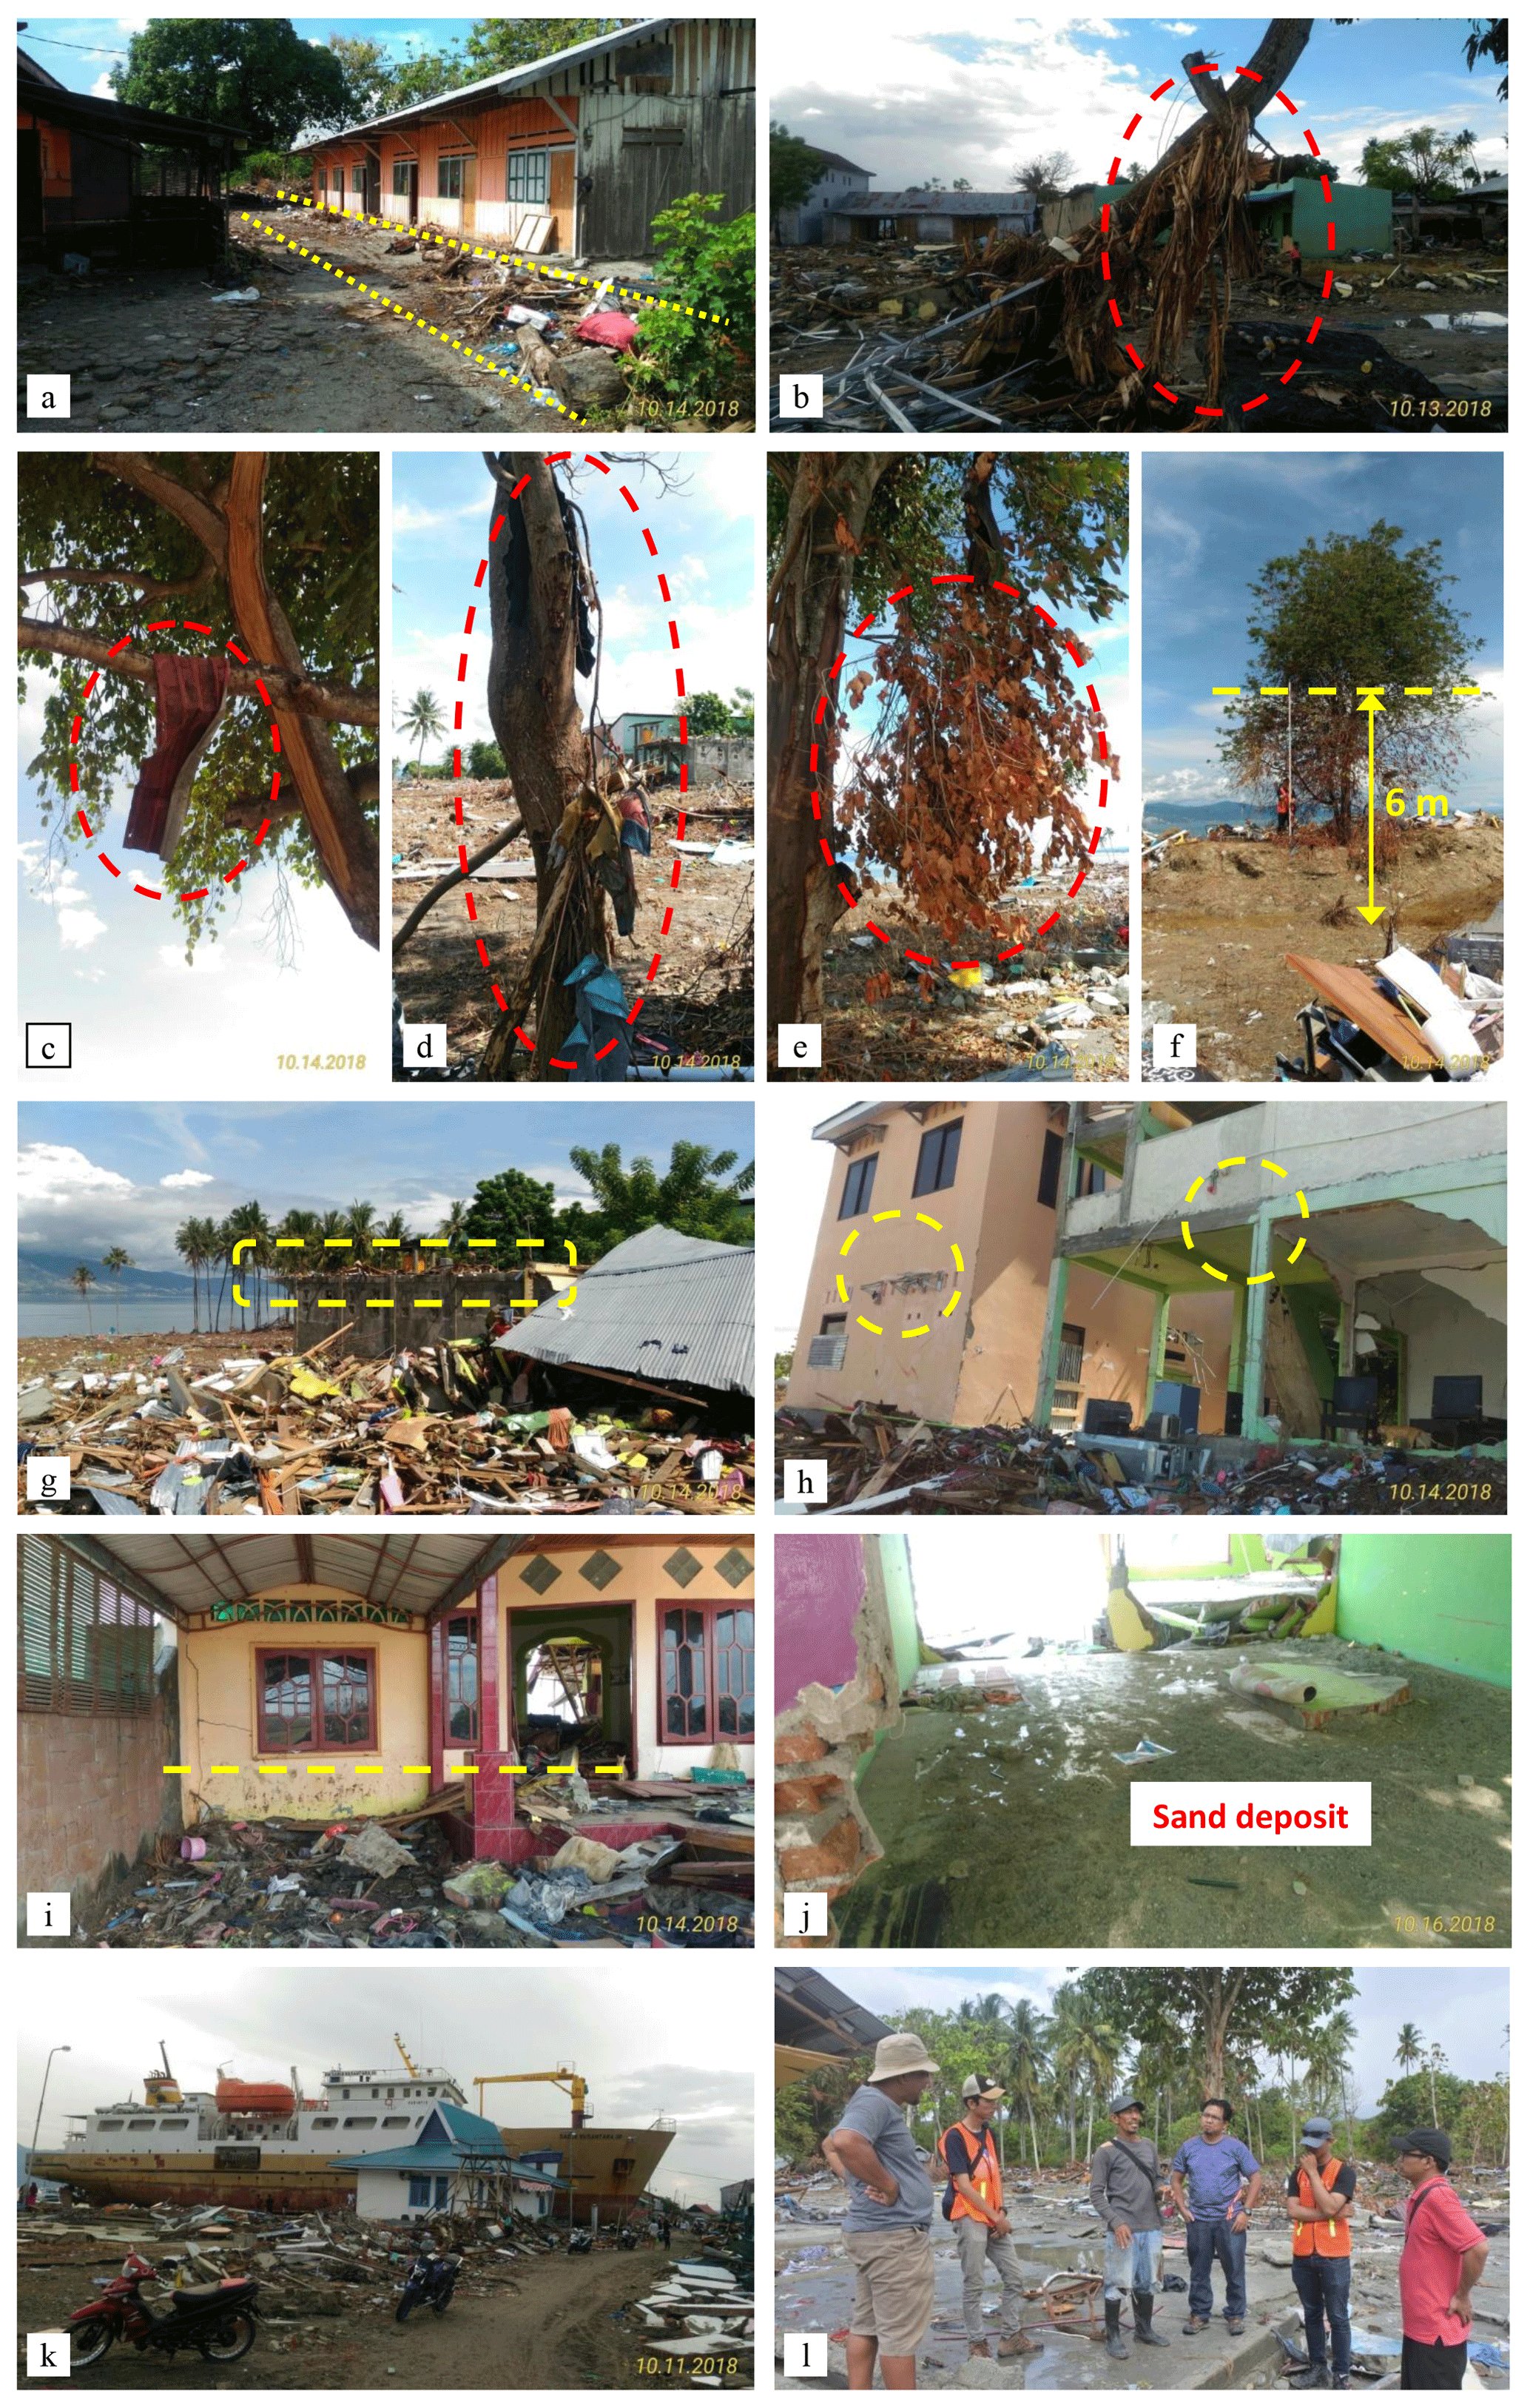
Figure 2Evidence of tsunami run-up and inundation. (a) Debris left behind in the residential area of Tondo, (b) debris caught in a tree in Mamboro, (c) and (d) debris stuck in a tree in Tondo, and (e) leaves turned brown due to being submerged in saltwater. (f) A tree had green leaves at the top and brown at the lower part, indicating the tsunami inundation height (flow depth) limit in Layana. (g) Debris lodged on top of a building, (h) broken house element showing tsunami water level, (i) watermark on a house wall in Lero Village, (j) sand deposit on building floor in Donggala City, (k) a 45 m long ship moved to land in Wani Harbor, and (l) interview with a survivor in Mamboro.
After the physical evidence and/or witnesses confirmed the position of the entry of tsunami water inland, measurements were carried out using conventional measurement instruments. Several laser and optical instruments for terrestrial surveys were operated. The instruments included a total station, a water pass, a prism, a handheld GPS device, a laser distance meter, and some assistance tools. These tools were used to measure height differences and the distance from a point and position. Run-up heights were corrected to calculate heights above sea level at the time of the survey using WXTide software version 4.7. We used Donggala station, the closest station listed in the software, for corrections and assumed no significant variations in sea level inside Palu Bay.
Damage observations were carried out at each site of the survey. We emphasized damage to buildings and infrastructure, although other kinds of damage were noted, such as that to vegetation, the shoreline, and property (e.g., cars, boats). Videos and photographs were produced to assess the damage. Videos recorded along the Trans-Sulawesi Highway were compared to Google Street View©, Google Maps©, and Google Earth© data to assess the distance from damaged regions to the coastline. In addition, detailed measurements of the dimensions of special objects (e.g., bridge) were made to facilitate tsunami force analysis.
Run-up is the maximum ground elevation wetted by the tsunami on a sloping shoreline. In the simplest case, the run-up value is recorded at maximum horizontal inundation distance (IOC Manuals and Guides No. 37, 2014). The measurement results are shown in Table 1 and Figs. 3–5. The measurement values in the table are corrected based on the tides. Run-up height and inundation distance vary from site to site.
The western coast of Palu Bay includes Sites 1 to 6. Site 1 (Donggala City) is located at the mouth of the bay. The run-up height and inundation distance at this site were not significant. Sites 2 and 3, namely Loli Dondo Village and Loli Saluran Village, had similar run-up heights (2.53 and 2.18 m, respectively). Inundation distances were short due to the steep hills towards the mainland. Sites 4 and 5 (Watusampu Village and Tipo Village) had run-up heights of 6.63 and 7.79 m, respectively. The inundation distances were 71.51 and 91.11 m, respectively. High run-up with short inundation was influenced by the steep topography. The highest run-up for the western coast was found in Tipo (7.79 m), followed by Watusampu (6.63 m).
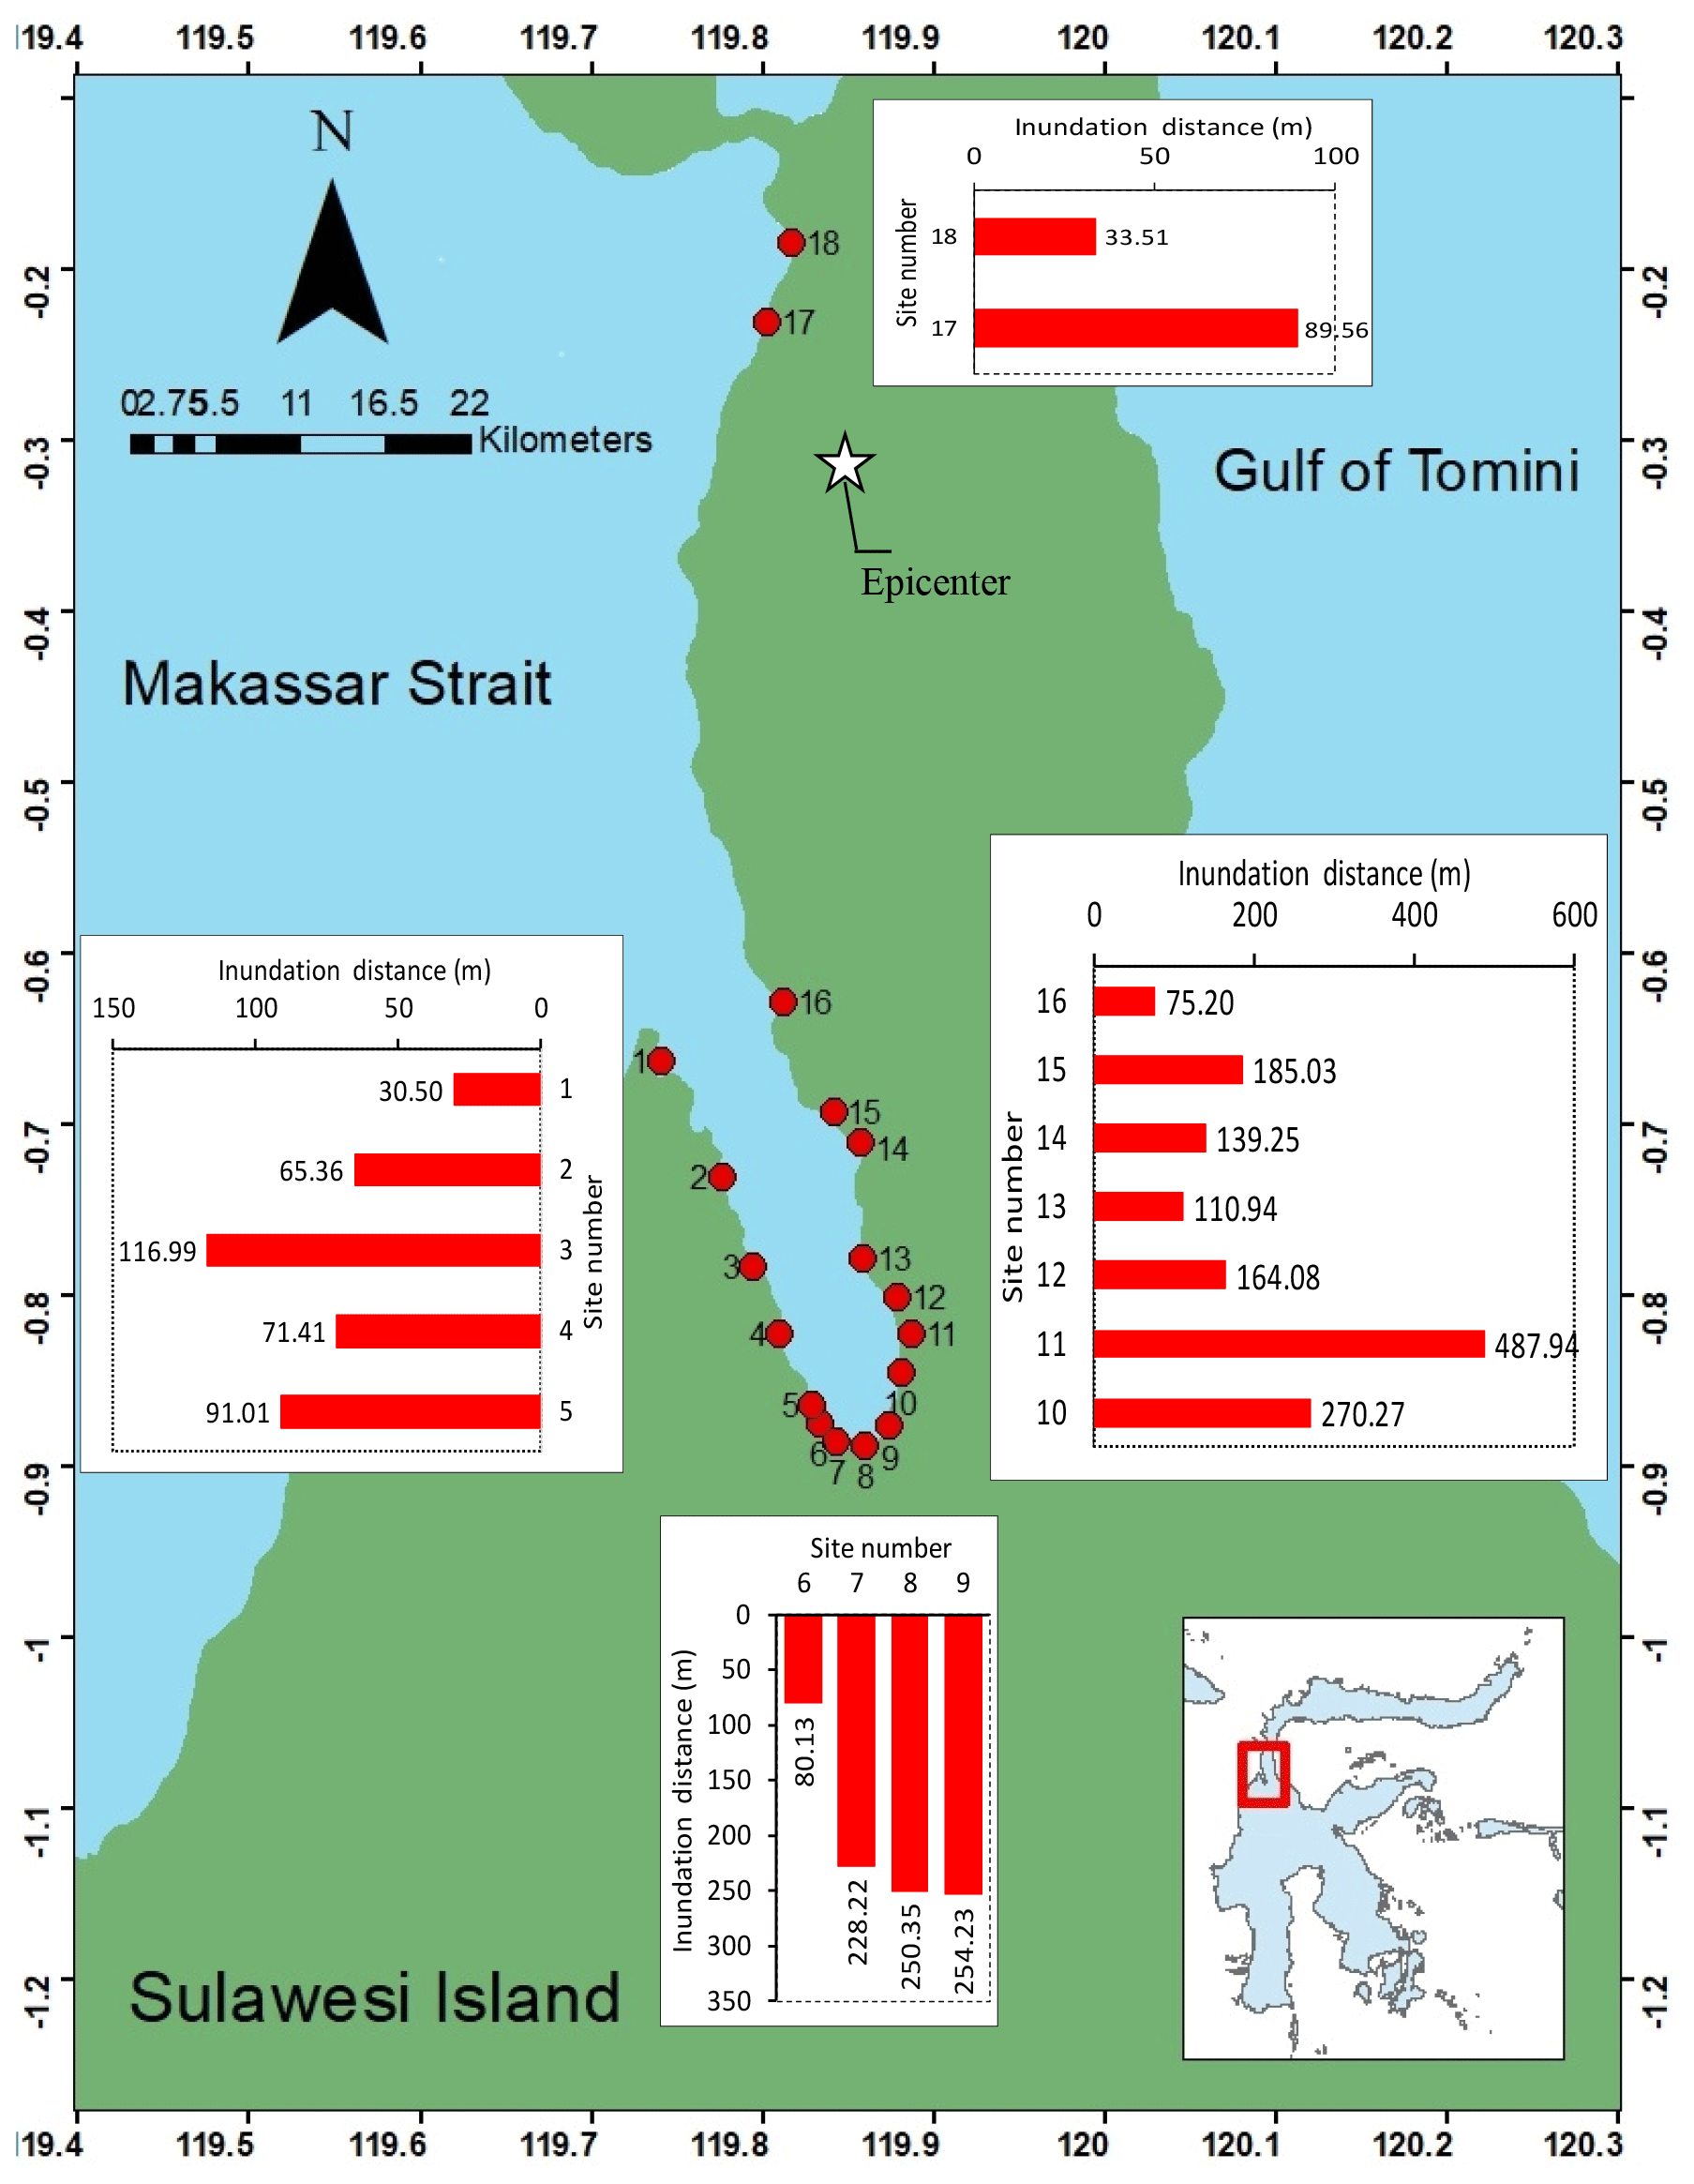
Figure 3Measurement results of inundation distances.

Figure 4Measurement results of run-up heights.
The southern coast of the bay (end of Palu Bay) includes Sites 7 to 9 (Lere, Besusu Barat, and Talise). The run-up heights at Lere and Besusu Barat were low (1.40 and 1.12 m, respectively). Talise had a higher run-up of 3.02 m, but all three sites had almost the same inundation distance (200 to 250 m). The density of buildings in this area seems to have prevented the tsunami from reaching further inland. The flat topography resulted in run-up elevation that did not differ much from sea level.
The eastern coast area of Palu Bay included Sites 10 to 16. Site 10 was located in Tondo. The topography of this area is relatively steep with a slope of 0.06 (6 %). Evidence of tsunami water rise was in the form of debris on top of buildings, truncated building elements, collapsed walls, trash that was carried away, and fixed debris. A survivor showed us the highest places of the tsunami water in this area. A total of four cross sections of the coast were measured by our team. The measured run-up heights were 10.73, 7.97, 10.14, and 8.50 m, respectively, as shown in Table 1. The run-up height of 10.73 m is the highest in this survey (Fig. 5), which left only a few buildings standing. The highest run-up found in the field survey of Omira et al. (2019) was in Benteng Village, with a height of 9.1 m. Benteng Village (on the western coast) is compared with the highest run-up location found in our survey (Tondo, on the eastern coast).
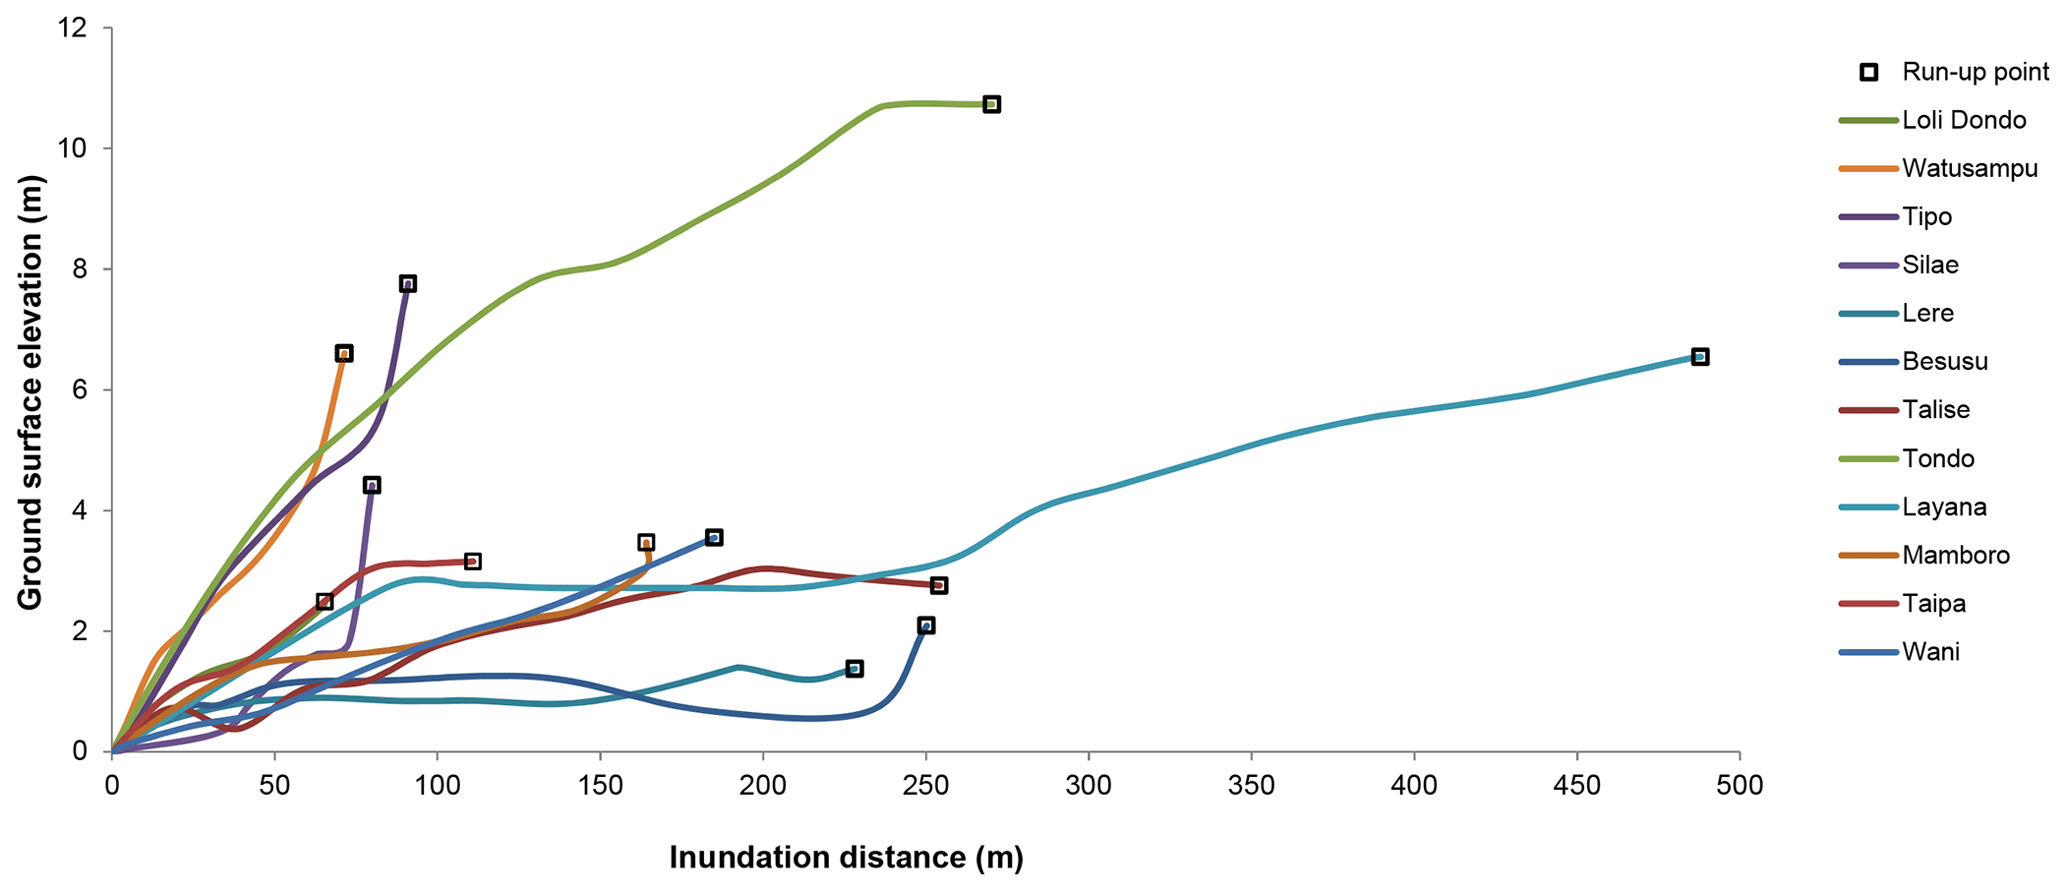
Figure 5Transects of beach where tsunami wave arrived. The longest inundation distance is at the Layana site and the highest run-up is at the Tondo site.
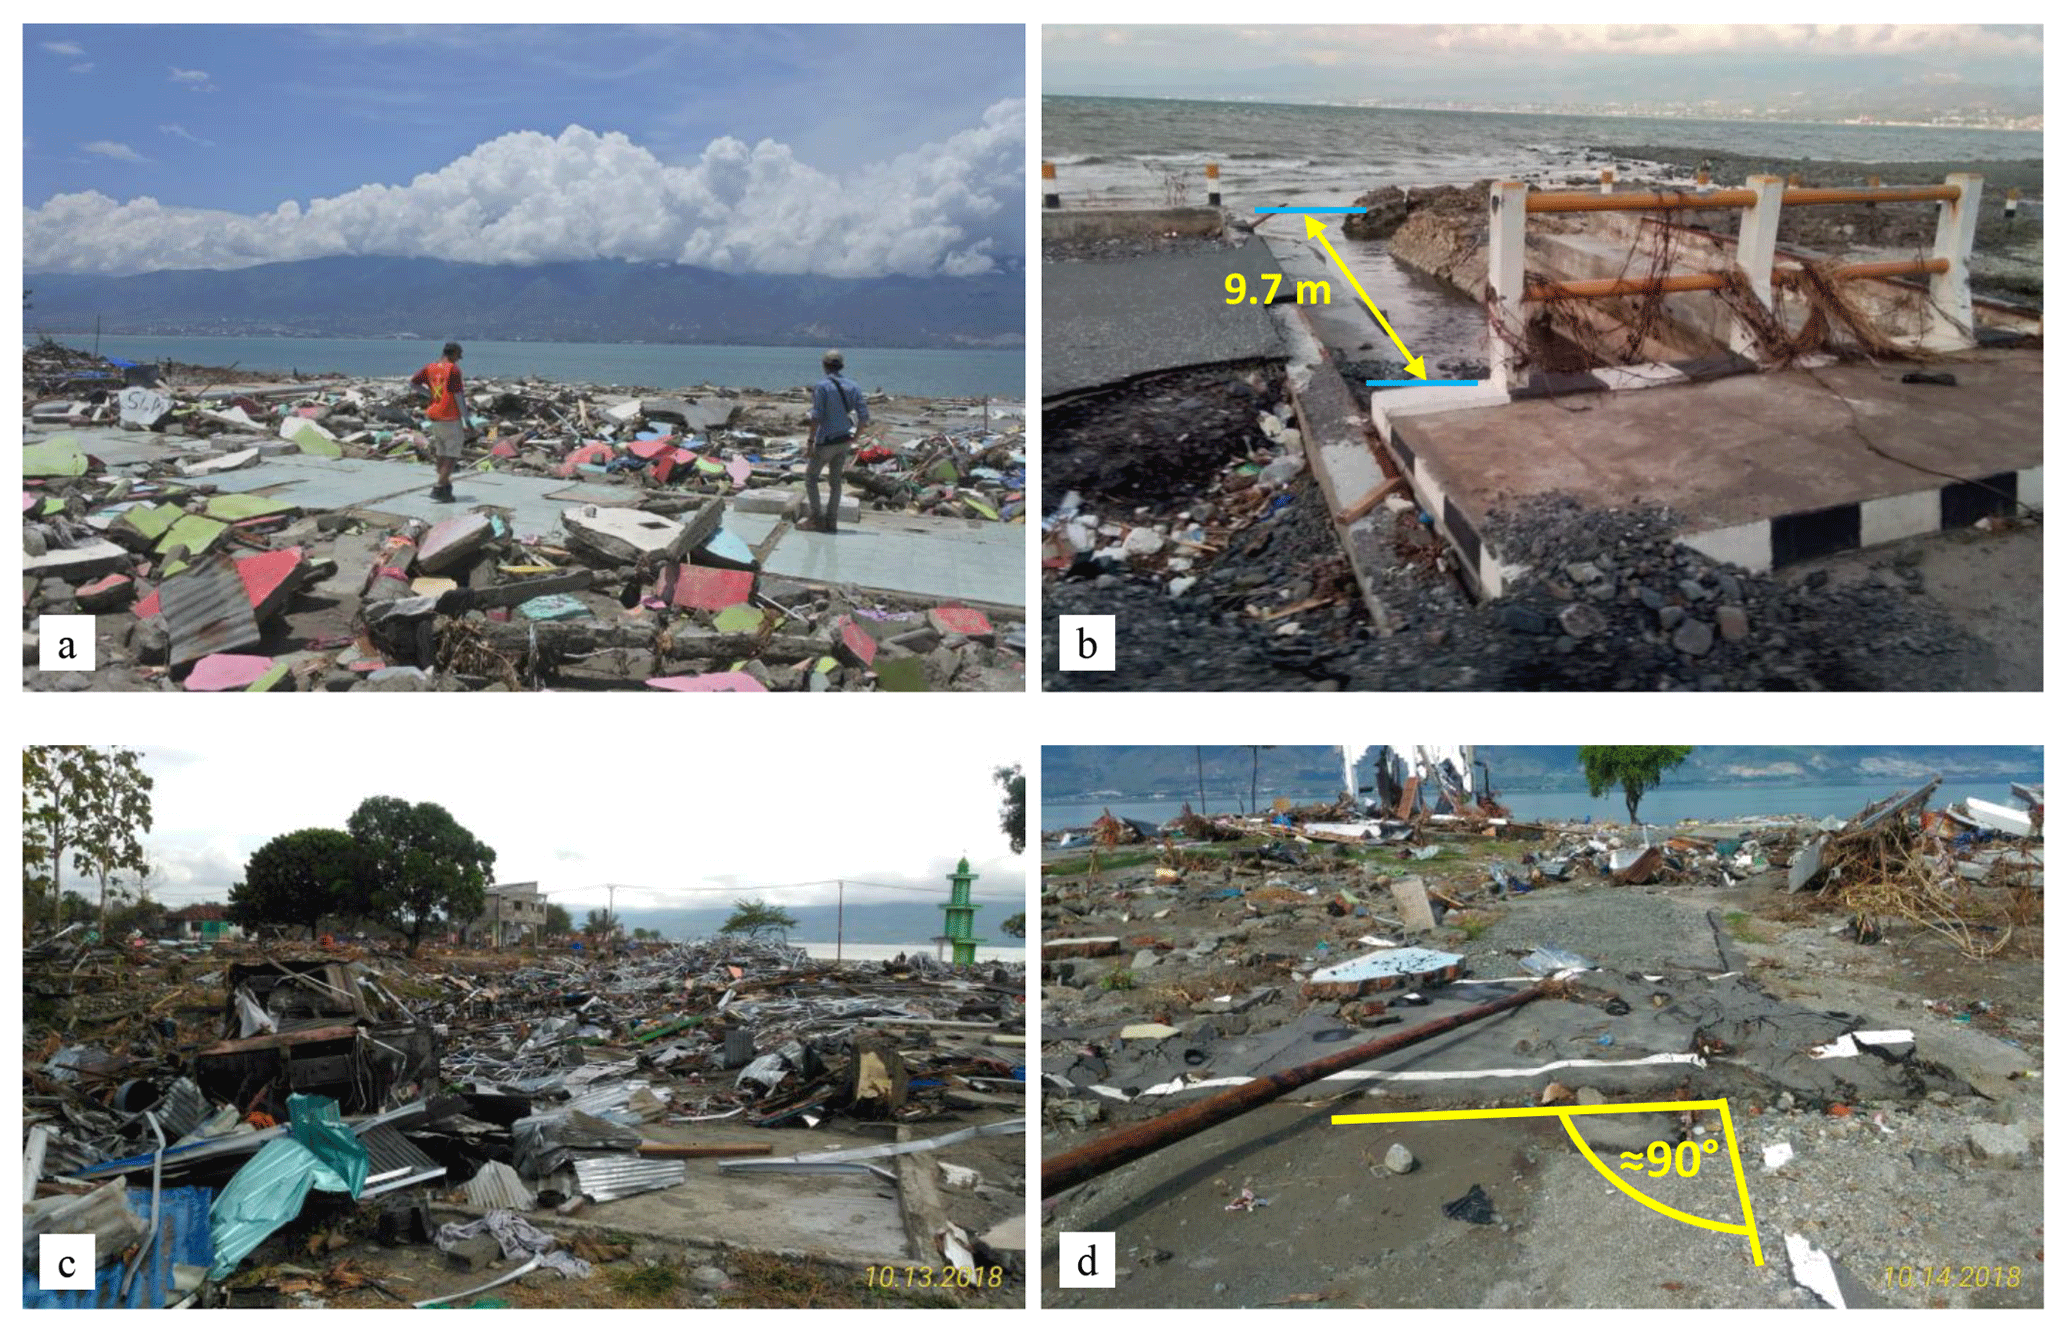
Figure 6(a) Damage caused by the tsunami in Tondo, a residential complex where a lot of private boarding houses were inhabited by students at the University of Tadulako, (b) a reinforced concrete bridge on Cumi-cumi Road in Palu City was shifted by 9.7 m by the tsunami, (c) Mamboro Village with 90 % of houses destroyed, and (d) asphalt layer of small road turned 90∘ in Tondo.
North of Tondo is Site 11 (Layana). The topography of this site is relatively flat with a slope of 0.013 (1.3 %). Because of this sloping topography, the tsunami wave reached as far as 488 m inland. This was the longest distance recorded. The run-up points reached 6.57 m at this site. Both points varied greatly because many buildings have long and wide walls that stemmed the tsunami flow further inland.
Sites 12 and 13 are Mamboro and Taipa. A run-up height of 3.5 m and a flow depth of 5.36 m caused severe damage to houses and casualties in Mamboro. In Taipa, a run-up of 4.88 m reached the roof of the passenger terminal of Taipa Port. North of Pantoloan Port is Wani Port (Site 15). Run-up, inundation, and flow depth were significant at this site (3.58, 185.13, and 5.14 m, respectively). Site 16 (Lero) is the northernmost survey site inside Palu Bay. This site faces Site 1, which also lies at the mouth of Palu Bay. The last two sites were Tanjung Padang and Lende. These sites are located outside Palu Bay and close to the epicenter. A run-up of around 1 m was found at both sites. The coastal area between Sites 16 and 17 has steep slopes (hilly area). No tsunami footage was found for this area.
Arrival time of a tsunami wave is one of the main parameters calculated in tsunami modeling. The time needed for the tsunami wave to propagate from earthquake source location to the coast is defined by the estimated time of arrival (ETA) (Strunz et al., 2011). Tidal records may provide a clue to tsunami arrival time. The tidal station closest to the disaster site is Pantoloan tidal station. This station is located inside Palu Bay, on a pier in Pantoloan Port, and is operated by the Agency of Geospatial Information. When the earthquake and tsunami occurred, the recording equipment was not damaged but the data transfer stopped because the communication network was interrupted. Figures 8 and 9 show the water level recorded when the tsunami arrived. The maximum low tide (6.74 m) was at 18:08 local time and the maximum tide (10.55 m) was at 18:10 local time. This means that the tsunami wave height recorded at the station was 3.8 m. This wave height can be seen more clearly in Fig. 9, which is from the same source as that for Fig. 8. In addition, the first tsunami wave arrived at 18:07, with the wave trough at 18:08 and the wave crest at 18:10 local time (UTC+8).
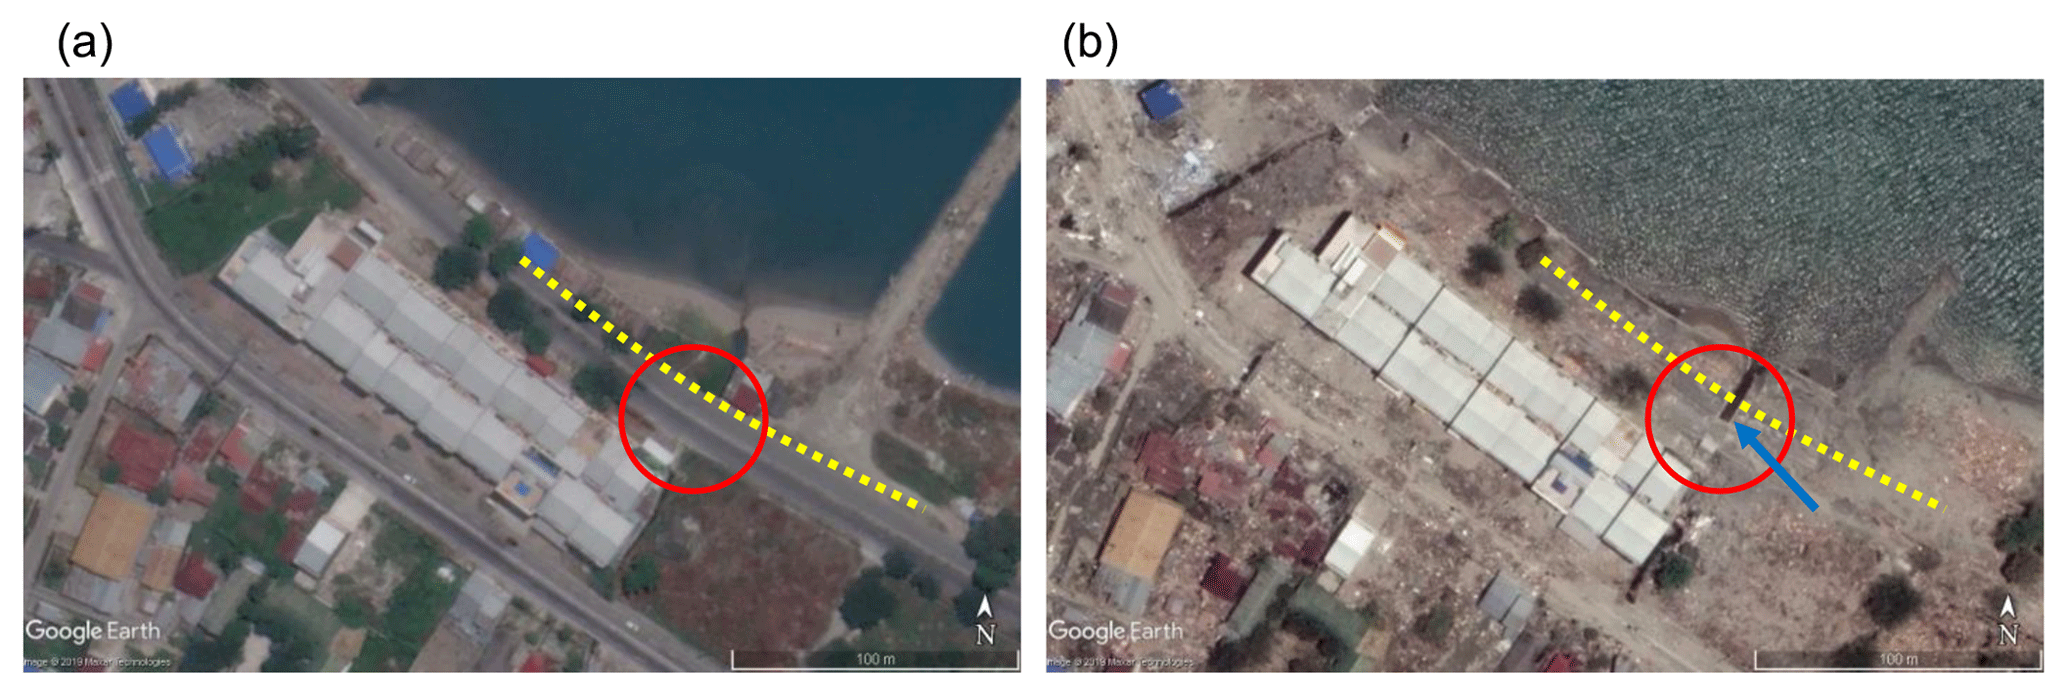
Figure 7Satellite images taken on (a) 17 August and (b) 2 October 2018, showing the bridge shift (images source: Google Earth©).
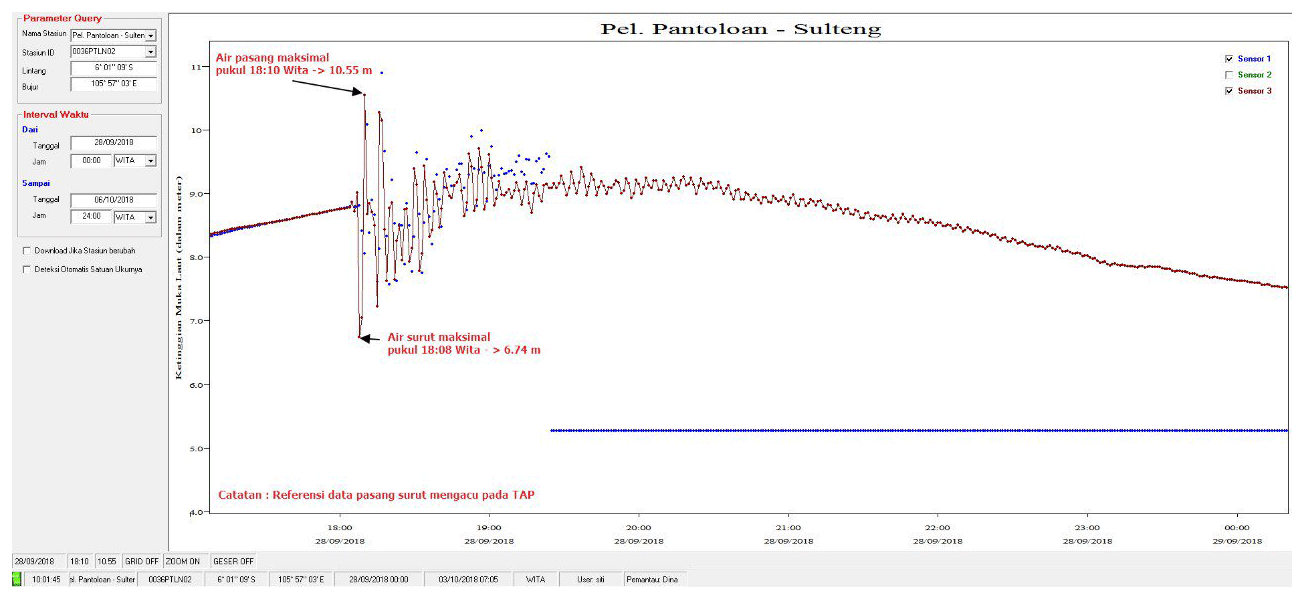
Figure 8Water level recording at the Pantoloan tidal station managed by the Geospatial Information Agency (Sudibyo, 2018a).
Other hints regarding tsunami arrival time are based on videos on social media, the internet, and television, as well as eyewitnesses. More than one tsunami wave hit the coastal zone in Palu Bay. Most witnesses stated that three tsunami waves had arrived. The first was less than 1 m high. The second and third waves were much higher and were quantified by measurements in this survey. The number of tsunami waves and their height order were similar to the 17 July 2006 tsunami in Java. That event also had three tsunami waves, of which the first one was small in height and was followed by the second wave, which was the highest one (Lavigne et al., 2007). Witnesses did not give an exact arrival time of the tsunami wave for the coastal zone in Palu Bay. Generally, they referred to prayer times as a guide. Indonesia is a predominantly Muslim country. The time of the earthquake and tsunami is close to one of the Muslim worship times in the afternoon, which coincides with a sunset prayer called maghrib. The prayer schedule circulated by the Ministry of Religion of the Republic of Indonesia for the area of Palu City and Donggala Regency indicates that the starting time of the maghrib prayer period on 28 September 2018 was 17:58 local time. Normally, there are two calls sounded from a mosque as the starting time sign for praying. The first call is called adzan (or adhan, azan, athan) and the second call is called iqamah (or iqama, iqamat). The period between the two calls is 10 min. Some news, videos, and witnesses show that the tsunami came when people were preparing to pray, between adzan and iqamah. The Mw=7.5 earthquake occurred at 18:04. This shows that the tsunami waves came less than 10 min after the earthquake or between 18:05 and 18:15 local time, different for each site in the disaster area. It was around 3 min in Donggala City and Lero Village and around 10 min at the end of Palu Bay (Lere, Besusu Barat, and Talise) after the main earthquake. The testimony from the witnesses was consistent with the tidal gauge data at Pantoloan station. The important note from the September 2018 event is that the tsunami arrival time was very short.
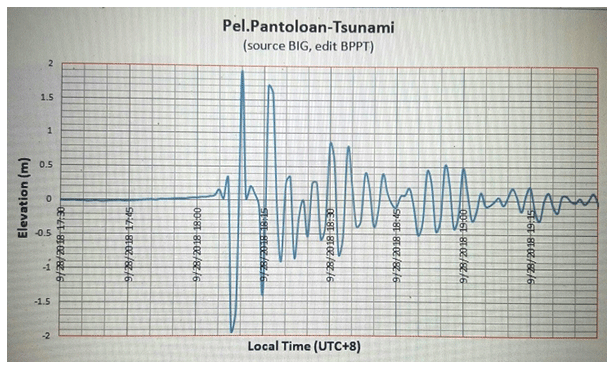
Figure 9Magnified view of Fig. 9, sourced from the Geospatial Information Agency (Sudibyo, 2018b).
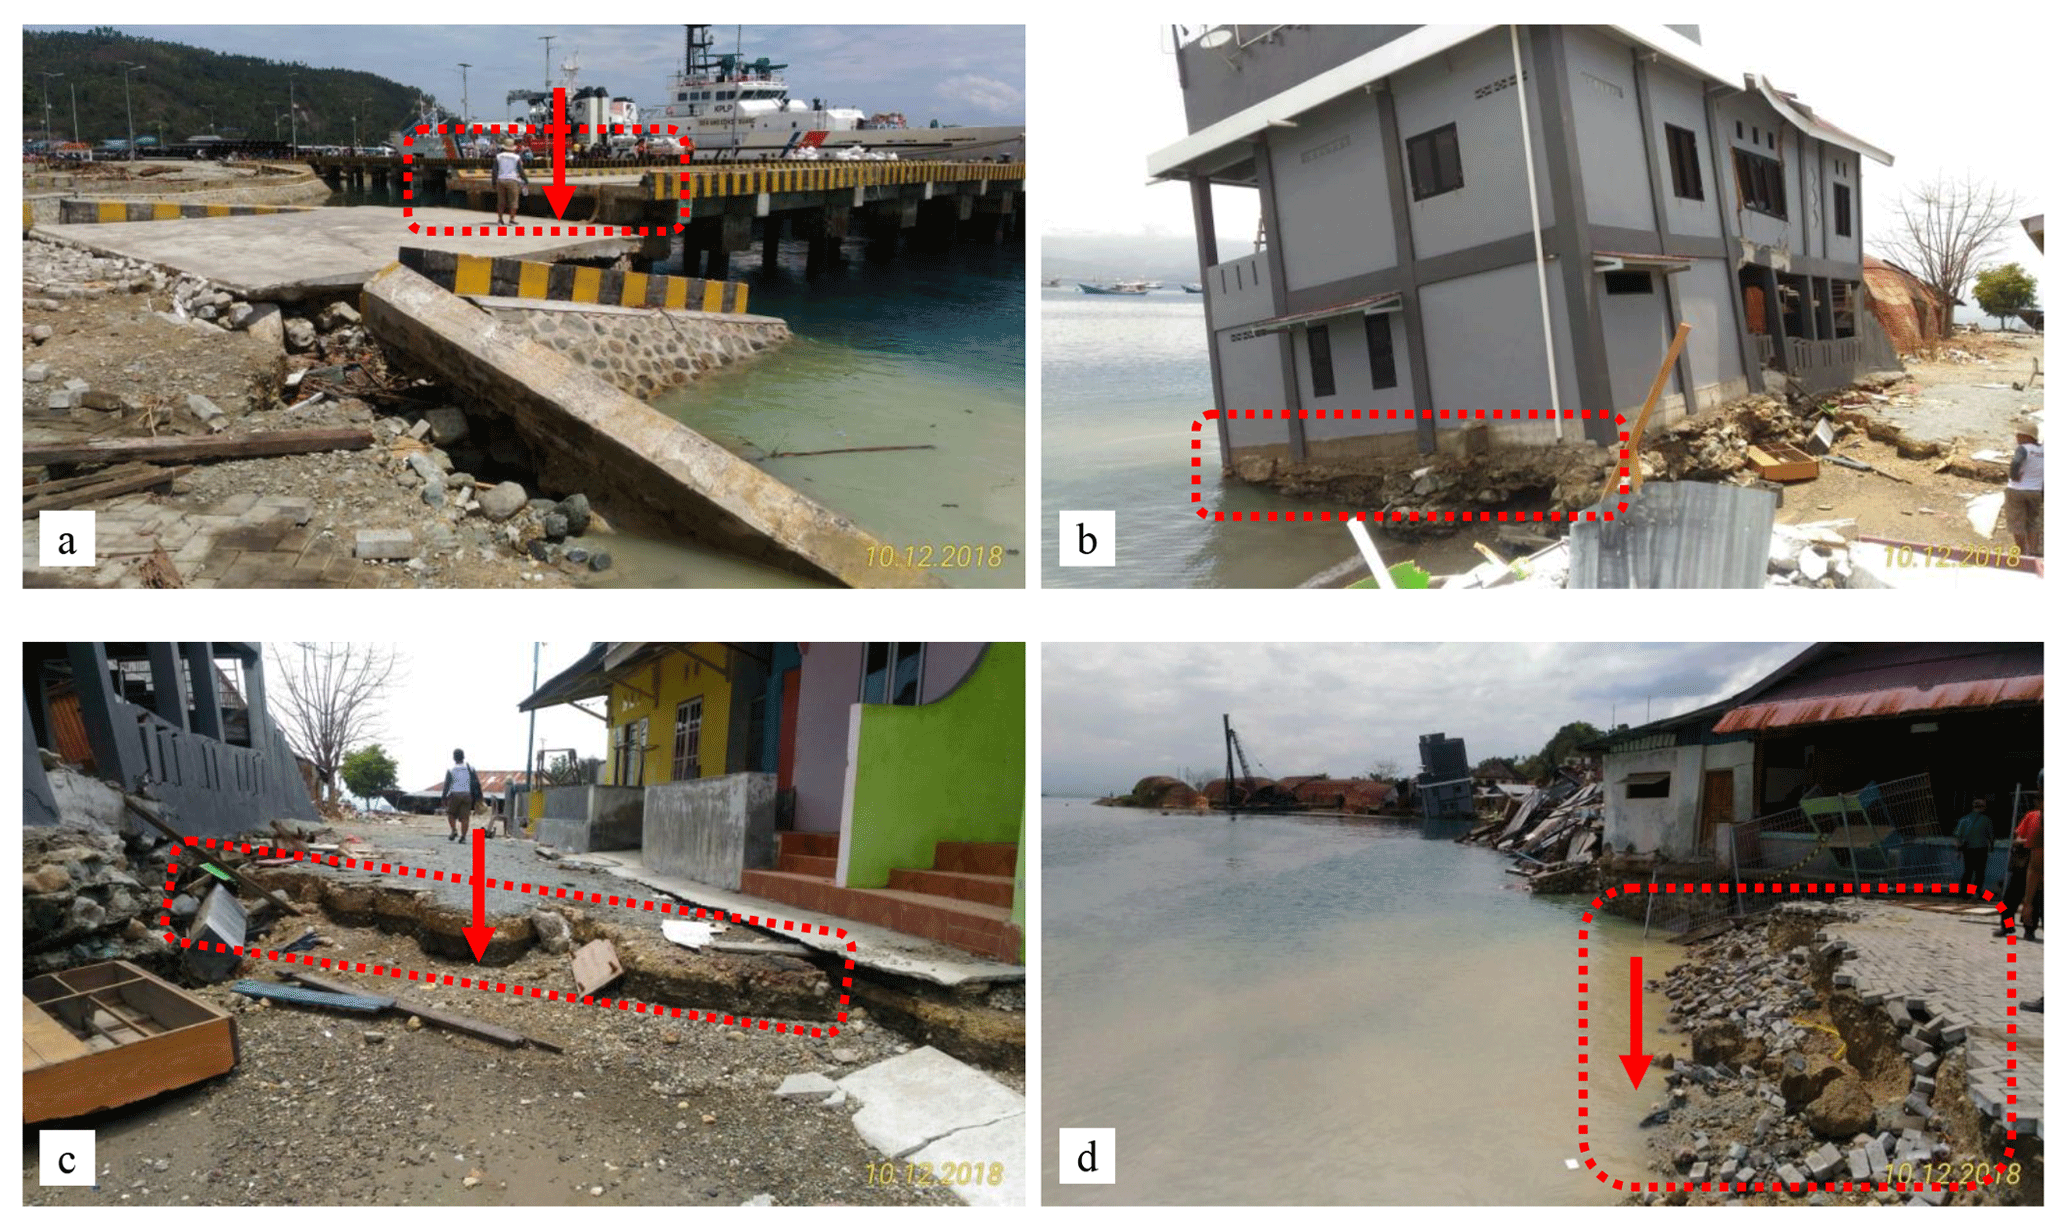
Figure 10Landslide in Donggala City. (a) A trestle dropped 0.8 m in Donggala Port, (b) a building on the seaside slipped down significantly, (c) the surface of an alley in a settlement dropped 0.4 m, and (d) a layered courtyard with paving blocks dropped around 1.5 m.
We categorized damage to buildings and structures caused by the Sulawesi tsunami into three types, namely damage due to earthquake, liquefaction, and tsunami. Damage caused by earthquake is characterized by horizontal collapse, cracking, and fracture structures. Damage due to liquefaction can be characterized by objects and buildings being turned over, rotated, disappeared, sunk in water, or sunk in mud. Damage due to tsunami is characterized by objects, buildings, or structures being washed away from the shoreline by a water current.
Survey sites in the western coastal area of Palu Bay included Sites 1 to 6. Site 1 (Donggala City) is located at the mouth of the bay. This site has a fishing port and an inter-island port. A fisherman who survived the tsunami told us that he was on a ship when the tsunami struck. He saw turbulent water not far from the position of the ships in the vicinity of the port of Donggala. This water propagated towards the wharfs in the ports, causing a fishing boat to rise to the dock.
Sites 2 and 3, namely Loli Dondo Village and Loli Saluran Village, have the same characteristics, with many houses built on the right and left sides of the Trans-Sulawesi Highway. The housings closest to the beach were mostly destroyed, and those closest to the hillside had moderate damage.
Sites 4 and 5 (Watusampu Village and Tipo Village) also have similar characteristics. The topography on the west coast of Palu Bay is steep due to a row of hills. These hills are a source of gravel for building materials. There are thus a lot of gravel quarries at these two sites. At the Watusampu site, measurements were carried out around the naval base of the Indonesian navy, where a navy patrol boat was lifted from its mooring site to the mainland. Near the tip of Palu Bay on the west side is Site 6 (Silae), which is an urban area with a dense population. The main road at this site is very close (20–30 m) to the coastline. Houses around the road were badly damaged. A four-star hotel suffered serious structural damage but did not collapse.
Table 2Land use and damage for each site (photos are available in the Supplement).
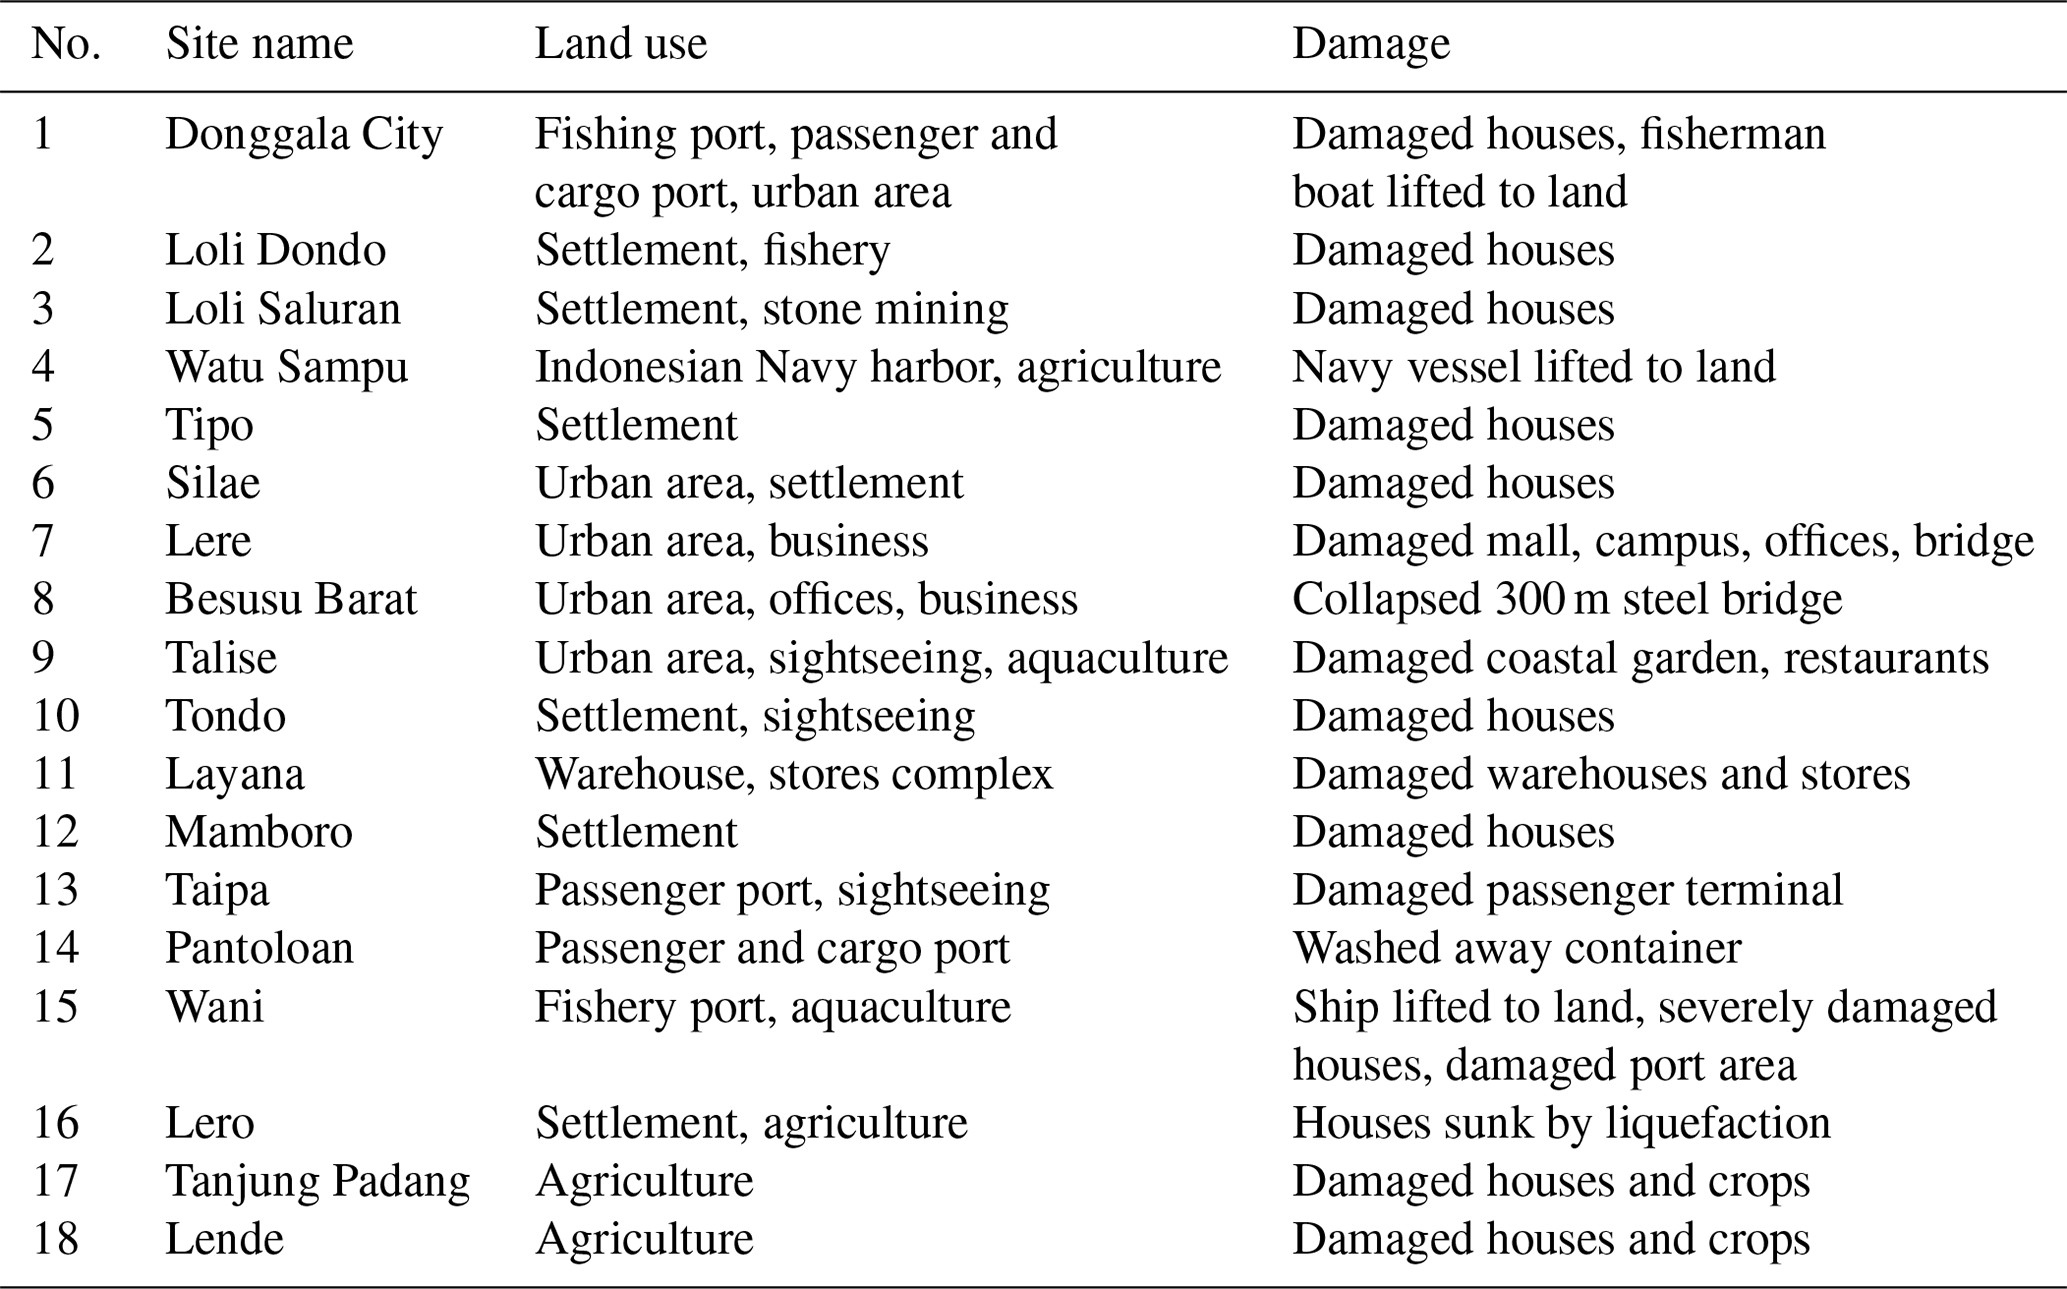
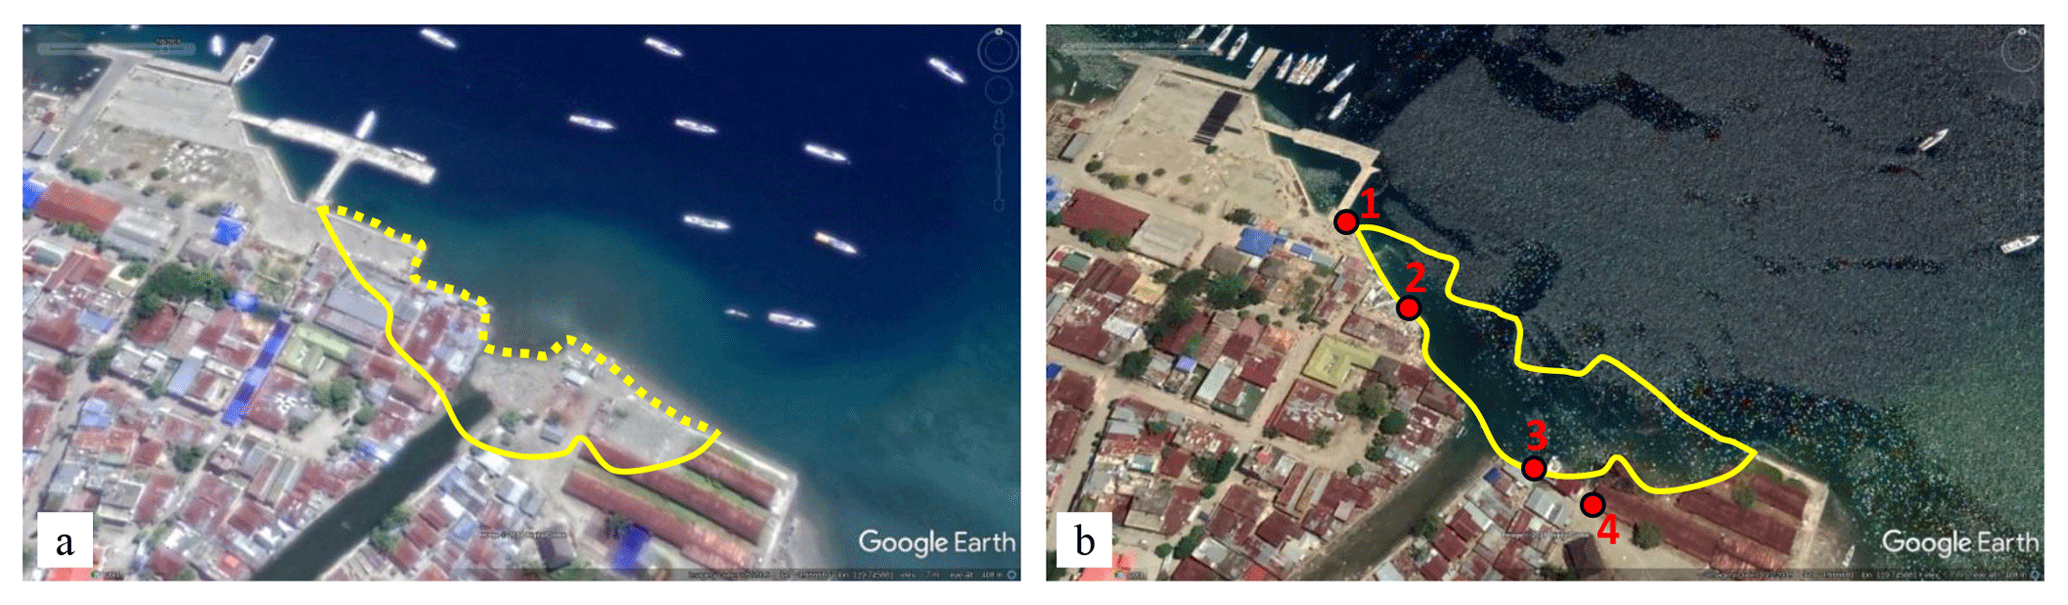
Figure 11Possible landslide areas in Donggala (yellow dotted lines). Images were obtained from Google Earth©. Satellite images taken on (a) 6 July 2016 (more than a year before the earthquake) and (b) 2 October 2018 (4 d after the earthquake and tsunami). The yellow bounded area is around 10 068 m2 or 1 ha. Numbers 1, 2, 3, and 4 in (b) correspond to Fig. 10a, b, c, and d.
The sites on the southern coast of the bay, Sites 7 to 9 (Lere, Besusu Barat, and Talise) at the end of Palu Bay, have a sloping topography and the highest population. They had the most fatalities and the worst damage. In Besusu Barat, a steel bridge with a span of 300 m collapsed. Witnesses who were on the banks of the Palu River during the earthquake and tsunami event said that the bridge collapsed during the earthquake and before the tsunami arrived. Amateur videos taken from the bridge abutment provide clues to the depth of flow. Measurements of trees and small buildings around the bridge indicate that the depth of the tsunami flow reached 4.89 m. The density of buildings in this area seems to have prevented the tsunami from reaching further inland. Most of the victims were at this site because it is a densely populated area, with many offices and much business activity as well as open public spaces. In addition, the Palu Nomoni festival, which attracted large crowds, was taking place at the time of the tsunami on Besusu and Talise beaches and in surrounding areas.
Survey sites in the eastern coast area of Palu Bay were Sites 10 to 16. Site 10 was located in Tondo. This area has many private boarding houses for students of the University of Tadulako, the biggest university in the city of Palu. The topography of this area is relatively steep with a slope of 0.04 (4 %). The run-up height of 10.73 m is the highest in this survey (Fig. 5), and few buildings survived in the area. This area was very crowded during the earthquake and tsunami event. Most students were in their boarding houses during the earthquake because it occurred after working hours. Surprisingly, fewer than 10 deaths were recorded. This is likely due to most of the young residents having the agility to move very quickly when the tsunami arrived.
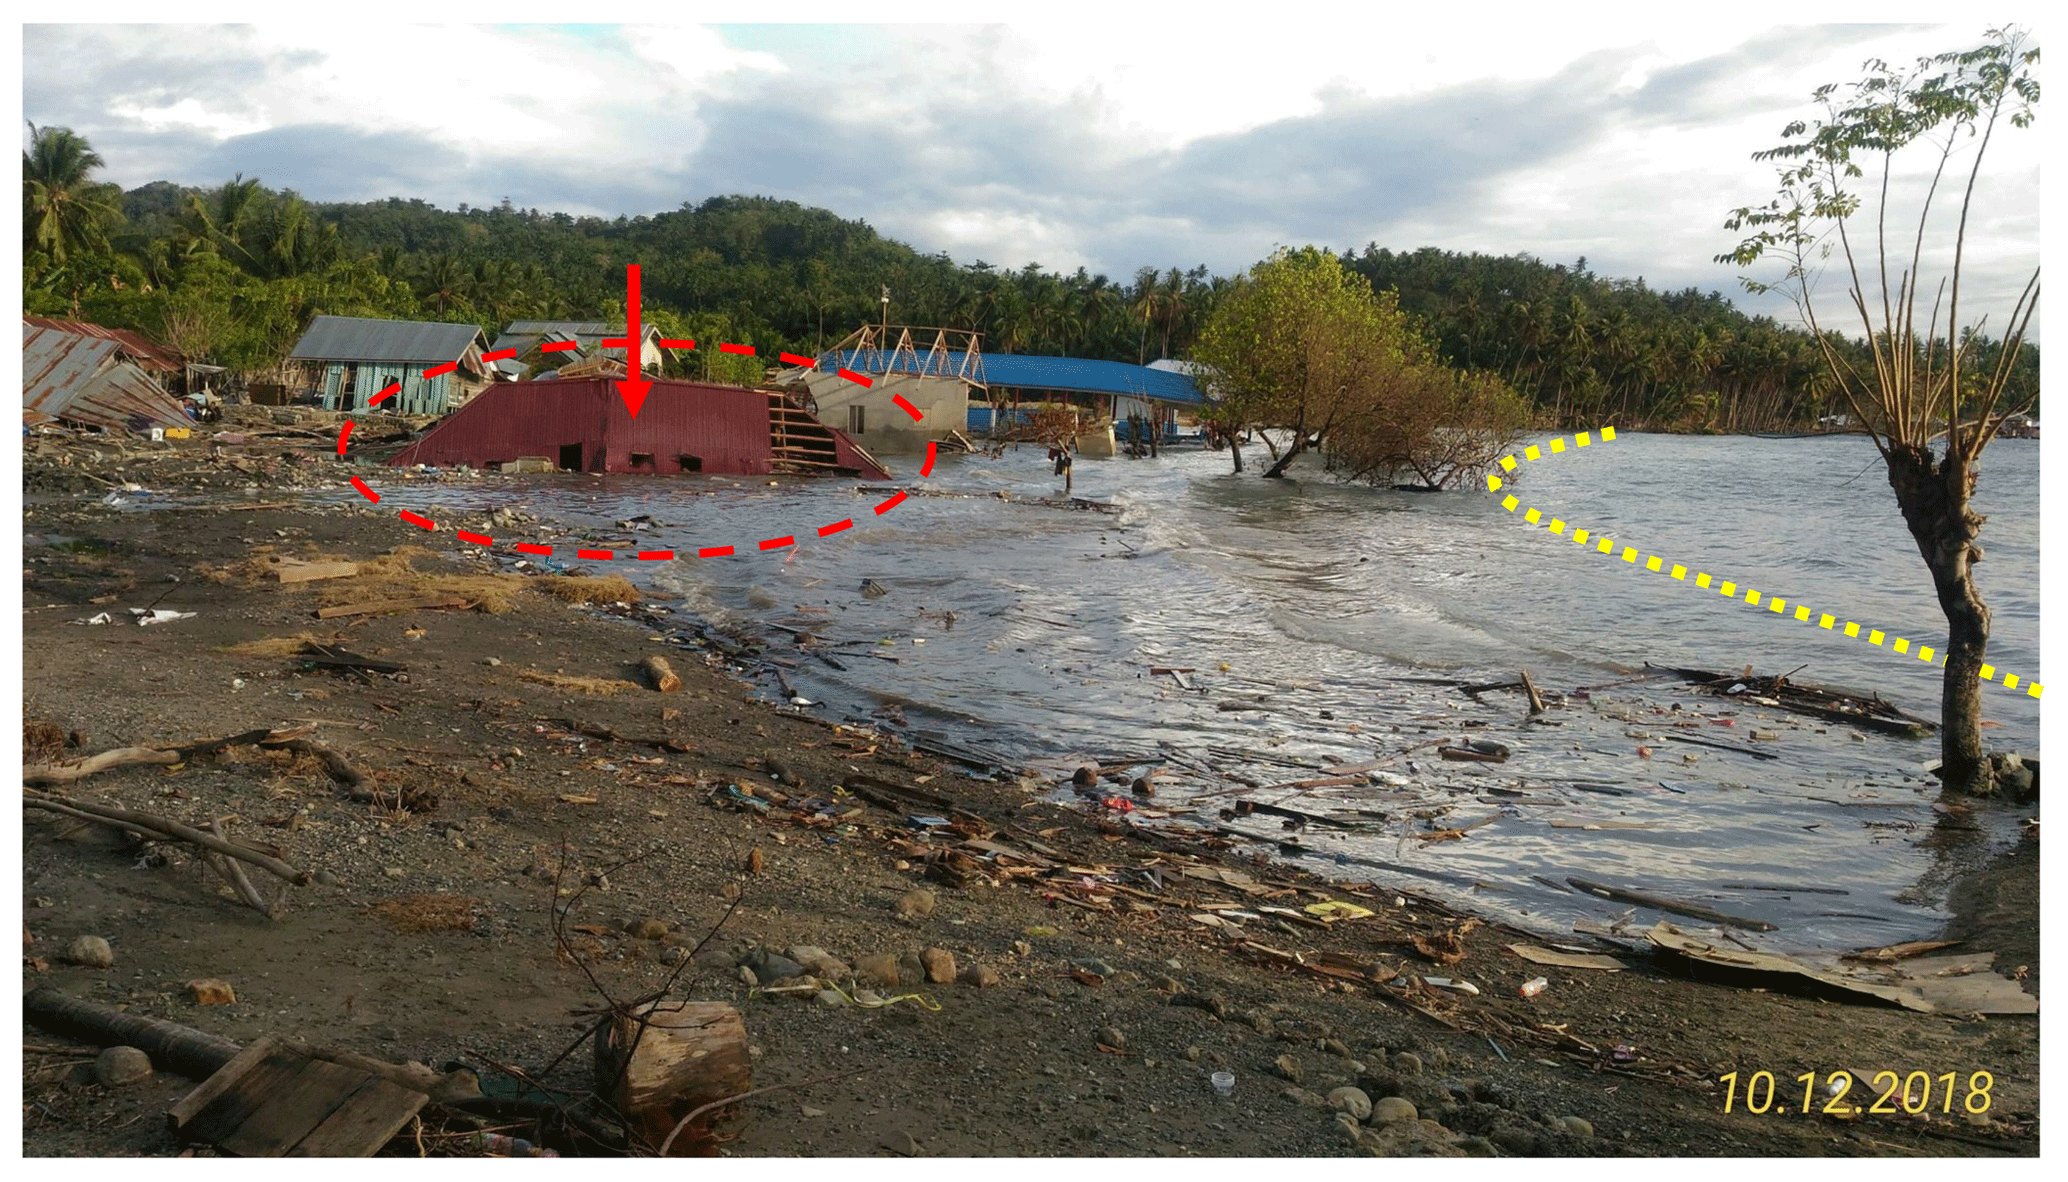
Figure 12Quick land subsidence in Lero Village. Photograph taken 2 weeks after the event. Some houses dropped suddenly, around 3–4 m, when the earthquake occurred. Residents of these houses, especially those indicated by the oval, could not evacuate in time. The yellow dotted line is the former coastline.
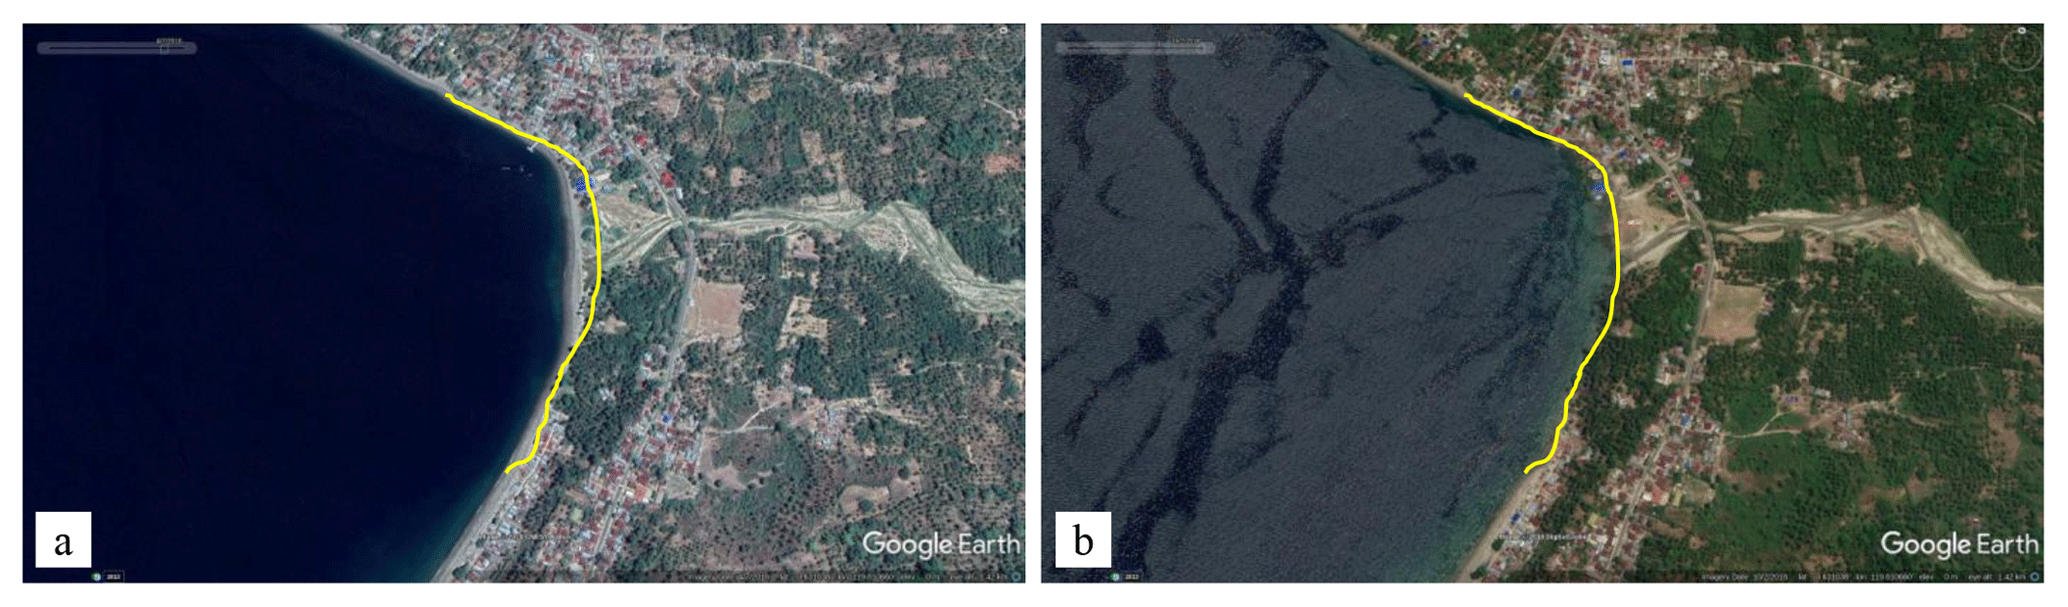
Figure 13Quick land subsidence in Lero Village. Satellite images taken on (a) 7 April 2016 and (b) 2 October 2018, from Google Earth©, showing conditions after the earthquake and tsunami. The area of land that dropped is 22 971 m2 or almost 2.3 ha.
North of Tondo is Site 11 (Layana). This site is a trading complex that supports the economic activities of Palu City in particular and Central Sulawesi Province in general. The buildings damaged at this site functioned as shops, warehouses, and corporate offices. Sites 12 and 13 are Mamboro and Taipa, respectively. A high flow depth of 7.79 m caused severe damage to houses and casualties in Mamboro Village. A stream was covered fully by debris. In Taipa Village, the run-up (4.88 m) and flow (8.40 m) depth devastated the passenger terminal, ferry crane, and navigation control building. Taipa is a passenger port that connects Sulawesi island to other islands. Site 14 (Pantoloan) is the biggest port in the bay. Here, containers floated off and the port crane collapsed. North of Pantoloan Port is Wani Port (Site 15). Here, we found significant damage, especially to the houses of the fishing community, collapsed coastal structures, and a ship that was lifted onto land. Run-up, inundation, and flow depth were significant at this site. Site 16 (Lero) is the northernmost survey site inside Palu Bay. This site faces Site 1 (western coast), which also lies at the mouth of Palu Bay. A small harbor and its facilities were totally destroyed. The last two sites were Tanjung Padang and Lende. These sites are located outside Palu Bay and close to the epicenter. The tsunamis were similar to tidal waves. They destroyed some houses and agricultural land. The coastal area between Sites 16 and 17 has steep slopes (hilly area). It has very few houses. No tsunami impact was found.
We made videos to document the damage along the Trans-Sulawesi Highway and compared them to Google Street View® data recorded before the tsunami occurrence. The videos showed that severe damage was limited to within 150 m from the coastline. The impact of the tsunami on structures and the coastal environment is summarized in Table 2.
Detailed measurements of a reinforced concrete bridge with simple support beams on Cumi-cumi Road, near Palu Grand Mall, Palu City (Fig. 6b) were taken. This bridge was shifted by as much as 9.7 m. It provided clues regarding the strength of the tsunamis. This bridge is made of reinforced concrete with a bridge span of 5.0 m and a width of 19.1 m. It passed over an open channel, which had a width of 4.1 m and a depth of 1.6 m. It had 14 beam girders with dimensions of 0.25 m×0.30 m and a girder distance of 1.35 m (its sketch is available in the Supplement). Its plate had a thickness of 0.20 m. Based on these dimensions, the surface area of the bridge was 244.7 m2, the volume was 23.4 m3, and the mass was estimated to be around 56 t. The bridge was estimated to have been submerged by tsunami water as deep as 3.0–4.5 m based on the tsunami marks around it (Site 7, Lere). Debris caught in the bridge fence (Fig. 6b) provided evidence of the tsunami water soaking the bridge. The shift stopped because the bridge body was stuck in the wall of a building. Furthermore, we investigated this case with the help of Google Earth©, as shown in Fig. 7a and b, which show satellite images taken on 17 August and 2 October 2018, respectively. As shown, the asphalt layer of the road was broken and the bridge over the open channel was shifted away from the coast by the tsunami. The position of this bridge is at the end of Palu Bay (0.88123∘ S; 119.83907∘ E).
Total coastal landslides in Palu Bay related to the 28 September 2018 event occurred at seven locations (Sassa and Takagawa, 2019), six locations (Arikawa, 2018), or 10 locations (Omira et al., 2019). Our team found two additional locations of coastal landslides. These are landslide locations not found by other survey teams. The two locations are around the river mouth in Donggala City (Figs. 10 and 11) and around the river mouth in Lero Village (Figs. 12 and 13). Landslides in Donggala were indicated by the loss of land around the Donggala River. Around 30 houses were reported to have suddenly sunk along with some of the residents. The wharf in the port of Donggala dropped by about 80 cm. The pile that was being installed for the foundation of a large building sank deep into the soil layer suddenly and was lost.
In Lero Village, some houses and their inhabitants drowned when the tremor struck. Figure 12 shows a house going down, with the ceiling at the position of the original floor. A typical house in Indonesia has a ceiling height of 3 to 4 m. This indicates that the landslide in Lero Village lowered the land surface by 3 to 4 m. In addition, an eyewitness reported that the seabed around 10 m from the coastline changed from 1 m deep to a depth that made the seabed invisible to the naked eyes. He heard a roaring sound a minute after the main earthquake.
This study reported the results of a post-tsunami field survey conducted after the 2018 Sulawesi tsunami. The results show that the run-up height reached 10.73 m in Tondo and the inundation distance was 488 m in Layana. The Tondo area has a steeply sloped coast whereas the Layana area has a flat topography. Flow depths of more than 2 m were found at sites that had significant damage. Tsunami events were concentrated in the bay, which indicates that the source of the tsunami must have been inside the bay. Most people interviewed in the survey area testified that there were three main tsunami waves that reached the coastal zone in Palu Bay. The second was the highest. The arrival time of the waves varied according to location. It was around 3 min in Donggala City and Lero Village, and around 10 min at the end of Palu Bay (Lere, Besusu Barat, and Talise) after the main Mw=7.5 earthquake event.
The tsunami waves that hit the coastal zone in Palu Bay were very strong, as indicated by massive damage at each site we surveyed. Severe damage was limited to within 150 m from the coastline. This includes the shifting of a 56 t bridge. The coastal landslides detected by our team in Donggala City (lost surface area of 10 068 m2) and Lero Village (lost surface area of 22 971 m2) are additional evidence of the coastal landslides found by other teams. Multiple landslide events may motivate the development of a tsunami model that is capable of simulating tsunamis generated by consecutive earthquake and landslide events, or simultaneous landslide events. Furthermore, landslides should be included in probabilistic tsunami hazard assessment, as done by Horspool et al. (2014) for Indonesia and for earthquake sources. The data and analysis from this survey and those from other teams will lead to a comprehensive and complete understanding of the September 2018 Sulawesi tsunami.
Data can be made available by the authors upon request.
The supplement related to this article is available online at: https://doi.org/10.5194/nhess-19-2781-2019-supplement.
WW and SCH designed the field survey. WW and PBS conducted the field survey in the disaster area. WW wrote original draft. SCH managed funding acquisition. RTI corresponded with government offices and provided early information. All authors contributed to the discussion and interpretation of the results.
The authors declare that they have no conflict of interest.
Thanks are due to Universitas Jenderal Soedirman, Indonesia, especially the Department of Civil Engineering and the Community Service Institution (LPPM Unsoed), which mobilized surveyors, students, and instruments to the disaster area. Authors highly appreciate Arvandi from the Agency of Public Works and Community Housing, Division of Municipal and Water Resources, Central Sulawesi Province for special assistance during our activities in the Palu Bay area. In addition, the authors also highly appreciate Sanidhya Nika Purnomo for our discussion on geographical information.
This research has been supported by the Ministry of Science and Technology, Taiwan (grant no. MOST 107-2221-E-006-080), and the Water Resources Agency (grant no. MOEAWRA 1080412).
This paper was edited by Mauricio Gonzalez and reviewed by two anonymous referees.
Arikawa, T., Muhari, A., Okumura, Y., Dohi, Y., Afriyanto, B., Sujatmiko, K. A., and Imamura, F.: Coastal Subsidence Induced Several Tsunamis During the 2018 Sulawesi Earthquake, J. Disaster Res., 13, sc20181204, https://doi.org/10.20965/jdr.2018.sc20181201, 2018.
Bellier, O., Siame, L., Beaudouin, T., Villeneuve, M., and Braucher, R.: High slip rate for a low seismicity along the Palu-Koro active fault in Central Sulawesi (Indonesia), Terra Nova, 13, 463–470, https://doi.org/10.1046/j.1365-3121.2001.00382.x, 2001.
BMKG: Katalog Gempabumi (Earthquake Catalog), available at: http://repogempa.bmkg.go.id/repo_new/repository.php, last access: 1 December 2018.
BPS-Statistics of Donggala Regency: Donggala Regency in Figures 2018, Donggala, 2018.
BPS-Statistics of Palu Municipality: Palu Municipatiy in Figures 2018, edited by: BPS-Statistics of Palu Municipality, BPS-Statistics of Palu Municipality, Palu, 2018.
BPS-Statistics of Sigi Regency: Sigi Regency in Figures 2018, Sigi, 2018.
Hadi, S. and Kurniawati, E.: Jumlah Korban Tewas Terkini Gempa dan Tsunami Palu 2.113 Orang, available at: https://nasional.tempo.co/read/1138400/jumlah-korban-tewas-terkini, 2018 (in Bahasa Indonesia).
Horspool, N., Pranantyo, I., Griffin, J., Latief, H., Natawidjaja, D. H., Kongko, W., Cipta, A., Bustaman, B., Anugrah, S. D., and Thio, H. K.: A probabilistic tsunami hazard assessment for Indonesia, Nat. Hazards Earth Syst. Sci., 14, 3105–3122, https://doi.org/10.5194/nhess-14-3105-2014, 2014.
IOC Manuals and Guides No. 37: International Tsunami Survey Team (ITST) Post-Tsunami Survey Field Guide, 2nd ed., edited by: Dominey-Howes, D., Dengler, L., Cunnen, J., and Aarup, T., the United Nations Educational, Scientific and Cultural Organization, Paris, 2014.
Latief, H., Puspito, N. T., and Fumihiko, I.: Tsunami Catalog and Zones in Indonesia, J. Nat. Disaster Sci., 22, 25–43, 2000.
Lavigne, F., Gomez, C., Giffo, M., Wassmer, P., Hoebreck, C., Mardiatno, D., Prioyono, J., and Paris, R.: Field observations of the 17 July 2006 Tsunami in Java, Nat. Hazards Earth Syst. Sci., 7, 177–183, https://doi.org/10.5194/nhess-7-177-2007, 2007.
Lynett, P. J., Borrero, J. C., Liu, P. L. F., and Synolakis, C. E.: Field survey and numerical simulations: A review of the 1998 Papua New Guinea tsunami, Pure Appl. Geophys., 160, 2119–2146, https://doi.org/10.1007/s00024-003-2422-0, 2003.
Maramai, A. and Tinti, S.: The 3 June 1994 Java Tsunami: A post-event survey of the coastal effects, Nat. Hazards, 15, 31–49, https://doi.org/10.1023/A:1007957224367, 1997.
Mikami, T., Shibayama, T., Esteban, M., Takabatake, T., Nakamura, R., Nishida, Y., Achiari, H., Rusli, Marzuki, A. G., Marzuki, M. F. H., Stolle, J., Krautwald, C., Robertson, I., Aránguiz, R., and Ohira, K.: Field Survey of the 2018 Sulawesi Tsunami: Inundation and Run-up Heights and Damage to Coastal Communities, Pure Appl. Geophys., 176, 3291–3304, https://doi.org/10.1007/s00024-019-02258-5, 2019.
Muhari, A., Imamura, F., Koshimura, S., and Post, J.: Examination of three practical run-up models for assessing tsunami impact on highly populated areas, Nat. Hazards Earth Syst. Sci., 11, 3107–3123, https://doi.org/10.5194/nhess-11-3107-2011, 2011.
Muhari, A., Imamura, F., Arikawa, T., and Afriyanto, B.: Finding of the unexpected tsunami due to the strike-slip fault at central Sulawesi, Indonesia on 28 September 2018, from the preliminary field survey at Palu, Temblor, available at: http://temblor.net/earthquake-insights/finding-of-the-unexpected-tsunami-due-to (last access: 5 December 2019), 2018.
Omira, R., Dogan, G. G., Hidayat, R., Husrin, S., Prasetya, G., Annunziato, A., Proietti, C., Probst, P., Paparo, M. A., Wronna, M., Zaytsev, A., Pronin, P., Giniyatullin, A., Putra, P. S., Hartanto, D., Ginanjar, G., Kongko, W., Pelinovsky, E., and Yalciner, A. C.: The September 28th, 2018, Tsunami In Palu-Sulawesi, Indonesia: A Post-Event Field Survey, Pure Appl. Geophys., 176, 1379–1395, https://doi.org/10.1007/s00024-019-02145-z, 2019.
Prasetya, G. S., De Lange, W. P., and Healy, T. R.: The Makassar Strait Tsunamigenic Region, Nat. Hazards, 24, 295–307, https://doi.org/10.1023/A:1012297413280, 2001.
Putra, P. S., Aswan, A., Maryunani, K. A., Yulianto, E., and Kongko, W.: Field Survey of the 2018 Sulawesi Tsunami Deposits, Pure Appl. Geophys., 176, 2203–2213, https://doi.org/10.1007/s00024-019-02181-9, 2019.
Sassa, S. and Takagawa, T.: Liquefied gravity flow-induced tsunami: first evidence and comparison from the 2018 Indonesia Sulawesi earthquake and tsunami disasters, Landslides, 16, 195–200, https://doi.org/10.1007/s10346-018-1114-x, 2019.
Strunz, G., Post, J., Zosseder, K., Wegscheider, S., Mück, M., Riedlinger, T., Mehl, H., Dech, S., Birkmann, J., Gebert, N., Harjono, H., Anwar, H. Z., Sumaryono, Khomarudin, R. M., and Muhari, A.: Tsunami risk assessment in Indonesia, Nat. Hazards Earth Syst. Sci., 11, 67–82, https://doi.org/10.5194/nhess-11-67-2011, 2011.
Sudibyo, M.: Wave record from the tidal station of the Pantoloan port, Palu city at the time of tsunami event, available at: https://twitter.com/marufins/status/1047467798996242433, last access: 20 December 2018a.
Sudibyo, M.: Gempa dan Tsunami Donggala-Palu 2018 (2), Tsunami Tak-Biasa Itu dan Takdir Kebumian Kota Palu, available at: https://ekliptika.wordpress.com/2018/10/07/gempa-dan-tsunami-donggala-palu-2018-2-tsunami last access: 20 December 2018b.
Synolakis, C. E. and Okal, E. A.: 1992–2002: Perspective on Decade of Post-Tsunami Surveys, in Tsunamis: Case Studies and Recent Developments, edited by: Satake, K., Springer Science & Business Media, 1–29, 2005.
Takagi, H., Pratama, M. B., Kurobe, S., Esteban, M., Aránguiz, R., and Ke, B.: Analysis of generation and arrival time of landslide tsunami to Palu City due to the 2018 Sulawesi earthquake, Landslides, 16, 983–991, https://doi.org/10.1007/s10346-019-01166-y, 2019.
Ulrich, T., Vater, S., Madden, E. H., Behrens, J., van Dinther, Y., van Zelst, I., Fielding, E. J., Liang, C., and Gabriel, A. A.: Coupled, Physics-Based Modeling Reveals Earthquake Displacements are Critical to the 2018 Palu, Sulawesi Tsunami, Pure Appl. Geophys., 176, 4069–4109, https://doi.org/10.1007/s00024-019-02290-5, 2019.
Yalciner, A. C., Synolakis, C. E., Alpar, B., Borrero, J. C., Altinok, Y., Imamura, F., Tinti, S., Ersoy, S., Kuran, U., Pamukcu, S., and Kanoglu, U.: Field surveys and modeling of the 1999 Izmit tsunami, ITS 2001 Proceedings, Session 4, 4–6, 2001.
Yalciner, A. C., Rahman Hidayat, R., Husrin, S., Prasetya, G., Annunziato, A., Doğan, G. G., Zaytsev, A., Omira, R., Proietti, C., Probst, P., Paparo, M. A., Wronna, M., Pronin, P., Giniyatullin, A., Putra, P. S., Hartanto, D., Ginanjar, G., Kongko, W., and Pelinovsky, E.: The 28th September 2018 Palu Earthquake and Tsunami ITST, 7–11 November 2018, Post Tsunami Field Survey Report (Short), 1–24, 2018.