the Creative Commons Attribution 4.0 License.
the Creative Commons Attribution 4.0 License.
 | 25 Nov 2019
Meteorological conditions leading to the 2015 Salgar flash flood: lessons for vulnerable regions in tropical complex terrain
Lina I. Ceballos
Jhayron S. Pérez-Carrasquilla
Julián Sepúlveda
Silvana M. López-Zapata
Manuel D. Zuluaga
Nicolás Velásquez
Laura Herrera-Mejía
Olver Hernández
Gisel Guzmán-Echavarría
Mauricio Zapata
Flash floods are a recurrent hazard for many developing Latin American regions due to their complex mountainous terrain and the rainfall characteristics in the tropics. These regions often lack the timely and high-quality information needed to assess, in real time, the threats to the vulnerable communities due to extreme hydrometeorological events. The systematic assessment of past extreme events allows us to improve our prediction capabilities of flash floods. In May 2015, a flash flood in the La Liboriana basin, municipality of Salgar, Colombia, caused more than 100 casualties and significant infrastructure damage. Despite the data scarcity, the climatological aspects, meteorological conditions, and first-order hydrometeorological mechanisms associated with the La Liboriana flash flood, including orographic intensification and the spatial distribution of the rainfall intensity relative to the basin's geomorphological features, are studied using precipitation information obtained using a weather radar quantitative precipitation estimation (QPE) technique, as well as from satellite products, in situ rain gauges from neighboring basins, quantitative precipitation forecasts (QPFs) from an operational Weather Research and Forecasting Model (WRF) application, and data from reanalysis products. The La Liboriana flash flood took place during a period with negative precipitation anomalies over most of the country as a result of an El Niño event. However, during May 2015, moist easterly flow towards the upper part of La Liboriana caused significant orographic rainfall enhancement. The overall evidence shows an important role of successive precipitation events in a relatively short period and of orography in the spatial distribution of rainfall and its intensification as convective cores approached the steepest topography. There were three consecutive events generating significant rainfall within the La Liboriana basin, and no single precipitation event was exceptionally large enough to generate the flash flood, but rather the combined role of precedent rainfall and the extreme hourly precipitation triggered the event. The results point to key lessons for improving local risk reduction strategies in vulnerable regions with complex terrain.
- Article
(26059 KB) - Full-text XML
- BibTeX
- EndNote


On the morning of 18 May 2015, at around 02:40 LT (local time) (UTC−5), a deadly flash flood in the La Liboriana river basin inundated the town of Salgar, in the Department of Antioquia, Colombia (see Fig. 1), killing more than 100 people, leaving around 535 houses destroyed, and causing significant public infrastructure damage1. From 14 to 18 May, several stratiform rainfall events and intense convective storms took place over the basin, triggering the flash flood. The reconstruction cost was estimated at approximately USD 12 million2: about 2.5 times the annual budget of the municipality3. Salgar, founded in 1903, and according to the national government4 with a population of around 17 600 people in 2015, of which 8800 reside in the urban area, is a typical complex-terrain South American town settled in the Andes Cordillera, erected on the river margins of the main channel of the La Liboriana watershed, near the confluence with the El Barroso river, in a flash-flood-susceptible region from a geomorphological perspective.
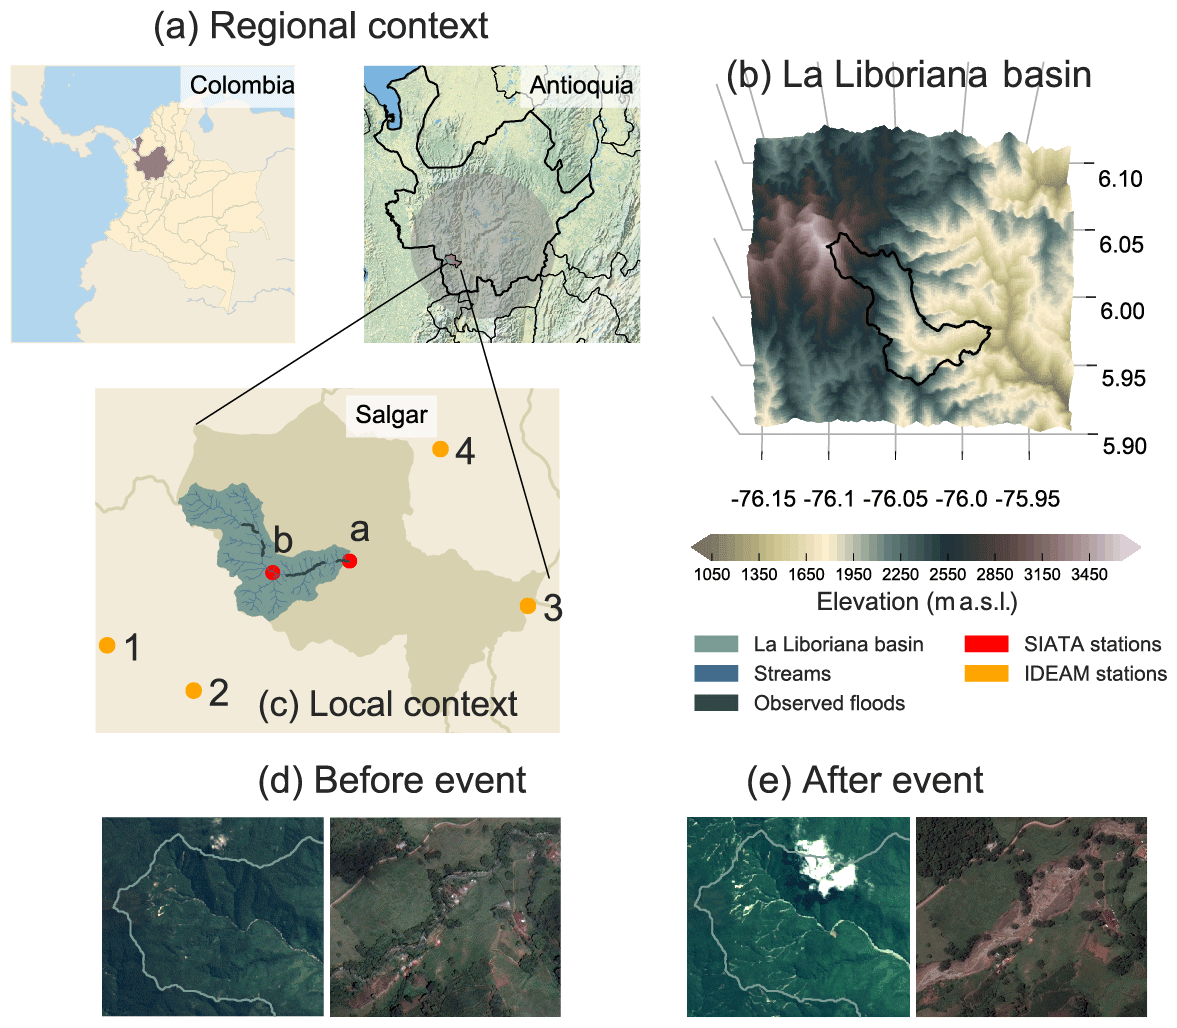
Figure 1(a–c) Geographical context of the municipality of Salgar and the La Liboriana basin. The panels present (a) the location of Colombia, the Department of Antioquia, and (b, c) Salgar, settled in the southwestern region of the department, on the eastward-facing hill of the western branch of the Andes Cordillera. The circular gray shadow denotes the 120 km radius area from the weather radar (C-band) site. (b) Three-dimensional representation of the La Liboriana basin using the ALOS-PALSAR digital elevation model (12.5 m resolution) highlighting the steepness of the region. Cerro Plateado corresponds to the highest hills of the basin at 3600 m a.s.l. (c) Zoom to the municipality of Salgar and the La Liboriana basin, showing the location of four rain gauges (1 to 4) from the Colombian National Weather Service (IDEAM), and two rain gauges (a and b) installed postevent by the Sistema de Alerta Temprana de Medellín y el Valle de Aburrá (SIATA). The IDEAM gauges correspond to codes 11020010 (1), 11025010 (2), 26210110 (3), and 26215010 (4). (d, e) Images before and after the Salgar 18 May 2015 flash flood event, showing an example of landslide scars in the upper basin, and erosion and changes in the delineation of the main channel. The first column corresponds to the pansharpened natural color composition from Landsat 8 images (path: 009, row: 056) with 15 m resolution for the upper basin (before: 16 July 2013, and after: 24 May 2017). The second column corresponds to © Google Earth Pro V 7.3.2.5491, 2018, for the main channel. The images are from Digital Globe, 2018 (before: October 2014, after: May 2015).
A large number of cities and municipalities in the Andean region, not only in Colombia but also in Bolivia, Ecuador, and Perú, are settled in small to medium size river basins similar to La Liboriana, in highly complex mountainous regions with hills exhibiting steep slopes, significant elevation differences relative to the river channel, and urban areas settled in areas prone to flash flooding. In Colombia, for example, where the Andes Cordillera trifurcates into branches, 67 % of the country's population lives in the Andean subregion, which corresponds to 30 % of the territory5. This condition increases the vulnerability of the country due to the fact that important human settlements frequently occupy floodplains.
Flash floods are associated with short-lived, very intense convective precipitation events, usually enhanced by the orography, over highly saturated land surfaces with steep terrains (Šálek et al., 2006; Llasat et al., 2016; Douinot et al., 2016; Velásquez et al., 2018). According to the US National Oceanic and Atmospheric Administration (NOAA), flash floods are triggered by heavy or excessive rainfall in a short period of time, appearing, in general, within 6 h from the onset of torrential rainfall (Jha et al., 2012). However, it is important to state that flash floods are not only the result of the rainfall event immediately before the flooding (the triggering event); the spatiotemporal structure of the rainfall in the days prior to the extreme flooding (preconditioning events) also plays an important role in modulating the overall moisture in the basin and in the occurrence of flooding. Flash floods are highly destructive, often resulting in significant human and economic losses, making them one of the most catastrophic natural hazards (Jonkman, 2005; Roux et al., 2011; Gruntfest and Handmer, 2001). Jonkman (2005), based on information from the International Disaster Database, shows that between 1975 and 2001 a total of 1816 worldwide freshwater flood events killed over 175 000 people and affected more than 2.2 billion people. These events not only caused human and economic losses but also damages to ecosystems and loss of historical and cultural values. In Colombia, there have been several flash flood events in the last decade associated with large-scale climate forcing patterns and with isolated extreme precipitation events. The 2010–2011 La Niña event triggered more than 1200 flooding events, affecting the lives of more than 3 million people (around 7 % of the country's population) and causing damages estimated in more than USD 6.5 billion (UN-CEPAL, 2012).
One of the most critical challenges associated with flash floods is their simulation and prediction with useful lead times (Yamanaka and Ma, 2017; Borga et al., 2011; Marra et al., 2017; Hardy et al., 2016; Ruiz-Villanueva et al., 2013). Skillful forecasts of the likelihood of the occurrence of a flash flood require a deeper insight into their triggering processes (Klemeš, 1983, 1993; Merz and Blöschl, 2003). These processes are complex and controlled by a range of variables including the rainfall regime (Merz and Blöschl, 2003). Several authors have assessed the role of the spatiotemporal structure of rainfall on flash flood occurrence in different watersheds around the globe. For example, Doswell et al. (1996), Kahana et al. (2002), Schumacher and Johnson (2005), Delrieu et al. (2005), Milelli et al. (2006), Borga et al. (2007), Norbiato et al. (2008), Fragoso et al. (2012), Berne and Krajewski (2013), Peters and Roebber (2014); Peters and Schumacher (2015), Gochis et al. (2015), Piper et al. (2016), Llasat et al. (2016), and Baltaci (2017) evaluated the observational evidence associated with flash floods from a climatological point of view and from case studies, pointing to the following important conditions prior to the occurrence of flash floods: (i) existence of distinct synoptic patterns days before the flood events leading to extreme precipitation; (ii) recurrence of convective systems, either organized as training convective elements or quasi-stationary convection as part of mesoscale convective systems (MCSs); (iii) antecedent long-duration stratiform rainfall saturating the basin prior to intense convective events; (iv) orographic rainfall enhancement; and (v) modulation of local rainfall by large-scale climate patterns. Implicitly, these studies point to the need to examine in detail, and with a high spatiotemporal resolution, the rainfall structure in a basin of interest to better understand the flash-flood-triggering processes. In the tropical Andean region there are several factors that increase the likelihood of flash flood occurrence, including the high availability of moisture in the atmosphere, the north–south migration of the Intertropical Convergence Zone (ITCZ) and its role in setting the conditions for short-lived convective precipitation events with high intensities in small spatial scales (Mapes et al., 2003; Houze, 2004; Houze et al., 2015), and the orographic rainfall intensification strengthening localized deep convective cores (Poveda et al., 2007; Falvey and Garreaud, 2007; Mora et al., 2008; Bookhagen and Strecker, 2008).
In addition to being the primary flash-flood-triggering factor under current climate conditions, potential changes in extreme precipitation frequency under climate change scenarios could plausibly increase flash flood recurrence around the globe (Hapuarachchi et al., 2011; Field et al., 2012), and in particular in the tropics, although the confidence in the projection of the magnitude of the precipitation changes is low (IPCC, 2014). Local in situ evidence suggests that, while there are no long-term trends in the yearly cumulative precipitation in the Department of Antioquia, short-lived events show long-term increments in intensity and frequency (Urán, 2016; Urán et al., 2019), with a substantial reduction of the return period of extreme events with implications for engineering and risk management.
As is the case for the La Liboriana extreme event, in many regions in the tropics and around the developing world, watersheds prone to flash floods are usually located in rural mountainous areas, with scarce or nonexistent real-time hydrometeorological information, imposing a challenge for their prediction, modeling, and, consequently, optimal risk management (Marra et al., 2017). The use of quantitative precipitation estimation (QPE) tools based on ground-based weather radar and satellite-based information for flash flood applications could potentially offset the lack of in situ precipitation products in small poorly gauged basins, becoming an important tool for the improvement of the state-of-the-art understanding of flash-flood-related processes such as orographical enhancement of extreme rainfall and runoff generation (Creutin and Borga, 2003; Yatheendradas et al., 2008). Additionally, radar information is also important since antecedent rainfall serves as a surrogate of soil moisture, and different authors have shown that antecedent soil moisture significantly modulates the occurrence of flash floods (Tramblay et al., 2012; Rodriguez-Blanco et al., 2012; Coustau et al., 2012; Yatheendradas et al., 2008; Castillo et al., 2003). Notwithstanding the limitations of radar retrievals (Šálek et al., 2006; Hardy et al., 2016), modern approaches combining radar information, in situ precipitation data, and model simulations are promising (Braud et al., 2016). Velásquez et al. (2018) present a hydrological modeling framework for the reconstruction of the La Liboriana flash flood assessing the runoff generation processes, concluding that the flash flood and the associated regional landslides in the region were strongly influenced by the observed antecedent rainfall, recharging the gravitational and capillary storages in the entire basin.
The aim of this study is to document the climatological aspects, meteorological conditions, and first-order hydrometeorological mechanisms triggering the 2015 La Liboriana flash flood, including orographic intensification and the spatial distribution of the rainfall intensity relative to the basin geomorphological features. We focus on the aspects related to the recurrence of the event and highlight the key lessons that should be incorporated into local risk reduction strategies for other vulnerable regions with similar climate features and terrain complexity. In spite of the data scarcity, the systematic analysis of the observational evidence of the successive rainfall events triggering the La Liboriana flash flood and the evaluation of the output of limited-area numerical prediction models constitute an interesting case study to improve our understanding of the main hydrometeorological factors modulating the occurrence of these events and their likelihood of occurrence. This type of study is useful in the context of policy-making, not only for short-term early warnings but also as a planning resource for long-term risk management and resilience building strategies.
The present work is structured as follows. Section 2 describes the region of study, the La Liboriana basin, as well as the information sources used in this analysis. The assessment of the overall climatological and meteorological conditions, and hydrometeorological mechanisms triggering the La Liboriana flash flood, is presented in Sect. 3 using precipitation information derived from a weather radar QPE technique, as well as from satellite products, in situ rain gauges from neighboring basins, quantitative precipitation forecasts (QPFs) from an operational Weather Research and Forecasting Model (WRF) application, and data from reanalysis products. Finally, the discussion and most important conclusions are presented in Sect. 4.
2.1 Geographical context
The municipality of Salgar is located in the southwest of the Department of Antioquia, in the westernmost branch (Cordillera Occidental) of the Colombian Andes. Figure 1a and b show the geographical context of the municipality of Salgar and the La Liboriana basin. The figure shows Colombia, the Department of Antioquia, and the location of Salgar. Figure 1c shows the three-dimensional representation of the La Liboriana basin using the ALOS-PALSAR (ASF-JAXA, 2011) digital elevation model (12.5 m resolution), highlighting the steepness of the region. La Liboriana is an eastward-facing basin with an area of 56 km2; its main channel originates in Cerro Plateado at around 3600 m a.s.l., and its outlet is located at 1300 m a.s.l., where it joins the El Barroso river and then drain to the Cauca River. Figure 1d and e show an example of landslide scars in the upper basin, changes in the delineation of the main channel, and considerable erosion as a consequence of the extreme precipitation event that triggered the Salgar flash flood.
2.2 In situ rain gauges
Before the occurrence of the flooding event, there were no rain gauges available in the La Liboriana basin or in the municipality of Salgar. Figure 1b shows the location of four rain gauges from the Colombian National Weather Service (IDEAM) in nearby regions to the La Liboriana basin. The records from in situ gauges are available with daily resolution and are useful to characterize the rainfall during May 2015 in a climate context. Figure 1b also shows the location of two rain gauges installed after the flooding event by the Sistema de Alerta Temprana de Medellín y el Valle de Aburrá (SIATA), the local early warning system of the Department of Antioquia's capital, with the purpose of validating the rainfall estimates using QPE techniques.
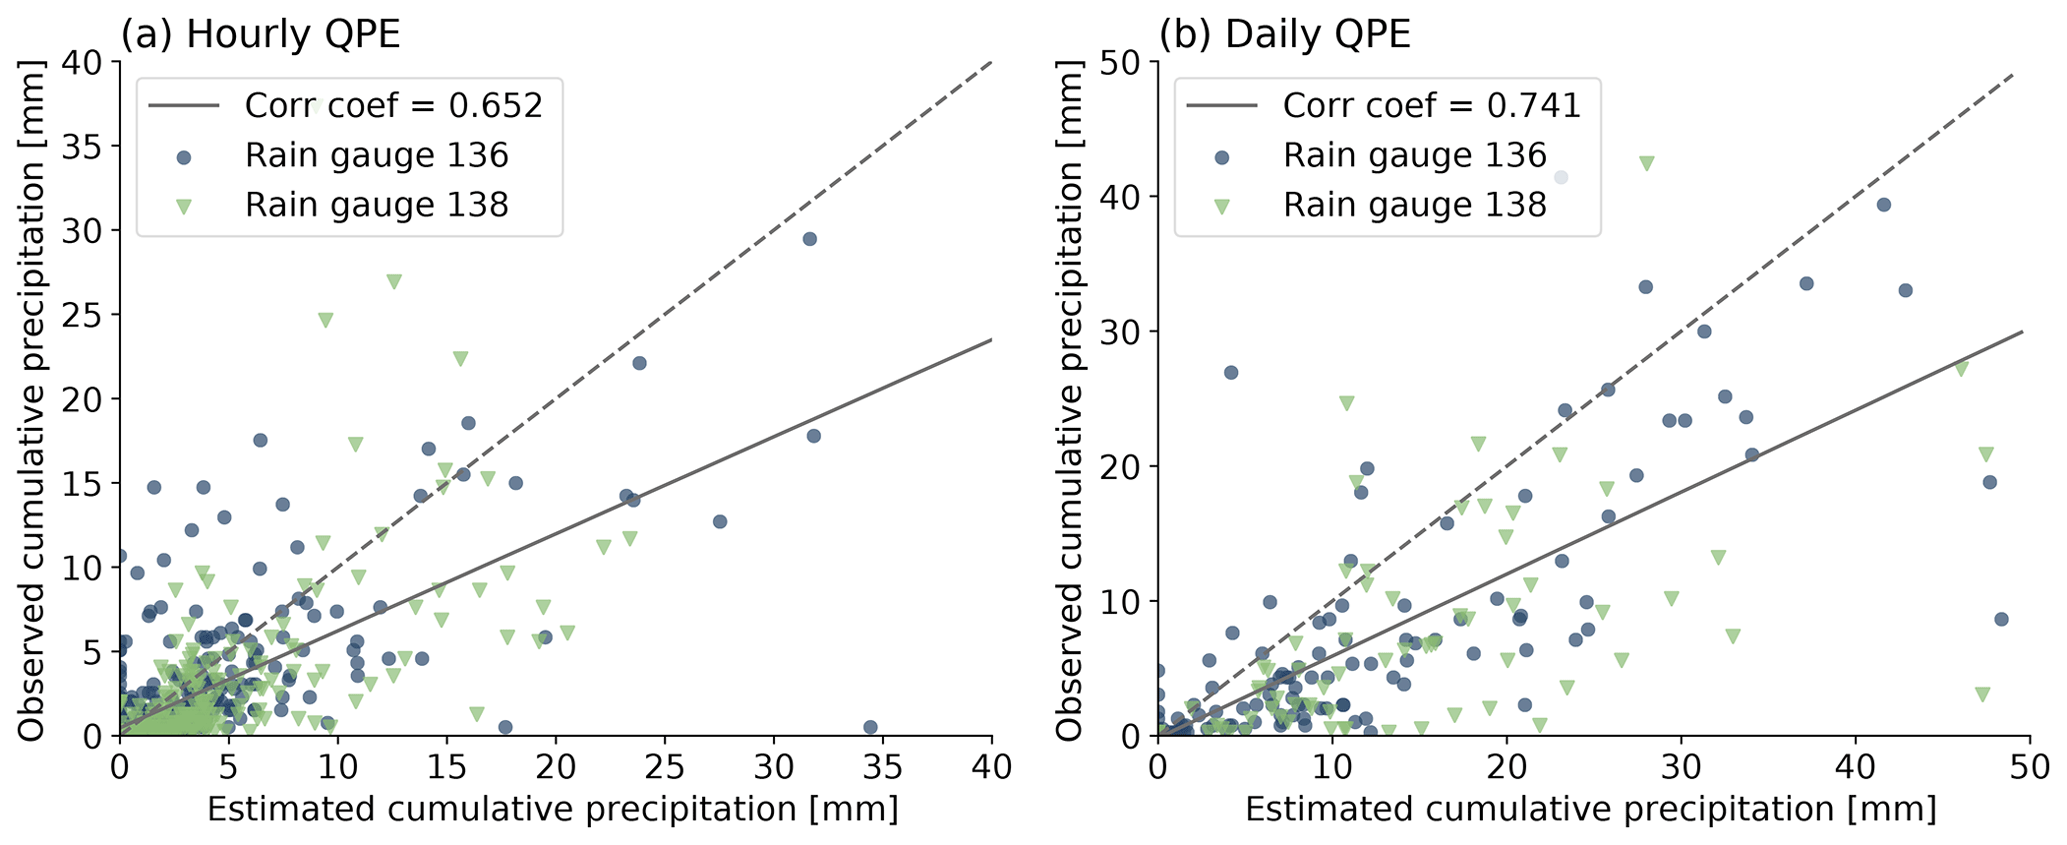
Figure 2(a) Scatter plot showing the relationship between the hourly cumulative precipitation estimated using the QPE technique and the in situ precipitation from the postevent SIATA rain gauges. The dashed line corresponds to a hypothetical perfect adjustment and the continuous line to the actual linear fit between the QPE technique and the in situ precipitation. (b) Similar to (a) but for daily cumulative PPT.
2.3 C-band radar QPE
In the absence of in situ rainfall records during the La Liboriana flash flood, we use precipitation estimates based on an empirical QPE technique described in Sepúlveda (2016) and Sepúlveda and Hoyos (2017) using reflectivity fields from a 350 kW C-band polarimetric and Doppler weather radar manufactured by Enterprise Electronics Corporation. The method uses radar reflectivity retrievals as well as in situ disdrometer and rain gauge information to finally obtain precipitation. The method is multistage, and it is based on (i) a regression of the radar reflectivity into the in situ disdrometer reflectivity and (ii) a regression between the in situ reflectivity and the gauge-measured rainfall intensity. Figure 1a (zoom 1) shows a 120 km radius area from the weather radar (C-band) installation site. The radar scanning strategy, which includes four plan position indicator sweeps (PPIs) at 0.5, 1.0, 2.0, and 4.0∘ and four range height indicator sweeps (RHIs), allows for the estimation of precipitation information every 5 min with a spatial resolution of about 128 m using the 1.0∘ PPI. The QPE technique was validated for the La Liboriana basin using hourly and daily information from the two in situ gauges installed after the flooding event. Figure 2 shows a correspondence between the hourly and daily cumulative precipitation estimated using the QPE technique and the precipitation registered in situ. The correlation between the hourly and daily rain gauge records and the QPE estimations are, respectively, 0.65 and 0.74. Similarly, the root mean square error and the mean absolute error for the hourly record are 3.8 and 2.2 mm, and for the daily records they are 10.4 and 7.2 mm, respectively. The high correlations and relatively small hourly errors indicate, despite the evident overestimation relative to the in situ tipping-bucket gauge records (slopes in Fig. 2 are 0.6 and 0.62), a high reliability of the derived precipitation based on radar reflectivity fields.
2.3.1 Convective and stratiform precipitation
Radar reflectivity fields are also used to describe the spatiotemporal evolution of the precipitation events leading to the La Liboriana flash flood and to assess the partition into its convective and stratiform portions, using the classification methodology proposed by Yuter and Houze (1997) and Steiner et al. (1995), which is based on the intensity and sharpness of the reflectivity peaks. Lightning activity is also analyzed together with radar reflectivity fields using data from in situ instruments that are part of a total lightning detection system developed at the University of Munich (LINET – lightning detection network), which locates cloud discharges and cloud-to-ground strokes (Betz et al., 2008, 2009). The efficiency in the detection of the two types of strokes is greater than 90 %, identifying the time of occurrence with an accuracy of 100 ns.
2.3.2 Predominant propagation of precipitation events
In a complex-terrain setting, the orientation of the basin relative to the wind direction and to the predominant advection of the precipitation systems determines, to a significant extent, the potential for orographic enhancement. In order to evaluate this potential, the Li et al. (1995) methodology, based on the work by Tuttle and Foote (1990), is used to assess the prevailing direction in which precipitation systems approach the La Liboriana basin. We estimated the velocity fields from precipitation retrievals (QPE technique) using a pattern cross-correlation technique and a variational approach, to satisfy continuity, for all the precipitation events over La Liboriana from May 2014 to August 2018. The dates of the precipitation events were obtained from the radar record. Precipitation events with an average rainfall intensity less than 0.2 mm h−1 were not considered.
2.4 Satellite-based precipitation products
In the case of the La Liboriana flood, there is radar information available; however, for several basins around the world, the only spatially distributed precipitation information available in near-real time is from satellite retrievals. From a risk management point of view, it is beneficial to assess how useful the satellite information is to (i) represent the spatiotemporal structure of the precipitation events triggering flash floods and (ii) to issue advanced warnings to the public. For this assessment, we use the 3-hourly Tropical Rainfall Measuring Mission (TRMM) 3B42 v7 product, which is in good agreement with in situ stations globally and regionally (TRMM, 2011; Kummerow et al., 1998; Huffman et al., 2007; Ceccherini et al., 2015), and the half-hourly Global Precipitation Measurement mission IMERG v05 final precipitation (Huffman, 2017; Huffman et al., 2007; Joyce and Xie, 2011). The TRMM-3B42 v7 product has a 0.25∘ by 0.25∘ spatial resolution and a spatial coverage spanning the entire zonal band from 50∘ S to 50∘ N. The IMERG v05 final precipitation has global coverage and a spatial resolution of 0.1∘ by 0.1∘. We also use GOES-13 4 km spatial resolution infrared brightness temperatures (UCAR/NCAR-EOL, 2015) as a proxy for cold cloud tops, also useful to identify locations where precipitation is likely occurring.
Although it is out of the scope of this research, it is important to highlight that extreme convection early detection and tracking algorithms based on combined satellite and radar information might also play a decisive role in risk management, anticipating the threat to regions of interest. The reader is referred to the description of skillful Lagrangian tracking algorithms available in the literature (e.g., Carvalho and Jones, 2001; Handwerker, 2002; Vila et al., 2008; Zinner et al., 2008; Bellerby et al., 2009; Kober and Tafferner, 2009; Merk and Zinner, 2013).
2.5 Sea surface temperature and reanalysis products
Monthly sea surface temperature (SST) information from the NOAA Optimum Interpolation SST V2 (Reynolds et al., 2002), with 1∘ horizontal resolution, is used to describe the climate context in which the La Liboriana flood occurred and the long-term link between local precipitation and global SSTs. Similarly, atmospheric information (meridional and zonal winds, geopotential height, and specific humidity) at different pressure levels is obtained from the ERA5 global reanalysis project with a spatial resolution of 30 km (Copernicus Climate Change Service, 2017).
2.5.1 Back-trajectory analysis
Precipitation is, among others, a function of the net moisture influx into a region of interest. In the tropics, the divergence/convergence of moisture fluxes and the migration of the ITCZ control the net moisture influx in a control volume. In long- (sustainable and resiliency-based urban/rural planning) and short-term (early warning) risk management applications, it is remarkably important to identify the moisture sources in a region to fully characterize the local hydrological cycle and the present and future potential hazards linked to extreme events. A Lagrangian approximation, such as the estimation of back trajectories, is an optimal tool to identify the moisture sources for a region (Gimeno et al., 2012), allowing one to characterize its climatology and to identify spatiotemporal patterns associated with the essential moisture sources in different timescales (Dirmeyer and Brubaker, 2007; Drumond et al., 2008; Viste and Sorteberg, 2013; Drumond et al., 2014; Huang and Cui, 2015; Ciric et al., 2016; Stojanovic et al., 2017; Hoyos et al., 2018). The back trajectories, together with the specific humidity, are estimated using three-dimensional wind and specific-humidity fields from ERA5 global reanalysis. These trajectories are an excellent proxy for the origin of the moisture generating the observed precipitation events.
2.6 Weather Research and Forecasting Model
The Weather Research and Forecasting Model, version 3.7.1 (Skamarock et al., 2008), is the foundation for the operational numerical forecasts issued by SIATA on a daily basis. The model configuration uses three nested domains with 18 (191×191), 6 (82×118), and 2 (136×136) km horizontal resolution and 40 vertical levels up to 50 hPa. The first domain (18 km), from 10∘ S to 20∘ N and from 60 to 90∘ W, covers the entire geography of Colombia, the Caribbean Sea, the Colombian sector of the Pacific Ocean, and the Amazon, in order to include the main external forcing factors of atmospheric circulation and precipitation over the territory. The second domain (6 km) includes the Andean region of Colombia (1 to 10∘ N and 72 to 78∘ W). The third and last domain (2 km) is centered around the Aburrá Valley and extends from 5 to 7.5∘ N and 74.5 to 76.8∘ W. The municipality of Salgar is located within the third domain. The model uses the output from the 12:00 UTC 0.5∘ Global Forecast System (GFS) as initial and boundary conditions. The integration time step is 90, 60, and 10 s in the 18, 6, and 2 km resolution domains, respectively. Table 1 summarizes the schemes and parameterizations used.

3.1 Climatology context
The La Liboriana flash flood occurred during May 2015, a month with multiannual average cumulative precipitation between 350 and 400 mm in the nearby region according to IDEAM records. The daily and cumulative rainfall recorded by the existing gauges is shown in Fig. 3. Most of the rainfall (more than 85 %) took place after 12 May, with the heaviest period between 12 and 22 May. The highest daily precipitation recorded by the rain gauges corresponds to accumulations around 55–60 mm. These daily values do not appear to be unusually high, corresponding to daily precipitation percentiles between 75th and 90th. This suggests that the available in situ records do not capture the unique spatiotemporal rainfall features that triggered the flash flood. While in situ rain gauges are perhaps the best method to measure precipitation intensity and total volume, their generally sparse nature limits their use in risk management applications, pointing to the need to combine information of local nature, or ground truth, with tools that provide spatiotemporal precipitation estimates such as satellites and weather radars.
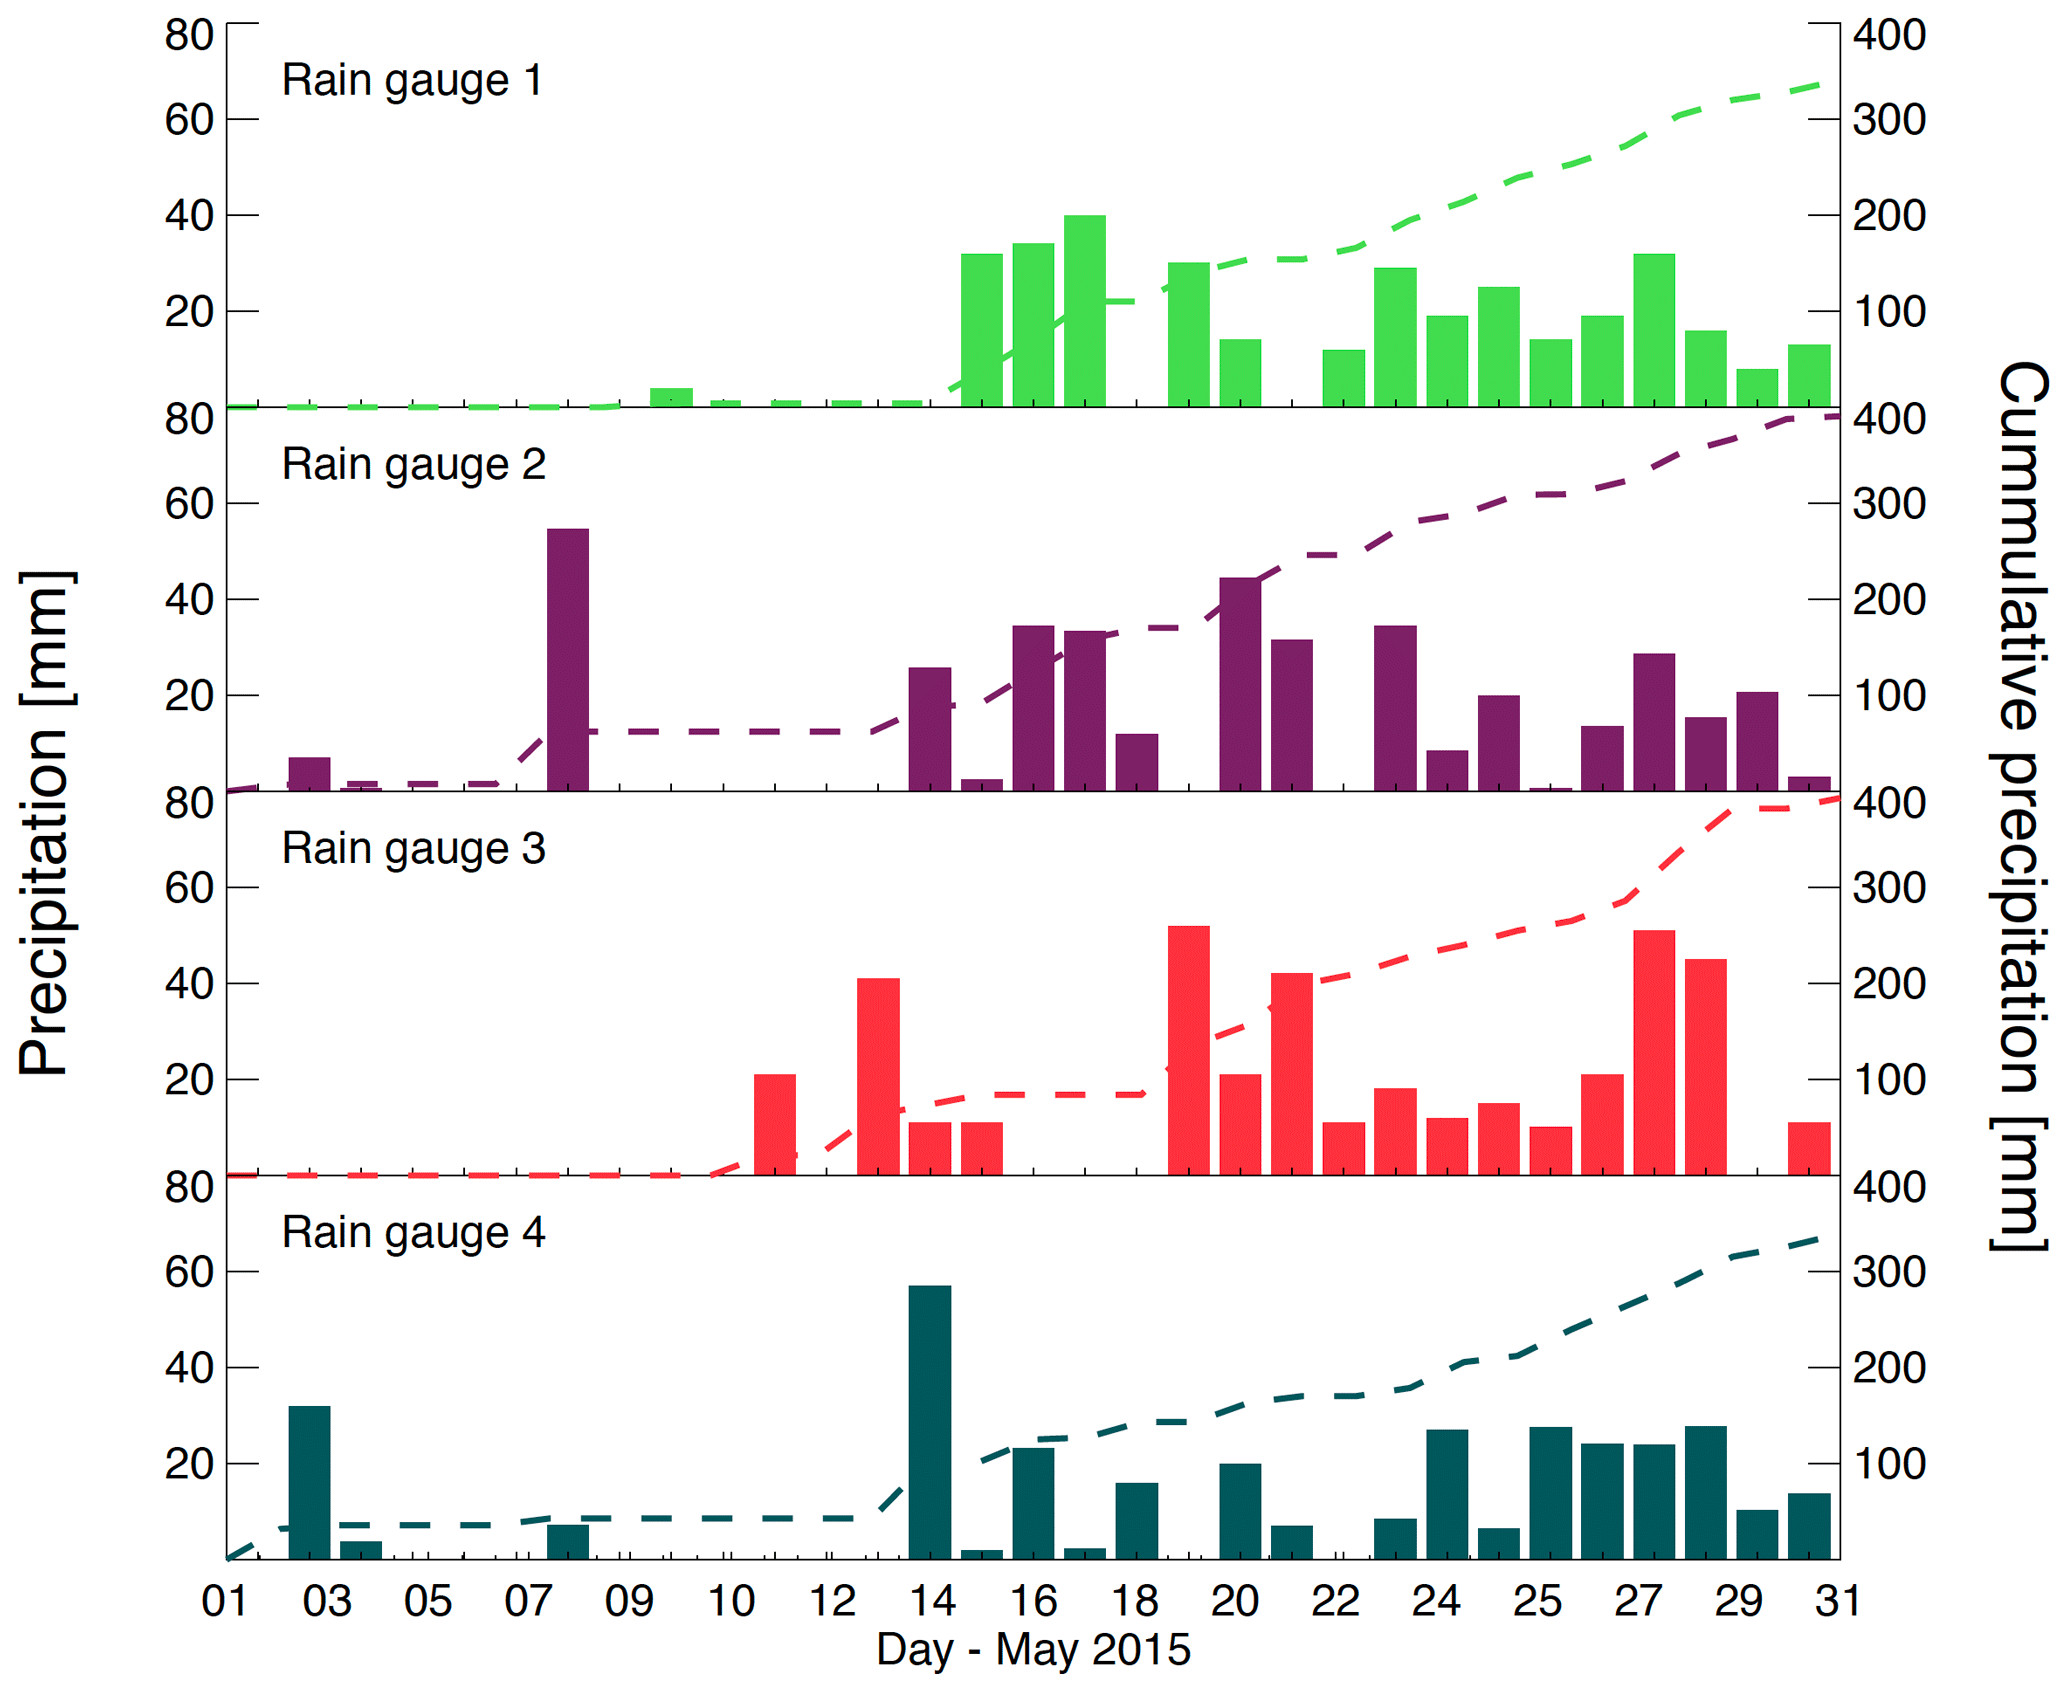
Figure 3Daily precipitation during May 2015 near Salgar, recorded at the IDEAM in situ rain gauges shown in Fig. 1. Bars correspond to daily cumulative precipitation and the dashed lines to the evolution of the cumulative precipitation during May 2015.
Similarly, a climatological assessment suggests that the monthly cumulative precipitation during May 2015, rather than being anomalously high as a result of regional or global-scale forcing, corresponds to magnitudes close to the May climatology in the region. Figure 4a shows the annual cycle of precipitation and the multiannual average cumulative precipitation registered at the in situ stations and the corresponding TRMM satellite record over the La Liboriana basin. The figure also shows the 5-year average monthly rainfall, from 2014 to 2018, estimated using the QPE technique. Precipitation in the region exhibits a bimodal pattern with peaks in the April–May and October–November periods modulated, from a climate perspective, by the migration of the ITCZ (Poveda et al., 2005, 2006). According to in situ historical records, the annual precipitation in the region around La Liboriana is between 2400 and 3050 mm, and during the peak months, precipitation reaches between 200 and 350 mm. Precipitation data from TRMM show that during May the mean cumulative precipitation is 415 mm with a standard deviation of 170 mm. The La Liboriana flood occurred during May, a month which climatologically corresponds to the highest precipitation period in the region. The QPE rainfall over the La Liboriana basin appears to be higher than in nearby regions and higher than the TRMM precipitation record. Although the period is not the same, these differences are linked to the orographic rainfall enhancement in the upper part of the basin as it will be discussed in the following subsections.
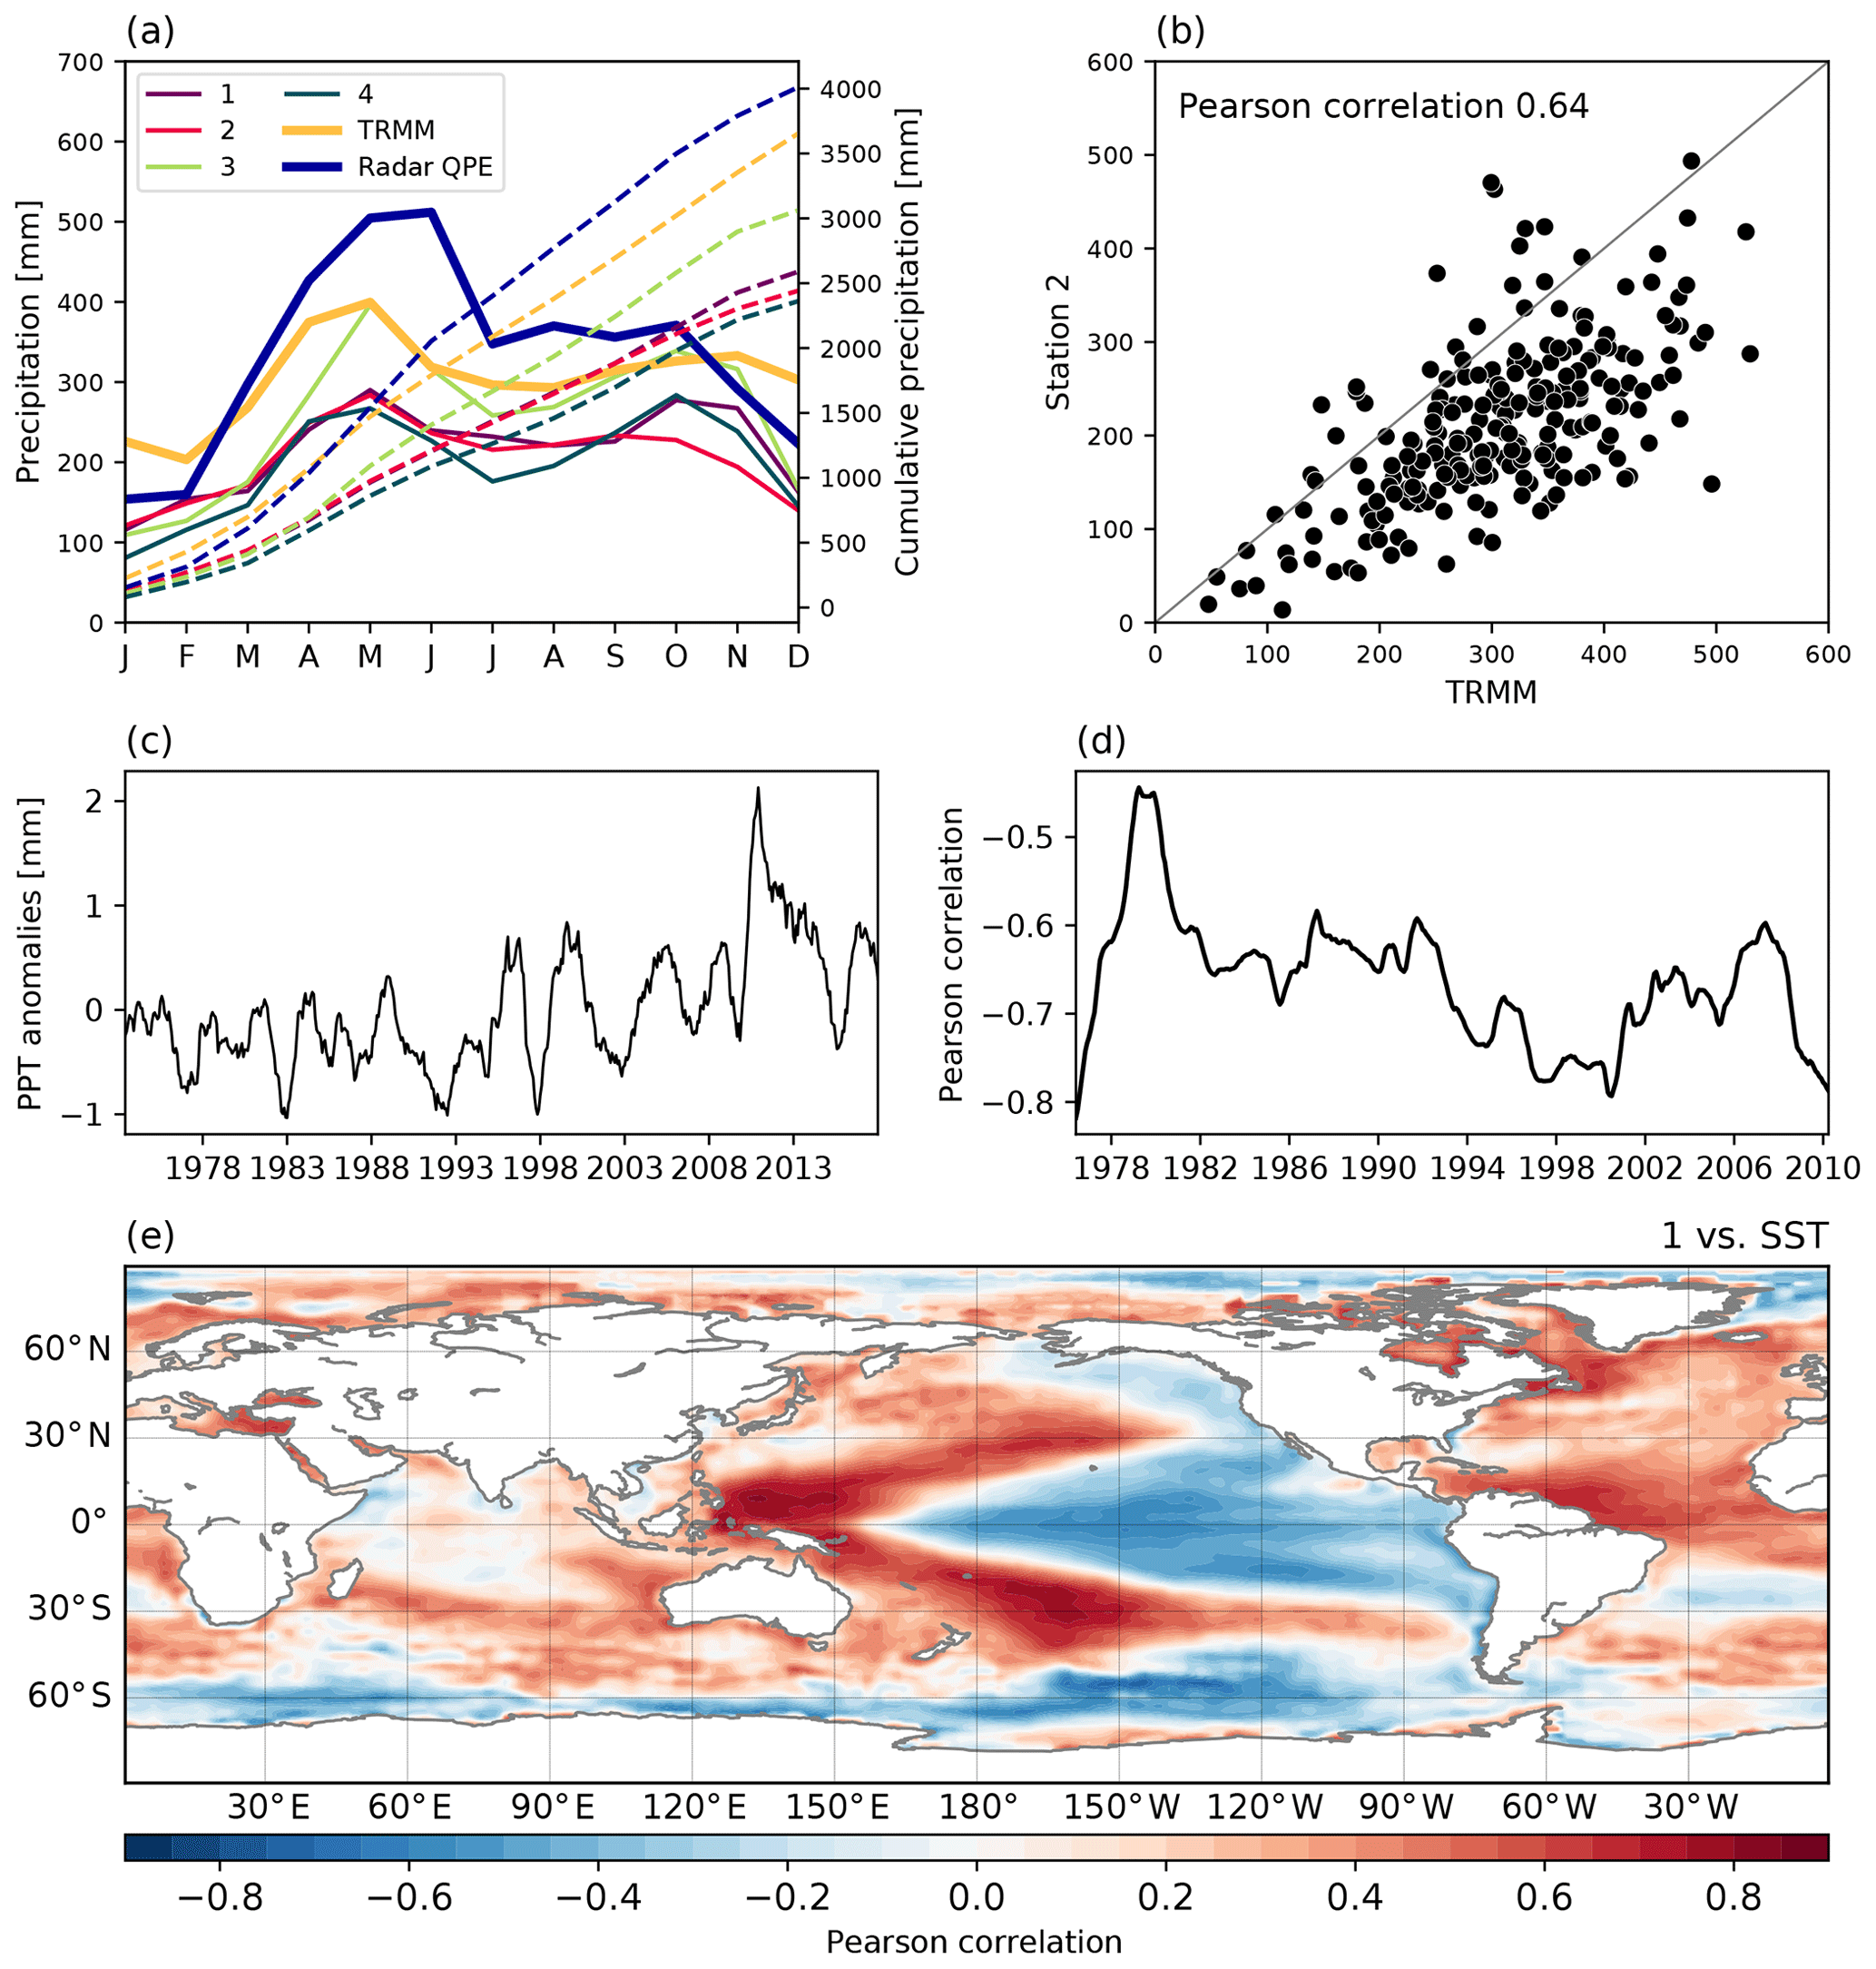
Figure 4(a) Mean annual cycle of precipitation near Salgar from IDEAM rain gauges and TRMM 3B42 product (thick yellow line) using data from 1998 to 2018. The panel also shows the 5-year average monthly QPE rainfall from 2014 to 2018. (b) Scatter plot between monthly TRMM records and one of the in situ gauges, showing the Pearson correlation between both series (0.64). (c) Precipitation anomalies over La Liboriana, after filtering all variability with periods equal to or shorter than 13 months. (d) The 10-year windowed moving correlation between the Multivariate ENSO Index (MEI) and in situ precipitation. (e) Spatial distribution of the correlation between filtered SST and in situ precipitation.
The TRMM record reproduces the annual cycle of precipitation in the region well, but the magnitude appears to be overestimated; however, it is important to note that in situ rainfall stations are not located in the La Liboriana basin. We assess TRMM precipitation considering that in many vulnerable places, especially in developing countries, it is the only information available in near-real time. Figure 4b shows the scatter plot between monthly TRMM records and one of the in situ gauges, as well as the Pearson correlation between both series. The correlation between TRMM and the other three in situ gauges is similar in magnitude to the one shown in Fig. 4b. The evidence suggests that, while TRMM appears to overestimate the monthly rainfall, the interannual variability is represented satisfactorily, with a correlation of 0.64. Precipitation anomalies over La Liboriana, after filtering all variability with periods equal to or shorter than 13 months, exhibit an important interannual variability, with a period between 3 and 7 years (Fig. 4c). Figure 4d and e presents evidence linking this variability directly to the spatiotemporal structure of the El Niño–Southern Oscillation (ENSO).
The spatial distribution of the correlation between SST and in situ precipitation (Fig. 4e) closely resembles the ENSO horseshoe pattern in the Pacific Ocean (e.g., Diaz et al., 2001; Deser et al., 2010). The magnitude of the correlation in this region is considerably high in some areas, with absolute values over 0.8. The sign of the correlation indicates that high SSTs in the central Pacific and the cold tongue are associated with negative precipitation anomalies over La Liboriana. The link is robust as it does not change sign over the years, but its strength has waxed and waned during the last 4 decades, as presented in Fig. 4d showing the moving correlation between rainfall and the Multivariate ENSO Index (Wolter and Timlin, 2011). This change in correlation suggests other external forcing agents, such as the Atlantic Ocean (see Fig. 4e), also play an important role in modulating interannual precipitation variability in the region. Figure 5a and b show the regional cumulative precipitation from the TRMM 3B42 product and mean SST during May 2015, respectively, and Fig. 5c and d show their anomalies relative to the long-term May conditions. The mean pattern shows warm surface waters in the ocean, in a region north of the Equator and south of Central America, between 80 and 110∘ W. Also, the data suggest substantial precipitation over the ocean north of the Equator as well; this is not necessarily collocated with the warmest surface but with the 27–29 ∘C isotherms instead. It is important to state that not only the magnitude of the local SST but also the large-scale global circulation plays a crucial role in determining the overall location of the convection hotspots (Hoyos and Webster, 2012). Over the ocean, the maximum precipitation is located around 10∘ N and 110∘ W. There is also precipitation over Colombia, with larger values over the Amazon basin and, in particular, over the Colombian Pacific region. However, precipitation anomalies show that during May 2015 most of the country had lower precipitation than the long-term average.
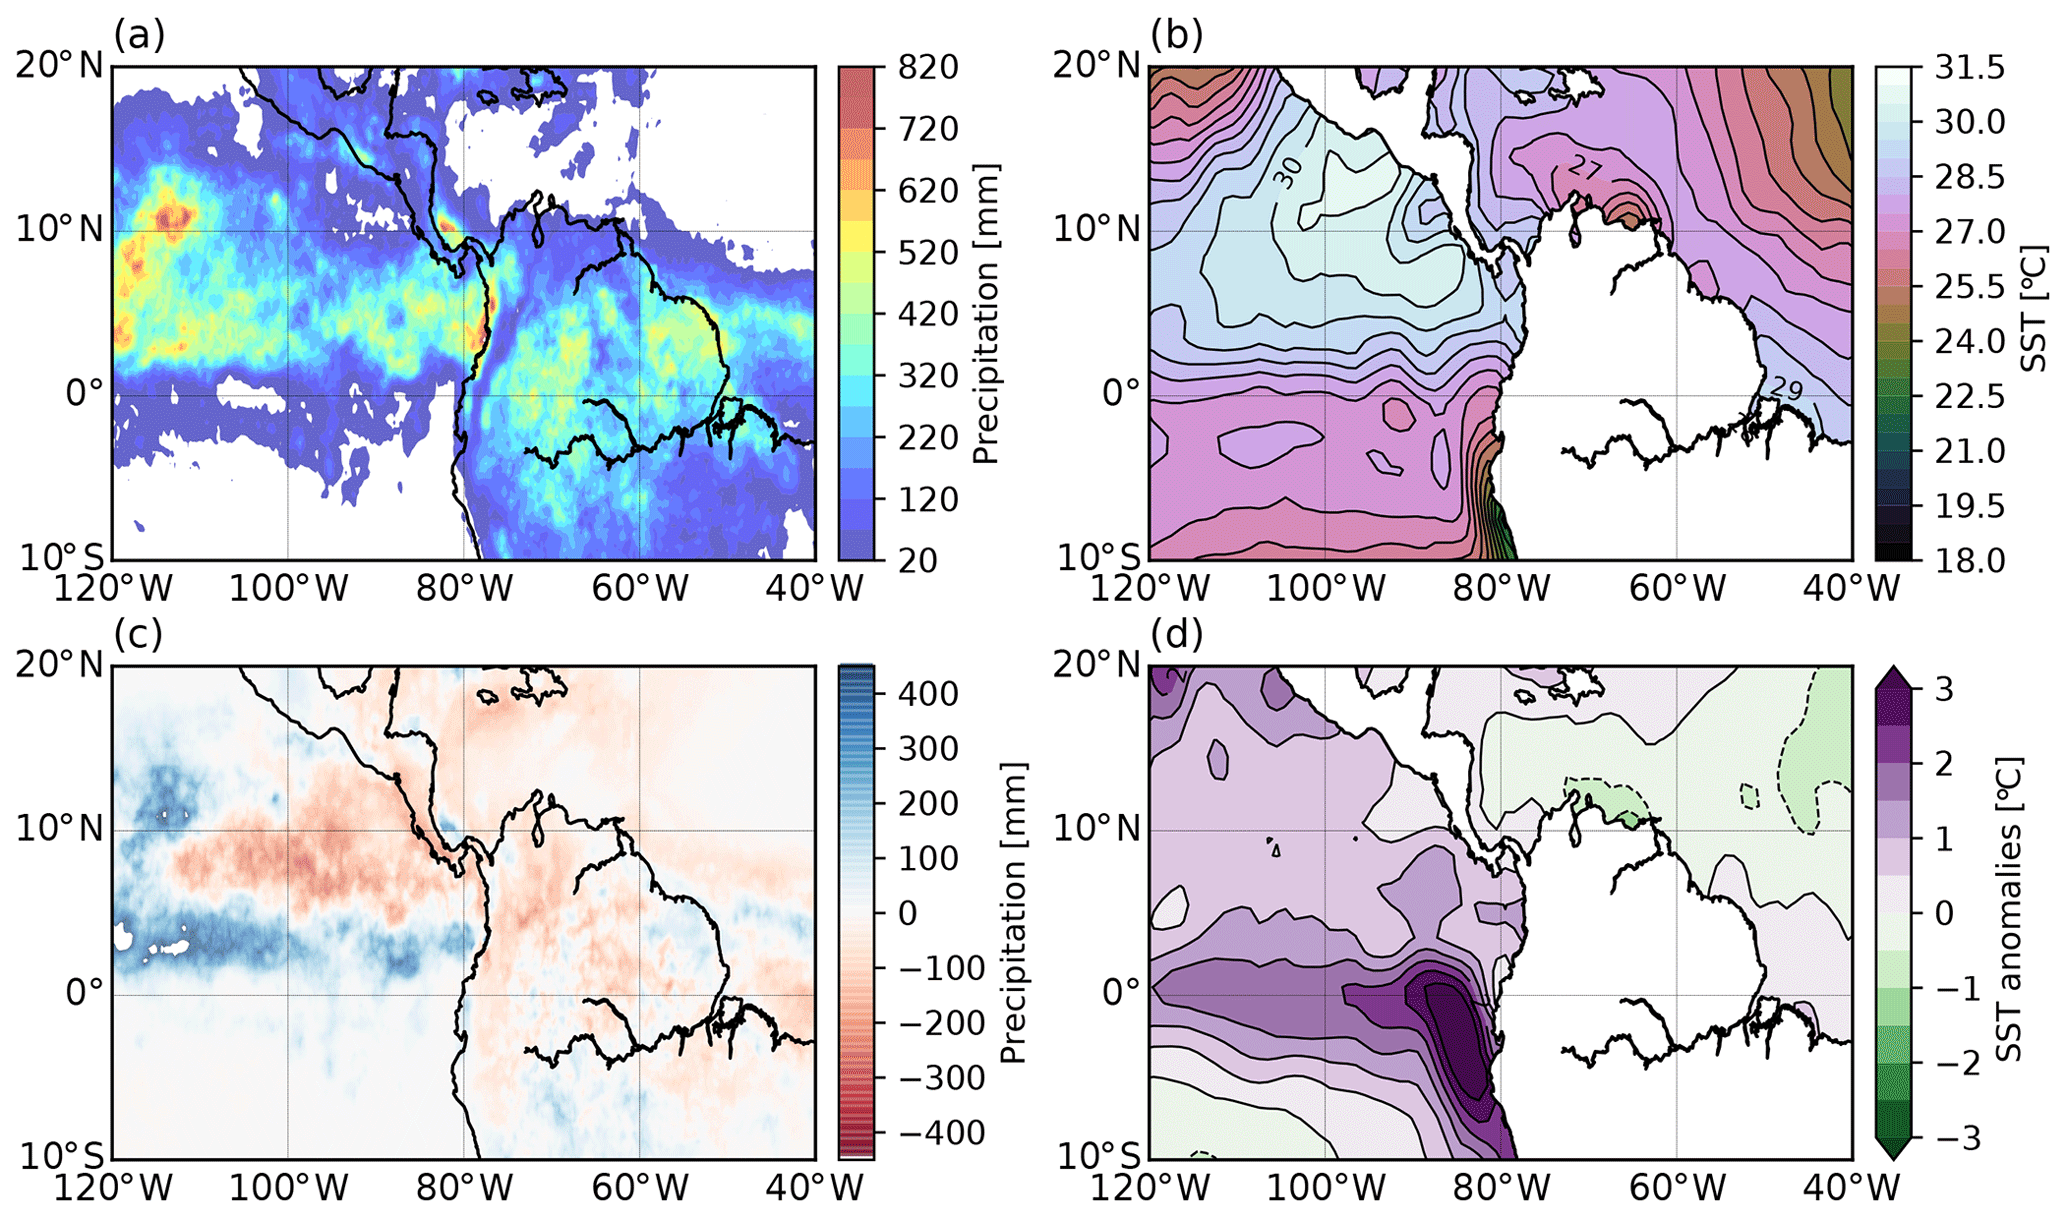
Figure 5(a) Regional cumulative precipitation from the TRMM 3B42 product (blue-to-red shading) and mean SST (green-to-white shading and black lines) during May 2015. (b) Cumulative precipitation (red-to-white shading) and mean SST (green-to-purple shading and black lines) anomalies relative to the long-term May conditions. Temperature contours are every 0.5 ∘C.
It is important to note that, while the climate conditions, in general, modulate the likelihood of extreme event occurrence (Haylock et al., 2006; Orlowsky and Seneviratne, 2012), the La Liboriana flash flood happened during El Niño conditions and the resulting negative precipitation anomalies over Colombia. From a risk assessment point of view, even under external forcing leading to less precipitation than the expected value, the likelihood of hazard occurrence is never zero: it is not sufficient to consider the monthly cumulative precipitation, but it is necessary to study the nature of the precipitation events adding up to the monthly values, particularly their moisture sources, the preferred trajectory of the events, and the dominant precipitation type in a particular region and season. Figure 6 shows the seasonal predominant precipitation tracks estimated using the radar retrievals and the back-trajectory analysis focusing on the parcels arriving to 500 hPa over the La Liboriana basin for the December-to-February (DJF), March-to-May (MAM), June-to-August (JJA), and September-to-November (SON) trimesters. Following the Li et al. (1995) methodology described in the previous section, we analyzed all La Liboriana precipitation events from May 2014 to August 2018, averaging all the estimated precipitation velocity vectors obtained with the mentioned methodology over the basin. Considering the average speed and direction, each of the events is categorized into eight different classes depending on the direction they come from (N, NE, E, SE, S, SW, W, and NW) plus one class, local formation, for the events with wind speeds close to zero. For the back trajectories, Fig. 6 shows the evolution of the trajectories arriving to the 500 hPa pressure level 4 d prior to the precipitation over the basin, indicating also the specific humidity of the parcels advancing towards the basin.
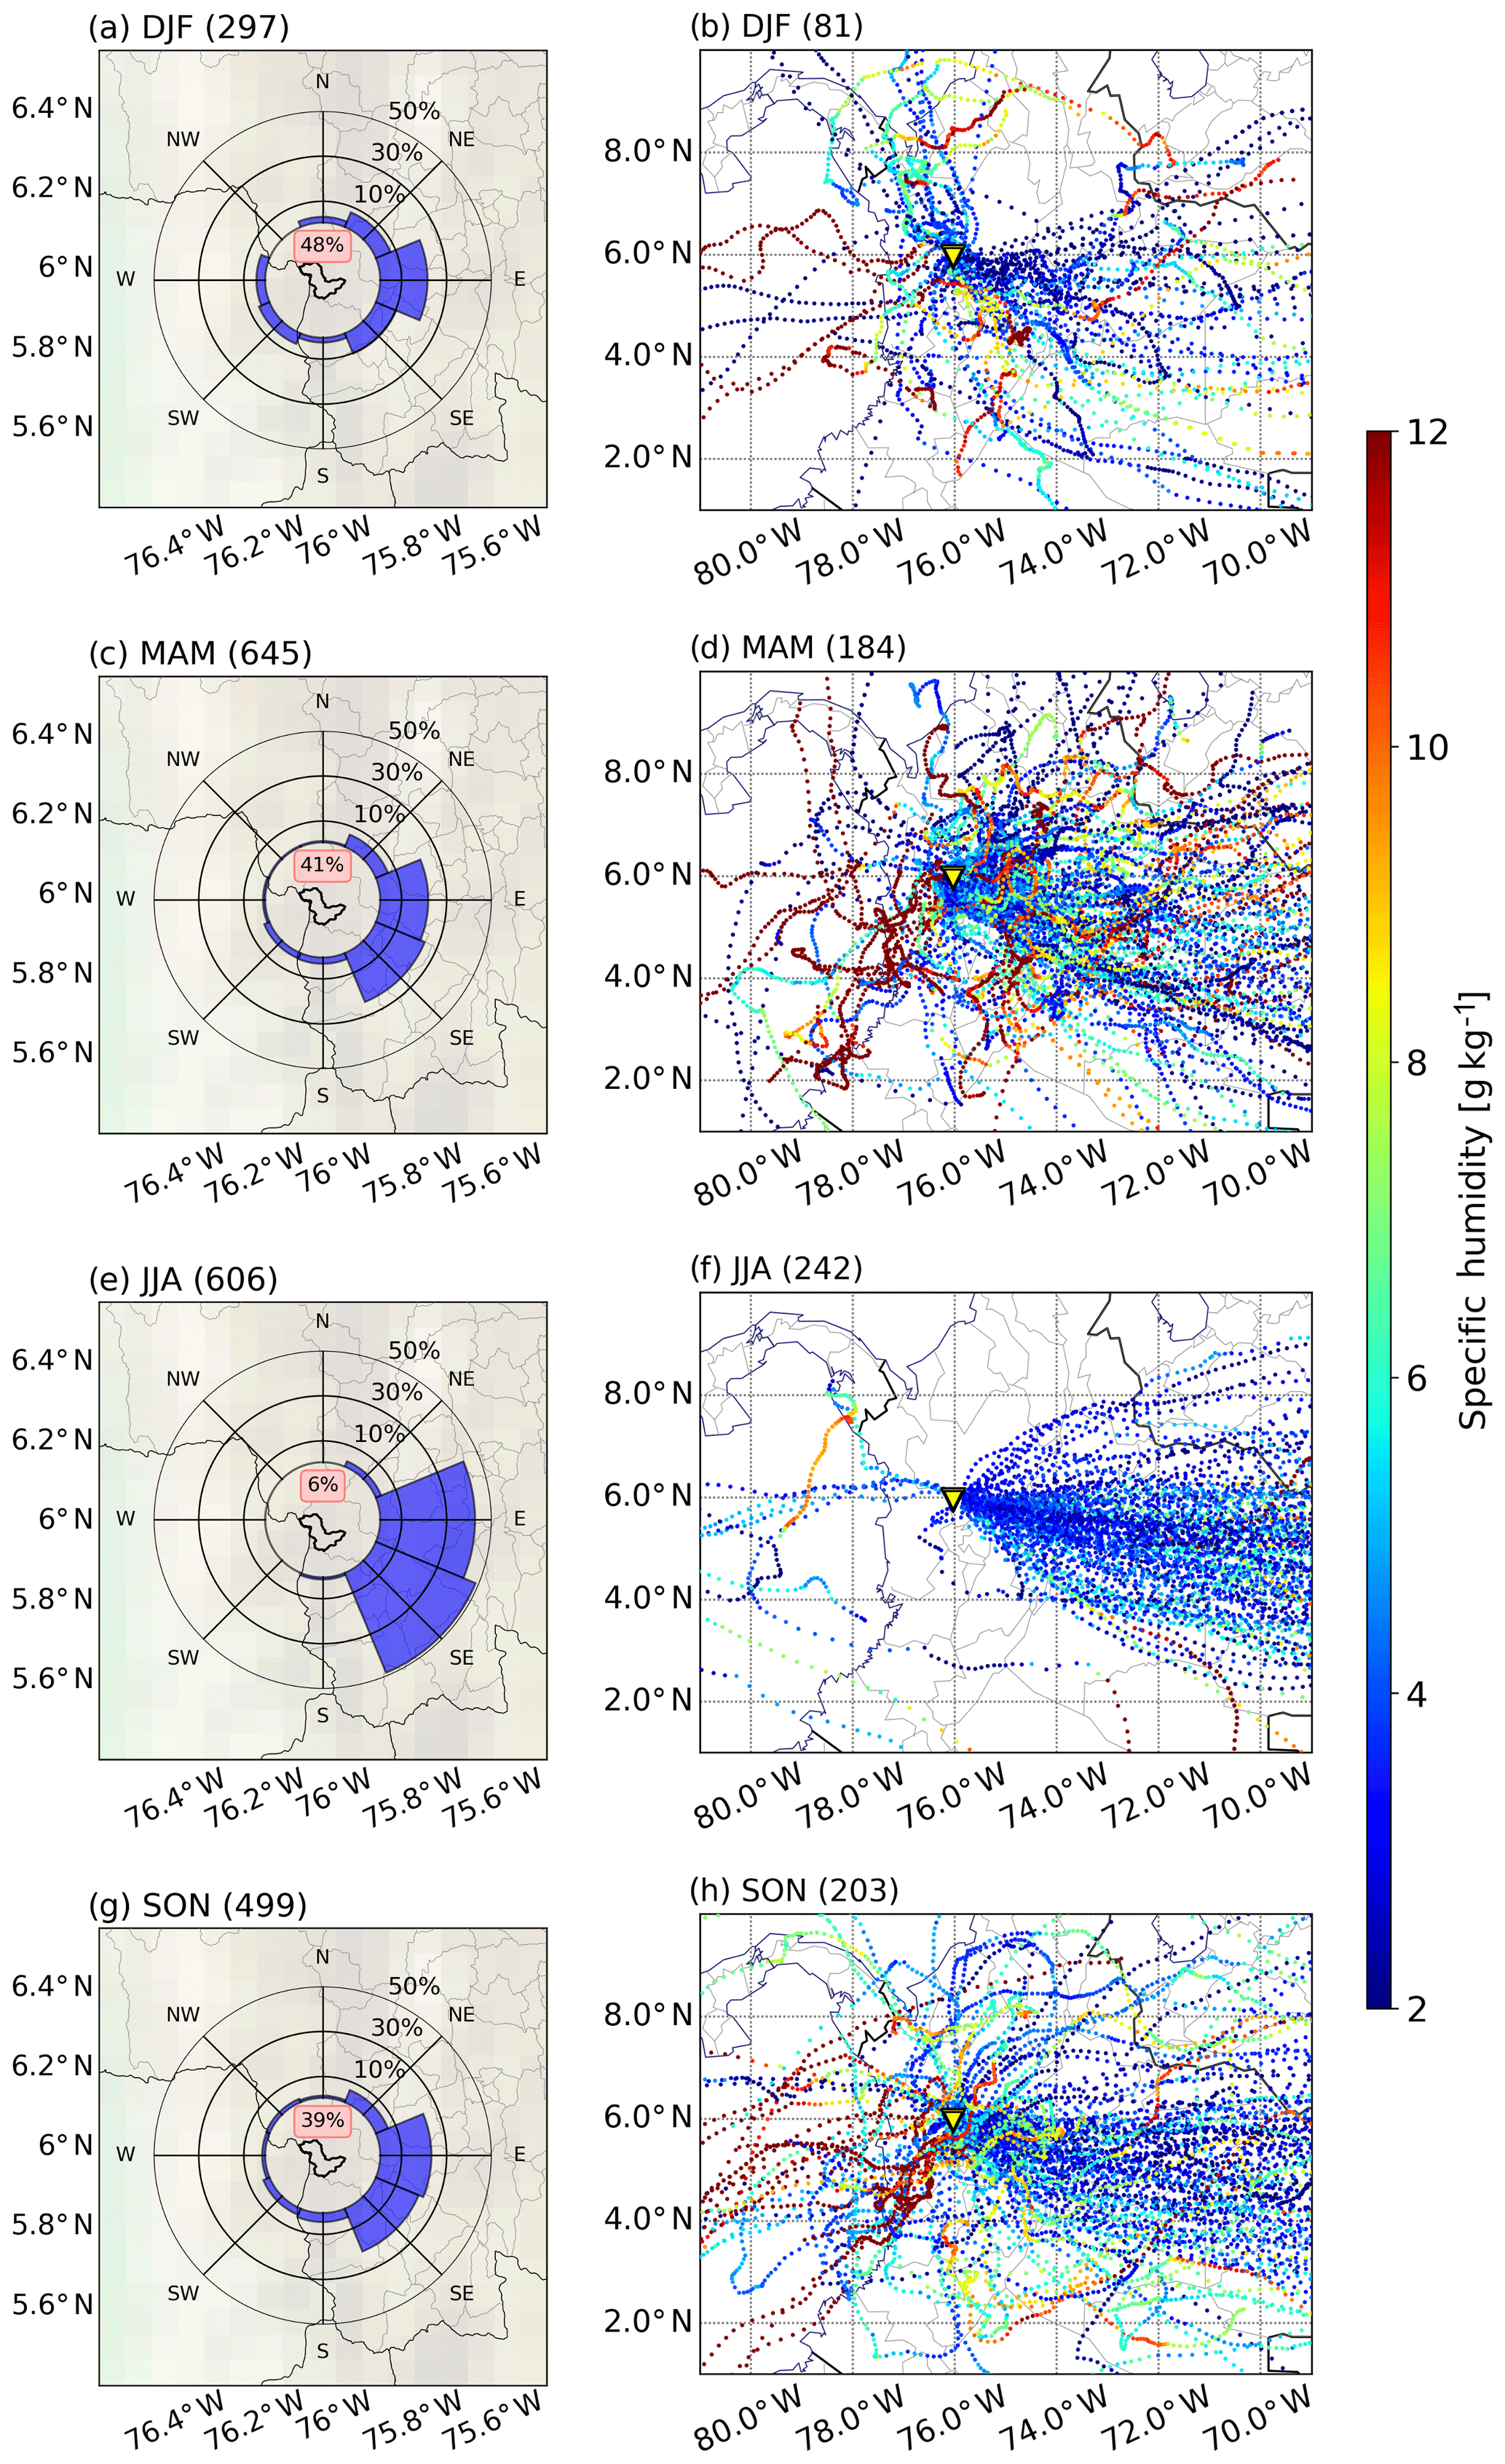
Figure 6Seasonal predominant precipitation tracks estimated using radar retrievals (a, c, e, g) and the back-trajectory and specific-humidity analysis arriving at 500 hPa over the La Liboriana basin (b, d, f, h) for the December-to-February (DJF), March-to-May (MAM), June-to-August (JJA), and September-to-November (SON) quarters, respectively. The percentage in the center of the diagrams in (a, c, e, g) corresponds to the portion of the events categorized as of local formation. Each panel includes, in the title, the number of events considered in each case.
Results from both analyses show a predominant easterly flow and easterly propagation of the precipitation events towards the La Liboriana basin. This trajectory is most characteristic during the JJA trimester, with almost 50 % of the rainfall events over La Liboriana approaching from the southeast and over 40 % of the events from the east. During the other trimesters, there is also a predominant easterly flow towards the basin associated with the trade winds, but there is also important moisture influx from the Pacific Ocean, especially during SON, and a large percentage of local convective activity, mainly during DJF. The number of events leading to precipitation over La Liboriana with air masses approaching from the west is small, but the specific humidity is considerably larger than the easterly events. Considering the orientation of the basin and the overall topographical features, together with the east–west flow in the region, the likelihood of orographic precipitation enhancement is very high. During May 2015, the spatiotemporal evolution of the precipitation events followed the typical climatological pattern for the region (Fig. 7a and b). It is important to note that moisture may reach the atmospheric column over La Liboriana at different levels. For this reason, Fig. 7c shows the back trajectories for the events during May 2015 reaching the basin at 850 hPa. For the 18 May (starting 17 May) event (first convective core reaching the basin around 00:10 LT), moisture was advected from the east, while during 17 May (starting 16 May), parcels reached La Liboriana from the west at 500 hPa and from the southwest at 850 hPa, starting in the Pacific Ocean, near the Equator, off the coast of Peru, with higher specific humidity than during 18 May. This fact has two important practical implications: (i) the anomalous conditions leading to the La Liboriana flash flood are not associated with marked changes in the predominant flow during May 2015 compared to climatology; and (ii) the changes are more subtle than just considering the sign and magnitude of precipitation anomalies or distinct circulation patterns, thus implying that under near-average conditions La Liboriana and other similar basins on the Andes Cordillera are subject to extreme hydrometeorological events, which translates into a challenge regarding risk management.

Figure 7(a, b) Similar to Fig. 6 for May 2015. (c) Back-trajectory and specific-humidity analysis arriving at 850 hPa over the La Liboriana basin.
Figure 8 displays the average cumulative precipitation for the La Liboriana basin for the 2013–2018 period, obtained using the described QPE technique. The precipitation is shown for the DJF, MAM, JJA, and SON trimesters, and it is discriminated in the portion associated with stratiform and convective precipitation using the Steiner et al. (1995) method. As shown in Fig. 8, and coinciding with the TRMM product in magnitude and timing (see Fig. 4a and b), the MAM trimester corresponds to the rainiest time of the year, and at the same time, it is the only season with a significant portion of both stratiform and convective cumulative precipitation. Conversely, during JJA and SON the precipitation in the region is mainly stratiform. This feature is relevant as it suggests that flash floods and rainfall-triggered landslides are more likely during the MAM quarter. The type of precipitation, and in particular its intensity, is key to understanding flash flood and mass wasting events. As mentioned before, flash floods are more likely associated with intense convective precipitation events (e.g., Šálek et al., 2006; Llasat et al., 2016). During MAM, long-duration and low-intensity stratiform events precondition the basin overall soil moisture, recharging the gravitational and capillary storages prior to the occurrence of short-duration high-intensity convective events, with the potential of triggering flash floods and landslides. The previous assessment is validated by the analysis of the historical disaster records available at https://www.desinventar.org (last access: 20 November 2019), for the subregion of the Department of Antioquia including the municipality of Salgar (the southwest region). The number of flash floods and torrential flows in the subregion, from 1922 to 2019, is 6 during DEF, 25 during MAM, 13 during JJA, and 10 during SON.

Figure 8Precipitation climatology for the La Liboriana basin for the 2013–2018 period using the described QPE technique. The precipitation climatology is presented for the DJF, MAM, JJA, and SON trimesters, and it is discriminated in the portion associated with stratiform and convective precipitation using the Steiner et al. (1995) method.
3.2 Synoptic and meteorological conditions leading to the flash flood
3.2.1 Synoptic conditions
A series of intense storms occurred in the days and hours preceding the Salgar disaster. Figure 9a, c, and e present the spatial distribution of the 700 hPa geopotential height and the corresponding wind field for the closest time to the occurrence of the flooding in Salgar (01:00 LT of 18 May 2015) and the prior two precipitation events on 15 and 17 May, at the same time. The event during 18 May (Fig. 9e) exhibits a predominant wind field from the southeast favoring air masses to reach the eastern slopes of the topographical ridges of the Andes Cordillera. This wind flow was favored by a low-pressure system that was located over the Pacific coast of Colombia and Panama and likely by the predominant easterly upper-level wind (not shown). Figure 9b, d, and f show brightness temperature (Tb) from the GOES-13 satellite for the same time as the wind field and the geopotential heights. Figure 9f shows an area of relatively low values of Tb (e.g., Tb<200 K) associated with a broad deep cloud system located in the northeast region of the Department of Antioquia and a small cloud system in the southwest that is likely related to the storms that occurred in the day of the disaster in Salgar. The small footprint of these storms indicates the precipitating elements that produced the observed rainfall correspond to early stages of localized intense convective storms. Later (not shown here), GOES imagery shows growth in the area of the cloud system, as the hydrometeors inside the cloud were lofted to the upper troposphere likely producing significant ice concentration, reducing the Tb measurements.
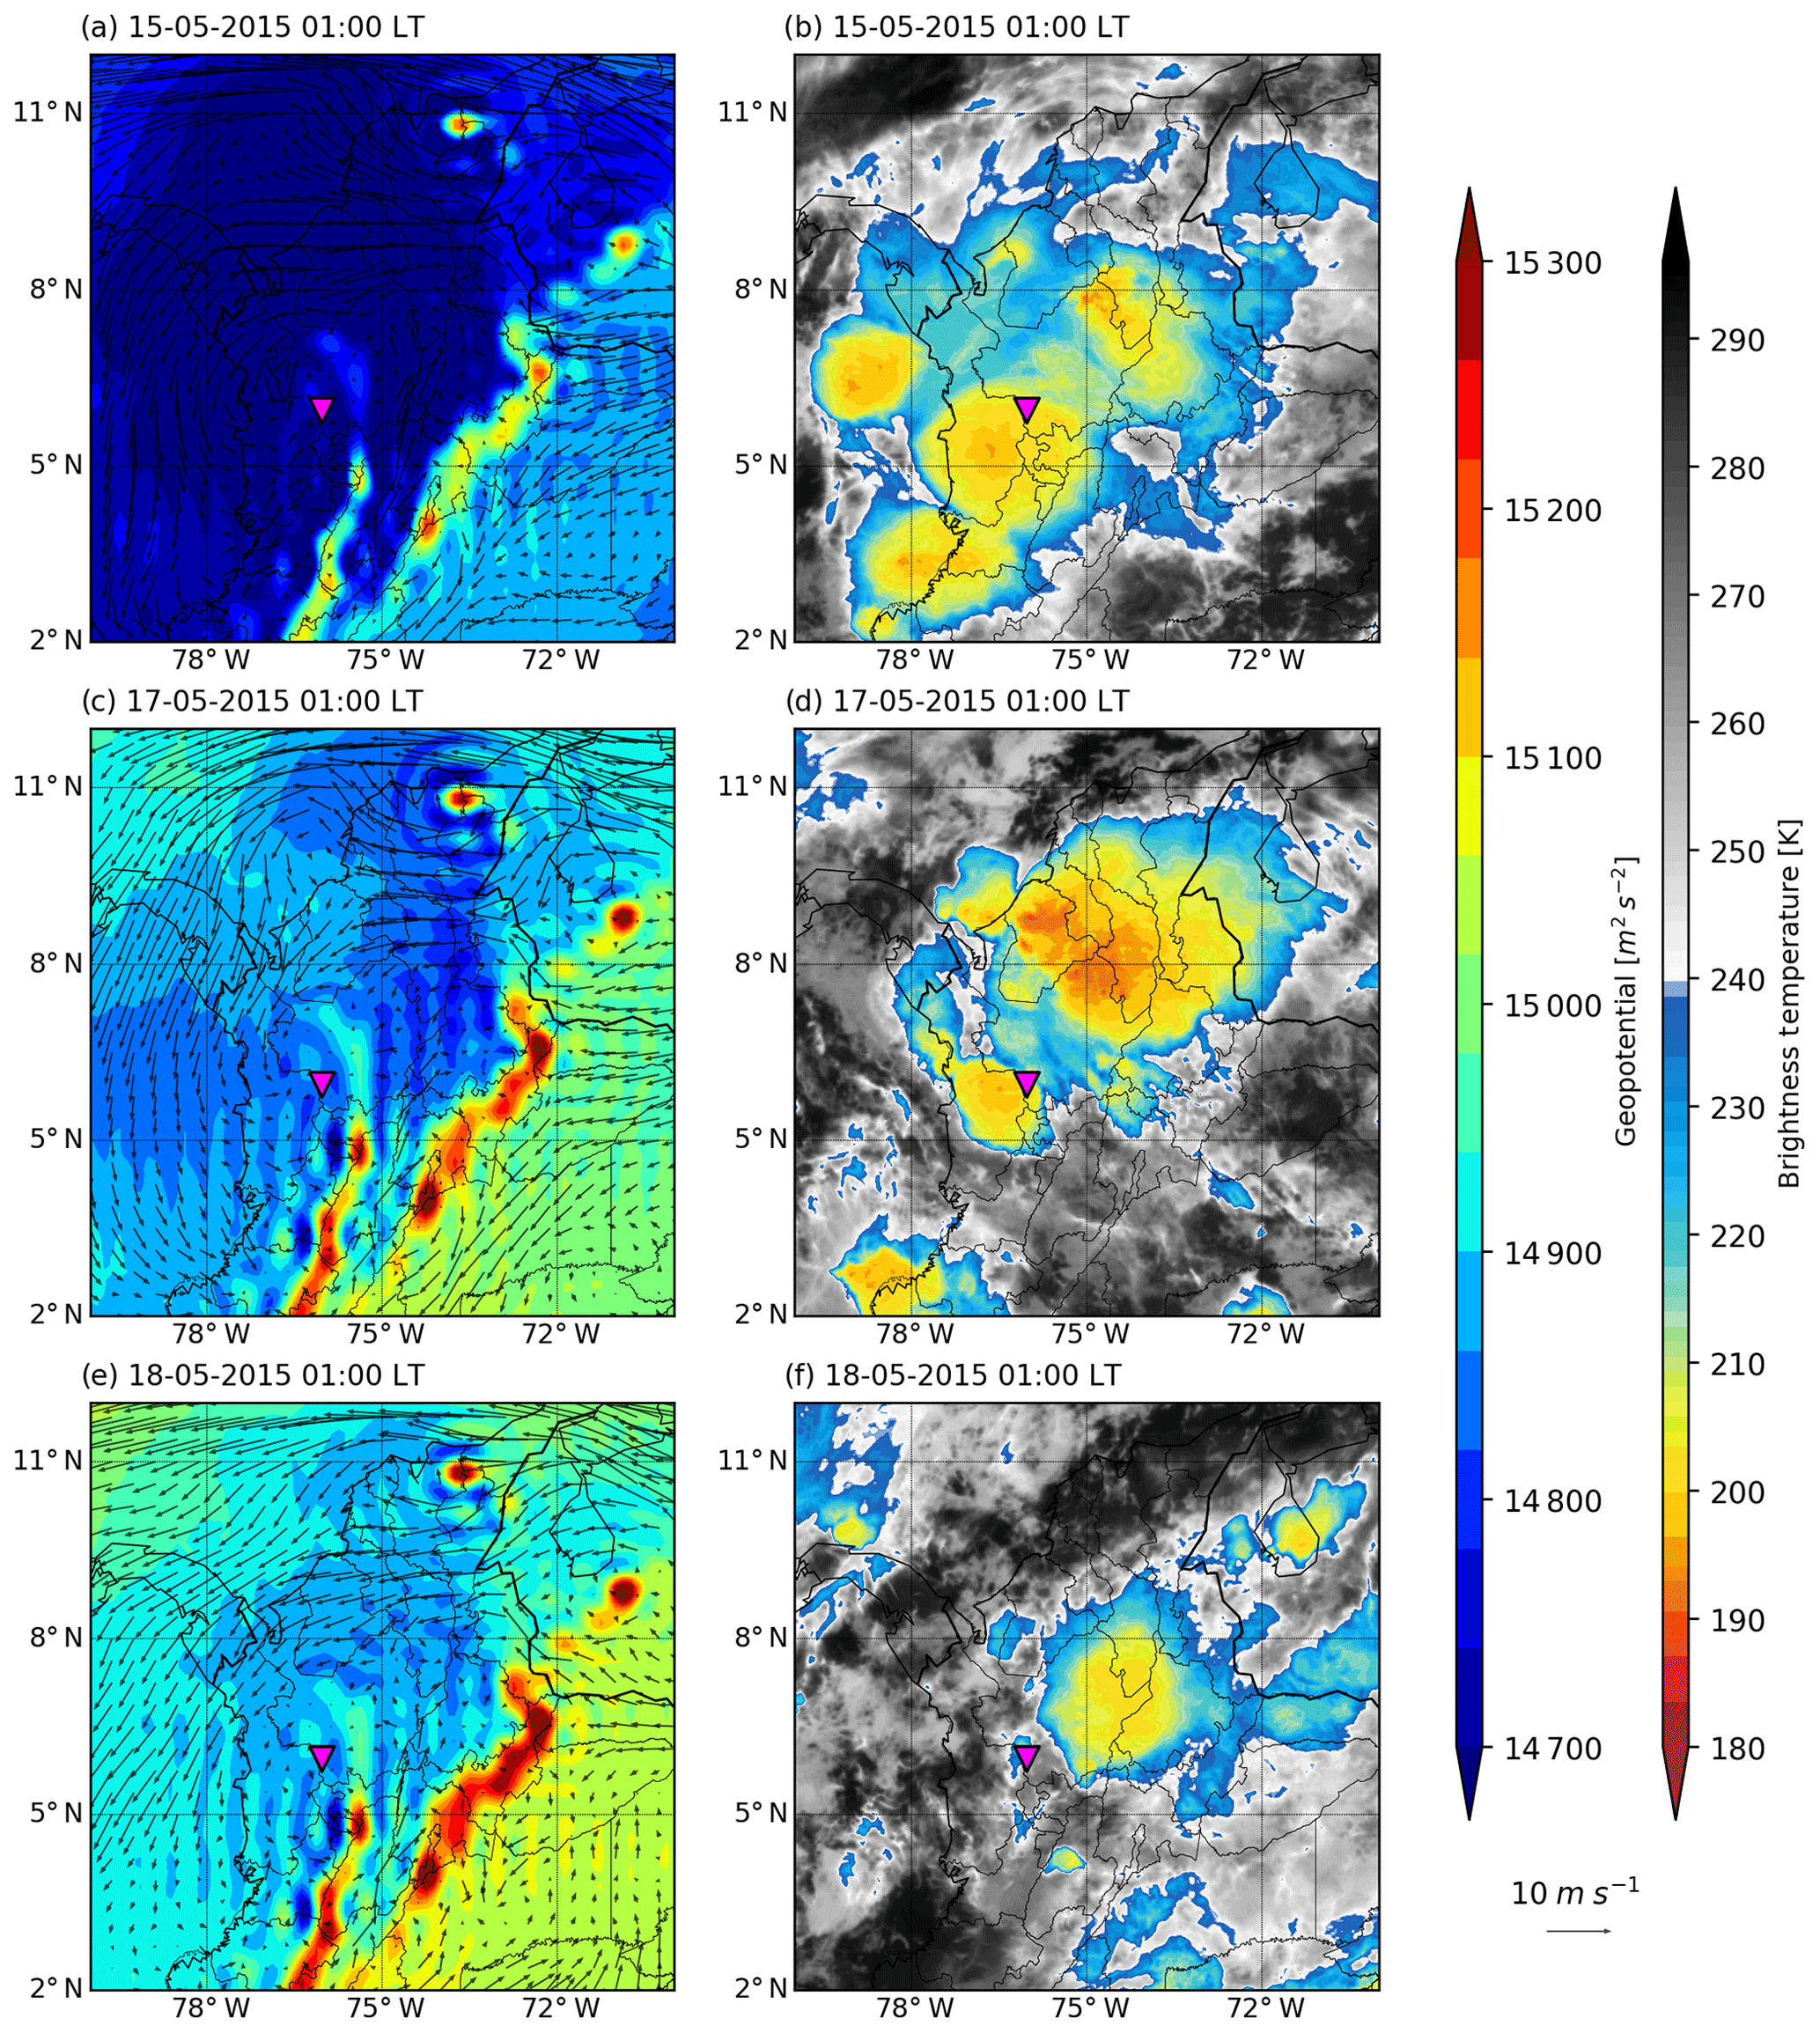
Figure 9(a, c, e) show the ERA-Interim geopotential height at 700 hPa (filled contours) and horizontal wind (vectors) for 15, 17, and 18 May 2015, all at 01:00 LT, respectively. (b, d, f) show the GOES-13 brightness temperature for the same times as in (a, c, e).
Twenty four hours before the flash flood (Fig. 9c and d), the precipitation event was associated with a low-pressure center near the Pacific coast of Colombia, showing convergence in the region over the western slopes of the Andes in the Pacific region of Colombia, affecting indirectly the municipality of Salgar. This feature is a characteristic pattern of the synoptic conditions associated with the occurrence of broad MCSs over this region (Houze et al., 2015; Zuluaga and Houze, 2015). In fact, the cloud system in Fig. 9d displays a considerable growth over the western region of Colombia, favoring humidity convergence and the generation of storms over the La Liboriana basin and the town of Salgar. In addition to the 17 and 18 May events, there was a prior important precipitation event during 15 May synoptically similar to the event during 18 May but more intense (Fig. 9a and b). While the overall geopotential height was lower in the entire region, there was a marked low-pressure system that was located over the Pacific coast of Colombia, the Department of Antioquia and Panama, favoring the southeasterly flow towards the western slopes of the Andes Cordillera, and even cyclonic anomalies of relative vorticity over Salgar. These conditions generated the growth of extensive cloud systems over the region with significant stratiform and convective rainfall.
3.2.2 QPE and satellite precipitation
Figure 10 shows the cumulative precipitation during the duration of the three events in Fig. 9, obtained using the radar QPE technique. The figure shows the spatial distribution of precipitation for a 120 km radius area centered at the radar site and for the La Liboriana basin. Figure 10a and b show the cumulative precipitation during the 25 h between 14 May, 17:00 LT, and 15 May, 18:00 LT (period 1); Fig. 10c and d the cumulative precipitation during the 13 h between 16 May, 21:00 LT, and 17 May, 10:00 LT (period 2); and Fig. 10e and f the precipitation during 8 h between 17 May, 22:00 LT, and 18 May, 06:00 LT (period 3). During period 1, the northern and the western municipalities of the Department of Antioquia were under heavy precipitation, with rainfall accumulation over 150 mm in various regions including the La Liboriana basin. An interesting characteristic of period 1 is that there were large rainfall accumulations mainly in the higher elevations and steeper slopes of the La Liboriana basin (Fig. 10b). Cumulative precipitation during this period was over 110 mm in the upper half of the basin, making this event the largest of the three in terms of total rainfall. Before this event, since 1 May 2015, rainfall over La Liboriana was less than 80 mm, well below climatological values. Regardless of its magnitude, the precipitation during period 1 did not cause flash flooding in Salgar, partly because of its long duration and, on average, relatively low intensities (despite having high-intensity spells) but more importantly because the gravitational storage in the basin’s soils was low due to the below-average rainfall between 1 and 13 May (Velásquez et al., 2018).
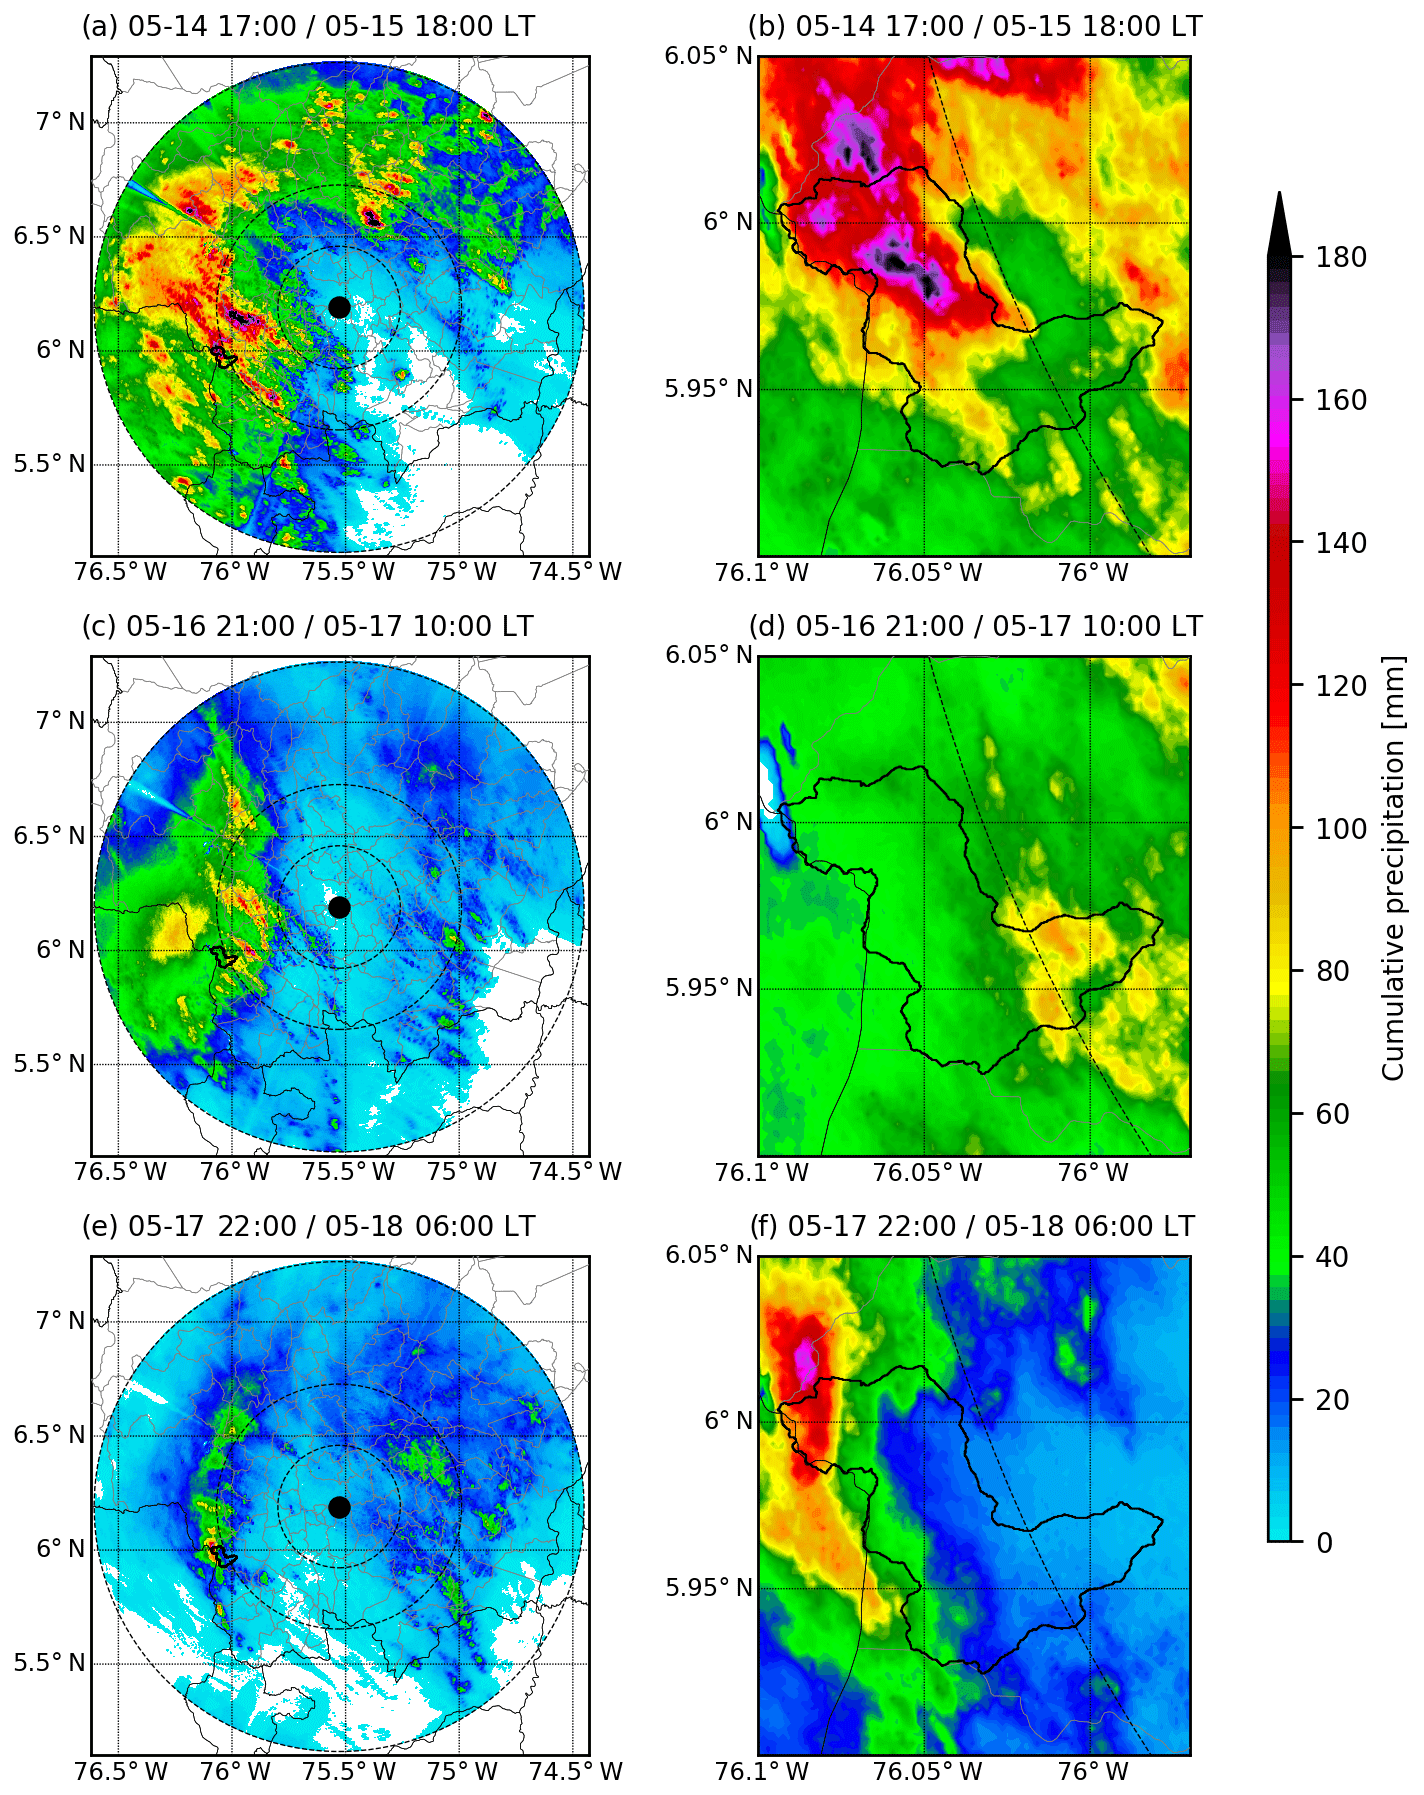
Figure 10Cumulative precipitation for the three events prior to the La Liboriana flash flood obtained using the radar QPE technique. The panels show the spatial distribution of precipitation for a 120 km radius area centered at the radar site and for the La Liboriana basin. (a, b) Cumulative precipitation during the 25 h between 14 May, 17:00 LT, and 15 May, 18:00 LT; (c, d) cumulative precipitation during the 13 h between 16 May, 21:00 LT, and 17 May, 10:00 LT; and (e, f) precipitation between 17 May, 22:00 LT, and 18 May, 06:00 LT.
Figure 11 shows the 5 min time series of convective and stratiform rainfall over the La Liboriana basin during the period of maximum accumulation of each of the three events, as well as the evolution of the basin's area covered by either stratiform or convective precipitation. Overall, Fig. 11 shows that most of the rain accumulation over the La Liboriana basin days before the time of the disaster was due to convective precipitation, with very intense spells. Figure 11a shows that a large part of the rainfall during the 15 May event was produced by convective precipitating clouds and that during the most intense phase, lasting about 120 min, the area of the basin with convective precipitation was about the same as the stratiform-covered region. By the end of the event, although the accumulation is low, there is a predominance of stratiform rainfall over the basin.

Figure 11The 5 min time series of convective and stratiform rainfall over the La Liboriana basin during the period of maximum accumulation of each of the three events in Fig. 10, as well as the evolution of the area of the basin covered by either stratiform or convective precipitation. (a, b) correspond to the 14–15 May event, (c, d) to the 17 May event, and (e, f) to the 17–18 May triggering event. The gray shadow in (e, f) corresponds to the approximate timing of the flash flood event in different parts of the basin according to local authorities and the community (from 02:10 to 02:40 LT).
The second of the three events started during the night of 16 May, and the average cumulative precipitation during period 2, in the basin, was around 45–50 mm (Fig. 10c and d). The spatial distribution of rainfall during period 2 is the most homogeneous among the three events, typical of stratiform-dominated events covering the entire basin as observed in Fig. 11d, and that was part of a broad cloud system that was covering a significant portion of western Colombia. By the end of period 2, Fig. 11d shows the presence of three short-lived convective cells in the basin covering an important fraction of the basin.
Figure 12 shows weather radar horizontal reflectivity (Zh) retrievals depicting key moments of the evolution of this event (period 2) over the entire 120 km radius area and over the La Liboriana basin. The black dots correspond to cloud-to-ground lightning. Figure 12a–f show a region of stratiform rain that moved northeastward to La Liboriana from the Department of Chocó (the rainiest region in Colombia and one of the wettest of the world, e.g., Poveda and Mesa, 2000), across the western branch of the Colombian Andes, generating close to uniform precipitation over the basin for a prolonged period. Eventually, convective cores that formed over the western hills of the Cordillera Occidental crossed La Liboriana, generating intense precipitation that concentrated in the lower half of the basin and near the outlet (Fig. 12i–l), where the hills are considerably flatter than in the upper half of the basin.
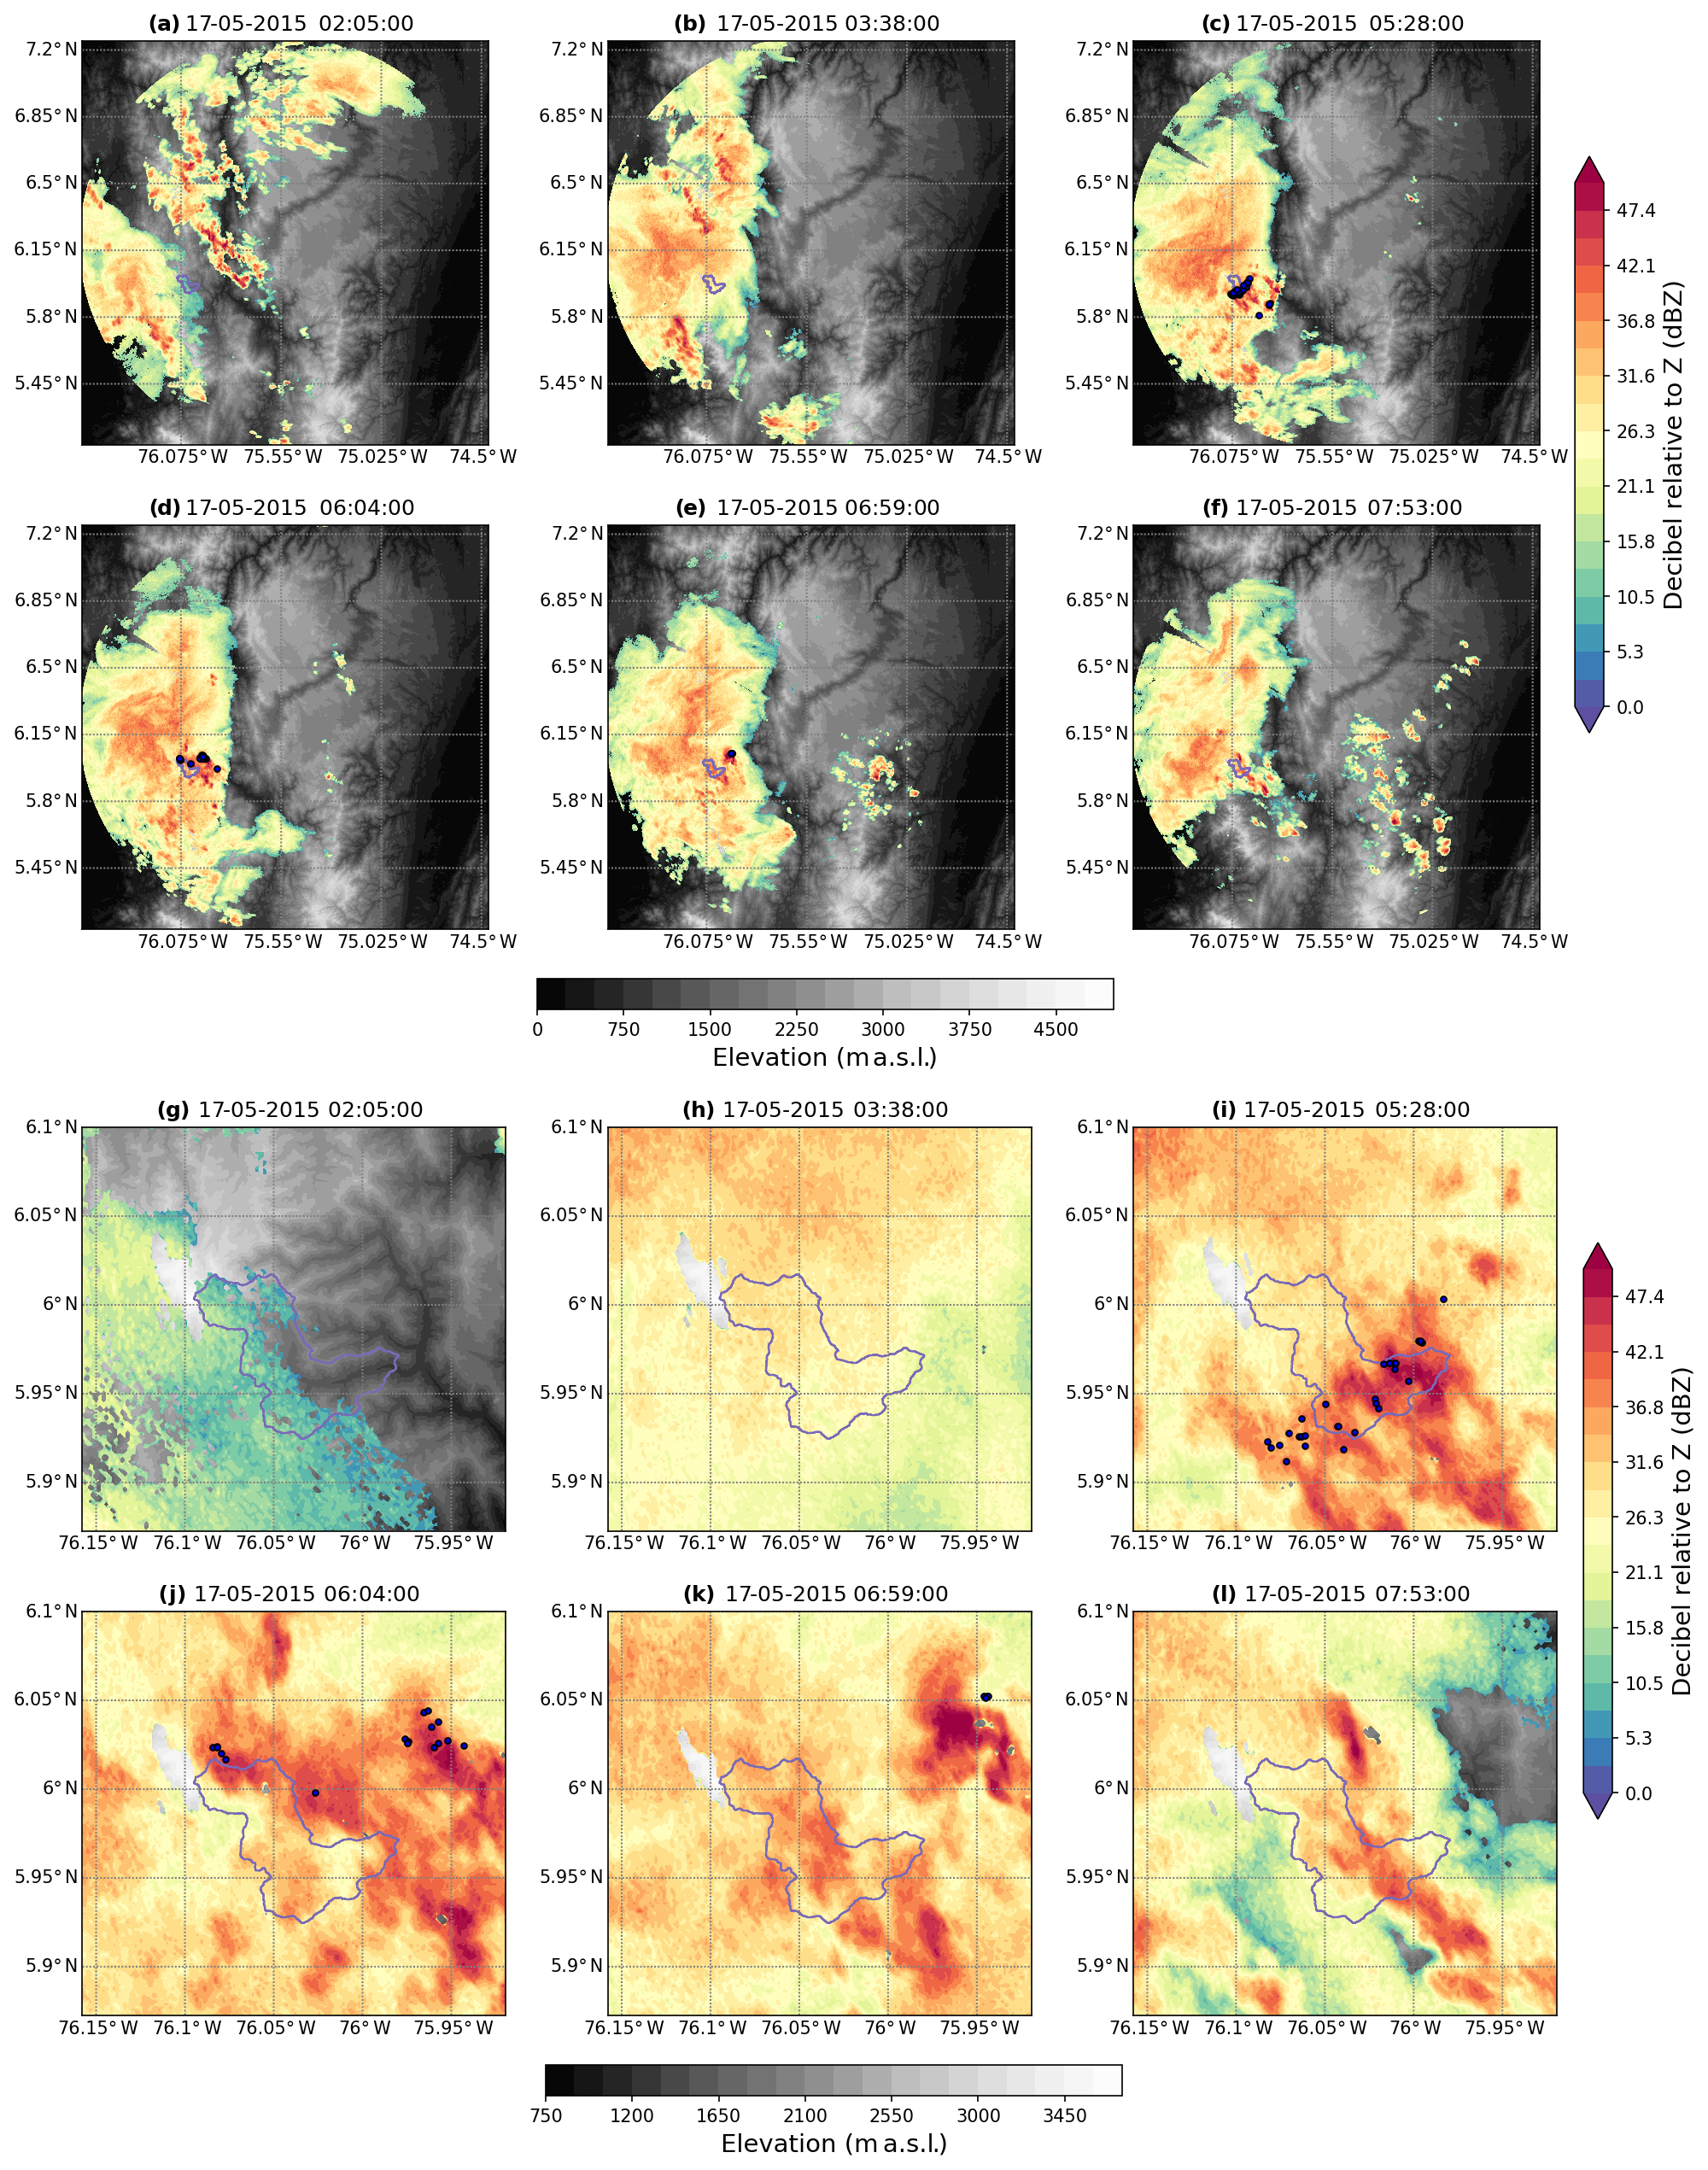
Figure 12Quasi-horizontal reflectivity fields from the C-band radar (1∘ antenna tilt) showing the evolution of the 17 May precipitation event (period 2) for (a–f) the region determined by the 120 km radius circular area centered at the radar site and (g–j) the region around the La Liboriana basin for the dates specified in each panel. The black dots correspond to cloud-to-ground lightning.
Rainfall during periods 1 and 2 increased the overall soil moisture in the basin, likely decreasing the magnitude of the infiltration rates (Penna et al., 2011; Zehe et al., 2010), hence increasing runoff and the likelihood of flash flood occurrence (Wagner et al., 1999; Penna et al., 2011; Tramblay et al., 2012). Twenty hours after the second event, a third event characterized by training convection (deep convective cells organized such that they move repeatedly over the same area as described by Doswell et al., 1996) moved towards La Liboriana. Figure 10e and f show a considerably high cumulative precipitation over the highest elevation of the basin, towards Cerro Plateado, with values over 150 mm. The average precipitation over the basin is between 35 and 40 mm. The evolution of the Zh retrievals shows that the third event was composed of multiple convective storms, propagating in the southeast–northwest direction towards the upper part of the basin (Fig. 13g–l), embedded in the convective envelope seen in GOES-13 Tb imagery (Fig. 9f), and in the same direction as suggested by ERA-Interim low-level winds. In particular, there were two successive extreme convective cores generating rainfall with maximum intensity near Cerro Plateado and ultimately triggering the flash flood. The first convective core entered the basin after 23:00 LT on 17 May (Fig. 11e), intensifying towards the highest hills between 00:30 and 01:00 LT on 18 May (Fig. 13i and j). At this point, Zh values reached over 50 dBZ. Then, another intense convective core appeared around 02:00 LT, generating precipitation in the same places as the previous core and lasting for about 30 min (Fig. 13k). The precipitating cloud associated with the second core had an elongated dimension of about 15 km by 5 km and was aligned SE–NW, taking a similar shape to the basin. The flooding was reported in the urban area of Salgar about 30 to 45 min after the occurrence of this intense event. The convective cores were immersed in a system of storms that reached the mesoscale (around ∼70 km of length) and were moving across the Department of Antioquia with a SE–NW direction. These events can be categorized as almost purely convective (Fig. 11e), with Zh reaching over 40 dBZ. It is relevant to note that the cumulative convective rainfall reported during the day of the disaster was not the highest among the three events, and its intensity was not exceptionally higher.
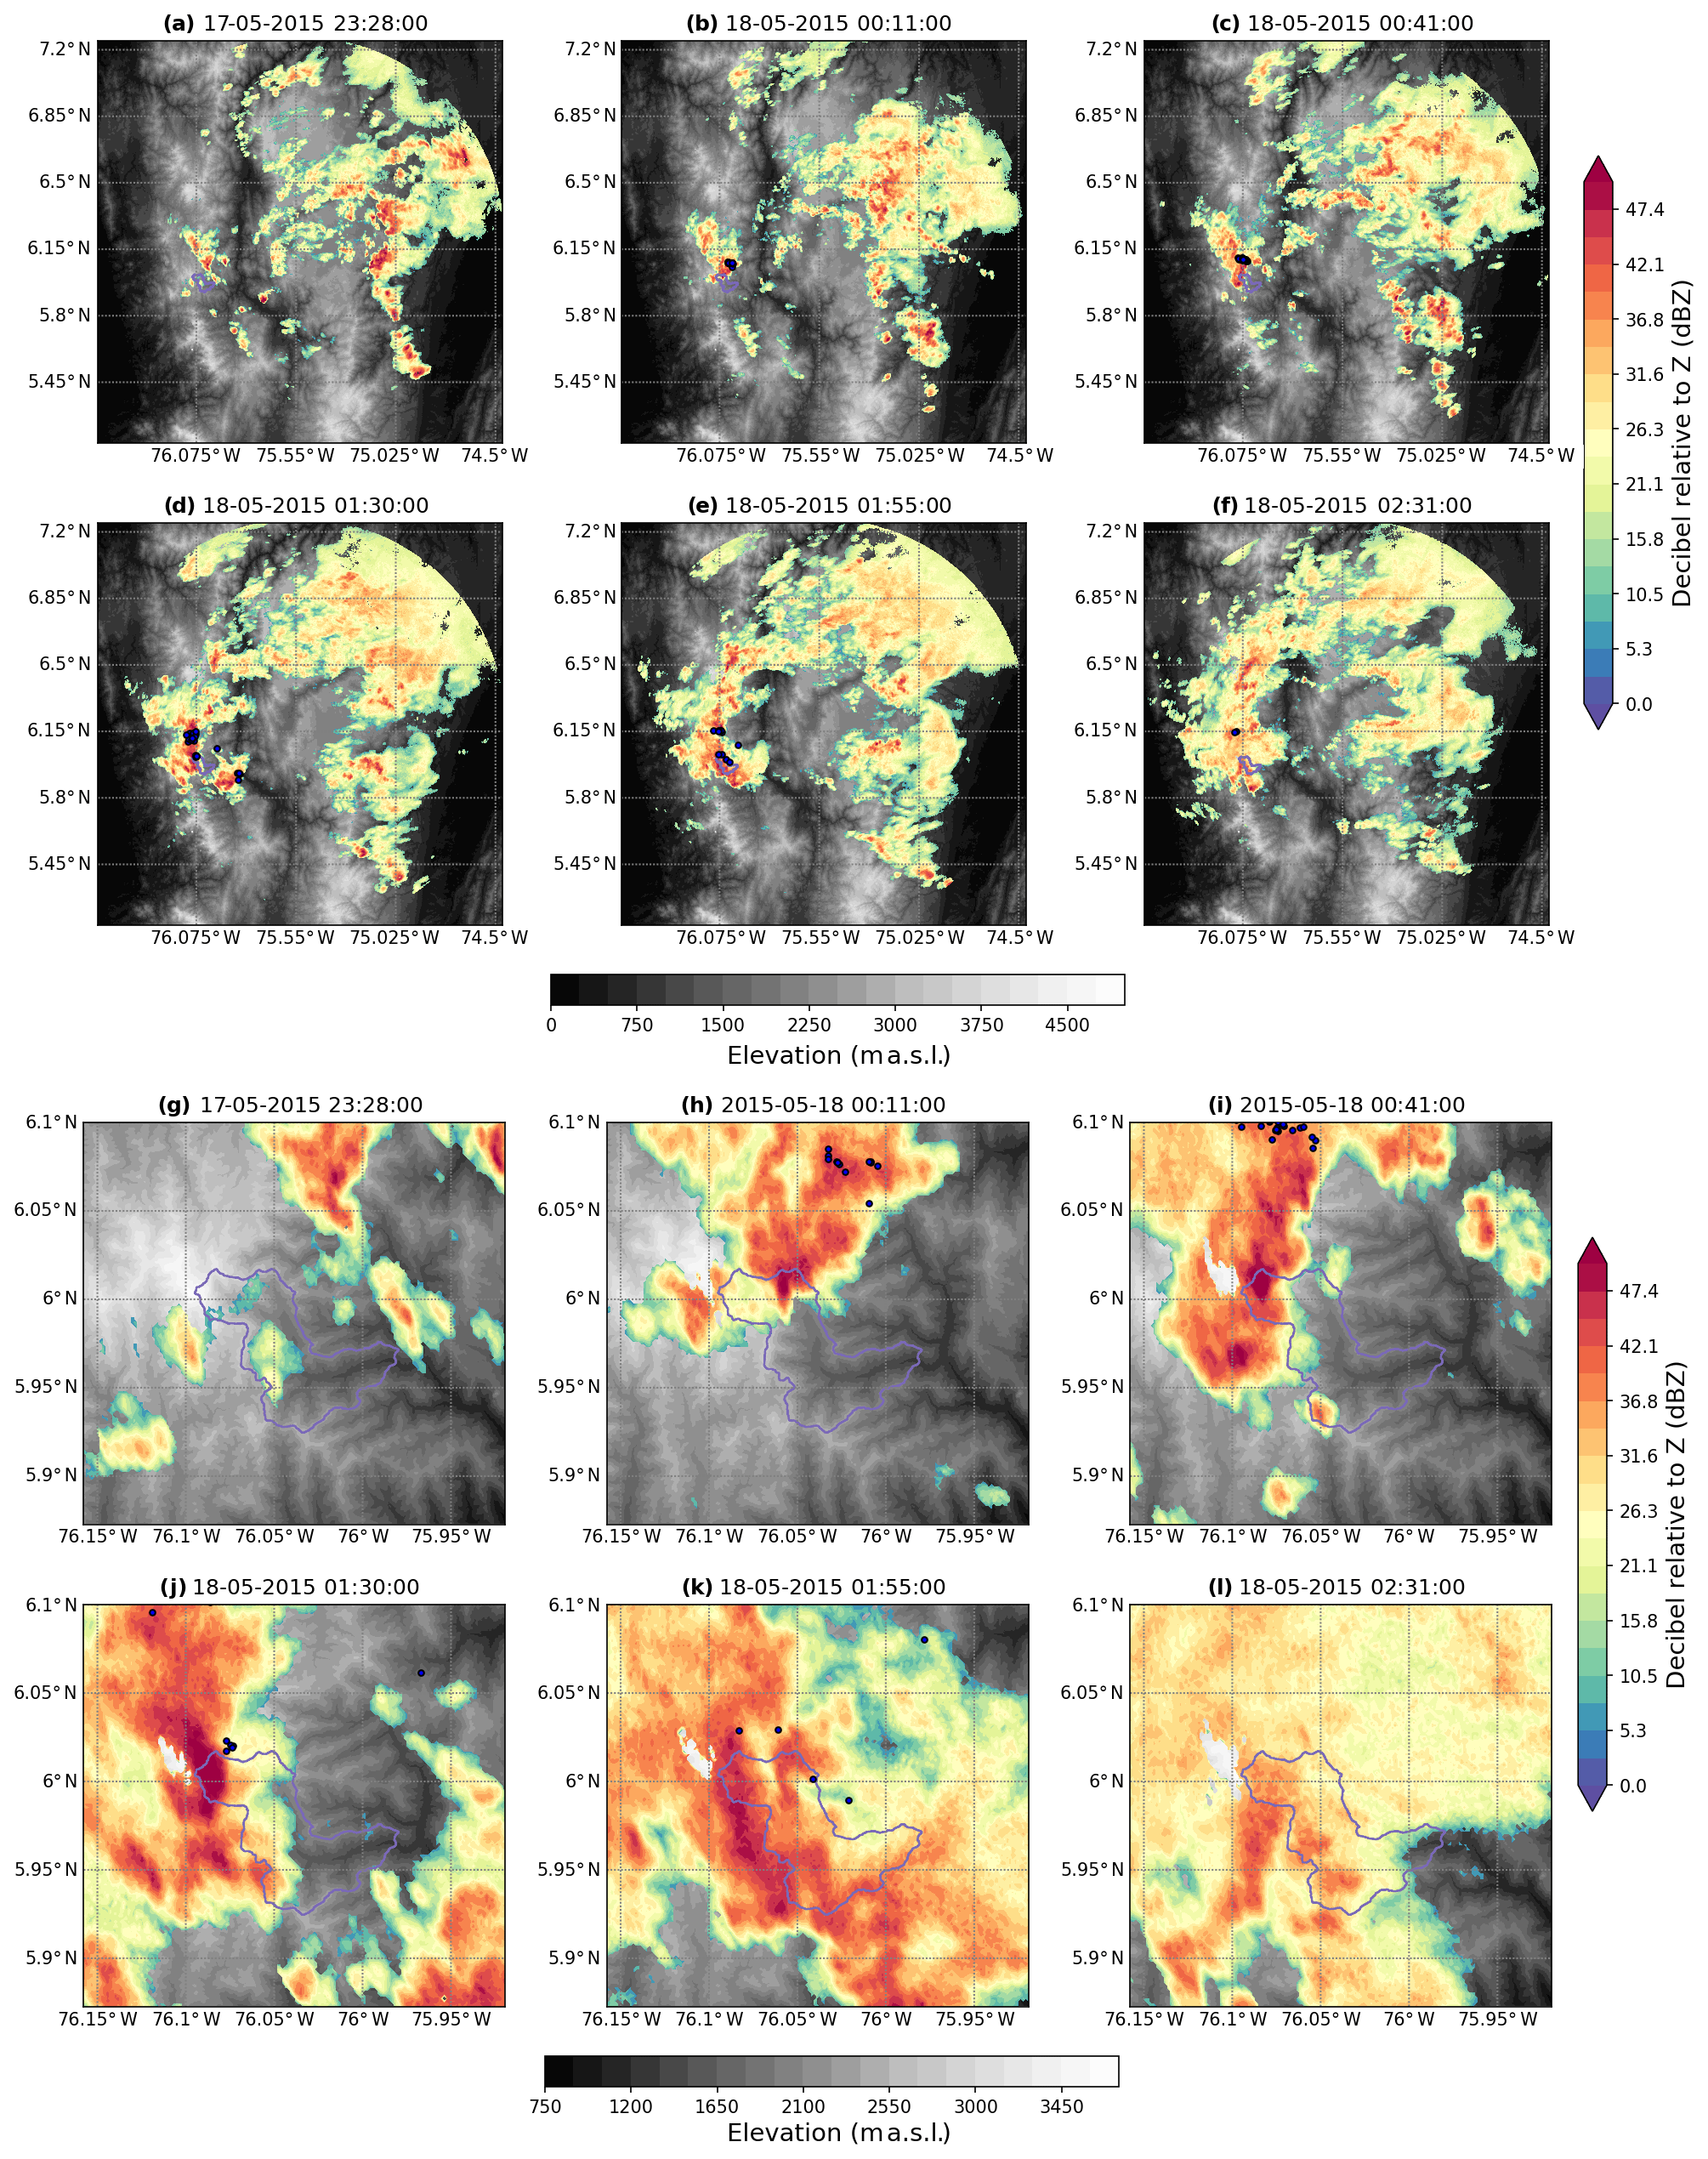
Figure 13Similar to Fig. 12 for the flash-flood-triggering event (period 3).
Figure 14 shows the vertical cross sections of Zh, radial velocity (Vr), differential reflectivity (ZDR), and polarimetric correlation coefficient (ρHV) across one of the convective cells that was occurring north of Salgar around the time of the disaster (02:00 LT, 18 May 2015) and was also immersed in the system of the storms. An intense, purely convective storm can be observed reaching up to 14.5 km (Fig. 14a), with the characteristic divergent pattern in the upper levels of the radial velocity field (Fig. 14b). The intensity of the storm is associated with a core of high Zh values over a ∼7 km region (horizontal extension). Figure 14c shows values of ZDR greater than 1, indicative of nonspherical particles likely composed of liquid droplets, associated with the high Zh values between 4 and 6 km height, and also aloft, over 10 km height towards the western side of the storm, where ice and snow particle formation is likely occurring. All of this occurs in a region with high particle homogeneity, regarding hydrometeor shape, characterized by high ρHV values (Fig. 14d). The shape and values of the polarimetric variables observed in Fig. 14 are highly indicative of the composition of the associated storms, showing mostly liquid droplets, and with particle microphysics distributed homogeneously over the affected region. The assessment of the vertical structure of the convective cores is also relevant to evaluate their intensification potential: in cases like the one presented in Fig. 14, the depth of the convective core and the overall structure of the system suggest a high potential for intense rainfall at the surface.
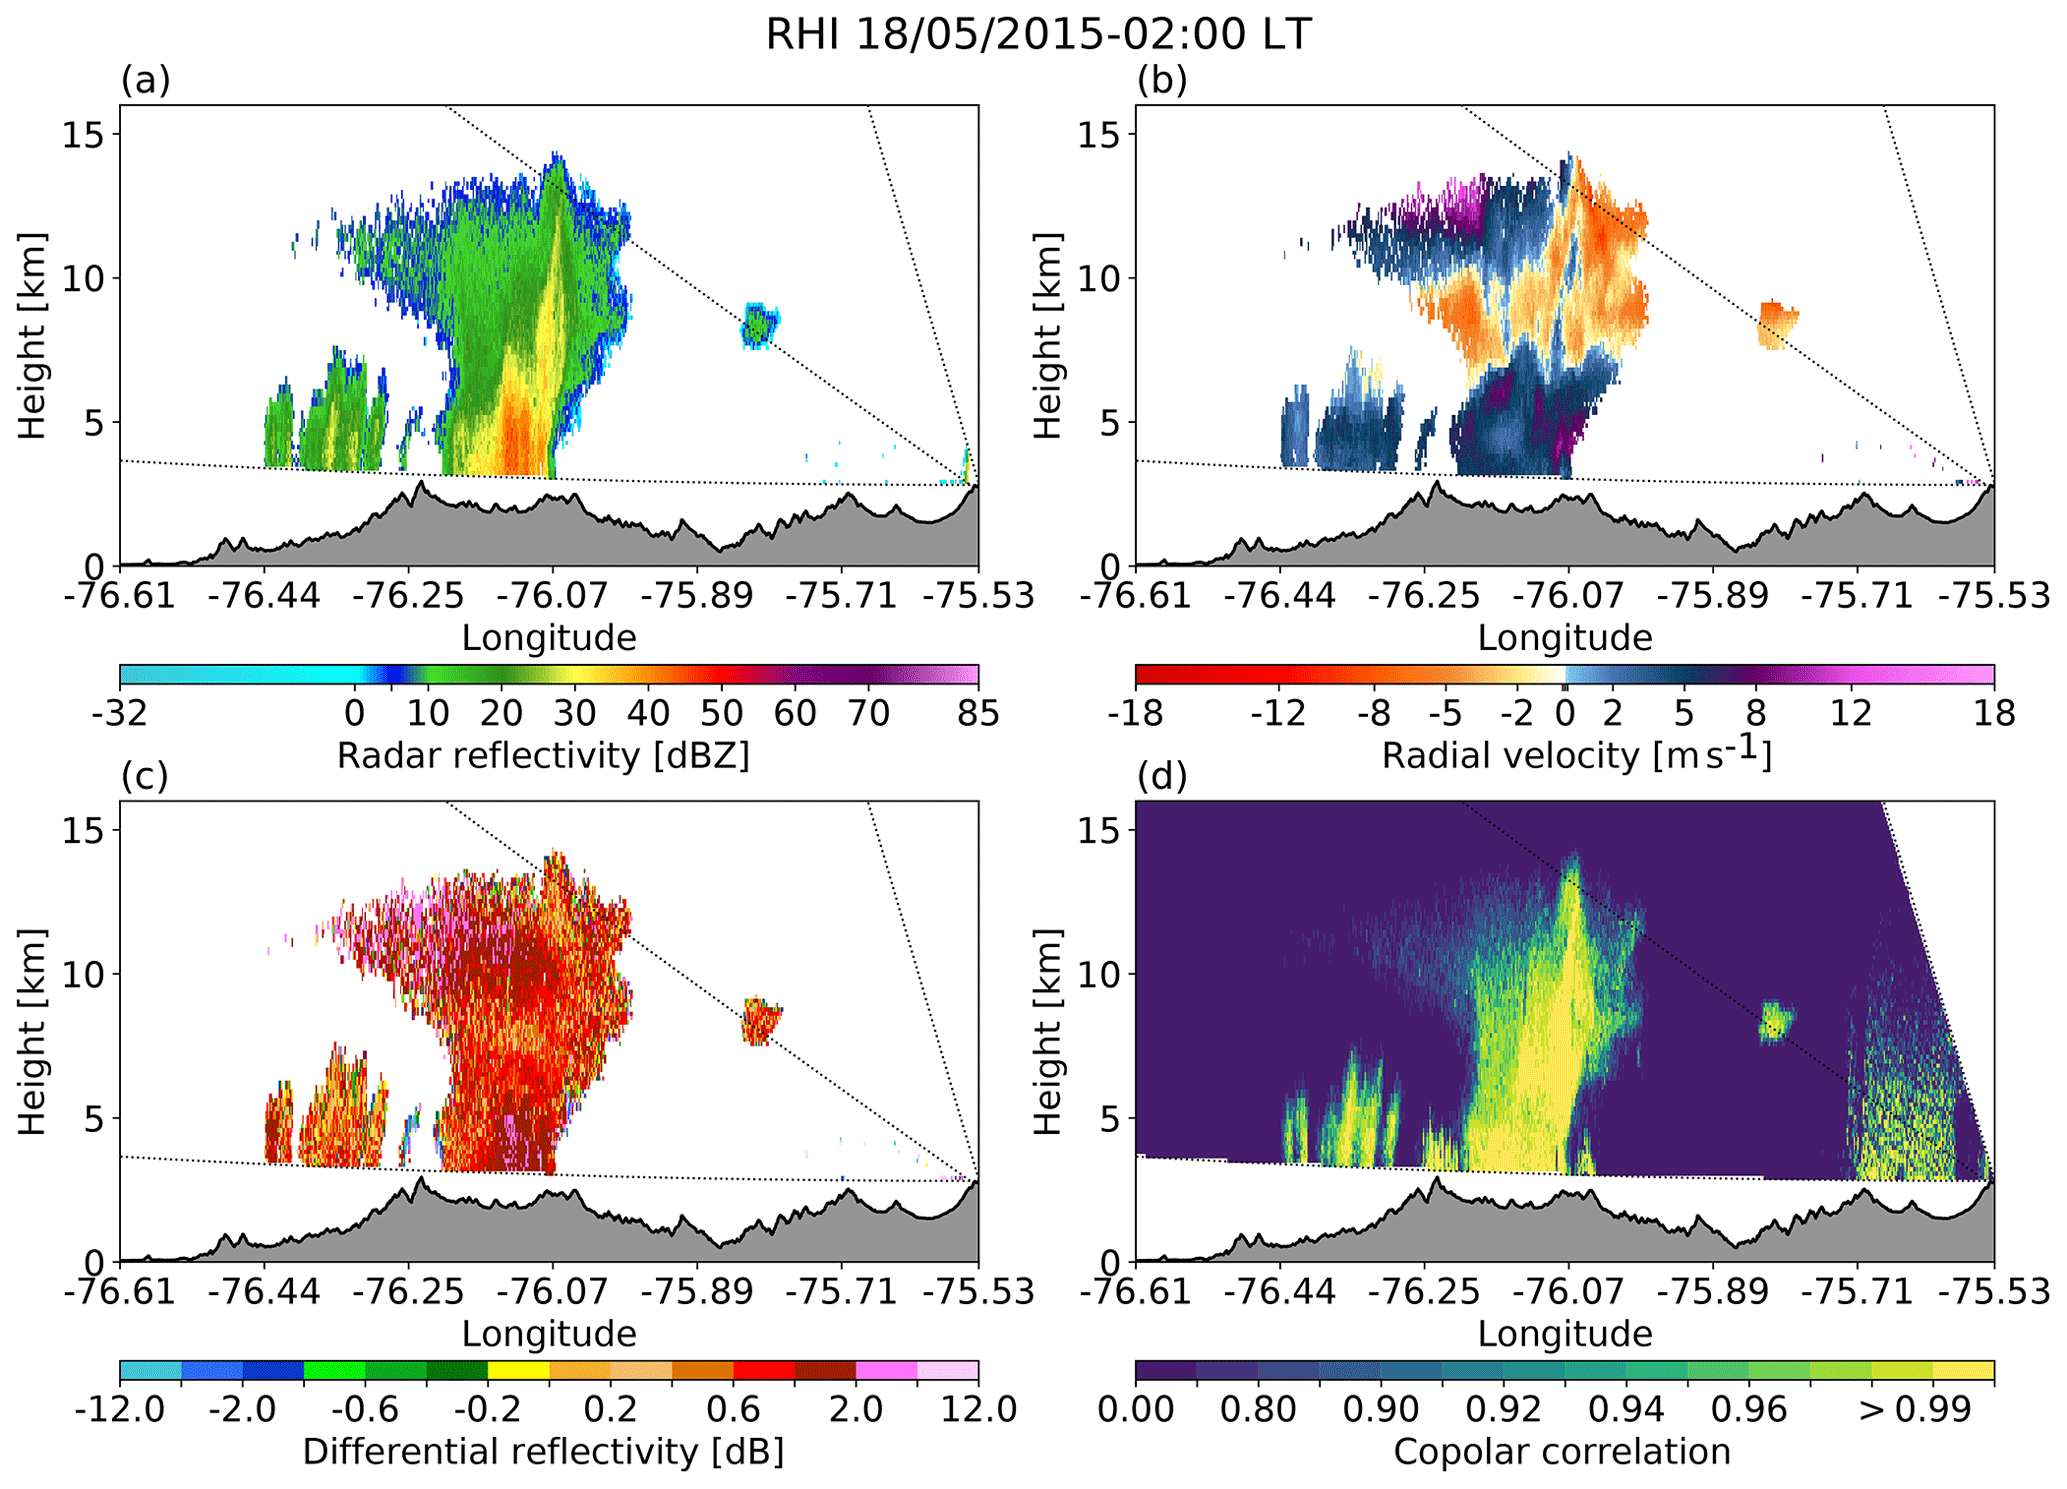
Figure 14Vertical cross sections across the east–west direction (270∘) of the reflectivity field shown in Fig. 1, showing (a) horizontal reflectivity, (b) radial velocity, (c) differential reflectivity, and (d) polarimetric correlation coefficient. Notice the maximum altitude of the reflectivity field is about 15 km and the base of the scans is about 3.2 km.
3.2.3 Orographic enhancement
The synoptic and meteorological evidence of the 2015 La Liboriana flash flood and debris flow suggests an important role of orography in the spatiotemporal evolution of the triggering storms. Figure 15a–c show Hovmöller diagrams (longitude–time cross section) of Zh at 6∘ N for different radar scanning tilts (1, 2 and 4∘) relative to the topography of the region as shown in Fig. 15d. The Hovmöller diagrams summarize the evolution of the flash-flood-triggering event during 18 May 2015. Figure 15e shows the temporal evolution of Zh, for the different tilts, along the black line in Fig. 15a–c. Figure 15e also shows the corresponding terrain elevation below the propagating precipitating cloud. Overall, the figure shows an event of medium intensities (20–30 dBZ) approaching the upper part of the basin from the east. As the convective cores approached the steepest topography, above 3000 m a.s.l., the intensities increased significantly, with cores exceeding 40 dBZ. At around 01:30 LT, a precipitation system with high intensities approached Cerro Plateado and joined the first core, generating a high-intensity nucleus that extended latitudinally from 5.93 to 6.06∘ N (see Fig. 13). These intense cores persisted close to the steepest and highest terrain for about 2 h when the system started to spread around, covering the basin with precipitating clouds of varying intensities (Fig. 13k and i). The intensification of the cores as they approached the topographic obstacle is evident in the three radar scanning tilts (Fig. 15a–c). Subsequently, the system began to dissipate as it migrated out of the basin in a northwestern direction. According to Fig. 15e, it is possible to identify that the approaching systems increased their intensity by at least 30 dBZ over the topographic barrier, highlighting the importance of the steep orography of the basin in the intensification of the cloud system generating the disaster over the municipality of Salgar.
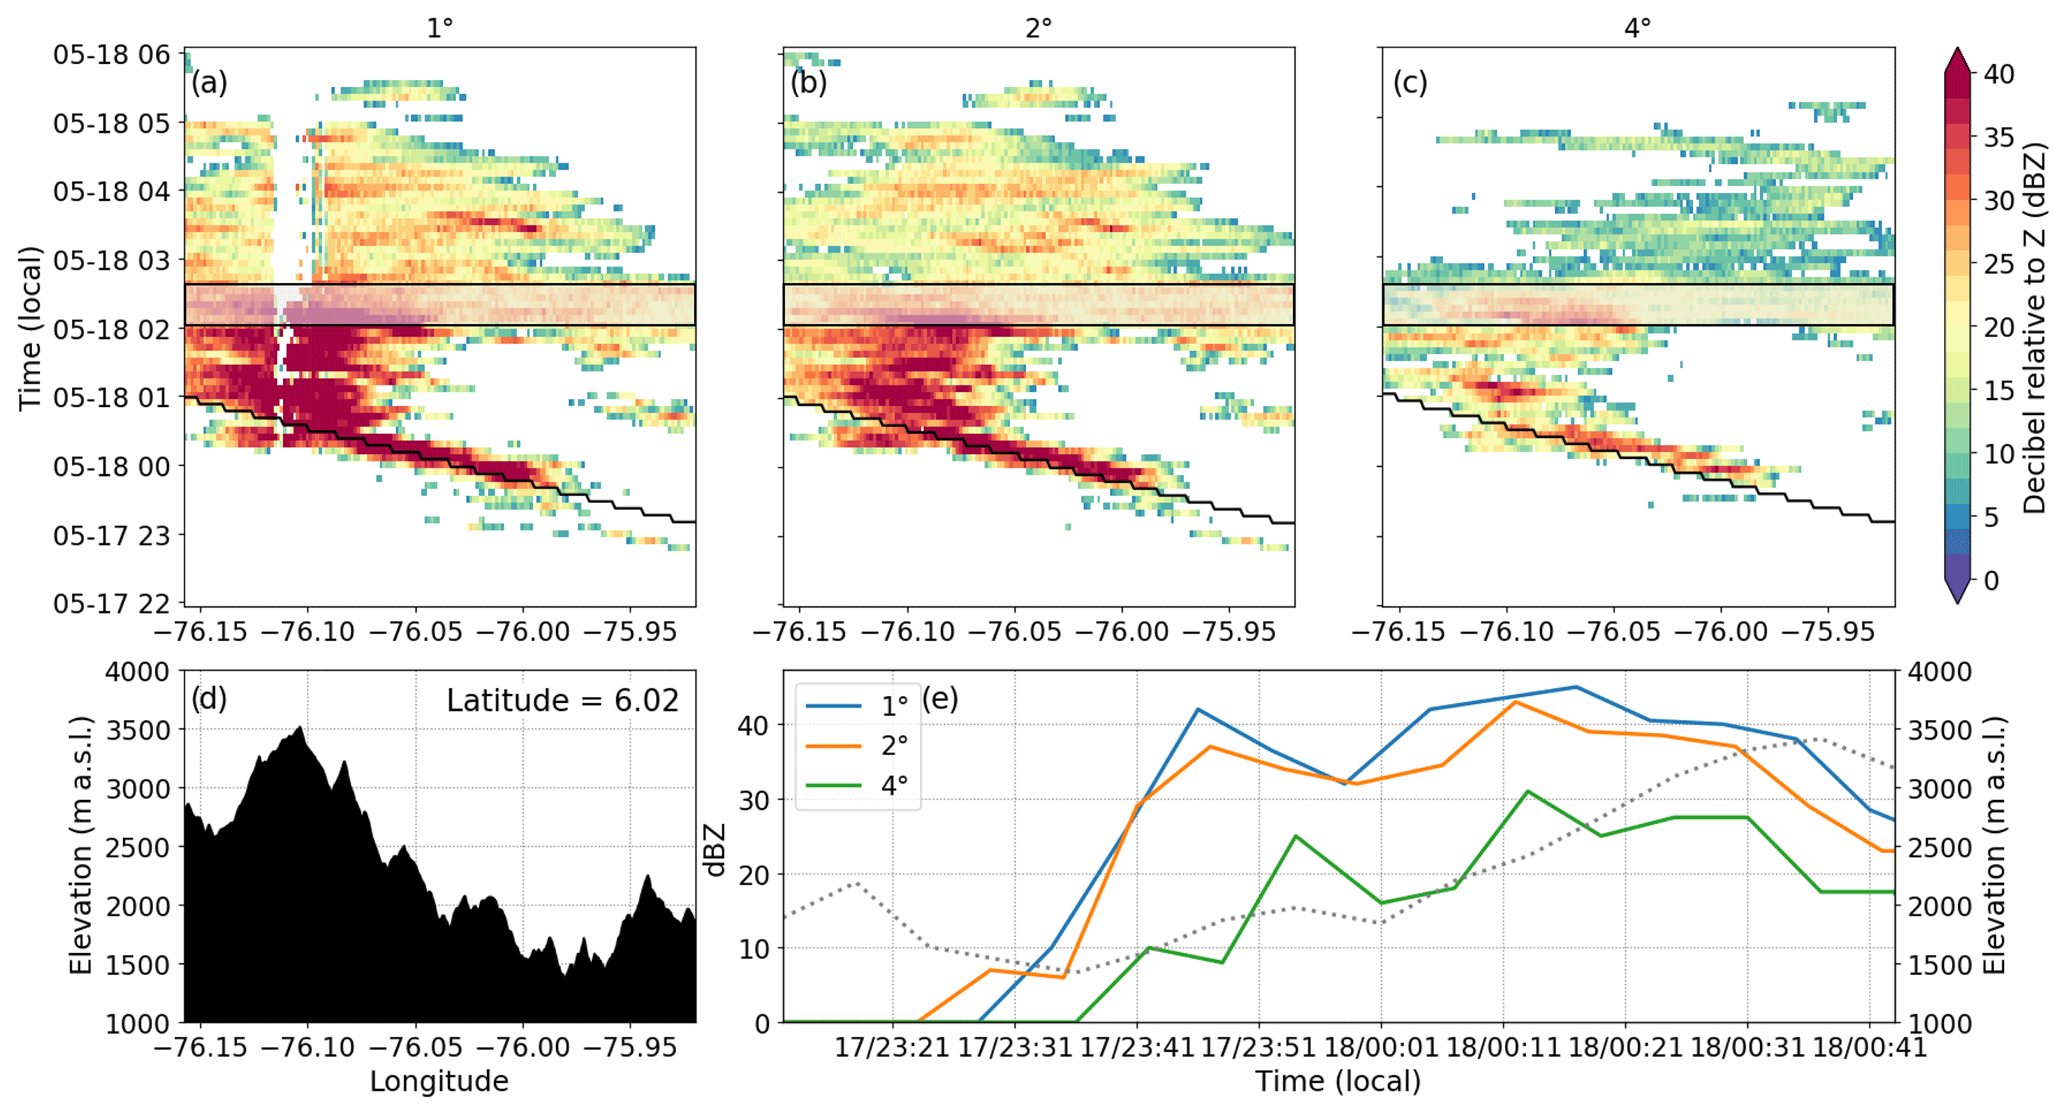
Figure 15(a–c) Hovmöller diagrams (longitude–time cross section) at 6∘ N for different radar scanning tilts at 1, 2, and 4∘, respectively. (d) Topography of the region at 6∘ N. (e) Continuous lines show the temporal evolution of Zh along the black line in (a–c), and the dashed line shows the corresponding terrain elevation below the precipitating cloud.
3.2.4 Evidence from satellite retrievals
Figure 16 shows the IMERG and TRMM 3B42 cumulative precipitation for the three events from 14 to 18 May 2015 for the same regions and the same periods as in Fig. 10. The regions shown, the 120 km radius area centered at the radar site (radar scale) and the La Liboriana basin, allow assessing the usefulness of both satellite products in risk management. At the radar scale, despite the apparent underestimation of peak values by the satellite retrievals, the overall structure of the rainfall distribution is captured skillfully by the satellite-based estimates and in particular by the IMERG algorithm, which is able to capture the spatial structure of the cumulative precipitation on all three cases, including the location and areal extent of the events. On the other hand, at the basin scale, none of the products capture the intense cores evident in the QPE technique. This does not necessarily preclude the use of satellite information in risk analysis, but it does limit its direct use in flash flood warning systems. Alternatively, given that at the radar scale satellite information appears skillful, the spatial distribution of precipitation from IMERG, as an example, should be used as a two-dimensional probability density function (or mass spatial function) combined with downscaling schemes such as a multifractal framework (e.g., Deidda, 2000; Tao and Barros, 2010) to generate probabilistic higher-resolution precipitation fields conserving the original mass in the coarse scale.
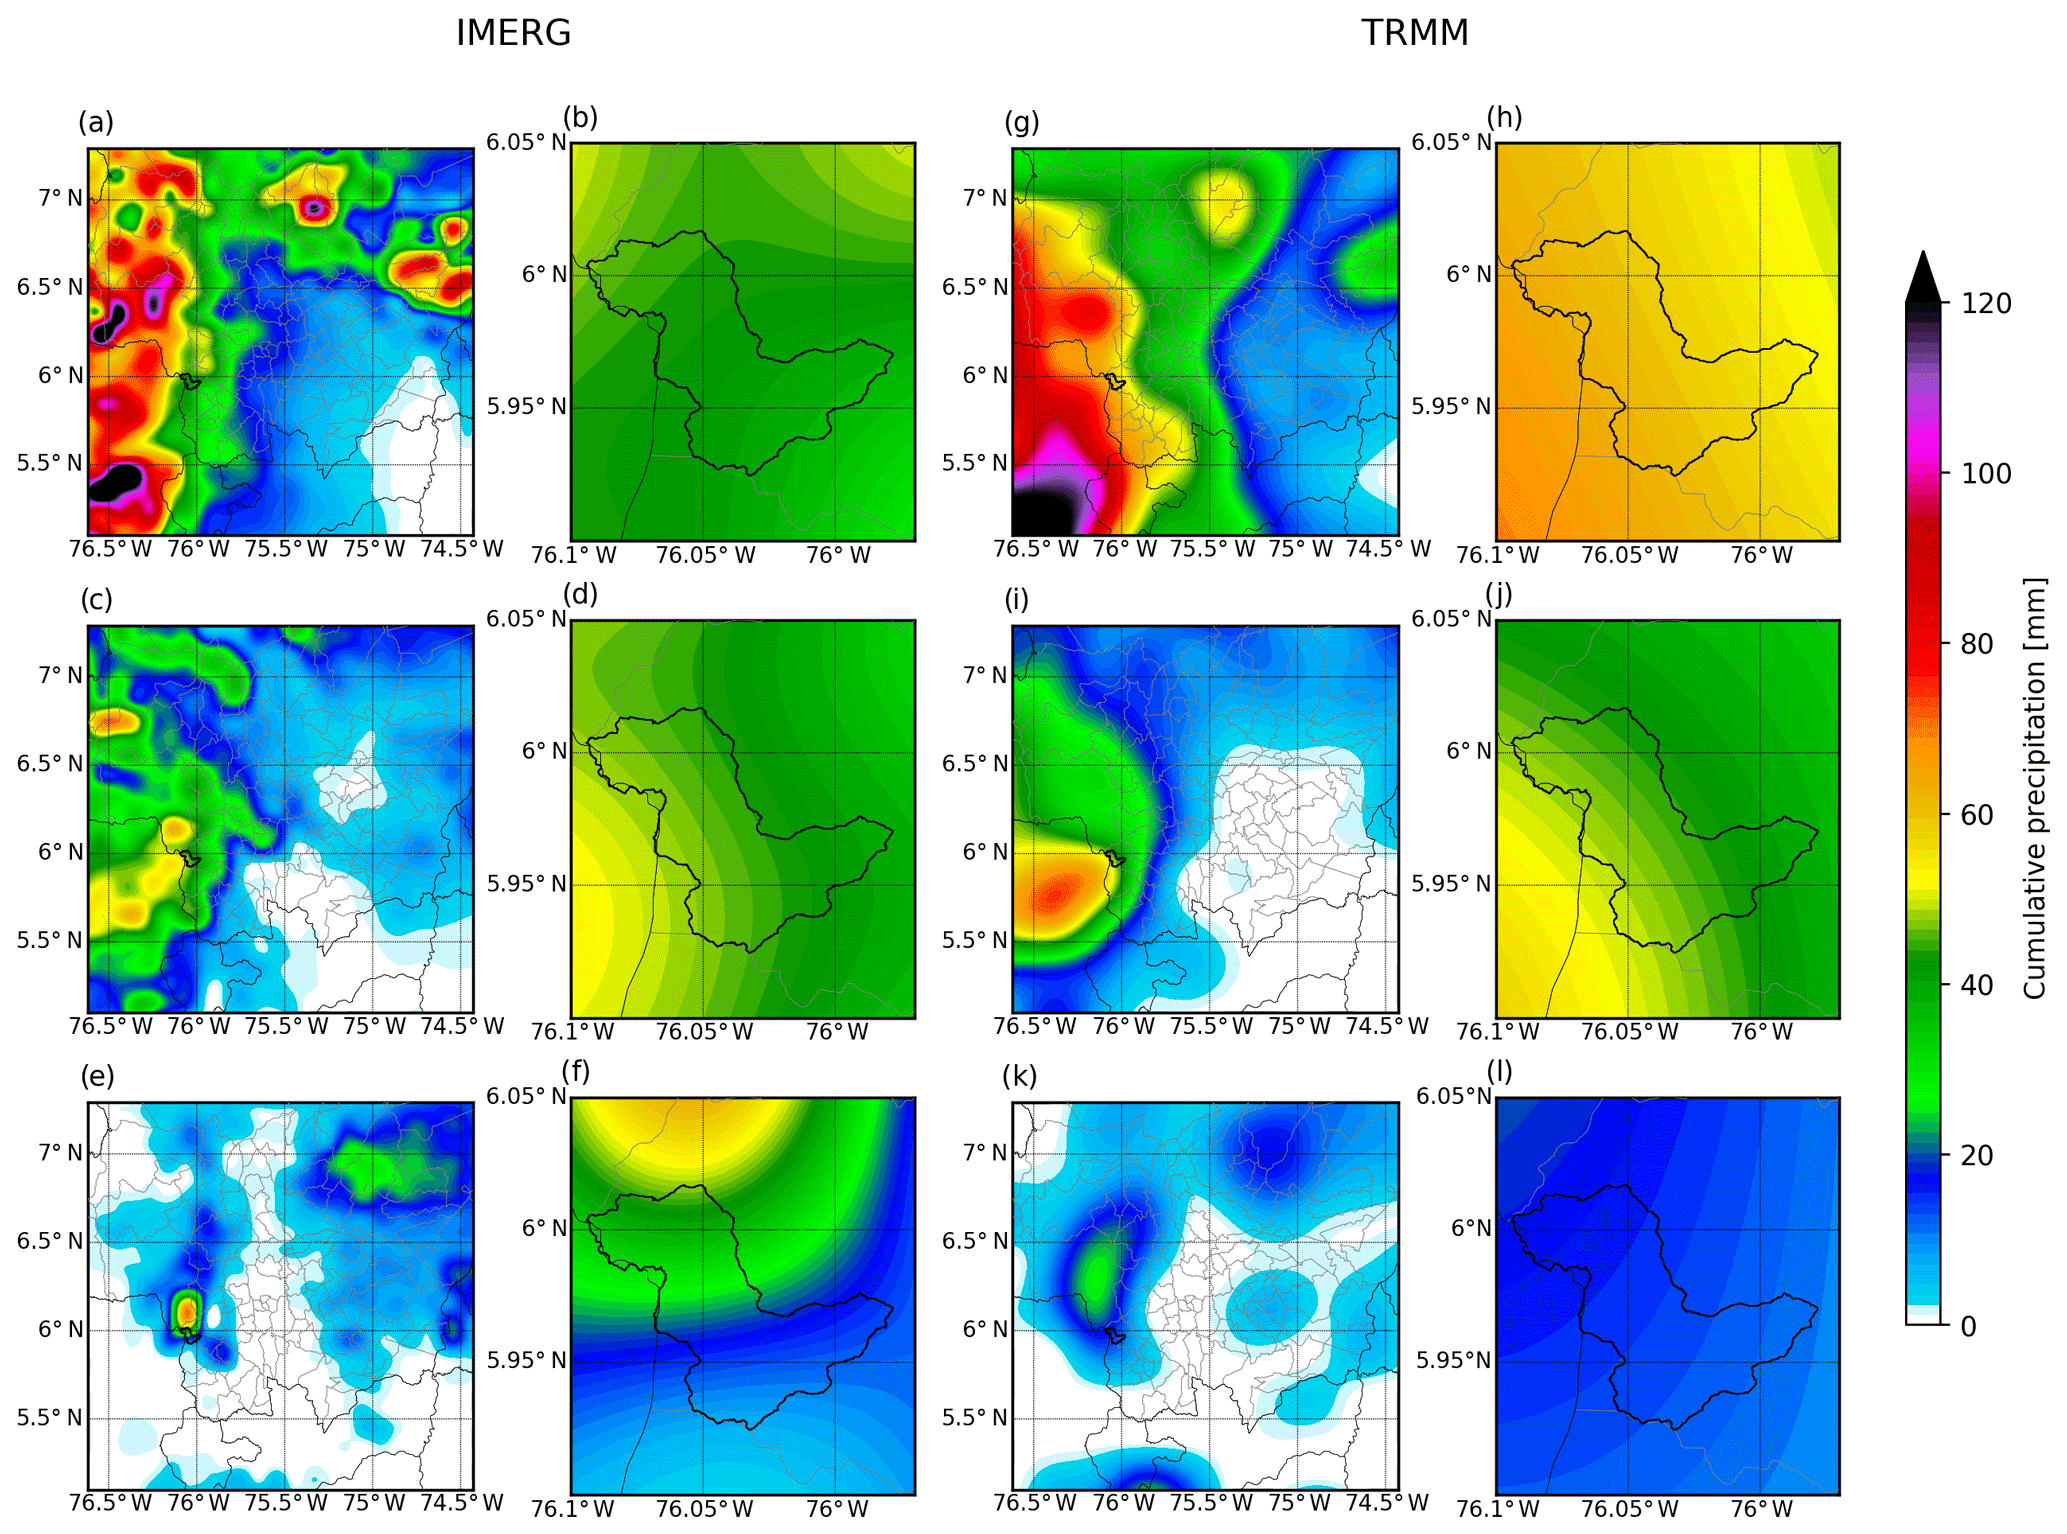
Figure 16Same as Fig. 10 for the IMERG (a–f) and TRMM 3B42 (g–l) products.
Figure 17 shows Hovmöller diagrams of IMERG precipitation and GOES-13 Tb, at 6.00535∘ N, for the flash-flood-triggering event during 18 May 2015. Figure 17a presents evidence that the IMERG dataset captured the event approaching the basin from the east and the main features of the orographic enhancement during the event reasonably well, although with very coarse features. On the other hand, GOES-13 Tb, a proxy for cold cloud tops, does not clearly capture the observed orographic enhancement in cloudiness (Fig. 17b), most likely due to its inherent synoptic nature: difficulties discerning deep clouds from thin–high clouds using the infrared–thermal channels.
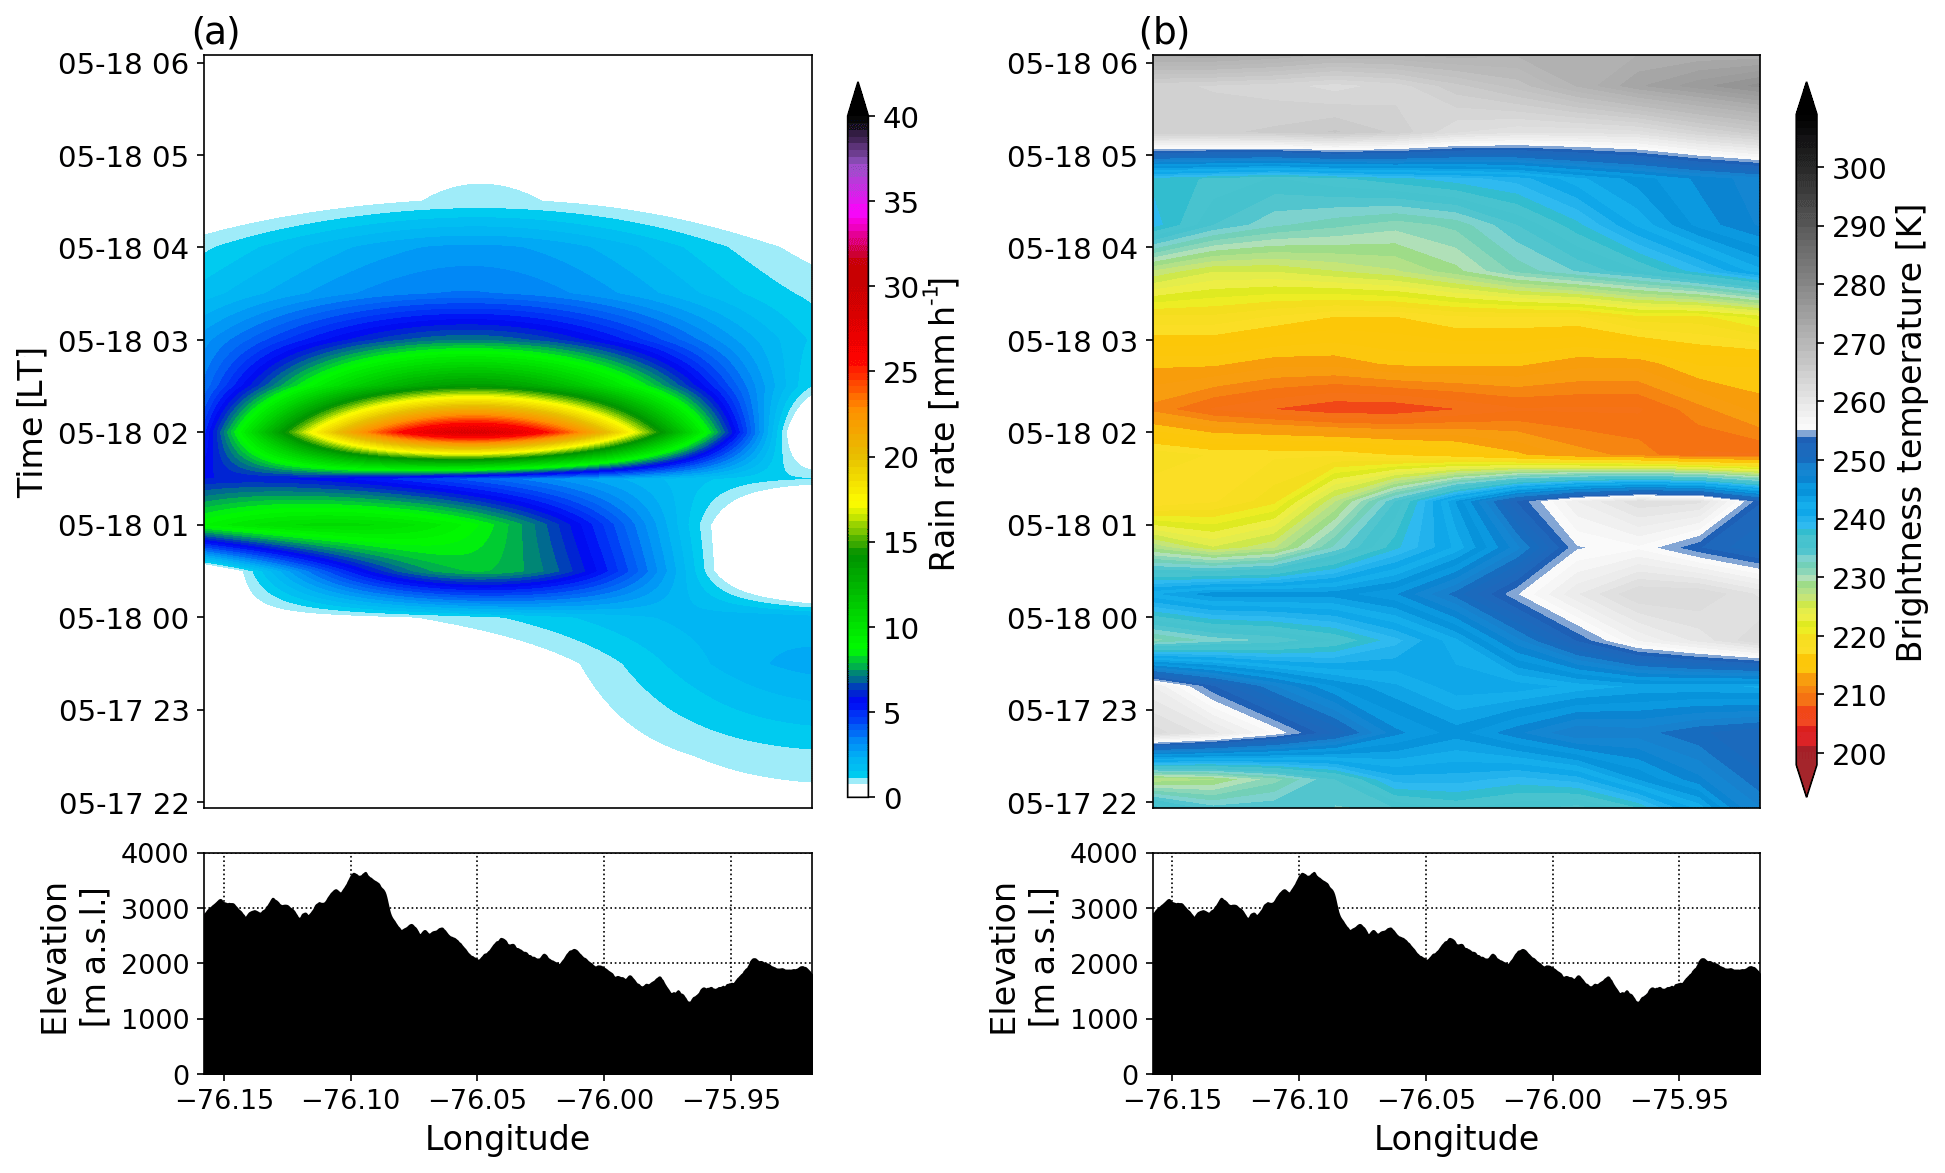
Figure 17Longitude–time Hovmöller diagram at 6.00535∘ N in the same time interval as before for (a) IMERG interpolated rainfall rate, and (b) GOES-13 brightness temperature. The terrain profile at 6.00535∘ N is shown below the Hovmöller diagrams.
3.3 First-order hydrometeorological processes
One of the goals of this work is to assess the likelihood of occurrence of extreme events similar to the one, or to the ones, triggering the La Liboriana flash flood. In other words, it is important to evaluate whether or not the characteristics of the 18 May 2015 flood were exceptional and, ideally, their recurrence rate. In a traditional sense, it would be desirable to estimate a return period of the conditions that led to the La Liboriana flash flood. However, the length of the historical radar QPE record is not enough for a robust estimation of the return period. Considering this limitation, the previous analysis together with first-order hydrometeorological considerations allows us to conduct a preliminary assessment of the exceptionality of the precipitation conditions associated with the event. Analyses in the previous sections suggest that (i) the spatial structure of precipitation relative to the basin's main geomorphologic features, (ii) the occurrence of multiple precipitation events in a relatively short time span (3–4 d), and (iii) the orographic enhancement of precipitation all played a significant role in triggering the observed flash flood, suggesting that the traditional point rainfall return period estimation based on intensity–duration–frequency curves (IDF) grossly misrepresents the observed hydrometeorological processes, even using areal transformations via reduction factors (e.g., Rodriguez-Iturbe and Mejía, 1974; Bacchi and Ranzi, 1996; Sivapalan and Blöschl, 1998; Veneziano and Langousis, 2005; Barbero et al., 2014). In general, all approaches considering as a basis a spatially random distribution of precipitation over a specific basin would not properly represent the observations.
Figure 18a–d present the spatial distribution of the 75th, 90th, 99th, and 99.9th hourly cumulative precipitation percentiles, respectively, for the La Liboriana basin. The different percentiles are estimated considering the entire radar QPE record (2014–2018). The figure shows, clearly, a preferential spatial distribution of the extreme rainfall over the basin, with higher values towards the upper basin. The peak hourly values in the upper basin, where the slopes are higher, change from approximately 35 mm for the 90th percentile to 125 mm for the 99.9th percentile. The spatial distribution of the different percentiles is most likely due to the orographic intensification observed in the region. Figure 18e shows the hourly cumulative precipitation during the time of the flash flood, from 02:00 to 03:00 LT during 18 May 2015, including evidence of the intensification towards the upper basin, similar to the spatial structure of the different percentiles shown in Fig. 18a–d. During the hour of the event, the cumulative precipitation in the upper part of the basin is in fact over the 95th percentile, and a very small percentage is above the 99th percentile, but no region in the basin was above the historically observed 99.9th percentile (see Fig. 18f): 87 % of the basin was over the 90th percentile and 39% above the 95th percentile. The bivariate histogram in Fig. 18g is evidence of the conditional link between the highest hourly cumulative precipitation and the steepest slopes in the basin, with the maximum cumulative values taking place only over regions with slopes between 20 % and 40 %, which is different to the lowest cumulative precipitation values that occur over the entire range of slopes. The converse relationship does not hold, as the steepest slopes are not always associated with large values of cumulative precipitation.

Figure 18(a–d) Spatial distribution of the 75th, 90th, 99th, and 99.9th hourly cumulative precipitation percentiles, respectively, for the La Liboriana basin. (e) Hourly cumulative precipitation during the hour of the flash flood, from 02:00 to 03:00 LT during 18 May 2015, including evidence of the intensification towards the upper basin. (f) Spatial distribution of the corresponding hourly percentile for the cumulative precipitation in (e). The continuous white (red) line corresponds to the 95th (99th) percentile. (g) Bivariate histogram of the hourly cumulative precipitation in (e) and the slopes in the basin.
Considering the evidence suggesting that the occurrence of the 2015 La Liboriana flash flood is linked to multiple precipitation events in a few days or, in other words, that no single precipitation event was exceptionally large enough to generate the extreme event, Fig. 19 shows the assessment of the combined role of precedent rainfall modulating overall soil moisture, and the intense precipitation during the event, by estimating the bivariate histogram of 48 h (and 96 h) cumulative precipitation and the hourly cumulative precipitation for the entire basin (Fig. 19a and c) and for the upper basin (Fig. 19b and d). The figure also marks, for reference, the conditions associated with the La Liboriana flash flood (black triangle in Fig. 19). Based on the historical record and the cumulative precipitation for the entire basin, the probability (long-term frequency) of having rainfall above the hourly La Liboriana average during the event is 3.05 %, while for the upper basin it is 0.65 %. For the 48 h cumulative precipitation, the probability of having larger values is about 1.93 % for the entire basin and 0.41 % for the upper part. The bivariate probability for events above the 1 and 48 h cumulative precipitation associated with the flash flood is 0.16 % for the entire basin and only 0.03 % for the upper part. The latter probability, for the upper portion of the basin, corresponds to only two events for the entire record, both during the same week (16:00 LT 15 May and 03:00 LT 18 May, during 2015). Aggregating the entire basin, 11 events show similar cumulative precipitation features in the historical record. The probabilities presented in this paragraph are not robust as they have been estimated based on a 5-year radar record, which is not enough for assessing extreme event recurrence as mentioned previously; however, the practical implications are important as the results suggest that the La Liboriana event was, in fact, exceptional compared to all events in the 5-year radar record, but in particular in the upper part of the basin, implying that for optimal risk management it is necessary to consider the spatial distribution of cumulative rainfall relative to the geomorphological features of the basin. In other words, while the individual event on 18 May was not exceptional, the climatological anomalies were negative to normal, and the synoptic patterns around the extreme event were similar to the expected ones for the region; the combination of high rainfall accumulation as a result of successive precipitation events over the basin, followed by a moderate extreme event, is unique in the available observational record. The evidence for the La Liboriana basin also suggests that the 96 h period is more appropriate to analyze the extreme event (Fig. 19c and d). In this case, for the upper part of the basin, there is no other event in the historical record with 1 and 96 h cumulative values larger than or equal to the Salgar event. An analysis of the historical disaster records available at https://www.desinventar.org (last access: 20 November 2019) for the municipality of Salgar and the analysis and historical accounts presented in Polanco and Bedoya (2005) and Cardona-Duque (2018) show that there have been 11 extreme flash floods and torrential floods in the period from 1922 to 2019, five of them with fatalities. According to these reports, the largest so far corresponds to the event during 18 May 2015. The deadliest event before the La Liboriana disaster assessed in this study corresponds to a flash flood and torrential flows that occurred during June 1971, killing 45 people.
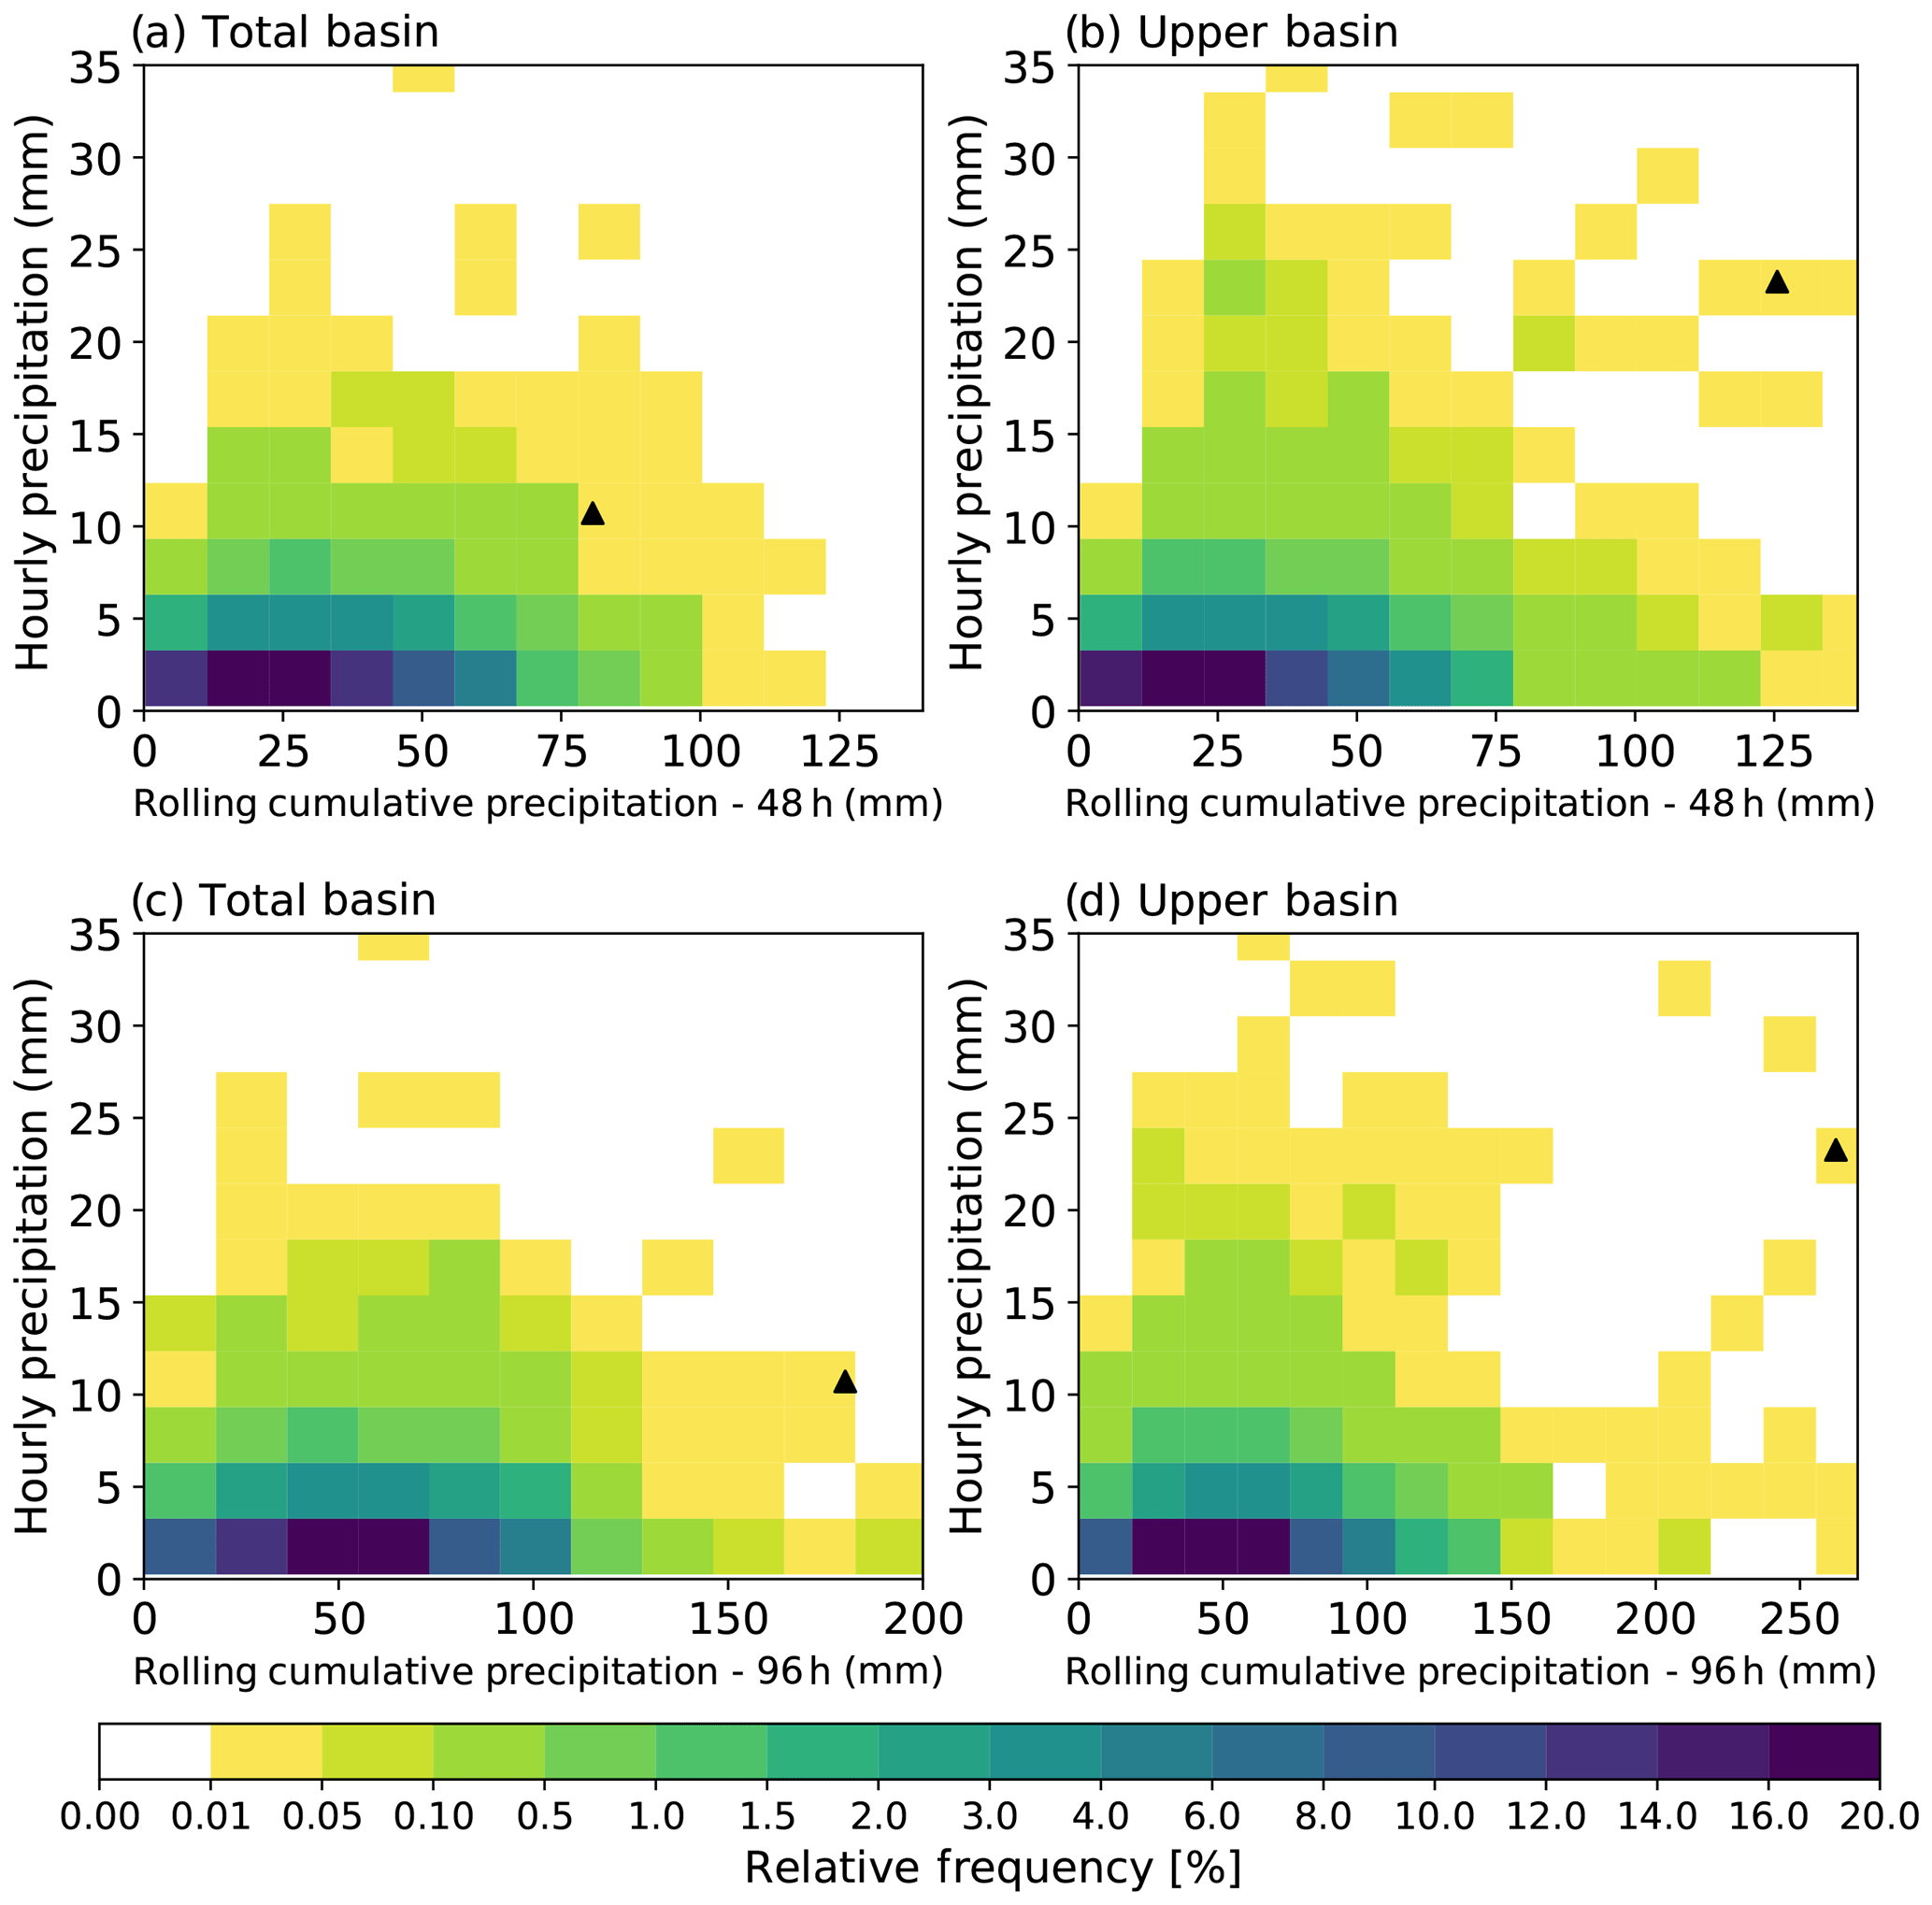
Figure 19(a, b) Bivariate histogram of the 48 h cumulative precipitation and the hourly cumulative precipitation for the entire basin and for the upper basin, respectively. (c, d) Same as (a, b) for 96 h cumulative precipitation. The black triangle corresponds to the La Liboriana flash flood event.
3.4 WRF forecasts
The use of accurate and skillful numerical weather prediction models is arguably one of the most promising strategies to improve the lead times in flash flood forecasting schemes. In such a context, simulation and forecast skill refers, in general, to the ability of the model to capture the large-scale moisture advection features responsible for the heavy rainfall in a specific region (e.g., Younis et al., 2008; Gochis et al., 2015). In regions with complex terrains, such as Salgar, in addition to the moisture advection, limited-area models are required to represent the interaction of the flow with the local topography and all the processes leading to the observed orographic precipitation enhancement. In general, QPF precipitation forecasts of extreme events tend to underestimate the total rainfall amounts (Gochis et al., 2015); however, in cases where the spatial distribution of precipitation is accurately anticipated, model output statistics (MOS) techniques could be used to bias-correct the QPF for its use in flash flood likelihood assessment, providing valuable information for an optimal risk reduction.
A brief evaluation of the limited-area operational weather forecasts issued by SIATA suggests that the model simulates the main processes leading to the observed orographic enhancement that took place prior to the La Liboriana flash flood reasonably well. In the case of the SIATA operational forecasts, which tend to underestimate total rainfall amounts, we have found that the 90th percentile of precipitation in a given area better represents the observed average (or median) precipitation over the specific area, and we use it here as a simple quantile-to-quantile MOS technique. Figure 20 presents a summary of the assessment of the 120 h operational forecasts issued daily, from 14 to 19 May 2015. Different microphysics parameterizations were used operationally at the time, including the Single Moment 5-class, Eta (Ferrier, 1994), and the Lin (Lin et al., 1983) schemes. Here we present the evaluation of the model forecasts using the Lin et al. (1983) scheme given that, for the case of the La Liboriana flash flood, the skill of the successive rainfall forecasts was considerably higher than when using the other schemes.
Figure 20a shows the comparison between the hourly time series of spatially integrated rainfall forecasts and the precipitation obtained using the radar QPE technique described previously. The observed time series is obtained by averaging the QPE over the Salgar municipality and the simulated time series by selecting the 90th percentile of the precipitation forecasts over the same region. In general, all the forecasts show heavy rainfall during the subsequent days matching the observations, especially the timing of the events. The 14 May forecast captures the timing of the series of all three events, but as the lead time is larger, it fails to capture the peak magnitude of the cumulative precipitation. Similar performance is observed for all the different forecasts, with the 16 May forecast being the most accurate in capturing the rainfall event during 17 May. Even though the event on 18 May was forecasted in all cases, the amount of precipitation was considerably less than the one observed. Figure 20b shows the total amount of precipitation accumulated from the start of the forecast to 19 May. In general, despite using the 90th percentile, the forecasts underestimate the observed rainfall amounts. In the 14 May forecast, the total precipitation corresponds to 160 mm over the Salgar region, and the radar observations show 390 mm (17 and 18 May events were considerably underestimated). Among all the forecasts shown in Fig. 20a, the 16 May case shows a better agreement with observations as it captured the 17 May event, with a total accumulation of 120 mm compared to the observed 190 mm.
.
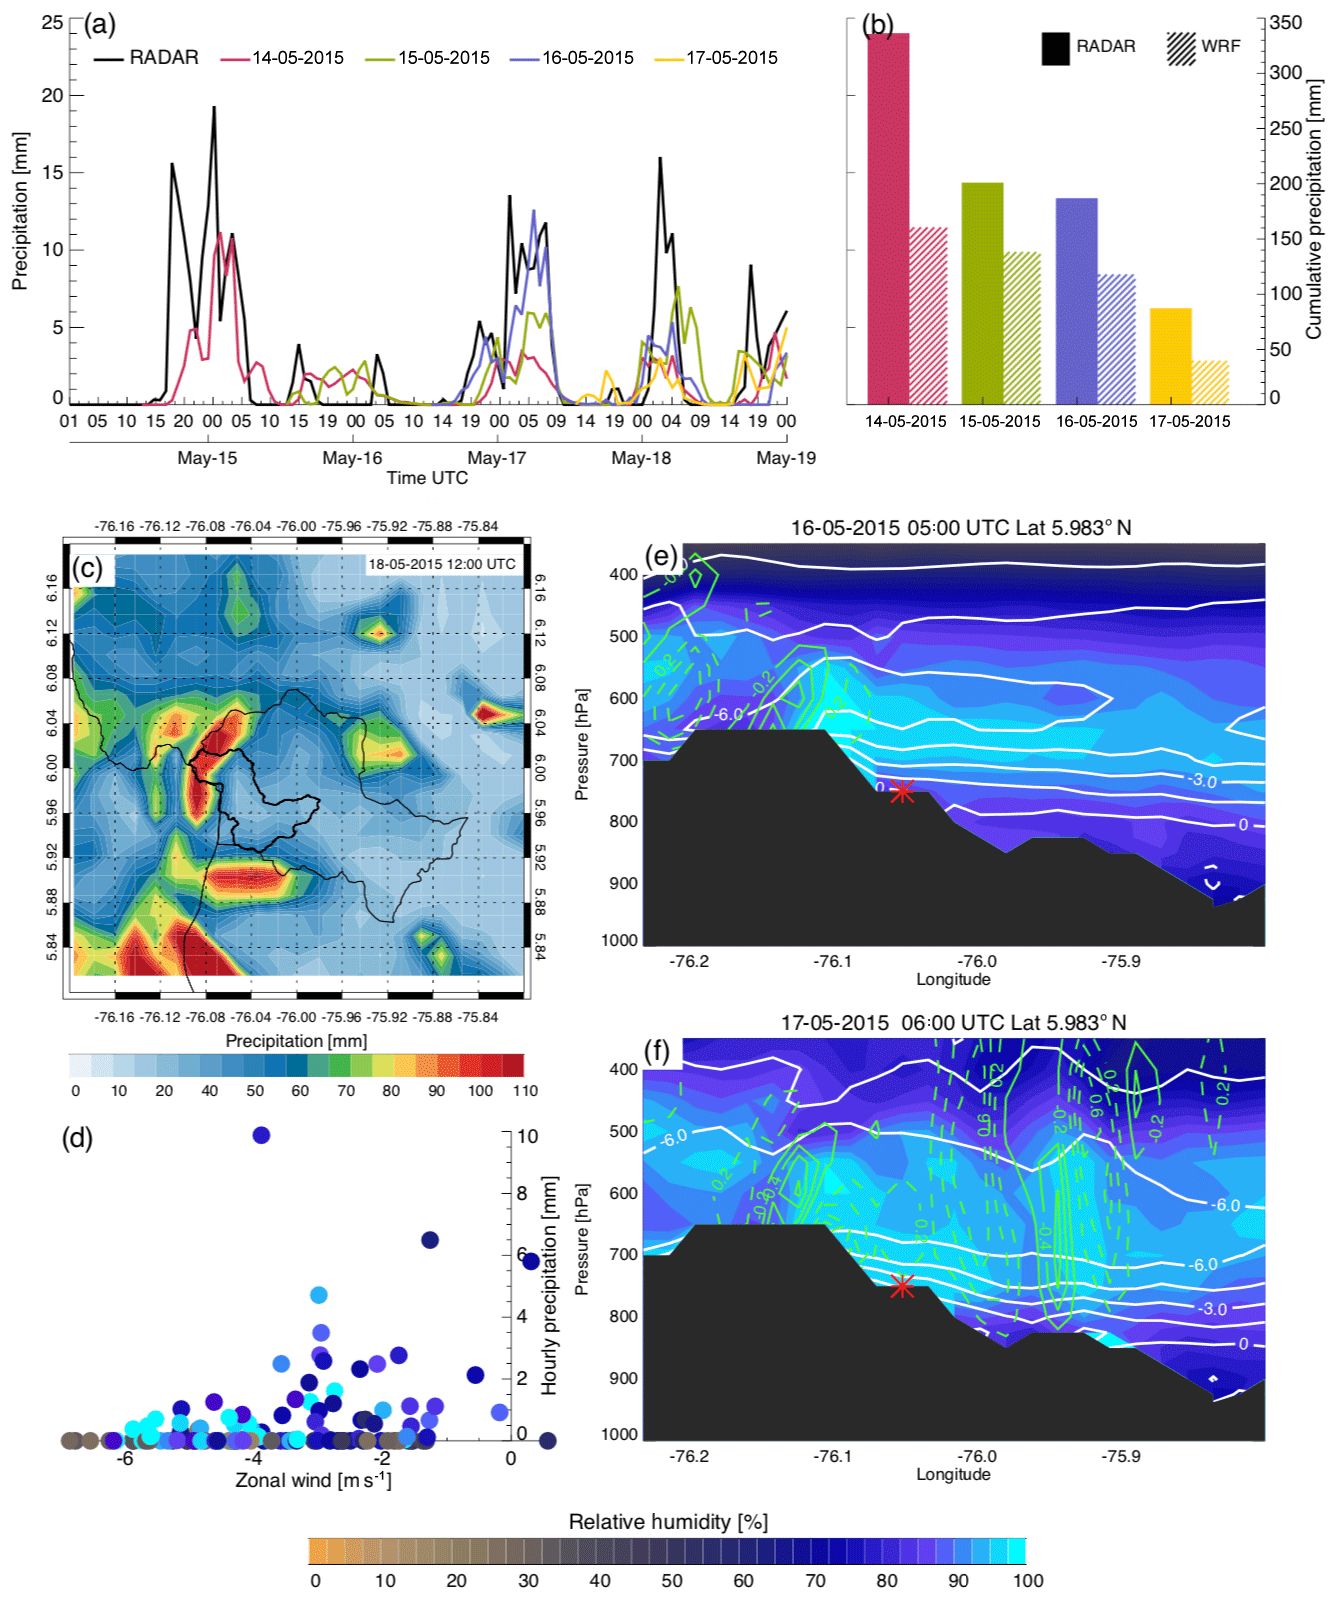
Figure 20(a) Hourly time series of precipitation over Salgar derived using the radar QPE technique and WRF forecasts. Each colored line corresponds to the model precipitation from different forecast dates, and the black line corresponds to rainfall estimations from radar QPE. (b) Total amount of model precipitation over Salgar, accumulated from the start of each forecast to 19 May. (c) Spatial distribution of the 14 May 12:00 UTC 96 h forecasted cumulative precipitation over the region of interest. (d) Scatter plot of hourly zonal wind at 2500 m a.s.l. and cumulative precipitation at the surface over the location marked in (e, f) (red asterisk). (e, f) Snapshots of the model forecasts showing a clear orographic ascent of moist air, forced by the topographic barrier. The colors represent relative humidity, the continuous white line represents easterly wind, and the green continuous (dashed) lines represent subsidence (ascent). The black area represents the topography of the region. The relative humidity color table describes the colors in (d–f). The magnitude of the zonal and vertical winds shown in the contours is in meters per second (m s−1)
Figure 20c shows the spatial distribution of the 14 May 12:00 UTC 96 h forecasted cumulative precipitation. While the forecast significantly underestimates the total amount of precipitation during the period in question (see Fig. 10), the model captures the intensification in the upper part of the basin caused by orography considerably well. The operational WRF model, despite the relatively coarse horizontal resolution, generates an area of high precipitation towards the upper part of La Liboriana at Cerro Plateado, similar to the observations (Fig. 10b, d and f). Figure 20d shows a scatter plot of hourly zonal wind at 2500 m a.s.l. and cumulative precipitation at the surface over the location marked in Fig. 20e and f by a red asterisk. Each data point in the scatter plot is color coded using the magnitude of the relative humidity at the same location. Figure 20d suggests that, in the model, moist air is advected towards the topographic barrier, triggering precipitation. The figure also suggests a conditional relationship between rainfall and the advection of moist air, in which precipitation in the region only occurs when the relative humidity of the air advected towards the upper basin is higher than 40 %. Figure 20e and f show two snapshots of the model forecasts when there is orographic ascent of moist air, forced by the topographic barrier. In Fig. 20e the orographic ascent is incipient, in the first stages of development, as a response to the easterly wind, towards the barrier, generating forced ascent and moistening of the air near the barrier (around 76.1∘ W) and away towards the east at around 670 hPa. Figure 20f also shows another case of orographic lifting during a more mature stage, when the ascent of air occurs in a broader column, penetrating deeper into the upper troposphere. In order to evaluate the actual usefulness of WRF in flash flood likelihood assessment, it is important to discard the possibility that the WRF-simulated rainfall pattern associated with the La Liboriana flash flood (Fig. 20c) is an artifact of the model, overemphasizing the orographic enhancement of precipitation. During the April–May 2015 rainy season, radar observations show a total of 57 rainfall events in addition to the ones leading to La Liboriana. Among all 57 events, 42 show a similar synoptic pattern. On the other hand, WRF simulations of the 42 events, from the daily operational SIATA weather forecasts, do not exhibit extreme orographic intensification (see Fig. A1 for the spatial pattern of the WRF-simulated cumulative precipitation for the top nine rainfall events out of the mentioned 42 cases). This suggests that the WRF simulation during the period of La Liboriana is not an artifact of the model, providing useful information for risk management.
Flash floods are a recurrent hazard for many developing Latin American regions as a result of the interaction between copious rainfall and the complex mountainous terrain associated with the Andes Cordillera. Additionally, these regions often lack the timely and high-quality information needed to assess, in real time, the threats to the vulnerable communities due to extreme hydrometeorological events. The mitigation of the flash flood risk in a region of interest requires anticipation with different lead times. Long-term strategic actions require, at least, a process-based evaluation of flash flood potential in the region. On the other hand, the short-term tactical response ought to be based on the real-time assessment of the observations, as well as simulation and prediction with useful lead times. Past extreme events become an opportunity to improve our anticipation capabilities to strive for the protection of life, so that extreme events like the one that occurred in May 2015 in the La Liboriana basin do not result in loss of life. The systematic assessment of the climatological aspects, meteorological conditions, and first-order hydrometeorological processes associated with the La Liboriana flash flood allowed us to analyze the main triggering processes, highlighting critical lessons to improve local risk reduction strategies. Regarding the lead times, in the case of La Liboriana, an analysis of the lag between the peak discharge time relative to the maximum intensity for the events presented in Velásquez et al. (2018) suggests the minimum useful forecast lead time is approximately 1.5 h. This lead time also matches the estimates of the time of concentration of the La Liboriana basin (between 1.3–1.7 h) using different methodologies, including the Kirpich (1940) and Giandotti (as cited in Fang et al., 2008) equations.
The overall evidence suggests that, from a climatology point of view, (i) the La Liboriana flash flood took place during a period with negative monthly precipitation anomalies associated with El Niño conditions; however, (ii) the long-term back-trajectory and Lagrangian analyses show a predominant easterly flow and propagation of the precipitation events towards the La Liboriana basin, which, given the orographic opposition to the prevailing wind, stress the potential for orographic rainfall enhancement. That is the case of the La Liboriana flash flood during 2015, characterized by moist easterly flow towards Cerro Plateado, permitting orographic rainfall enhancement. Also, (iii) during MAM, due to the considerable total precipitation accumulation and the coexistence of long-duration and low-intensity stratiform events with short-duration and high-intensity convective events, the potential for triggering flash floods and landslides is higher than during other seasons. The climatological assessment provides the first important lesson for risk management: in most Latin American countries there is a media and institutional bias to link all risk management planning to whether there are, or there could be, El Niño or La Niña conditions during a certain period, and, while that is certainly important and an improvement compared to the previous decades, it should not be the sole focus, especially in regions like the La Liboriana basin, where the interaction between the geomorphological features and the predominant lower troposphere flow could likely result in orographic intensification and the occurrence of extreme events. Even in regions with scarce information, a combination of satellite rainfall retrievals (i.e., IMERG), detailed atmospheric reanalysis information (i.e., ERA 5), and the available high-resolution DEMs provide the means to pinpoint the most susceptible regions to prioritize the required long-term strategic actions. This analysis should allow the holistic detection of zones susceptible to flash flooding.
The analysis of the spatiotemporal configuration of precipitation, identifying the main hydrometeorological factors controlling the occurrence of extreme events and their likelihood of occurrence, is the foundation for the second risk management lesson. In the case of the La Liboriana event, a series of intense storms associated with wind flow favored by a low-pressure system that was located over the Pacific coast of Colombia and Panama occurred in the days and hours preceding the disaster. The overall evidence of the La Liboriana flash flood shows a definitive role of the multiple precipitation events in a relatively short period and of their intensification as convective cores approached the steepest topography. There were three successive events generating significant rainfall within the La Liboriana basin: no single precipitation event was exceptionally large enough to generate the extreme event, but rather the combined role of precedent rainfall and the extreme hourly precipitation triggered the event. The first two events, which increased the overall soil moisture in the basin, were followed by a third event characterized by training convective elements towards La Liboriana with significant orographic enhancement and a preferential spatial distribution of the most extreme rainfall towards the upper basin, ultimately triggering the flash flood. Most of the rain over the La Liboriana basin days before the disaster was of the convective type, with very intense spells, generating high rainfall accumulations with the highest hourly cumulative precipitation linked to the steepest slopes in the basin due to the orographic intensification in the region. Tactical risk management decisions would benefit from implementing, as a complement to flash flood guidance tools, a real-time assessment of the bivariate distribution (and joint probability) of each ongoing event compared to the historical record, taking into account high 1 h moving cumulative rainfall conditioned to values of precedent N-hour moving cumulative precipitation. This analysis should be conducted for the entire basin as well as for critical areas associated with, for example, the steepest hills. The value of N should be defined for each basin as a function of the general geomorphology and the historical records. From this point of view, the results suggest that the rainfall prior to the Salgar event was, in fact, exceptional compared to all the records, especially in the upper part of the basin. The evidence also suggests that for the La Liboriana basin, the N=96 h period is more appropriate to assess the likelihood of the occurrence of an extreme event. The analysis presented here could be extended to other complex-terrain basins with vulnerable communities, considering that it is likely that for each different basin there is a different optimal N-hour cumulative precipitation to be considered in the construction of the bivariate histograms by risk managers.
The present study also highlights the usefulness of long-term QPE records based on radar retrievals from high-resolution scans in assessing the spatial structure of flash-flood-triggering rainfall events. Low-resolution radar scans (∼1 km grid spacing) are useful from the meteorological standpoint, but high-resolution retrievals are required for hydrometeorological applications. Also, for information-scarce regions, the study suggests that IMERG captures the general spatial structure of the cumulative precipitation of extreme events, including their location and areal extent, even in cases where the complex topography leads to orographic enhancement. Even though IMERG does not capture the most intense convective cores evident in the radar retrievals, the spatial distribution of precipitation could be used as a starting point for a probabilistic rainfall downscaling scheme, which is useful for risk management applications. Lastly, WRF simulates the main processes associated with the observed orographic enhancement of rainfall reasonably well, capturing the intensification in the upper part of the basin as moist air is advected towards the topographic barrier. The latter fact suggests that forecasts from WRF are useful and should be taken into account in warning operations.
The radar data, the WRF namelist, and the overall setup will be made available upon request.
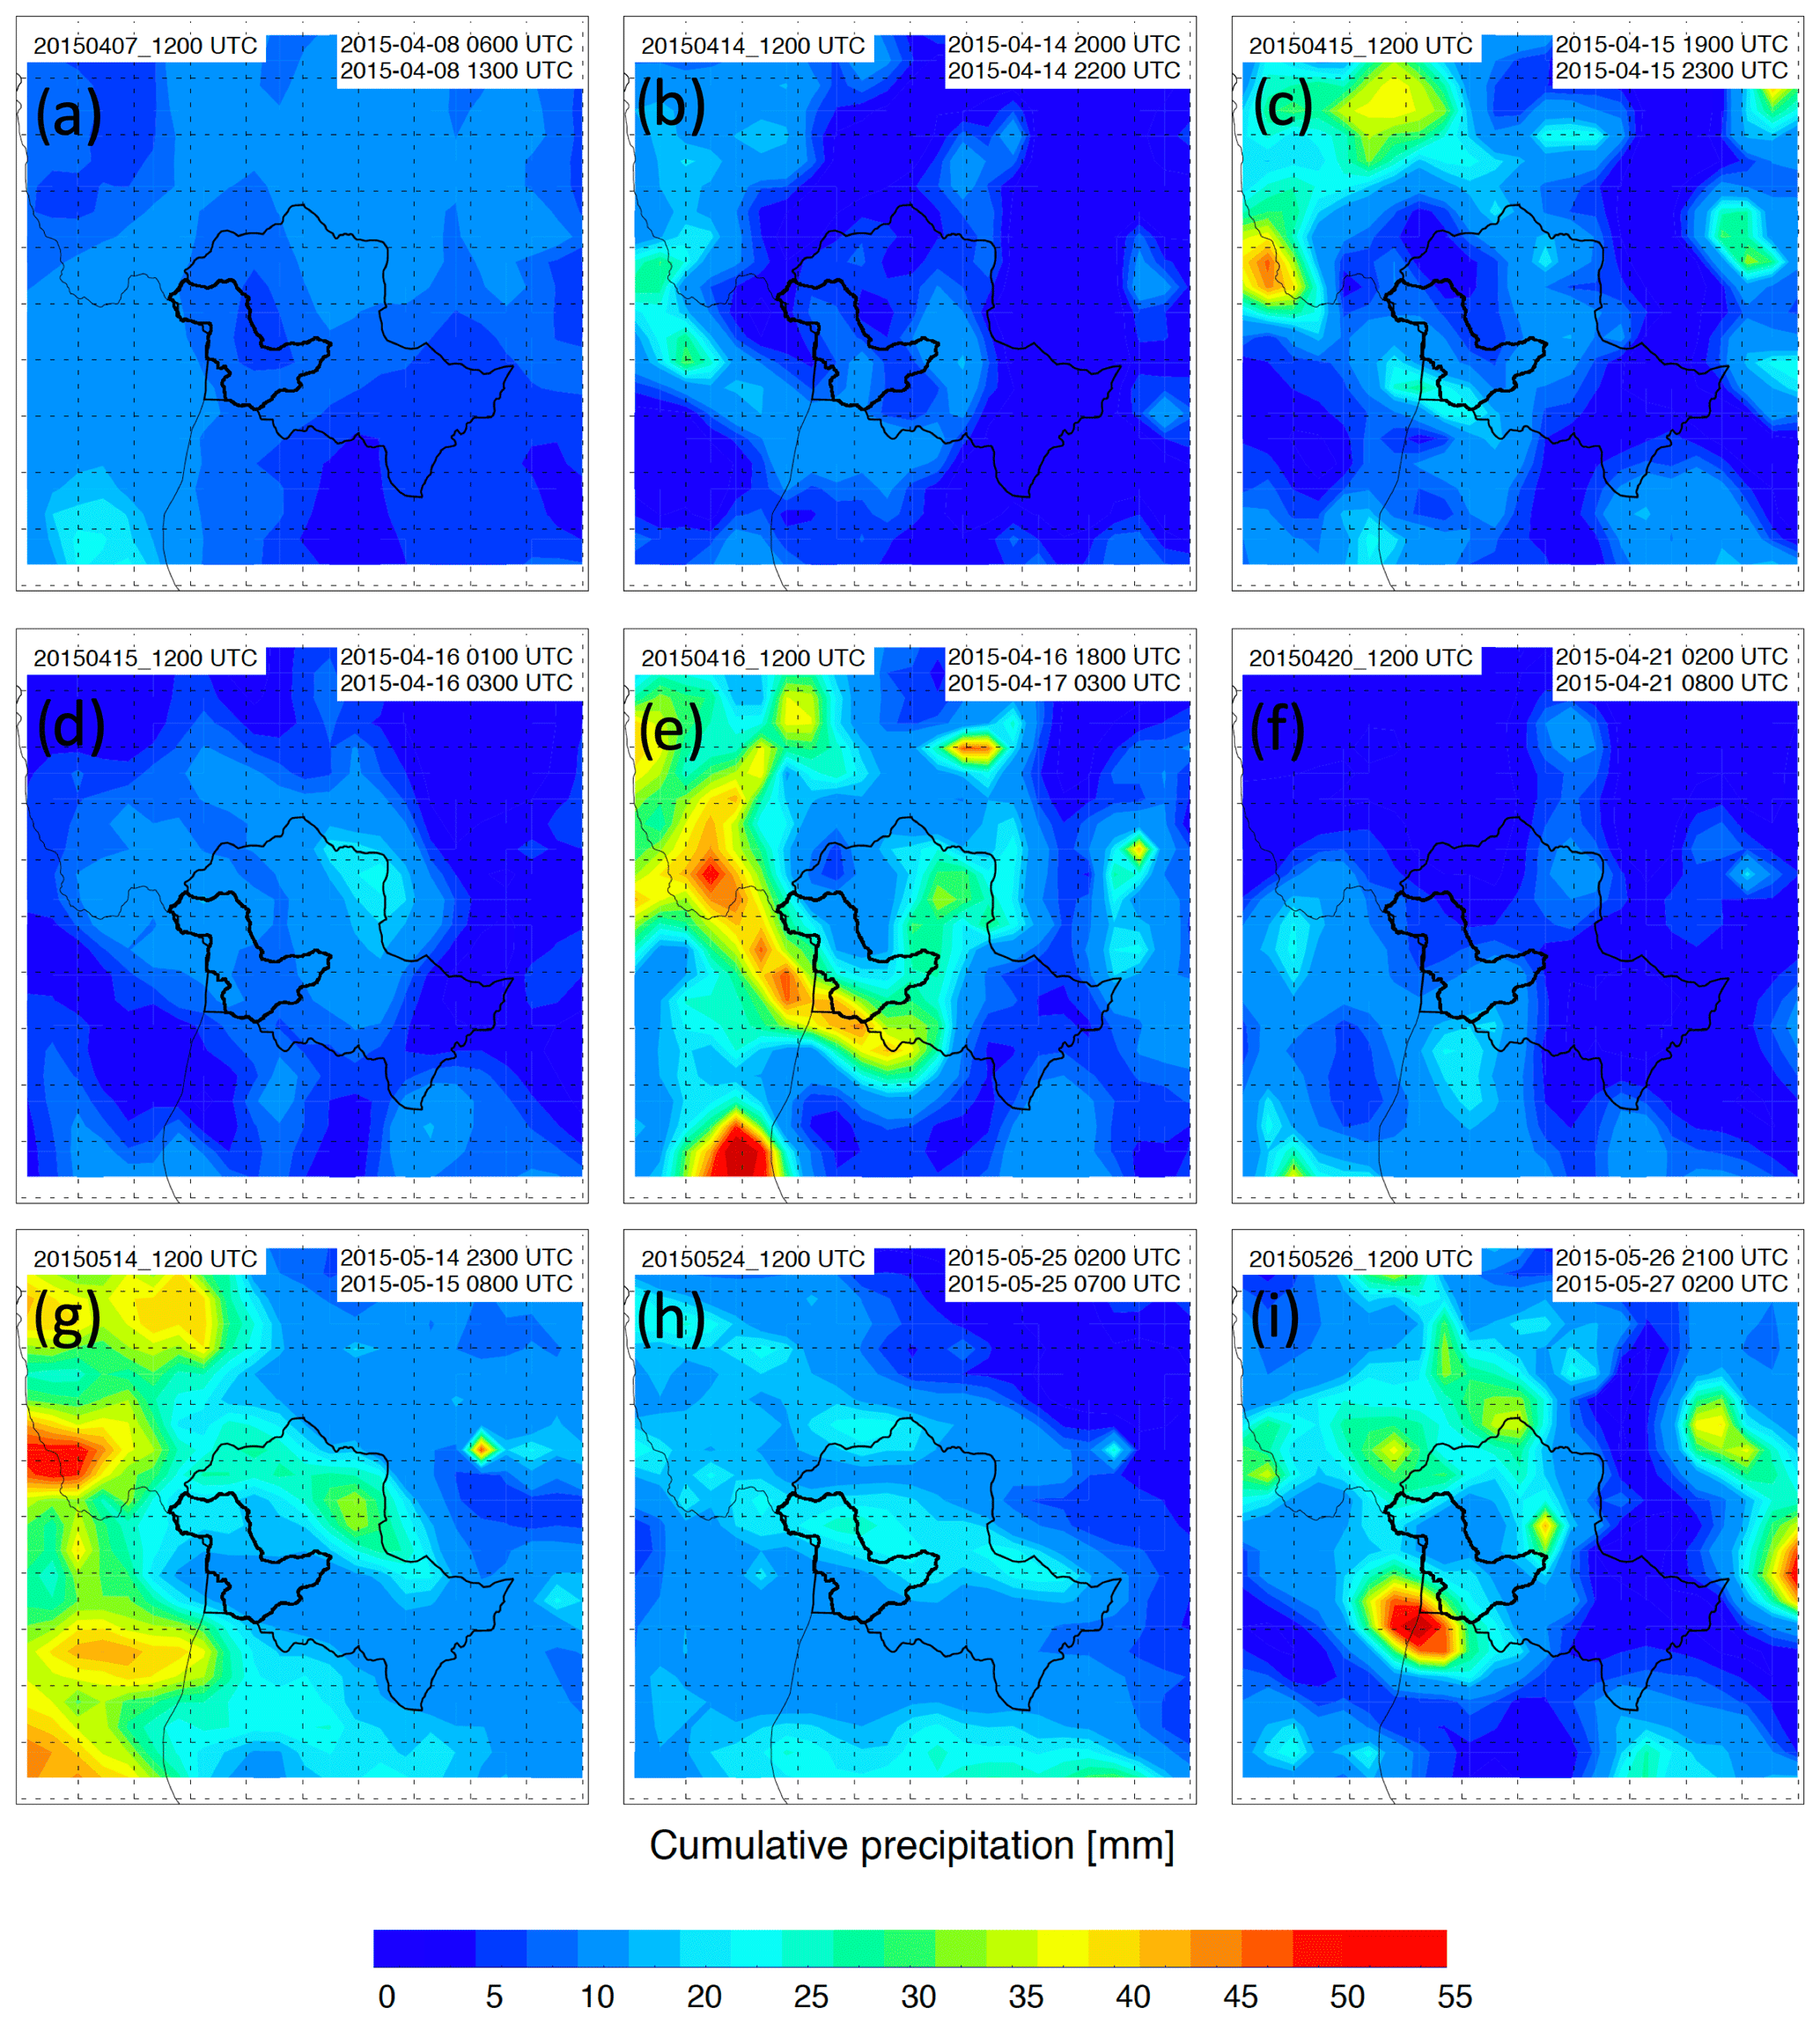
Figure A1Spatial distribution of WRF-forecasted cumulative precipitation (24 h lead time) over the region of interest for nine different rainfall events during the April–May 2015 rainy season: (a) from 8 April 2015 06:00 to 13:00 UTC, (b) from 14 April 2015 20:00 to 22:00 UTC, (c) from 15 April 2015 19:00 to 23:00 UTC, (d) from 16 April 2015 01:00 to 03:00 UTC, (e) from 16 April 2015 18:00 UTC to 17 April 2015 03:00 UTC, (f) from 21 April 2015 02:00 to 08:00 UTC, (g) from 14 April 2015 23:00 UTC to 15 April 2015 08:00 UTC, (h) from 25 May 2015 02:00 to 07:00 UTC, and (i) from 26 May 2015 21:00 UTC to 27 May 2015 02:00 UTC. While some of the cases exhibit orographic intensification, the panels show significant interevent variability despite their similar synoptic flow (not shown), with no fixed orographic pattern indicating intensification at Cerro Plateado.
CDH conceived the research with help from MDZ, LIC, and NV. CDH prepared the manuscript with contributions from all coauthors. LIC, LHM, and CDH conducted the climatological analysis. JSPC and OH performed the back-trajectory and the Lagrangian analysis. JS estimated the surface precipitation using radar retrievals. NV conducted the stratiform–convective separation. MDZ helped with the synoptic analysis. SMLZ, JSPC, and JS performed the orographic analysis and the hydrometeorological assessment. LIC, MZ, and GGE performed the WRF runs and analyzed the forecast output.
The authors declare that they have no conflict of interest.
The authors would like to thank Freddy Vinet, the anonymous reviewer, and the editor for their insightful comments. The authors also thank the institutional support from Área Metropolitana del Valle de Aburrá, Grupo EPM, and ISAGEN. Carlos D. Hoyos, Manuel D. Zuluaga, and Laura Herrera-Mejía would like to thank the support from Patrimonio Autónomo Fondo Nacional de Financiamiento para la Ciencia, La Tecnología y la Innovación, Francisco Jose de Caldas, from Colciencias.
This research has been supported by the Early Warning Cooperation Agreement between área Metropolitana del Valle de Aburrá, Grupo EPM, and ISAGEN (contract no. CD511, 2017, and no. CD504, 2019) and Colciencias (grant no. 80740-128-2019).
This paper was edited by Maria-Carmen Llasat and reviewed by Freddy Vinet and one anonymous referee.
ASF-JAXA: Dataset: ASF DAAC 2015, ALOS PALSAR Radiometric Terrain Corrected high res, Includes Material JAXA/METI 2007, https://doi.org/10.5067/Z97HFCNKR6VA, 2011. a
Bacchi, B. and Ranzi, R.: On the derivation of the areal reduction factor of storms, Atmos. Res., 42, 123–135, https://doi.org/10.1016/0169-8095(95)00058-5, 1996. a
Baltaci, H.: Meteorological analysis of flash floods in Artvin (NE Turkey) on 24 August 2015, Nat. Hazards Earth Syst. Sci., 17, 1221–1230, https://doi.org/10.5194/nhess-17-1221-2017, 2017. a
Barbero, G., Moisello, U., and Todeschini, S.: Evaluation of the Areal Reduction Factor in an Urban Area through Rainfall Records of Limited Length: A Case Study, J. Hydrol. Eng., 19, 05014016, https://doi.org/10.1061/(ASCE)HE.1943-5584.0001022, 2014. a
Bellerby, T., Hsu, K.-L., and Sorooshian, S.: LMODEL: A Satellite Precipitation Methodology Using Cloud Development Modeling. Part I: Algorithm Construction and Calibration, J. Hydrometeorol., 10, 1081–1095, https://doi.org/10.1175/2009JHM1091.1, 2009. a
Berne, A. and Krajewski, W.: Radar for hydrology: Unfulfilled promise or unrecognized potential?, Adv. Water Resour., 51, 357–366, https://doi.org/10.1016/j.advwatres.2012.05.005, 2013. a
Betz, H. D., Schmidt, K., Oettinger, W. P., and Montag, B.: Cell-tracking with lightning data from LINET, Adv. Geosci., 17, 55–61, https://doi.org/10.5194/adgeo-17-55-2008, 2008. a
Betz, H. D., Schmidt, K., Laroche, P., Blanchet, P., Oettinger, W. P., Defer, E., Dziewit, Z., and Konarski, J.: LINET – An international lightning detection network in Europe, Atmos. Res., 91, 564–573, https://doi.org/10.1016/j.atmosres.2008.06.012, 2009. a
Bookhagen, B. and Strecker, M. R.: Orographic barriers, high-resolution TRMM rainfall, and relief variations along the eastern Andes, Geophys. Res. Lett., 35, L06403, https://doi.org/10.1029/2007GL032011, 2008. a
Borga, M., Boscolo, P., Zanon, F., and Sangati, M.: Hydrometeorological Analysis of the 29 August 2003 Flash Flood in the Eastern Italian Alps, J. Hydrometeorol., 8, 1049–1067, 2007. a
Borga, M., Anagnostou, E. N., Blöschl, G., and Creutin, J. D.: Flash flood forecasting, warning and risk management: The HYDRATE project, Environ. Sci. Policy, 14, 834–844, https://doi.org/10.1016/j.envsci.2011.05.017, 2011. a
Braud, I., Borga, M., Gourley, J., Hürlimann, M., Zappa, M., and Gallart, F.: Flash floods, hydro-geomorphic response and risk management, J. Hydrol., 541, 1–5, https://doi.org/10.1016/j.jhydrol.2016.08.005, 2016. a
Cardona-Duque, M. A.: Construcción Social Del Riesgo De Desastres. Caso Salgar-Antioquia, PhD thesis, Universidad pontificia Bolivariana – Sede Medellín, available at: https://repository.upb.edu.co/handle/20.500.11912/4349 (last access: 20 November 2019), 2018. a
Carvalho, L. M. V. and Jones, C.: A Satellite Method to Identify Structural Properties of Mesoscale Convective Systems Based on the Maximum Spatial Correlation Tracking Technique (MASCOTTE), J. Applied Meteorol., 40, 1683–1701, https://doi.org/10.1175/1520-0450(2001)040<1683:ASMTIS>2.0.CO;2, 2001. a
Castillo, V. M., Gómez-Plaza, A., and Martínez-Mena, M.: The role of antecedent soil water content in the runoff response of semiarid catchments: A simulation approach, J. Hydrol., 284, 114–130, https://doi.org/10.1016/S0022-1694(03)00264-6, 2003. a
Ceccherini, G., Ameztoy, I., Hernández, C. P. R., and Moreno, C. C.: High-resolution precipitation datasets in South America and West Africa based on satellite-derived rainfall, enhanced vegetation index and digital elevation model, Remote Sens., 7, 6454–6488, https://doi.org/10.3390/rs70506454, 2015. a
Ciric, D., Stojanovic, M., Drumond, A., Nieto, R., and Gimeno, L.: Tracking the Origin of Moisture over the Danube River Basin Using a Lagrangian Approach, Atmosphere, 7, 162, https://doi.org/10.3390/atmos7120162, 2016. a
Copernicus Climate Change Service (C3S): ERA5: Fifth generation of ECMWF atmospheric reanalyses of the global climate, Copernicus Climate Change Service Climate Data Store (CDS), https://doi.org/10.24381/cds.bd0915c6, 2017. a
Coustau, M., Bouvier, C., Borrell-Estupina, V., and Jourde, H.: Flood modelling with a distributed event-based parsimonious rainfall-runoff model: Case of the karstic Lez river catchment, Nat. Hazards Earth Syst. Sci., 12, 1119–1133, https://doi.org/10.5194/nhess-12-1119-2012, 2012. a
Creutin, J. D. and Borga, M.: Radar hydrology modifies the monitoring of flash-flood hazard, Hydrol. Process., 17, 1453–1456, https://doi.org/10.1002/hyp.5122, 2003. a
Deidda, R.: Rainfall downscaling in a space-time multifractal framework, Water Resour. Res., 36, 1779–1794, https://doi.org/10.1029/2000WR900038, 2000. a
Delrieu, G., Nicol, J., Yates, E., Kirstetter, P.-E., Creutin, J. D., Anquetin, S., Obled, C., Saulnier, G.-M., Ducrocq, V., Gaume, E., Payrastre, O., Andrieu, H., Ayral, P.-A., Bouvier, C., Neppel, L., Livet, M., Lang, M., du Châtelet, J. P., Walpersdorf, A., and Wobrock, W.: The Catastrophic Flash-Flood Event of 8–9 September 2002 in the Gard Region, France: A First Case Study for the Cévennes–Vivarais Mediterranean Hydrometeorological Observatory, J. Hydrometeorol., 6, 34–52, 2005. a
Deser, C., Alexander, M. A., Xie, S.-P., and Phillips, A. S.: Sea Surface Temperature Variability: Patterns and Mechanisms, Annu. Rev. Mar. Sci., 2, 115–143, https://doi.org/10.1146/annurev-marine-120408-151453, 2010. a
Diaz, H. F., Hoerling, M. P., and Eischeid, J. K.: ENSO variability, teleconnections and climate change, Int. J. Climatol., 21, 1845–1862, https://doi.org/10.1002/joc.631, 2001. a
Dirmeyer, P. A. and Brubaker, K. L.: Characterization of the Global Hydrologic Cycle from a Back-Trajectory Analysis of Atmospheric Water Vapor, J. Hydrometeorol., 8, 20–37, https://doi.org/10.1175/JHM557.1, 2007. a
Doswell, C. A., Brooks, H. E., and Maddox, R. A.: Flash Flood Forecasting: An Ingredients-Based Methodology, Weather Forecast., 11, 560–581, https://doi.org/10.1175/1520-0434(1996)011<0560:FFFAIB>2.0.CO;2, 1996. a, b
Douinot, A., Roux, H., Garambois, P. A., Larnier, K., Labat, D., and Dartus, D.: Accounting for rainfall systematic spatial variability in flash flood forecasting, J. Hydrol., 541, 359–370, https://doi.org/10.1016/j.jhydrol.2015.08.024, 2016. a
Drumond, A., Nieto, R., Gimeno, L., and Ambrizzi, T.: A Lagrangian identification of major sources of moisture over Central Brazil and La Plata Basin, J. Geophys. Res.-Atmos., 113, D14128, https://doi.org/10.1029/2007JD009547, 2008. a
Drumond, A., Marengo, J., Ambrizzi, T., Nieto, R., Moreira, L., and Gimeno, L.: The role of the Amazon Basin moisture in the atmospheric branch of the hydrological cycle: a Lagrangian analysis, Hydrol. Earth Syst. Sci., 18, 2577–2598, https://doi.org/10.5194/hess-18-2577-2014, 2014. a
Falvey, M. and Garreaud, R.: Wintertime Precipitation Episodes in Central Chile: Associated Meteorological Conditions and Orographic Influences, J. Hydrometeorol., 8, 171–193, https://doi.org/10.1175/JHM562.1, 2007. a
Fang, X., Thompson, D. B., Cleveland, T. G., Pradhan, P., and Malla, R.: Time of Concentration Estimated Using Watershed Parameters Determined by Automated and Manual Methods, J. Irrig. Drain. Eng., 134, 202–211, https://doi.org/10.1061/(ASCE)0733-9437(2008)134:2(202), 2008. a
Ferrier, B. S.: A Double-Moment Multiple-Phase Four-Class Bulk Ice Scheme. Part I: Description, J. Atmos. Sci., 51, 249–280, https://doi.org/10.1175/1520-0469(1994)051<0249:ADMMPF>2.0.CO;2, 1994. a
Field, C. B., Barros, V., Stocker, T. F., Dahe, Q., Dokken, D. J., Ebi, K. L., Mastrandrea, M. D., Mach, K. J., Plattner, G. K., Allen, S. K., Tignor, M., and Midgley, P. M.: Managing the risks of extreme events and disasters to advance climate change adaptation, in: Special report of the Intergovernmental Panel on Climate Change, Cambridge University Press, Cambridge, UK, 2012. a
Fragoso, M., Trigo, R. M., Pinto, J. G., Lopes, S., Lopes, A., Ulbrich, S., and Magro, C.: The 20 February 2010 Madeira flash-floods: Synoptic analysis and extreme rainfall assessment, Nat. Hazards Earth Syst. Sci., 12, 715–730, https://doi.org/10.5194/nhess-12-715-2012, 2012. a
Gimeno, L., Stohl, A., Trigo, R. M., Dominguez, F., Yoshimura, K., Yu, L., Drumond, A., Durán-Quesada, A. M., and Nieto, R.: Oceanic and terrestrial sources of continental precipitation, Rev. Geophys., 50, RG4003, https://doi.org/10.1029/2012RG000389, 2012. a
Gochis, D., Schumacher, R., Friedrich, K., Doesken, N., Kelsch, M., Sun, J., Ikeda, K., Lindsey, D., Wood, A., Dolan, B., Matrosov, S., Newman, A., Mahoney, K., Rutledge, S., Johnson, R., Kucera, P., Kennedy, P., Sempere-Torres, D., Steiner, M., Roberts, R., Wilson, J., Yu, W., Chandrasekar, V., Rasmussen, R., Anderson, A., and Brown, B.: The great Colorado flood of September 2013, B. Am. Meteoro. Soc., 96, 1461–1487, https://doi.org/10.1175/BAMS-D-13-00241.1, 2015. a, b, c
Gruntfest, E. and Handmer, J.: Coping with flash floods, in: NATO Science series, Environmental Security, vol. 77, Proceedings of the NATO Advanced Study Institute, 8–17 November 1999, Ravello, Italy, Springer Netherlands, p. 322, 2001. a
Handwerker, J.: Cell tracking with TRACE3D – a new algorithm, Atmos. Res., 61, 15–34, https://doi.org/10.1016/S0169-8095(01)00100-4, 2002. a
Hapuarachchi, H. A. P., Wang, Q. J., and Pagano, T. C.: A review of advances in flash flood forecasting, Hydrol. Process., 25, 2771–2784, https://doi.org/10.1002/hyp.8040, 2011. a
Hardy, J., Gourley, J. J., Kirstetter, P. E., Hong, Y., Kong, F., and Flamig, Z. L.: A method for probabilistic flash flood forecasting, J. Hydrol., 541, 480–494, https://doi.org/10.1016/j.jhydrol.2016.04.007, 2016. a, b
Haylock, M. R., Peterson, T. C., Alves, L. M., Ambrizzi, T., Anunciação, Y. M. T., Baez, J., Barros, V. R., Berlato, M. A., Bidegain, M., Coronel, G., Corradi, V., Garcia, V. J., Grimm, A. M., Karoly, D., Marengo, J. A., Marino, M. B., Moncunill, D. F., Nechet, D., Quintana, J., Rebello, E., Rusticucci, M., Santos, J. L., Trebejo, I., and Vincent, L. A.: Trends in Total and Extreme South American Rainfall in 1960–2000 and Links with Sea Surface Temperature, J. Climate, 19, 1490–1512, https://doi.org/10.1175/JCLI3695.1, 2006. a
Houze, R. A.: Mesoscale convective systems, Rev. Geophys., 42, RG4003, https://doi.org/10.1029/2004RG000150, 2004. a
Houze, R. A., Rasmussen, K. L., Zuluaga, M. D., and Brodzik, S. R.: The variable nature of convection in the tropics and subtropics: A legacy of 16 years of the Tropical Rainfall Measuring Mission satellite, Rev. Geophys., 53, 994–1021, https://doi.org/10.1002/2015RG000488, 2015. a, b
Hoyos, C. D. and Webster, P. J.: Evolution and modulation of tropical heating from the last glacial maximum through the twenty-first century, Clim. Dynam., 38, 1501–1519, https://doi.org/10.1007/s00382-011-1181-3, 2012. a
Hoyos, I., Dominguez, F., Cañón-Barriga, J., Martínez, J. A., Nieto, R., Gimeno, L., and Dirmeyer, P. A.: Moisture origin and transport processes in Colombia, northern South America, Clim. Dynam., 50, 971–990, https://doi.org/10.1007/s00382-017-3653-6, 2018. a
Huang, Y. and Cui, X.: Moisture sources of an extreme precipitation event in Sichuan, China, based on the Lagrangian method, Atmos. Sci. Lett., 16, 177–183, https://doi.org/10.1002/asl2.562, 2015. a
Huffman, G. J.: GPM IMERG Final Precipitation L3 Half Hourly 0.1 degree × 0.1 degree V05, Goddard Earth Sciences Data and Information Services Center (GES DISC), Greenbelt, MD, https://doi.org/10.5067/GPM/IMERG/3B-HH/05, 2017. a
Huffman, G. J., Bolvin, D. T., Nelkin, E. J., Wolff, D. B., Adler, R. F., Gu, G., Hong, Y., Bowman, K. P., and Stocker, E. F.: The TRMM Multisatellite Precipitation Analysis (TMPA): Quasi-Global, Multiyear, Combined-Sensor Precipitation Estimates at Fine Scales, J. Hydrometeorol., 8, 38–55, 2007. a, b
IPCC: Climate Change 2014: Synthesis Report, in: Contribution of Working Groups I, II and III to the Fifth Assessment Report of the Intergovernmental Panel on Climate Change, IPCC, Geneva, Switzerland, 2014. a
Jha, A., Bloch, R., and Lamond, J.: Cities and Flooding: A Guide to Integrated Urban Flood Risk Management for the 21st Century, World Bank Publications, Washington, D.C., USA, https://doi.org/10.1596/978-0-8213-8866-2, 2012. a
Jonkman, S.: Global perspectives on loss of human life caused by floods, Nat. Hazards, 34, 151–175, https://doi.org/10.1007/s11069-004-8891-3, 2005. a, b
Joyce, R. J. and Xie, P.: Kalman Filter-Based CMORPH, J. Hydrometeorol., 12, 1547–1563, 2011. a
Kahana, R., Ziv, B., Enzel, Y., and Dayan, U.: Synoptic climatology of major floods in the Negev Desert, Israel, Int. J. Climatol., 22, 867–882, https://doi.org/10.1002/joc.766, 2002. a
Kirpich, Z. P.: Time of concentration of small agricultural watersheds, J. Civ. Eng., 10, 362, 1940. a
Klemeš, V.: Conceptualization and scale in hydrology, J. Hydrol., 65, 1–23, 1983. a
Klemeš, V.: Probability of extreme hydrometeorological events – A different approach, in: Extreme Hydrological Events: Precipitation, Floods and Droughts, IAHS Publ. no. 213, Yokohama, Japan, 167–176,, 1993. a
Kober, K. and Tafferner, A.: Tracking and nowcasting of convective cells using remote sensing data from radar and satellite, Meteorol. Z., 18, 75–84, https://doi.org/10.1127/0941-2948/2009/359, 2009. a
Kummerow, C., Barnes, W., Kozu, T., Shiue, J., and Simpson, J.: The tropical rainfall measuring mission (TRMM) sensor package, J. Atmos. Ocean. Tech., 15, 809–817, https://doi.org/10.1175/1520-0426(1998)015<0809:TTRMMT>2.0.CO;2, 1998. a
Li, L., Schmid, W., and Joss, J.: Nowcasting of Motion and Growth of Precipitation with Radar over a Complex Orography, J. Appl. Meteorol., 34, 1286–1300, https://doi.org/10.1175/1520-0450(1995)034<1286:NOMAGO>2.0.CO;2, 1995. a, b
Lin, Y.-L., Farley, R. D., and Orville, H. D.: Bulk Parameterization of the Snow Field in a Cloud Model, J. Clim. Appl. Meteorol., 22, 1065–1092, https://doi.org/10.1175/1520-0450(1983)022<1065:BPOTSF>2.0.CO;2, 1983. a, b
Llasat, M. C., Marcos, R., Turco, M., Gilabert, J., and Llasat-Botija, M.: Trends in flash flood events versus convective precipitation in the Mediterranean region: The case of Catalonia, J. Hydrol., 541, 24–37, https://doi.org/10.1016/j.jhydrol.2016.05.040, 2016. a, b, c
Mapes, B., Warner, T., Xu, M., and Negri, A. J.: Diurnal Patterns of Rainfall in Northwestern South America. Part I: Observations and Context, Mon. Weather Rev., 131, 799–812, https://doi.org/10.1175/1520-0493(2003)131<0799:DPORIN>2.0.CO;2, 2003. a
Marra, F., Destro, E., Nikolopoulos, E. I., Zoccatelli, D., Dominique Creutin, J., Guzzetti, F., and Borga, M.: Impact of rainfall spatial aggregation on the identification of debris flow occurrence thresholds, Hydrol. Earth Syst. Sci., 21, 4525–4532, https://doi.org/10.5194/hess-21-4525-2017, 2017. a, b
Merk, D. and Zinner, T.: Detection of convective initiation using Meteosat SEVIRI: implementation in and verification with the tracking and nowcasting algorithm Cb-TRAM, Atmos. Meas. Tech., 6, 1903–1918, https://doi.org/10.5194/amt-6-1903-2013, 2013. a
Merz, R. and Blöschl, G.: A process typology of regional floods, Water Resour. Res., 39, 1–20, https://doi.org/10.1029/2002WR001952, 2003. a, b
Milelli, M., Llasat, M. C., and Ducrocq, V.: The cases of June 2000, November 2002 and September 2002 as examples of Mediterranean floods, Nat. Hazards Earth Syst. Sci., 6, 271–284, https://doi.org/10.5194/nhess-6-271-2006, 2006. a
Mora, A., Parra, M., Strecker, M. R., Sobel, E. R., Hooghiemstra, H., Torres, V., and Jaramillo, J. V.: Climatic forcing of asymmetric orogenic evolution in the Eastern Cordillera of Colombia, Geol. Soc. Am. Bull., 120, 930–949, https://doi.org/10.1130/B26186.1, 2008. a
Norbiato, D., Borga, M., Degli Esposti, S., Gaume, E., and Anquetin, S.: Flash flood warning based on rainfall thresholds and soil moisture conditions: An assessment for gauged and ungauged basins, J. Hydrol., 362, 274–290, https://doi.org/10.1016/j.jhydrol.2008.08.023, 2008. a
Orlowsky, B. and Seneviratne, S. I.: Global changes in extreme events: regional and seasonal dimension, Climatic Change, 110, 669–696, https://doi.org/10.1007/s10584-011-0122-9, 2012. a
Penna, D., Tromp-Van Meerveld, H. J., Gobbi, A., Borga, M., and Dalla Fontana, G.: The influence of soil moisture on threshold runoff generation processes in an alpine headwater catchment, Hydrol. Earth Syst. Sci., 15, 689–702, https://doi.org/10.5194/hess-15-689-2011, 2011. a, b
Peters, J. M. and Roebber, P. J.: Synoptic Control of Heavy-Rain-Producing Convective Training Episodes, Mon. Weather Rev., 142, 2464–2482, https://doi.org/10.1175/MWR-D-13-00263.1, 2014. a
Peters, J. M. and Schumacher, R. S.: Mechanisms for Organization and Echo Training in a Flash-Flood-Producing Mesoscale Convective System, Mon. Weather Rev., 143, 1058–1085, https://doi.org/10.1175/MWR-D-14-00070.1, 2015. a
Piper, D., Kunz, M., Ehmele, F., Mohr, S., Mühr, B., Kron, A., and Daniell, J.: Exceptional sequence of severe thunderstorms and related flash floods in May and June 2016 in Germany – Part 1: Meteorological background, Nat. Hazards Earth Syst. Sci., 16, 2835–2850, https://doi.org/10.5194/nhess-16-2835-2016, 2016. a
Polanco, C. and Bedoya, G.: Compilación y análisis de los desastres naturales reportados en el departamento de Antioquia exceptuando los municipios del Valle de Aburrá-Colombia, entre 1920–1999, Ingeniería y Ciencia, 1, 45–65, 2005. a
Poveda, G. and Mesa, O. J.: On the existence of Lloró (the rainiest locality on Earth): Enhanced ocean-land-atmosphere interaction by a low-level jet, Geophys. Res. Lett., 27, 1675–1678, https://doi.org/10.1029/1999GL006091, 2000. a
Poveda, G., Mesa, O. J., Salazar, L. F., Arias, P. A., Moreno, H. A., Vieira, S. C., Agudelo, P. A., Toro, V. G., and Alvarez, J. F.: The Diurnal Cycle of Precipitation in the Tropical Andes of Colombia, Mon. Weather Rev., 133, 228–240, https://doi.org/10.1175/MWR-2853.1, 2005. a
Poveda, G., Waylen, P. R., and Pulwarty, R. S.: Annual and inter-annual variability of the present climate in northern South America and southern Mesoamerica, Palaeogeogr. Palaeocl., 234, 3–27, https://doi.org/10.1016/j.palaeo.2005.10.031, 2006. a
Poveda, G., Vélez, J. I., Mesa, O. J., Cuartas, A., Barco, J., Mantilla, R. I., Mejía, J. F., Hoyos, C. D., Ramírez, J. M., Ceballos, L. I., Zuluaga, M. D., Arias, P. A., Botero, B. A., Montoya, M. I., Giraldo, J. D., and Quevedo, D. I.: Linking Long-Term Water Balances and Statistical Scaling to Estimate River Flows along the Drainage Network of Colombia, J. Hydrol. Eng., 12, 4–13, https://doi.org/10.1061/(ASCE)1084-0699(2007)12:1(4), 2007. a
Reynolds, R. W., Rayner, N. A., Smith, T. M., Stokes, D. C., and Wang, W.: An Improved In Situ and Satellite SST Analysis for Climate, J. Climate, 15, 1609–1625, https://doi.org/10.1175/1520-0442(2002)015<1609:AIISAS>2.0.CO;2, 2002. a
Rodriguez-Blanco, M., Taboada-Castro, M., and Taboada-Castro, M.: Rainfall–runoff response and event-based runoff coefficients in a humid area (northwest Spain), Hydrolog. Sci. J., 403, 319–329, https://doi.org/10.1080/02626669509491418, 2012. a
Rodriguez-Iturbe, I. and Mejía, J. M.: On the transformation of point rainfall to areal rainfall, Water Resour. Res., 10, 729–735, https://doi.org/10.1029/WR010i004p00729, 1974. a
Roux, H., Labat, D., Garambois, P. A., Maubourguet, M. M., Chorda, J., and Dartus, D.: A physically-based parsimonious hydrological model for flash floods in Mediterranean catchments, Nat. Hazards Earth Syst. Sci., 11, 2567–2582, https://doi.org/10.5194/nhess-11-2567-2011, 2011. a
Ruiz-Villanueva, V., Díez-Herrero, A., Bodoque, J. M., Ballesteros Cánovas, J. A., and Stoffel, M.: Characterisation of flash floods in small ungauged mountain basins of Central Spain using an integrated approach, Catena, 110, 32–43, https://doi.org/10.1016/j.catena.2013.06.015, 2013. a
Šálek, M., Brezková, L., and Novák, P.: The use of radar in hydrological modeling in the Czech Republic – case studies of flash floods, Nat. Hazards Earth Syst. Sci., 6, 229–236, https://doi.org/10.5194/nhess-6-229-2006, 2006. a, b, c
Schumacher, R. S. and Johnson, R. H.: Organization and Environmental Properties of Extreme-Rain-Producing Mesoscale Convective Systems, Mon. Weather Rev., 133, 961–976, https://doi.org/10.1175/MWR2899.1, 2005. a
Sepúlveda, J.: Estimación cuantitativa de precipitación a partir de la información de Radar Meteorológico delÁrea Metropolitana del Valle de Aburrá, MS thesis, Universidad Nacional de Colombia – Sede Medellín, available at: http://bdigital.unal.edu.co/54581/ (last access: 20 November 2019), 2016. a
Sepúlveda, J. and Hoyos, C. D.: Disdrometer-based C-Band Radar Quantitative Precipitation Estimation (QPE) in a highly complex terrain region in tropical Colombia, in: AGU Fall Meeting Abstracts, 13 December 2017, New Orleans, 2017. a
Sivapalan, M. and Blöschl, G.: Transformation of point rainfall to areal rainfall: Intensity-duration-frequency curves, J. Hydrol., 204, 150–167, https://doi.org/10.1016/S0022-1694(97)00117-0, 1998. a
Skamarock, W. C., Klemp, J. B., Dudhia, J., Gill, D. O., Barker, D. M., Wang, W., and Powers, J. G.: A description of the Advanced Research WRF version 3, NCAR Technical note -475+STR, National Center for Atmospheric Research, Boulder, Colorado, USA, 2008. a
Steiner, M., Houze, R. A., and Yuter, S. E.: Climatological Characterization of Three-Dimensional Storm Structure from Operational Radar and Rain Gauge Data, J. Appl. Meteorol., 34, 1978–2007, https://doi.org/10.1175/1520-0450(1995)034<1978:CCOTDS>2.0.CO;2, 1995. a, b, c
Stojanovic, M., Drumond, A., Nieto, R., and Gimeno, L.: Moisture Transport Anomalies over the Danube River Basin during Two Drought Events: A Lagrangian Analysis, Atmosphere, 8, 193, https://doi.org/10.3390/atmos8100193, 2017. a
Tao, K. and Barros, A. P.: Using Fractal Downscaling of Satellite Precipitation Products for Hydrometeorological Applications, J. Atmos. Ocean. Tech., 27, 409–427, https://doi.org/10.1175/2009JTECHA1219.1, 2010. a
Tramblay, Y., Bouaicha, R., Brocca, L., Dorigo, W., Bouvier, C., Camici, S., and Servat, E.: Estimation of antecedent wetness conditions for flood modelling in northern Morocco, Hydrol. Earth Syst. Sci., 16, 4375–4386, https://doi.org/10.5194/hess-16-4375-2012, 2012. a, b
TRMM: TRMM (TMPA) Rainfall Estimate L3 3 hour 0.25 degree × 0.25 degree V7, Goddard Earth Sciences Data and Information Services Center (GES DISC), Greenbelt, MD, https://doi.org/10.5067/TRMM/TMPA/3H/7, 2011. a
Tuttle, J. D. and Foote, G. B.: Determination of the Boundary Layer Airflow from a Single Doppler Radar, J. Atmos. Ocean. Tech., 7, 218–232, https://doi.org/10.1175/1520-0426(1990)007<0218:DOTBLA>2.0.CO;2, 1990. a
UCAR/NCAR-EOL: GOES-13 Imager 4 km All Channel Data – netCDF, Version 1.0, UCAR/NCAR – Earth Observing Laboratory, https://doi.org/10.5065/D6057D99, 2015. a
UN-CEPAL: Valoración de daños y pérdidas: Ola invernal en Colombia 2010–2011, Naciones Unidas, Comisión Económica para América Latina y el Caribe, available at: https://www.cepal.org/es/publicaciones/37958-valoracion-danos-perdidas-ola-invernal-colombia-2010 (last access: 20 November 2019), 2012. a
Urán, J. D.: Cambios en los valores extremos de variables climáticas en Colombia asociados a cambio climático, MS thesis, Universidad Nacional de Colombia – Sede Medellín, available at: http://bdigital.unal.edu.co/52475/ (last access: 20 November 2019), 2016. a
Urán, J. D., Hoyos, C. D., and Agudelo, P. A.: Assesment Of The Long-Term Changes In Sub-Daily Precipitation In A Tropical Complex-Terrain Region: Extreme Events And Their Relation With Temperature Increase, Earth and Space Science Open Archive, https://doi.org/10.1002/essoar.10500551.1, 2019. a
Velásquez, N., Hoyos, C. D., Vélez, J. I., and Zapata, E.: Reconstructing the Salgar 2015 Flash Flood Using Radar Retrievals and a Conceptual Modeling Framework: A Basis for a Better Flood Generating Mechanisms Discrimination, Hydrol. Earth Syst. Sci. Discuss., https://doi.org/10.5194/hess-2018-452, in review, 2018. a, b, c, d
Veneziano, D. and Langousis, A.: The areal reduction factor: A multifractal analysis, Water Resour. Res., 41, W07008, https://doi.org/10.1029/2004WR003765, 2005. a
Vila, D. A., Machado, L. A. T., Laurent, H., and Velasco, I.: Forecast and Tracking the Evolution of Cloud Clusters (ForTraCC) Using Satellite Infrared Imagery: Methodology and Validation, Weather Forecast., 23, 233–245, https://doi.org/10.1175/2007WAF2006121.1, 2008. a
Viste, E. and Sorteberg, A.: Moisture transport into the Ethiopian highlands, Int. J. Climatology, 33, 249–263, https://doi.org/10.1002/joc.3409, 2013. a
Wagner, W., Lemoine, G., and Rott, H.: A method for estimating soil moisture from ERS Scatterometer and soil data, Remote Sens. Environ., 70, 191–207, https://doi.org/10.1016/S0034-4257(99)00036-X, 1999. a
Wolter, K. and Timlin, M. S.: El Niño/Southern Oscillation behaviour since 1871 as diagnosed in an extended multivariate ENSO index (MEI.ext), Int. J. Climatol., 31, 1074–1087, https://doi.org/10.1002/joc.2336, 2011. a
Yamanaka, T. and Ma, W.: Runoff prediction in a poorly gauged basin using isotope-calibrated models, J. Hydrol., 544, 567–574, https://doi.org/10.1016/j.jhydrol.2016.12.005, 2017. a
Yatheendradas, S., Wagener, T., Gupta, H., Unkrich, C., Goodrich, D., Schaffner, M., and Stewart, A.: Understanding uncertainty in distributed flash flood forecasting for semiarid regions, Water Resour. Res., 44, W05S19, https://doi.org/10.1029/2007WR005940, 2008. a, b
Younis, J., Anquetin, S., and Thielen, J.: The benefit of high-resolution operational weather forecasts for flash flood warning, Hydrol. Earth Syst. Sci., 12, 1039–1051, https://doi.org/10.5194/hess-12-1039-2008, 2008. a
Yuter, S. E. and Houze, R. A.: Measurements of Raindrop Size Distributions over the Pacific Warm Pool and Implications for Z–R Relations, J. Appl. Meteorol., 36, 847–867, https://doi.org/10.1175/1520-0450(1997)036<0847:MORSDO>2.0.CO;2, 1997. a
Zehe, E., Graeff, T., Morgner, M., Bauer, A., and Bronstert, A.: Plot and field scale soil moisture dynamics and subsurface wetness control on runoff generation in a headwater in the Ore Mountains, Hydrol. Earth Syst. Sci., 14, 873–889, https://doi.org/10.5194/hess-14-873-2010, 2010. a
Zinner, T., Mannstein, H., and Tafferner, A.: Cb-TRAM: Tracking and monitoring severe convection from onset over rapid development to mature phase using multi-channel Meteosat-8 SEVIRI data, Meteorol. Atmos. Phys., 101, 191–210, https://doi.org/10.1007/s00703-008-0290-y, 2008. a
Zuluaga, M. D. and Houze, R. A.: Extreme Convection of the Near-Equatorial Americas, Africa, and Adjoining Oceans as seen by TRMM, Mon. Weather Rev., 143, 298–316, https://doi.org/10.1175/MWR-D-14-00109.1, 2015. a
As reported by local and national media and the government: https://www.elcolombiano.com/multimedia/videos/salgar-tres-anos-despues-de-la-tragedia-KD8702862 (last access: 20 November 2019), https://caracol.com.co/emisora/2016/05/17/medellin/1463513573_945644.html (last access: 20 November 2019), and http://portal.gestiondelriesgo.gov.co/Paginas/Noticias/2015/Antecion-Emergencia-Salgar-Antioquia.aspx (last access: 20 November 2019).
See the report in https://www.eltiempo.com/colombia/medellin/termina-reconstruccion-de-salgar-antioquia-tras-avalancha-107534 (last access: 20 November 2019).
See the annual budget for all municipalities in the Department of Antioquia: http://www.antioquiadatos.gov.co/index.php/8-2-2-1-1-presupuesto-definitivo-de-ingresos-de-los-municipios (last access: 20 November 2019).
See projections at http://www.dane.gov.co/files/investigaciones/poblacion/proyepobla06_20/ProyeccionMunicipios2005_2020.xls (last access: 27 April 2019).
Estimated based on the area of the Colombian subregions and government projections of population available at http://www.dane.gov.co/files/investigaciones/poblacion/proyepobla06_20/ProyeccionMunicipios2005_2020.xls (last access: 27 April 2019).