the Creative Commons Attribution 4.0 License.
the Creative Commons Attribution 4.0 License.
 | 01 Oct 2019
Extreme significant wave height of tropical cyclone waves in the South China Sea
Zhuxiao Shao
Bingchen Liang
Huajun Li
Ping Li
Dongyoung Lee
Extreme significant wave heights are assessed in the South China Sea (SCS), as assessments of wave heights are crucial for coastal and offshore engineering. Two significant factors include the initial database and assessment method. The initial database is a basis for assessment, and the assessment method is used to extrapolate appropriate return-significant wave heights during a given period. In this study, a 40-year (1975–2014) hindcast of tropical cyclone waves is used to analyse the extreme significant wave height, employing the peak over threshold (POT) method with the generalized Pareto distribution (GPD) model. The peak exceedances over a sufficiently large value (i.e. threshold) are fitted; thus, the return-significant wave heights are highly dependent on the threshold. To determine a suitable threshold, the sensitivity of return-significant wave heights and the characteristics of tropical cyclone waves are studied. The sample distribution presents a separation that distinguishes the high sample from the low sample, and this separation is within the stable threshold range. Because the variation in return-significant wave heights in this range is generally small and the separation is objectively determined by the track and intensity of the tropical cyclone, the separation is selected as a suitable threshold for extracting the extreme sample in the tropical cyclone wave. The asymptotic tail approximation and estimation uncertainty show that the selection is reasonable.
- Article
(299 KB) - Full-text XML
- BibTeX
- EndNote


Reasonable assessments of extreme significant wave heights are highly important for the security and expense of coastal defence and offshore structures (Ojeda and Guillén, 2006, 2008; Ojeda et al., 2010, 2011; Mortlock and Goodwin, 2015, 2016; Mortlock et al., 2017). To obtain this assessment, a sample is extracted from an accurate initial database, the extreme sample is identified by a reliable sampling method and an appropriate probability distribution model is fitted.
The initial database highly influences the assessment of extreme significant wave heights (Godoi et al., 2017; Lucas et al., 2017; Li et al., 2018; Ribal and Young, 2019). In previous studies, the long-term continuous database is usually employed as the initial database, such as a 32-year measured significant wave height in the Gulf of Maine (Viselli et al., 2015), a 44-year hindcasted significant wave height in the North Atlantic Ocean (Muraleedharan et al., 2016) and a 22-year hindcasted significant wave height in the Yellow Sea (Gao et al., 2018). Considering that the extreme significant wave height should be extrapolated based on an independent and identically distributed database required for the extreme value theory (EVT) (Coles, 2001; Sobradelo et al., 2011), these time series buoy measurements and numerical hindcasts should be processed. The homogenous methodology is used to extract homogenous significant wave heights via separation in carefully chosen directional sectors and seasonal analyses, as well as separation of the sea state into independent wave systems (Lerma et al., 2015; Solari and Alonso, 2017). Declustering methodology, such as the double-threshold approach (Mazas and Hamm, 2011) and minimum separation time method (Kapelonis et al., 2015), is used to differentiate the individual wave event. However, these methodologies may introduce uncertainty in the sample (such as the subjectivity of practitioners in the selections of initial threshold and time window), which influences the extreme sample selection.
The peak over threshold (POT) method (Goda et al., 2001) is widely used to identify the peak exceedances over a threshold (Ferreira and Guedes Soares, 1998; Soares and Scotto, 2004; Caires and Sterl, 2005; Benetazzo et al., 2012; You and Callaghan, 2013; Xiao et al., 2017). Additionally, the generalized Pareto distribution (GPD) model (Coles, 2001) is widely used to extrapolate extreme significant wave heights (Martucci et al., 2010; Blanchet et al., 2015; Kapelonis et al., 2015; Boessenkool et al., 2017; Muhammed Naseef and Sanil Kumar, 2017). This method (i.e. the POT-GPD method) makes the most of the samples, extends the return period when the threshold is suitable (Alves and Young, 2003; You, 2011; Vanem, 2015a; Samayam et al., 2017; Shao et al., 2017) and, due to this method, extracts all high samples. To select a suitable threshold, many methods have been proposed, such as graphical diagnostics (Coles, 2001; Sánchez-Arcilla et al., 2017; Bernardara et al., 2014), empirical methods (Ferreira et al., 2003; Neves and Alves, 2004; Reiss and Thomas, 2007), probabilistically based techniques (Hill, 1975; Beirlant et al., 2006; Goegebeur et al., 2008), computational approaches (Danielsson et al., 2001; Beguería, 2005; Solari et al., 2017) and mixture models (Carreau and Bengio, 2009; Eastoe and Tawn, 2010; MacDonald et al., 2011). Among these methods, a graphical diagnostic referred to as the sensitivity of the return-significant wave height to the threshold (Scarrott and MacDonald, 2012) is commonly accepted (Petrov et al., 2013; Northrop and Coleman, 2014; Vanem, 2015b; Northrop et al., 2017; Sulis et al., 2017).
In the South China Sea (SCS), time series wave parameters have been simulated (Zheng et al., 2012; Mirzaei et al., 2015; Yaakob et al., 2016) and extreme waves have been investigated based on long-term continuous data (Zheng et al., 2015; Chen et al., 2017; Wang et al., 2018). In addition, Shao et al. (2018a) and Liang et al. (2019) analysed the extreme significant wave height in a tropical cyclone. Shao et al. (2018a) compared the annual maxima (AM) method (Tawn, 1988) with the POT method. The AM method is an easy sampling method that does not require additional work, as the method directly extracts the annual maximum significant wave height for extrapolation. However, the AM method has limitations in a fixed time window (i.e. 1 year), which cannot guarantee the independence and number of samples. The annual maximum significant wave height obtained from neighbouring years may originate from the same extreme wave; some maximum significant wave heights may be neglected (i.e. the annual maximum significant wave height may be smaller than some unselected peaks of significant wave heights in other years), resulting in an insufficient number of samples, especially for a relatively long return period. In a tropical cyclone, the AM method's limitation is further exacerbated, even if the return period is close to the database size. The annual frequency, intensity and track of recorded tropical cyclones vary greatly, and corresponding waves have obvious differences. Shao et al. (2018a) found that the minimum sample may be much lower than the maximum sample, and the minimum sample may be too small to represent the extreme wave (i.e. the minimum sample in the AM method is obviously smaller than the extreme sample in the POT method).
Compared with the AM method, the POT method is a natural sampling method without additional limitations. When the threshold is suitable, the POT method can guarantee the representativeness and number of extreme samples. However, the threshold selection process is relatively complex. Shao et al. (2018a) and Liang et al. (2019) analysed the sensitivity of the return-significant wave height to the threshold. The researchers found that the suitable threshold should be determined within the stable threshold range. When the return-significant wave height is insensitive to the threshold (i.e. the variation in return-significant wave heights is generally small), the corresponding return-significant wave height is defined as the stable return-significant wave height and the corresponding range of thresholds is defined as the stable threshold range. Using the sensitivity analysis, Shao et al. (2018a) defined the largest threshold within the common stable threshold range as the suitable threshold and Liang et al. (2019) proposed an Automated Threshold Selection Method based on the characteristic of Extrapolated significant wave heights (ATSME). The ATSME employs the differences in extrapolated significant wave heights for neighbouring thresholds as the diagnostic parameters to identify the uniquely stable threshold range via an automated method and selects the largest threshold within the stable threshold range as the suitable threshold for different return periods.
In this study, the assessment of extreme significant wave heights is further studied in the SCS. Before the assessment, the meteorological characteristics are analysed to identify extreme weather. In the SCS, the tropical cyclone always drives the storm wave (Anoop et al., 2015; Hithin et al., 2015; Sanil Kumar and Anoop, 2015; Ojeda et al., 2017; Wang et al., 2017; Mortlock et al., 2018; Sanil Kumar et al., 2018) and the number of tropical cyclones is sufficiently large. Thus, it is possible to study the extreme significant wave height in a tropical cyclone (Young et al., 2012; Young and Vinoth, 2013; Young, 2017). To achieve the assessment, a 40-year (1975–2014) hindcasted significant wave height of tropical cyclone waves is employed as the initial database. Considering that the hindcast is independently simulated during the tropical cyclone recorded in the SCS, the maximum significant wave height of the tropical cyclone wave can be directly extracted as the sample when the tropical cyclone influences the wave at the targeted location. Based on the sample, the POT method threshold is studied. By analysing the sensitivity of the return-significant wave heights and the characteristics of the tropical cyclone waves, the sample distribution presents a separation within the stable threshold range. As validated by the asymptotic tail approximation and estimation uncertainty, the high sample shown in the distribution of the sample is suitable for extrapolating extreme significant wave heights in the SCS.
The article is structured as follows. In the next section, the POT-GPD and ATSME are introduced. The initial data and study sites are presented in Sect. 3. In Sect. 4, the sampling method is described. In Sect. 5, the characteristics of tropical cyclone waves are discussed. Finally, the discussions and conclusions are presented in Sect. 6.
2.1 Extrapolation theory
The POT method extracts the maximum significant wave heights above a selected value (i.e. threshold), u, as the extreme sample. For u, which is sufficiently large, the distribution function of peak exceedances can be approximated by a member of the GPD (Pickands, 1975; Embrechts et al., 1997):
where Hs* represents the peak exceedance over the threshold, σ represents the scale parameter and k represents the shape parameter. These GPD parameters (σ and k) are estimated using the maximum likelihood estimation method, which is recommended by Mazas and Hamm (2011):
where N represents the number of events exceeding the threshold (i.e. the number of extreme samples) and Hs represents the maximum significant wave height.
The i-year return-significant wave height, Hsi, is defined as follows:
Thus, the value can be calculated with the following equation:
where NT represents the size of the dataset.
2.2 Automated threshold selection method
The ATSME determines a unique threshold within a uniquely stable threshold range for a specific return period. Liang et al (2019) found that the stable threshold range shows a pattern associated with the return period. The minimum threshold of the stable threshold range controls the representativeness of the extreme sample; thus, the samples over the minimum threshold can represent extreme waves well, and the minimum thresholds for different return periods remain constant. The maximum threshold of the stable threshold range controls the number of extreme samples, and a longer return period requires more extreme samples; thus, the maximum thresholds gradually decrease when the return period increases. Consequently, excluding the sample within the stable threshold ranges does not obviously influence the return-significant wave heights, and a suitable threshold should be determined within the stable threshold range.
The terms u1, …, um are candidate thresholds. Hsi,j represents the i-year return-significant wave height based on the threshold of uj. The difference, ΔHsi,j, in i-year return-significant wave heights (Hsi,j and Hs) for neighbouring thresholds (uj and uj−1) is defined as follows:
To study the influence of the excluded samples on the return-significant wave height with an increasing threshold and to select a suitable threshold, the ATSME is defined as follows (Liang et al., 2019).
-
Sample. Take the sample from the initial database under an independent and identically distributed assumption.
-
Candidate threshold. Identify the suitable range for the equally spaced, increasing candidate thresholds (u1, um) and the threshold interval . u1 is set as the minimum sample, um is set as the maximum sample and Ntot is set as the number of samples.
-
Return period and value. Choose the order of i (i=i1, …, ) for different return periods, which is dependent on NT and the requirement of practitioners. Extrapolate the return-significant wave height for the i-year, Hsi,j, which corresponds to every candidate threshold, uj.
-
Stable threshold range. Calculate the difference, ΔHsi,j, in the return-significant wave height for neighbouring thresholds. Define a characteristic parameter, chi,j, to record the stable characteristics of the return-significant wave heights. Find the uniquely stable threshold range for the i-year return period.
-
Suitable threshold. Determine the suitable threshold within the stable threshold range, such as the maximum threshold.
3.1 Initial data
Significant wave heights from a 40-year hindcast of tropical cyclone waves (Shao et al., 2018a) are adopted as the initial database, which is simulated using the third-generation spectral wind wave model SWAN (Simulating WAves Nearshore) (Booij et al., 1999; Mortlock et al., 2014; Amrutha et al., 2016). This model is forced by the blended wind, which is obtained by combining the European Centre for Medium-Range Weather Forecasts reanalysis wind data (ECMWF, covering the ERA-40; Uppala et al., 2005 and ERA-Interim; Dee et al., 2011) and Holland model wind data (Shao et al., 2018b). The spatial resolution is 0.0625∘ for both longitude and latitude, and the temporal resolution is 1 h. From 1975 to 2014, waves are simulated only during 974 independent tropical cyclones.
3.2 Study sites
To analyse the extreme significant wave height, 22 locations were selected as the study sites (Fig. 1). When the distance between the centre of the tropical cyclone and the study site is within 300 km, this tropical cyclone is recorded, and hourly significant wave heights simulated during this tropical cyclone are adopted as the initial database at the study site. At the 22 study sites, the number of recorded tropical cyclones is 247 to 403, and the annual mean number of recorded tropical cyclones is 6.175 to 10.075. The corresponding tropical cyclone waves are sufficient for assessing extreme significant wave heights in the SCS (Mazas and Hamm, 2011).
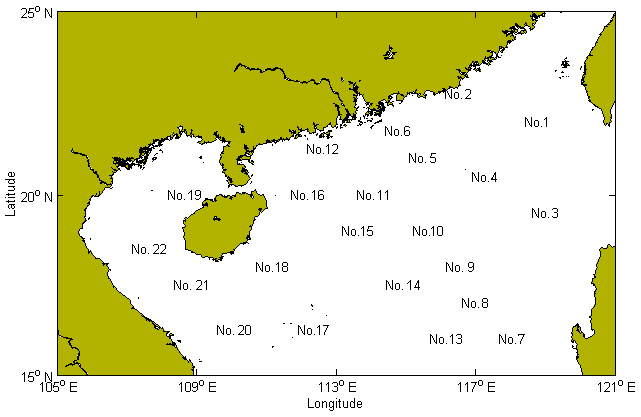
Figure 1The study sites in the study region.
4.1 Sample
As required by the EVT, the extreme significant wave height should be extrapolated based on the independent wave under the same type of meteorological event (Lerma et al., 2015; Solari and Alonso, 2017). Considering that the initial database is simulated only during the independent tropical cyclone, the maximum significant wave height of recorded tropical cyclone waves can be directly extracted as the sample at the study site. For example, 328 tropical cyclones are recorded at location no. 1; thus, 328 maximum significant wave heights during these tropical cyclones are extracted as the sample.
4.2 Sensitivity of return values to threshold
Sensitivity of the return-significant wave height to the threshold can be used in threshold selection. This method fits the GPD over a range of candidate thresholds and selects the suitable threshold by identifying the stability of the return-significant wave heights. If return-significant wave heights are insensitive to the threshold, the corresponding threshold can be selected as the suitable threshold. The benefit of this method is that it requires practitioners to graphically inspect and comprehend the data features and assess the uncertainty of the candidate thresholds (Scarrott and MacDonald, 2012). The drawback of this method is that the threshold is not uniquely selected and another criterion is needed to identify the optimal threshold (Lerma et al., 2015).
Shao et al. (2018a) and Liang et al. (2019) analysed the sensitivity of the return-significant wave height and provided threshold selection criteria to determine a unique threshold. Liang et al. (2019) diagnosed the return-significant wave height within the stable threshold range. If some return-significant wave heights within the stable threshold range are relatively different from the others, the corresponding candidate thresholds are rejected. Thus, the conclusions of Liang et al. (2019) on the sensitivity of the return-significant wave height are employed in this study. For example, at location no. 1, the equally spaced, increasing candidate thresholds are identified by a threshold interval of 0.05 m, and the stable threshold ranges for the 50-, 100-, 150- and 200-year return periods are [3.3, 5.75 m], [3.3, 5.25 m], [3.3, 4.6 m] and [3.3, 4.5 m)], respectively.
To further analyse the candidate thresholds within the stable threshold range, the characteristics of tropical cyclone waves are investigated. The track and intensity of tropical cyclones affect the waves at the study site. When the tropical cyclone track is close to the study site and the intensity of the tropical cyclone is strong, the corresponding wave is sufficiently strong for representing the extreme wave at the study site. In this case, the maximum significant wave height of this tropical cyclone wave should be extracted as the extreme sample. For example, at location no. 1, the maximum significant wave heights during tropical cyclones Pabuk in 2007, Linfa in 2009, Molave in 2009 and Meranti in 2010 were 5.27, 8.17, 9.48 and 4.51 m, respectively. The tracks of these tropical cyclones are close to location no. 1, and the intensities of these tropical cyclones are strong when they influence the waves at location no. 1 (shown in Fig. 2).

Figure 2Tracks of the centres of tropical cyclones Pabuk, Linfa, Molave and Meranti (triangle represents location no. 1, curves represent tracks of centres and circles represent locations of centres).
In contrast, when the track of the tropical cyclone is far from the study site or the intensity of the tropical cyclone is weak, the corresponding wave is insufficiently strong to represent the extreme wave at the study site. In this case, the maximum significant wave height of this tropical cyclone wave should not be extracted as the extreme sample. For example, at location no. 1, the maximum significant wave heights during tropical cyclones Maria in 2000 and Toraji in 2001 are 2.59 and 1.57 m, respectively. Although the intensities of these tropical cyclones are strong when they influence the waves at location no. 1, the tracks of these tropical cyclones are too far from location no. 1 (shown in Fig. 3). The maximum significant wave heights during tropical cyclones Trami in 2001 and Wutip in 2007 were 2.47 and 2.20 m, respectively. Although the tracks of these tropical cyclones are close to location no. 1, the intensities of these tropical cyclones are weak when these tropical cyclones influence the waves at location no. 1 (shown in Fig. 4). The maximum significant wave heights during tropical cyclones Kai-tak in 2005 and Kammuri in 2008 were 1.11 and 2.36 m, respectively. The tracks of these tropical cyclones are far from location no. 1, and the intensities of these tropical cyclones are weak when they influence the waves at location no. 1 (shown in Fig. 5).
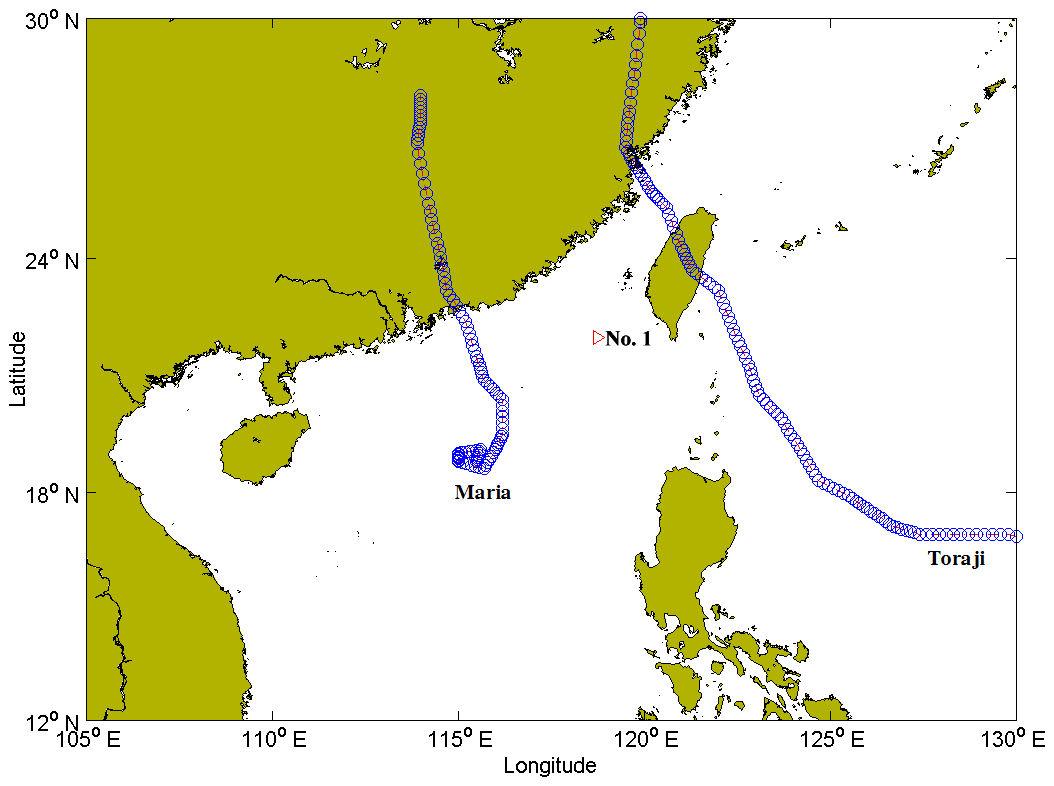
Figure 3Tracks of the centres of tropical cyclones Maria and Toraji (triangle represents location no. 1, curves represent tracks of centres and circles represent locations of centres).
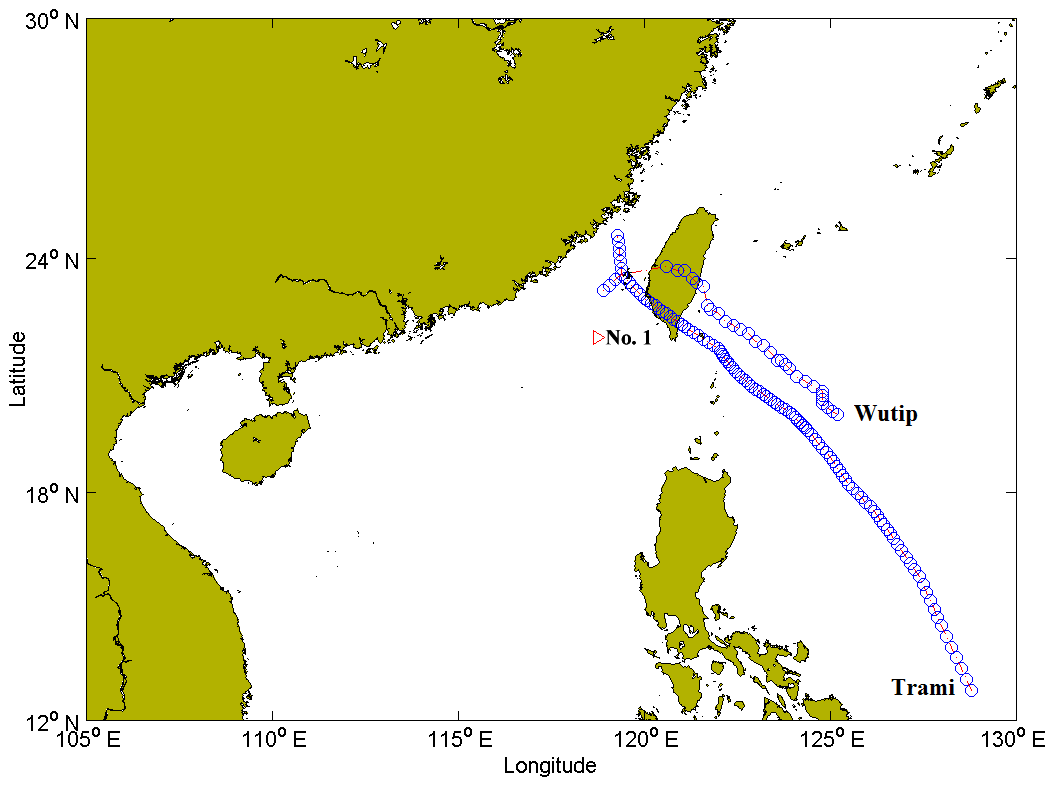
Figure 4Tracks of the centres of tropical cyclones Trami and Wutip (triangle represents location no. 1, curves represent tracks of centres and circles represent locations of centres).

Figure 5Tracks of the centres of tropical cyclones Kai-tak and Kammuri (triangle represents location no. 1, curves represent tracks of centres and circles represent locations of centres).
The track and intensity influences of the tropical cyclones are reflected in the sample distribution (i.e. the distribution of the maximum significant wave height). In Fig. 6, the distribution of the sample at location no. 1 is presented. The sample is counted from 0 to 15 m with an interval of 0.05 m, which is the same as the threshold interval. The samples are concentrated in two ranges: range 1 (0–4.15 m) and range 2 (4.15–15 m), with a separation value of 4.15 m (the curve is plotted to clearly show these ranges). In range 1, 191 samples from 191 independent tropical cyclone waves are found. The corresponding tropical cyclone has a weak influence on the wave at location no. 1, and its track and intensity are similar to those shown in Figs. 3–5. In range 2, 137 samples from 137 independent tropical cyclone waves are found. The corresponding tropical cyclone has a strong influence on the wave at location no. 1, and its track and intensity are similar to those shown in Fig. 2. The sample distribution has a natural separation, distinguishing the high sample from the low sample. Linking the distribution with the sensitivity of the return-significant wave height, this separation (the corresponding annual mean number of extreme samples is 3.425) is within the stable threshold range shown in Sect. 4.2.
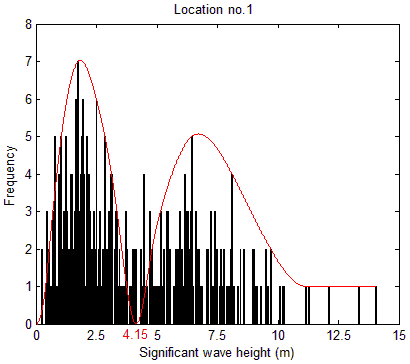
Figure 6Histogram of the maximum significant wave height from 0 to 15 m with intervals of 0.05 m at location no. 1.
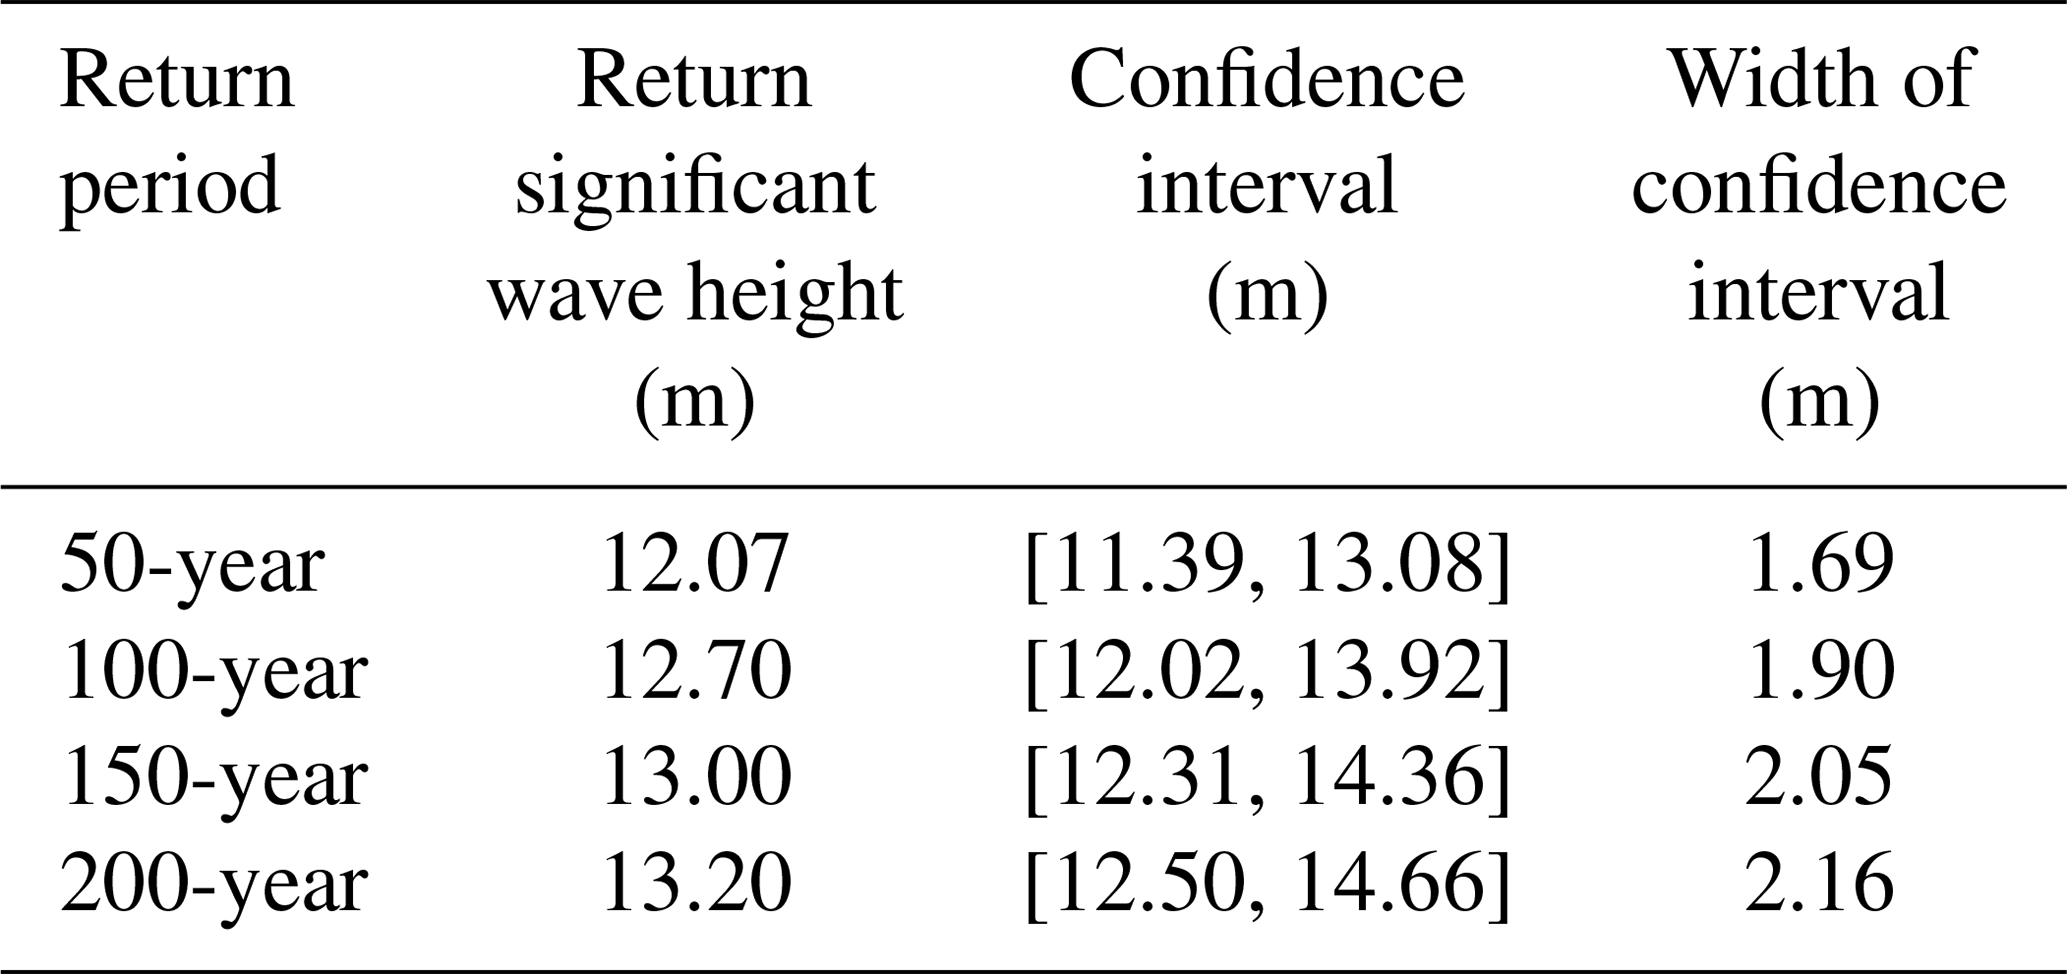
To further validate the separation, the asymptotic tail approximation and estimation uncertainty are analysed. The asymptotic tail approximation can be estimated by the quantile plot, which is discussed by Coles (2001) and produced by a free package running in R. In Fig. 7, the quantile plot for the threshold of 4.15 m is presented, which shows that there are generally few differences between the empirical and fitted quantiles, indicating a good fit for the selected threshold. In Table 1, the return-significant wave height is shown with the confidence interval. The likelihood method (Schendel and Thongwichian, 2017) reparameterizes the likelihood in terms of the unknown quantile and uses profile likelihood arguments to construct an approximate 95 % confidence interval. At location no. 1, the confidence intervals indicate that the variance in the extrapolated significant wave heights is acceptable.
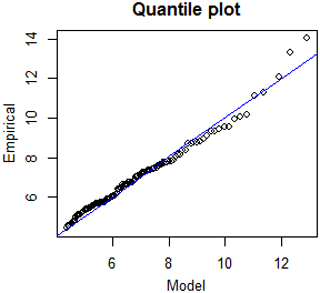
Figure 7The quantile plot for GPD-fitted maximum significant wave heights at location no. 1 for the threshold of 4.15 m.
Table 1Statistics for the return-significant wave heights and confidence intervals at location no. 1 for the threshold of 4.15 m.
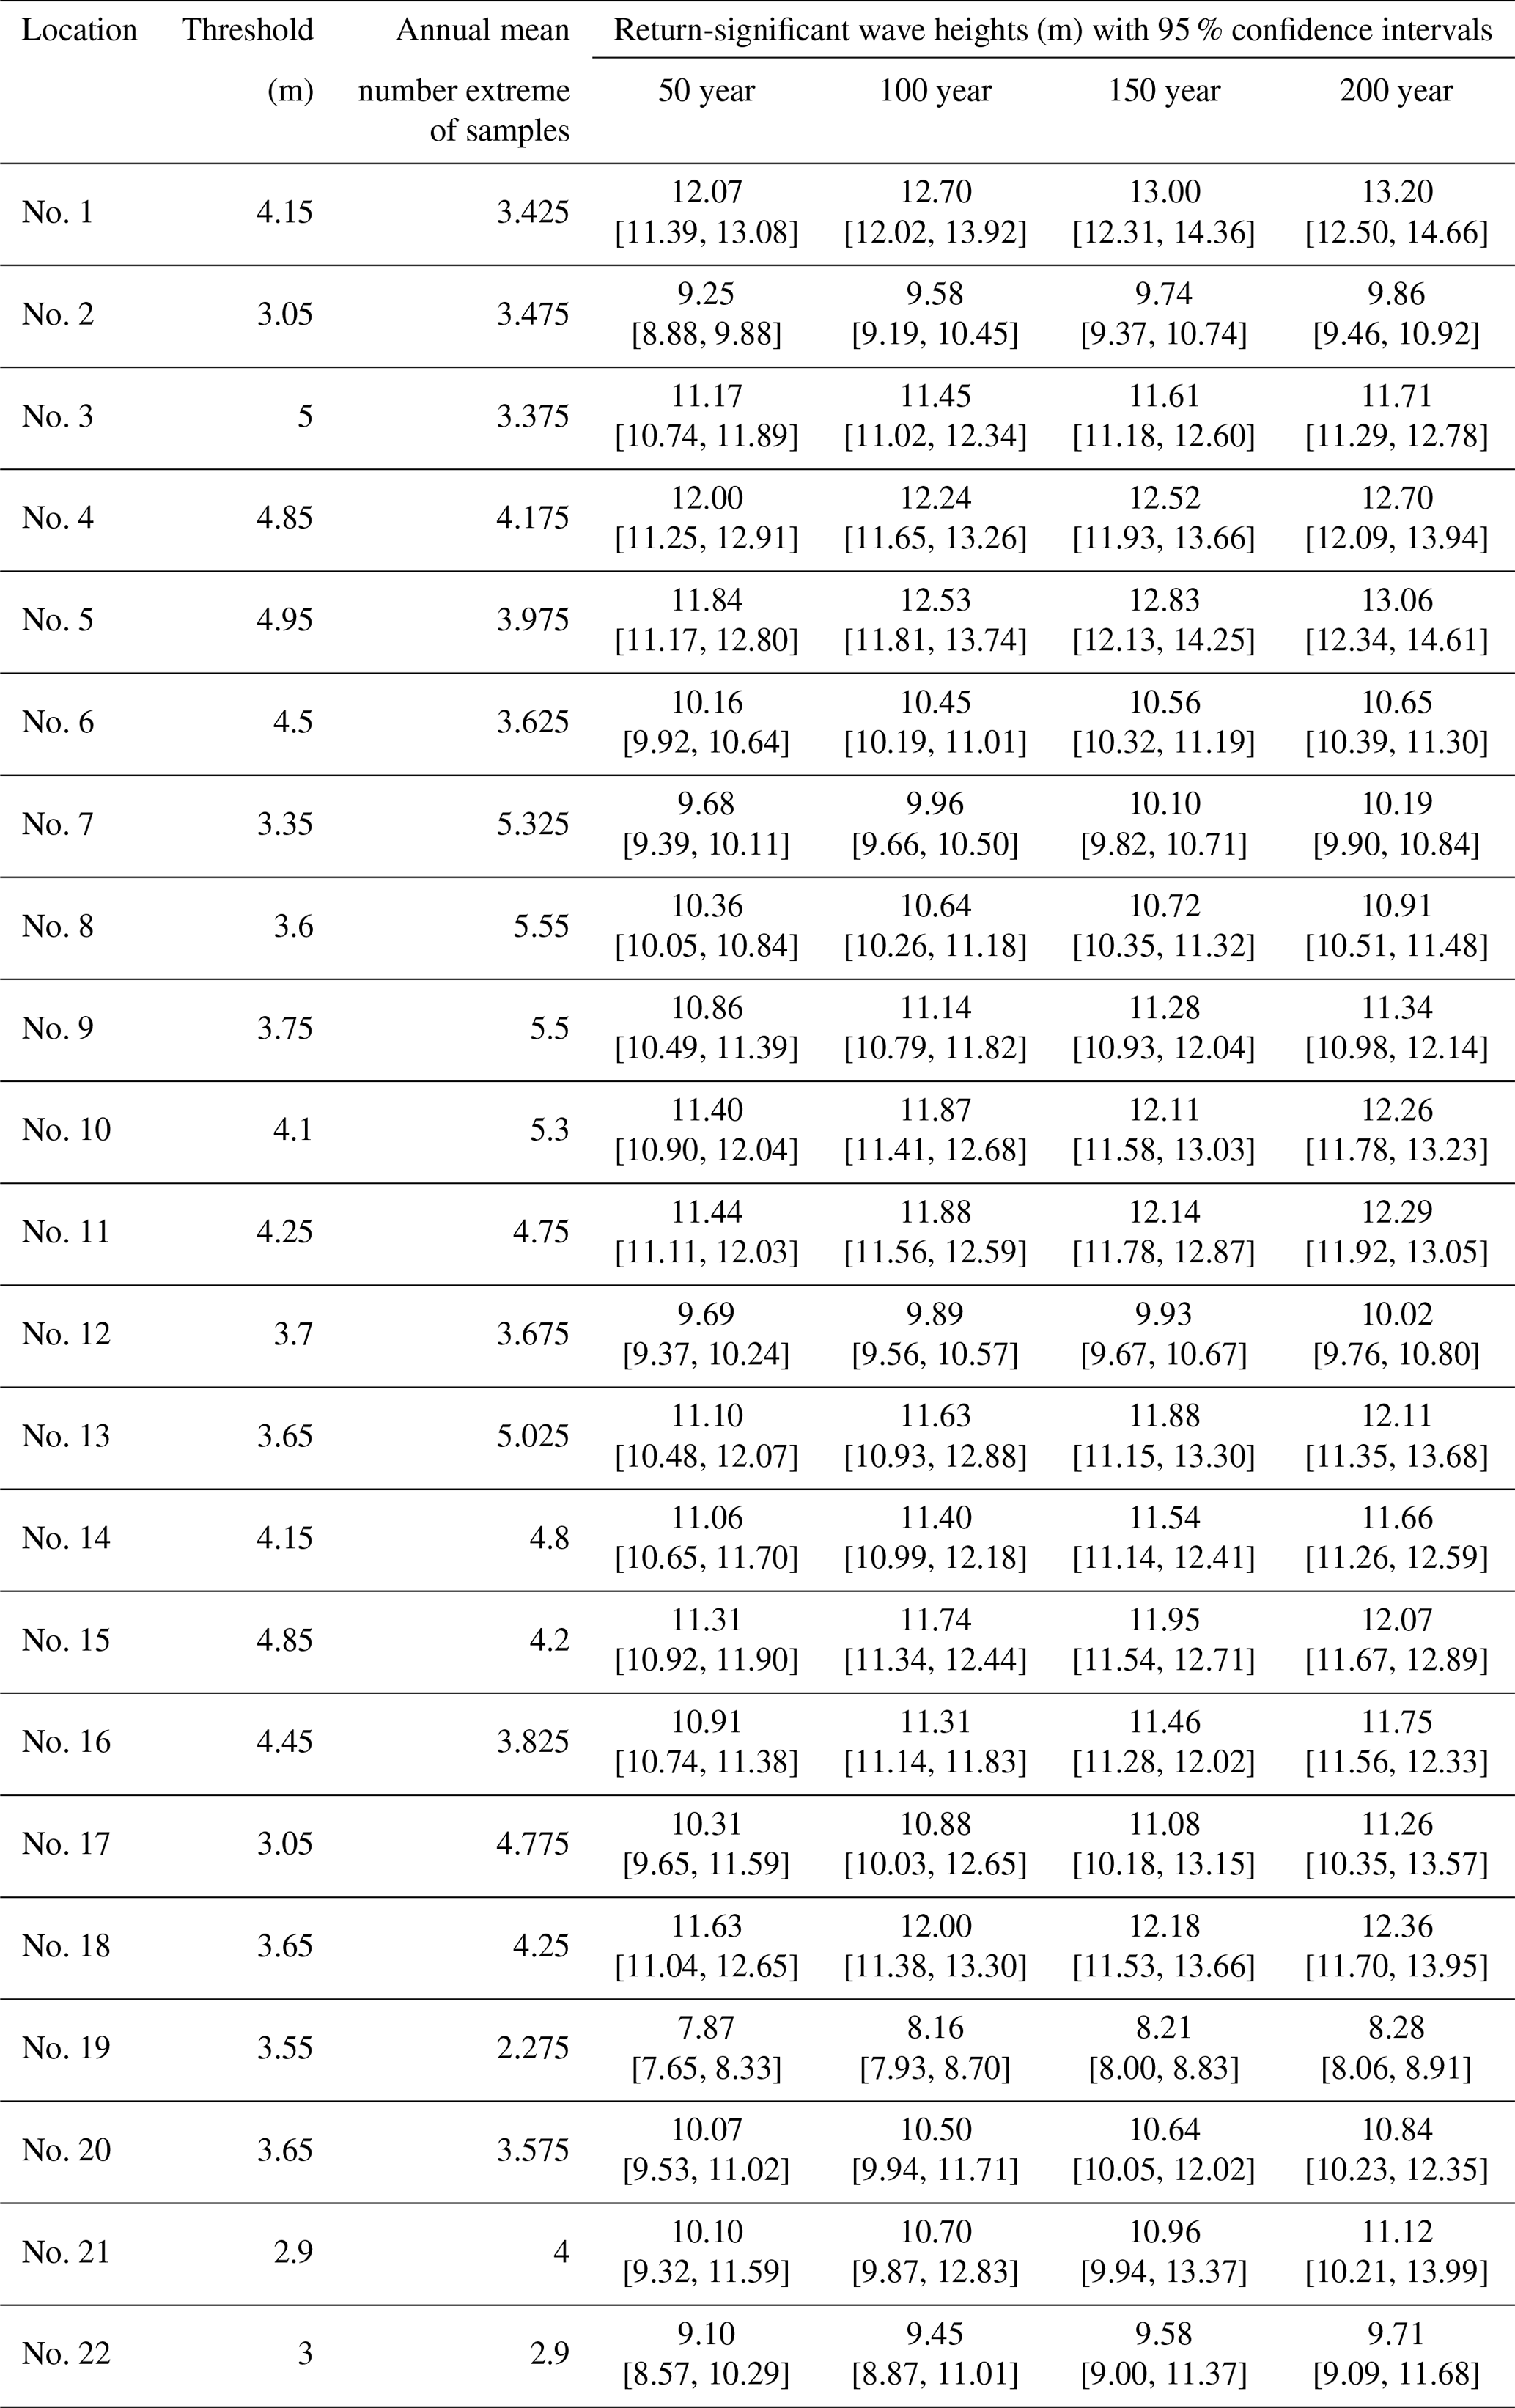
The same conclusion can be reached at the other 21 study sites. For example, the sample distributions at location nos. 7 and 10 (Fig. 8) present separation values of 3.35 and 4.1 m, respectively. Based on these separation values, the GPD model is used to extrapolate the return-significant wave heights for return periods of 50, 100, 150 and 200 years (Table 2). To validate the reliability of the return-significant wave heights, the asymptotic tail approximation and estimation uncertainty are analysed. For example, the quantile plots at location nos. 7 and 10 are presented in Fig. 9, and the confidence intervals at 21 study sites are shown in Table 2. The fits of the results are good, and the uncertainties of the return-significant wave heights are acceptable.

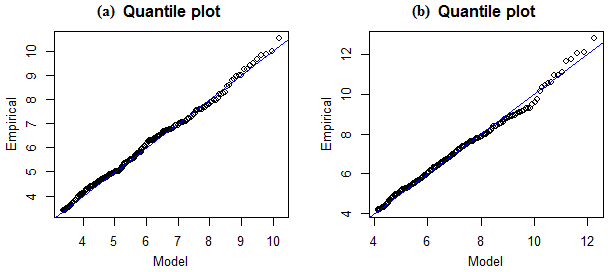
Figure 9Quantile plots for GPD-fitted maximum significant wave heights: (a) for the threshold of 3.35 m at location no. 7 and (b) for the threshold of 4.1 m at location no. 10.
In general, Shao et al. (2018a) and Liang et al. (2019) select the suitable threshold within the stable threshold range. Benefiting from the stable characteristics of return-significant wave heights, their threshold selection criteria can be used to assess the extreme significant wave height. The criterion of Shao et al. (2018a) is relatively simple, and the criterion of Liang et al. (2019) is relatively stable, due to a diagnostic process of return-significant wave heights. For example, at location no. 12, Shao et al. (2018a) extrapolate the return-significant wave heights for the return periods of 50, 100, 150 and 200 years, which are 9.59, 9.86, 9.99 and 10.06 m, respectively. However, under the criterion of Liang et al. (2019), the corresponding return-significant wave heights are 9.69, 9.89, 9.96 and 10.05 m, respectively. When the variation in few return-significant wave heights is relatively large in the stable threshold range, the return-significant wave heights of Liang et al. (2019) are more stable than those of Shao et al. (2018a), especially for a short return period.
Table 2Statistics for thresholds (separations), extreme samples and return-significant wave heights with 95 % confidence intervals.
To determine the suitable threshold within the stable threshold range without a subjective definition, the thresholds within the stable threshold range are further analysed and associated with the characteristics of the tropical cyclone wave. When studying the tropical cyclone wave, a fixed distance is used to identify the initial database at the study site. This fixed distance allows some small samples (the corresponding track is far or the intensity is weak) to be extracted; however, no large samples (the corresponding track is close and intensity is strong) are neglected. Associated with these influences (i.e. track and intensity influences) from the tropical cyclones, the sample distribution has a natural separation distinguishing the high sample (strong influence from the tropical cyclone) from the low sample (weak influence from the tropical cyclone). Linking this distribution with the stable threshold range, the separation is within the stable threshold range. Thus, this separation can be used to identify the extreme sample (i.e. high sample in the distribution). Note that in Table 9 of Shao et al. (2019) and Tables 1 and 2 in this study, the return-significant wave heights for the return periods of 50, 100, 150 and 200 years are similar at the same 22 study locations. However, the threshold selection criterion in this study is relatively simple and objective, and this criterion can reflect the characteristics of the tropical cyclone wave. In addition, under this criterion, the asymptotic tail approximation and estimation uncertainty show that the fits are good and the uncertainties of the return-significant wave heights are acceptable.
Considering that the sample distribution reflects the characteristics of the tropical cyclone wave, the threshold selection criterion is suitable in a tropical cyclone-dominated area. In this area, the initial database and characteristics of the tropical cyclones determine a bimodal shape of this distribution, which has a separation within the stable threshold range. Because the separation is objectively determined by the track and intensity of the tropical cyclone, this value can be identified as a suitable threshold in the POT method.
Tropical cyclone information of Wenzhou: High resolution tropical cyclone parameters, available at: http://www.wztf121.com/, last access: 1 August 2019.
ZS and BL conceived the study and drafted the paper. HL, PL and DL jointly worked on enriching and developing the draft. All authors contributed to the discussion and interpretation of the results.
The authors declare that they have no conflict of interest.
The authors would like to acknowledge the support of the funds and projects. In addition, we would like to thank the editor and reviewers for their valuable suggestions and comments.
This research has been supported by the National Science Fund (grant nos. 51679223 and 51739010), the 111 Project (grant no. B14028), the Shandong Provincial Natural Science Key Basic Program (grant no. ZR2017ZA0202) and a grant from the 7th Generation Ultra-Deep-water Drilling Rig Innovation Project.
This paper was edited by Piero Lionello and reviewed by Thomas Mortlock and three anonymous referees.
Alves, J. H. G. M. and Young, I. R.: On estimating extreme significant wave heights using combined Geosat, Topex/Poseidon and ERS-1 Altimeter Data, Appl. Ocean Res., 25, 167–186, 2003.
Amrutha, M. M., Sanil Kumar, V., Sandhya, K. G., Nair, T. B., and Rathod, J. L.: Wave hindcast studies using SWAN nested in WAVEWATCH III-comparison with measured nearshore buoy data off Karwar, eastern Arabian Sea, Ocean Eng., 119, 114–124, 2016.
Anoop, T. R., Sanil Kumar, V., Shanas, P. R., and Johnson, G.: Surface wave climatology and its variability in the North Indian Ocean based on ERA-Interim reanalysis, J. Atmos. Ocean. Tech., 32, 1372–1385, 2015.
Beguería, S.: Uncertainties in partial duration series modelling of extremes related to the choice of the threshold value, J. Hydrol., 303, 215–230, 2005.
Beirlant, J., Goegebeur, Y., Segers, J., and Teugels, J. L.: Statistics of extremes: theory and applications, John Wiley & Sons, London, UK, 2006.
Benetazzo, A., Fedele, F., Carniel, S., Ricchi, A., Bucchignani, E., and Sclavo, M.: Wave climate of the Adriatic Sea: a future scenario simulation, Nat. Hazards Earth Syst. Sci., 12, 2065–2076, https://doi.org/10.5194/nhess-12-2065-2012, 2012.
Bernardara, P., Mazas, F., Kergadallan, X., and Hamm, L.: A two-step framework for over-threshold modelling of environmental extremes, Nat. Hazards Earth Syst. Sci., 14, 635–647, https://doi.org/10.5194/nhess-14-635-2014, 2014.
Blanchet, J., Touati, J., Lawrence, D., Garavaglia, F., and Paquet, E.: Evaluation of a compound distribution based on weather pattern subsampling for extreme rainfall in Norway, Nat. Hazards Earth Syst. Sci., 15, 2653–2667, https://doi.org/10.5194/nhess-15-2653-2015, 2015.
Boessenkool, B., Bürger, G., and Heistermann, M.: Effects of sample size on estimation of rainfall extremes at high temperatures, Nat. Hazards Earth Syst. Sci., 17, 1623–1629, https://doi.org/10.5194/nhess-17-1623-2017, 2017.
Booij, N., Holthuijsen, L. H., and Ris, R. C.: A third-generation wave model for coastal regions: 1. Model description and validation, J. Geophys. Res., 104, 7649–7666, 1999.
Caires, S. and Sterl, A.: 100-year return value estimates for ocean wind speed and significant wave, J. Climate, 18, 1032–1048, 2005.
Carreau, J. and Bengio, Y.: A hybrid Pareto model for asymmetric fat-tailed data: the univariate case, Extremes, 12, 53–76, 2009.
Chen, X., Wang, K., Zhang, Z., Zeng, Y. D., Zhang, Y., and O'Driscoll, K.: An assessment of wind and wave climate as potential sources of renewable energy in the nearshore Shenzhen coastal zone of the South China Sea, Energy, 134, 789–801, 2017.
Coles, S.: An introduction to statistical modeling of extreme values, in: Springer Series in Statistics, Springer-Verlag, London, 2001.
Danielsson, J., de Haan, L., Peng, L., and de Vries, C. G.: Using a bootstrap method to choose the sample fraction in tail index estimation, J. Multivar. Anal., 76, 226–248, 2001.
Dee, D. P., Uppala, S. M., Simmons, A. J., Berrisford, P., Poli, P., Kobayashi, S., Andrae, U., Balmaseda, M. A., Balsamo, G., Bauer, P., Bechtold, P., Beljaars, A. C. M., Berg, V. D. L., Bidlot, J., Bormann, N., Delsol, C., Dragani, R., Fuentes, M., Geer, A. J., Haimberger, L., Healy, S. B., Hersbach, H., Hólm, E. V., Isaksen, L., Kållberg, P., Köhler, M., Matricardi, M., McNally, A. P., Monge-Sanz, B. M., Morcrette, J.-J., Park, B.-K., Peubey, C., de Rosnay, P., Tavolato, C., Thépaut, J.-N., and Vitart, F.: The ERA-Interim reanalysis: Configuration and performance of the data assimilation system, Q. J. Roy. Meteorol. Soc., 137, 553–597, 2011.
Eastoe, E. F. and Tawn, J. A.: Statistical models for overdispersion in the frequency of peaks over threshold data for a flow series, Water Resour. Res., 46, 1–12, https://doi.org/10.1029/2009WR007757, 2010.
Embrechts, P., Klüppelberg, C., and Mikosch, T.: Modelling Extremal Events: For Insurance and Finance, Springer, New York, USA, p. 648, 1997.
Ferreira, J. A. and Guedes Soares, C.: An application of the peaks over threshold method to predict extremes of significant wave height, J. Offsh. Mech. Arct. Eng., 120, 165–176, 1998.
Ferreira, J. A., de Haan, L., and Peng, L.: On optimising the estimation of high quantiles of a probability distribution, Statistics, 37, 401–434, 2003.
Gao, H. J., Wang, L. Q., Liang, B. C., and Pan, X. Y.: Estimation of Extreme Significant Wave Heights in the Yellow Sea, China, in: The 28th International Ocean and Polar Engineering Conference, International Society of Offshore and Polar Engineers, Sapporo, Japan, 10–15 June 2018, 387–391, 2018.
Goda, Y., Konagaya, O., Takeshita, N., Hitomi, H., and Nagai, T.: Population distribution of extreme significant wave heights estimated through regional analysis, Int. Conf. Coast. Eng., 276, 1078–1091, 2001.
Godoi, V. A., Bryan, K. R., Stephens, S. A., and Gorman, R. M.: Extreme waves in New Zealand waters, Ocean Model., 117, 97–110, 2017.
Goegebeur, Y., Beirlant, J., and de Wet, T.: Linking Pareto-tail kernel goodness-of-fit statistics with tail index at optimal threshold and second order estimation, Revstat, 6, 51–69, 2008.
Hill, B. M.: A simple general approach to inference about the tail of a distribution, Ann. Stat., 3, 1163–1174, 1975.
Hithin, N. K., Sanil Kumar, V., and Shanas, P. R.: Trends of wave height and period in the Central Arabian Sea from 1996 to 2012: a study based on satellite altimeter data, Ocean Eng., 108, 416–425, 2015.
Kapelonis, Z. G., Gavriliadis, P. N., and Athanassoulis, G. A.: Extreme value analysis of dynamical wave climate projections in the Mediterranean Sea, Proced. Comput. Sci., 66, 210–219, 2015.
Lerma, A. N., Bulteau, T., Lecacheux, S., and Idier, D.: Spatial variability of extreme significant wave height along the Atlantic and channel French coast, Ocean Eng., 97, 175–185, 2015.
Li, J., Pan, S., Chen, Y., Fan, Y. M., and Pan, Y.: Numerical estimation of extreme waves and surges over the northwest Pacific Ocean, Ocean Eng., 153, 225–241, 2018.
Liang, B. C., Shao, Z. X., Li, H. J., Shao, M., and Lee, D. Y.: An automated threshold selection method based on the characteristic of extrapolated significant wave heights, Coast. Eng., 144, 22–32, 2019.
Lucas, C., Muraleedharan, G., and Soares, C. G.: Regional frequency analysis of extreme waves in a coastal area, Coast. Eng., 126, 81–95, 2017.
MacDonald, A., Scarrott, C. J., Lee, D., Darlow, B., Reale, M., and Russell, G.: A flexible extreme value mixture model, Comput. Stat. Data Anal., 55, 2137–2157, 2011.
Martucci, G., Carniel, S., Chiggiato, J., Sclavo, M., Lionello, P., and Galati, M. B.: Statistical trend analysis and extreme distribution of significant wave height from 1958 to 1999 – an application to the Italian Seas, Ocean Sci., 6, 525–538, https://doi.org/10.5194/os-6-525-2010, 2010.
Mazas, F. and Hamm, L.: Amulti-distribution approach to POT methods for determining extreme significant wave heights, Coast. Eng., 58, 385–394, 2011.
Mirzaei, A., Tangang, F., and Juneng, L.: Wave energy potential assessment in the central and southern regions of the South China Sea, Renewable Energy, 80, 454–470, 2015.
Mortlock, T. R. and Goodwin, I. D.: Directional wave climate and power variability along the Southeast Australian shelf, Cont. Shelf Res., 98, 36–53, 2015.
Mortlock, T. R. and Goodwin, I. D.: Impacts of enhanced central Pacific ENSO on wave climate and headland-bay beach morphology, Cont. Shelf Res., 120, 14–25, 2016.
Mortlock, T. R., Goodwin, I. D., and Turner, I. L.: Nearshore SWAN model sensitivities to measured and modelled offshore wave scenarios at an embayed beach compartment, NSW, Australia, Aust. J. Civ. Eng., 12, 67–82, 2014.
Mortlock, T. R., Goodwin, I.D., McAneney, J. K., and Roche, K.: The June 2016 Australian East Coast Low: Importance of Wave Direction for Coastal Erosion Assessment, Water, 9, 1–22, 2017.
Mortlock, T. R., Metters, D., Soderholm, J., Maher, J., Lee, S. B., Boughton, G., Stewart, N., Zavadil, E., and Goodwin, I. D.: Extreme water levels, waves and coastal impacts during a severe tropical cyclone in northeastern Australia: a case study for cross-sector data sharing, Nat. Hazards Earth Syst. Sci., 18, 2603–2623, https://doi.org/10.5194/nhess-18-2603-2018, 2018.
Muhammed Naseef, T. and Sanil Kumar, V.: Variations in return value estimate of ocean surface waves – a study based on measured buoy data and ERA-Interim reanalysis data, Nat. Hazards Earth Syst. Sci., 17, 1763–1778, https://doi.org/10.5194/nhess-17-1763-2017, 2017.
Muraleedharan, G., Lucas, C., and Soares, C. G.: Regression quantile models for estimating trends in extreme significant wave heights, Ocean Eng., 118, 204–215, 2016.
Neves, C. and Alves, M. I. F.: Reiss and Thomas' automatic selection of the number of extremes, Comput. Stat. Data Anal., 47, 689–704, 2004.
Northrop, P. J. and Coleman, C. L.: Improved threshold diagnostic plots for extreme value analyses, Extremes, 17, 289–303, 2014.
Northrop, P. J., Attalides, N., and Jonathan, P.: Cross-validatory extreme value threshold selection and uncertainty with application to ocean storm severity, J. Roy. Stat. Soc. C, 66, 93–120, 2017.
Ojeda, E. and Guillén, J.: Shoreline variability of Barcelona city beaches in response to storms and artificial nourishment (2001–2003), in: Coastal Dynamics 2005: State of the Practice, Coastal Dynamics, Barcelona, Spain, 1–11, 2006.
Ojeda, E. and Guillén, J.: Shoreline dynamics and beach rotation of artificial embayed beaches, Mar. Geol., 253, 51–62, 2008.
Ojeda, E., Guillén, J., and Ribas, F.: The morphodynamic responses of artificial embayed beaches to storm events, Adv. Geosci., 26, 99–103, https://doi.org/10.5194/adgeo-26-99-2010, 2010.
Ojeda, E., Guillén, J., and Ribas, F.: Dynamics of single-barred embayed beaches, Mar. Geol., 280, 76–90, 2011.
Ojeda, E., Appendini, C. M., and Mendoza, E. T.: Storm-wave trends in Mexican waters of the Gulf of Mexico and Caribbean Sea, Nat. Hazards Earth Syst. Sci., 17, 1305–1317, https://doi.org/10.5194/nhess-17-1305-2017, 2017.
Petrov, V., Guedes Soares, C., and Gotovac, H.: Prediction of extreme significant wave heights using maximum entropy, Coast. Eng., 74, 1–10, 2013.
Pickands, J.: Statistical inference using extreme order statistics, the Annals of Statistics, 3, 119-131, 1975.
Reiss, R. D. and Thomas, M.: Statistical analysis of extreme values, Birkhäuser, Basel, 2007.
Ribal, A. and Young, I. R.: 33 years of globally calibrated wave height and wind speed data based on altimeter observations, Scient. Data, 6, 1–15, 2019.
Samayam, S., Laface, V., Annamalaisamy, S. S., Arena, F., Vallam, S., and Gavrilovich, P. V.: Assessment of reliability of extreme wave height prediction models, Nat. Hazards Earth Syst. Sci., 17, 409–421, https://doi.org/10.5194/nhess-17-409-2017, 2017.
Sánchez-Arcilla, A., Gomez Aguar, J., Egozcue, J. J., Ortego, M. R., Galiatsatou, P., and Prinos, P.: Extremes from scarce data: the role of Bayesian and scaling techniques in reducing uncertainty, J. Hydraul. Res., 46, 224–234, 2017.
Sanil Kumar, V. and Anoop, T. R.: Spatial and temporal variations of wave height in shelf seas around India, Nat. Hazards, 78, 1693–1706, 2015.
Sanil Kumar, V., Joseph, J., Amrutha, M. M., Jena, B. K., Sivakholundu, K. M., and Dubhashi, K. K.: Seasonal and interannual changes of significant wave height in shelf seas around India during 1998–2012 based on wave hindcast, Ocean Eng., 151, 127–140, 2018.
Scarrott, C. and MacDonald, A.: A review of extreme value threshold estimation and uncertainty quantification, Stat. J., 10, 33–60, 2012.
Schendel, T. and Thongwichian, R.: Confidence intervals for return levels for the peaks-over-threshold approach, Adv. Water Resour., 99, 53–59, 2017.
Shao, Z. X., Liang, B. C., Pan, X. Y., and Gao, H. J.: Analysis of Extreme Waves with Tropical Cyclone Wave Hindcast Data, in: The 27th International Ocean and Polar Engineering Conference, International Society of Offshore and Polar Engineers, San Francisco, USA, 25–30 June 2017, 30–33, 2017.
Shao, Z. X., Liang, B. C., Li, H. J., and Lee, D. Y.: Study of sampling methods for assessment of extreme significant wave heights in the South China Sea, Ocean Eng., 168, 173–184, 2018a.
Shao, Z. X., Liang, B. C., Li, H. J., Wu, G. X., and Wu, Z. H.: Blended wind fields for wave modeling of tropical cyclones in the South China Sea and East China Sea, Appl. Ocean Res., 71, 20–33, 2018b.
Soares, C. G. and Scotto, M. G.: Application of the r largest-order statistics for long-term predictions of significant wave height, Coast. Eng., 51, 387–394, 2004.
Sobradelo, R., Martí, J., Mendoza-Rosas, A. T., and Gómez, G.: Volcanic hazard assessment for the Canary Islands (Spain) using extreme value theory, Nat. Hazards Earth Syst. Sci., 11, 2741–2753, https://doi.org/10.5194/nhess-11-2741-2011, 2011.
Solari, S. and Alonso, R.: A new methodology for extreme waves analysis based on weather-patterns classification methods, Coast. Eng. Proc., 1, 1–12, 2017.
Solari, S., Egüen, M., Polo, M. J., and Losada, M. Á.: Peaks Over Threshold (POT): A methodology for automatic threshold estimation using goodness of fit p-value, Water Resour. Res., 53, 2833–2849, 2017.
Sulis, A., Cozza, R., and Annis, A.: Extreme wave analysis methods in the gulf of Cagliari (South Sardinia, Italy), Ocean Coast. Manage., 140, 79–87, 2017.
Tawn, J. A.: An extreme-value theory model for dependent observations, J. Hydrol., 101, 227–250, 1988.
Uppala, S. M., KÅllberg, P. W., Simmons, A. J., Andrae, U., Bechtold, V. D. C., Fiorino, M., Gibson, J. K., Haseler, J., Hernandez, A., Kelly, G. A., Li, X., Onogi, K., Saarinen, S., Sokka, N., Allan, R. P., Andersson, E., Arpe, K., Balmaseda, M. A., Beljaars, A. C. M., Berg, V. D. L., Bidlot, J., Bormann, N., Caires, S., Chevallier, F., Dethof, A., Dragosavac, M., Fisher, M., Fuentes, M., Hagemann, S., Hólm, E., Hoskins, B. J., Isaksen, L., Janssen, P. A. E. M., Jenne, R., Mcnally, A. P., Mahfouf, J.-F., Morcrette, J.-J., Rayner, N. A., Saunders, R. W., Simon, P., Sterl, A., Trenberth, K. E., Untch, A., Vasiljevic, D., Viterbo, P., and Woollen, J.: The ERA-40 re-analysis, Q. J. Roy. Meteorol. Soc., 131, 2961–3012, 2005.
Vanem, E.: Non-stationary extreme value models to account for trends and shifts in the extreme wave climate due to climate change, Appl. Ocean Res., 52, 201–211, 2015a.
Vanem, E.: Uncertainties in extreme value modelling of wave data in a climate change perspective, J. Ocean Eng. Mar. Energy, 1, 339–359, 2015b.
Viselli, A. M., Forristall, G. Z., Pearce, B. R., and Dagher, H. J.: Estimation of extreme wave and wind design parameters for offshore wind turbines in the Gulf of Maine using a POT method, Ocean Eng., 104, 649–658, 2015.
Wang, L. Q., Liang, B. C., and Li, H. J.: A new non-parametric correction model and its applications to hindcasting wave data, Ocean Eng., 132, 11–24, 2017.
Wang, Z., Duan, C., and Dong, S.: Long-term wind and wave energy resource assessment in the South China sea based on 30-year hindcast data, Ocean Eng., 163, 58–75, 2018.
Xiao, L., Lu, H., Tao, L., and Yang, L. J.: LH-moment estimation for statistical analysis on the wave crest distributions of a deepwater spar platform model test, Mar. Struct., 52, 15–33, 2017.
Yaakob, O., Hashim, F. E., Omar, K. M., Din, A. H. M., and Koh, K. K.: Satellite-based wave data and wave energy resource assessment for South China Sea, Renewable Energy, 88, 359–371, 2016.
You, Z. J.: Extrapolation of historical coastal storm wave data with best-fit distribution function, Aust. J. Civ. Eng., 9, 73–82, 2011.
You, Z. J. and Callaghan, D.: Discussion of “Modelling significant wave height distributions with quantile functions for estimation of extreme significant wave heights” [Ocean Eng. 54 (2012) 119–131], Ocean Eng., 70, 208–210, 2013.
Young, I.: A review of parametric descriptions of tropical cyclone wind-wave generation, Atmosphere, 8, 1–20, 2017.
Young, I. R. and Vinoth, J.: An “extended fetch” model for the spatial distribution of tropical cyclone wind-waves as observed by altimeter, Ocean Eng., 70, 14–24, 2013.
Young, I. R., Vinoth, J., Zieger, S., and Babanin, A. V.: Investigation of trends in extreme value wave height and wind speed, J. Geophys. Res., 117, C00J06, https://doi.org/10.1029/2011JC007753, 2012.
Zheng, C. W., Zhuang, H., Li, X., and Li, X. Q.: Wind energy and wave energy resources assessment in the East China Sea and South China Sea, Sci. China Technol. Sci., 55, 163–173, 2012.
Zheng, C. W., Pan, J., Tan, Y. K., Gao, Z. S., Rui, Z. F., and Chen, C. H.: The seasonal variations in the significant wave height and sea surface wind speed of the China's seas, Acta Oceanol. Sin., 34, 58–64, 2015.