the Creative Commons Attribution 4.0 License.
the Creative Commons Attribution 4.0 License.
 | 07 Jan 2019
Ensemble flood forecasting considering dominant runoff processes – Part 1: Set-up and application to nested basins (Emme, Switzerland)
Manuel Antonetti
Christoph Horat
Ioannis V. Sideris
Massimiliano Zappa
Flash floods evolve rapidly during and after heavy precipitation events and represent a potential risk for society. To predict the timing and magnitude of a peak runoff, it is common to couple meteorological and hydrological models in a forecasting chain. However, hydrological models rely on strong simplifying assumptions and hence need to be calibrated. This makes their application difficult in catchments where no direct observation of runoff is available.
To address this gap, a flash-flood forecasting chain is presented based on (i) a nowcasting product which combines radar and rain gauge rainfall data (CombiPrecip); (ii) meteorological data from state-of-the-art numerical weather prediction models (COSMO-1, COSMO-E); (iii) operationally available soil moisture estimations from the PREVAH hydrological model; and (iv) a process-based runoff generation module with no need for calibration (RGM-PRO). This last component uses information on the spatial distribution of dominant runoff processes from the so-called maps of runoff types, which can be derived with different mapping approaches with increasing involvement of expert knowledge. RGM-PRO is event-based and parametrised a priori based on the results of sprinkling experiments.
This prediction chain has been evaluated using data from April to September 2016 in the Emme catchment, a medium-sized flash-flood-prone basin in the Swiss Prealps. Two novel forecasting chains were set up with two different maps of runoff types, which allowed sensitivity of the forecast performance to the mapping approaches to be analysed. Furthermore, special emphasis was placed on the predictive power of the new forecasting chains in nested subcatchments when compared with a prediction chain including an original version of the runoff generation module of PREVAH calibrated for one event.
Results showed a low sensitivity of the predictive power to the amount of expert knowledge included for the mapping approach. The forecasting chain including a map of runoff types with high involvement of expert knowledge did not guarantee more skill. In the larger basins of the Emme region, process-based forecasting chains revealed comparable skill to a prediction system including a conventional hydrological model. In the small nested subcatchments, although the process-based forecasting chains outperformed the original runoff generation module, no forecasting chain showed satisfying skill in the sense that it could be useful for decision makers.
Despite the short period available for evaluation, preliminary outcomes of this study show that operational flash-flood predictions in ungauged basins can benefit from the use of information on runoff processes, as no long-term runoff measurements are needed for calibration.
- Article
(4976 KB) - Full-text XML
-
Supplement
(255 KB) - BibTeX
- EndNote


Flash floods (FFs) arising from the interaction of the atmospheric and the hydrological system are characterised by a runoff peak that develops within time periods that range from minutes to hours and may occur during or after intense rainfall (Norbiato et al., 2008). They may result in threatening catastrophes and pose a risk to society, especially on small-scale catchments (of few hundred square kilometres of size or less) with steep slopes and shallow soils. Since small basins react quickly to precipitation there is only little time for warnings (Liechti et al., 2013). Furthermore, FFs can be accompanied by landslides and mud flows (Collier, 2007). Impermeable surfaces and saturated soils may accelerate the rainfall–runoff transition (Norbiato et al., 2008).
FFs are considered to be significant natural hazards and they are associated with a serious risk to life and destruction of buildings and infrastructure (Collier, 2007; Gaume et al., 2009; Norbiato et al., 2008). In Europe, FF occurrence peaks during autumn in Mediterranean and Alpine–Mediterranean areas and during summer in inland continental regions due to pronounced convective activity (Marchi et al., 2010; Norbiato et al., 2008). The magnitude of the events is in general larger in Mediterranean countries than in inner continental countries (Gaume et al., 2009; Javelle et al., 2010). According to Gaume et al. (2009), the most severe FF events in Europe were the Barcelona flood in Spain (1962) with over 400 casualties (Lopez Bustos, 1964), the two floods in the region of Piedmont in Italy (1968 and 1994) with respectively 72 and 69 victims (Ferro, 2005; Guzzetti et al., 2005) and the Aude flood in France (1999) with 35 fatalities (Gaume et al., 2004). Economic damages associated with such floods were substantial, e.g. EUR 3.3 billion for the Aude flood (Lefrou et al., 2000) and EUR 1.2 billion for the Garde flood which occurred in 2002 in France (Braud et al., 2010; Delrieu et al., 2005; Huet et al., 2003). In Switzerland, in June 2007, heavy precipitation caused flooding of the river Langeten and landslides in the region of Huttwil, Canton of Bern. This led to three fatalities and damages of CHF 60 million (Liechti, 2008). In July 2014, flooding of the river Emme and landslides were responsible for damages of CHF 15 million in Schangnau, Canton of Bern (Andres et al., 2015).
1.1 Current approaches for flash-flood prediction
As both meteorological and hydrological conditions are important for FF prediction, coupled approaches were developed, for instance, the so-called Flash Flood Guidance (FFG) concept, which is used to issue warnings in the USA (Carpenter et al., 1999; Norbiato et al., 2008). FFG is defined as the rainfall depth which is necessary to occur for a certain duration to cause minor flooding in a specific basin. According to Georgakakos (2006) and Norbiato et al. (2008), for the USA, FFG thresholds are computed with a hydrological model that is run iteratively with increasing amounts of rainfall of a given duration. The FFG provides a value of susceptibility of a basin to a FF and takes the hydrological state of the system and in particular soil moisture into account. In operational mode, FFG is computed each day. When nowcast or forecast rainfall depth is higher than FFG, a warning is issued as a flooding is likely. Although this concept is useful, neither the timing nor the magnitude of the event is assessed (Norbiato et al., 2008). As a further approach, Collier and Fox (2003) proposed a Flash Flood Susceptibility Assessment Procedure (FFSAP), which is similar to what Mani et al. (2012) elaborated for the catchments investigated here (see Sect. 2) and to what is currently deployed in Saxony (eastern Germany) for operational flash-flood early warning (Philipp et al., 2016). Mani et al. (2012) developed an approach for the Swiss Emme basin based on the concept of “disposition”, defined as the susceptibility of a region to flash floods and debris flow. In their approach, the actual disposition is defined by the sum of base and variable disposition, whereby the former is inferred from geological properties of the catchment and the latter is dependent on time. Whether a process initiation through heavy precipitation is expected – meaning that the actual disposition reaches a threshold – is determined with analyses of rainfall radar data (Panziera et al., 2016). Although this approach provides the geographical distributions of event-prone areas, it is expensive as it requires periodic field work to sample the variable disposition. In addition, as with the FFG concept, it does not provide detailed information on the magnitude and timing of an event. Several combinations of meteorological and hydrological models were implemented in so-called forecasting chains to quantitatively predict peak flows. It was already examined by, for example, Georgakakos (1986), who implemented a stochastic–dynamic hydrometeorological model. In general, a forecasting chain consists of (a) an atmospheric model, (b) a hydrological prediction system, (c) a nowcasting tool for initial conditions and (d) warnings for end users (Zappa et al., 2008, 2011). The advantage of this approach is that timing and magnitude of the event can be predicted. Some examples of forecasting chains are described below, with a particular focus on the hydrological model.
Rossa et al. (2010) carried out a case study for the 26 September 2007 Venice FF in the 90 km2 Dese River basin. They implemented a forecasting chain with a semi-distributed hydrological–hydraulic model that is based on the Green–Ampt approach (Heber Green and Ampt, 1911) for infiltration-excess and saturation-excess runoff generation and the Penman–Monteith equation (Monteith et al., 1965; Penman, 1948) for evapotranspiration fluxes. As the river network of their study area is affected by tides, the coupling to the hydrodynamic model was of importance. Liechti et al. (2013) explored the potential of two radar-based ensemble forecasting chains for FF early warning in Alpine catchments in southern Switzerland, including the Verzasca basin. They found that it is valuable having an ensemble in hydrological initial conditions. However, data needed for such predictions are only available in certain regions as they are exclusively produced for research projects, which prevents the operational application of their approach. A skilful forecasting chain for the river Sihl and the city of Zurich was developed by Addor et al. (2011), which combined the PREVAH hydrological model with the FLORIS hydraulic model and used deterministic and probabilistic meteorological input. In all of the forecasting chains of Liechti et al. (2013) and Addor et al. (2011), the hydrological model used (PREVAH; Viviroli et al., 2009) relied on calibration.
Haag et al. (2016) integrated spatially distributed information on dominant runoff processes (DRPs; see Sect. 3.1.1) based on the classification of Scherrer and Naef (2003) into LARSIM (Large Area Runoff Simulation Model; Bremicker, 2000). For each DRP, the soil module was parametrised based on numerical experiments. Depending on which runoff process is dominant in a certain hydrological response unit (HRU), a corresponding basis parametrisation of the soil storage was used. With scaling factors, which allow for an adaptation of the basis parametrisation, the model was calibrated while maintaining geographical heterogeneity. Subsequently, LARSIM was forced with meteorological input data and applied on the Nahe catchment in Rheinland-Pfalz, where it has been used for operational flood prediction and early warning since 2014.
1.2 Challenges and uncertainties
FF predictions are challenging for several reasons. A first challenge is that FFs are extreme events and often occur in ungauged basins, which means that there is only little data available for their investigation (Gaume et al., 2009). In most extreme cases, hydrometric measuring devices may even be destroyed (Collier, 2007). In order to still have sufficient data to perform a proper statistical analyses, warning thresholds are often set too low and become not relevant for FFs anymore (Liechti et al., 2013). Furthermore, especially small catchments are prone to FFs (Alfieri et al., 2011), which requires a high resolution of the forcing numerical prediction model (Collier, 2007).
Table 1Overview of previous own work on the topics of the paper. Prior and current applications are classified according to the target area, the models used, the available forcing and the analyses performed. NSE is the Nash–Sutcliffe efficiency. KGE is the Kling–Gupta efficiency. SWAE is the sum of weighted absolute errors. ANOVA is the analysis of variance. Brown et al. (2010) is given as a benchmark paper for the verification of ensemble hydrological forecasts.

Considering a forecasting chain, uncertainties of meteorological input, of the hydrological initial conditions, of the structure of the hydrological model and of the hydrological model parameters propagate and superpose through the flood forecasting chain in a non-linear fashion (Velazquez et al., 2011; Zappa et al., 2011). Meteorological uncertainty, which can be assessed with a meteorological ensemble prediction system, is usually assumed to account for the largest share of total uncertainty (Rossa et al., 2011; Zappa et al., 2011). Uncertainty in the parameters of the hydrological model follows from an incomplete understanding on how to mathematically represent the rainfall–runoff transition process and can be treated with a hydrological multi-model approach (Fenicia et al., 2011; Velazquez et al., 2011). Hydrological model parameter uncertainties result when physical processes affecting runoff generation are modelled conceptually and multiple parameter sets are identified during the calibration process that lead to optimum model performance, a problem which is known as equifinality (Beven, 1993). Zappa et al. (2011) treated uncertainty in model parameters with an ensemble of the PREVAH hydrological model and found this uncertainty source to be responsible for the second largest contribution to the total uncertainty in their study.
1.3 Prior work and objectives
From the previous literature review, it emerges that in recent years several studies on the topic of FFs prediction have been completed by our research group. Before stating the goals of this new paper it is useful to have a summary of our prior work on related topics. Table 1 presents an overview on seven papers published since 2011. Zappa et al. (2011) is our benchmark paper on uncertainty propagation and evaluated probabilistic forecasts in the Verzasca basin, for which real-time forecasts as forced by different generation of forcing numerical weather prediction (NWP) models (COSMO-1, COSMO-2, COSMO-LEPS and COSMO-E in Table 1) have been operated since 2007 (Zappa et al., 2008). Addor et al. (2011) is the first work in which we address the topic of verification of deterministic and ensemble forecasts; it is focussed on the river Sihl. Liechti et al. (2013) investigated flash-flood nowcasting with advanced ensemble weather radar products and a deterministic NWP for three areas in southern Switzerland, including the Verzasca River. Antonetti et al. (2017) first introduces RGM-PRO and its a priori configuration. RGM-PRO is a runoff generation module (RGM) with no need for calibration. Re-simulating sprinkler experiments (Kienzler and Naef, 2008) allows an a priori determination of the parameters generally requiring calibration (see Sect. 3). This procedure has been evaluated in five target areas, including a sub-basin of the Emme catchment. Antonetti and Zappa (2018) investigated with different configurations of RGM-PRO to which extent expert knowledge can improve simulation results under consideration of uncertainty in the Emme catchment and its main tributaries. All the studies confirmed that forecasts of timing and magnitude of flash floods are of importance and require a combination of a meteorological prediction with a hydrological model. The latter could either be a physically based model – which is computationally expensive and not the first choice for operational use – or a conceptual model, in which calibration problems arise and hinder applicability for ungauged basins. Larger catchments and low-flow periods are predicted by current state-of-the art forecasting chains relying on calibration (Zappa et al., 2008). This study and the companion paper by Horat et al. (2018) have been designed to evaluate possible operational deployment of an event-based runoff generation module such as RGM-PRO, which has the potential of being configured for ungauged areas without the need for tailored calibration. Such event-based tools should only be in operation when thunderstorms are to be expected as they provide information to anticipate flash floods in small fast-reacting areas. These two latest experiments are the first using the COSMO-E and COSMO-1 numerical models for hydrological predictions (see Sect. 2.2). The period of evaluation covers the summer of 2016. It is a short period for a comprehensive assessment of RGM-PRO, but it might already provide indication of its potential. The first research question of the present study addresses this aspect:
-
To what extent does the skill of the FF prediction depend on the use of model structures considering spatially distributed information on runoff processes in a hydrological model?
The new RGM which includes knowledge on runoff processes is expected to be advantageous over traditional RGMs in nested subcatchments (Antonetti et al., 2016a). The reason for this is that the calibration procedure for the common hydrological model is performed with data from the runoff gauge of the main catchment. Therefore, the second research question is the following:
-
Is it possible to increase skill in FF forecasting in nested subcatchments with the use of a process-based RGM which includes spatially distributed information on DRPs instead of using a traditional RGM relying on calibration in a forecasting chain?
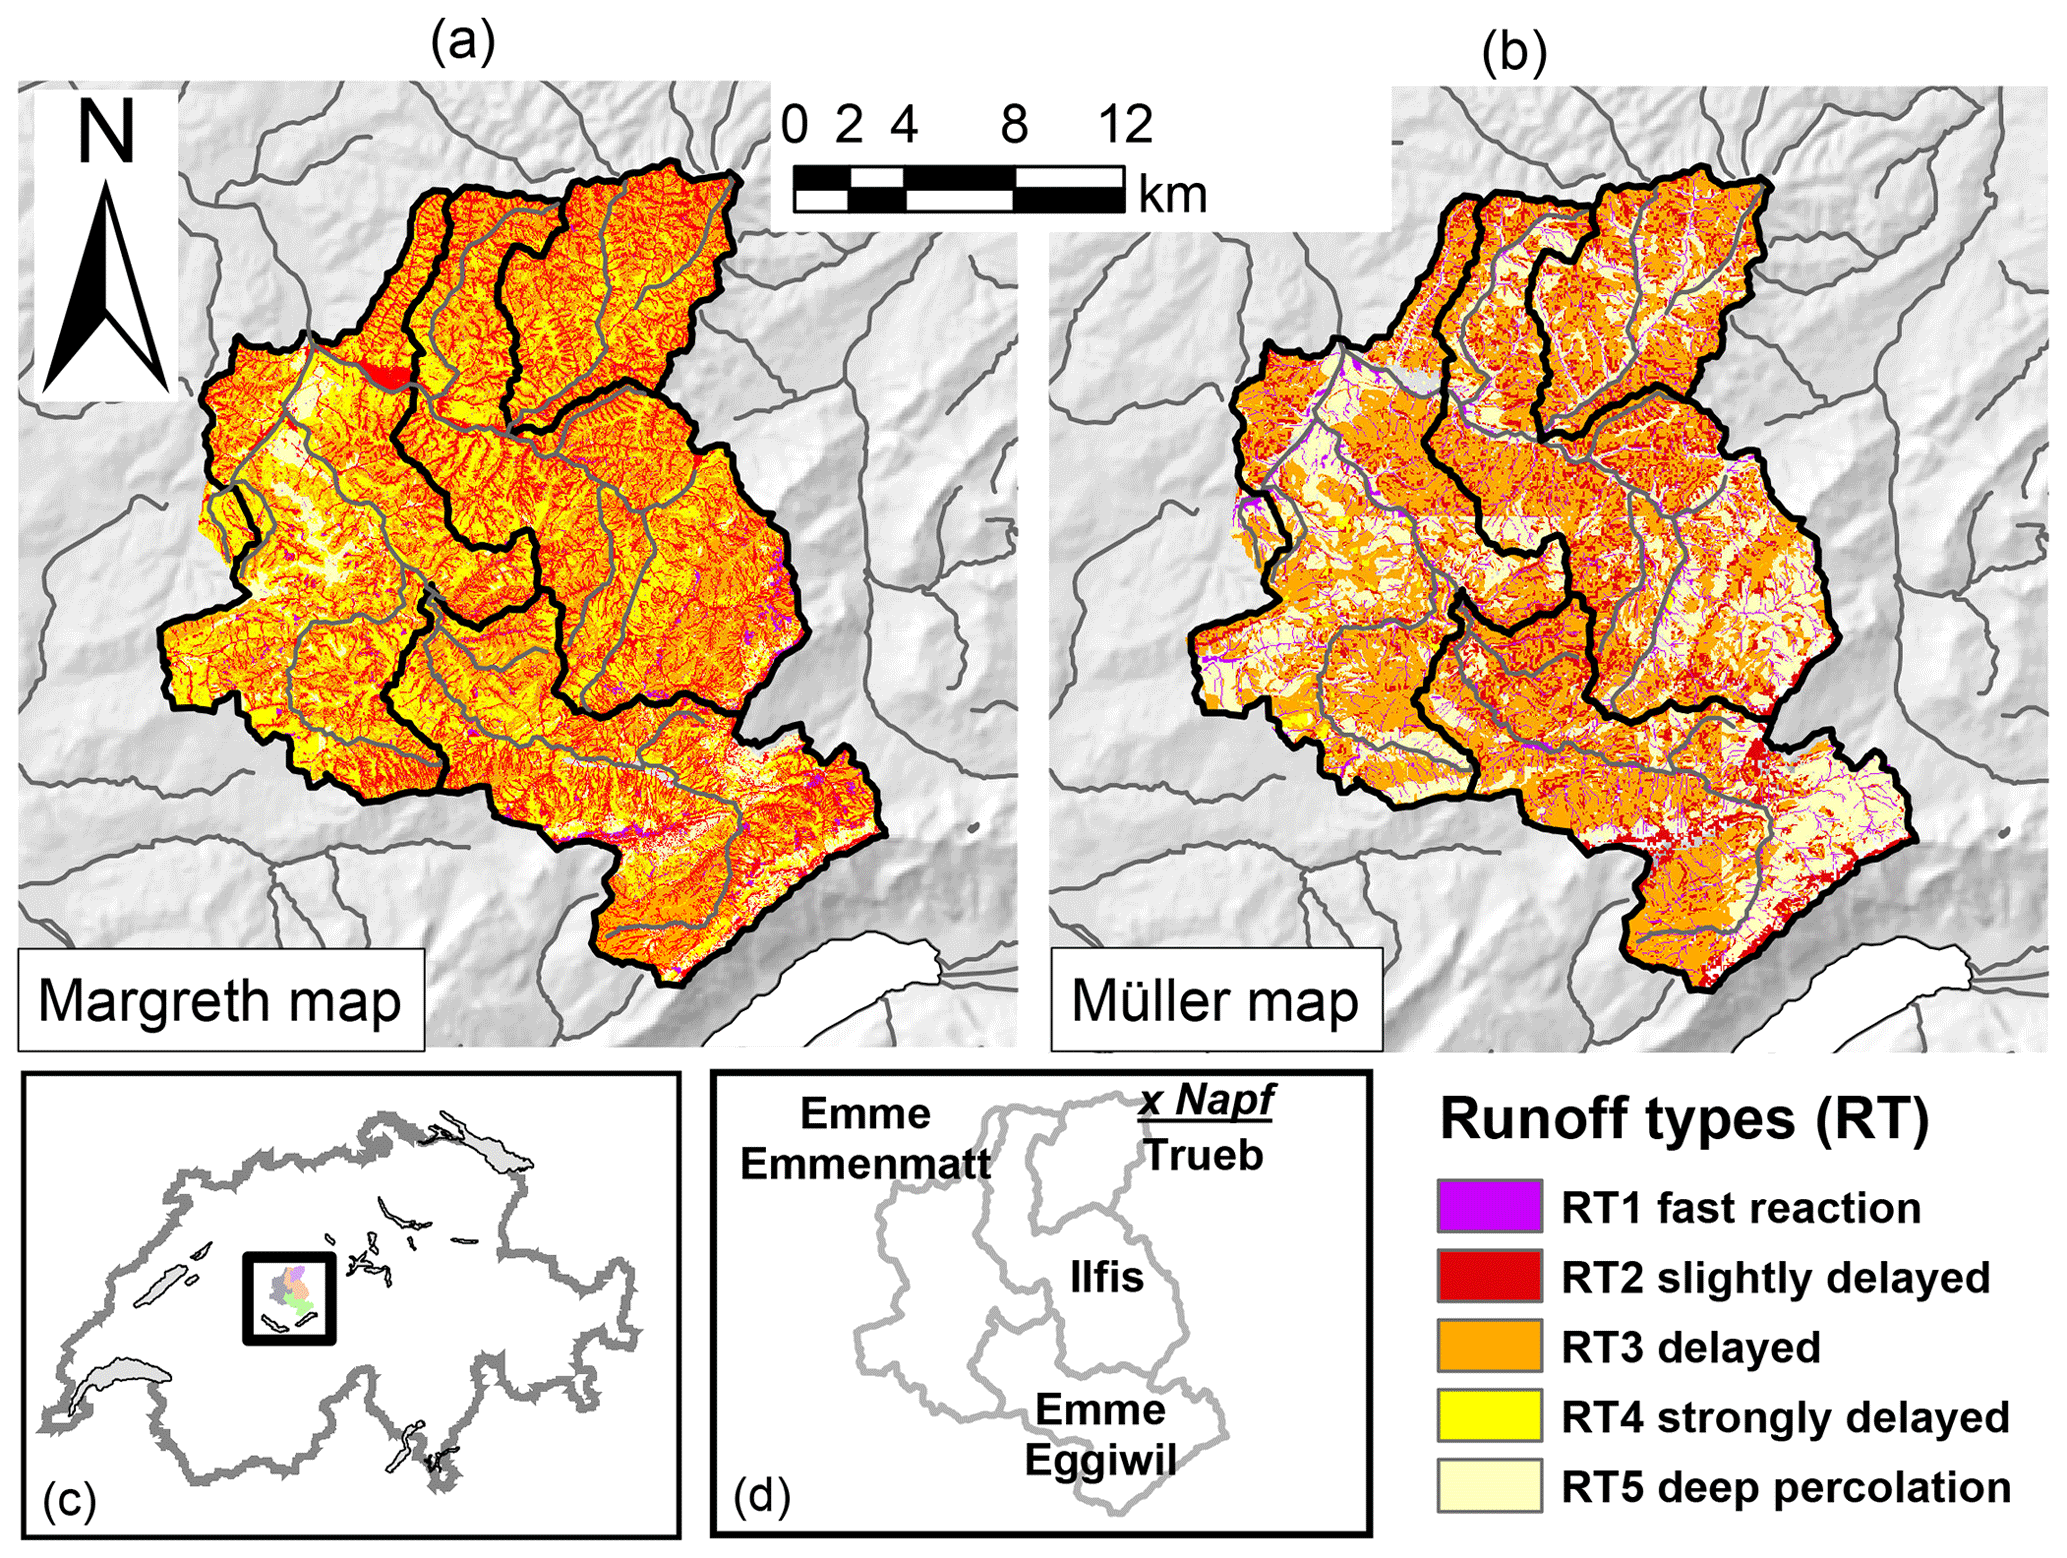
Figure 1Overview on the investigated Emme catchment. (a) a process map according to Margreth et al. (2010); (b) a process map according to Müller et al. (2009); (c) the location of the target area within Switzerland and (d) the situation of the nested sub-areas and location of the Napf meteorological station. GIS elements are reproduced by kind authorisation of swisstopo (JA022265), BFS GEOSTAT/BUWAL.
A forecasting chain with state-of-the-art meteorological and hydrological components is proposed and evaluated for the Swiss Emme catchment (see Sect. 2). The different components of the forecasting chains are described in Sect. 3. In Sect. 3.3, the skill assessment procedure used for this study is presented. To avoid large overlaps in the presentations of the methods, the Methods section of the present paper focusses on the hydrological component of the FF forecasting chain, whereas the companion paper (Horat et al., 2018) presents more information on the NWP models used, COSMO-E and COSMO-1, applies RGM-PRO in forecasting mode for the Verzasca catchment and compares its quality with our current operational model. The results are shown in Sect. 4 and are discussed in Sect. 5. In Sect. 6, conclusions are drawn.
2.1 Target area
The Emme catchment (445 km2), shown in Fig.1, is located in the Prealps and lies mainly in the Canton of Bern. It ranges from 560 to 2120 m a.s.l. The Trueb subcatchment (55 km2) is nested within the Ilfis subcatchment (184 km2), which is in turn nested within the main catchment, here also referred to as Emmenmatt. Another nested subcatchment of the main catchment is Eggiwil, which is 125 km2 in area. Considering land use, 4 % of the basin is covered by settlements, 52 % by pasture and 44 % by forest. In the catchment, a geological sequence of Upper Freshwater Molasse, Upper Marine Molasse, Lower Freshwater Molasse, Flysch and limestone is present. For a more detailed description of the study area, we refer to Antonetti and Zappa (2018).
Runoff measurements at hourly resolution for comparison with simulations were provided by the Swiss Federal Office for Environment (FOEN) for the Emmenmatt, Eggiwil and Ilfis catchments. For the Trueb catchment, measurements from the Bau-, Verkehrs- und Energiedirektion of the Canton of Bern were available. For the evaluation of hindcasts, only four events are investigated as runoff data are not available from 2005 to 2010 for the Trueb catchment.
2.2 Meteorological forcing
Accurate precipitation estimation is a demanding task. Rain gauges provide relatively accurate precipitation measurements on the ground, but their spatial representativeness may be low depending on the aggregation used and the type of weather. Moreover, rain gauge networks can only cover large regions sparsely; therefore important features of the precipitation field may be missed, since rainfall is typically characterised by high spatio-temporal variability (Liechti et al., 2013; Sideris et al., 2014). Radar precipitation estimates cover large regions densely, but these estimates are essentially mean values for grid cells with a resolution of 1 km2 × 1 km2. Moreover, such estimates are subject to complex errors generated through the chain of processes of signal transmission, hydrometeors' backscattered signal detection and their eventual transformation into units that characterise precipitation water (Germann et al., 2006).
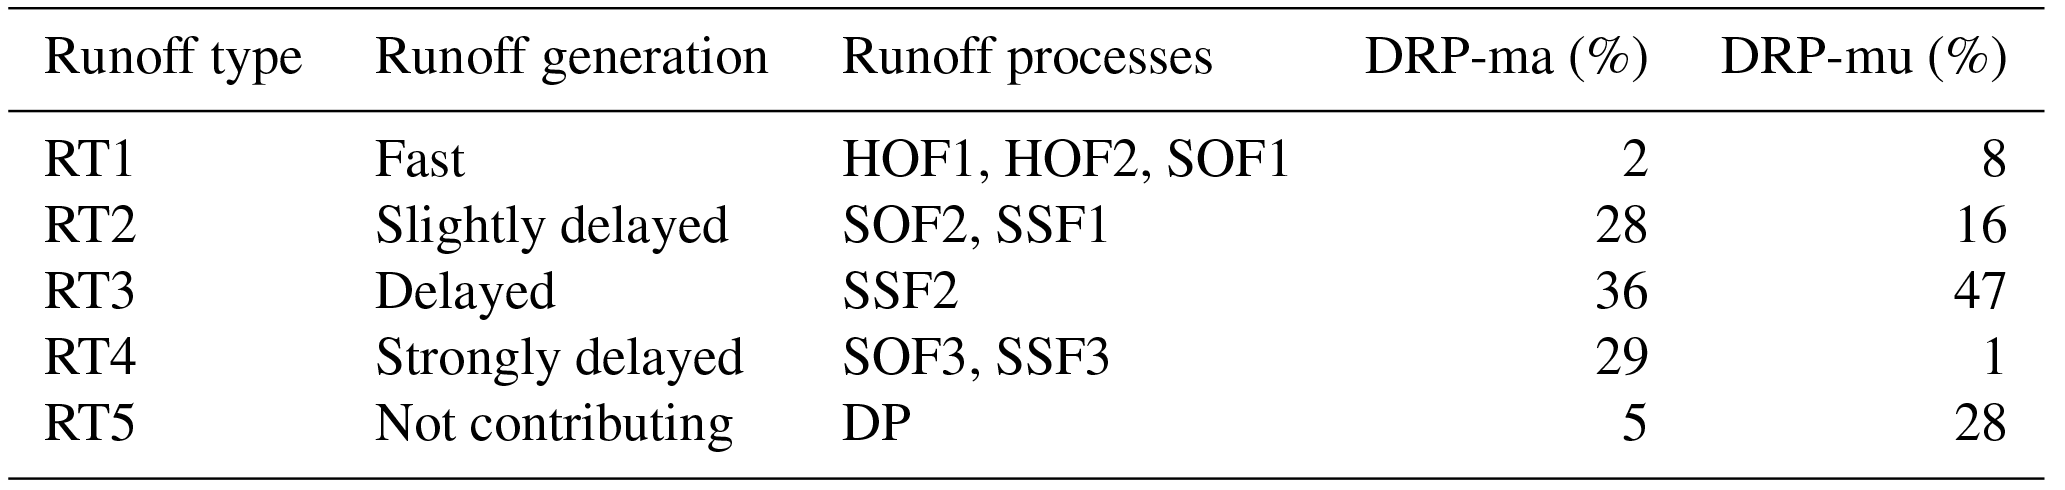
Table 2Attribution of DRPs to RTs. Nomenclature of the DRPs is as follows: HOF is Hortonian overland flow, SOF is saturation overland flow, SSF is subsurface flow and DP is deep percolation. The suffix 1 is attributed to landscapes showing an immediate reaction in terms of runoff generation. The suffixes 2 and 3 denote delayed and strongly delayed reactions, respectively. Sources: Scherrer and Naef (2003) and Antonetti and Zappa (2018). The portion of RT in the maps of Margreth (DRP-ma) and Müller (DRP-mu) is given for the whole target area up to Emmenmatt.
The combination of radar and rain gauge precipitation estimates (CombiPrecip) is in essence a localised adjustment of the radar field using the rain gauge measurements. Such techniques typically involve geostatistics and produce as an output an optimal field which is unbiased in comparison with the existing rain gauge measurements. It also maintains the underlying spatial structure associated with the radar rainfall observation. CombiPrecip is a technique developed by the Swiss Federal Office of Meteorology and Climatology, MeteoSwiss, which relies on spatio-temporal geostatistics to produce this adjustment (Sideris et al., 2014). Information on hourly rainfall at ground stations is blended with the weather radar signal. With respect to the target area, the most representative rain station used in the blending is the one on the “Napf” (Fig. 1). CombiPrecip has been used in this study in order to force the event-based runoff generation modules with gridded precipitation for the selected events. Retrospective CombiPrecip data are available for the period 2005 to 2013. The data used here have been collected and archived during real-time operations of systems developed by WSL.
As future rainfall input, quantitative precipitation forecasts were used from NWP models by MeteoSwiss, namely COSMO-E and COSMO-1, and were processed as in Addor et al. (2011). COSMO-1 has a grid spacing of 1.1 km and runs as deterministic model with initialisations every 3 h. Lead time is 33 h except for the 03:00 UTC run, for which a 45 h forecast is available. COSMO-E is an ensemble prediction system with 2.2 km grid spacing, two initialisations each day and a lead time of 120 h. Both COSMO-E and COSMO-1 are available for only one season and there is no prior experience in applying these models in a forecasting chain. A recent evaluation of COSMO-E is presented in Klasa et al. (2018), while its configuration can be found by accessing the MeteoSwiss web page (MeteoSwiss, 2018).
3.1 Process-based modelling with RGM-PRO
3.1.1 Mapping dominant runoff processes
Information on the spatial distribution of runoff processes in a catchment can be visualised in maps of runoff types (RTs; e.g. Schmocker-Fackel et al., 2007). Such maps are necessary for RGM-PRO simulations and can be generated in various ways. For identification of the DRPs at the plot scale, Scherrer and Naef (2003) developed a decision scheme based on the possible flow paths of water on temperate grassland. In each vertical soil compartment – from the surface to underlying geology – the flow process is determined by critical factors. These can be, for instance, the vegetation cover for the surface compartment, macropores for the topsoil, lateral preferential pathways for the subsoil and permeability for the geological underground. At the end of each possible path through the system, the occurring DRP is identified. For other land use types such as arable land or forest, different decision schemes are used. In order to upscale the DRPs from the plot to the catchment scale, Schmocker-Fackel et al. (2007) developed a simplified method relying on a soil map and a high-resolution digital terrain model (2 m × 2 m) in a GIS environment. During the upscaling, the DRPs are reclassified into RTs according to Table 2 (Antonetti et al., 2016a, 2017). In regions where soil data are absent, a relatively time-consuming soil model based on expert knowledge was used (Margreth et al., 2010). Maps of RTs generated with this methodology are referred to as Margreth maps and were already used, for instance, in Antonetti et al. (2016a, 2017). A simpler upscaling approach with less involvement of expert knowledge was proposed by Müller et al. (2009), and the resulting maps are onwards referred to as Müller maps. The method of Müller et al. (2009) relies on a digital terrain model at lower resolution than Margreth maps (25 m × 25 m in this application), a geological map and a land use map. It assumes that mainly slope and permeability of the geological substratum determine DRPs, whereby information about soil characteristics is not needed. The geological substratum is classified into permeable and impermeable, land use data into grassland, arable land and forest and slope into five categories. For any land use class and slope, regions with a permeable substratum are classified as having deep percolation, i.e. RT5. DRPs for impermeable geology depend on a combination of land use and slope category (Müller et al., 2009).
For the Emme region, a Margreth map from SoilCom GmbH was available and used for this study (Fig. 1a). In addition, a map of RTs with the approach of Müller et al. (2009) was derived (Fig. 1b).
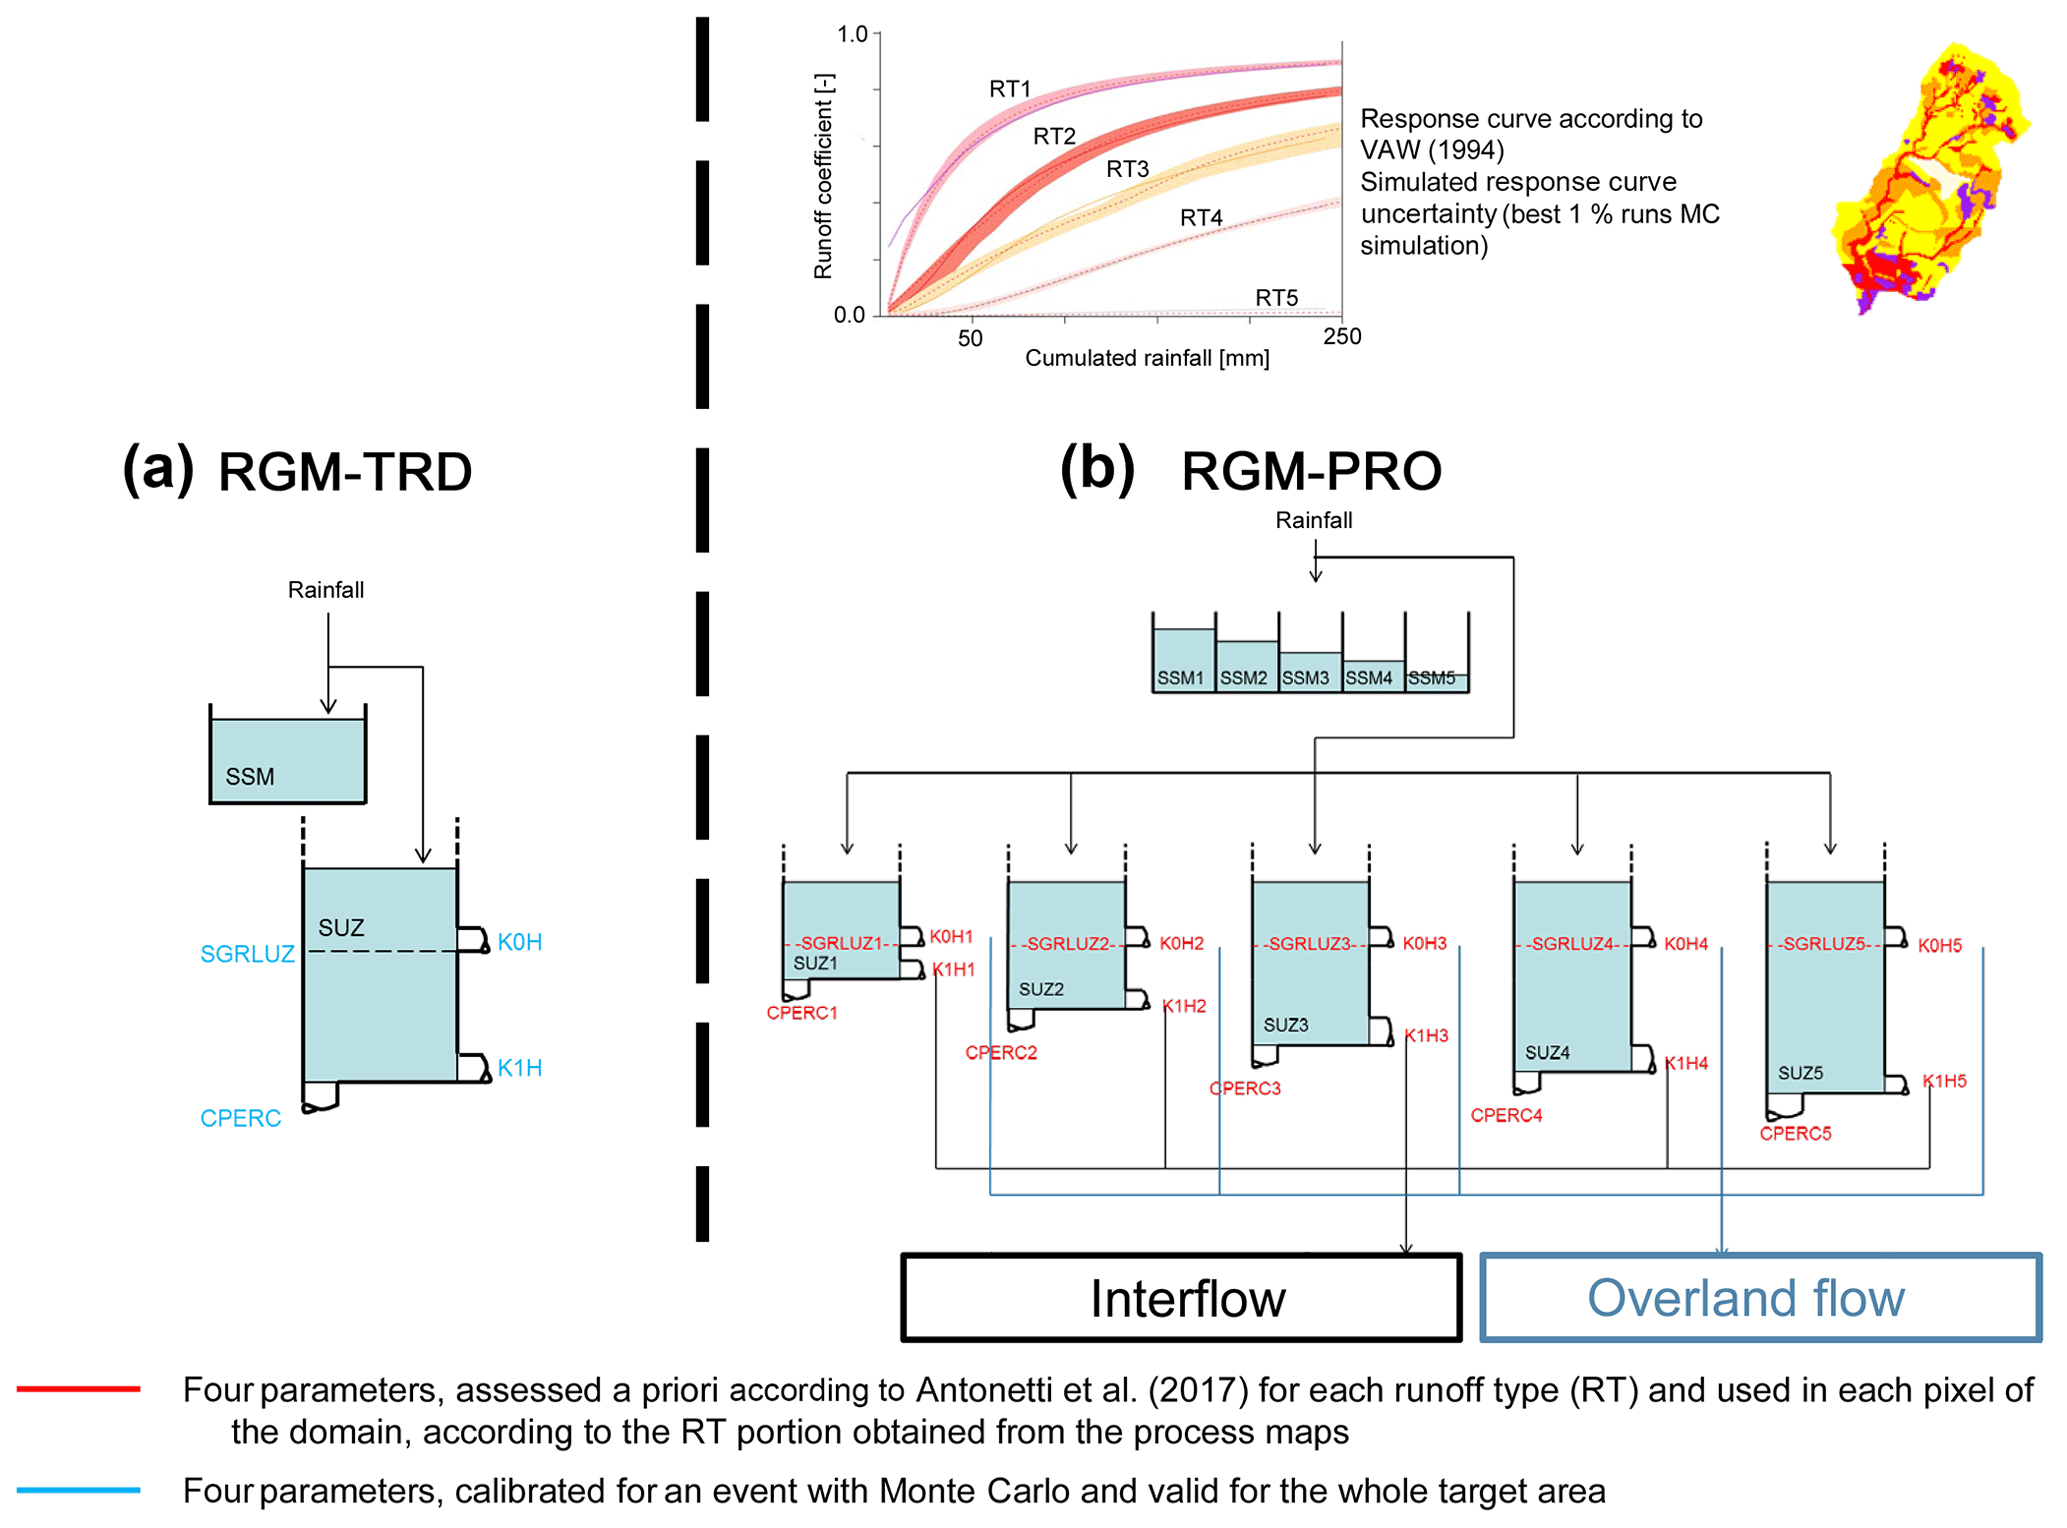
Figure 2Structure of the adopted RGMs. (a) RGM-TRD module from the traditional PREVAH model, with four parameters requiring calibration (Gurtz et al., 2003) and validity for the whole target area. b RGM-PRO module using typical infiltration curves for a priori estimation of four parameters for five runoff types (Table 2) according to Antonetti et al. (2017) and Antonetti et al. (2016b). RTs are obtained from process maps (Fig. 1).
Antonetti et al. (2016a) compared the similarity of various DRP mapping approaches including a high to low amount of expert knowledge in the Meilen and the Reppisch catchments on the Swiss Plateau. A manually derived map according to Scherrer and Naef (2003) served as reference. Furthermore, they performed synthetic runoff simulations in order to assess the sensitivity of the hydrograph to the mapping approach. Antonetti et al. (2016a) found that the simulations with the most complex automatic mapping approach, i.e. Schmocker-Fackel et al. (2007), produced the most similar results when compared with the reference. In contrast, simulations following the simplified schemes lead to the strongest deviations.
Here we evaluate the role of maps in another region and focus on the role of mapping approaches in flood predictions in an operational set-up.
3.1.2 Structure and a priori parametrisations
RGM-PRO is a stand-alone runoff generation module and in many terms a spin-off of the traditional module of the PREVAH hydrological model (Viviroli et al., 2009). It integrates knowledge on runoff generation mechanisms as elaborated in Antonetti and Zappa (2018). A comparison of the traditional structure of the PREVAH module (RGM-TRD) with RGM-PRO is shown in Fig. 2. RGM-PRO uses information contained in maps of RTs (Fig. 2b), which are based on the classification of DRPs (Table 2; Scherrer and Naef, 2003). The parameter values of RGM-PRO are determined a priori for each RT by re-simulating sprinkler experiments (Kienzler and Naef, 2008; Scherrer et al., 2007, Fig. 2a). With this approach, RGM-PRO can avoid classic calibration against runoff observations, which allows the application in areas where no measurements are available. Therefore, it is more advantageous having five parameters that can be obtained a priori than one parameter for which calibration is needed. The meaning of the RGM-PRO parameters in Fig. 2 is presented in Table 3. For a detailed description of the model, please refer to Antonetti et al. (2017).
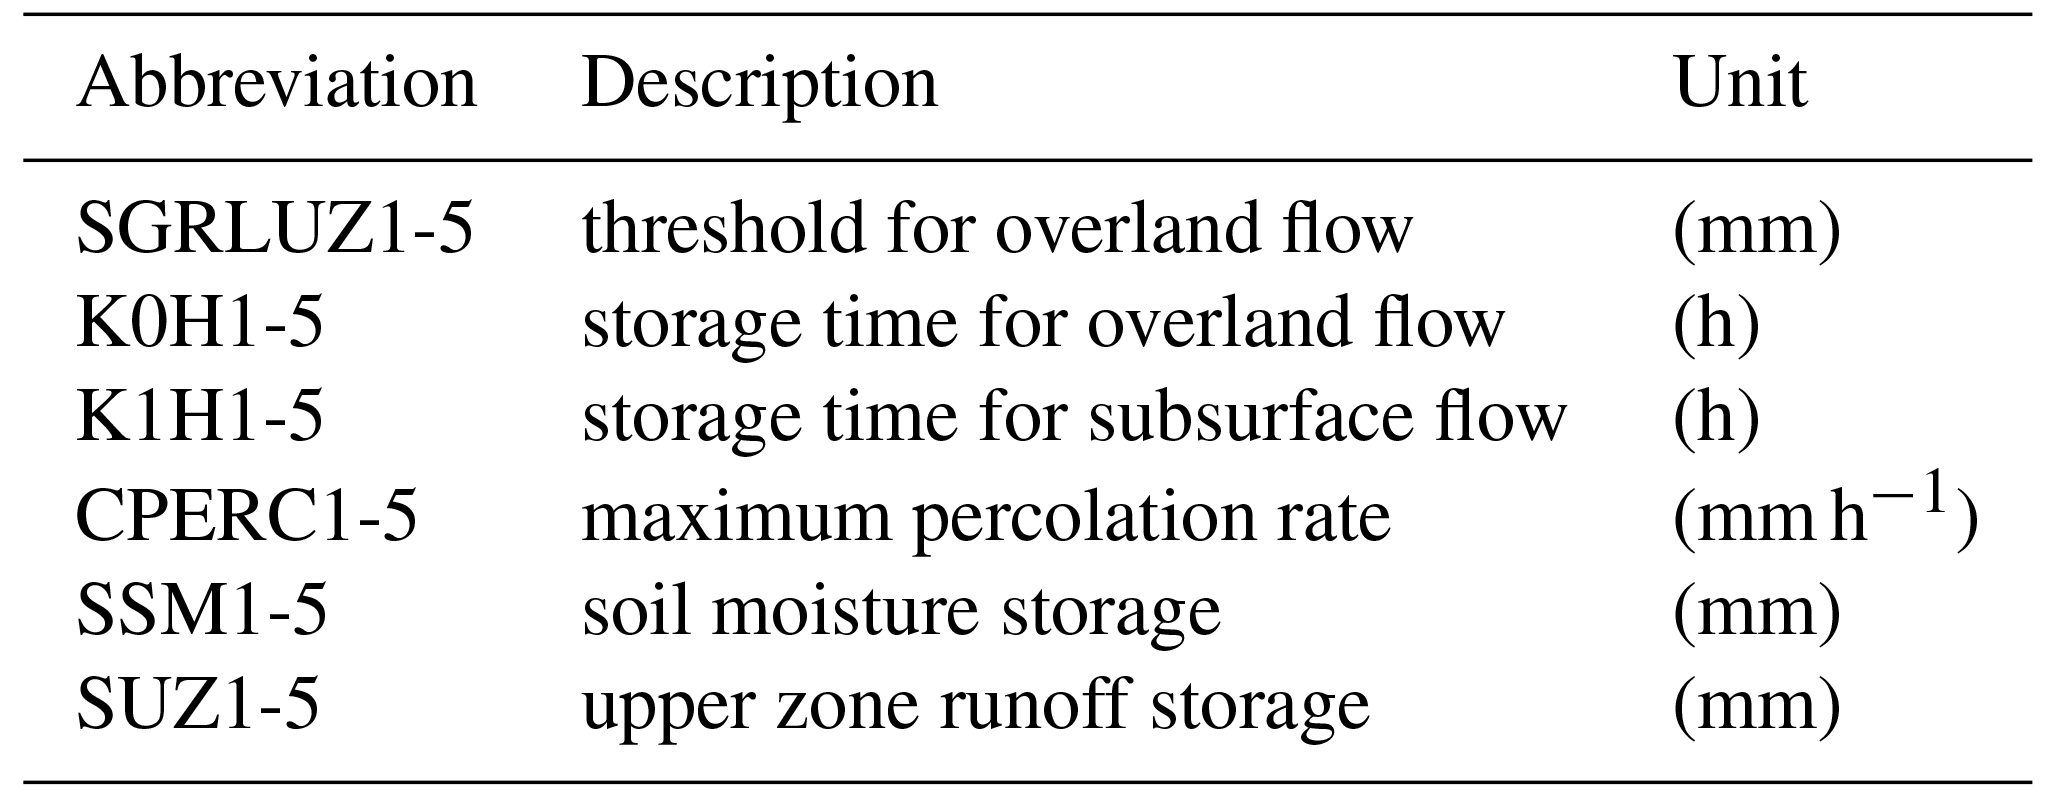
Table 3Description of parameters for RGM-PRO. All parameters have indices for RTs from 1 to 5.
RGM-PRO runs at a spatial resolution of 500 m and a temporal resolution of 1 h and requires gridded precipitation input. Maps of RT are available at higher spatial resolution (25 m2 × 25 m2) and used to obtain a sub-grid parametrisation of RGM-PRO. Specifically, for each 500 m2 × 500 m2 cell the percentage of each RT is taken into account (Antonetti et al., 2017). RGM-PRO is an event-based model and soil moisture data are needed for initialisation. For this, an operationally available gridded input from PREVAH at a spatial resolution of 500 m2 × 500 m2 was used. This PREVAH version coincided with the one used for real-time assessment of drought in Switzerland (Jörg-Hess et al., 2015; Zappa et al., 2014). Subsequently, soil moisture data were downscaled to a resolution of 25 m according to Blöschl et al. (2009). With this method, the map of RTs serves as a fingerprint since it contains information determining the spatial variability of soil moisture (Antonetti and Zappa, 2018).
3.1.3 Traditional benchmark version with conventional hydrological runoff generation module
For comparison, a forecasting chain with the traditional structure (RGM-TRD) was set up. Ideally RGM-TRD needs to be calibrated and validated against several observed flood events. In this application we decided to calibrate for one single event, the largest runoff event measured at Emmenmatt gauge in 2016, which occurred on the 14 May. We choose this approach in order to evaluate a set-up with minimum requirements concerning observed discharge. This should show the potential of the RGM-TRD approach, when a single measurement campaign is available, as discussed for example in Pool et al. (2017).The calibrated parameter set, valid for the whole target area, finally resulted from the 10 runs with the highest Kling–Gupta efficiency (KGE; see Sect. 3.3) out of 4000 Monte Carlo simulations, as conducted also for the study by Antonetti and Zappa (2018).

Figure 3Scheme of the FF forecasting chains in the Emme catchments investigated in this paper, with the key indicated on the right-hand side. On the left-hand side, P.I. stands for precipitation input, H.M. for hydrological model and S.D. for soil moisture data. “5 d min. runoff” represents the minimum observed runoff in the last 5 days prior to the forecast.
3.2 Overview of completed experiments
The experimental set-up for the Emme areas is displayed in Fig. 3. Two forecasting chains with RGM-PRO were set up based on Müller maps (DRP-mu-C1 and DRP-mu-CE) and two based on Margreth maps (DRP-ma-C1 and DRP-ma-CE). Comparison of these will show possible advantages of including a high amount of expert knowledge in the map of RTs for forecasting purposes. In addition, two chains were built with the calibrated RGM-TRD, namely PRE-C-C1 and PRE-C-CE. Comparison of RGM-PRO-based chains with the ones based on the calibrated PREVAH indicates whether a hydrological model integrating knowledge on DRPs can compete with a calibrated one in a forecast mode. The outcomes of the Monte Carlo experiment have been used to evaluate RGM-PRO and RGM-TRD for past events in the Emme area. All forecasting chains relied on model initialisation with CombiPrecip and soil moisture data from PREVAH simulations. Furthermore, for all forecasting chains, start of the simulation was at the moment in time with minimum observed runoff in the last 5 days prior to the forecast.
Our investigation period was restricted to May until July 2016. The reason for this is that the NWPs from the new COSMO-E and COSMO-1 models have only been available since March 2016. The prior models COSMO-LEPS and COSMO-2 (e.g. Zappa et al., 2008) were dismissed in September 2016 and will not be available for future operational deployment. A comparison between the prior and new NWP models is outside the scope of this study.
The strength of the approach presented in this study including the new RGM is that it does not require calibration. Although it is of advantage having an ensemble in hydrological initial conditions (Liechti et al., 2013), the use of probabilistic nowcasting tools to treat this kind of uncertainty is renounced. This seems justified as spread decays within the first 48 h (Zappa et al., 2011) and this study aims to have a system in operational mode. Furthermore, uncertainty due to the hydrological model structure is not addressed here. Studies on this topic have been presented by Seiller et al. (2017) and Perrin et al. (2001).
3.3 Data analysis
For the verification of deterministic forecasts for continuous predictands, the Nash–Sutcliffe efficiency (NSE) was computed (Nash and Sutcliffe, 1970). As a precursor of NSE, the mean squared error (MSE; Eq. 1) was calculated as the arithmetic average of the squared difference of the forecast-observation pairs.
The NSE is then obtained by calculating the skill score of the MSE, given in Eq. (2). A skill score describes the improvement of a specific forecast over a reference forecast, where the mean runoff during the events served as a reference forecast, shown in Eq. (3).
with
In addition, with Eq. (4) the Kling–Gupta efficiency (KGE) was computed (Gupta et al., 2009), which is a decomposition of NSE into a linear correlation (r), a bias (β) and a variability of flow component (α).
The perfect value of NSE and KGE is 1, and positive values indicate improvement compared with a reference forecast.
For deterministic and probabilistic forecasts, the Brier score (BS; Eq. 6) and the Brier skill score (BSS; Eq. 5) were computed. As these scores evaluate dichotomous predictands, a quantile of hourly runoff climatology from May to July 2016 served to distinguish between events and non-events. A value of zero for BS and a value of 1 for BSS are achieved by a perfect forecast. For BSS, the mean runoff from May to July 2016 served as a reference forecast (Eq. 7):
with
and
For the ensemble predictions, the area under the receiver operating characteristics (ROCa) was computed, which is a well-suited measure to establish a synthesis across methods and lead times. Furthermore, with ROCa, the utility of a prediction system for end users can be assessed. According to Buizza et al. (1999), a ROCa value of 0.7 is the minimum value useful for decision makers. ROCa is used here to summarise the outcomes also presented in the Supplement. A matrix is compiled to visualise which of the used chains is performing best. In general, the verification of hydrological ensemble predictions accounts for the recommendations issued by Brown et al. (2010) and used in previous applications (Addor et al., 2011; Liechti et al., 2013).
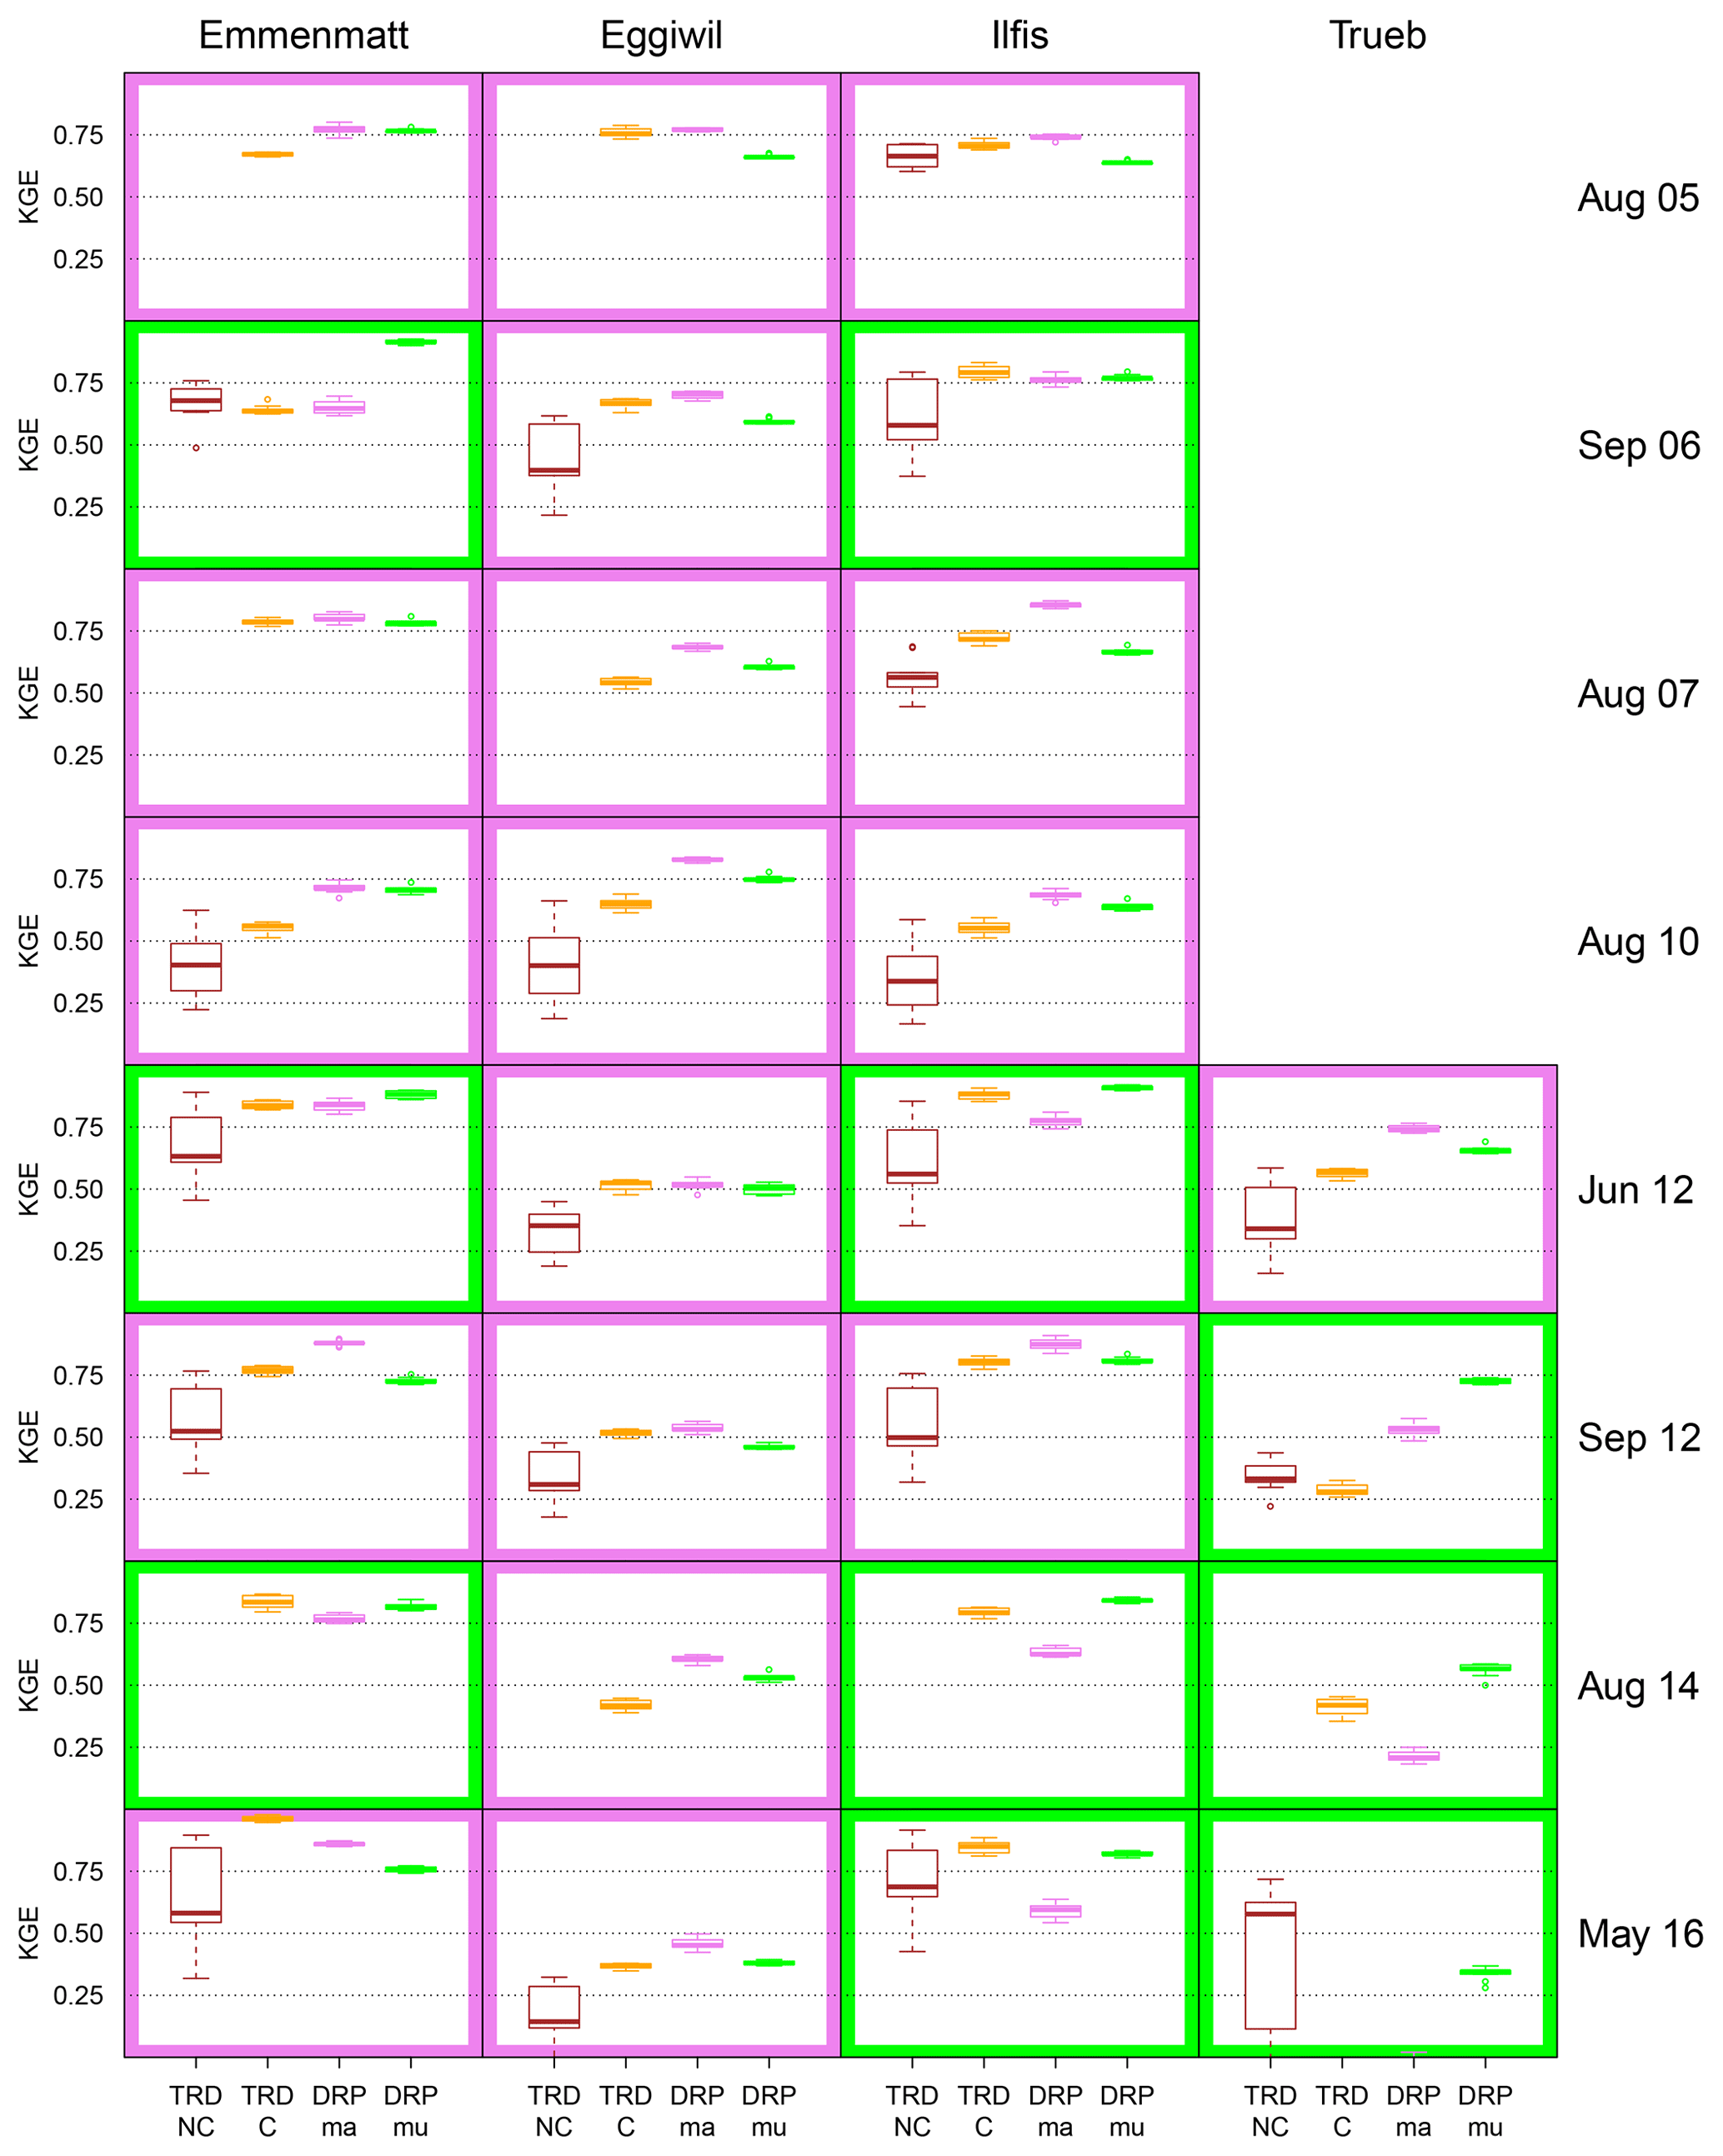
Figure 4Re-analysis of eight large runoff events from 2005 to 2016 with CombiPrecip data in the four Emme catchments. The box plots represent the simulation results of the different model configurations. TRD-NC stands for uncalibrated PREVAH, TRD-C for calibrated PREVAH, DRP-ma for RGM-PRO relying on Margreth maps and DRP-mu for RGM-PRO based on Müller maps. The border colour reveals whether DRP-ma (pink) or DRP-mu (light green) performed better in terms of median KGE. Where no box plot is visible, all KGE values were below zero. The spread in KGE of uncalibrated PREVAH results from 10 random hydrological parameter sets out of 4000 Monte Carlo simulations, whereas uncertainty from calibrated PREVAH originates from the 10 parameter sets with highest KGE for the May 2016 event in Emmenmatt. The spread in RGM-PRO arises from simulations with 10 hydrological parameter sets lying in narrow ranges determined by sprinkler experiments (Antonetti et al., 2017).
4.1 Evaluation of hindcasts
For eight large runoff events from 2005 to 2016 and using the configuration and evaluation strategy described in Antonetti et al. (2017), we compared the performance of uncalibrated (TRD-NC) and calibrated (TRD-C) PREVAH and RGM-PRO with Margreth (DRP-ma) and Müller maps (DRP-mu) when forced exclusively with CombiPrecip data (Fig. 4). A calibration was completed as stated in Sect. 3.1.3 for the Emmenmatt gauge; the results for the nested Ilfis, Eggiwil and Trueb catchments represent an internal verification.
For a comparison of the mapping approaches for RGM-PRO, the coloured border in Fig. 4 defines whether DRP-ma (pink) or DRP-mu (light green) performs better in terms of median KGE. It reveals that DRP-ma outperforms DRP-mu in 18 out of 28 cases. However, when not considering the Eggiwil catchment, the two models perform best exactly an equal number of times, i.e. 10 out of 20 cases.
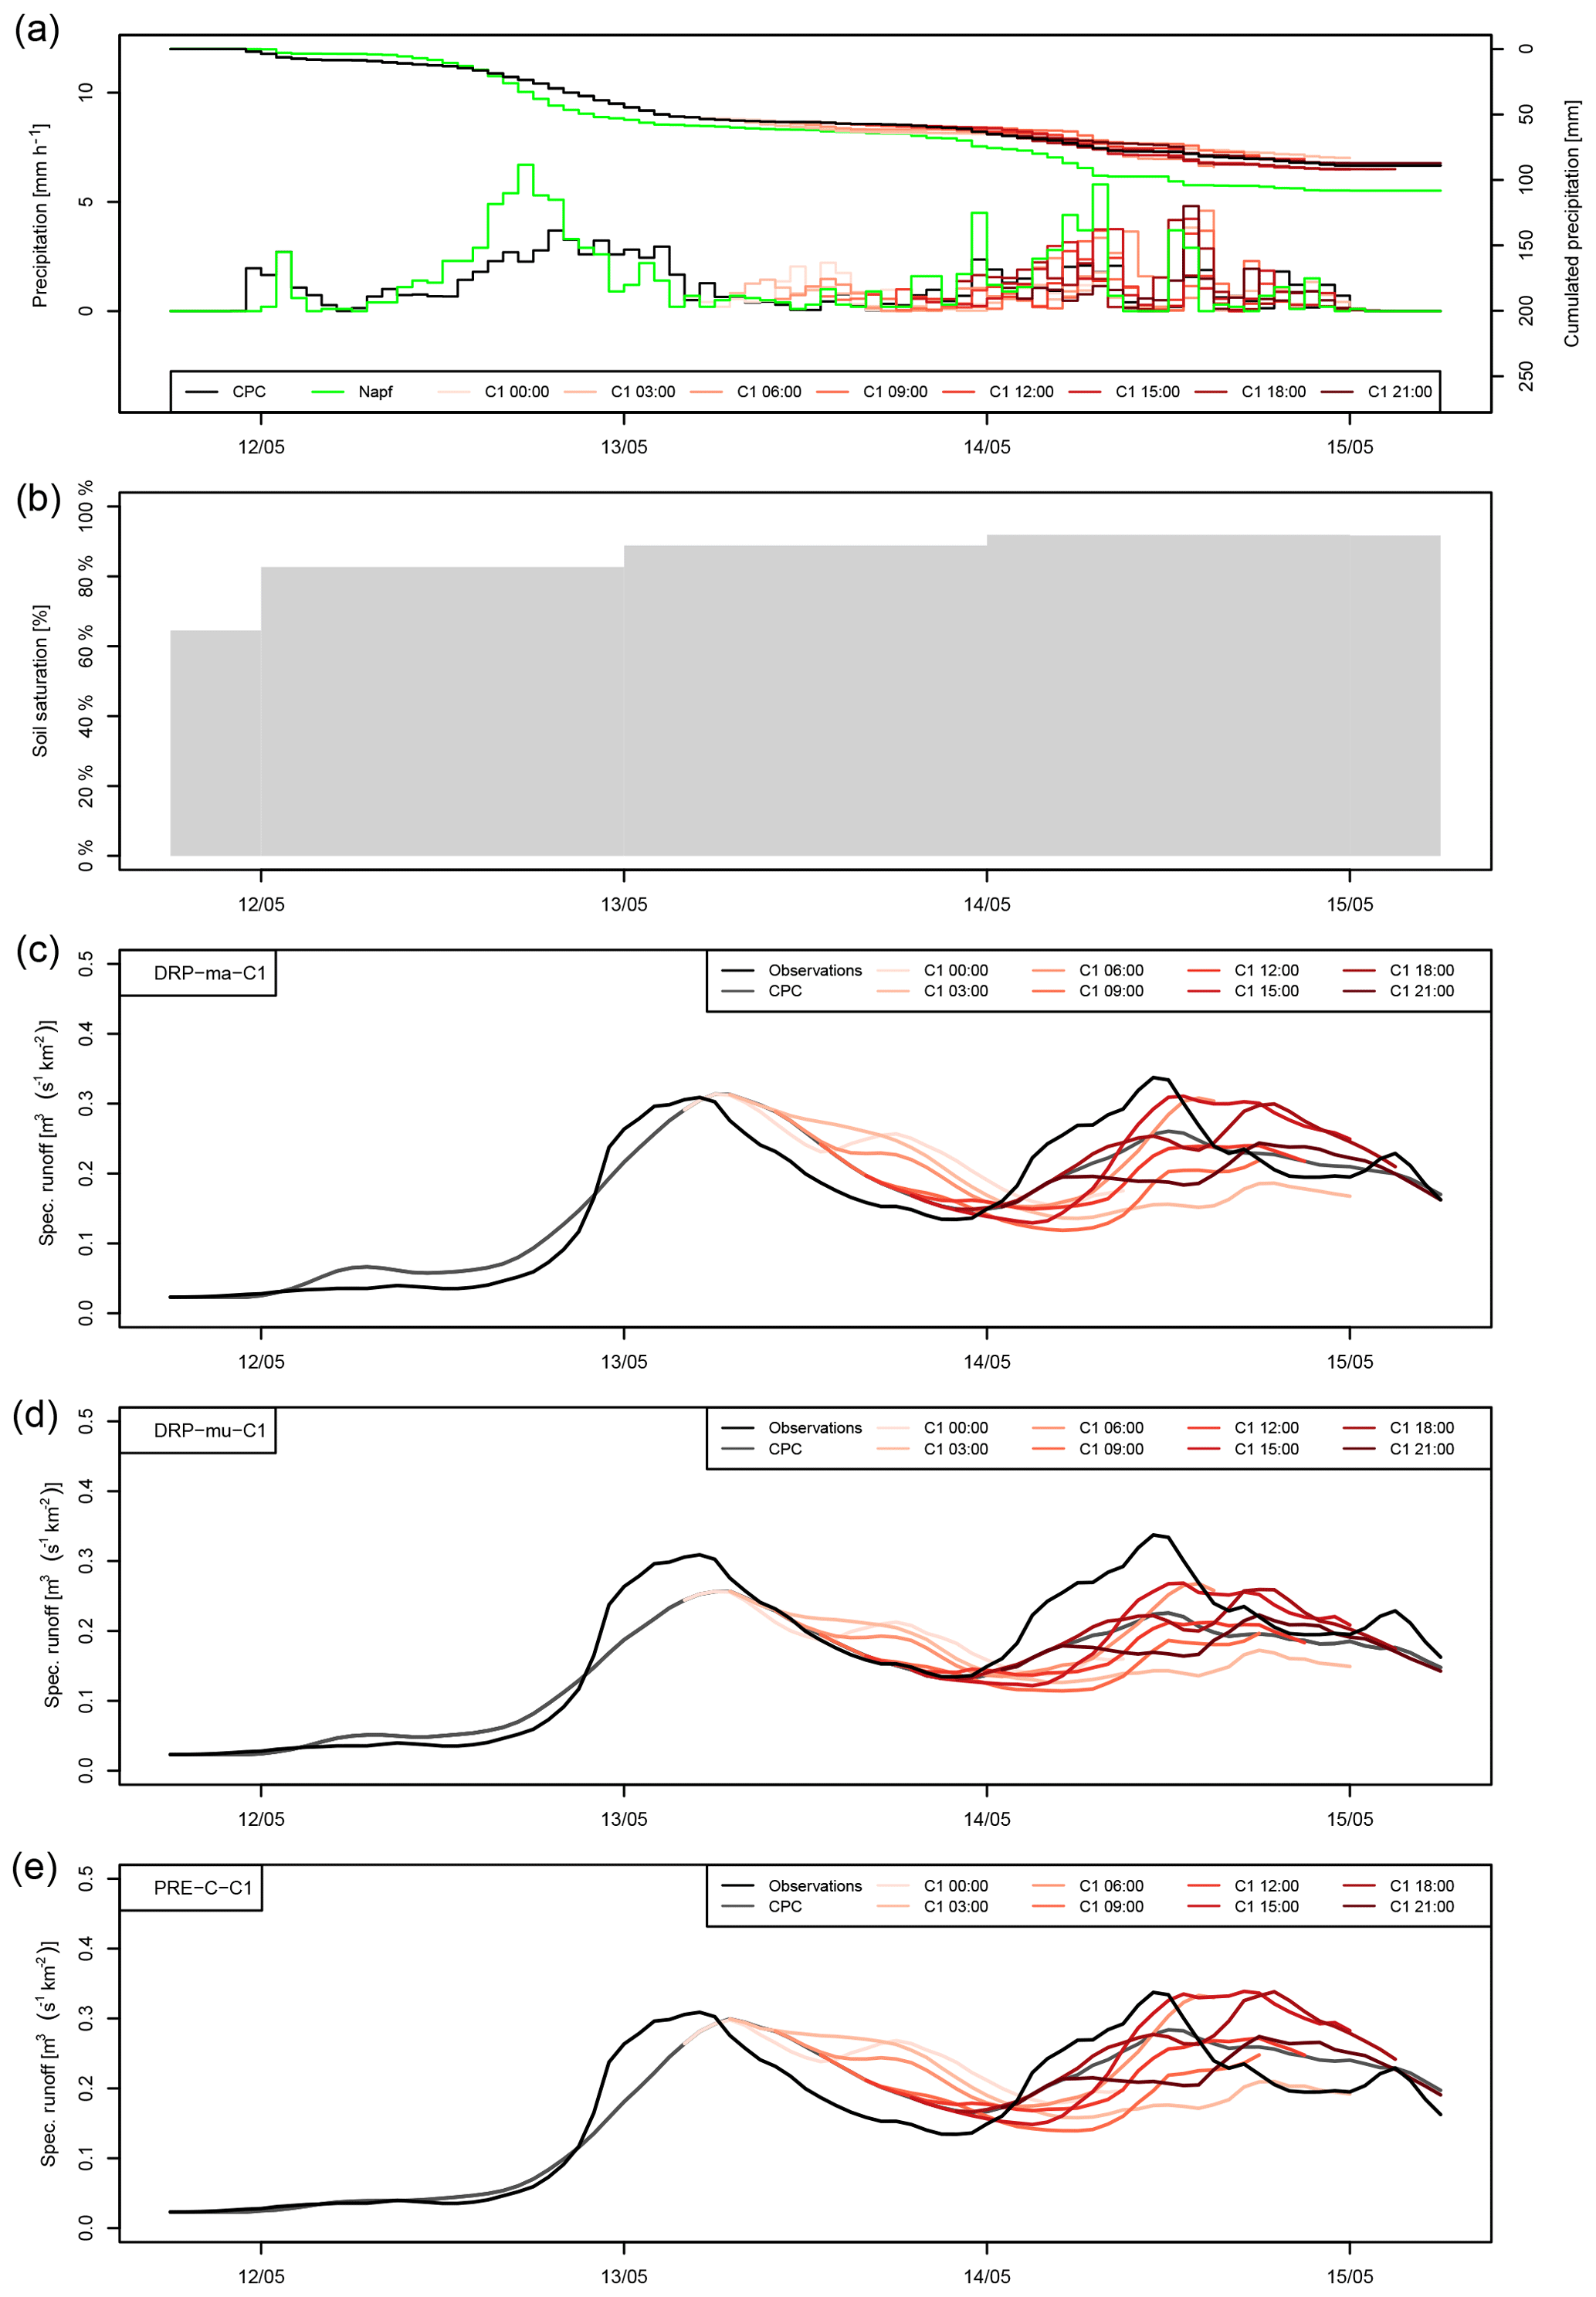
Figure 5Flood predictions with (c) DRP-ma-C1, (d) DRP-mu-C1 and (e) PRE-C-C1 for Emmenmatt with eight initialisations each on the alert date of 13 May 2016. Catchment precipitation predictions from COSMO-1 and measurements from the Napf station and CombiPrecip (both provided by MeteoSwiss) are depicted in (a), and evolution of soil moisture from PREVAH simulations is depicted in (b).

Figure 6Probabilistic forecasts for the Emmenmatt catchment with a switch to the forecast mode on 12 May at 19:00 for (a) DRP-ma-CE, (b) DRP-mu-CE and (c) PRE-C-CE.
Considering uncalibrated and calibrated PREVAH as well demonstrates that TRD-NC is worst in terms of KGE in by far the most cases. In addition, uncertainty is always largest. Comparing calibrated PREVAH with RGM-PRO approaches indicates that TRD-C is better than both DRP-ma and DRP-mu in only 5 out of 28 times. However, performance of the three last-mentioned models is comparable and highly dependent on the event–catchment combination. In the Trueb basin, DRP-mu seems to be preferred over DRP-ma and the DRP-based approaches over the calibrated PREVAH. However, there are only four events as runoff data are not available from 2005 to 2010.
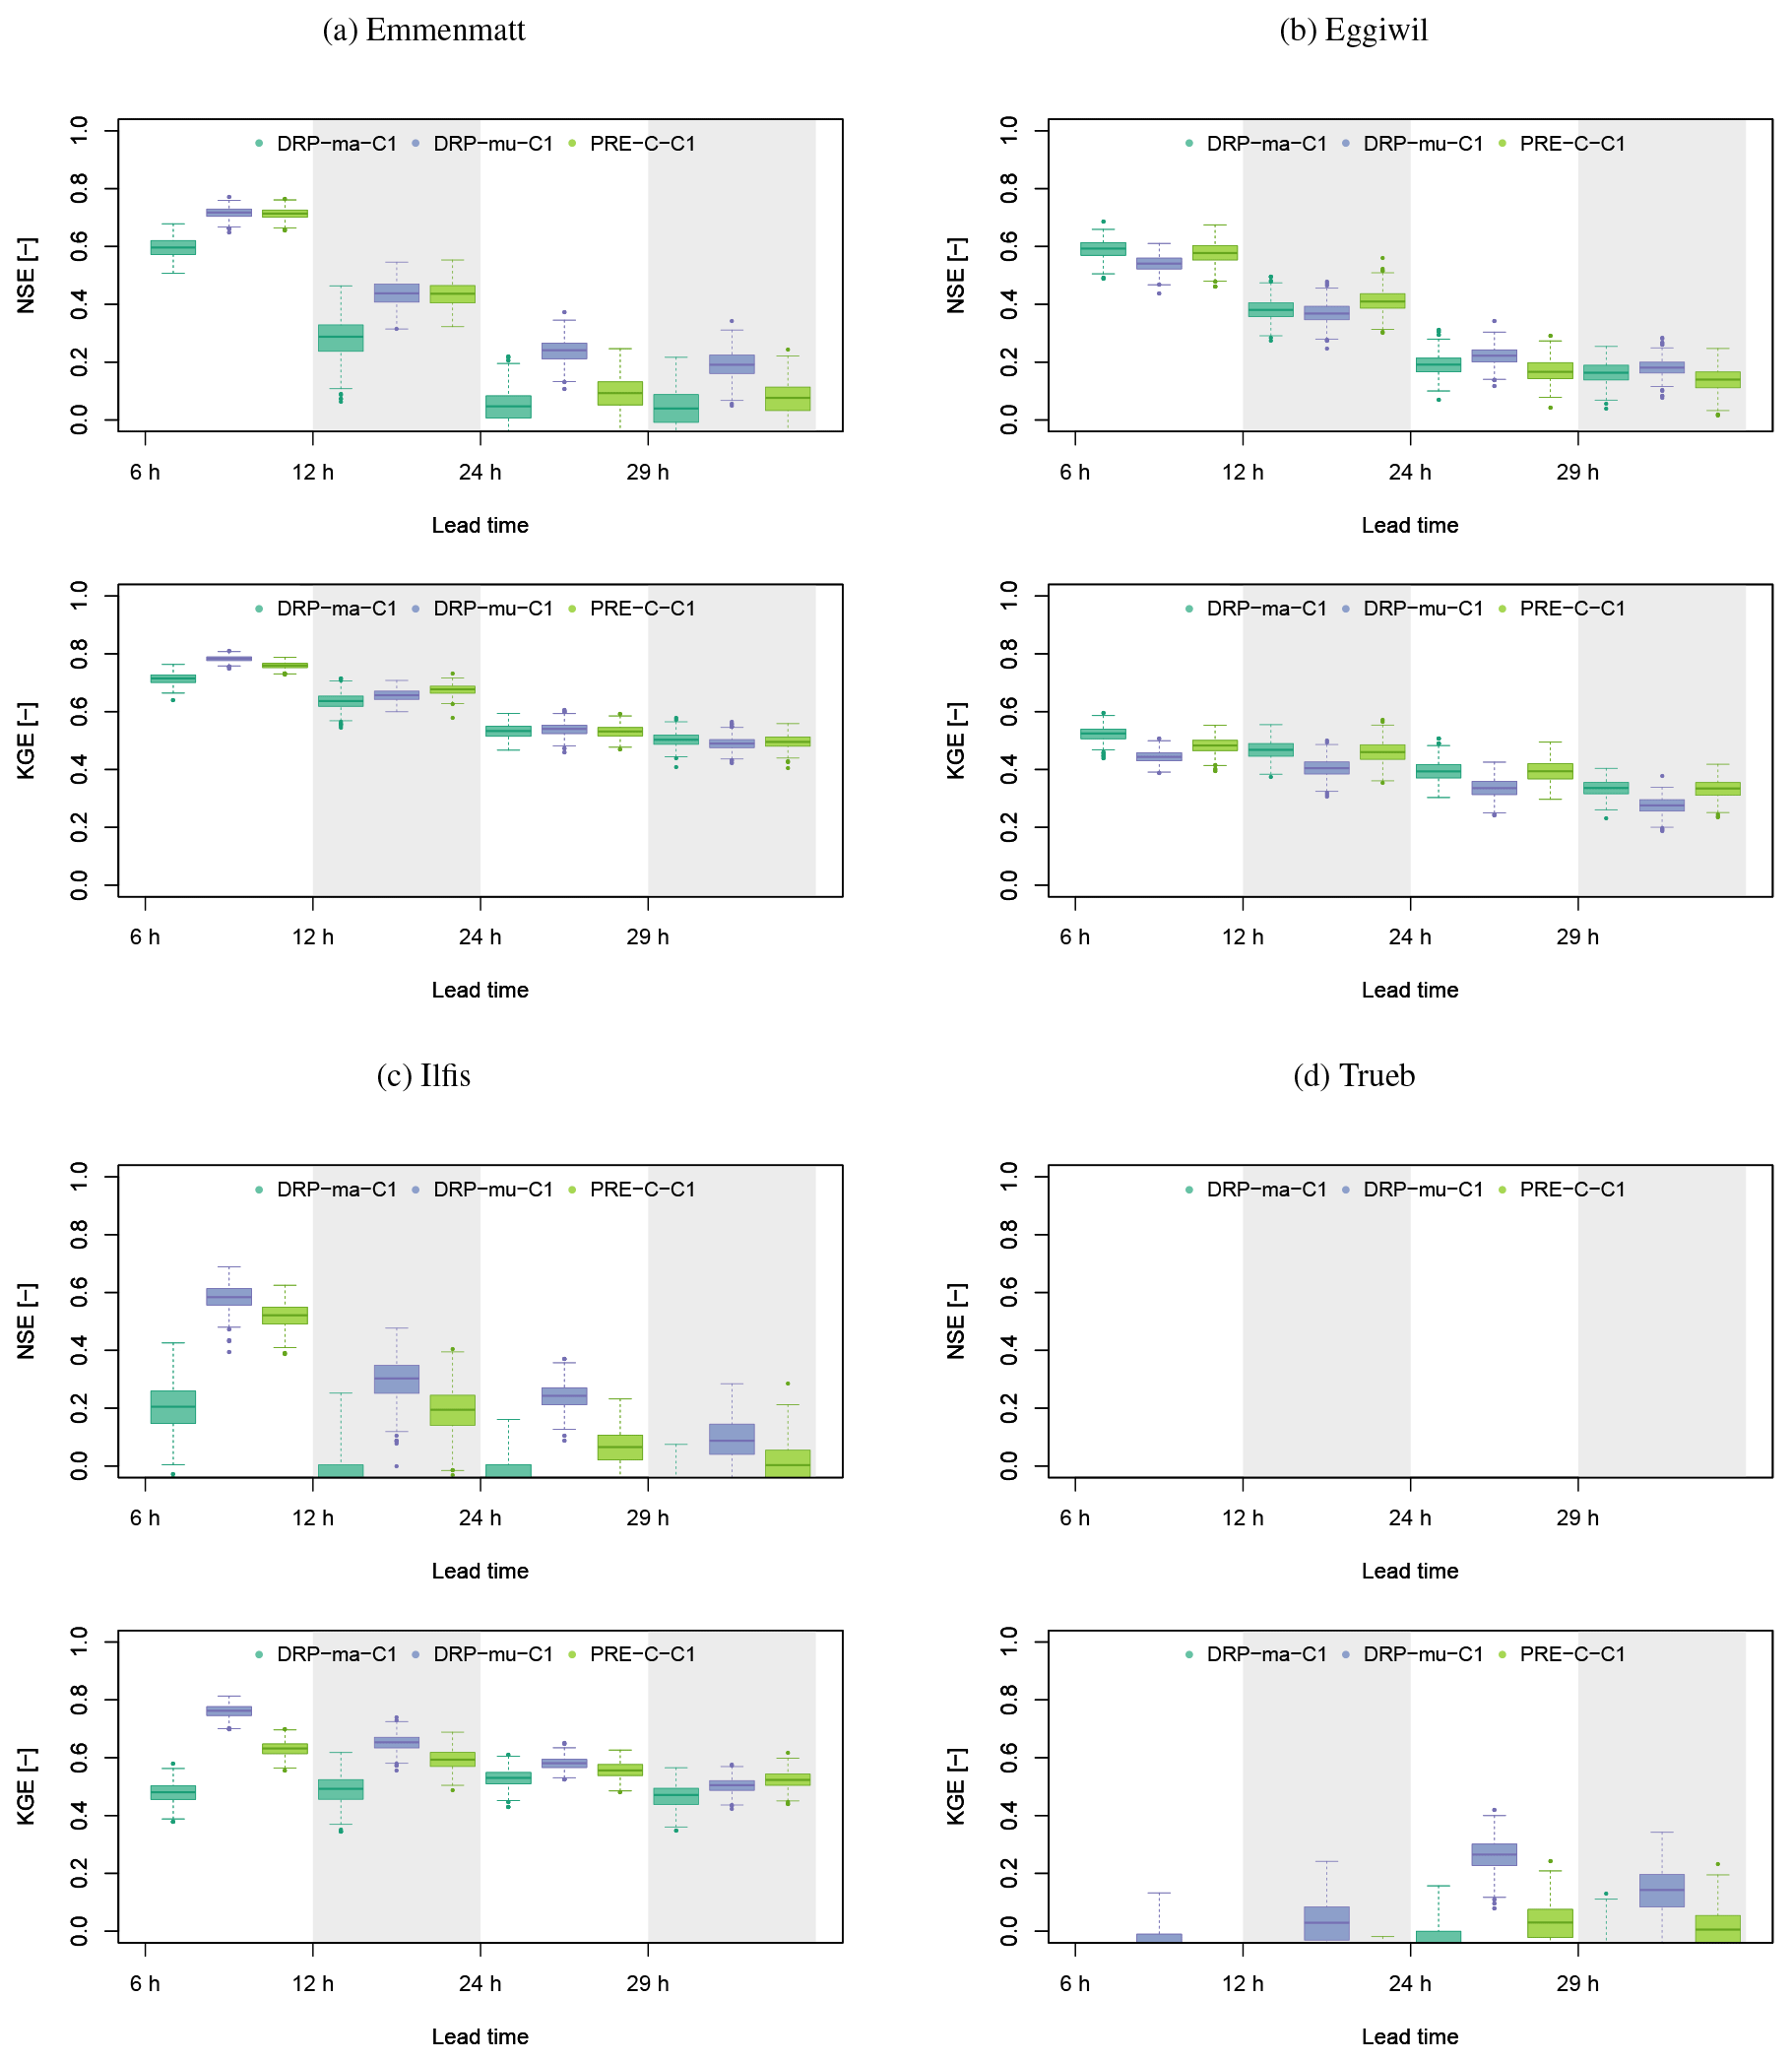
Figure 7NSE and KGE for (a) Emmenmatt, (b) Eggiwil, (c) Ilfis and (d) Trueb as a function of lead time for DRP-ma-C1 (dark green), DRP-mu-C1 (blue) and PRE-C-C1 (light green) for all events in the investigated period from May until July 2016. A window of 6 h was taken for the computations, e.g. from 19 to 24 h for the 24 h lead time. The box plots represent the sampling uncertainties of the score computations obtained with bootstrapping (Addor et al., 2011).
4.2 Preliminary assessment of re-forecasts
4.2.1 Example of re-forecasts
Visual analysis of events remains a very valuable complement to statistical evaluation and gives forecasters and users a better and intelligible way to get a feeling for the quality of their systems. Figure 5 depicts deterministic flood predictions of DRP-ma-C1, DRP-mu-C1 and PRE-C-C1 in the Emmenmatt basin, as well as the temporal evolution of precipitation and soil moisture from 11 to 15 May 2016. This was the largest event in the Emmenmatt catchment investigated in this study and also the time period for which PRE-C-C1 (and PRE-C-CE) was calibrated. In terms of COSMO-1 precipitation forecasts, cumulated predicted rainfall is revealed to be in good agreement with CombiPrecip data and leads to a gradual increase in soil moisture, which started from slightly unsaturated conditions as assimilated from the real-time product introduced in Sect. 3.1.2. Main phases of precipitation input are in the late evening of 12 May and in the early morning of 14 May. Corresponding peaks in observed runoff lag only few hours behind, which is a consequence of the fast-responding properties of Emmenmatt catchment. None of the three prediction chains is really able to catch the quickly rising hydrograph during the initialisation period with CombiPrecip, although performance is satisfactory. The simulated first peak of DRP-ma-C1 and PRE-C-C1 is relatively good in terms of volume, whereas DRP-mu-C1 underestimates it. These characteristics appear as well in a forecast mode, in which the highest forecasts of DRP-ma-C1 and PRE-C-C1 reach up to the observed second peak but are substantially lower for DRP-mu-C1. Overall, the performance of DRP-ma-C1 and PRE-C-C1 is comparable in this example. Comparing the two DRP-based RGMs, the Margreth mapping approach is revealed to be generating higher peaks than the Müller approach. This holds as well when considering more examples; however, it is not always of advantage. The spread in hydrographs resulting from the eight COSMO-1 initialisations on that day is considerable, especially for the strongly reacting DRP-ma-C1 and PRE-C-C1. This jumpiness is a typical behaviour of deterministic systems and a major problem for decision makers still relying on such systems (e.g. Bruen et al., 2010). Probabilistic forecasts for the same event from DRP-ma-CE, DRP-mu-CE and PRE-C-CE are depicted in Fig. 6, with a switch to forecast mode on 12 May at 19:00. At the start of the forecasting period, all three prediction chains are overconfident, as the ensemble spread in precipitation input has not yet developed. Afterwards, observed runoff is contained within ensemble range for all forecasting chains, except for parts of the recession period. As for deterministic predictions, DRP-ma-CE and PRE-C-CE perform very similarly in this example.
4.2.2 Evaluation of short-range forecasts with hydrological measures of agreement
NSE and KGE are used to provide a classical hydrological way of evaluating the experiments. When considering NSE and KGE for Emmenmatt and Eggiwil catchments, shown in Fig. 7, it can be seen that there is skill for all deterministic forecasting systems and all investigated lead times and that skill declines over time.
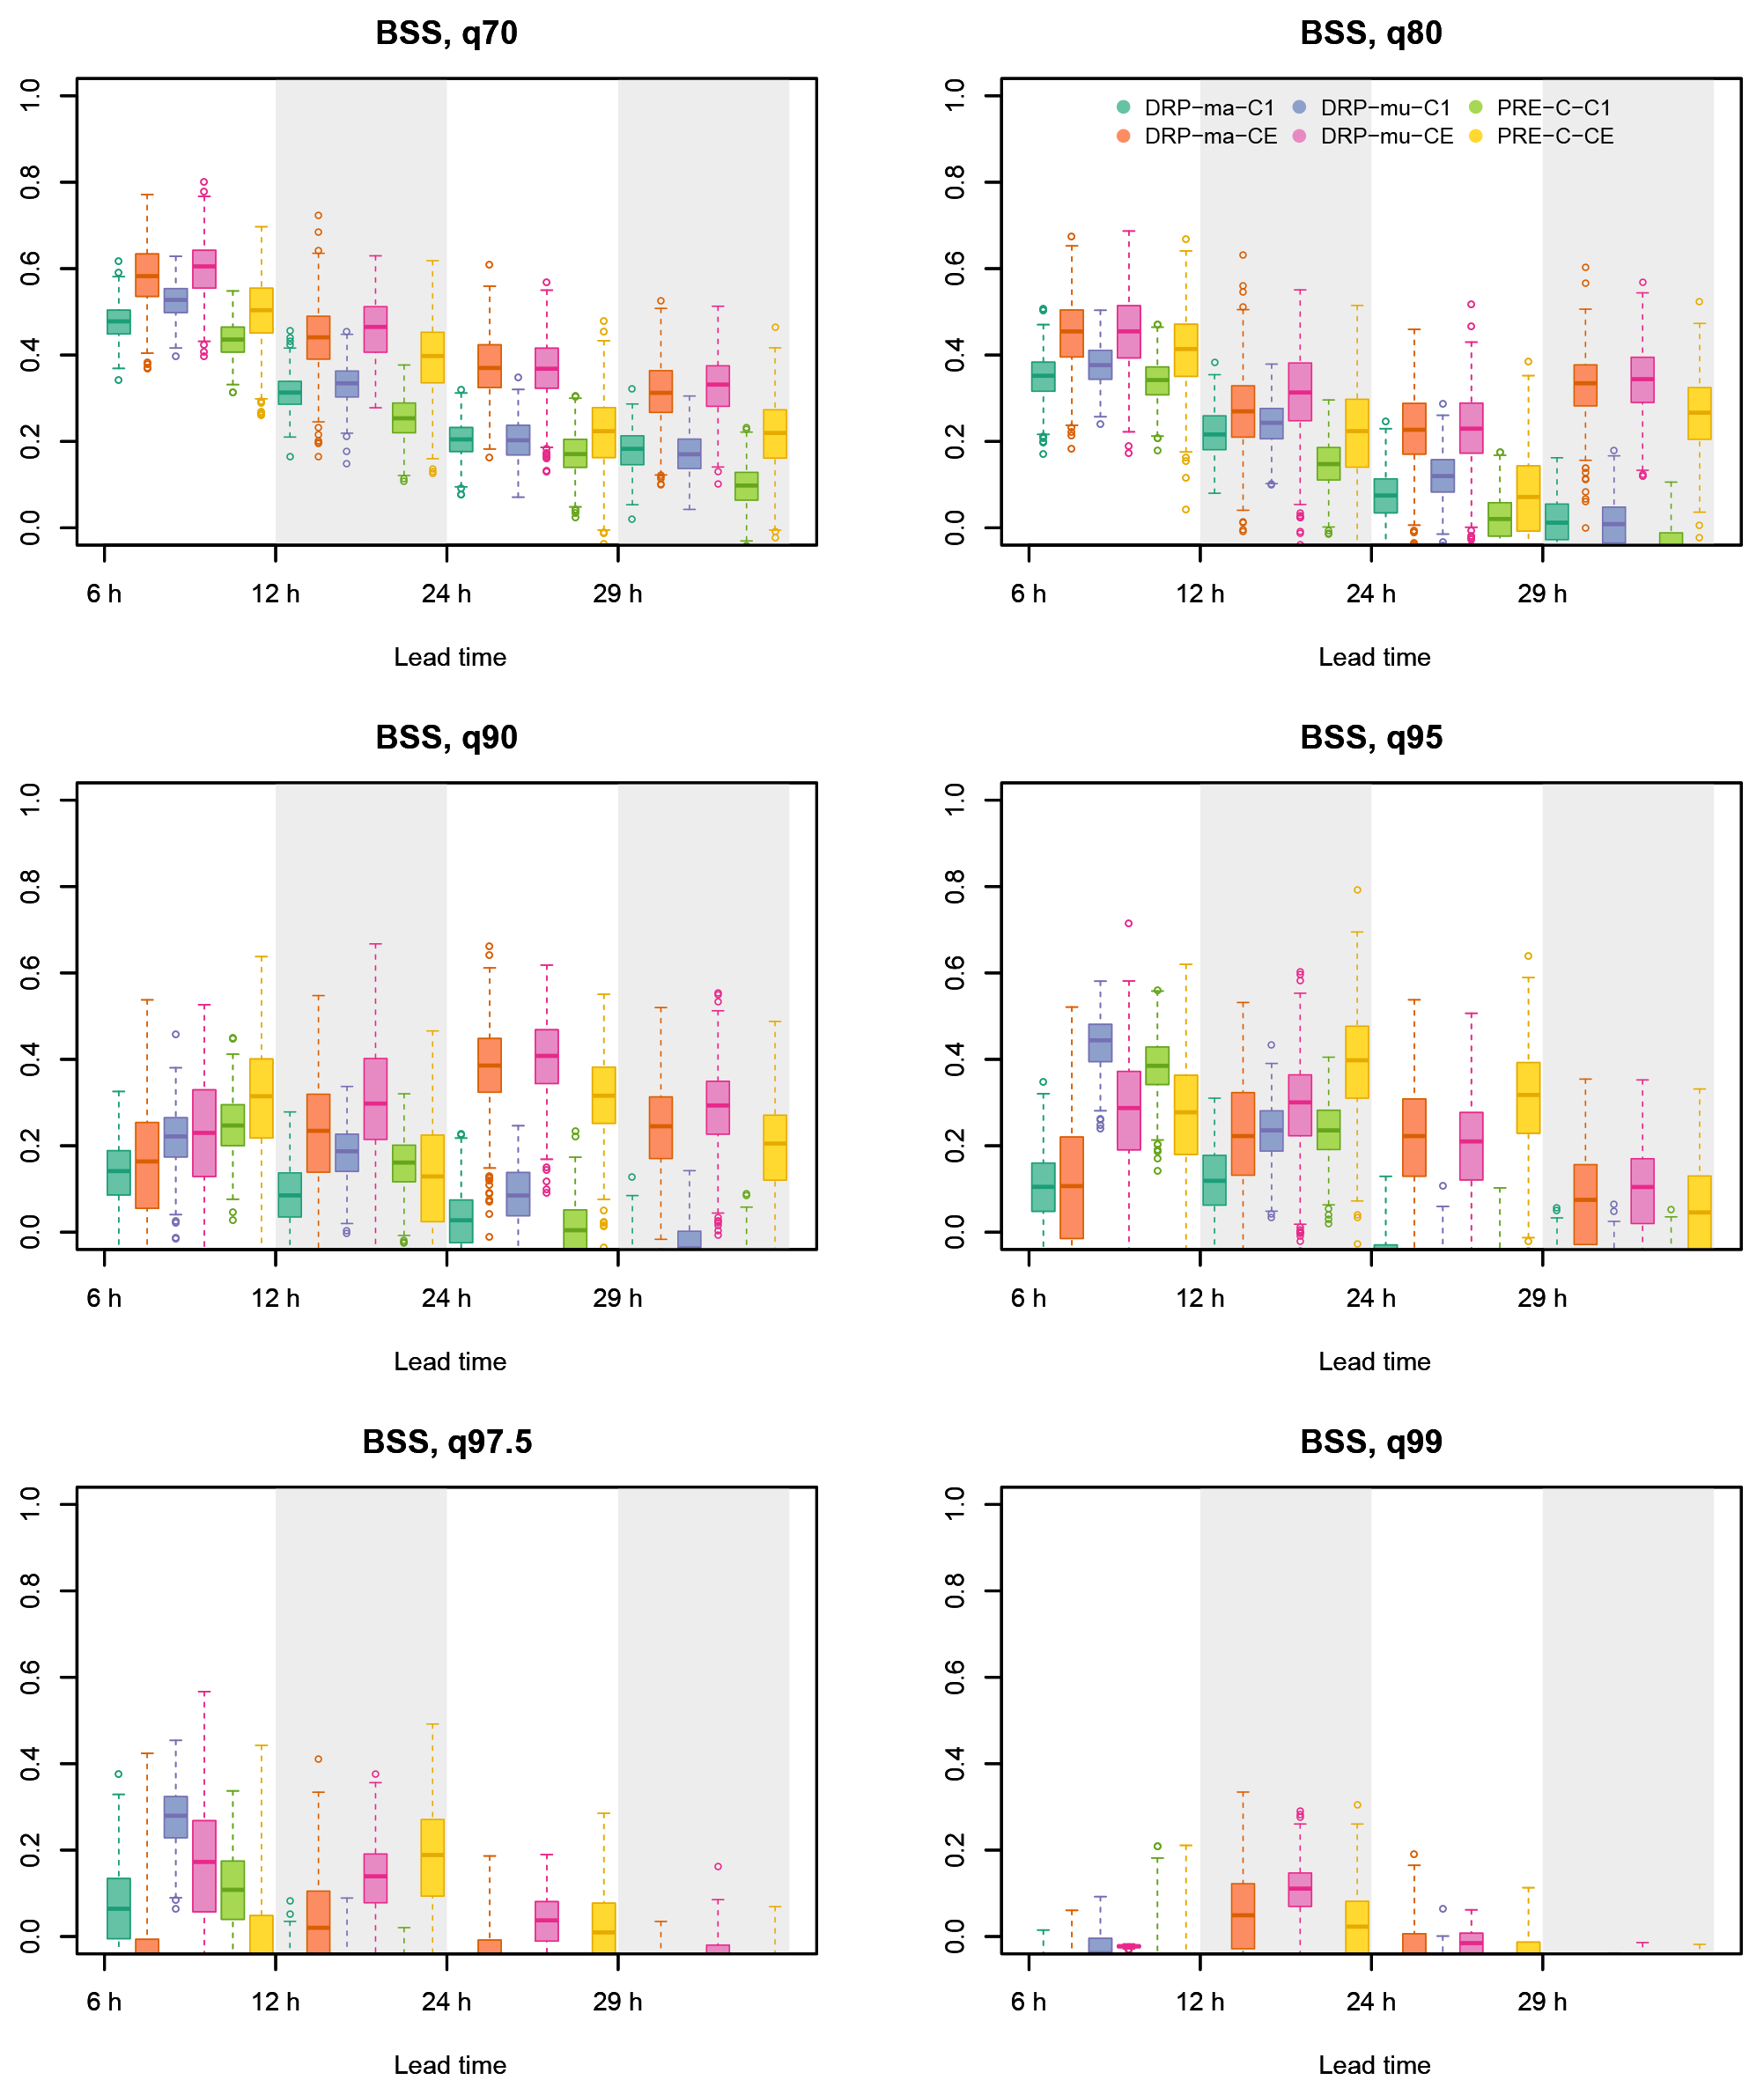
Figure 8Comparison of BSS in the Emmenmatt catchment for deterministic DRP-ma-C1, DRP-mu-C1 and PRE-C-C1 and probabilistic DRP-ma-CE, DRP-mu-CE and PRE-C-CE as a function of lead time for several threshold quantiles for all events in the investigated period from May until July 2016. A window of 6 h was taken for the computations. The box plots represent the sampling uncertainties of the score computations obtained with bootstrapping.
In the Emmenmatt catchment, DRP-ma-C1 reveals the poorest and DRP-mu-C1 the best performance in terms of NSE. Findings from KGE imply no clear preference for one forecasting chain. In the Eggiwil basin, all three forecasting chains perform equally well. For the Ilfis catchment, there is skill for all forecasting chains and any lead time except for DRP-ma-C1 after 6 h in terms of NSE. Values of both NSE and KGE are decreasing over time. For all lead times, DRP-mu-C1 is the best and DRP-ma-C1 the worst-performing forecasting chain, apart from a lead time of 29 h for which PRE-C-C1 is best in terms of KGE. In the Trueb basin, there is no skill for any forecasting chain in terms of NSE. Considering KGE, there is little skill for DRP-mu-C1 at lead times of 12, 24 and 29 h and for PRE-C-C1 at 24 and 29 h lead time.
4.2.3 Comparison of deterministic and probabilistic forecasts
The BSS is used as proposed in Addor et al. (2011) as a measure for comparing deterministic and probabilistic forecasts, with the box plots representing the sampling uncertainties of the score computations obtained with bootstrapping. In all catchments, there is in general a decrease of BSS with lead time, which is in particular strong for Emmenmatt (Fig. 8). Figures of BSS for Eggiwil, Ilfis and Trueb catchments are provided in the Supplement. Furthermore, there is less skill for increasing threshold quantiles. For deterministic forecasts there is mostly no skill for q0.975 and q0.99 quantiles in Emmenmatt, Eggiwil and Ilfis, whereas in Trueb there is only skill for the q0.7 threshold quantile.
In all basins, no increase of uncertainty with lead time is visible and the spread of forecasting chains relying on CE is larger than for approaches based on C1. The ensemble approach is always better than its respective deterministic counterpart with few exceptions. This confirms numerous previous studies on the topic. Deterministic forecasting chains are most competitive at short lead times, whereas for lead times of 24 and 29 h, skill of the ensemble approach is substantially larger. One of the reasons for this behaviour could be the higher resolution of COSMO-1 as compared to COSMO-E and thus the better consideration of convection in the deterministic approach. Nevertheless the analysed data set is too short for conclusive statements on this finding. In most cases, however, uncertainty bars of BSS overlap.
Comparing the deterministic forecasting chains based on Müller and Margreth mapping approaches in Emmenmatt reveals that DRP-mu-C1 is better than DRP-ma-C1 for all quantiles apart from the low ones and long lead times, for which BSS values are comparable. In Eggiwil and Trueb basins, performance of DRP-ma-C1 and DRP-mu-C1 is similar, with a slight preference for the Margreth approach in Eggiwil. In the Ilfis catchment, DRP-mu-C1 is favoured over DRP-ma-C1 for all thresholds and lead times when there is skill.
In Emmenmatt, Eggiwil and Ilfis catchments, there is no clear preference when comparing the deterministic process-based forecasting chains with PRE-C-C1, as performance depends on threshold quantile and lead time. For the few cases when there is skill in the Trueb basin, the process-based forecasting chains perform better than PRE-C-C1.
Comparing the three probabilistic forecasting chains among each other leads to different outcomes in the four Emme catchments. In Emmenmatt and Ilfis, DRP-mu-CE is slightly better than DRP-ma-CE in most cases, whereas in Eggiwil, the opposite is true. In the Trueb catchment, no clear preference for the Margreth or Müller approach is found. In Eggiwil and Ilfis, it is not obvious whether to favour PRE-C-CE or the process-based forecasting chains. In the Emmenmatt basin, in general one of the two process-based forecasting chains performs better than PRE-C-CE, although this is highly dependent on threshold and lead time. A clear advantage is found for process-based forecasting chains in the Trueb basin, as skill – if there is any – is usually substantially larger than for PRE-C-CE.
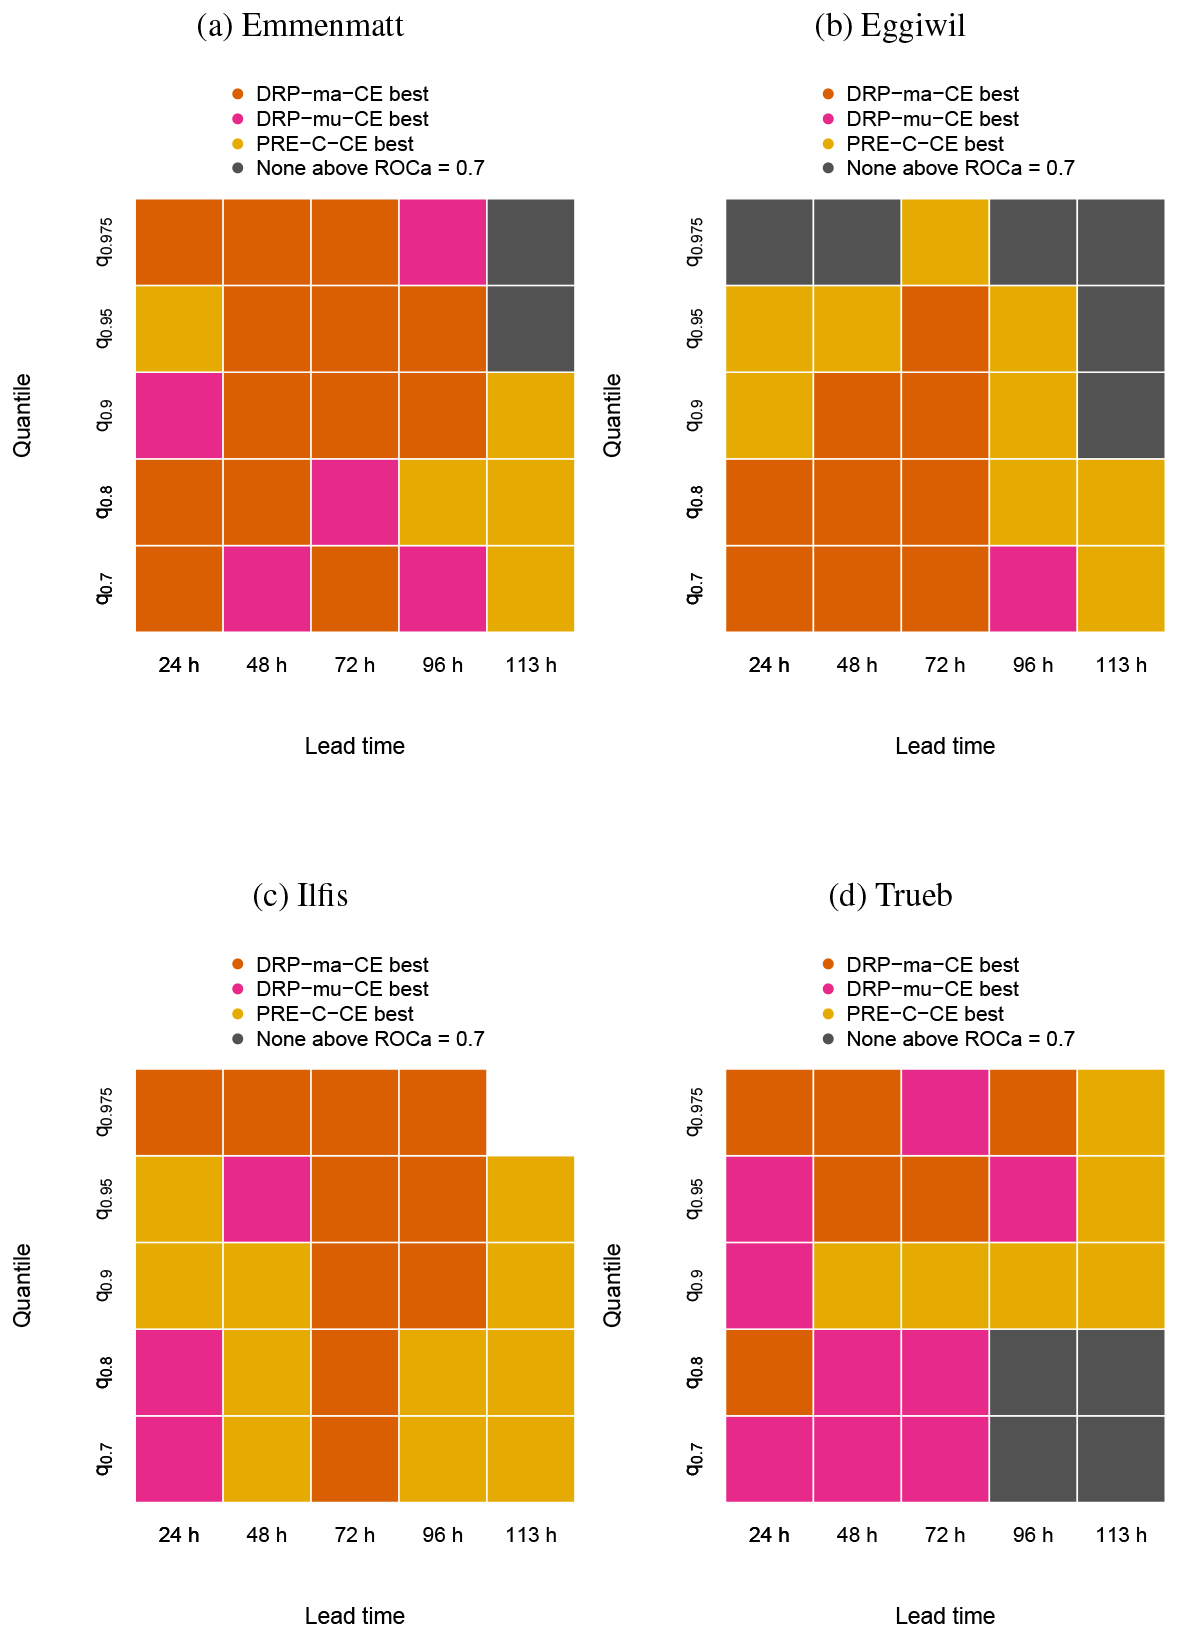
Figure 9Summaries of ROCa for (a) Emmenmatt, (b) Eggiwil, (c) Ilfis and (d) Trueb as a function of lead time and threshold quantile for DRP-ma-CE, DRP-mu-CE and PRE-C-CE for all events in the investigated period from May until July 2016. The dark orange colour indicates that ROCa of DRP-ma-CE is highest, whereas pink and yellow colours imply that DRP-ma-CE and PRE-C-CE, respectively, perform best. Grey shading indicates that none of the forecasting chains has ROCa higher than 0.7, which is considered to be the minimum value useful for decision makers (Buizza et al., 1999). Please note that there were not enough data for the calculations in the Ilfis catchment for the 113 h lead time and the q0.975 threshold quantile.
4.2.4 Synthesis of extended-range forecast quality with COSMO-E
In order to compare the different forecasting chains DRP-ma-CE, DRP-mu-CE and PRE-C-CE for their performance in terms of ROCa, a summary is shown in Fig. 9. The values of ROCa that served as a basis for Fig. 9 can be found in the Supplement. In no catchment is there a clear pattern or preference for one approach. Out of 87 cases, which is the number of either dark orange, pink or yellow coloured squares, DRP-ma-CE is best 38 times, PRE-C-CE 31 times and DRP-mu-CE 18 times. For all ensemble approaches and catchments, values of ROCa are in general not higher than 0.9 and decrease with lead time. For the longest lead times, values of ROCa tend to be around 0.7, i.e. at the boundary of being useful (Buizza et al., 1999). An exception is found in the Trueb basin, where the highest quantiles have the largest values of ROCa (around 0.8) for the longest lead times. In contrast, for the q0.975 threshold quantile at 113 h lead time, there is clearly no skill in Emmenmatt and Eggiwil and there were not enough data for the computations to be executed in the Ilfis basin.
5.1 Effect of different DRP mapping approaches
In terms of most measures of agreement, no clear preference for using either the Margreth or Müller map in FF forecasting chains is found, with uncertainty bars overlapping in most cases. However, there is a modest advantage for the Müller mapping approach. For Emmenmatt, Ilfis and Trueb catchments, DRP-mu-C1 and CE perform slightly better than DRP-ma-C1 and CE for most lead times in terms of NSE, KGE and BSS.
The case studies with the forecasting chains reveal that DRP-ma-C1 and CE react more intense on precipitation in comparison with DRP-mu-C1 and CE. This does not necessarily lead to faster occurring peaks, but to peaks that are higher in magnitude. This is in good agreement with the relative shares of RTs in Table 2 for the different mapping approaches: as the Müller method classifies much deeper percolation (RT5), there is less simulated water at the runoff gauge. In terms of peak timing, there is not much difference between process-based forecasting chains, which could be because Müller also classifies a higher fraction of RT1, leading to compensation effects. Both visual inspections of hydrographs and measures of agreement reveal very similar performance of both approaches, which is remarkable when taking into account how distinct the two maps in Fig. 1 look. A reason that this difference was not as large as expected could be that – in agreement with Zappa et al. (2011) – meteorological uncertainties are dominant, and uncertainty in DRP mapping is of minor importance in a forecast mode. However, reanalysis with CombiPrecip data (Fig. 4) also showed no clear preference between the two process-based forecasting chains when not considering the Eggiwil catchment. These results are in agreement with Antonetti and Zappa (2018), who find that satisfactory model performance is also achieved using mapping approaches with low involvement of expert knowledge. Due to considerable uncertainties, there is only a slight increase in potential value when a more complex map of RTs is considered, even when using optimal runoff and real-time meteorological input data (Antonetti and Zappa, 2018).
In the Eggiwil basin, there are ongoing discussions as to whether the runoff gauge overestimates runoff (Antonetti and Zappa, 2018). This is supported by the fact that all three forecasting chains reveal strong under-forecasting for the highest threshold quantiles, which is in contrast to the other catchments. However, it could also be possible that none of the three models is able to represent the processes important for runoff formation correctly in Eggiwil. As the Margreth approach usually generates the highest runoffs, it is most competitive in the Eggiwil basin.
Overall, the analysis shows that, in a forecast mode, a map of RTs with high involvement of expert knowledge does not guarantee a higher performance compared with a map of RTs based on less expertise. The Müller mapping approach is faster to implement, is financially more attractive and does not lead to worse results compared with the Margreth method. This finding is in agreement with Antonetti and Zappa (2018).
5.2 Effect of integrating knowledge on DRP into hydrological modelling in nested catchments of the Emme region
Comparing the two process-based forecasting chains with the one including a calibrated hydrological model indicates comparable performance in terms of all measures of agreement used in Emmenmatt, Eggiwil and Ilfis catchments. If there is skill in the Trueb basin in terms of BSS and KGE, which is hardly ever the case, performance of process-based forecasts is substantially better than the one of PRE-C-C1 and CE. This is in accordance with Antonetti et al. (2016a) and Antonetti and Zappa (2018), who state that process-based forecasting chains should be advantageous, especially in nested subcatchments and not in the main catchments for which the calibration was done. However, as with the discharge measurement in Eggiwil, Scherrer AG (2012) doubts the quality of the runoff data for the Trueb basin, and Antonetti and Zappa (2018) explain the poor model performance in this area to be a consequence thereof.
This study investigated the potential of a process-based runoff generation module for flash-flood prediction from May to July 2016 in the Emme catchments. The main task was to set up four quasi-operational forecasting chains for Emmenmatt, Eggiwil, Ilfis and Trueb basins. The innovation in the approach followed in this paper is the use of RGM-PRO, a conceptual hydrological module with no need for calibration (Antonetti et al., 2017). RGM-PRO relies on spatially distributed information of runoff processes in a catchment, i.e. the so-called maps of runoff types. For all forecasting chains, either numerical weather prediction data from deterministic COSMO-1 or probabilistic COSMO-E served as meteorological input. To initialise the hydrological model, gridded precipitation nowcasts from CombiPrecip were used, which also provided meteorological input for the corresponding reference runs. The forecasting chains including RGM-PRO were set up, each depending on maps of runoff types with a little (Müller) and high amount of expert knowledge (Margreth), resulting in the forecasting chains DRP-mu-C1 and DRP-mu-CE, and DRP-ma-C1 and DRP-ma-CE. This design allowed for a sensitivity analysis of the forecast performance for spatially distributed information in runoff processes. In addition, two forecasting chains including a conventional hydrological module relying on calibration (PREVAH; Viviroli et al., 2009) were set up (PRE-C-C1 and PRE-C-CE). Special emphasis was placed on the performance of the prediction systems in nested subcatchments.
-
Results suggest that DRP-mu-C1 and DRP-mu-CE have slight advantages in terms of most measures of agreement and catchments when compared with forecasting chains involving a high amount of knowledge for maps of runoff types. The faster implementation speed of the Müller mapping approach is an additional reason for considering it as our preferable choice in a forecast mode.
-
Forecasting chains with integrated knowledge on runoff processes revealed comparable performance to the ones employing a conventional hydrological model in the larger catchments of the Emme region. In the smallest nested subcatchment, i.e. the Trueb basin, prediction systems based on RGM-PRO outperformed the ones relying on conventional PREVAH substantially in the few cases when there was any skill. This confirms the potential of including information on dominant runoff processes in hydrological models, as an a priori parametrised (i.e. non-calibrated) hydrological model reached comparable results to – if not even better results than – a conventional hydrological model.
For a future study, it would be informative to assess the sensitivity of the spatial distribution of rainfall, i.e. whether precipitation falls on a fast- or a slow-reacting surface, to flood response. For this, numerical experiments with simulated thunderstorms of the same intensity and duration but at different locations in a catchment could be executed in a similar way as in Paschalis et al. (2014) and Lumassegger et al. (2016), who investigated streamflow response to the space–time variability of precipitation. To quantify uncertainty in runoff-type mapping approaches and propagation through the forecasting chain, an extension of Zappa et al. (2011) and Antonetti and Zappa (2018) could be possible. We can conclude that a skilful application of a hydrological model with no need for calibration in a forecasting chain is possible, which extends the prediction of flash floods to ungauged and nested basins. In the companion paper Horat et al. (2018), the application of RGM-PRO is extended to another climatic region of Switzerland (the Verzasca basin in southern Switzerland) and tested against the already operational forecasting chain relying on the PREVAH model (Zappa et al., 2011).
The Margreth map used for this study is provided by SoilCom GmbH (http://www.soilcom.ch, Margreth Map, 2018). For the Müller map, Arealstatistik 1979/85 (https://www.bfs.admin.ch/bfs/de/home/statistiken/raum-umwelt/erhebungen/area/geschichte/area-1979-85.html, BFS, 1995) with 100 m resolution serves as a land use map and DTM25 (data: BFS GEOSTAT/Federal Office of Topography swisstopo; http://www.swisstopo.admin.ch, GIS data, 2017) with a resolution of 25 m as a digital terrain model. As a geological map, Geologischer Atlas GA25 (Data: BFS GEOSTAT/Federal Office of Topography swisstopo) with a scale of 1:25 000 is used where it is available and elsewhere Geologische Karte (Data: BFS GEOSTAT/Federal Office of Topography swisstopo) with a scale of 1:500 000 is used. Meteorological data, i.e. CombiPrecip, COSMO and rain gauge data, are provided by the Swiss Federal Office of Meteorology and Climatology (MeteoSwiss; http://www.meteoswiss.admin.ch, Precipitation data, 2017). Runoff measurements are obtained from the Swiss Federal Office for Environment (FOEN; http://www.bafu.admin.ch, Runoff measurements, 2017a) and the Bau-, Verkehrs- und Energiedirektion of the Canton of Bern (http://www.bve.be.ch, Runoff measurements, 2017b). Further information on the hydrological modelling system PREVAH can be obtained from the Institute of Geography, University of Bern (http://www.hydrologie.unibe.ch/PREVAH; Viviroli et al., 2007). The process-based runoff generation module RGM-PRO has been developed at the Swiss Federal Research Institute WSL (http://www.wsl.ch; WSL, 2018). The authors can provide further information upon request.
The supplement related to this article is available online at: https://doi.org/10.5194/nhess-19-19-2019-supplement.
The study design was the responsibility of MZ and MA. MZ prepared the COSMO data for the simulations performed by MA and CH. The statistical analysis was carried out by CH with the aid of MA. In addition, MA and CH prepared the manuscript, and IS created and provided the CombiPrecip product used. The paper benefited from the contributions of all co-authors.
The authors declare that they have no conflict of interest.
This work was carried out at the Swiss Federal Institute for Forest, Snow and
Landscape Research (WSL), Birmensdorf, Switzerland. The contribution of
Manuel Antonetti was funded by the Swiss Federal Office for Environment
(FOEN). We would like to thank Simon Scherrer from Scherrer Hydrologie AG and
Michael Margreth from SoilCom GmbH for the maps of runoff types. In addition,
we are grateful to Heini Wernli (ETH Zurich) for his valuable comments
and to Katharina Liechti for providing R scripts used in the
verification of the forecasts.
Edited by: Kai
Schröter
Reviewed by: two anonymous referees
Addor, N., Jaun, S., Fundel, F., and Zappa, M.: An operational hydrological ensemble prediction system for the city of Zurich (Switzerland): skill, case studies and scenarios, Hydrol. Earth Syst. Sci., 15, 2327–2347, https://doi.org/10.5194/hess-15-2327-2011, 2011. a, b, c, d, e, f, g
Alfieri, L., Velasco, D., and Thielen, J.: Flash flood detection through a multi-stage probabilistic warning system for heavy precipitation events, Adv. Geosci., 29, 69–75, https://doi.org/10.5194/adgeo-29-69-2011, 2011. a
Andres, N., Badoux, A., and Hegg, C.: Unwetterschäden in der Schweiz im Jahre 2014, Wasser Energie Luft, 107, 47–54, 2015. a
Antonetti, M., Buss, R., Scherrer, S., Margreth, M., and Zappa, M.: Mapping dominant runoff processes: an evaluation of different approaches using similarity measures and synthetic runoff simulations, Hydrol. Earth Syst. Sci., 20, 2929–2945, https://doi.org/10.5194/hess-20-2929-2016, 2016a. a, b, c, d, e, f
Antonetti, M., Scherrer, S., Kienzler, P., Margreth, M., and Zappa, M.: Überprüfung von einem prozessnahen Abflussbildungsmodul auf der Hangskale und für klein- und mesoskalige Gebiete, Forum für Hydrologie und Wasserbewirtschaftung, available at: ftp://ftp.wsl.ch/pub/antonetti/Prozessbasierte_Niederschlags-Abfluss-Modellierung/Anhang_J_Antonetti_etal_ForumHyWa_36.16.pdf, last access: 18 December 2018, 2016b. a
Antonetti, M., Scherrer, S., Kienzler, P. M., Margreth, M., and Zappa, M.: Process-based hydrological modelling: The potential of a bottom-up approach for runoff predictions in ungauged catchments, Hydrol. Process., 31, 2902–2920, https://doi.org/10.1002/hyp.11232, 2017. a, b, c, d, e, f, g, h, i
Antonetti, M. and Zappa, M.: How can expert knowledge increase the realism of conceptual hydrological models? A case study based on the concept of dominant runoff process in the Swiss Pre-Alps, Hydrol. Earth Syst. Sci., 22, 4425–4447, https://doi.org/10.5194/hess-22-4425-2018, 2018. a, b, c, d, e, f, g, h, i, j, k, l, m
Beven, K.: Prophecy, reality and uncertainty in distributed hydrological modelling, Adv. Water Resour., 16, 41–51, 1993. a
BFS: Die Bodennutzung der Schweiz. Arealstatistik 1979/85, Bundesamt für Statistik, Bern, available at: https://www.bfs.admin.ch/bfs/de/home/statistiken/raum-umwelt/erhebungen/area/geschichte/area-1979-85.html (last access: 20 December 2018), 1995. a
Blöschl, G., Komma, J., and Hasenauer, S.: Hydrological downscaling of soil moisture, Final Report to the H-SAF (Hydrology Satellite Application Facility) via the Austrian Central Institute for Meteorology and Geodynamics (ZAMG), available at: http://hsaf.meteoam.it/documents/visiting-scientist/HSAF_VS08_02_Final_Report.pdf (last access: 18 December 2018), 2009. a
Braud, I., Roux, H., Anquetin, S., Maubourguet, M.-M., Manus, C., Viallet, P., and Dartus, D.: The use of distributed hydrological models for the Gard 2002 flash flood event: Analysis of associated hydrological processes, J. Hydrol., 394, 162–181, 2010. a
Bremicker, M.: Das Wasserhaushaltsmodell LARSIM – Modellgrundlagen und Anwendungsbeispiele, Freiburger Schriften zur Hydrologie, 11, available at: http://www.hydrology.uni-freiburg.de/publika/band11.html (last access: 20 December 2018), 2000. a
Brown, J. D., Demargne, J., Seo, D.-J., and Liu, Y.: The Ensemble Verification System (EVS): A software tool for verifying ensemble forecasts of hydrometeorological and hydrologic variables at discrete locations, Environ. Modell. Softw., 25, 854–872, 2010. a, b
Bruen, M., Krahe, P., Zappa, M., Olsson, J., Vehvilainen, B., Kok, K., and Daamen, K.: Visualizing flood forecasting uncertainty: some current European EPS platforms – COST731 working group 3, Atmos. Sci. Lett., 11, 92–99, https://doi.org/10.1002/asl.258, 2010. a
Buizza, R., Hollingsworth, A., Lalaurette, E., and Ghelli, A.: Probabilistic predictions of precipitation using the ECMWF ensemble prediction system, Weater Forecast., 14, 168–189, 1999. a, b, c
Carpenter, T. M., Sperfslage, J. A., Georgakakos, K. P., Sweeney, T., and Fread, D. L.: National threshold runoff estimation utilizing GIS in support of operational flash flood warning systems, J. Hydrol., 224, 21–44, https://doi.org/10.1016/S0022-1694(99)00115-8, 1999. a
Collier, C. and Fox, N.: Assessing the flooding susceptibility of river catchments to extreme rainfall in the United Kingdom, International Journal of River Basin Management, 1, 225–235, https://doi.org/10.1080/15715124.2003.9635209, 2003. a
Collier, C. G.: Flash flood forecasting: What are the limits of predictability?, Q. J. Roy. Meteor. Soc., 133, 3–23, https://doi.org/10.1002/qj.29, 2007. a, b, c, d
Delrieu, G., Nicol, J., Yates, E., Kirstetter, P., Creutin, J., Anquetin, S., Obled, C., Saulnier, G., Ducrocq, V., Gaume, E., Payrastre, O., Andrieu, H., Ayral, P., Bouvier, C., Neppel, L., Livet, M., Lang, M., du-Châtelet, J. P., Walpersdorf, A., and Wobrock, W.: The catastrophic flash-flood event of 8–9 September 2002 in the Gard Region, France: A first case study for the Cévennes–Vivarais Mediterranean Hydrometeorological Observatory, J. Hydrometeorol., 6, 34–52, 2005. a
Fenicia, F., Kavetski, D., and Savenije, H. H. G.: Elements of a flexible approach for conceptual hydrological modeling: 1. Motivation and theoretical development, Water Resour. Res., 47, W11510, https://doi.org/10.1029/2010WR010174, 2011. a
Ferro, G.: Assessment of major and minor events that occurred in Italy during the last century using a disaster severity scale score, Prehospital and Disaster Medicine, 20, 316–323, 2005. a
Gaume, E., Livet, M., Desbordes, M., and Villeneuve, J. P.: Hydrological analysis of the river Aude, France, flash flood on 12 and 13 November 1999, J. Hydrol., 286, 135–154, https://doi.org/10.1016/j.jhydrol.2003.09.015, 2004. a
Gaume, E., Bain, V., Bernardara, P., Newinger, O., Barbuc, M., Bateman, A., Blaskovicova, L., Blöschl, G., Borga, M., Dumitrescu, A., Daliakopoulos, I., Garcia, J., Irimescu, A., Kohnova, S., Koutroulis, A., Marchi, L., Matreata, S., Medina, V., Preciso, E., Sempere-Torres, D., Stancalie, G., Szolgay, J., Tsanis, I., Velasco, D., and Viglione, A.: A compilation of data on European flash floods, J. Hydrol., 367, 70–78, https://doi.org/10.1016/j.jhydrol.2008.12.028, 2009. a, b, c, d
Georgakakos, K. P.: A generalized stochastic hydrometeorological model for flood and flash-flood forecasting, Water Resour. Res., 22, 2096–2106, https://doi.org/10.1029/WR022i013p02096, 1986. a
Georgakakos, K. P.: Analytical results for operational flash flood guidance, J. Hydrol., 317, 81–103, https://doi.org/10.1016/j.jhydrol.2005.05.009, 2006. a
Germann, U., Galli, G., Boscacci, M., and Bolliger, M.: Radar precipitation measurement in a mountainous region, Q. J. Roy. Meteor. Soc., 132, 1669–1692, https://doi.org/10.1256/qj.05.190, 2006. a
GIS data: Federal Office of Topography swisstopo, available at: https://www.swisstopo.admin.ch/, last access: 22 January 2017. a
Gupta, H. V., Kling, H., Yilmaz, K., and Martinez-Baquero, G.: Decomposition of the Mean Squared Error and NSE Performance Criteria: Implications for Improving Hydrological Modelling, J. Hydrol., 377, 80–91, https://doi.org/10.1016/j.jhydrol.2009.08.003, 2009. a
Gurtz, J., Zappa, M., Jasper, K., Lang, H., Verbunt, M., Badoux, A., and Vitvar, T.: A comparative study in modelling runoff and its components in two mountainous catchments, Hydrol. Process., 17, 297–311, https://doi.org/10.1002/hyp.1125, 2003. a
Guzzetti, F., Stark, C., and Salvati, P.: Evaluation of flood and landslide risk to the population in Italy, Environ. Manage., 36, 15–36, https://doi.org/10.1007/s00267-003-0257-1, 2005. a
Haag, I., Luce, A., Henn, N., and Demuth, N.: Berücksichtigung räumlich differenzierter Abflussprozesskarten im Wasserhaushaltsmodell LARSIM, Forum für Hydrologie und Wasserbewirtschaftung, 36.16, 51–62, https://doi.org/10.14617/for.hydrol.wasbew.36.16, 2016. a
Heber Green, W. and Ampt, G.: Studies on Soil Physics, J. Agr. Sci., 4, 1–24, https://doi.org/10.1017/S0021859600001441, 1911. a
Horat, C., Antonetti, M., Liechti, K., Kaufmann, P., and Zappa, M.: Ensemble flood forecasting considering dominant runoff processes: II. Benchmark against a state-of-the-art model-chain (Verzasca, Switzerland), Nat. Hazards Earth Syst. Sci. Discuss., https://doi.org/10.5194/nhess-2018-119, in review, 2018. a, b, c
Huet, P., Martin, X., Prime, J.-L., Foin, P., Laurain, C., and Cannard, P.: Retour d'expériences des crues de septembre 2002 dans les départements du Gard, de l'Hérault, du Vaucluse, des bouches du Rhône, de l'Ardèche et de la Drôme, Inspection générale de l'Environnement, Paris, France, p. 124, 2003. a
Javelle, P., Fouchier, C., Arnaud, P., and Lavabre, J.: Flash flood warning at ungauged locations using radar rainfall and antecedent soil moisture estimations, J. Hydrol., 394, 267–274, 2010. a
Jörg-Hess, S., Griessinger, N., and Zappa, M.: Probabilistic Forecasts of Snow Water Equivalent and Runoff in Mountainous Areas, J. Hydrometeorol., 16, 2169–2186, 2015. a
Kienzler, P. M. and Naef, F.: Temporal variability of subsurface stormflow formation, Hydrol. Earth Syst. Sci., 12, 257–265, https://doi.org/10.5194/hess-12-257-2008, 2008. a, b
Klasa, C., Arpagaus, M., Walser, A., and Wernli, H.: An evaluation of the convection?permitting ensemble COSMO-E for three contrasting precipitation events in Switzerland, Q. J. Roy. Meteor. Soc., 144, 744–764, https://doi.org/10.1002/qj.3245, 2018. a
Lefrou, C., Martin, X., Labarthe, J.-P., Varret, J., Mazière, B., Tordjman, R., and Feunteun, R.: Les crues des 11, 12 et 13 novembre 1999, dans les départements de l'Aude, l'Herault, les Pyrennées Orientales et du Tarn, Inspection générale de l'Environnement, Paris, France, p. 140, 2000. a
Liechti, K.: Starke Gewitter im Juni 2007 – Einordnung und hydrologische Modellierung für die Regionen Huttwil (BE) und Einsiedeln (SZ), Master thesis at Department of Geography, University of Zurich, 2008. a
Liechti, K., Panziera, L., Germann, U., and Zappa, M.: The potential of radar-based ensemble forecasts for flash-flood early warning in the southern Swiss Alps, Hydrol. Earth Syst. Sci., 17, 3853–3869, https://doi.org/10.5194/hess-17-3853-2013, 2013. a, b, c, d, e, f, g, h
Lopez Bustos, A.: Resumen y conclusiones de los estudios sobre avenidas del Valles en 1962, Instituto de Hidrologia, Technical Report, Madrid, 1964. a
Lumassegger, S., Achleitner, S., Kohl, B., Formayer, H., Strehz, A., and Einfalt, T.: Auswirkungen räumlich variabler Niederschläge auf die Sturzflutsimulation, Forum für Hydrologie und Wasserbewirtschaftung, 36.16, 131–139, https://doi.org/10.14617/for.hydrol.wasbew.36.16, 2016. a
Mani, P., Dobmann, J., Lüthi, A., and Gerber, B.: Frühwarnsystem für kleine Einzugsgebiete – Ein Dispositionsansatz, 12th Congress Interpraevent 2012 – extended abstracts, 519–530, available at: http://www.interpraevent.at/palm-cms/upload_files/Publikationen/Tagungsbeitraege/2012_1_519.pdf, last acess: 18 December 2018, 2012. a, b
Marchi, L., Borga, M., Preciso, E., and Gaume, E.: Characterisation of selected extreme flash floods in Europe and implications for flood risk management, J. Hydrol., 394, 118–133, https://doi.org/10.1016/j.jhydrol.2010.07.017, 2010. a
Margreth, M., Naef, F., and Scherrer, S.: Weiterentwicklung der Abflussprozesskarte Zürich in den Waldgebieten, Technical Report commissioned by the Office of Waste, Water, Energy and Air (WWEA), Ct. Zurich, 2010. a, b
Margreth Map: SoilCom, available at: http://www.soilcom.ch, last access: 18 December 2018. a
MeteoSwiss: COSMO forecasting system, available at: https://www.meteoswiss.admin.ch/home/measurement-and-forecasting-systems/warning-and-forecasting-systems/cosmo-forecasting-system.html, last access: 28 October 2018. a
Monteith, J. L.: Evaporation and the Environment, 19th Symposia of the Society for Experimental Biology, 19, 205–234, 1965. a
Müller, C., Hellebrand, H., Seeger, M., and Schobel, S.: Identification and regionalization of dominant runoff processes – a GIS-based and a statistical approach, Hydrol. Earth Syst. Sci., 13, 779–792, https://doi.org/10.5194/hess-13-779-2009, 2009. a, b, c, d, e
Nash, J. and Sutcliffe, J.: River flow forecasting through conceptual models part I – A discussion of principles, J. Hydrol., 10, 282–290, https://doi.org/10.1016/0022-1694(70)90255-6, 1970. a
Norbiato, D., Borga, M., Degli Esposti, S., Gaume, E., and Anquetin, S.: Flash flood warning based on rainfall thresholds and soil moisture conditions: An assessment for gauged and ungauged basins, J. Hydrol., 362, 274–290, https://doi.org/10.1016/j.jhydrol.2008.08.023, 2008. a, b, c, d, e, f, g
Panziera, L., Gabella, M., Zanini, S., Hering, A., Germann, U., and Berne, A.: A radar-based regional extreme rainfall analysis to derive the thresholds for a novel automatic alert system in Switzerland, Hydrol. Earth Syst. Sci., 20, 2317–2332, https://doi.org/10.5194/hess-20-2317-2016, 2016. a
Paschalis, A., Fatichi, S., Molnar, P., Rimkus, S., and Burlando, P.: On the effects of small scale space-time variability of rainfall on basin flood response, J. Hydrol., 514, 313–327, 2014. a
Penman, H. L.: Natural Evaporation from Open Water, Bare Soil and Grass, P. Roy. Soc. Lond. A Mat., 193, 120–145, https://doi.org/10.1098/rspa.1948.0037, 1948. a
Perrin, C., Michel, C., and Andréassian, V.: Does a large number of parameters enhance model performance? Comparative assessment of common catchment model structures on 429 catchments, J. Hydrol., 242, 275–301, https://doi.org/10.1016/S0022-1694(00)00393-0, 2001. a
Philipp, A., Kerl, F., Büttner, U., Metzkes, C., Singer, T., Wagner, M., and Schütze, N.: Small-scale (flash) flood early warning in the light of operational requirements: opportunities and limits with regard to user demands, driving data, and hydrologic modeling techniques, P. Int. Ass. Hydrol. Sci., 373, 201–208, https://doi.org/10.5194/piahs-373-201-2016, 2016. a
Pool, S., Viviroli, D., and Seibert, J.: Prediction of hydrographs and flow-duration curves in almost ungauged catchments: Which runoff measurements are most informative for model calibration?, J. Hydrol., 554, 613–622, https://doi.org/10.1016/j.jhydrol.2017.09.037, 2017. a
Precipitation data (i.e. CombiPrecip, COSMO and rain gauge data): Federal Office of Meteorology and Climatology MeteoSwiss, available at: http://www.meteoswiss.admin.ch/, last access: 22 January 2017. a
Rossa, A., Liechti, K., Zappa, M., Bruen, M., Germann, U., Haase, G., Keil, C., and Krahe, P.: The COST 731 Action: A review on uncertainty propagation in advanced hydro-meteorological forecast systems, Atmos. Res., 100, 150–167, https://doi.org/10.1016/j.atmosres.2010.11.016, 2011. a
Rossa, A. M., Laudanna Del Guerra, F., Borga, M., Zanon, F., Settin, T., and Leuenberger, D.: Radar-driven high-resolution hydro-meteorological forecasts of the 26 September 2007 Venice flash flood, J. Hydrol., 394, 230–244, https://doi.org/10.1016/j.jhydrol.2010.08.035, 2010. a
Runoff measurements (Emme, Ilfis): Swiss Federal Research Institute WSL, available at: http://www.bafu.admin.ch, last access: 22 January 2017a. a
Runoff measurements (Trueb): Bau-, Verkehrs- und Energiedirektion of the Canton of Bern, available at: http://www.bve.be.ch, last access: 22 January 2017b. a
Scherrer, S. and Naef, F.: A decision scheme to indicate dominant hydrological flow processes on temperate grassland, Hydrol. Process., 17, 391–401, https://doi.org/10.1002/hyp.1131, 2003. a, b, c, d, e
Scherrer, S., Naef, F., Faeh, A. O., and Cordery, I.: Formation of runoff at the hillslope scale during intense precipitation, Hydrol. Earth Syst. Sci., 11, 907–922, https://doi.org/10.5194/hess-11-907-2007, 2007. a
Scherrer AG: Massgebende Hochwasserabflüsse an der Ilfis und an verschiedenen Seitenbächen, Bericht im Auftrag vom Tiefbauamt des Kt. BE, Oberingenieurkreis IV, Verkehr und Infrastruktur des Kt. LU., Lucerne, 2012. a
Schmocker-Fackel, P., Naef, F., and Scherrer, S.: Identifying runoff processes on the plot and catchment scale, Hydrol. Earth Syst. Sci., 11, 891–906, https://doi.org/10.5194/hess-11-891-2007, 2007. a, b, c
Seiller, G., Anctil, F., and Roy, R.: Design and experimentation of an empirical multistructure framework for accurate, sharp and reliable hydrological ensembles, J. Hydrol., 552, 313–340, https://doi.org/10.1016/j.jhydrol.2017.07.002, 2017. a
Sideris, I. V., Gabella, M., Erdin, R., and Germann, U.: Real-time radar-rain-gauge merging using spatio-temporal co-kriging with external drift in the alpine terrain of Switzerland, Q. J. Roy. Meteor. Soc., 140, 1097–1111, https://doi.org/10.1002/qj.2188, 2014. a, b
Swiss Federal Research Institute WSL: Process-based runoff generation module RGM-PRO, available at: http://www.wsl.ch, last access: 18 December 2018. a
Velázquez, J. A., Anctil, F., Ramos, M. H., and Perrin, C.: Can a multi-model approach improve hydrological ensemble forecasting? A study on 29 French catchments using 16 hydrological model structures, Adv. Geosci., 29, 33–42, https://doi.org/10.5194/adgeo-29-33-2011, 2011. a, b
Viviroli, D., Gurtz, J., and Zappa, M.: The Hydrological Modelling System PREVAH, Geographica Bernensia P40, Bern, Institute of Geography, University of Bern, available at: http://www.hydrologie.unibe.ch/PREVAH (last access: 18 December 20018), 2007. a
Viviroli, D., Zappa, M., Gurtz, J., and Weingartner, R.: An introduction to the hydrological modelling system PREVAH and its pre- and post-processing-tools, Environ. Modell. Softw., 24, 1209–1222, https://doi.org/10.1016/j.envsoft.2009.04.001, 2009. a, b, c
Zappa, M., Rotach, M. W., Arpagaus, M., Dorninger, M., Hegg, C., Montani, A., Ranzi, R., Ament, F., Germann, U., Grossi, G., Jaun, S., Rossa, A., Vogt, S., Walser, A., Wehrhan, J., and Wunram, C.: MAP D-PHASE: Real-time demonstration of hydrological ensemble prediction systems, Atmos. Sci. Lett., 9, 80–87, https://doi.org/10.1002/asl.183, 2008. a, b, c, d
Zappa, M., Jaun, S., Germann, U., Walser, A., and Fundel, F.: Superposition of three sources of uncertainties in operational flood forecasting chains, Atmos. Res., 100, 246–262, https://doi.org/10.1016/j.atmosres.2010.12.005, 2011. a, b, c, d, e, f, g, h, i
Zappa, M., Bernhard, L., Spirig, C., Pfaundler, M., Stahl, K., Kruse, S., Seidl, I., and Stähli, M.: A prototype platform for water resources monitoring and early recognition of critical droughts in Switzerland, Proc. IAHS, 523, 804–821, 2014. a