the Creative Commons Attribution 4.0 License.
the Creative Commons Attribution 4.0 License.
 | 17 Jun 2019
A high-resolution spatial assessment of the impacts of drought variability on vegetation activity in Spain from 1981 to 2015
Sergio M. Vicente-Serrano
Cesar Azorin-Molina
Marina Peña-Gallardo
Miquel Tomas-Burguera
Fernando Domínguez-Castro
Natalia Martín-Hernández
Santiago Beguería
Ahmed El Kenawy
Iván Noguera
Mónica García
Drought is a major driver of vegetation activity in Spain, with significant impacts on crop yield, forest growth, and the occurrence of forest fires. Nonetheless, the sensitivity of vegetation to drought conditions differs largely amongst vegetation types and climates. We used a high-resolution (1.1 km) spatial dataset of the normalized difference vegetation index (NDVI) for the whole of Spain spanning the period from 1981 to 2015, combined with a dataset of the standardized precipitation evapotranspiration index (SPEI) to assess the sensitivity of vegetation types to drought across Spain. Specifically, this study explores the drought timescales at which vegetation activity shows its highest response to drought severity at different moments of the year. Results demonstrate that – over large areas of Spain – vegetation activity is controlled largely by the interannual variability of drought. More than 90 % of the land areas exhibited statistically significant positive correlations between the NDVI and the SPEI during dry summers (JJA). Nevertheless, there are some considerable spatio-temporal variations, which can be linked to differences in land cover and aridity conditions. In comparison to other climatic regions across Spain, results indicate that vegetation types located in arid regions showed the strongest response to drought. Importantly, this study stresses that the timescale at which drought is assessed is a dominant factor in understanding the different responses of vegetation activity to drought.
- Article
(10027 KB) - Full-text XML
-
Supplement
(5925 KB) - BibTeX
- EndNote


Drought is one of the major hydroclimatic hazards impacting land surface fluxes (Baldocchi et al., 2004; Fischer et al., 2007; Hirschi et al., 2011), vegetation respiration (Ciais et al., 2005), net primary production (Reichstein et al., 2007; Zhao and Running, 2010), primary and secondary forest growth (Allen et al., 2015), and crop yield (Lobell et al., 2015; Asseng et al., 2015). Recently, numerous studies suggested an accelerated impact of drought on vegetation activity and forest mortality under different environmental conditions (Allen et al., 2010, 2015; Breshears et al., 2005) with a reduction in vegetation activity and higher rates of tree decay (e.g. Carnicer et al., 2011; Restaino et al., 2016). Nevertheless, a comprehensive assessment of the impacts of drought on vegetation activity is a challenging task. This is particularly because data on forest conditions and growth are partial, spatially sparse, and restricted to a small number of sampled forests (Grissino-Mayer and Fritts, 1997). Furthermore, the temporal resolution of forest data is insufficient to provide deep insights into the impacts of drought on vegetation activity (e.g. the official forest inventories; Jenkins et al., 2003). In addition to these challenges, the spatial and temporal data on crops are often limited, as they are mostly aggregated to administrative levels and provided at the annual scale, with minor information on vegetation activity across the different periods of the year (FAO, 2018). To handle these limitations, numerous studies have alternatively employed the available remotely sensed data to assess the impacts of drought on vegetation activity (e.g. Ji and Peters, 2003; Wan et al., 2004; Rhee et al., 2010; Zhao et al., 2017).
Several space-based products allow for quantifying vegetation conditions, given that active vegetation responds dissimilarly to the electromagnetic radiation received in the visible and near-infrared parts of the vegetation spectrum (Knipling, 1970). As such, with the available spectral information recorded by sensors on board satellite platforms, it is possible to calculate vegetation indices and accordingly assess vegetation activity (Tucker, 1979). In this context, several studies have already employed vegetation indices not only to develop drought-related metrics (e.g. Kogan, 1997; Mu et al., 2013), but to determine the impacts of drought on vegetation conditions as well (García et al., 2010; Vicente-Serrano et al., 2013; Zhang et al., 2017). An inspection of these studies reveals that drought impacts can be characterized using vegetation indices, albeit with a different response of vegetation dynamics as a function of a wide-range of factors, including – among others – vegetation type, bioclimatic conditions, and drought severity (Bhuiyan et al., 2006; Vicente-Serrano, 2007; Quiring and Ganesh, 2010; Ivits et al., 2014).
Given the high interannual variability of precipitation, combined with the prevailing semi-arid conditions across vast areas of the territory, Spain has suffered from frequent, intense, and severe drought episodes during the past decades (Vicente-Serrano, 2006). Nonetheless, in the era of temperature rise, the observed increase in atmospheric evaporative demand (AED) during the last decades has accelerated the severity of droughts (Vicente-Serrano et al., 2014c), in comparison to the severity caused only by precipitation deficits (Vicente-Serrano et al., 2014b; González-Hidalgo et al., 2018). Over Spain, the hydrological and socio-economic impacts of droughts are well-documented. Hydrologically, droughts are often associated with a decrease in streamflow and reservoir storages (Lorenzo-Lacruz et al., 2010, 2013). The impacts of drought can extend further to crops, leading to crop failure due to deficit in irrigation water (Iglesias et al., 2003), and even in arable unirrigated lands (Austin et al., 1998; Páscoa et al., 2017). Over Spain, numerous investigations also highlighted the adverse impacts of drought on forest growth (e.g. Camarero et al., 2015; Gazol et al., 2018; Peña-Gallardo et al., 2018a) and forest fires (Hill et al., 2008; Lasanta et al., 2017; Pausas, 2004; Pausas and Fernández-Muñoz, 2012).
Albeit with these adverse drought-driven impacts, there is a lack of comprehensive studies that assess the impacts of drought on vegetation activity over the entire Spanish territory, with a satisfactorily temporal coverage. While numerous studies employed remotely sensed imagery and vegetation indices to analyse spatial and temporal variability and trends in vegetation activity over Spain (e.g. del Barrio et al., 2010; Julien et al., 2011; Stellmes et al., 2013), few attempts have been made to link the temporal dynamics of satellite-derived vegetation activity with climate variability and drought evolution (e.g. Vicente-Serrano et al., 2006; Udelhoven et al., 2009; Gouveia et al., 2012; Mühlbauer et al., 2016). An example is González-Alonso and Casanova (1997), who analysed the spatial distribution of droughts in 1994 and 1995 over Spain, concluding that the most affected areas are semi-arid regions. In their comparison of the MODIS normalized difference vegetation index (NDVI) data and the standardized precipitation index (SPI) over Spain, García-Haro et al. (2014) indicated that the response of vegetation dynamics to climate variability is highly variable, according to the regional climate conditions, vegetation community, and growth stages. A similar finding was also confirmed by Vicente-Serrano (2007) and Contreras and Hunink (2015) in their assessment of the response of NDVI to drought in semi-arid regions of northeast and southeast Spain, respectively. With these comprehensive efforts, a detailed spatial assessment of the links between droughts and vegetation activity, which covers a long time period (decades), is highly desired for Spain to explore the differences in the response of vegetation activity to drought under different environments with various land cover and vegetation types.
The overriding objectives of this study are (i) to determine the possible differences in the response of vegetation activity to drought over Spain, as a function of the different land cover types and climatic conditions, and (ii) to explore the drought timescales at which vegetation activity highly responds to drought severity. An innovative aspect of this study is that it provides – for the first time – a comprehensive assessment of the response of vegetation activity to drought using a multidecadal (1981–2015) high-spatial-resolution (1.1 km) NDVI dataset over the study region.
2.1 Datasets
2.1.1 NDVI data
Globally, there are several NDVI datasets, which have been widely used to analyse NDVI variability and trends (e.g. Slayback et al., 2003; Herrmann et al., 2005; Anyamba and Tucker, 2005) and to assess the links between NDVI and climate variability and drought (e.g. Dardel et al., 2014; Vicente-Serrano et al., 2015; Gouveia et al., 2016). Amongst these global datasets, the most widely used are those derived from the Advanced Very High Resolution Radiometer (AVHRR) sensor on board the NOAA satellites and those retrieved from the Moderate Resolution Imaging Spectroradiometer (MODIS) data. Both products have been widely employed to evaluate the possible influence of drought on vegetation dynamics in different regions worldwide (e.g. Tucker et al., 2005; Gu et al., 2007; Sona et al., 2012; Pinzon and Tucker, 2014; Ma et al., 2015). While the Global Inventory Modeling and Mapping Studies (GIMMS) dataset from NOAA AVHRR is available at a semi-monthly temporal resolution for the period from 1981 onwards (Tucker et al., 2005; Pinzon and Tucker, 2014), its spatial resolution is quite low (64 km2), which makes it difficult to capture the high spatial variability of vegetation cover over Spain. However, the NDVI dataset derived from MODIS dates back only to 2001 (Huete et al., 2002), which is insufficient to give insights into the long-term response of vegetation activity to drought. To overcome these spatial and temporal limitations, our decision was made to employ a recently developed high-resolution spatial NDVI dataset (Sp_1Km_NDVI), which is available at grid intervals of 1.1 km, spanning the period from 1981 onwards. In accordance with the GIMMS dataset, Sp_1Km_NDVI is available at a semi-monthly temporal resolution. This dataset has already been validated (Vicente-Serrano et al., 2018), showing high performance in comparison to other available NDVI datasets. As such, it can be used – with confidence – to provide a multidecadal assessment of NDVI variability at high spatial resolution, especially in areas of highly variable vegetation. Herein, it is noteworthy to indicate that the data from the Sp_1Km_NDVI dataset was standardized (sNDVI), so that each series has an average equal to zero and a standard deviation equal to 1. This procedure is motivated by the strong seasonality and spatial differences of vegetation activity over Spain. Following this procedure, the magnitudes of all NDVI time series are comparable over space and time. To accomplish this task, the data were fitted to a log-logistic distribution, which shows better skill in standardizing environmental variables, in comparison to other statistical distributions (Vicente-Serrano and Beguería, 2016).
In order to limit the possible impact of changes in land cover on the dependency between drought and vegetation cover, we assumed that strong changes in NDVI can be seen as an indicator of changes in land cover. As such, those pixels with strong changes in NDVI during the study period were excluded from the analysis. These pixels were defined after an exploratory analysis in which we tested different thresholds. Specifically, we excluded those pixels that exhibited a decrease in the annual NDVI higher than 0.05 units or an increase higher than 0.15 units between 1981 and 2015. The spatial distribution of these pixels (not shown here) concurs well with the areas identified in earlier studies over Spain in which there was an abrupt modification of the land cover type: creation of new irrigated lands (Lasanta and Vicente-Serrano, 2012; Lecina et al., 2010; Stellmes et al., 2013; Vicente-Serrano et al., 2018), urban expansion (Gallardo and Martínez-Vega, 2016; Palazón et al., 2016; Serra et al., 2008), agricultural abandonment (Lasanta et al., 2017), deforestation (Camarero et al., 2015; Carnicer et al., 2011), reforestation (Ortigosa et al., 1990), etc. Furthermore, to avoid the possible influence of spatial autocorrelation, which can occur in areas with dominant positive changes in NDVI due to excessive rural exodus and natural revegetation processes (Hill et al., 2008; Vicente-Serrano et al., 2018), we detrended the standardized NDVI series by means of a linear model. We then add the residuals of the linear trend to the average of NDVI magnitude over the study period. A similar approach has been adopted in several environmental studies (Olsen et al., 2013; Xulu et al., 2018; Zhang et al., 2016). Correlations with the drought dataset were based on the sNDVI.
2.1.2 Drought dataset
Due to its complicated physiological strategies to cope with water stress, vegetation can show specific and even individual resistance and vulnerability to drought (Chaves et al., 2003; Gazol et al., 2017, 2018). As such, it is quite difficult to directly assess the impacts of drought on vegetation activity and forest growth. Alternatively, drought indices can be an appropriate tool to make this assessment, particularly with their calculation at multiple timescales. These timescales summarize the accumulated climatic conditions over different periods, which make drought indices closely related to impact studies. Overall, to calculate drought indices, we employed data for a set of meteorological variables (i.e. precipitation, maximum and minimum air temperature, relative humidity, sunshine duration, and wind speed) from a recently developed gridded climatic dataset (Vicente-Serrano et al., 2017). This gridded dataset was developed using a dense network of quality-controlled and homogenized meteorological records. Data are available for the whole Spanish territory at a spatial resolution of 1.1 km, which is consistent with the resolution of the NDVI dataset (Sect. 2.1.1). Based on this gridded dataset, we computed the atmospheric evaporative demand (AED) and the standardized precipitation evapotranspiration index (SPEI). We used the reference evapotranspiration (ETo) as the most reliable way of estimating the AED. ETo was calculated using the physically based FAO-56 Penman–Monteith equation (Allen et al., 1998). Conversely, the SPEI was computed using precipitation and ETo data (Vicente-Serrano et al., 2010). The SPEI is one of the most widely used drought indices and has thus been employed to quantify drought in a number of agricultural (e.g. Peña-Gallardo et al., 2018b), environmental (e.g. Vicente-Serrano et al., 2012; Bachmair et al., 2018), and socio-economic applications (e.g. Bachmair et al., 2015; Stagge et al., 2015). The SPEI is advantageous compared to the Palmer Drought Severity Index (PDSI), as it is calculated at different timescales. In comparison to the standardized precipitation index (SPI) (McKee et al., 1993), the SPEI does not account only for precipitation, but it also considers the contribution of ETo in drought evolution.
In this work, the SPEI was calculated for the common 1- to 24-month timescales, but here, given the semi-monthly availability of the data, we calculated the corresponding 1- to 48-semi-monthly timescales. The preference to use various timescales is motivated by our intention to characterize the response of different hydrological and environmental systems to drought. It is well-recognized that natural systems can show different responses to the timescales of drought (Vicente-Serrano et al., 2011, 2013). The timescale refers to the period in which antecedent climate conditions are accumulated and it allows adaptation of the drought index to the drought impacts since different hydrological and environmental systems show different response sensitivities to the timescales of climate variability. This has been shown for hydrological systems (López-Moreno et al., 2013; Barker et al., 2016), but ecological and agricultural systems also show strong differences in the response to different timescales of climatic droughts (Pasho et al., 2011; Peña-Gallardo et al., 2018b) given different biophysical conditions and the different strategies of vegetation types to cope with water stress (Chaves et al., 2003; McDowell et al., 2008), which are strongly variable in complex Mediterranean ecosystems. For instance, drought indices can be calculated on flexible timescales since it is not known a priori the most suitable period at which the NDVI responds. Herein, we also detrended and standardized the semi-monthly SPEI data to be comparable with the de-trended sNDVI.
Finally, we used the CORINE Land Cover for 2000 (https://land.copernicus.eu/pan-european/corine-land-cover, last access: 21 May 2019) to determine how land cover can impact the response of NDVI to drought severity. This map is representative of the main classes of land cover in the study domain over the period of investigation.
2.2 Statistical analysis
We used the Pearson's r correlation coefficient to assess the relationship between the interannual variability of the sNDVI and SPEI. This association was evaluated independently for each semi-monthly period of the year. Specifically, we calculated the correlation between the sNDVI for each semi-monthly period and SPEI recorded in the same period, at 1- and 48-semi-monthly timescales. Significant correlations were set at p<0.05. Importantly, as the data of the sNDVI and SPEI were de-trended, the possible impact of serial correlation on the correlation between sNDVI and SPEI is minimized, with no spurious correlation effects that can be expected from the co-occurrence of the trends. Similarly, as the data were analysed for each semi-monthly period independently, our results are free from any seasonality effect. Given that it is not possible to know a priori the best cumulative period to explain the response of the vegetation activity to drought variability, we retained for further analysis the maximum correlation, independently of the timescale at which this is obtained.
Based on the correlation coefficients between the sNDVI and SPEI in the study domain, we determined the semi-monthly period of the year and the SPEI timescale at which the maximum correlation is found. This information was then used to determine the spatial and seasonal variations according to the different land cover categories. Finally, the average climate conditions over the study domain, including aridity (precipitation minus ETo) and average temperature, were related to the timescales at which the maximum correlation between the sNDVI and SPEI was found.
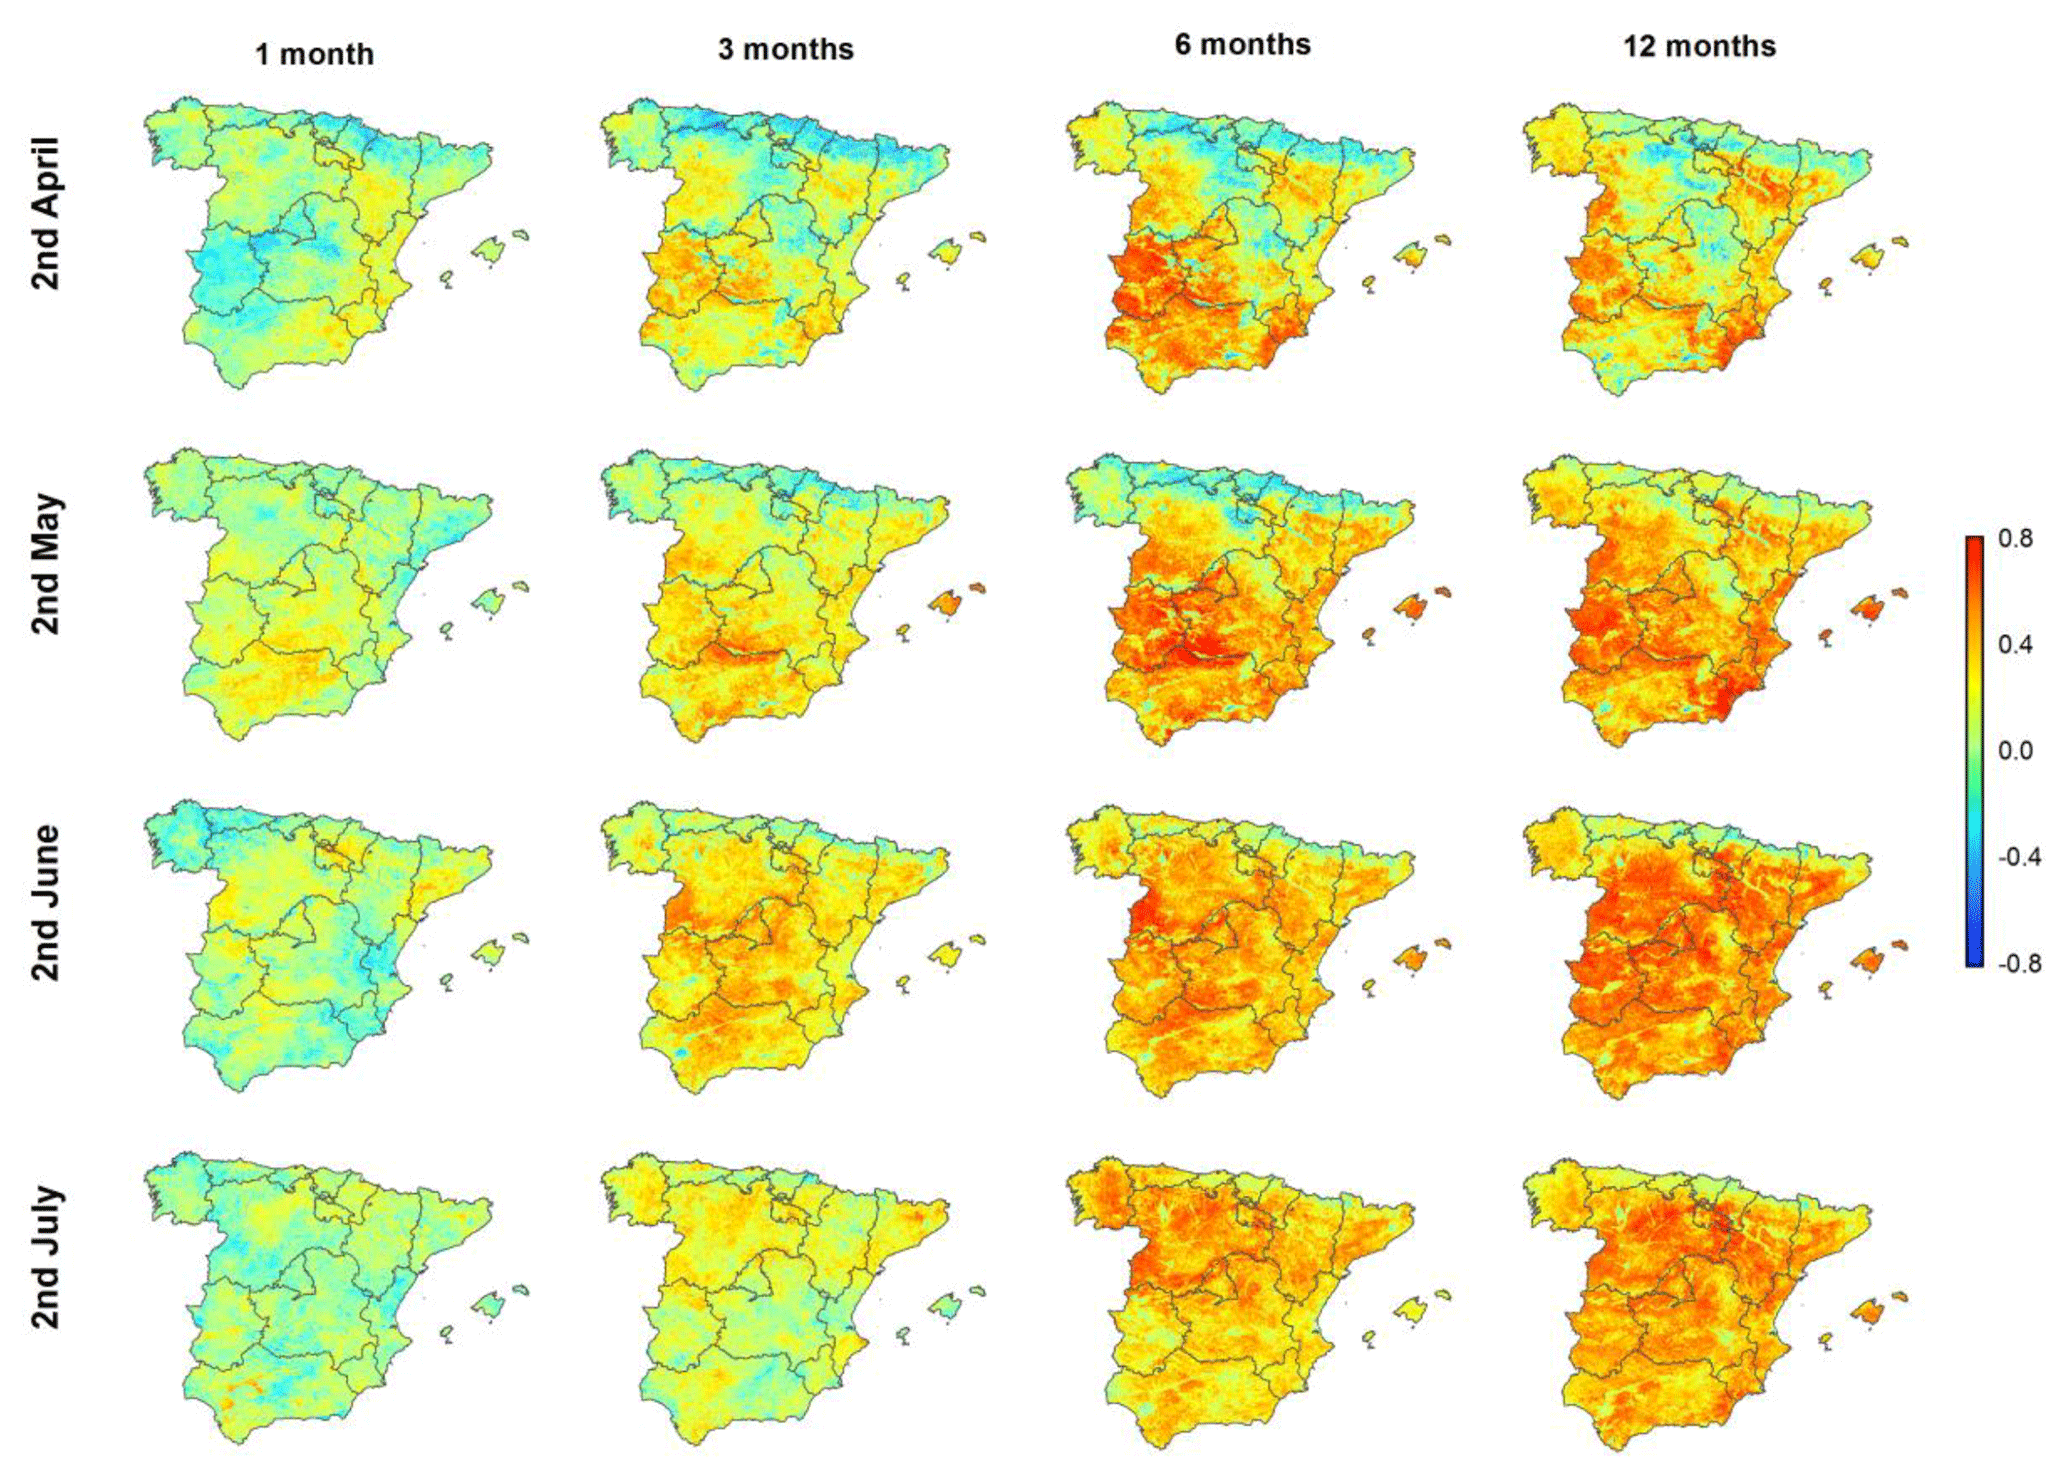
Figure 1Spatial distribution of the Pearson's r correlation coefficient calculated between the sNDVI and different SPEI timescales for different semi-monthly periods.
3.1 General influence of drought on the sNDVI
Figure 1 shows an example of the spatial distribution of the Pearson's r correlation coefficients calculated between the sNDVI and the SPEI at the timescales of 1, 3, 6, and 12 months (2, 6, 12 and 24 semi-monthly periods). Results are shown only for the second semi-monthly period of each month between April and July. The differential response of the NDVI to the different timescales of the SPEI is illustrated. As depicted, the 6-month timescale was more relevant to vegetation activity in large areas of southwestern and southeastern Spain during the second half of April. Conversely, vegetation activity was more determined by the 12-month SPEI across the Ebro basin in northeastern Spain. This stresses the need to consider different drought timescales to know the climate cumulative period that mostly affects vegetation activity. The 6-month and 12-month SPEIs produced similar results during the second period of May, while the 12-month timescale is more related to vegetation activity in June and July.
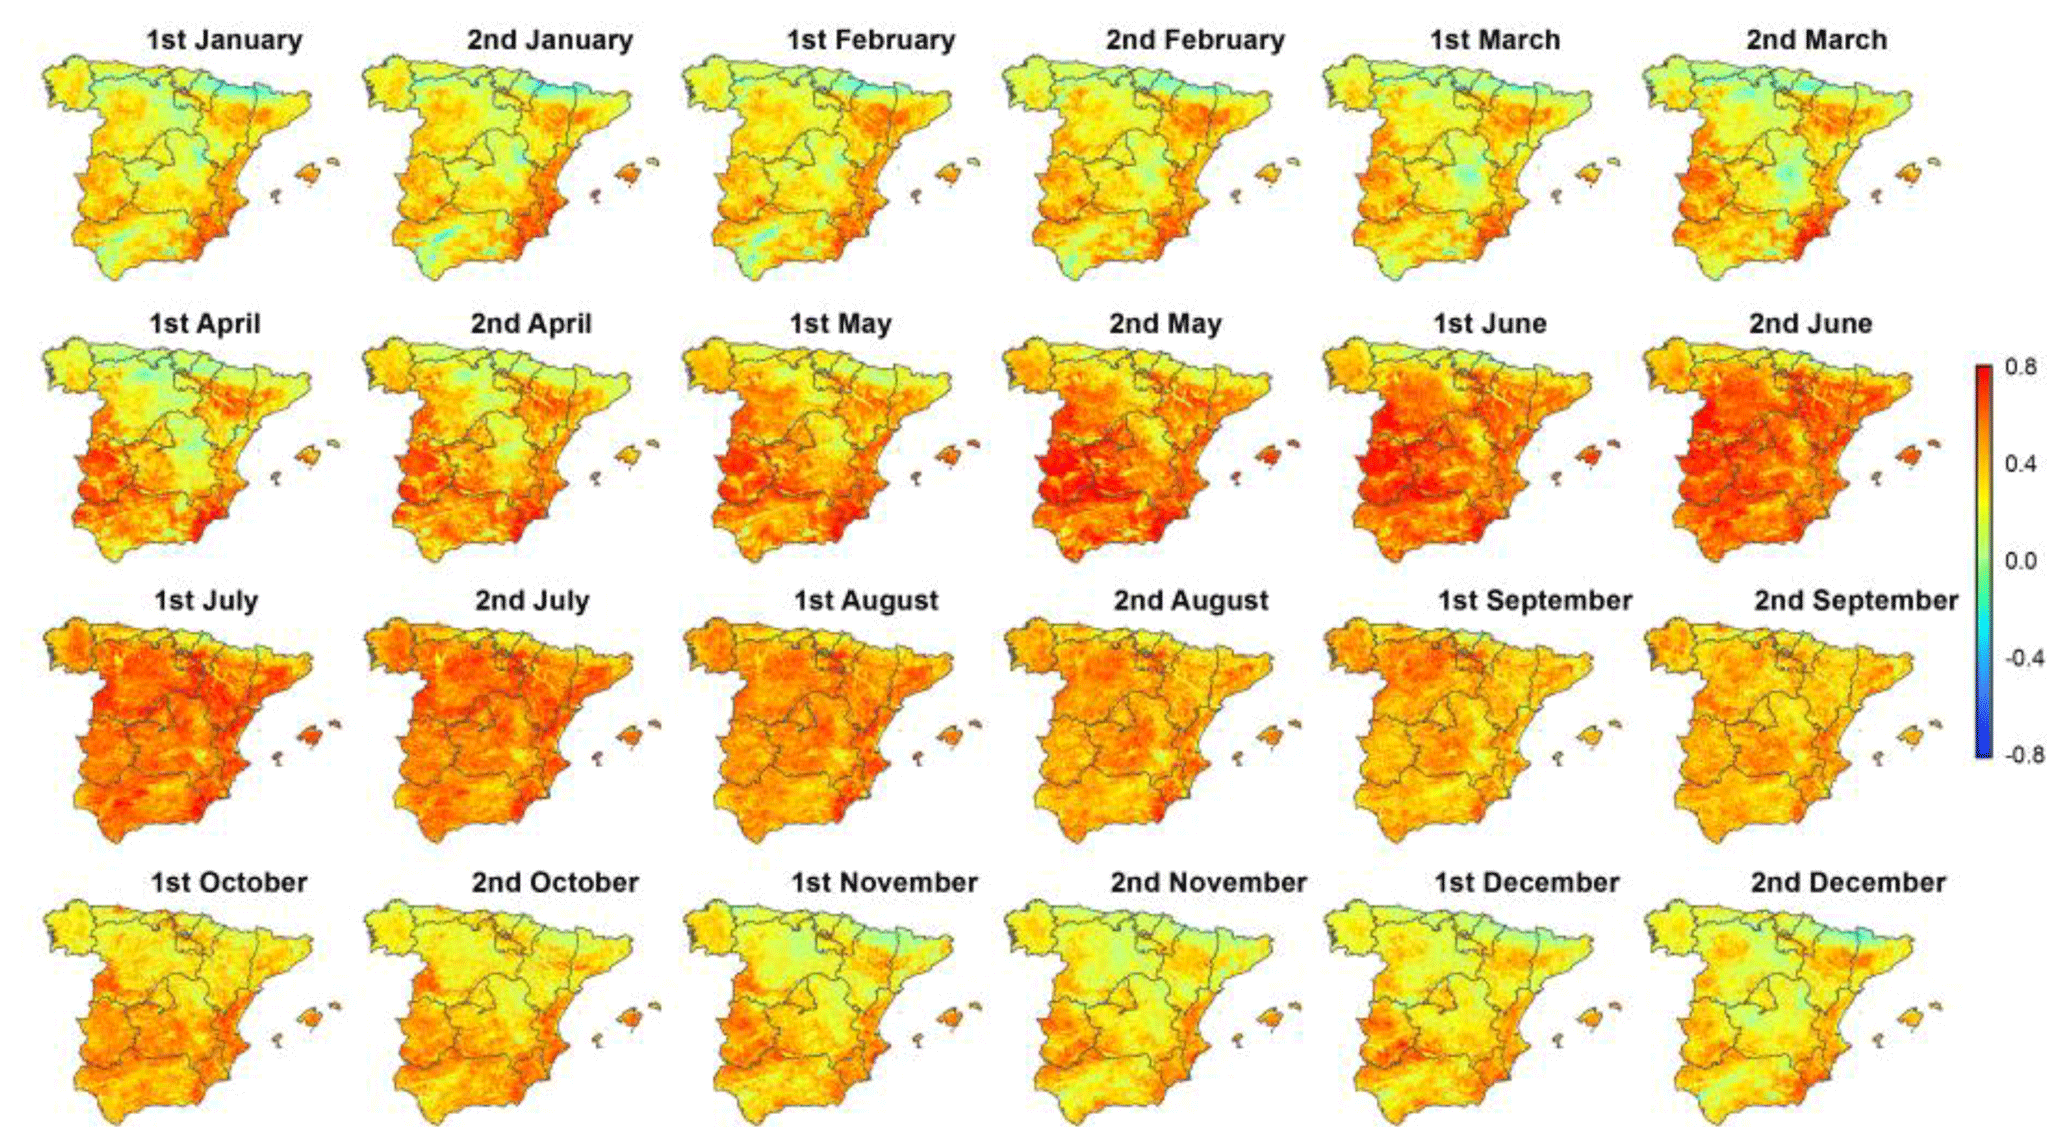
Figure 2Spatial distribution of the maximum correlation between the sNDVI and the SPEI during the different semi-monthly periods.
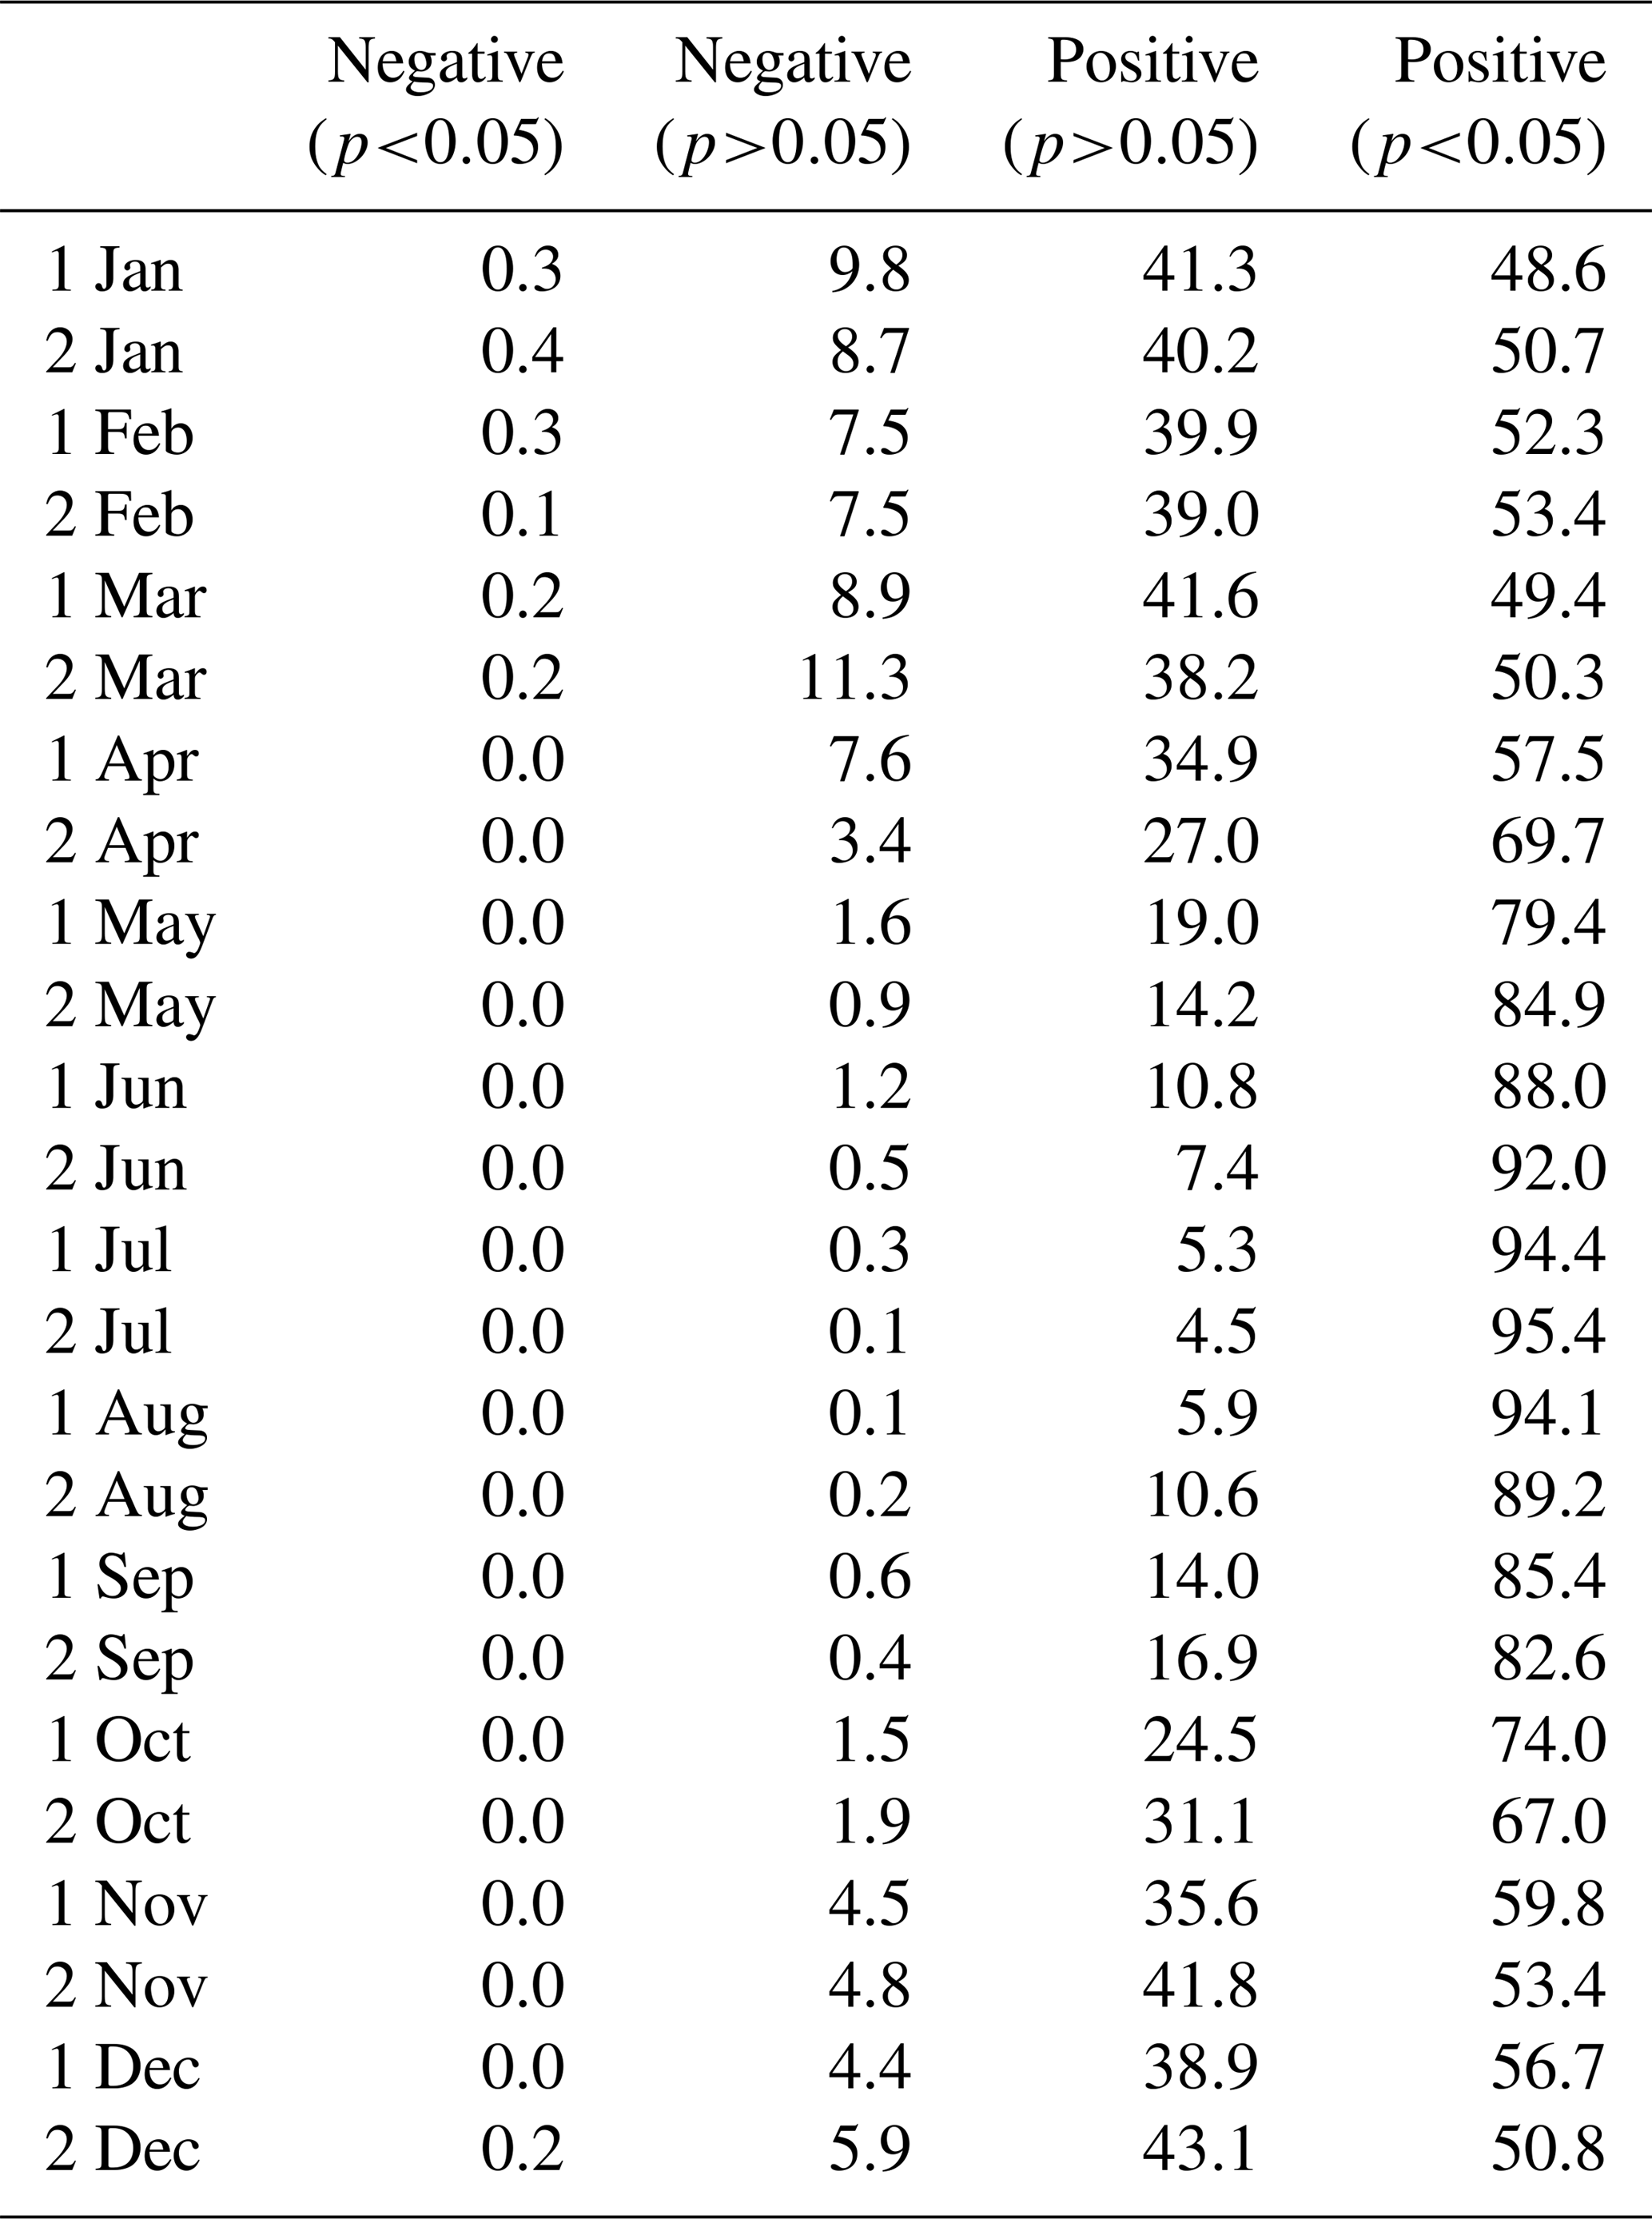
Figure 2 summarizes the maximum correlation between the sNDVI and the SPEI, providing insights into the differential response of the NDVI to drought. It can be noted that there are clear seasonal and spatial differences in the response of sNDVI to the SPEI. The sNDVI is more related to the SPEI during the warm season (MJJA). In contrast, the response of the sNDVI to drought is less pronounced from September to April, albeit with some exceptions. One example is the response of vegetation to drought alongside the southeastern Mediterranean coastland, where the correlation between sNDVI and SPEI is almost high all year. Table 1 summarizes the percentage of the total area exhibiting significant or non-significant correlations over Spain during the different semi-monthly periods. Positive (lower sNDVI with drought) and statistically significant correlations are dominant across the entire territory, but with a seasonal component. In particular, a higher percentage of the territory shows positive and significant correlations during the warm season (MJJA). From the middle of May to middle of September, more than 80 % of the study domain shows positive and significant correlations between the sNDVI and the SPEI. A similar finding is also found between the middle of June and the beginning of August. Figure 3 summarizes the average correlations between the SPEI and sNDVI. As illustrated, there is a gradual increase in the response of the sNDVI to the SPEI from the beginning of May to the end of July, when the maximum average correlation is recorded. In contrast, the correlations between the SPEI and sNDVI decrease progressively from August to December.
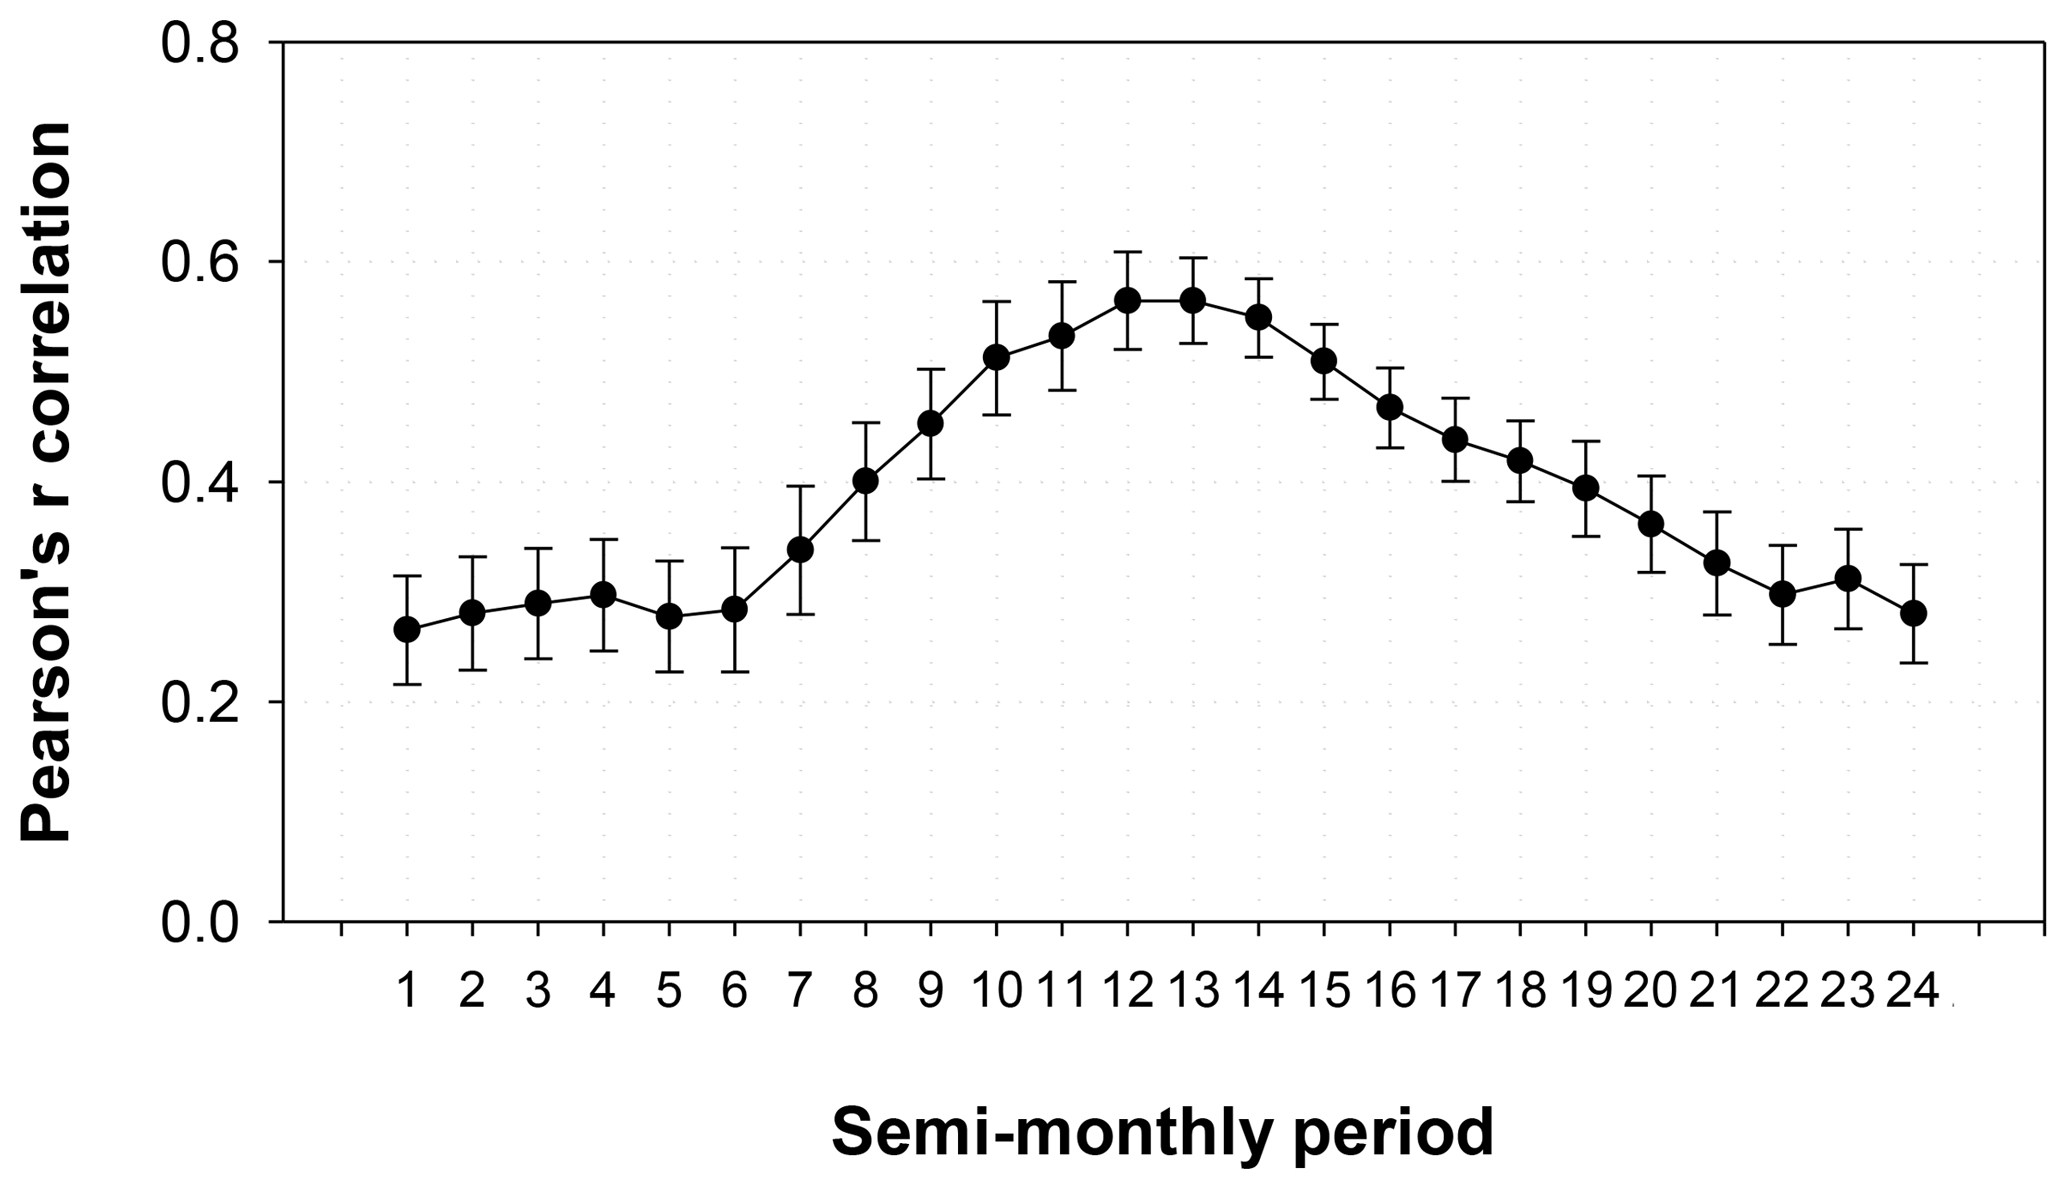
Figure 3Spatial average and standard error of the Pearson's r correlation coefficient between the sNDVI and SPEI time series.
Table 1Percentage of the total surface area according to the different significance categories of Pearson's r correlations between the sNDVI and SPEI.
The response of the sNDVI to different timescales of the SPEI and seasons is quite complex. Figure 4 shows the spatial distribution of the SPEI timescale at which the maximum correlation was found for each one of the 24 semi-monthly periods of the year. It can be noted that there are considerable seasonal and spatial differences. Nonetheless, these differences are masked with the estimated average values of the SPEI timescale recorded for the semi-monthly periods (Fig. 5), which are less variable (oscillating between 18 and 22 semi-monthly periods – 9–11 months) throughout the year. In general, the areas and periods with higher correlations are recorded at 7- and 24-semi-monthly timescales (3–12 months).
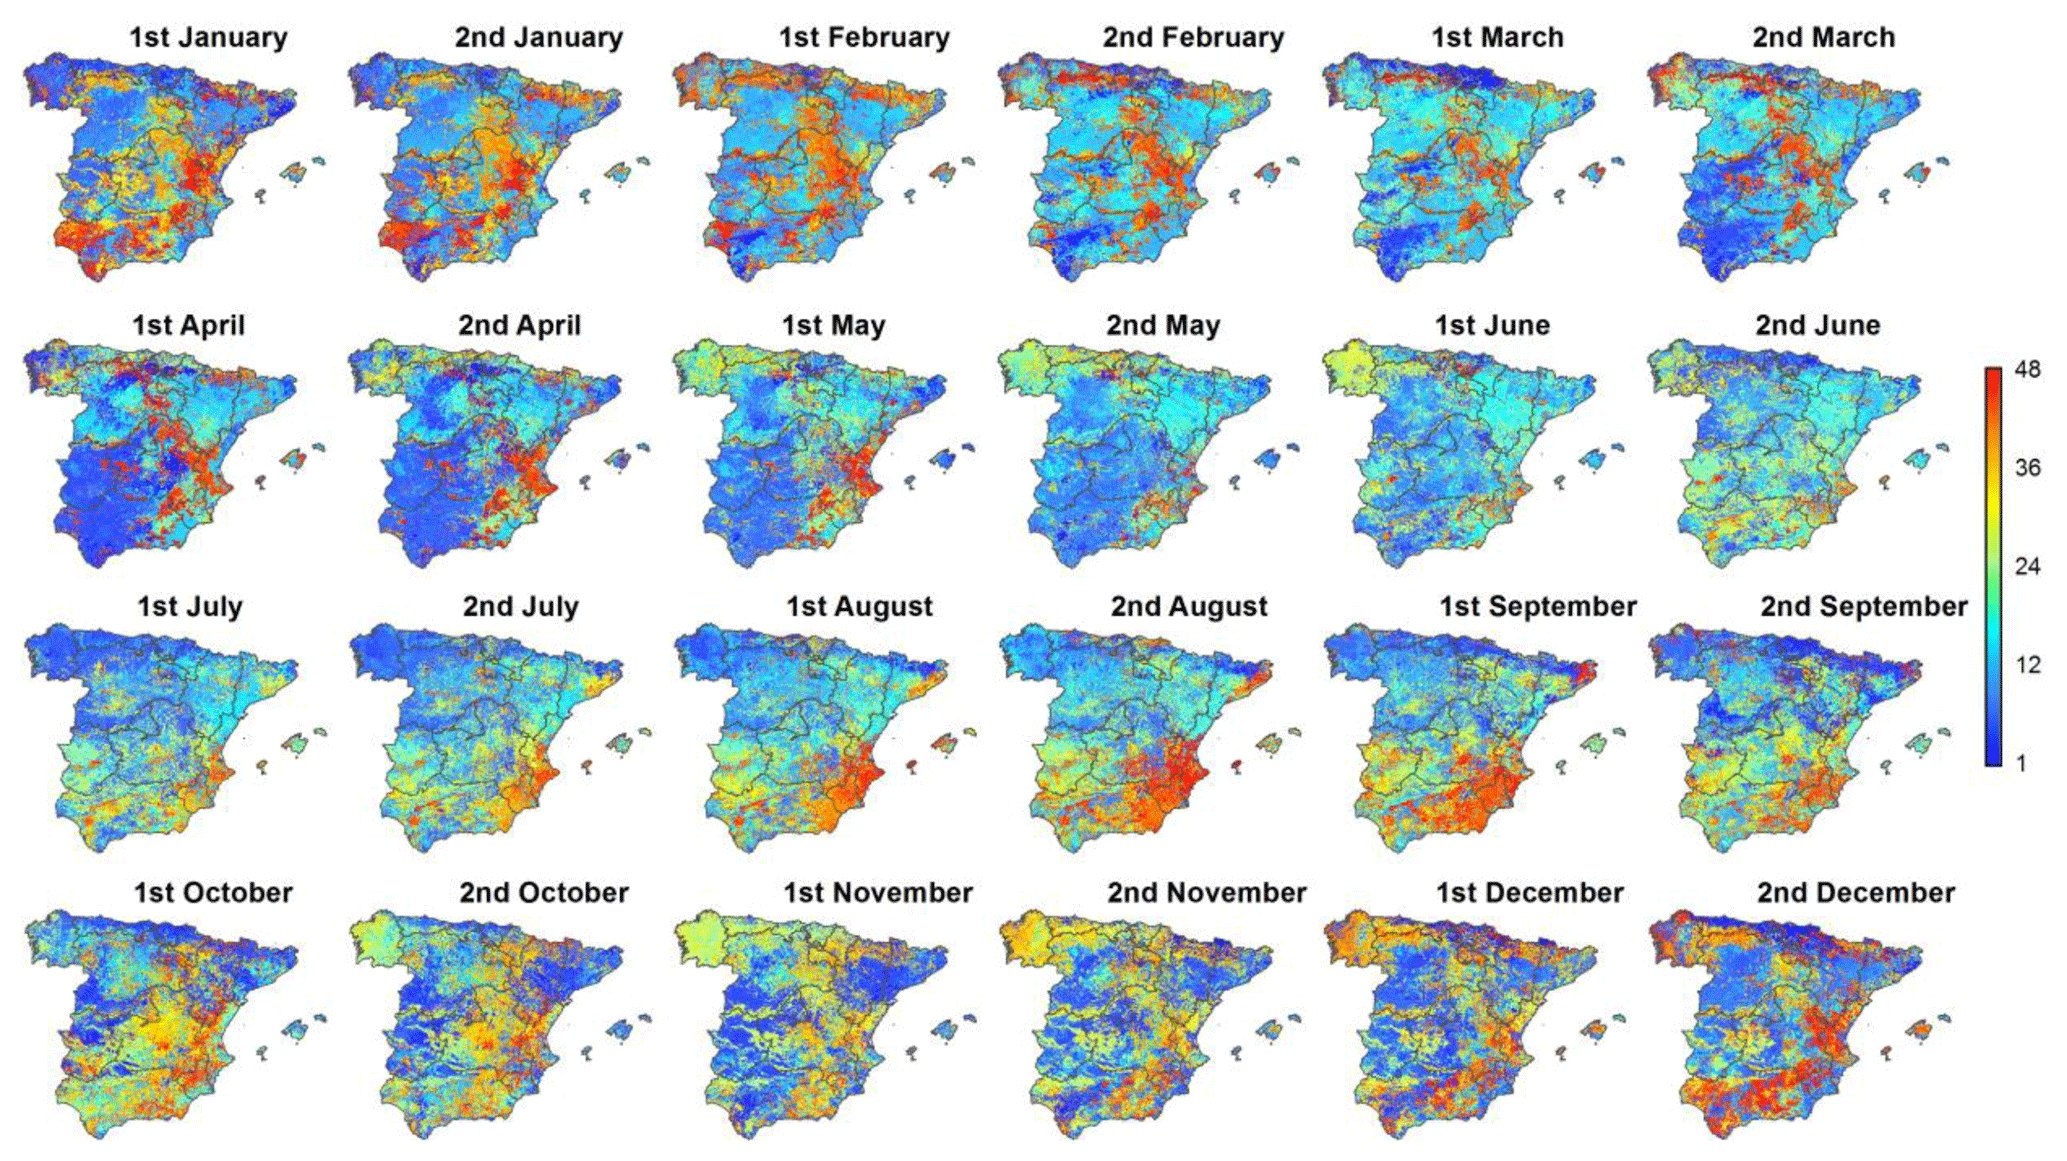
Figure 4Spatial distribution of the SPEI timescales at which the maximum correlation between the sNDVI and SPEI is found for each one of the semi-monthly periods.

Figure 5Average and standard error of the SPEI timescale at which the maximum Pearson's r correlation coefficient between the sNDVI and SPEI is found.
3.2 Land cover differences
There are differences in the magnitude and seasonality of the Pearson's r correlation coefficients among all land cover types. Figure 6 shows the average and standard error of the mean of the maximum Pearson's r coefficients between the sNDVI and SPEI for the different land cover types and the 24 semi-monthly periods. The magnitudes of correlation vary considerably, as a function of land cover type, as well as the period of the year in which the highest correlations are recorded. The unirrigated arable lands show a peak of significant correlation between April and June. However, this correlation decreases towards the end of the year. The majority of this land cover shows positive and significant correlations between May and September (Supplement Table S1), with percentages almost close to 100 %. Conversely, irrigated lands do not show such a strong response to drought during the warm season. Even with the presence of a seasonal pattern, it is less pronounced than the one observed for unirrigated arable lands. Overall, irrigated areas are characterized by positive and significant correlations between sNDVI and SPEI during summertime (Table S2). Similarly, vineyards show a clear seasonal pattern, albeit with a peak of maximum correlations during the late summer (July to August) and early autumn (September to October) (Table S3). Conversely, olive groves show the highest correlation between the sNDVI and SPEI during the second half of May and in October, suggesting a quasi-bimodal response of the NDVI to drought. This pattern is also revealed in the percentage of the surface area with significant correlations (Table S4). In the same context, the areas of natural vegetation exhibit their maximum correlation between the sNDVI and SPEI during summer months. The highest correlations are found in July and August for the forest types, compared to earlier June for the natural grasslands and the areas of sclerophyllous vegetation. Conversely, the mixed forests tend to show lower correlations than broad-leaved and coniferous forests. A quick inspection of all these types of land cover indicates that the correlations between the sNDVI and SPEI are generally positive and significant during summer months (Tables S5 to S11).
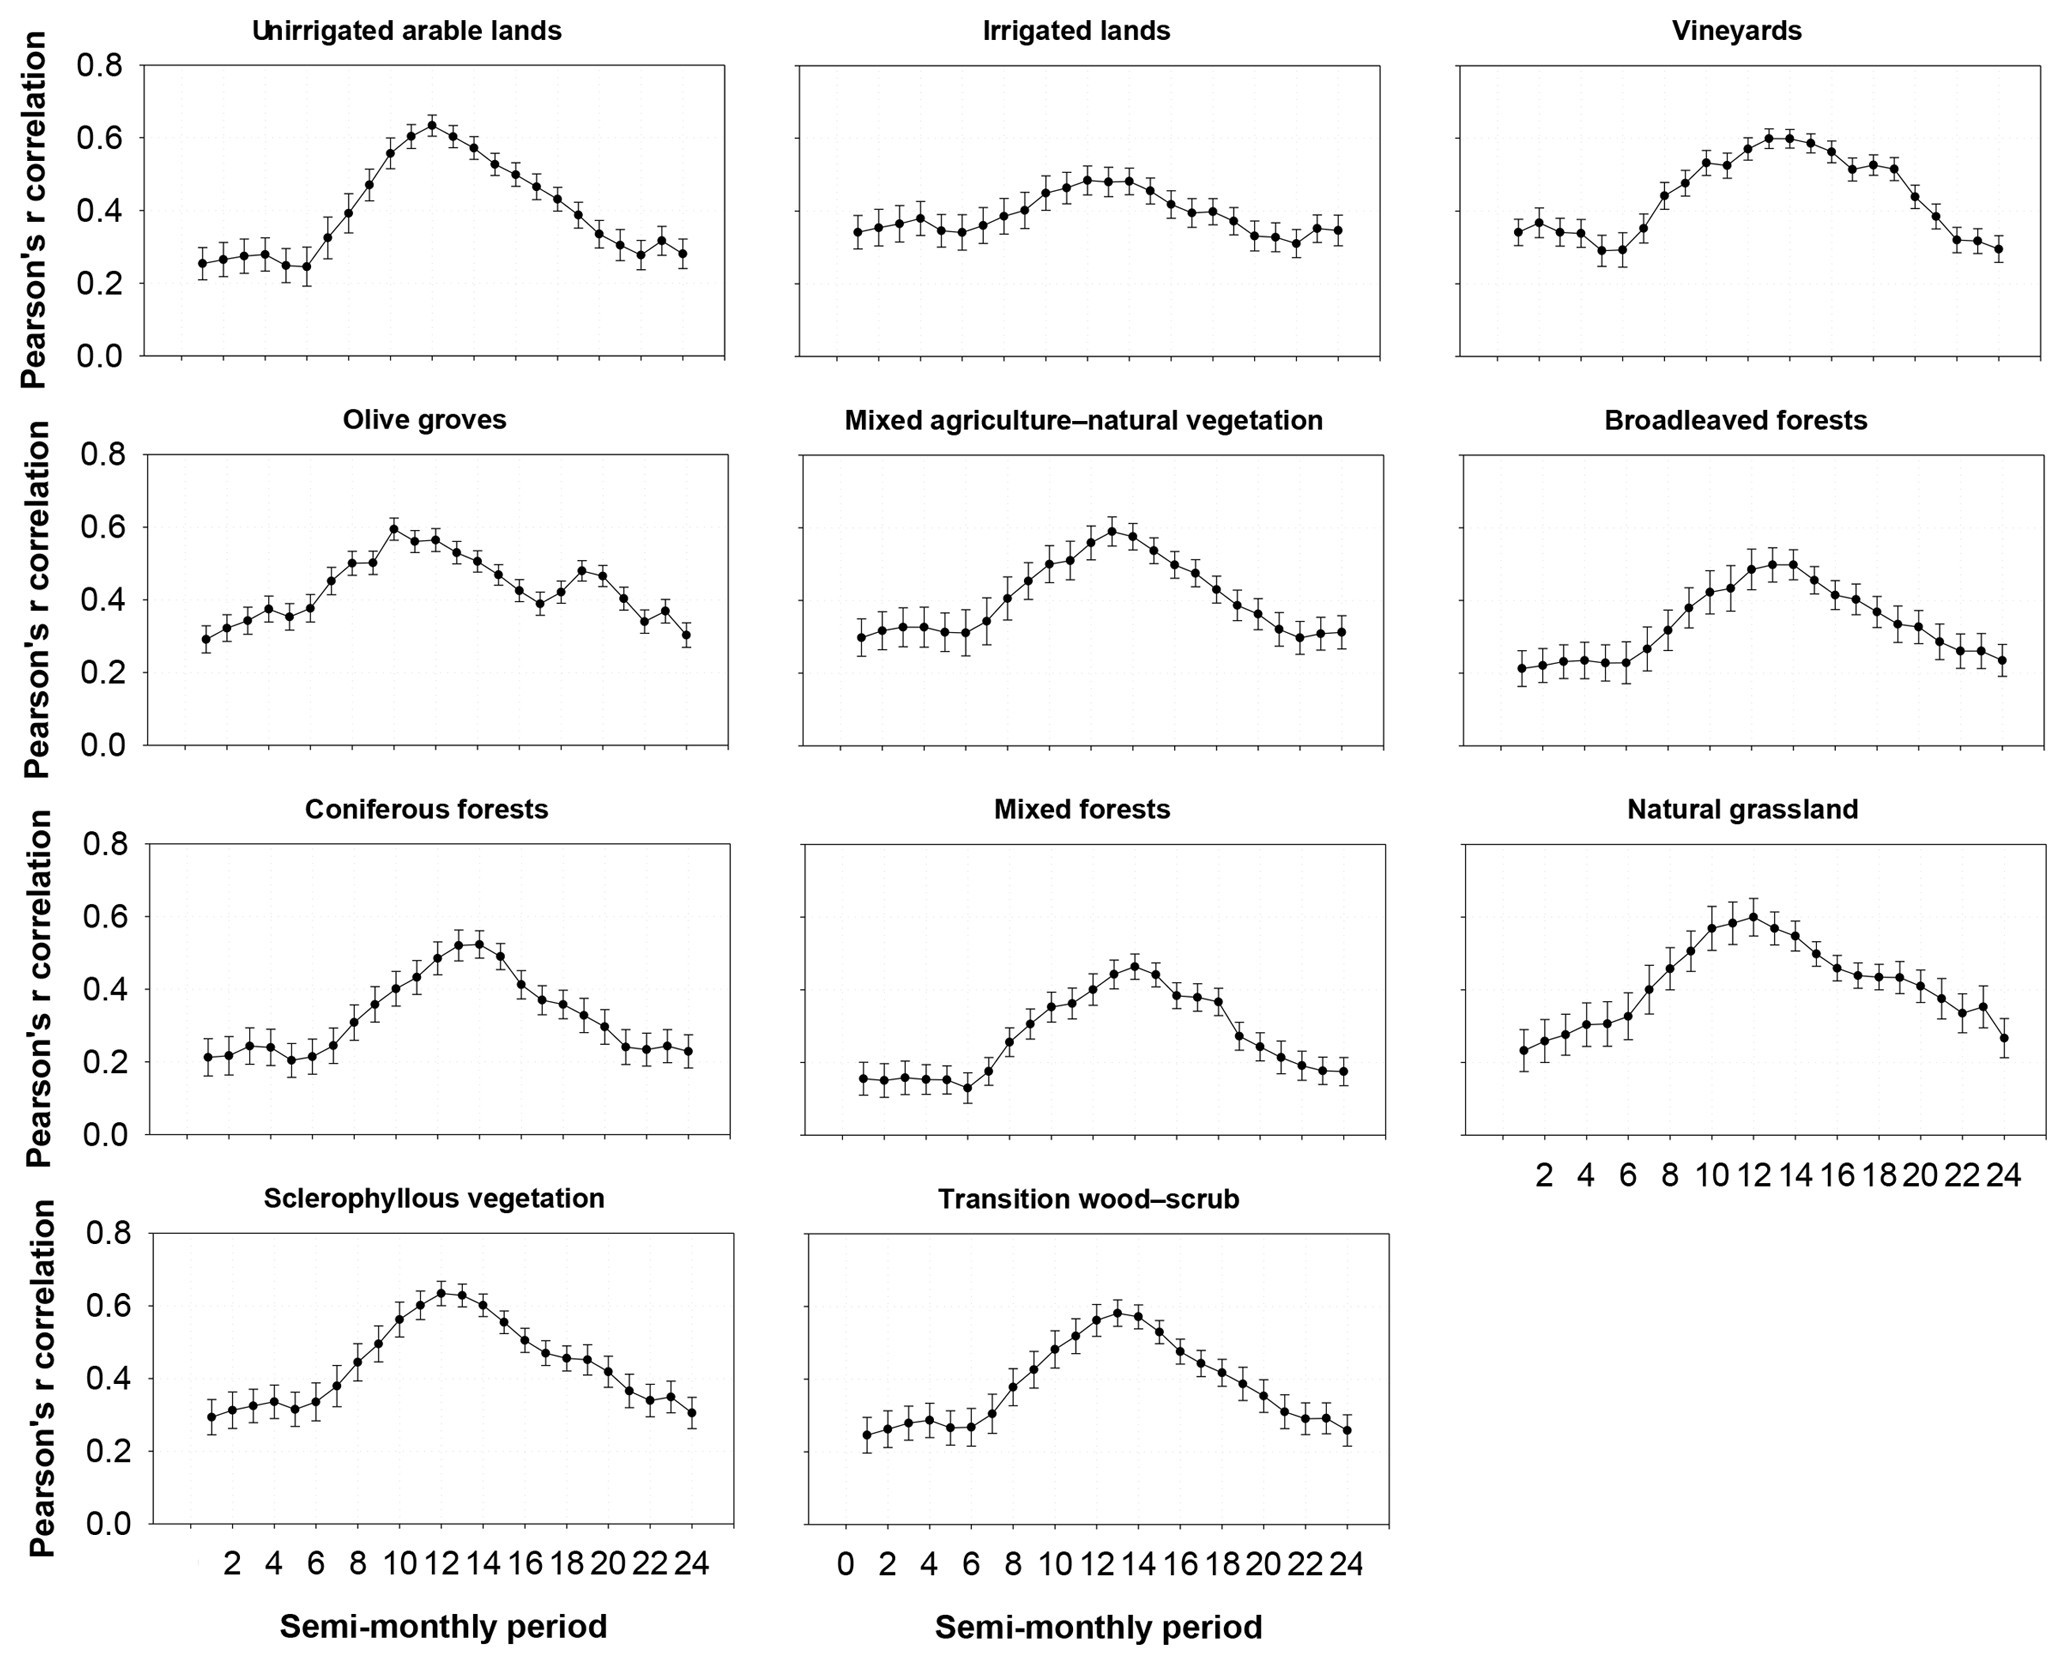
Figure 6Average and standard error of the Pearson's r correlation coefficient between the sNDVI and SPEI for the different land cover types.
Large differences across vegetation types were found for the SPEI timescales at which maximum correlations between sNDVI and the SPEI are found (Fig. 7). For example, for unirrigated arable lands, the maximum correlation between SPEI and sNDVI is found for timescales between 11 and 21 semi-monthly periods. This indicates that crops in May–June (the period in which higher correlations are recorded) respond mostly to the climate conditions recorded between June and December of the preceding year. Irrigated lands show a clear seasonal pattern, as maximum correlations are recorded at timescales between 12 and 18 semi-monthly periods (i.e. 6 to 9 months), mainly between November and May. Conversely, the maximum correlations between sNDVI and SPEI during summer are found for timescales between 25 and 28 semi-monthly periods. Similar to irrigated lands, vineyards show a strong seasonality, responding to longer timescales at the end of summertime. In contrast, natural vegetation areas show a less seasonal response to SPEI timescales, which mostly impact the interannual variability of sNDVI. The SPEI timescales, at which the maximum correlation is found between sNDVI and SPEI, vary from 20 semi-monthly periods during the warm season (MJJAS) to 30 semi-monthly periods during the cold season (ONDJFMA). This finding is evident for all forest types and areas of sclerophyllous vegetation and mixed wood–scrub. The only exception corresponds to natural grasslands, which show a response to shorter SPEI timescales (i.e. 20 semi-monthly periods in winter and 15 in spring and early summer).

Figure 7Average and standard error of the SPEI timescale at which the maximum Pearson's r correlation coefficient was found between the sNDVI and SPEI for the different land cover types.
3.3 Influence of average climatic conditions
In addition to the impact of the timescale at which drought is quantified, the response of vegetation activity to drought can also be closely related to the prevailing climatic conditions. Figure 8 summarizes the spatial correlation between aridity (P-ETo) and the maximum correlation between the sNDVI and SPEI. For most of the semi-monthly periods of the year aridity is negatively correlated with the maximum correlation between sNDVI and SPEI, indicating that vegetation activity at arid sites is more responsive to drought variability. This correlation is more pronounced for the period between December and June. In contrast, this negative association becomes weaker and statistically non-significant during warmer months (July to August). Figure 9 illustrates the spatial correlation between mean air temperature and the maximum correlation between the sNDVI and SPEI. Results demonstrate similar results to those found for aridity, with a general positive and significant correlation from March to June, followed by a non-significant and weak correlation during summer months.
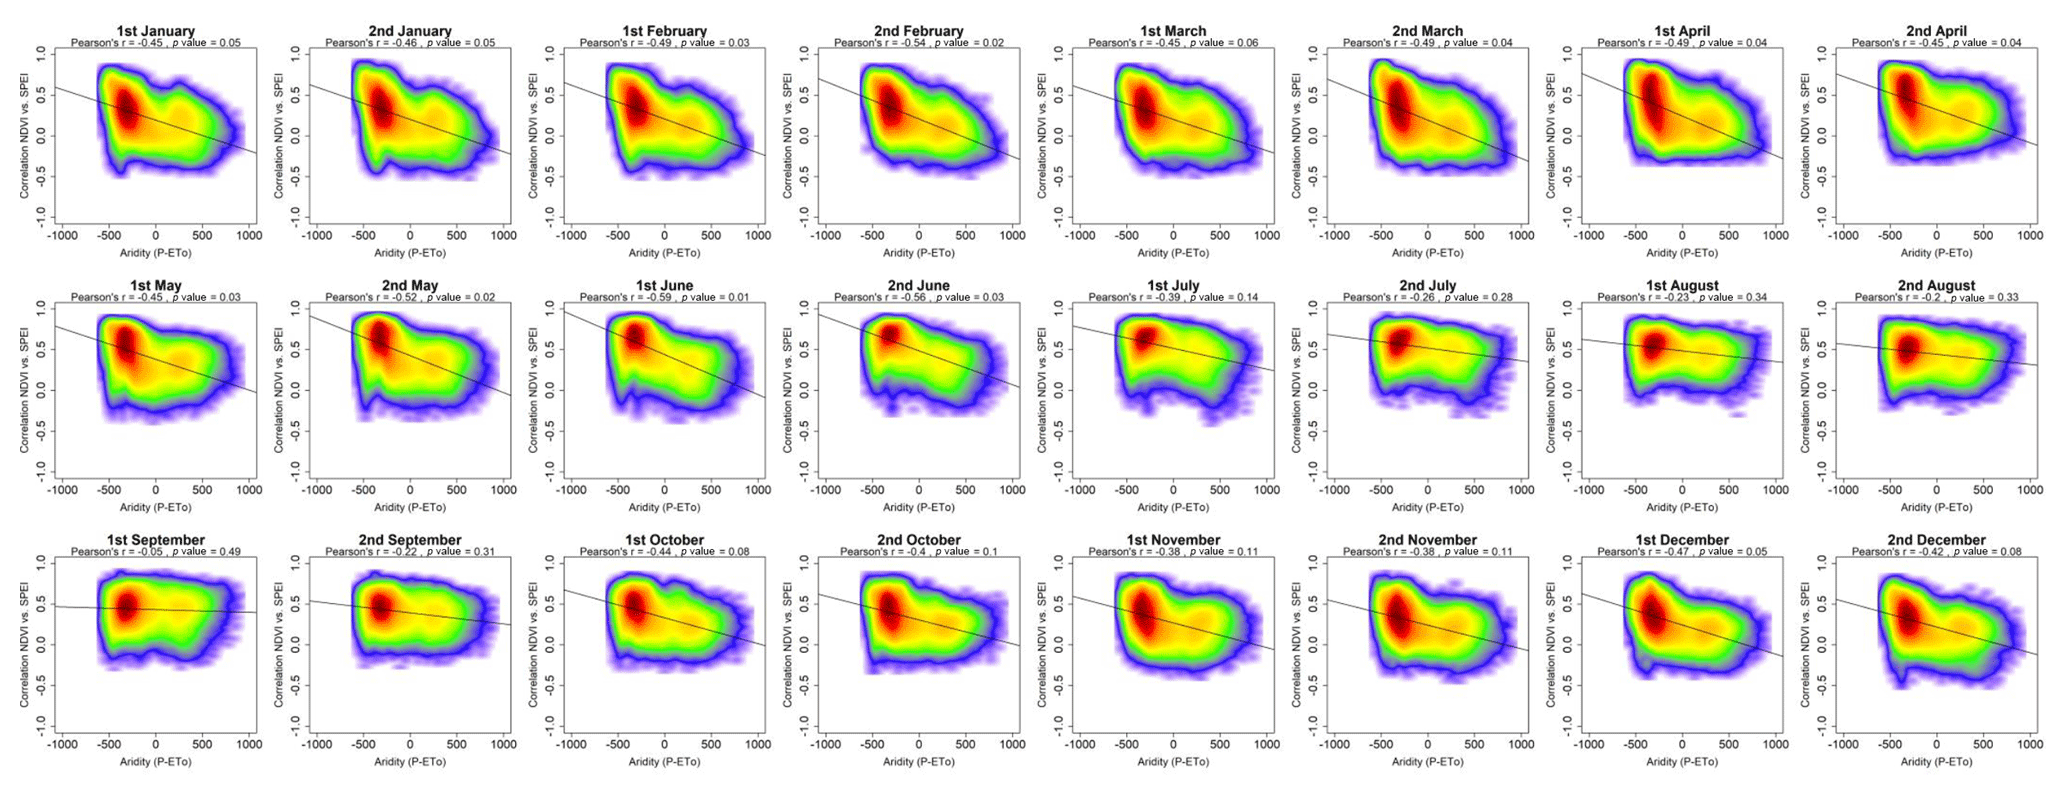
Figure 8Scatterplots showing the relationships between the maximum correlation obtained between the sNDVI and the SPEI and the climate aridity (precipitation minus ETo). Given the high number of data, the significance of the correlation was obtained using a bootstrap method. A total of 1000 random samples of 30 data points each were extracted, from which correlations and p values were obtained. The final significance was assessed by means of the average of the obtained correlation coefficients and p values, which are indicated in the figure.
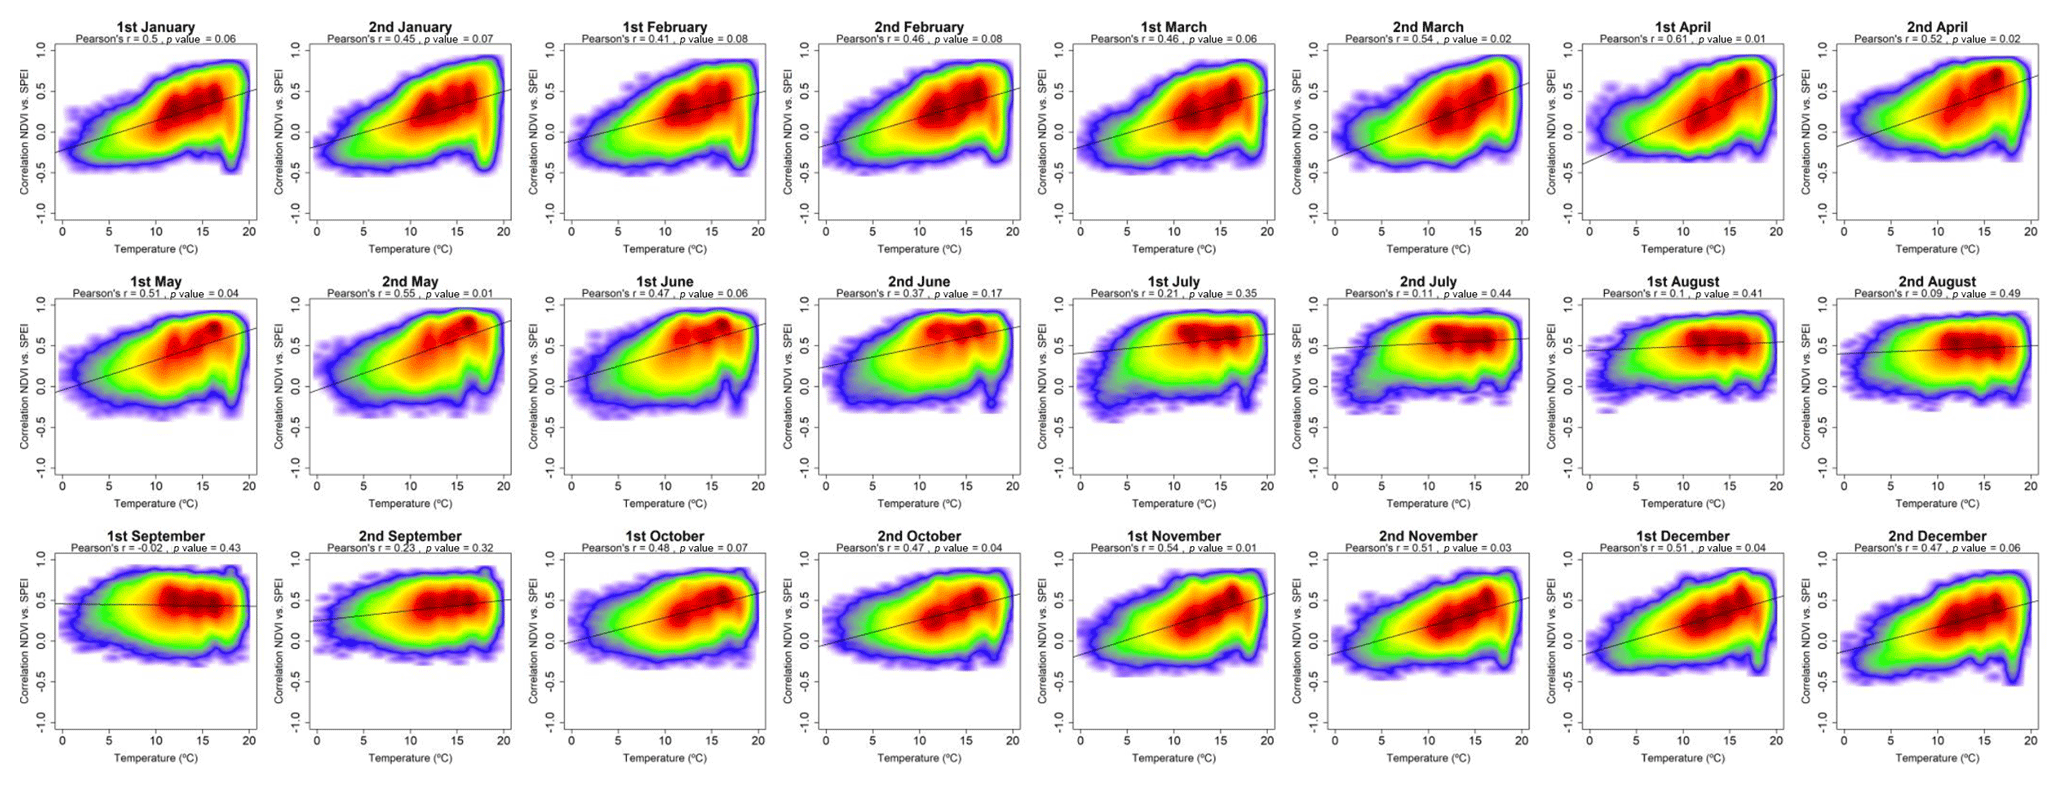
Figure 9Scatterplots showing the relationships between the maximum correlation obtained between the sNDVI and the SPEI and the average air temperature. Given the high number of points, the significance of correlation was obtained by means of 1000 random samples of 30 cases from which correlations and p values were obtained. The final significance was assessed by means of the average of the obtained p values.
Nonetheless, these general patterns vary largely as a function of land cover type (Supplement Figs. S1 to S11). For example, in unirrigated arable lands, there is strong negative correlation between aridity and the sNDVI–SPEI maximum correlation from March to May: a period that witnesses the peak of vegetation activity in this land cover type. This also coincides with the period of the highest average correlations between the sNDVI and SPEI. Taken together, this demonstrates that unirrigated arable lands located in the most arid areas are more sensitive to drought variability than those located in humid regions. As opposed to unirrigated arable lands, the correlations with aridity are found to be statistically non-significant in all periods of the year for irrigated lands, vineyards, and olive groves. Nevertheless, for the different natural vegetation categories, the correlations are negative and statistically significant during large periods. The mixed agricultural–natural vegetation areas show a significant correlation between October and July, with stronger association at the beginning of the summer season. Broadleaved and coniferous forests, scrub, and pasturelands also show a negative relationship between the spatial patterns of the sNDVI–SPEI correlations and aridity.
As depicted in Fig. 9, the relationship between the sNDVI–SPEI correlation and air temperature shows that the response of vegetation activity to drought is modulated by air temperature during springtime. This implies that warmer areas are those in which the sNDVI is more controlled by drought. A contradictory pattern is found during warmer months, in which the role of air temperature in modulating the impact of drought on vegetation activity is minimized. The relationships between air temperature and the NDVI–SPEI correlation vary among the different land cover types (Figs. S12 to S22). For example, in unirrigated arable lands, the positive and statistically significant correlation is found in the period from March to May, indicating that the response of the sNDVI to SPEI tends to coincide spatially with areas of warmer conditions. As observed for aridity, the relationship between the sNDVI and SPEI in irrigated lands is less associated with the spatial patterns of air temperature. A similar pattern is recorded for vineyards and olive groves. Nevertheless, the areas of natural vegetation show a clear relationship between air temperature and the sNDVI–SPEI correlations. In the mixed agriculture and natural vegetation areas, we found a statistically significant positive association between the sNDVI and SPEI from October to May. Conversely, this association is less evident during summer months. This general association during springtime, combined with the lack of association during summertime, can also be seen for other natural vegetation types such as broad-leaved and coniferous forests, natural grasslands, sclerophyllous vegetation, and mixed wood–scrub.
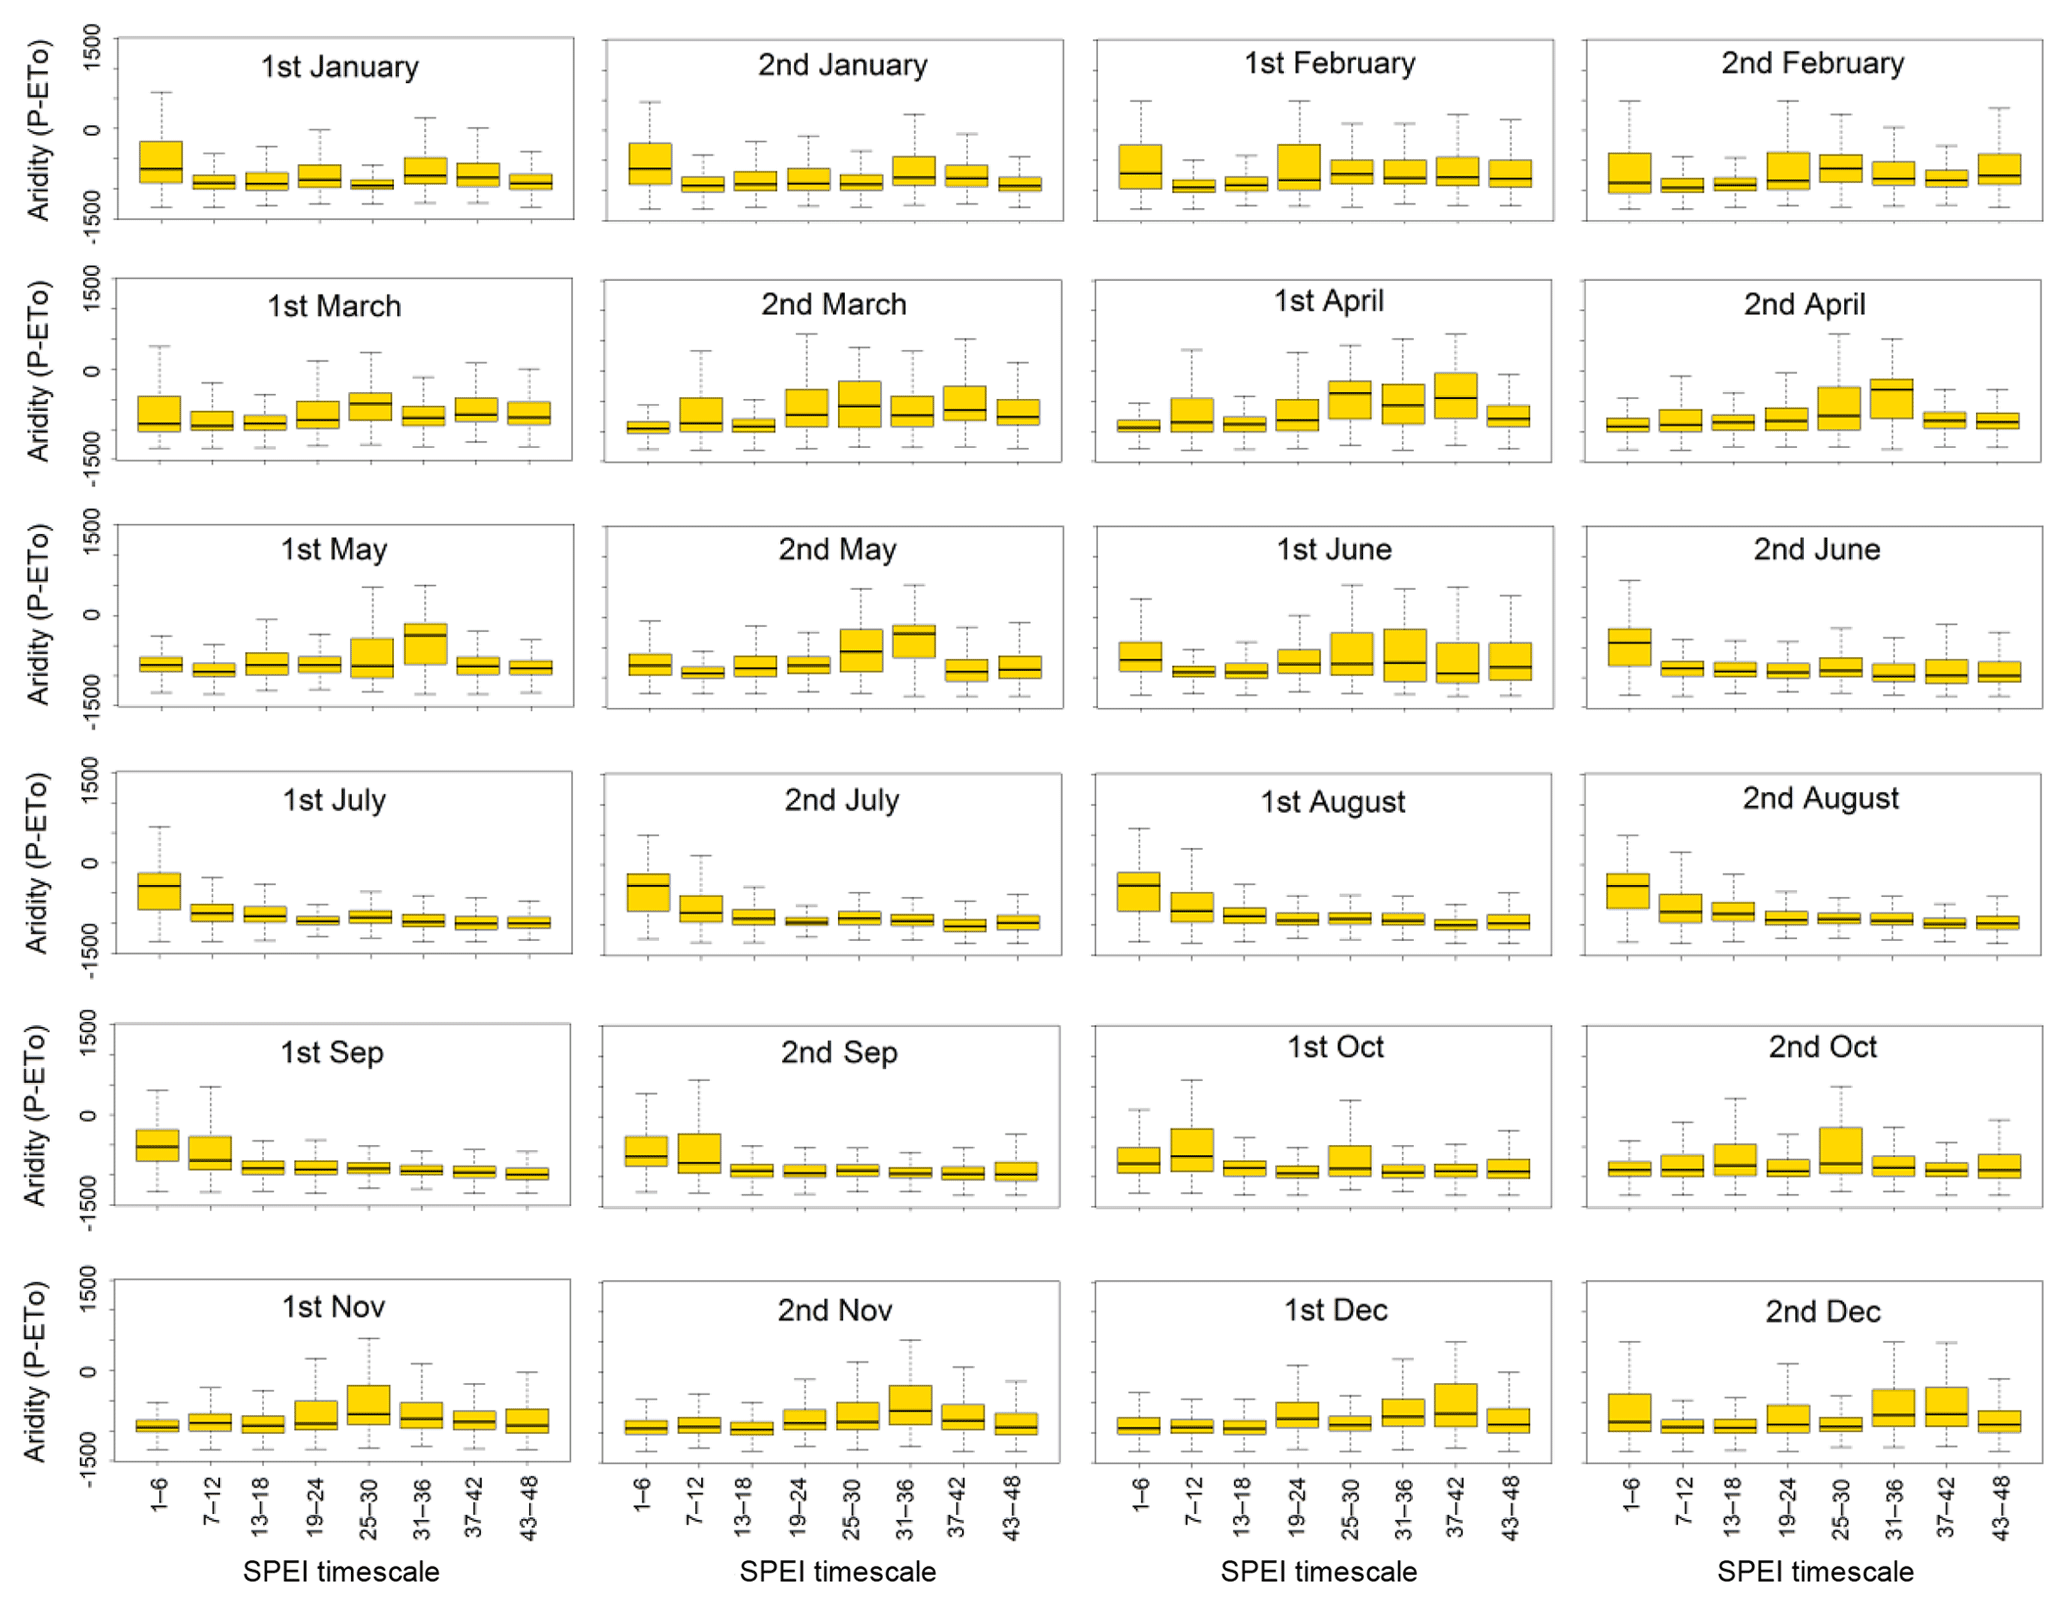
Figure 10Box plots showing the climate aridity values, as a function of the SPEI timescales at which the maximum correlation between the sNDVI and SPEI is recorded.
We also analysed the dependency between climatic conditions (i.e. aridity and air temperature) and the SPEI timescale(s) at which the maximum correlation between the sNDVI and SPEI is recorded. Figure 10 shows the values of aridity corresponding to SPEI timescales at which the maximum correlation between the sNDVI and SPEI is found for each semi-monthly period. The different box plots indicate complex patterns, which are quite difficult to interpret. Overall, less arid areas show stronger correlations at longer timescales (25–42 semi-monthly periods) during springtime. In the same context, the regions with maximum correlations at short timescales (1–6 months) tend to be located in less arid regions that record their maximum correlations at timescales between 7 and 24 semi-monthly periods. This suggests that the most arid areas mostly respond to the SPEI timescales between 6 and 12 months, compared to short (1–3 months) or long (> 12 months) SPEI timescales in more humid regions. In contrast, during the summer season, the interannual variability of the sNDVI in the arid areas is mostly determined by the SPEI recorded at timescales higher than 6 months (12 semi-monthly periods), while responding to short SPEI timescales (< 3 months) over the most humid regions.
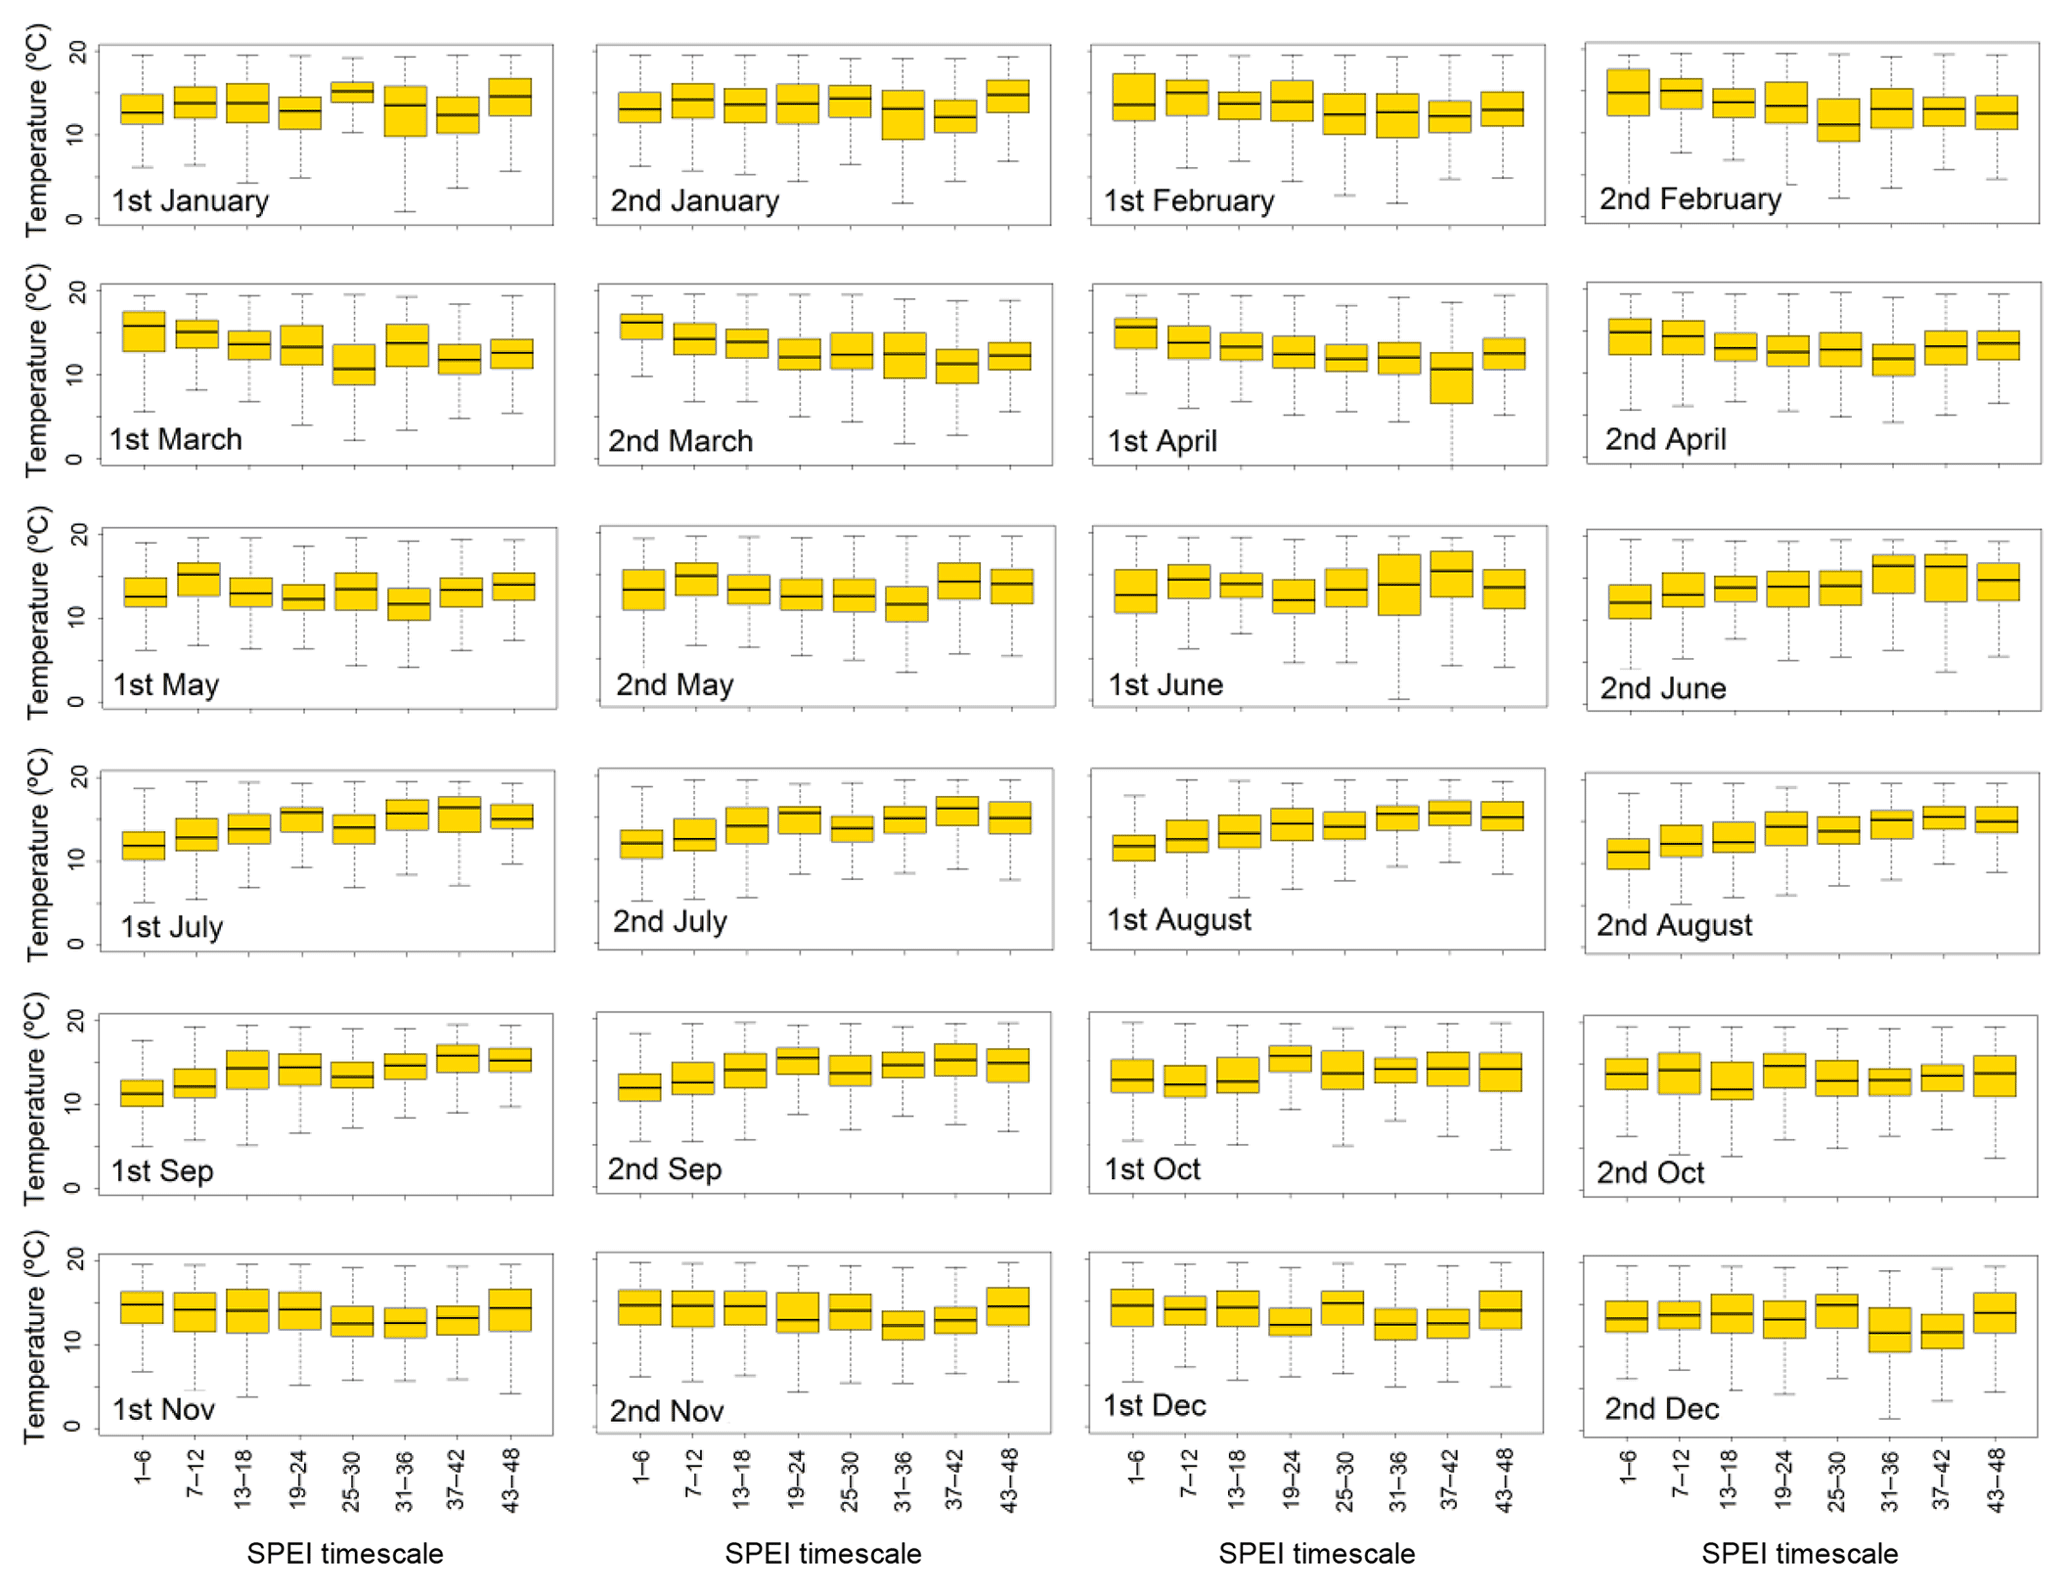
Figure 11Box plots showing air temperature values, as a function of the SPEI timescales at which the maximum correlation between the sNDVI and SPEI is recorded.
Also, we found links between the spatial distribution of air temperature and the SPEI timescales at which maximum correlation between the sNDVI and SPEI is recorded (Fig. 11). In early spring, short SPEI timescales dominate in warmer areas, compared to long SPEI timescales in colder regions. A contradictory pattern is observed from June to September, with a dominance of shorter SPEI timescales in colder areas and longer SPEI timescales in warmer regions.
The spatial distribution of all land cover types, after excluding irrigated lands in which the anthropogenic factors dominate, is illustrated in Fig. 12. Mixed forests are located in the most humid areas, while vineyards, olive groves, unirrigated arable lands, and the sclerophyllous natural vegetation are distributed at the most arid sites. Nevertheless, there is a gradient of these land cover types in terms of their response to drought, as those types located under more arid conditions show a stronger response of vegetation activity to drought than those located in humid environments. For example, the mixed forests show lower correlations than crop types and other vegetation areas. This pattern is more evident during the different semi-monthly periods, albeit with more differences during spring and autumn. In summer, these differences are much smaller between land cover categories, irrespective of aridity conditions.
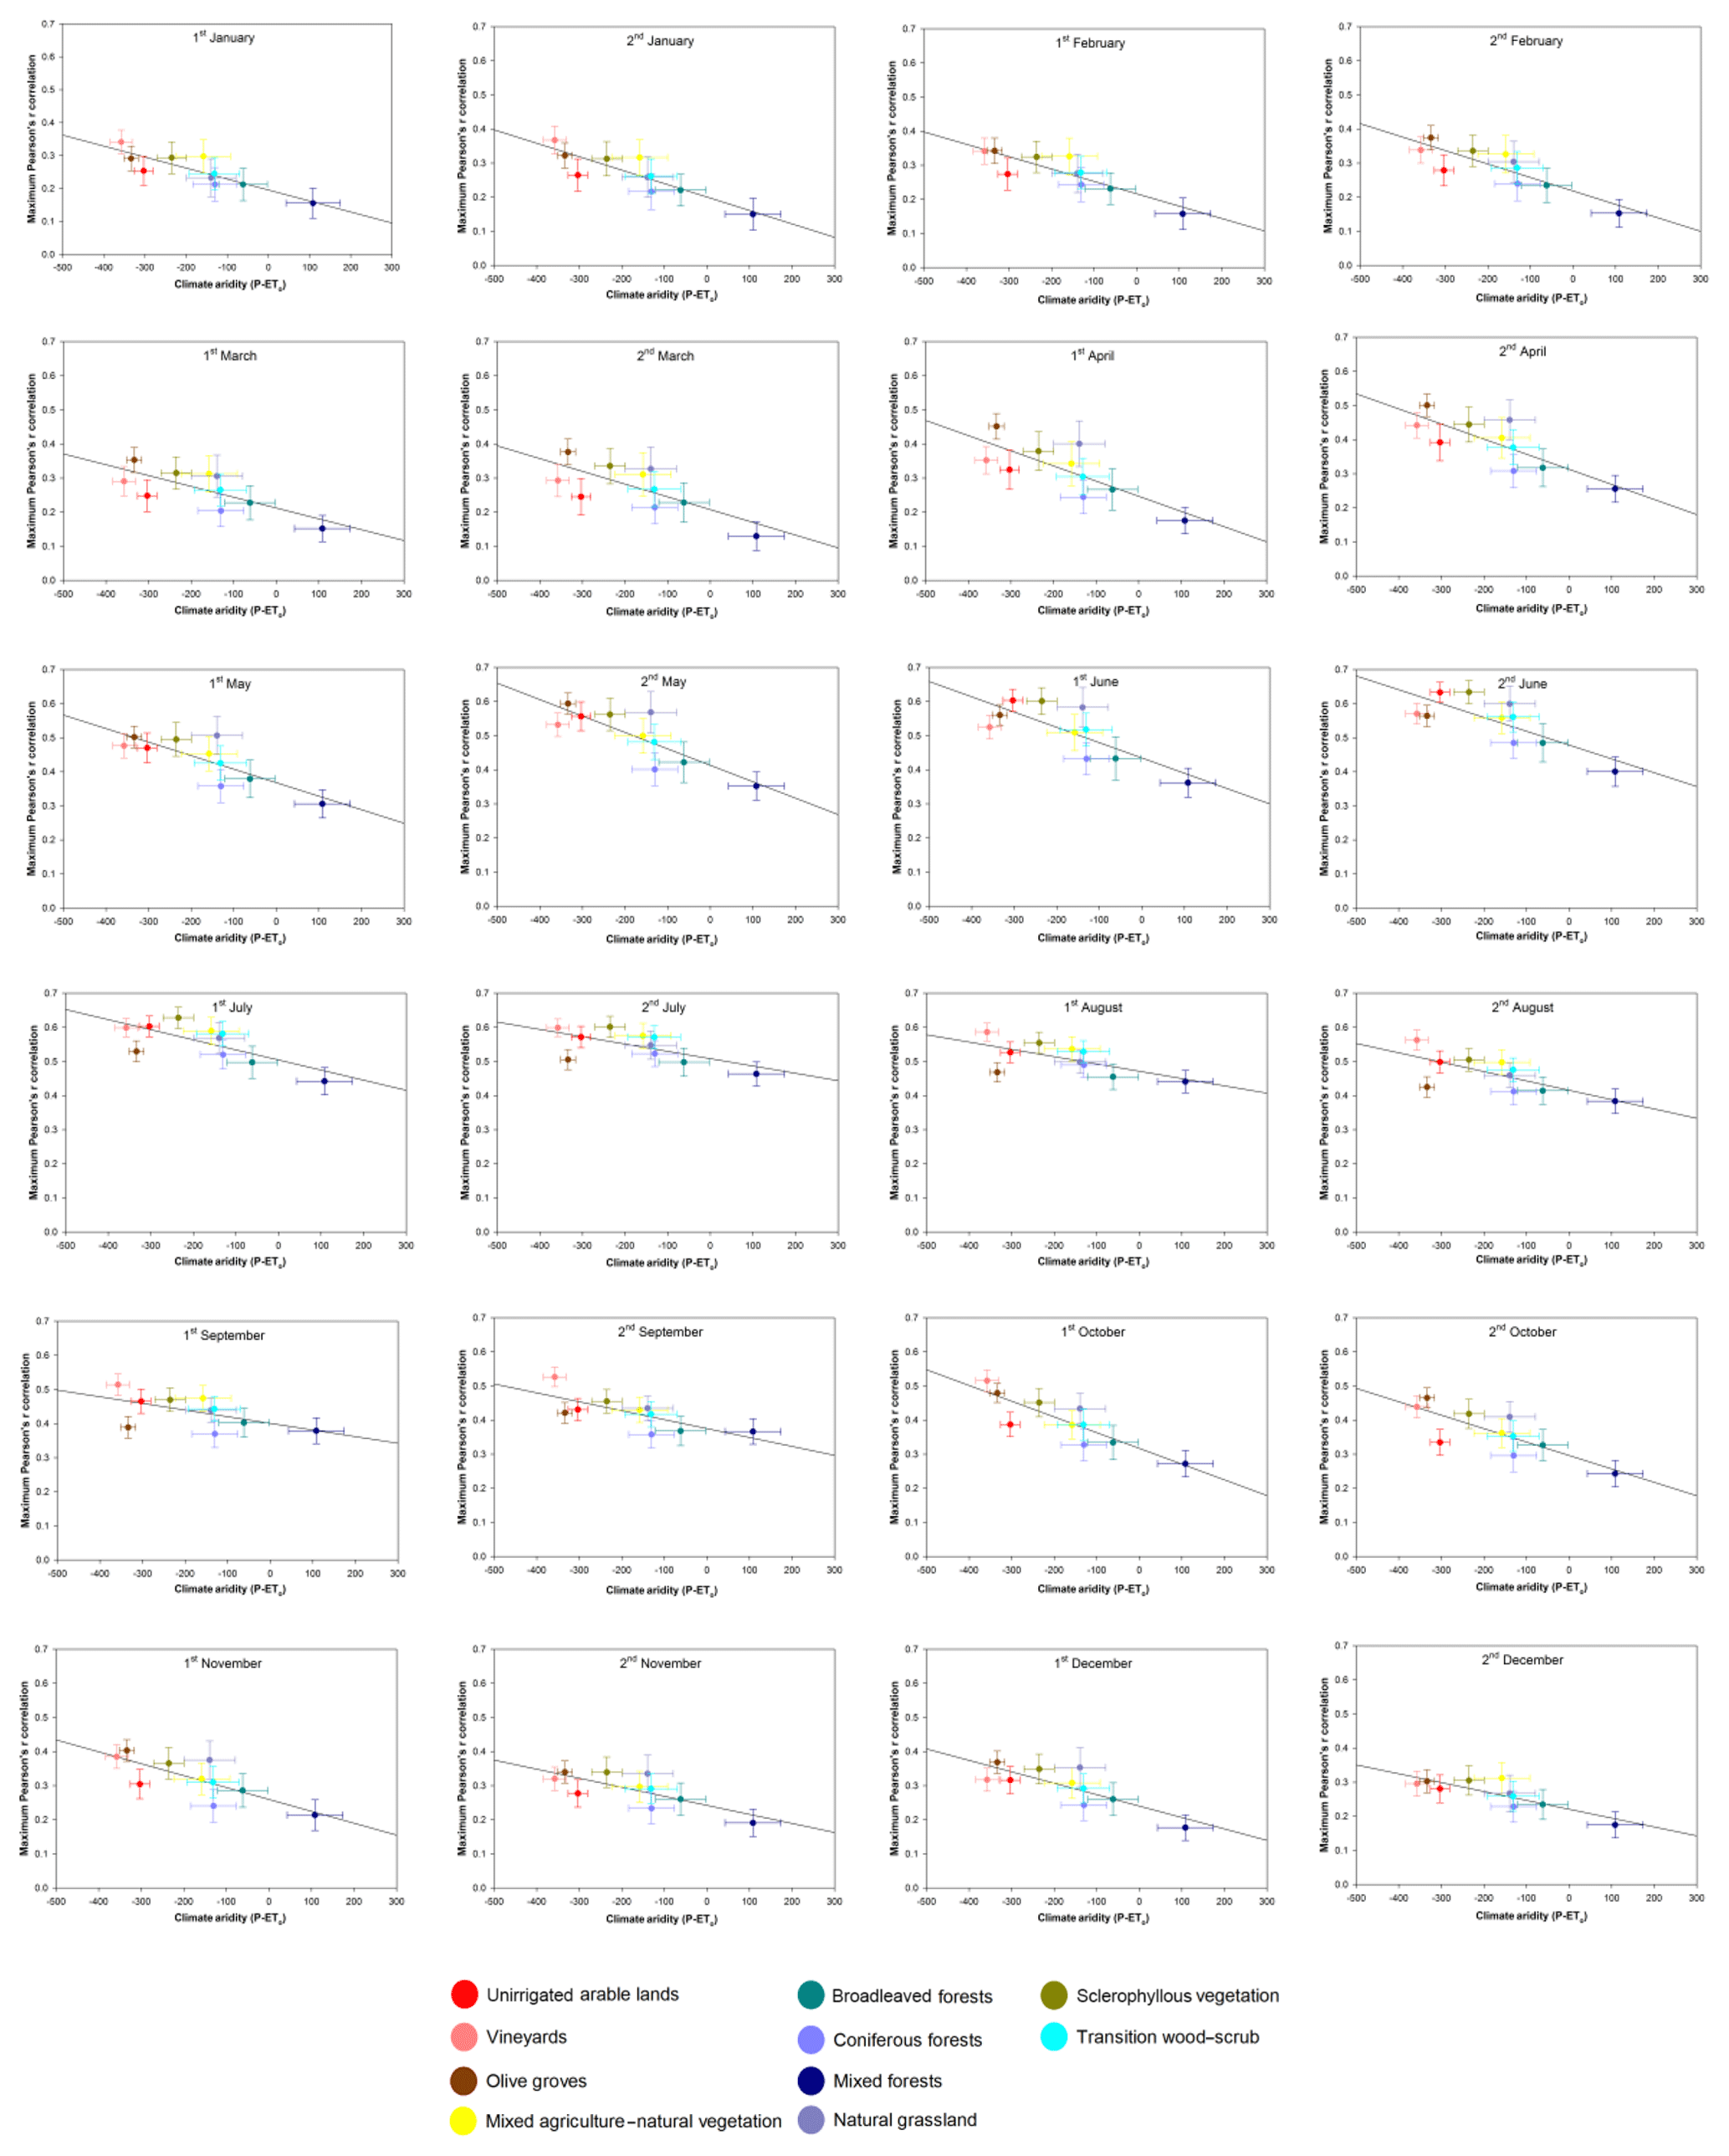
Figure 12Scatterplots showing the relationship between the mean annual aridity and the maximum correlation found between the sNDVI and the SPEI in the different land cover types analysed in this study. Vertical and horizontal bars represent one-fourth the standard deviation around the mean values.
There are also differences in the average SPEI timescale at which the maximum sNDVI–SPEI correlation is obtained (Fig. 13). However, these differences are complex, with noticeable seasonal differences in terms of the relationship between climate aridity and land cover types. In spring and late autumn, land cover types located in more arid conditions tend to respond to shorter SPEI timescales than those located in more humid areas. This pattern can be seen in late summer and early autumn, in which the most arid land cover types (e.g. vineyards and olive groves) tend to respond at longer SPEI timescales, compared to forest types (mostly the mixed forests), which are usually located under more humid conditions.
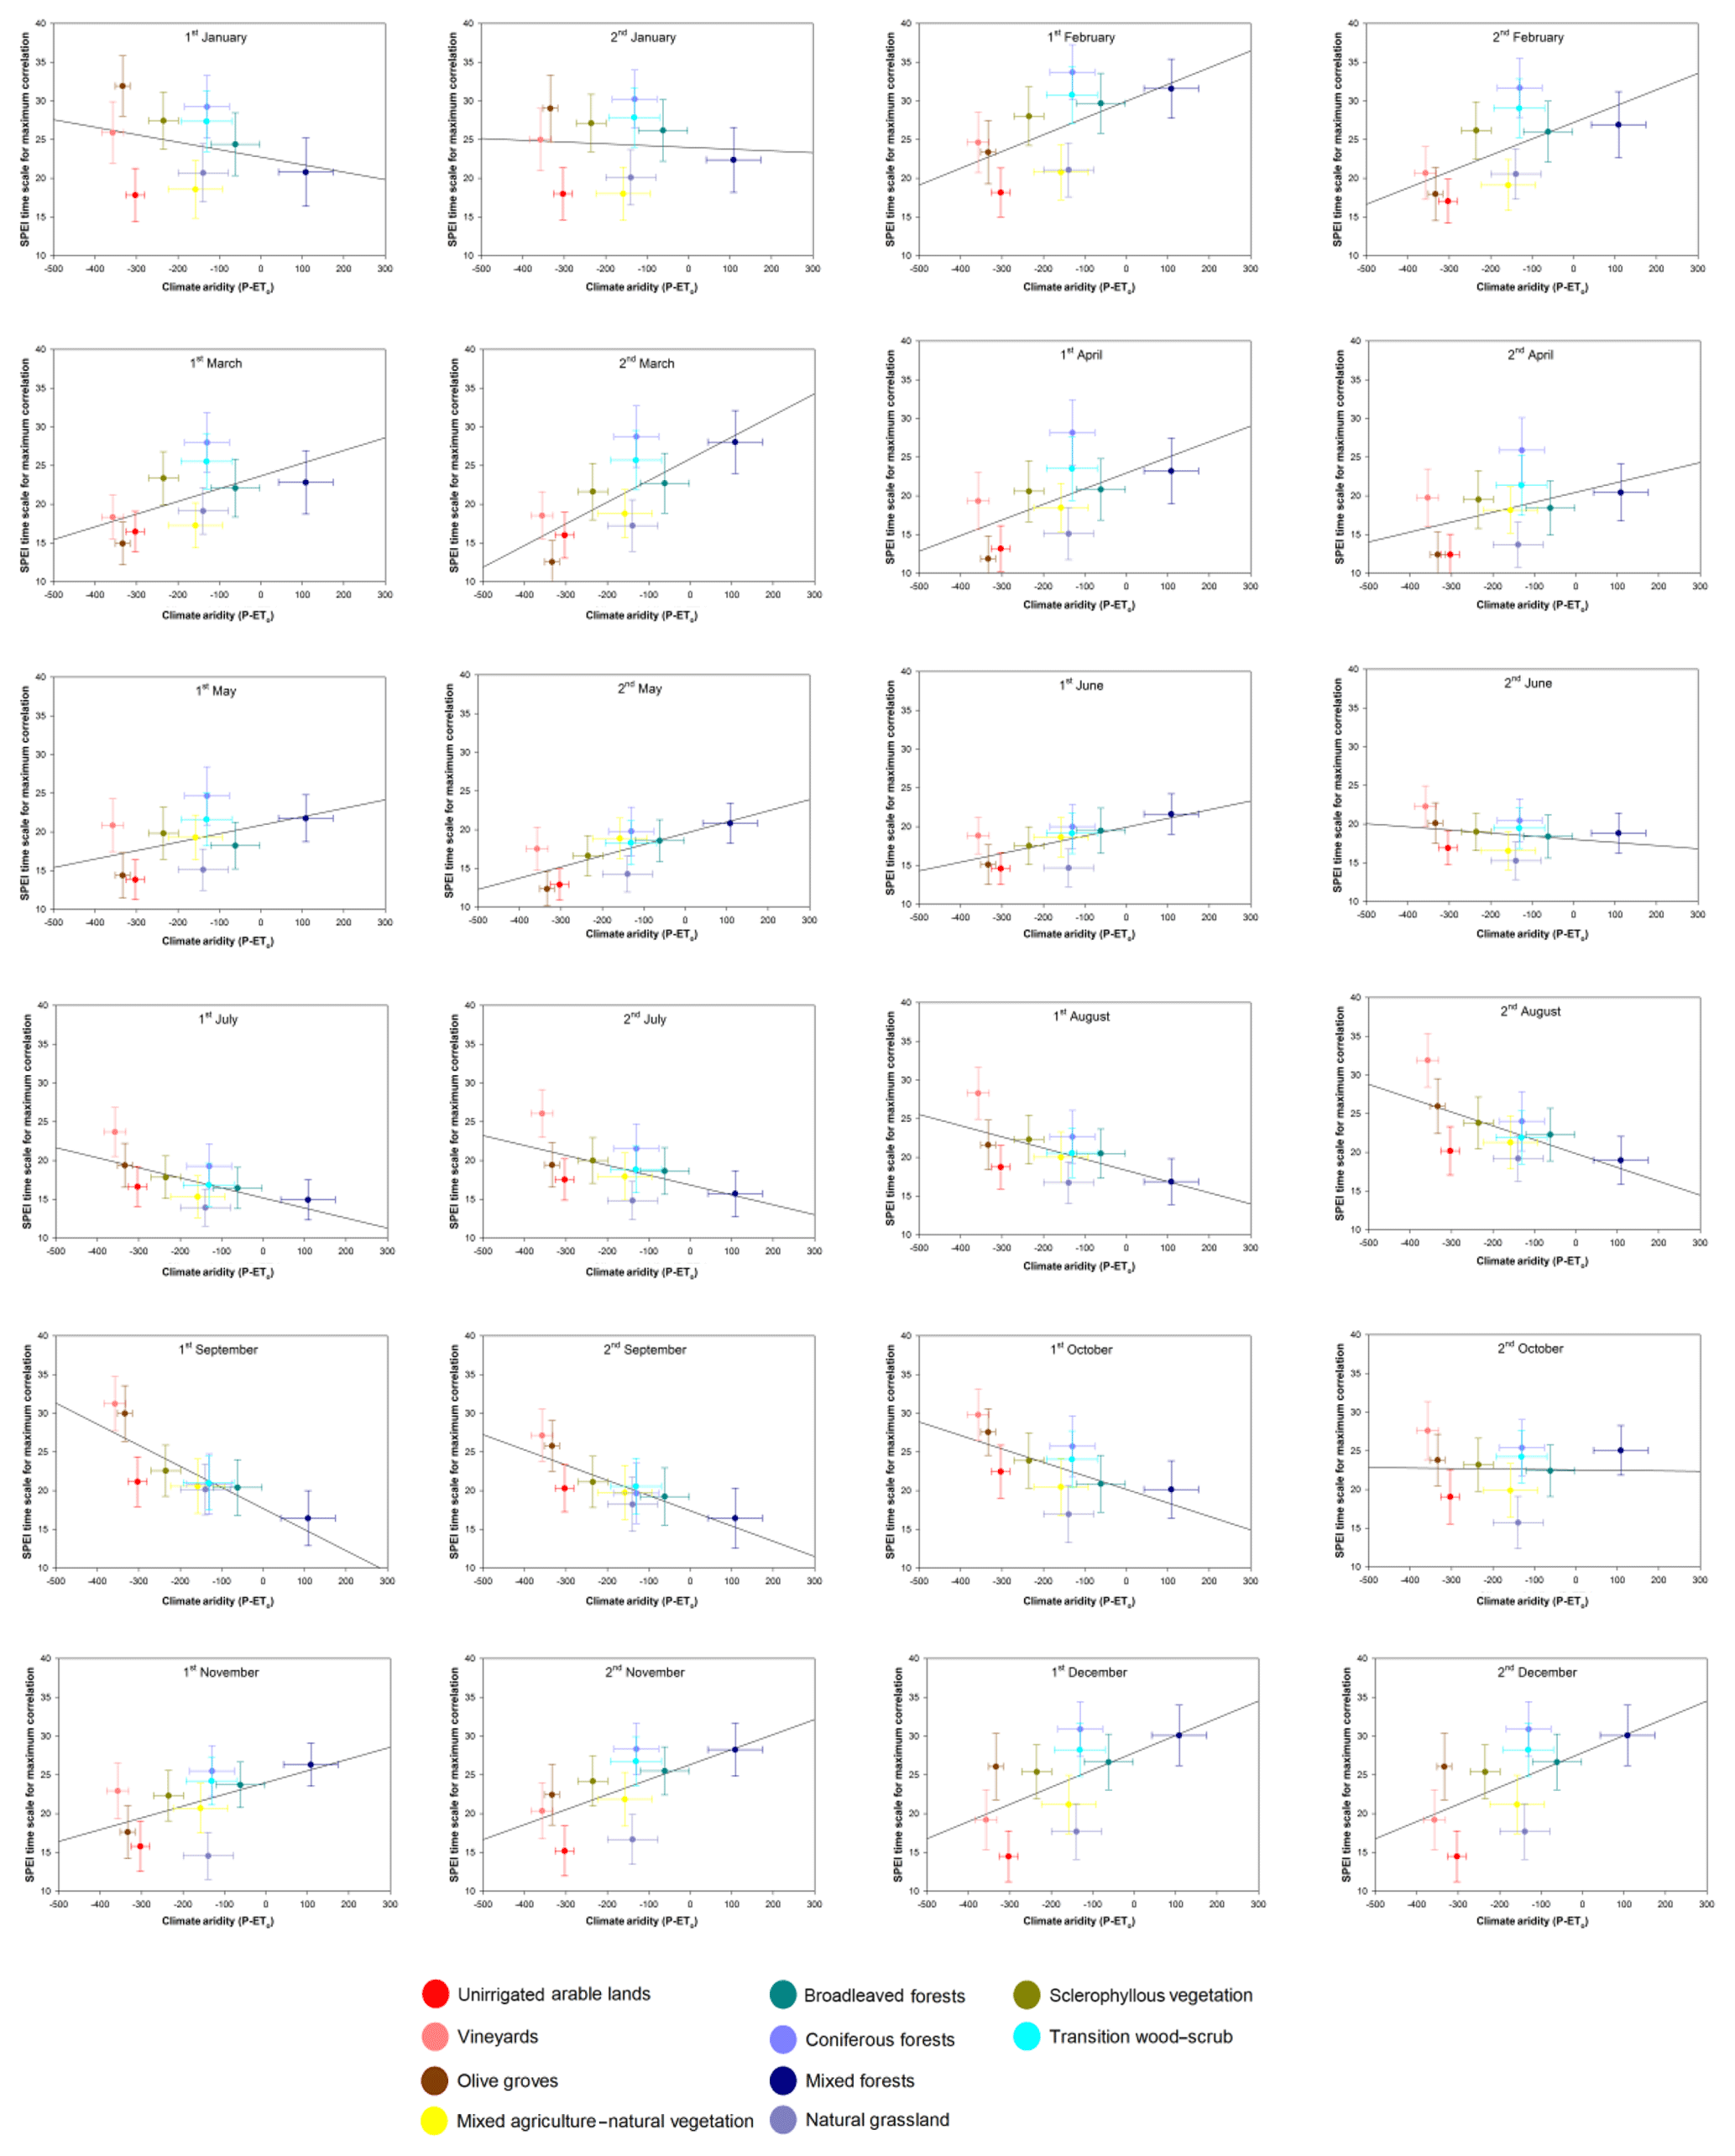
Figure 13Scatterplots showing the relationship between the mean annual aridity and the SPEI timescale at which the maximum correlation is found between the sNDVI and SPEI for the different land cover types. Vertical and horizontal bars represent one-fourth the standard deviation around the mean values.
This study assesses the response of vegetation activity to drought in Spain using a high-resolution (1.1 km) spatial NDVI dataset that dates back to 1981 (Vicente-Serrano et al., 2018). Based on another high-resolution semi-monthly gridded climatic dataset, drought was quantified using the standardized precipitation evapotranspiration index (SPEI) at different timescales (Vicente-Serrano et al., 2017).
Results demonstrate that vegetation activity over large parts of Spain is closely related to the interannual variability of drought. In summer more than 90 % of the study domain shows statistically significant positive correlations between the NDVI and SPEI. A similar response of the NDVI to drought is confirmed in earlier studies in different semi-arid and subhumid regions worldwide, including northeastern Brazil (e.g. Barbosa et al., 2006), the Sahel (e.g. Herrmann et al., 2005), central Asia (e.g. Gessner et al., 2013), Australia (e.g. De Keersmaecker et al., 2017), and California (e.g. Okin et al., 2018). Albeit with this generalized response, our results also show noticeable spatial and seasonal differences in this response. These differences can be linked to the timescale at which the drought is quantified, in addition to the impact of other dominant climatic conditions (e.g. air temperature and aridity).
4.1 The response of vegetation activity to drought variability
This study stresses that the response of vegetation activity to drought is more pronounced during the warm season (MJJAS), in which vast areas of the Spanish territory show statistically significant positive correlation between the sNDVI and SPEI. This seasonal pattern can be attributed to the phenology of vegetation under different land cover types. In the cold season, some areas, such as pastures and non-permanent broadleaf forests, do not have any vegetation activity. Other areas, with coniferous forests, shrubs, and cereal crops, show a low vegetation activity. As such, irrespective of the recorded drought conditions, the response of vegetation to drought would be low during wintertime. This behaviour is also enhanced by the atmospheric evaporative demand (AED), which is generally low in winter in Spain (Vicente-Serrano et al., 2014d), with a lower water demand of vegetation and accordingly low sensitivity to soil water availability. Austin et al. (1998) indicated that soil water recharge occurs mostly during winter months, given the low water consumption by vegetation. However, in spring, vegetation becomes more sensitive to drought due to temperature rise. Accordingly, the photosynthetic activity, which determines NDVI, is highly controlled by soil water availability (Myneni et al., 1995). In this study, the positive spatial relationship found between air temperature and the sNDVI–SPEI correlation reinforces this explanation. In spring, we found low correlations between the NDVI and SPEI, even in cold areas. In contrast, summer warm temperatures reinforce vegetation activity, but with some exceptions such as cereal cultivations, dry pastures, and shrubs. This would explain why the response of vegetation activity to the SPEI is stronger during summer in vast areas of Spain.
Also, this study suggests clear seasonal differences in the response of the NDVI to drought, and in the magnitude of the correlation between the NDVI and the SPEI, as a function of the dominant land cover. These differences are confirmed at different spatial scales, ranging from regional and local (e.g. Ivits et al., 2014; Zhao et al., 2015; Gouveia et al., 2017; Yang et al., 2018) to global (e.g. Vicente-Serrano et al., 2013), Over Spain, the unirrigated arable lands, natural grasslands, and sclerophyllous vegetation show an earlier response to drought, mainly in late spring and early summer. This response is mainly linked to the vegetation phenology dominating in these land covers, which usually reach their maximum activity in late spring to avoid dryness and temperature rise during summer months. The root systems of herbaceous species are not very deep, so they depend on the water storage in the most superficial soil layers (Milich and Weiss, 1997), and they could not survive during the long and dry summer in which the surface soil layers are mostly depleted (Martínez-Fernández and Ceballos, 2003). This would explain an earlier and stronger sensitivity to drought also shown in other semi-arid regions (Liu et al., 2017; Yang et al., 2018; Bailing et al., 2018). Conversely, maximum correlations between the NDVI and the SPEI are recorded during summer months in the forests but also in wood cultivations like vineyards and olive groves. In this case, the maximum sensitivity to drought coincides with the maximum air temperature and atmospheric evaporative demand (Vicente-Serrano et al., 2014d). This pattern would be indicative of a different adaptation strategy of trees in comparison to herbaceous vegetation, since whilst herbaceous cover would adapt to the summer dryness generating the seed bank before the summer (Peco et al., 1998; Russi et al., 1992), the trees and shrubs would base their adaptation on deeper root systems, translating the drought sensitivity to the period of highest water demand and water limitation.
In addition to the seasonal differences among land cover types, we have shown that in Spain herbaceous crops show a higher correlation between the NDVI and the SPEI than most natural vegetation types (with the exception of the sclerophyllous vegetation). This behaviour could be explained by three different factors: (i) a higher adaptation of natural vegetation to the characteristic climate of the region where drought is a frequent phenomenon (Vicente-Serrano, 2006), (ii) the deeper root systems that allow shrubs and trees to obtain water from the deep soil, and (iii) cultivated lands that tend to be typically located in drier areas than natural vegetation. Different studies showed that the vegetation of dry environments tends to have a more intense response to drought than subhumid and humid vegetation (Schultz and Halpert, 1995; Abrams et al., 1990; Nicholson et al., 1990; Herrmann et al., 2016). Vicente-Serrano et al. (2013) analysed the sensitivity of the NDVI in the different biomes at a global scale and found a spatial gradient in the sensitivity to drought, which was more important in arid and semi-arid regions.
4.2 Response to the average climatology
In this study we have shown a control in the response of the NDVI to drought severity by the climatic aridity. Thus, there is a significant correlation between the spatial distribution of the climatic aridity and the sensitivity of the NDVI to drought, mostly in spring and autumn. This could be explained because in more humid environments the main limitation to vegetation growth is temperature and radiation rather than water, so not all the water available would be used by vegetation reflected in a water surplus as surface runoff. This characteristic would make the vegetation less sensitive to drought in the cold season. Drought indices are relative metrics in comparison to the long-term climate with the purpose of making drought severity conditions comparable between areas of very different climate characteristics (Mukherjee et al., 2018). This means that in humid areas the corresponding absolute precipitation can be sufficient to cover the vegetation water needs although drought indices provide information on below-average conditions. Conversely, in arid regions a low value of a drought index is always representative of limited water availability, which would explain the closer relationship between the NDVI and the SPEI.
Here we also explored if the general pattern observed in humid and semi-arid regions is also affected by the land cover, and found that the behaviour in the unirrigated arable lands is the main reason for the global pattern. Herbaceous crops show that aridity levels have a clear control of the response of the NDVI to drought during the period of vegetation activity. Nevertheless, after the common harvest period (June) this control by aridity mostly disappears. This is also observed in the grasslands and in the sclerophyllous vegetation, and it could be explained by the low vegetation activity of the herbaceous and shrub species during the summer, given the phenological strategies to cope with water stress with the formation of the seeds before the period of dryness (Chaves et al., 2003). The limiting aridity conditions that characterize the regions in which these vegetation types grow would also contribute to explaining this phenomenon. Conversely, the forests, both broadleaved and coniferous, also show a control by aridity in the relationship between the NDVI and the SPEI during the summer months since these land cover types show the peak of the vegetation activity during this season.
In any case, it is also remarkable that the spatial pattern of the NDVI sensitivity to drought in forests is less controlled by aridity during the summer season, curiously the season in which there are more limiting conditions. This could be explained by the NDVI saturation under high levels of leaf area index (Carlson and Ripley, 1997) since once the tree tops are completely foliated the electromagnetic signal is not sensitive to additional leaf growth. This could explain the less sensitive response of the forests to drought in comparison to land cover types characterized by lower leaf area (e.g. shrubs or grasslands). Nevertheless, we do not think that this phenomenon can totally explain the decreased sensitivity to drought with aridity in summer since the dominant coniferous and broadleaved forests in Spain are usually not characterized by a 100 % leaf coverage (Castro-Díez et al., 1997; Molina and del Campo, 2012), so large signal saturation problems are not expected. Conversely, the ecophysiological strategies of forests to cope with drought may help explain the observed lower relationship between aridity during the summer months. Experimental studies suggested that the interannual variability of the secondary growth could be more sensitive to drought than the sensitivity observed by the photosynthetic activity and the leaf area (Newberry, 2010). This could be a strategy to optimize the storage of carbohydrates, suggesting that forests in dry years would prioritize the development of an adequate foliar area in relation to the wood formation in order to maintain respiration and photosynthetic processes. Recent studies by Gazol et al. (2018) and Peña-Gallardo et al. (2018b) confirmed that, irrespective of forest species, there is a higher sensitivity of tree-ring growth to drought, compared to the sensitivity of the NDVI. The different spatial and seasonal responses of vegetation activity to drought in our study domain can also be linked to the dominant forest species and species richness, which have been evident in numerous studies (e.g. Lloret et al., 2007). Moreover, this might also be attributed to the ecosystem physiological processes, given that vegetation tends to maintain the same water use efficiency under water stress conditions, regardless of vegetation types and environmental conditions (Huxman et al., 2004). This would explain that – independently of the aridity conditions – the response of the NDVI to drought would be similar. Here, we demonstrated that the response of the NDVI to drought is similar during summer months, even with the different land cover types and environmental conditions.
4.3 The importance of drought timescales
A relevant finding of this study is that the response of the NDVI is highly dependent on the timescale at which drought is quantified. Numerous studies indicated that the accumulation of precipitation deficits during different time periods is essential to determine the influence of drought on the NDVI (e.g. Malo and Nicholson, 1990; Liu and Kogan, 1996; Lotsch et al., 2003; Ji and Peters, 2003; Wang et al., 2003). This is simply because soil moisture is impacted largely by precipitation and the atmospheric evaporative demand over previous cumulative periods (Scaini et al., 2015). Moreover, the different morphological, physiological, and phenological strategies would also explain the varying response of vegetation types to different drought timescales. This finding is confirmed in previous works using NDVI and different timescales of a drought index (e.g. Ji and Peters, 2003; Vicente-Serrano, 2007), but also using other variables like tree-ring growth (e.g. Pasho et al., 2011; Arzac et al., 2016; Vicente-Serrano et al., 2014a). This study confirms this finding, given that there is a high spatial diversity in the SPEI timescale at which vegetation has its maximum correlation with the NDVI. These spatial variations, combined with strong seasonal differences, are mainly controlled by the dominant land cover types and aridity conditions. In their global assessment, Vicente-Serrano et al. (2013) found gradients in the response of the world biomes to drought, which are driven mainly by the timescale at which the biome responds to drought in a gradient of aridity. Again, the response to these different timescales implies not only different vulnerabilities of vegetation to water deficits, but also various strategies from plants to cope with drought. In Spain, we showed that the NDVI responds mostly to the SPEI at timescales of around 20 semi-monthly periods (10 months), but with some few seasonal differences (i.e. shorter timescales in spring and early autumn than in late summer and autumn). Herein, it is also noteworthy to indicate that there are differences in this response, as a function of land cover types. Overall, during the periods of highest vegetation activity, the herbaceous land covers (e.g. unirrigated arable lands and grasslands) respond to shorter SPEI timescales than other forest types. This pattern can be seen in the context that herbaceous covers are more dependent on the weather conditions recorded during short periods. These vegetation types could not reach deep soil levels, which are driven by climatic conditions during longer periods (Changnon and Easterling, 1989; Berg et al., 2017). In contrast, the tree root systems would access these deeper levels, having the capacity to buffer the effect of short-term droughts, albeit with more vulnerability to long droughts that ultimately would affect deep soil moisture levels. This pattern has been recently observed in southeastern Spain when comparing herbaceous crops and vineyards (Contreras and Hunink, 2015). Recently, Okin et al. (2018) linked the different responses to drought timescales between scrubs and chaparral herbaceous vegetation in California to soil water depletion at different levels.
Albeit with these general patterns, we also found some relevant seasonal patterns. For example, irrigated lands responded to long SPEI timescales (> 15 months) during summer months, whilst they responded to shorter timescales (< 7 months) during spring and autumn. This behaviour can be linked to water management in these areas. Specifically, during spring months, these areas do not receive irrigation and accordingly vegetation activity is determined by water stored in the soil. Conversely, summer irrigation depends on the water stored in the dense net of reservoirs existing in Spain; some of them have a multiannual capacity. Water availability in the reservoirs usually depends on the climate conditions recorded during long periods (1 or 2 years) (López-Moreno et al., 2004; Lorenzo-Lacruz et al., 2010), which determine water availability for irrigation. This explains why vegetation activity in irrigated lands depends on long timescales of drought. Similarly, vineyards and olive groves respond to long SPEI timescales during summer. These cultivations are highly resistant to drought stress (Quiroga and Iglesias, 2009). However, these adapted cultivations can be sensitive to severe droughts under extreme summer dryness. In comparison to other natural vegetation, mixed forests show a response to shorter SPEI timescales. This could be explained by the low resistance of these forest species to water deficits (e.g. the different fir species located in humid mountain areas; Camarero et al., 2011, 2018).
Here, we also showed that climate aridity can partially explain the response of the NDVI to the different SPEI timescales. In Spain, the range of the mean aridity recorded by the mean land cover types is much lower than that observed at the global scale for the world biomes (Vicente-Serrano et al., 2013). This might explain why there are no clear patterns in the response of the land cover types to the aridity gradients and the SPEI timescales at which the maximum correlation between the NDVI and SPEI is found. Nevertheless, we found some seasonal differences between the cold and warm seasons. In summer, the NDVI responds to longer SPEI timescales, as opposed to the most humid forests that respond to shorter timescales. This stresses that – in addition to aridity – the degree of vulnerability to different duration water deficits, which are well-quantified using the drought timescales, may contribute to explaining the spatial distribution of the main land cover types across Spain given different biophysical conditions, but also the different strategies of vegetation types to cope with water stress (Chaves et al., 2003; McDowell et al., 2008), which are strongly variable in complex Mediterranean ecosystems.
The main conclusions of this study are as follows.
-
Vegetation activity over large parts of Spain is closely related to the interannual variability of drought.
-
The response of vegetation activity to drought is more pronounced during the warm season, which is attributed to the phenology of vegetation under different land cover types.
-
There are clear seasonal differences in the response of the NDVI to drought.
-
Natural grasslands and sclerophyllous vegetation show an earlier response to drought.
-
There is a control in the response of the NDVI to drought severity by the climatic aridity, which is partially controlled by the land cover.
-
The response of the NDVI is highly dependent on the timescale at which drought is quantified although there are differences in this response, as a function of land cover types.
The drought index dataset is available at http://monitordesequia.csic.es (Begueria et al., 2019). The NDVI data are available upon request.
The supplement related to this article is available online at: https://doi.org/10.5194/nhess-19-1189-2019-supplement.
SMVS designed the research; SMVS performed research. CAM, MTB, NMH, and MPG worked on data generation. MG, SB, FDC, MPG and IN assisted with data processing and figure creation. SMVS and AEK drafted the paper and all the authors contributed to the writing.
The authors declare that they have no conflict of interest.
This article is part of the special issue “Hydroclimatic extremes and impacts at catchment to regional scales”. It is not associated with a conference.
This research has been supported by the Spanish Commission of Science and Technology and FEDER (grant no. PCIN-2015-220), the Spanish Commission of Science and Technology and FEDER (grant no. CGL2014-52135-C03-01), the Spanish Commission of Science and Technology and FEDER (grant no. CGL2017-83866-C3-3-R), the Spanish Commission of Science and Technology and FEDER (grant no. CGL2017-82216-R), WaterWorks 2014 (grant no. 690462, IMDROFLOOD), the JPI Climate (grant no. 690462, INDECIS), and WaterWorks 2015 (FORWARD grant).
This paper was edited by Chris Reason and reviewed by two anonymous referees.
Abrams, M. D., Schultz, J. C., and Kleiner, K. W.: Ecophysiological responses in mesic versus xeric hardwood species to an early-season drought in central Pennsylvania, Forest Sci., 36, 970–981, 1990.
Allen, C. D., Macalady, A. K., Chenchouni, H., Bachelet, D., McDowell, N., Vennetier, M., Kitzberger, T., Rigling, A., Breshears, D. D., Hogg, E. H., T., Gonzalez, P., Fensham, R., Zhang, Z., Castro, J., Demidova, N., Lim, J.-H., Allard, G., Running, S. W., Semerci, A., and Cobb, N.: A global overview of drought and heat-induced tree mortality reveals emerging climate change risks for forests, Forest Ecol. Manag., 259, 660–684, https://doi.org/10.1016/j.foreco.2009.09.001, 2010.
Allen, C. D., Breshears, D. D., and McDowell, N. G.: On underestimation of global vulnerability to tree mortality and forest die-off from hotter drought in the Anthropocene, Ecosphere, 6, 1–5, https://doi.org/10.1890/ES15-00203.1, 2015.
Allen, R. G., Pereira, L. S., Raes, D., and Smith, M.: Crop Evapotranspiration Guidel, Comput. Crop Water Requir., Add FAo, Rome, 1998.
Anyamba, A. and Tucker, C. J.: Analysis of Sahelian vegetation dynamics using NOAA-AVHRR NDVI data from 1981–2003, J. Arid Environ., 63, 596–614, https://doi.org/10.1016/j.jaridenv.2005.03.007, 2005.
Arzac, A., García-Cervigón, A. I., Vicente-Serrano, S. M., Loidi, J., and Olano, J. M.: Phenological shifts in climatic response of secondary growth allow Juniperus sabina L. to cope with altitudinal and temporal climate variability, Agr. Forest Meteorol., 217, 35–45, https://doi.org/10.1016/j.agrformet.2015.11.011, 2016.
Asseng, S., Ewert, F., Martre, P., Rötter, R. P., Lobell, D. B., Cammarano, D., Kimball, B. A., Ottman, M. J., Wall, G. W., White, J. W., Reynolds, M. P., Alderman, P. D., Prasad, P. V. V., Aggarwal, P. K., Anothai, J., Basso, B., Biernath, C., Challinor, A. J., De Sanctis, G., Doltra, J., Fereres, E., Garcia-Vila, M., Gayler, S., Hoogenboom, G., Hunt, L. A., Izaurralde, R. C., Jabloun, M., Jones, C. D., Kersebaum, K. C., Koehler, A.-K., Müller, C., Naresh Kumar, S., Nendel, C., O'leary, G., Olesen, J. E., Palosuo, T., Priesack, E., Eyshi Rezaei, E., Ruane, A. C., Semenov, M. A., Shcherbak, I., Stöckle, C., Stratonovitch, P., Streck, T., Supit, I., Tao, F., Thorburn, P. J., Waha, K., Wang, E., Wallach, D., Wolf, J., Zhao, Z., and Zhu, Y.: Rising temperatures reduce global wheat production, Nat. Clim. Change, 5, 143–147, https://doi.org/10.1038/nclimate2470, 2015.
Austin, R. B., Cantero-Martínez, C., Arrúe, J. L., Playán, E., and Cano-Marcellán, P.: Yield-rainfall relationships in cereal cropping systems in the Ebro river valley of Spain, Eur. J. Agron., 8, 239–248, https://doi.org/10.1016/S1161-0301(97)00063-4, 1998.
Bachmair, S., Kohn, I., and Stahl, K.: Exploring the link between drought indicators and impacts, Nat. Hazards Earth Syst. Sci., 15, 1381–1397, https://doi.org/10.5194/nhess-15-1381-2015, 2015.
Bachmair, S., Tanguy, M., Hannaford, J., and Stahl, K.: How well do meteorological indicators represent agricultural and forest drought across Europe?, Environ. Res. Lett., 13, 034042, https://doi.org/10.1088/1748-9326/aaafda, 2018.
Bailing, M., Zhiyong, L., Cunzhu, L., Lixin, W., Chengzhen, J., Fuxiang, B., and Chao, J.: Temporal and spatial heterogeneity of drought impact on vegetation growth on the Inner Mongolian Plateau, Rangel. J., 40, 113–128, https://doi.org/10.1071/RJ16097, 2018.
Baldocchi, D. D., Xu, L., and Kiang, N.: How plant functional-type, weather, seasonal drought, and soil physical properties alter water and energy fluxes of an oak-grass savanna and an annual grassland, Agr. Forest Meteorol., 123, 13–39, https://doi.org/10.1016/j.agrformet.2003.11.006, 2004.
Barbosa, H. A., Huete, A. R., and Baethgen, W. E.: A 20-year study of NDVI variability over the Northeast Region of Brazil, J. Arid Environ., 67, 288–307, https://doi.org/10.1016/j.jaridenv.2006.02.022, 2006.
Barker, L. J., Hannaford, J., Chiverton, A., and Svensson, C.: From meteorological to hydrological drought using standardised indicators, Hydrol. Earth Syst. Sci., 20, 2483–2505, https://doi.org/10.5194/hess-20-2483-2016, 2016.
Begueria, S., Latorre, B., Reig, F., and Vicente-Serrano, S. M.: Drought Indices dataset for Spain, available at: http://monitordesequia.csic.es, last access: 29 May 2019.
Berg, A., Sheffield, J., and Milly, P. C. D.: Divergent surface and total soil moisture projections under global warming, Geophys. Res. Lett., 44, 236–244, https://doi.org/10.1002/2016GL071921, 2017.
Bhuiyan, C., Singh, R. P., and Kogan, F. N.: Monitoring drought dynamics in the Aravalli region (India) using different indices based on ground and remote sensing data, Int. J. Appl. Earth Obs. Geoinf., 8, 289–302, https://doi.org/10.1016/j.jag.2006.03.002, 2006.
Breshears, D. D., Cobb, N. S., Rich, P. M., Price, K. P., Allen, C. D., Balice, R. G., Romme, W. H., Kastens, J. H., Floyd, M. L., Belnap, J., Anderson, J. J., Myers, O. B., and Meyer, C. W.: Regional vegetation die-off in response to global-change-type drought, P. Natl. Acad. Sci. USA, 102, 15144–15148, https://doi.org/10.1073/pnas.0505734102, 2005.
Camarero, J. J., Bigler, C., Linares, J. C., and Gil-Pelegrín, E.: Synergistic effects of past historical logging and drought on the decline of Pyrenean silver fir forests, Forest Ecol. Manag., 262, 759–769, https://doi.org/10.1016/j.foreco.2011.05.009, 2011.
Camarero, J. J., Gazol, A., Sangüesa-Barreda, G., Oliva, J., and Vicente-Serrano, S. M.: To die or not to die: Early warnings of tree dieback in response to a severe drought, J. Ecol., 103, 44–57, https://doi.org/10.1111/1365-2745.12295, 2015.
Camarero, J. J., Gazol, A., Sangüesa-Barreda, G., Cantero, A., Sánchez-Salguero, R., Sánchez-Miranda, A., Granda, E., Serra-Maluquer, X., and Ibáñez, R.: Forest growth responses to drought at short- and long-term scales in Spain: Squeezing the stress memory from tree rings, Front. Ecol. Evol., 6, https://doi.org/10.3389/fevo.2018.00009, 2018.
Carlson, T. N. and Ripley, D. A.: On the relation between NDVI, fractional vegetation cover, and leaf area index, Remote Sens. Environ., 62, 241–252, https://doi.org/10.1016/S0034-4257(97)00104-1, 1997.
Carnicer, J., Coll, M., Ninyerola, M., Pons, X., Sánchez, G., and Peñuelas, J.: Widespread crown condition decline, food web disruption, and amplified tree mortality with increased climate change-type drought, P. Natl. Acad. Sci. USA, 108, 1474–1478, https://doi.org/10.1073/pnas.1010070108, 2011.
Castro-Díez, P., Villar-Salvador, P., Pérez-Rontomé, C., Maestro-Martínez, M., and Montserrat-Martí, G.: Leaf morphology and leaf chemical composition in three Quercus (Fagaceae) species along a rainfall gradient in NE Spain, Trees-Struct. Funct., 11, 127–134, https://doi.org/10.1007/s004680050068, 1997.
Changnon, S. A. and Easterling, W. E.: Measuring Drought Impacts: The Illinois Case, J. Am. Water Resour. Assoc., 25, 27–42, https://doi.org/10.1111/j.1752-1688.1989.tb05663.x, 1989.
Chaves, M. M., Maroco, J. P., and Pereira, J. S.: Understanding plant responses to drought – From genes to the whole plant, Funct. Plant Biol., 30, 239–264, https://doi.org/10.1071/FP02076, 2003.
Ciais, P., Reichstein, M., Viovy, N., Granier, A., Ogée, J., Allard, V., Aubinet, M., Buchmann, N., Bernhofer, C., Carrara, A., Chevallier, F., De Noblet, N., Friend, A. D., Friedlingstein, P., Grünwald, T., Heinesch, B., Keronen, P., Knohl, A., Krinner, G., Loustau, D., Manca, G., Matteucci, G., Miglietta, F., Ourcival, J. M., Papale, D., Pilegaard, K., Rambal, S., Seufert, G., Soussana, J. F., Sanz, M. J., Schulze, E. D., Vesala, T., and Valentini, R.: Europe-wide reduction in primary productivity caused by the heat and drought in 2003, Nature, 437, 529–533, https://doi.org/10.1038/nature03972, 2005.
Contreras, S. and Hunink, J. E.: Drought effects on rainfed agriculture using standardized indices: A case study in SE Spain, in Drought: Research and Science-Policy Interfacing – Proceedings of the International Conference on Drought: Research and Science-Policy Interfacing, 65–70, 2015.
Dardel, C., Kergoat, L., Hiernaux, P., Mougin, E., Grippa, M., and Tucker, C. J.: Re-greening Sahel: 30 years of remote sensing data and field observations (Mali, Niger), Remote Sens. Environ., 140, 350–364, https://doi.org/10.1016/j.rse.2013.09.011, 2014.
De Keersmaecker, W., Lhermitte, S., Hill, M. J., Tits, L., Coppin, P., and Somers, B.: Assessment of regional vegetation response to climate anomalies: A case study for australia using GIMMS NDVI time series between 1982 and 2006, Remote Sens., 9, https://doi.org/10.3390/rs9010034, 2017.
del Barrio, G., Puigdefabregas, J., Sanjuan, M. E., Stellmes, M., and Ruiz, A.: Assessment and monitoring of land condition in the Iberian Peninsula, 1989–2000, Remote Sens. Environ., 114, 1817–1832, https://doi.org/10.1016/j.rse.2010.03.009, 2010.
FAO: Food and Agricultural Organization, Food and Agriculture data, available from: http://www.fao.org, last access: 1 October 2018.
Fischer, E. M., Seneviratne, S. I., Vidale, P. L., Lüthi, D., and Schär, C.: Soil moisture-atmosphere interactions during the 2003 European summer heat wave, J. Clim., 20, 5081–5099, https://doi.org/10.1175/JCLI4288.1, 2007.
Gallardo, M. and Martínez-Vega, J.: Three decades of land-use changes in the region of Madrid and how they relate to territorial planning, Eur. Plan. Stud., 24, 1016–1033, https://doi.org/10.1080/09654313.2016.1139059, 2016.
García, M., Litago, J., Palacios-Orueta, A., Pinzón, J. E., and Ustin Susan, L.: Short-term propagation of rainfall perturbations on terrestrial ecosystems in central California, Appl. Veg. Sci., 13, 146–162, https://doi.org/10.1111/j.1654-109X.2009.01057.x, 2010.
García-Haro, F. J., Campos-Taberner, M., Sabater, N., Belda, F., Moreno, A., Gilabert, M. A., Martínez, B., Pérez-Hoyos, A., and Meliá, J.: Vegetation vulnerability to drought in Spain, Vulnerabilidad de la vegetación a la sequía en España, Rev. Teledetec., 42, 29–37, https://doi.org/10.4995/raet.2014.2283, 2014.
Gazol, A., Camarero, J. J., Anderegg, W. R. L., and Vicente-Serrano, S. M.: Impacts of droughts on the growth resilience of Northern Hemisphere forests, Glob. Ecol. Biogeogr., 26, 166–176, https://doi.org/10.1111/geb.12526, 2017.
Gazol, A., Camarero, J. J., Vicente-Serrano, S. M., Sánchez-Salguero, R., Gutiérrez, E., de Luis, M., Sangüesa-Barreda, G., Novak, K., Rozas, V., Tíscar, P. A., Linares, J. C., Martín-Hernández, N., Martínez del Castillo, E., Ribas, M., García-González, I., Silla, F., Camisón, A., Génova, M., Olano, J. M., Longares, L. A., Hevia, A., Tomás-Burguera, M., and Galván, J. D.: Forest resilience to drought varies across biomes, Glob. Change Biol., 24, 2143–2158, https://doi.org/10.1111/gcb.14082, 2018.
Gessner, U., Naeimi, V., Klein, I., Kuenzer, C., Klein, D., and Dech, S.: The relationship between precipitation anomalies and satellite-derived vegetation activity in Central Asia, Glob. Planet. Change, 110, 74–87, https://doi.org/10.1016/j.gloplacha.2012.09.007, 2013.
González-Alonso, F. and Casanova, J. L.: Application of NOAA-AVHRR images for the validation and risk assessment of natural disasters in Spain, in Remote Sensing '96, Balkema, Rotterdam, 227–233, 1997.
González-Hidalgo, J. C., Vicente-Serrano, S. M., Peña-Angulo, D., Salinas, C., Tomas-Burguera, M., and Beguería, S.: High-resolution spatio-temporal analyses of drought episodes in the western Mediterranean basin (Spanish mainland, Iberian Peninsula), Acta Geophys., 66, 381–392, https://doi.org/10.1007/s11600-018-0138-x, 2018.
Gouveia, C. M., Bastos, A., Trigo, R. M., and Dacamara, C. C.: Drought impacts on vegetation in the pre- and post-fire events over Iberian Peninsula, Nat. Hazards Earth Syst. Sci., 12, 3123–3137, https://doi.org/10.5194/nhess-12-3123-2012, 2012.
Gouveia, C. M., Páscoa, P., Russo, A., and Trigo, R. M.: Land degradation trend assessment over iberia during 1982–2012, Evaluación de la tendencia a la degradación del suelo en Iberia durante 1982–2012, Cuad. Investig. Geogr., 42, 89–112, https://doi.org/10.18172/cig.2808, 2016.
Gouveia, C. M., Trigo, R. M., Beguería, S., and Vicente-Serrano, S. M.: Drought impacts on vegetation activity in the Mediterranean region: An assessment using remote sensing data and multi-scale drought indicators, Glob. Planet. Change, 151, 15–27, https://doi.org/10.1016/j.gloplacha.2016.06.011, 2017.
Grissino-Mayer, H. D. and Fritts, H. C.: The International Tree-Ring Data Bank: An enhanced global database serving the global scientific community, Holocene, 7, 235–238, https://doi.org/10.1177/095968369700700212, 1997.
Gu, Y., Brown, J. F., Verdin, J. P., and Wardlow, B.: A five-year analysis of MODIS NDVI and NDWI for grassland drought assessment over the central Great Plains of the United States, Geophys. Res. Lett., 34, L06407, https://doi.org/10.1029/2006GL029127, 2007.
Herrmann, S. M., Anyamba, A., and Tucker, C. J.: Recent trends in vegetation dynamics in the African Sahel and their relationship to climate, Glob. Environ. Change, 15, 394–404, https://doi.org/10.1016/j.gloenvcha.2005.08.004, 2005.
Herrmann, S. M., Didan, K., Barreto-Munoz, A., and Crimmins, M. A.: Divergent responses of vegetation cover in Southwestern US ecosystems to dry and wet years at different elevations, Environ. Res. Lett., 11, https://doi.org/10.1088/1748-9326/11/12/124005, 2016.
Hill, J., Stellmes, M., Udelhoven, T., Röder, A., and Sommer, S.: Mediterranean desertification and land degradation, Mapping related land use change syndromes based on satellite observations, Glob. Planet. Change, 64, 146–157, https://doi.org/10.1016/j.gloplacha.2008.10.005, 2008.
Hirschi, M., Seneviratne, S. I., Alexandrov, V., Boberg, F., Boroneant, C., Christensen, O. B., Formayer, H., Orlowsky, B., and Stepanek, P.: Observational evidence for soil-moisture impact on hot extremes in southeastern Europe, Nat. Geosci., 4, 17–21, https://doi.org/10.1038/ngeo1032, 2011.
Huete, A., Didan, K., Miura, T., Rodriguez, E. P., Gao, X., and Ferreira, L. G.: Overview of the radiometric and biophysical performance of the MODIS vegetation indices, Remote Sens. Environ., 83, 195–213, https://doi.org/10.1016/S0034-4257(02)00096-2, 2002.
Huxman, T. E., Smith, M. D., Fay, P. A., Knapp, A. K., Shaw, M. R., Lolk, M. E., Smith, S. D., Tissue, D. T., Zak, J. C., Weltzin, J. F., Pockman, W. T., Sala, O. E., Haddad, B. M., Harte, J., Koch, G. W., Schwinning, S., Small, E. E., and Williams, D. G.: Convergence across biomes to a common rain-use efficiency, Nature, 429, 651–654, https://doi.org/10.1038/nature02561, 2004.
Iglesias, E., Garrido, A., and Gómez-Ramos, A.: Evaluation of drought management in irrigated areas, Agr. Econ., 29, 211–229, https://doi.org/10.1016/S0169-5150(03)00084-7, 2003.
Ivits, E., Horion, S., Fensholt, R., and Cherlet, M.: Drought footprint on European ecosystems between 1999 and 2010 assessed by remotely sensed vegetation phenology and productivity, Glob. Change Biol., 20, 581–593, https://doi.org/10.1111/gcb.12393, 2014.
Jenkins, J. C., Chojnacky, D. C., Heath, L. S., and Birdsey, R. A.: National-scale biomass estimators for United States tree species, Forest Sci., 49, 12–35, 2003.
Ji, L. and Peters, A. J.: Assessing vegetation response to drought in the northern Great Plains using vegetation and drought indices, Remote Sens. Environ., 87, 85–98, https://doi.org/10.1016/S0034-4257(03)00174-3, 2003.
Julien, Y., Sobrino, J. A., Mattar, C., Ruescas, A. B., Jiménez-Muñoz, J. C., Sòria, G., Hidalgo, V., Atitar, M., Franch, B., and Cuenca, J.: Temporal analysis of normalized difference vegetation index (NDVI) and land surface temperature (LST) parameters to detect changes in the Iberian land cover between 1981 and 2001, Int. J. Remote Sens., 32, 2057–2068, https://doi.org/10.1080/01431161003762363, 2011.
Knipling, E. B.: Physical and physiological basis for the reflectance of visible and near-infrared radiation from vegetation, Remote Sens. Environ., 1, 155–159, https://doi.org/10.1016/S0034-4257(70)80021-9, 1970.
Kogan, F. N.: Global Drought Watch from Space, B. Am. Meteorol. Soc., 78, 621–636, 1997.
Lasanta, T. and Vicente-Serrano, S. M.: Complex land cover change processes in semiarid Mediterranean regions: An approach using Landsat images in northeast Spain, Remote Sens. Environ., 124, 1–14, https://doi.org/10.1016/j.rse.2012.04.023, 2012.
Lasanta, T., Arnáez, J., Pascual, N., Ruiz-Flaño, P., Errea, M. P., and Lana-Renault, N.: Space–time process and drivers of land abandonment in Europe, Catena, 149, 810–823, https://doi.org/10.1016/j.catena.2016.02.024, 2017.
Lecina, S., Isidoro, D., Playán, E., and Aragüés, R.: Irrigation modernization and water conservation in Spain: The case of Riegos del Alto Aragón, Agr. Water Manage., 97, 1663–1675, https://doi.org/10.1016/j.agwat.2010.05.023, 2010.
Liu, N., Harper, R. J., Dell, B., Liu, S., and Yu, Z.: Vegetation dynamics and rainfall sensitivity for different vegetation types of the Australian continent in the dry period 2002–2010, Ecohydrology, 10, e1811, https://doi.org/10.1002/eco.1811, 2017.
Liu, W. T. and Kogan, F. N.: Monitoring regional drought using the vegetation condition index, Int. J. Remote Sens., 17, 2761–2782, https://doi.org/10.1080/01431169608949106, 1996.
Lloret, F., Lobo, A., Estevan, H., Maisongrande, P., Vayreda, J., and Terradas, J.: Woody plant richness and NDVI response to drought events in Catalonian (northeastern Spain) forests, Ecology, 88, 2270–2279, https://doi.org/10.1890/06-1195.1, 2007.
Lobell, D. B., Hammer, G. L., Chenu, K., Zheng, B., Mclean, G., and Chapman, S. C.: The shifting influence of drought and heat stress for crops in northeast Australia, Glob. Change Biol., 21, 4115–4127, https://doi.org/10.1111/gcb.13022, 2015.
López-Moreno, J. I., Beguería, S., and García-Ruiz, J. M.: The management of a large Mediterranean reservoir: Storage regimens of the Yesa Reservoir, Upper Aragon River basin, Central Spanish Pyrenees, Environ. Manag., 34, 508–515, https://doi.org/10.1007/s00267-003-0249-1, 2004.
López-Moreno, J. I., Vicente-Serrano, S. M., Zabalza, J., Beguería, S., Lorenzo-Lacruz, J., Azorin-Molina, C., and Morán-Tejeda, E.: Hydrological response to climate variability at different time scales: A study in the Ebro basin, J. Hydrol., 477, 175–188, https://doi.org/10.1016/j.jhydrol.2012.11.028, 2013.
Lorenzo-Lacruz, J., Vicente-Serrano, S. M., López-Moreno, J. I., Beguería, S., García-Ruiz, J. M., and Cuadrat, J. M.: The impact of droughts and water management on various hydrological systems in the headwaters of the Tagus River (central Spain), J. Hydrol., 386, https://doi.org/10.1016/j.jhydrol.2010.01.001, 2010.
Lorenzo-Lacruz, J., Morán-Tejeda, E., Vicente-Serrano, S. M., and López-Moreno, J. I.: Streamflow droughts in the Iberian Peninsula between 1945 and 2005: spatial and temporal patterns, Hydrol. Earth Syst. Sci., 17, 119–134, https://doi.org/10.5194/hess-17-119-2013, 2013.
Lotsch, A., Friedl, M. A., Anderson, B. T., and Tucker, C. J.: Coupled vegetation-precipitation variability observed from satellite and climate records, Geophys. Res. Lett., 30, 1774, https://doi.org/10.1029/2003GL017506, 2003.
Ma, X., Huete, A., Moran, S., Ponce-Campos, G., and Eamus, D.: Abrupt shifts in phenology and vegetation productivity under climate extremes, J. Geophys. Res.-Biogeo., 120, 2036–2052, https://doi.org/10.1002/2015JG003144, 2015.
Malo, A. R. and Nicholson, S. E.: A study of rainfall and vegetation dynamics in the African Sahel using normalized difference vegetation index, J. Arid Environ., 19, 1–24, 1990.
Martínez-Fernández, J. and Ceballos, A.: Temporal Stability of Soil Moisture in a Large-Field Experiment in Spain, Soil Sci. Soc. Am. J., 67, 1647–1656, 2003.
McDowell, N., Pockman, W. T., Allen, C. D., Breshears, D. D., Cobb, N., Kolb, T., Plaut, J., Sperry, J., West, A., Williams, D. G., and Yepez, E. A.: Mechanisms of plant survival and mortality during drought: Why do some plants survive while others succumb to drought?, New Phytol., 178, 719–739, https://doi.org/10.1111/j.1469-8137.2008.02436.x, 2008.
McKee, T. B., Doesken, N. J., and Kleist, J.: The relationship of drought frequency and duration to time scales, Eighth Conf. Appl. Climatol., Am. Meteorol. Soc., 179–184, 1993.
Milich, L. and Weiss, E.: Characterization of the sahel: Implications of correctly calculating interannual coefficients of variation (CoVs) from GAC NDVI values, Int. J. Remote Sens., 18, 3749–3759, https://doi.org/10.1080/014311697216603, 1997.
Molina, A. J. and del Campo, A. D.: The effects of experimental thinning on throughfall and stemflow: A contribution towards hydrology-oriented silviculture in Aleppo pine plantations, Forest Ecol. Manag., 269, 206–213, https://doi.org/10.1016/j.foreco.2011.12.037, 2012.
Mu, Q., Zhao, M., Kimball, J. S., McDowell, N. G., and Running, S. W.: A remotely sensed global terrestrial drought severity index, B. Am. Meteorol. Soc., 94, 83–98, https://doi.org/10.1175/BAMS-D-11-00213.1, 2013.
Mühlbauer, S., Costa, A. C., and Caetano, M.: A spatiotemporal analysis of droughts and the influence of North Atlantic Oscillation in the Iberian Peninsula based on MODIS imagery, Theor. Appl. Climatol., 124, 703–721, https://doi.org/10.1007/s00704-015-1451-9, 2016.
Mukherjee, S., Mishra, A., and Trenberth, K. E.: Climate Change and Drought: a Perspective on Drought Indices, Curr. Clim. Change Reports, 4, 145–163, https://doi.org/10.1007/s40641-018-0098-x, 2018.
Myneni, R. B., Hall, F. G., Sellers, P. J., and Marshak, A. L.: Interpretation of spectral vegetation indexes, IEEE T. Geosci. Remote, 33, 481–486, https://doi.org/10.1109/36.377948, 1995.
Newberry, T. L.: Effect of climatic variability on δ13C and tree-ring growth in piñon pine (Pinus edulis), Trees-Struct. Funct., 24, 551–559, https://doi.org/10.1007/s00468-010-0426-9, 2010.
Nicholson, S. E., Davenport, M. L., and Malo, A. R.: A comparison of the vegetation response to rainfall in the Sahel and East Africa, using normalized difference vegetation index from NOAA AVHRR, Climate Change, 17, 209–241, https://doi.org/10.1007/BF00138369, 1990.
Okin, G. S., Dong, C., Willis, K. S., Gillespie, T. W., and MacDonald, G. M.: The Impact of Drought on Native Southern California Vegetation: Remote Sensing Analysis Using MODIS-Derived Time Series, J. Geophys. Res.-Biogeo., 123, 1927–1939, https://doi.org/10.1029/2018JG004485, 2018.
Olsen, J. L., Ceccato, P., Proud, S. R., Fensholt, R., Grippa, M., Mougin, B., Ardö, J., and Sandholt, I.: Relation between seasonally detrended shortwave infrared reflectance data and land surface moisture in semi-arid Sahel, Remote Sens., 5, 2898–2927, https://doi.org/10.3390/rs5062898, 2013.
Ortigosa, L. M., Garcia-Ruiz, J. M., and Gil-Pelegrin, E.: Land reclamation by reforestation in the Central Pyrenees, Mt. Res.-Dev., 10, 281–288, https://doi.org/10.2307/3673607, 1990.
Palazón, A., Aragonés, L., and López, I.: Evaluation of coastal management: Study case in the province of Alicante, Spain, Sci. Total Environ., 572, 1184–1194, https://doi.org/10.1016/j.scitotenv.2016.08.032, 2016.
Páscoa, P., Gouveia, C. M., Russo, A., and Trigo, R. M.: The role of drought on wheat yield interannual variability in the Iberian Peninsula from 1929 to 2012, Int. J. Biometeorol., 61, 439–451, https://doi.org/10.1007/s00484-016-1224-x, 2017.
Pasho, E., Camarero, J. J., de Luis, M., and Vicente-Serrano, S. M.: Impacts of drought at different time scales on forest growth across a wide climatic gradient in north-eastern Spain, Agr. Forest Meteorol., 151, 1800–1811, https://doi.org/10.1016/j.agrformet.2011.07.018, 2011.
Pausas, J. G.: Changes in fire and climate in the eastern Iberian Peninsula (Mediterranean Basin), Climate Change, 63, 337–350, https://doi.org/10.1023/B:CLIM.0000018508.94901.9c, 2004.
Pausas, J. G. and Fernández-Muñoz, S.: Fire regime changes in the Western Mediterranean Basin: From fuel-limited to drought-driven fire regime, Climate Change, 110, 215–226, https://doi.org/10.1007/s10584-011-0060-6, 2012.
Peco, B., Ortega, M., and Levassor, C.: Similarity between seed bank and vegetation in Mediterranean grassland: A predictive model, J. Veg. Sci., 9, 815–828, https://doi.org/10.2307/3237047, 1998.
Peña-Gallardo, M., Vicente-Serrano, S. M., Camarero, J. J., Gazol, A., Sánchez-Salguero, R., Domínguez-Castro, F., El Kenawy, A., Beguería-Portugés, S., Gutiérrez, E., de Luis, M., Sangüesa-Barreda, G., Novak, K., Rozas, V., Tíscar, P. A., Linares, J. C., del Castillo, E., Ribas Matamoros, M., García-González, I., Silla, F., Camisón, Á., Génova, M., Olano, J. M., Longares, L. A., Hevia, A., and Galván, J. D.: Drought Sensitiveness on Forest Growth in Peninsular Spain and the Balearic Islands, Forests, 9, 2018a.
Peña-Gallardo, M., SM, V.-S., Domínguez-Castro, F., Quiring, S., Svoboda, M., Beguería, S., and Hannaford, J.: Effectiveness of drought indices in identifying impacts on major crops across the USA , Clim. Res., 75, 221–240, 2018b.
Pinzon, J. E. and Tucker, C. J.: A non-stationary 1981–2012 AVHRR NDVI < inf > 3g < /inf > time series, Remote Sens., 6, 6929–6960, https://doi.org/10.3390/rs6086929, 2014.
Quiring, S. M. and Ganesh, S.: Evaluating the utility of the Vegetation Condition Index (VCI) for monitoring meteorological drought in Texas, Agr. Forest Meteorol., 150, 330–339, https://doi.org/10.1016/j.agrformet.2009.11.015, 2010.
Quiroga, S. and Iglesias, A.: A comparison of the climate risks of cereal, citrus, grapevine and olive production in Spain, Agr. Syst., 101, 91–100, https://doi.org/10.1016/j.agsy.2009.03.006, 2009.
Reichstein, M., Ciais, P., Papale, D., Valentini, R., Running, S., Viovy, N., Cramer, W., Granier, A., Ogée, J., Allard, V., Aubinet, M., Bernhofer, C., Buchmann, N., Carrara, A., Grünwald, T., Heimann, M., Heinesch, B., Knohl, A., Kutsch, W., Loustau, D., Manca, G., Matteucci, G., Miglietta, F., Ourcival, J. M., Pilegaard, K., Pumpanen, J., Rambal, S., Schaphoff, S., Seufert, G., Soussana, J.-F., Sanz, M.-J., Vesala, T., and Zhao, M.: Reduction of ecosystem productivity and respiration during the European summer 2003 climate anomaly: A joint flux tower, remote sensing and modelling analysis, Glob. Change Biol., 13, 634–651, https://doi.org/10.1111/j.1365-2486.2006.01224.x, 2007.
Restaino, C. M., Peterson, D. L., and Littell, J.: Increased water deficit decreases Douglas fir growth throughout western US forests, P. Natl. Acad. Sci. USA, 113, 9557–9562, https://doi.org/10.1073/pnas.1602384113, 2016.
Rhee, J., Im, J., and Carbone, G. J.: Monitoring agricultural drought for arid and humid regions using multi-sensor remote sensing data, Remote Sens. Environ., 114, 2875–2887, https://doi.org/10.1016/j.rse.2010.07.005, 2010.
Russi, L., Cocks, P. S., and Roberts, E. H.: Seed bank dynamics in a Mediterranean grassland, J. Appl. Ecol., 29, 763–771, https://doi.org/10.2307/2404486, 1992.
Scaini, A., Sánchez, N., Vicente-Serrano, S. M., and Martínez-Fernández, J.: SMOS-derived soil moisture anomalies and drought indices: A comparative analysis using in situ measurements, Hydrol. Process., 29, 373–383, https://doi.org/10.1002/hyp.10150, 2015.
Schultz, P. A. and Halpert, M. S.: Global analysis of the relationships among a vegetation index, precipitation and land surface temperature, Int. J. Remote Sens., 16, 2755–2777, https://doi.org/10.1080/01431169508954590, 1995.
Serra, P., Pons, X., and Saurí, D.: Land-cover and land-use change in a Mediterranean landscape: A spatial analysis of driving forces integrating biophysical and human factors, Appl. Geogr., 28, 189–209, https://doi.org/10.1016/j.apgeog.2008.02.001, 2008.
Slayback, D. A., Pinzon, J. E., Los, S. O., and Tucker, C. J.: Northern hemisphere photosynthetic trends 1982–99, Glob. Change Biol., 9, 1–15, https://doi.org/10.1046/j.1365-2486.2003.00507.x, 2003.
Sona, N. T., Chen, C. F., Chen, C. R., Chang, L. Y., and Minh, V. Q.: Monitoring agricultural drought in the lower mekong basin using MODIS NDVI and land surface temperature data, Int. J. Appl. Earth Obs. Geoinf., 18, 417–427, https://doi.org/10.1016/j.jag.2012.03.014, 2012.
Stagge, J. H., Kohn, I., Tallaksen, L. M., and Stahl, K.: Modeling drought impact occurrence based on meteorological drought indices in Europe, J. Hydrol., 530, 37–50, https://doi.org/10.1016/j.jhydrol.2015.09.039, 2015.
Stellmes, M., Röder, A., Udelhoven, T., and Hill, J.: Mapping syndromes of land change in Spain with remote sensing time series, demographic and climatic data, Land Use Policy, 30, 685–702, https://doi.org/10.1016/j.landusepol.2012.05.007, 2013.
Tucker, C. J.: Red and photographic infrared linear combinations for monitoring vegetation, Remote Sens. Environ., 8, 127–150, https://doi.org/10.1016/0034-4257(79)90013-0, 1979.
Tucker, C. J., Pinzon, J. E., Brown, M. E., Slayback, D. A., Pak, E. W., Mahoney, R., Vermote, E. F., and El Saleous, N.: An extended AVHRR 8-km NDVI dataset compatible with MODIS and SPOT vegetation NDVI data, Int. J. Remote Sens., 26, 4485–4498, https://doi.org/10.1080/01431160500168686, 2005.
Udelhoven, T., Stellmes, M., del Barrio, G., and Hill, J.: Assessment of rainfall and NDVI anomalies in Spain (1989–1999) using distributed lag models, Int. J. Remote Sens., 30, 1961–1976, https://doi.org/10.1080/01431160802546829, 2009.
Vicente-Serrano, S. M.: Spatial and temporal analysis of droughts in the Iberian Peninsula (1910–2000), Hydrol. Sci. J., 51, 83–97, https://doi.org/10.1623/hysj.51.1.83, 2006.
Vicente-Serrano, S. M.: Evaluating the impact of drought using remote sensing in a Mediterranean, Semi-arid Region, Nat. Hazards, 40, 173–208, https://doi.org/10.1007/s11069-006-0009-7, 2007.
Vicente-Serrano, S. M. and Beguería, S.: Comment on “Candidate distributions for climatological drought indices (SPI and SPEI)” by James H. Stagge et al., Int. J. Climatol., 36, 2120–2131, https://doi.org/10.1002/joc.4474, 2016.
Vicente-Serrano, S. M., Cuadrat-Prats, J. M., and Romo, A.: Aridity influence on vegetation patterns in the middle Ebro Valley (Spain): Evaluation by means of AVHRR images and climate interpolation techniques, J. Arid Environ., 66, 353–375, https://doi.org/10.1016/j.jaridenv.2005.10.021, 2006.
Vicente-Serrano, S. M., Beguería, S., and López-Moreno, J. I.: A multiscalar drought index sensitive to global warming: The standardized precipitation evapotranspiration index, J. Clim., 23, 1696–1718, https://doi.org/10.1175/2009JCLI2909.1, 2010.
Vicente-Serrano, S. M., Beguería, S., and López-Moreno, J. I.: Comment on Characteristics and trends in various forms of the Palmer Drought Severity Index (PDSI) during 1900–2008 by Aiguo Dai, J. Geophys. Res.-Atmos., 116, D19112, https://doi.org/10.1029/2010JD015541 2011.
Vicente-Serrano, S. M., Beguería, S., Lorenzo-Lacruz, J., Camarero, J. J., López-Moreno, J. I., Azorin-Molina, C., Revuelto, J., Morán-Tejeda, E., and Sanchez-Lorenzo, A.: Performance of drought indices for ecological, agricultural, and hydrological applications, Earth Interact., 16, https://doi.org/10.1175/2012EI000434.1, 2012.
Vicente-Serrano, S. M., Gouveia, C., Camarero, J. J., Beguería, S., Trigo, R., López-Moreno, J. I., Azorín-Molina, C., Pasho, E., Lorenzo-Lacruz, J., Revuelto, J., Morán-Tejeda, E., and Sanchez-Lorenzo, A.: Response of vegetation to drought time-scales across global land biomes, P. Natl. Acad. Sci. USA, 110, 52–57, https://doi.org/10.1073/pnas.1207068110, 2013.
Vicente-Serrano, S. M., Camarero, J. J., and Azorin-Molina, C.: Diverse responses of forest growth to drought time-scales in the Northern Hemisphere, Glob. Ecol. Biogeogr., 23, 1019–1030, https://doi.org/10.1111/geb.12183, 2014a.
Vicente-Serrano, S. M., Lopez-Moreno, J.-I., Beguería, S., Lorenzo-Lacruz, J., Sanchez-Lorenzo, A., García-Ruiz, J. M., Azorin-Molina, C., Morán-Tejeda, E., Revuelto, J., Trigo, R., Coelho, F., and Espejo, F.: Evidence of increasing drought severity caused by temperature rise in southern Europe, Environ. Res. Lett., 9, 044001, https://doi.org/10.1088/1748-9326/9/4/044001, 2014b.
Vicente-Serrano, S. M., Azorin-Molina, C., Sanchez-Lorenzo, A., Revuelto, J., López-Moreno, J. I., González-Hidalgo, J. C., Moran-Tejeda, E., and Espejo, F.: Reference evapotranspiration variability and trends in Spain, 1961–2011, Glob. Planet. Change, 121, 26–40, https://doi.org/10.1016/j.gloplacha.2014.06.005, 2014c.
Vicente-Serrano, S. M., Azorin-Molina, C., Sanchez-Lorenzo, A., Revuelto, J., Morán-Tejeda, E., Lõpez-Moreno, J. I., and Espejo, F.: Sensitivity of reference evapotranspiration to changes in meteorological parameters in Spain (1961–2011), Water Resour. Res., 50, 8458–8480, https://doi.org/10.1002/2014WR015427, 2014d.
Vicente-Serrano, S. M., Cabello, D., Tomás-Burguera, M., Martín-Hernández, N., Beguería, S., Azorin-Molina, C., and Kenawy, A. E.: Drought variability and land degradation in semiarid regions: Assessment using remote sensing data and drought indices (1982–2011), Remote Sens., 7, 4391–4423, https://doi.org/10.3390/rs70404391, 2015.
Vicente-Serrano, S. M., Tomas-Burguera, M., Beguería, S., Reig, F., Latorre, B., Peña-Gallardo, M., Luna, M. Y., Morata, A., and González-Hidalgo, J. C.: A High Resolution Dataset of Drought Indices for Spain, Data, 2, https://doi.org/10.3390/data2030022, 2017.
Vicente-Serrano, S. M., Martín-Hernández, N., Reig, F., Azorin-Molina, C., Zabalza, J., Beguería, S., Domínguez-Castro, F., El Kenawy, A., Peña-Gallardo, M., Noguera, I., and García, M.: Vegetation greening in Spain detected from long term data (1981–2015), Int. J. Remote Sens., in review, 2018.
Wan, Z., Wang, P., and Li, X.: Using MODIS Land Surface Temperature and Normalized Difference Vegetation Index products for monitoring drought in the southern Great Plains, USA, Int. J. Remote Sens., 25, 61–72, https://doi.org/10.1080/0143116031000115328, 2004.
Wang, J., Rich, P. M., and Price, K. P.: Temporal responses of NDVI to precipitation and temperature in the central Great Plains, USA, Int. J. Remote Sens., 24, 2345–2364, https://doi.org/10.1080/01431160210154812, 2003.
Xulu, S., Peerbhay, K., Gebreslasie, M., and Ismail, R.: Drought influence on forest plantations in Zululand, South Africa, using MODIS time series and climate data, Forests, 9, https://doi.org/10.3390/f9090528, 2018.
Yang, S., Meng, D., Li, X., and Wu, X.: Multi-scale responses of vegetation changes relative to the SPEI meteorological drought index in North China in 2001–2014, Shengtai Xuebao, Acta Ecol. Sin., 38, 1028–1039, https://doi.org/10.5846/stxb201611242398, 2018.
Zhang, L., Xiao, J., Zhou, Y., Zheng, Y., Li, J., and Xiao, H.: Drought events and their effects on vegetation productivity in China, Ecosphere, 7, e01591, https://doi.org/10.1002/ecs2.1591, 2016.
Zhang, Q., Kong, D., Singh, V. P., and Shi, P.: Response of vegetation to different time-scales drought across China: Spatiotemporal patterns, causes and implications, Glob. Planet. Change, 152, 1–11, https://doi.org/10.1016/j.gloplacha.2017.02.008, 2017.
Zhao, M. and Running, S. W.: Drought-induced reduction in global terrestrial net primary production from 2000 through 2009, Science, 329, 940–943, https://doi.org/10.1126/science.1192666, 2010.
Zhao, M., Geruo, A., Velicogna, I., and Kimball, J. S.: Satellite observations of regional drought severity in the continental United States using GRACE-based terrestrial water storage changes, J. Clim., 30, 6297–6308, https://doi.org/10.1175/JCLI-D-16-0458.1, 2017.
Zhao, X., Wei, H., Liang, S., Zhou, T., He, B., Tang, B., and Wu, D.: Responses of natural vegetation to different stages of extreme drought during 2009–2010 in Southwestern China, Remote Sens., 7, 14039–14054, https://doi.org/10.3390/rs71014039, 2015.