the Creative Commons Attribution 4.0 License.
the Creative Commons Attribution 4.0 License.
 | 14 Dec 2018
The role of atmospheric rivers in compound events consisting of heavy precipitation and high storm surges along the Dutch coast
Hylke de Vries
Sybren Drijfhout
Atmospheric river (AR) systems play a significant role in the simultaneous occurrence of high coastal water levels and heavy precipitation in the Netherlands. Based on observed precipitation values (E-OBS) and the output of a numerical storm surge model (WAQUA/DSCMv5) forced with ERA-Interim sea level pressure and wind fields, we find that the majority of compound events (CEs) between 1979 and 2015 have been accompanied by the presence of an AR over the Netherlands. In detail, we show that CEs have a 3 to 4 times higher chance of occurrence on days with an AR over the Netherlands compared to any random day (i.e. days without knowledge on presence of an AR). In contrast, the occurrence of a CE on a day without AR is 3 times less likely than on any random day. Additionally, by isolating and assessing the prevailing sea level pressure (SLP) and sea surface temperature (SST) conditions with and without AR involvement up to 7 days before the events, we show that the presence of ARs constitutes a specific type of forcing conditions that (i) resemble the SLP anomaly patterns during the positive phase of the North Atlantic Oscillation (NAO+) with a north–south pressure dipole over the North Atlantic and (ii) cause a cooling of the North Atlantic subpolar gyre and eastern boundary upwelling zone while warming the western boundary of the North Atlantic. These conditions are clearly distinguishable from those during compound events without the influence of an AR which occur under SLP conditions resembling the East Atlantic (EA) pattern with a west–east pressure dipole over northern Europe and are accompanied by a cooling of the West Atlantic. Thus, this study shows that ARs are a useful tool for the early identification of possible harmful meteorological conditions over the Netherlands and supports an effort for the establishment of an early warning system.
- Article
(8774 KB) - Full-text XML
-
Supplement
(1487 KB) - BibTeX
- EndNote


Currently, policy decisions to respond to flood risk and its increase under global climate change are based on the assumption that coastal flooding is caused by a single, isolated and independent hazard, e.g. heavy precipitation or high river discharge. However, it has become increasingly obvious that this “single-hazard-approach” is insufficient to account for some of the most extreme flooding events observed over recent decades which were in fact often induced by the combined effect of multiple hazards (Kew et al., 2013; Vorogushyn et al., 2018; Zscheischler et al., 2018; van den Hurk et al., 2015). These so called “compound events” generally have a more devastating impact than their single-hazard equivalent and exert significant influence on the relevant flood statistics (Zscheischler et al., 2018; van den Hurk et al., 2015). Understanding the underlying dynamics of compound events is therefore paramount to support policymakers in making informed decisions and implementing effective coastal protection measures.
In this study we focus on compound events (CEs) in the form of heavy local precipitation and high surge levels (hereafter simply referred to as CEs) along the Dutch coast. For low lying countries like the Netherlands (NL) with a long coastline, understanding CEs related to coastal flooding is of particular importance as these have the potential to cause catastrophic impacts. First assessments of this type of compound events have aimed their attention mostly to the impact of compound events on flood risk in terms of return period (Kew et al., 2013; van den Hurk et al., 2015). While all these studies conclude that the exclusion of CEs leads to a severe underestimation of flood risk along the Dutch coast, which renders the application of current assessments for design standards insufficient, little detail is known about the mechanisms driving the simultaneous occurrence of heavy precipitation and high surge levels. A solid understanding of these processes and their interaction is, however, crucial to understand the implications that future climate change may have on the occurrence of CEs and thus the future development of flood risk. To close this gap, this study focuses on the large-scale climatologic conditions leading to the simultaneous occurrence of heavy precipitation and high surge levels. In particular, the study aims to identify the importance of one atmospheric phenomenon that has been suggested to potentially be involved in coastal CEs due to its association with high precipitation and strong near-surface winds, namely atmospheric rivers (Waliser and Guan, 2017).
Atmospheric rivers (ARs) are long filaments of high water vapour concentration typically located in the lower troposphere which travel from low to mid-latitudes towards the poles in both hemispheres. They play an important role in the hydrological cycle being responsible for over 90 % of the poleward water vapour transport at mid-latitudes (Dacre et al., 2015; Gimeno et al., 2014; Guan and Waliser, 2015; Zhu and Newell, 1998). They typically develop in relation to extra-tropical cyclones and move with the large-scale dynamic phenomena that produce them (hereafter AR system). In the case of western Europe, the moisture contained in ARs hitting this region originates from evaporation over an area stretching from the subtropical North Atlantic (north of 20∘ N) over the central and western North Atlantic to the western European coast (Ramos et al., 2016a). The vast geometric extent of ARs, with a typical width of several hundred kilometres (<1000 km) and lengths of over 2000 km allows them to cover and affect large geographical areas simultaneously (Guan and Waliser, 2015; Ralph et al., 2004). If these water-vapour-rich structures make landfall, orographic lifting (Lavers and Villarini, 2013) and, to a minor extent, other synoptic-scale and mesoscale processes (Ralph and Dettinger, 2012) can cause severe precipitation events that have been linked to major floods in many geographical regions (Gimeno et al., 2014). In western Europe, landfalling ARs dominate the high tail of extreme precipitation and their impacts can reach as far inland as Poland (Lavers and Villarini, 2013; Waliser and Guan, 2017). The strong near-surface winds associated with ARs constitute up to half of the events in the highest 98th percentile of the wind distribution along the western European coastline between 1997 and 2014 (Waliser and Guan, 2017). Thus, AR systems have the potential to play an important role in coastal surge heights a characteristic not previously assessed for ARs affecting Europe (Waliser and Guan, 2017).
The determination of the importance of ARs for and their impact on the conditions during coastal CEs in the Netherlands will pave the way to better understand the underlying risk CEs pose for coastal areas and to a possible early identification of hazardous conditions. This is particularly important in light of the projected frequency enhancement and intensification of ARs under global climate change (Espinoza et al., 2018; Ramos et al., 2016b). Despite their importance for flood risk, even univariate assessments of the impact of ARs and AR-carrying systems in the Netherlands have been incomplete by focusing on the impact of ARs on local precipitation. While these studies have brought valuable insights into the impact of ARs on precipitation in the Netherlands, there have been no equivalent assessments for the impact of ARs on coastal water level extremes or the connection between water level and precipitation extremes. Thus, it is unclear if the strong winds accompanying ARs can induce storm surges along the Dutch coast, where north–northwesterly winds cause the highest storm surges (Kew et al., 2013). This puts a constraint on the AR-causing low-pressure systems passing over the Netherlands that is not necessarily met by every one of those. The study presented here connects the impact of ARs on both precipitation and coastal surge levels. To achieve this we apply the “bottom-up” approach introduced by Hazeleger et al. (2015), which uses the impact, here the co-occurrence of high water levels and heavy precipitation, as a venture point for the analysis and identifies the physical processes driving the particular impact from there. This approach is particularly suited for compound events as it allows the identification of drivers with the largest impacts (Zscheischler et al., 2018). In detail, we investigate coastal water levels derived from a numerical surge model (WAQUA/DCSMv5) driven by reanalysis data and link these to observed precipitation (E-OBS) over the Netherlands from 1979 to 2015. From this dataset we identify CEs by isolating those events where both precipitation and water level, exceed a pre-defined quantile threshold. In a second step we identify days with the presence of an AR over the Netherlands. We then compare mean conditions during CEs with and without the involvement of ARs and identify the driving mechanisms behind these two types of CEs. Finally we determine the difference between conditions during ARs associated with CEs and those that are not (see Sect. 3). In this way, our study provides a first classification for compound events and presents a detailed assessment of conditions leading to coastal CEs in the Netherlands while focusing on the influence of ARs on their driving mechanisms. This will determine the potential of ARs to aggravate hazards related to coastal CEs in the Netherlands and deliver valuable insight into the atmospheric processes driving these events. The findings of this study could then be used to develop an early warning system using ARs as an indicator for upcoming events.
This study focuses on the possibility and significance of ARs systems causing compound events along the Dutch coast. Located largely at or below sea level, the Netherlands (NL) does not show any significant orographic features (Fig. 1). As a result, ARs passing over the Netherlands do not necessarily cause extreme precipitation (Beukema, 2014). Nevertheless, it has been shown that those ARs making landfall along the Dutch coast can lead to significant precipitation events depending on the forcing conditions caused by the prevailing large-scale atmospheric conditions (Waliser and Guan, 2017).
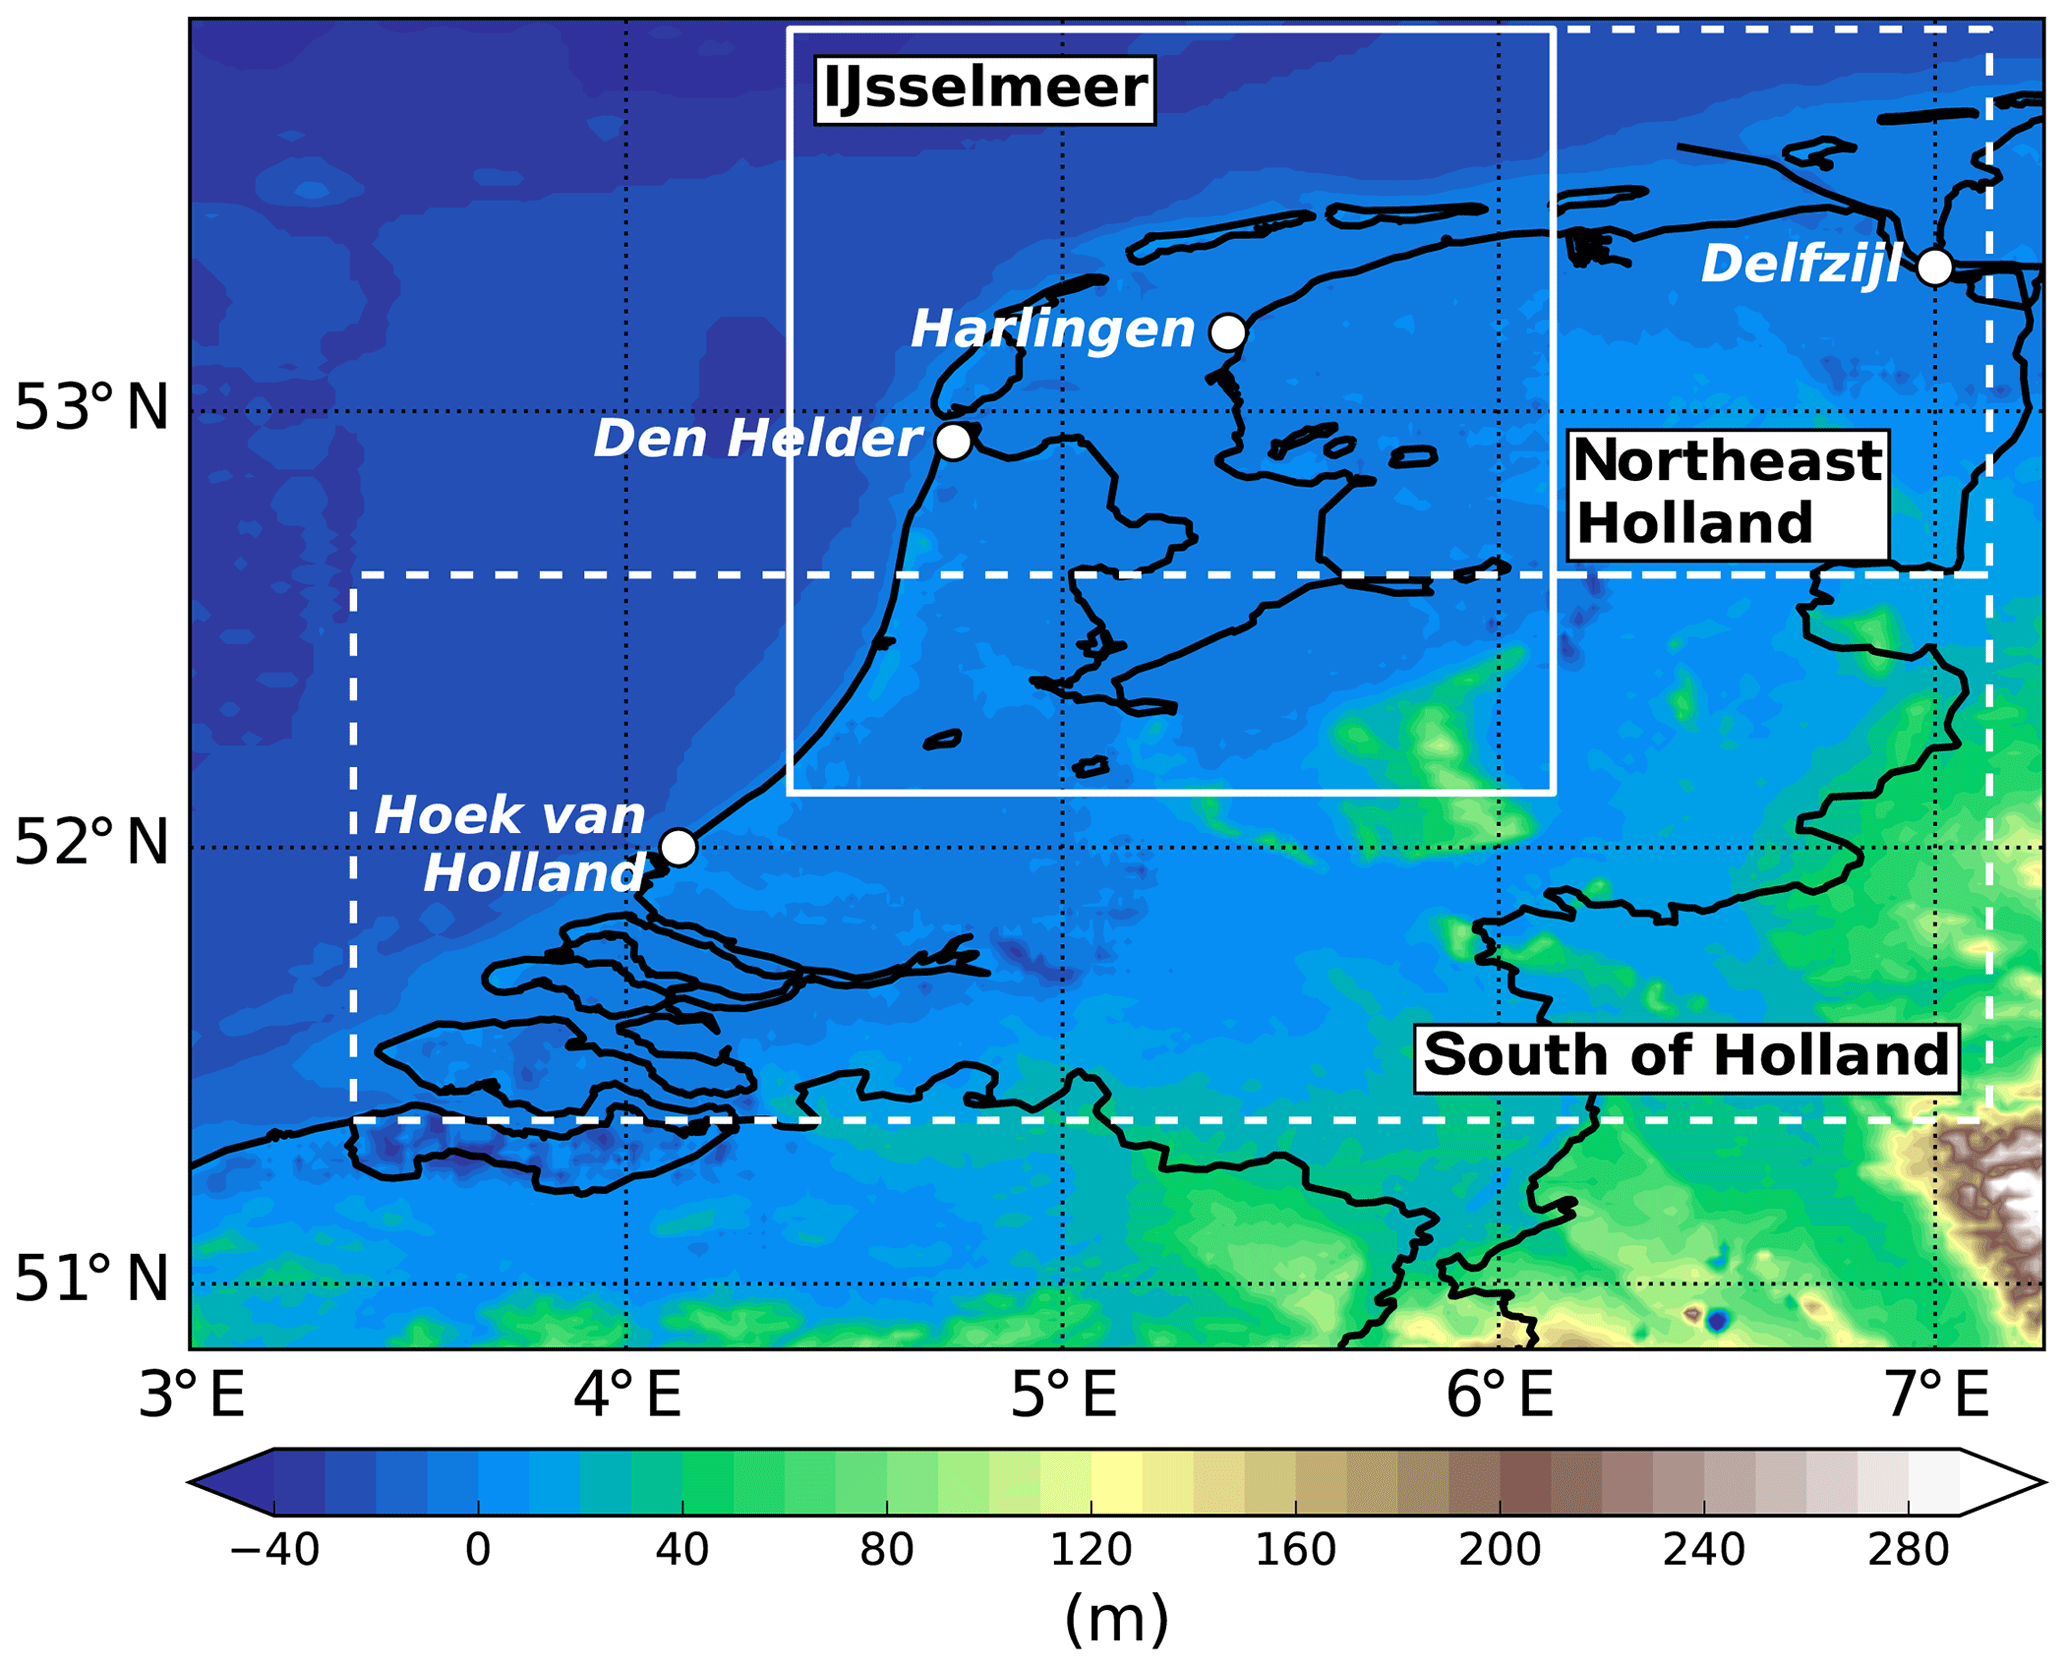
Figure 1Topographical map of the study area showing the geographic location of the four coastal stations under investigation in this study. White boxes indicate the three regions that were considered for local precipitation, i.e. south of Holland for Hoek van Holland, IJsselmeer for Den Helder and Harlingen and northeast Holland for Delfzijl. Elevation data are derived from the ETOPO1 Global Relief Model (Amante and Eakins, 2009).
For the impact assessment, our analysis focuses on a selection of four stations spread along the Dutch coast, namely Hoek van Holland (HvH), Den Helder (DHR), Harlingen (HRL), and Delfzijl (DLZ). The catchment areas associated with these stations are shown in Fig. 1 and include the south of the Netherlands (hereafter SNL) for Hoek van Holland, the IJsselmeer and its surrounding region (hereafter LIJ) for Den Helder and Harlingen, and the northeast of the Netherlands (hereafter NENL) for Delfzijl. All stations are operated by Dutch Ministry of Infrastructure and Water Management and are located in four different water boards. The stations were chosen due to their importance in the Dutch water management system and thus, their significance for flood risk in the Netherlands. Further, they represent a spread of stations along the Dutch coast and cover all its orientations. In this way, our study accounts for stations situated at the westward facing part of the coast (HvH), the northward facing part in the Wadden Sea (HRL, DLZ), and one station facing both directions located at the far west corner of the Dutch mainland (DHR).
3.1 ERA-Interim reanalysis dataset
The ERA-Interim reanalysis dataset is produced by the European Centre for Medium-Range Weather Forecast (ECMWF). It is the result of reanalysis simulations performed using a three component forecast model (Integrated Forecasting System IFS release Cy31r2) for the time period from 1 January 1979 to 2018 (Berrisford et al., 2011; Dee et al., 2011). This study uses data for mean sea level pressure, zonal and meridional wind components to force a numerical storm surge model, and integrated column vapour and sea surface temperatures for the analysis of differences between AR systems associated with compound events and those without a connection between AR and compound event for the time period from 1979 to 2015.
3.2 Atmospheric river database
Information about ARs occurring in the ERA-Interim reanalysis data between 1979 and 2015 is taken from an online AR database, which is based on the algorithm presented in Guan and Waliser (2015). The database contains information about the geometrical shape, axis and landfall locations of ARs in the ERA Interim dataset on a global grid with a spatial resolution of . It further provides the land–sea and coastal mask the detection algorithm used to determine AR landfalls. These masks are equivalent to those used in the IFS release Cy31r2 that generate the ERA-Interim reanalysis data.
ARs in the database are identified using the integrated vapour transport (IVT) spreading pressure levels between 1000 and 300 hPa. If the IVT exceeds both an intensity threshold of its local 85th percentile and a minimum of 100 kg m−1 s−1, the structure has the potential to be classified as an AR. However, only those structures with a length of at least 2000 km and a length to width ratio of two or higher are classified as ARs. Atmospheric IVT structures that do not show a significant poleward component are neglected. For more details about the detection of ARs and a validation of the applied detection algorithm the reader is referred to Guan and Waliser (2015) and Guan et al. (2018).
As mentioned in Sect. 2 the study presented in this paper isolates ARs in the database that passed over the Netherlands. For this, we isolated all days from the AR database on which an AR was detected within a box covering 3.0∘ E–7.2∘ E and 50.0∘ N–54.0∘ N (approximate location of the Netherlands) during at least one of the four daily timesteps. This results in the equivalent treatment of days with an AR over the study area during multiple timesteps and those days with an AR during only one timestep. The duration of the presence of an AR over the study area is therefore neglected. This choice accounts for the frequency limitation set by the E-OBS dataset, which provides daily precipitation sums only (see Sect. 3.3).
3.3 E-OBS precipitation dataset
The E-OBS precipitation dataset provides information of daily precipitation sums over Europe (land only) and spans over a time period from 1950 until present. It is derived from observations at stations across Europe and maps precipitation on a variety of spherical and regular grids. For a detail description of the dataset the reader is referred to Haylock et al. (2008).
In this study we use data on a regular grid with a 0.25∘ resolution. The time period taken into consideration is equivalent to the one used for the generation of the AR database described in the previous section, i.e. 1979 to 2015 (Sect. 3.2). Precipitation sums for the different regions under investigation have been derived by isolating precipitation data over the grid boxes within the region SNL, LIJ and NENL as indicated in Fig. 1.
3.4 The Storm Surge Model WAQUA/DCSMv5
In this study water levels along the Dutch coast are determined using the Dutch continental shelf model WAQUA/DCSMv5 (Gerritsen et al., 1995). Based on the two dimensional shallow water equations, WAQUA calculates water levels in the North Sea basin taking into account sea level pressure, 10 m wind speeds and the astronomical tide at the domain boundaries using 10 harmonic constituents. For selected stations along the coast, WAQUA provides local water level time series with a 10 m frequency. The output further contains information about the contribution of the tidal component and non-tidal residual (hereafter referred to as surge) to the total water level at each station.
The meteorological fields driving WAQUA in this study are mean sea level pressure and 10 m wind fields from the ERA-Interim reanalysis database (Sect. 3.1). In this set up, WAQUA is able to reproduce observations from gauge stations reasonably well (Ridder et al., 2018; Sterl et al., 2009). However, while generally reliable, WAQUA tends to underestimate extreme water levels, particularly those with long return periods (Ridder et al., 2018). However, this is not considered to be of major significance for this study as the results presented here are based on quantiles and are therefore determined relative to water levels produced within the model. Further, the water levels investigated here lie below the 1-year return level, thus the negative bias is not expected to significantly affect the results and conclusions of this study.
3.5 Definition of compound events
Since this study uses local precipitation as a proxy for run-off we need to define a temporal constraint for the definition of compound events that allows enough time for the precipitation water to reach the coast and interact with coastal waters. At the same time, we need to exclude more complex hydrodynamic processes that are caused by mechanisms taking place further upstream, i.e. outside of the study area, in large catchment areas. Considering the relatively small catchment areas under investigation here, a run off time of 3 days seems reasonable. This 3-day period should be sufficient to ensure that run-off and other catchment processes have transported the precipitated water close enough to the coastal area to be able to interact with the coastal water level. If precipitation was to occur several days after a coastal water maximum, the collected water in the catchment would reach the coast after the maximum water levels have already subsided, i.e. too late to cause the compounding effect under investigation in this study. Similarly, if a coastal water maximum takes place too long after a high precipitation event, i.e. the time-scale is chosen to be too long, the precipitated water might already be discharged into the sea, again not coinciding with a surge extreme. In this case the local impact would result from one or the other variable in isolation, thus could lead to false positives in the identification of compound events. Also, for long time scales the run off might be contaminated by upstream processes unrelated to the synoptic event causing the local precipitation, e.g. snow melt or isolated precipitation further upstream unrelated to the synoptic system causing the surge. Furthermore, since this study applies daily precipitation sums the selection of a 3-day period also ensures the inclusion of extremes that occur closely around midnight of a selected day that otherwise would be associated to a different day and thus falsely considered to not interact with coastal water levels despite the water.
The choice of a threshold to determine whether or not an event is considered to be “extreme” needs to take into account the limited data availability of daily values in precipitation and only 37 years in water levels. Therefore, we need to select a threshold low enough to deliver a reasonable number of events to allow a solid statistical analysis. At the same time, setting the threshold too low would prevent the assessment of the high tail of the multivariate distribution by including events with only moderate impact that are less relevant for the analysis of compound events. Therefore, we choose a relatively low threshold to define extreme precipitation and total water levels, namely the 95th percentile of the respective variable. The choice of rather weak extremes like this ensures numbers of exceedances sufficient for a solid investigation of the relatively short study period.
According to the above argumentation on timing and threshold, in the remainder of this paper, an event is referred to as a compound event (CE) if the 3-day precipitation sum over one of the chosen regions in the study area exceeds its 95th percentile and the total water level at the associated coastal station exceeds its 95th percentile at any point during the same 3-day period. The compound event is then considered to have occurred on the day in the centre of the 3-day period over which the precipitation sum and the water level maximum was derived. The day before and after this are not considered compound events unless they are located in the middle of a 3-day period that fulfills the above defined requirements. For instance, suppose that the precipitation (P) summed over day_1, day_2, and day_3 exceeds the 95th percentile of the 3-day precipitation sum of the full time series (), i.e. . If the maximum total water level () during the same 3-day period exceeds the 95th percentile of the total water level (H) of the full time series (), i.e. , then day_2 is considered to be a “compound event”. Day_1 and day_3 are not defined as compound events, unless they themselves fulfill the definition of compound events, i.e. for day_1: , H(day_1), and for day_3: , H(day_3), . Each of the 3 days is then counted as a single compound event. As a result, should all 3 days (day_1, day_2 and day_3) fulfill the requirement of compound events then they are considered as three separate events. Accordingly, the day before the compound event on day_1 would be day_0, the day before CE on day_2 would be day_1 etc.
4.1 Climatology
Throughout the study period with a total of 13 513 days, roughly 17 %–19 % of days display conditions with an AR located over the Netherlands (NL) at at least one of its four 6-hourly reanalysis timesteps (Fig. 2). This shows that ARs are a common phenomenon in this region with an AR passing over the Netherlands roughly every 3–5 days. The number of compound events in the 37 years of ERA-Interim data ranges from 93 (DLZ) to 106 (HvH) events with the majority of CEs coinciding with the presence of an AR over the Netherlands on the same day or within ±1 days of the event (Table 1). Only a small fraction of 18 % (Harlingen) to 28 % (Delfzijl) of CEs does not show any association to the presence of an AR over the Netherlands. This is significantly different to climatology with roughly 61 % of days that lack the presence of an AR over a 3-day period against 39 % of days with an AR detected over the Netherlands either on the day itself or the day before or after. As a result, the chance of having a CE on a random day (i.e. without knowledge on presence AR) is a factor of 3 higher than that on a day without an AR, whereas the chance on having a CE on a day with AR is a factor of 3 to 4 higher than on a random day.
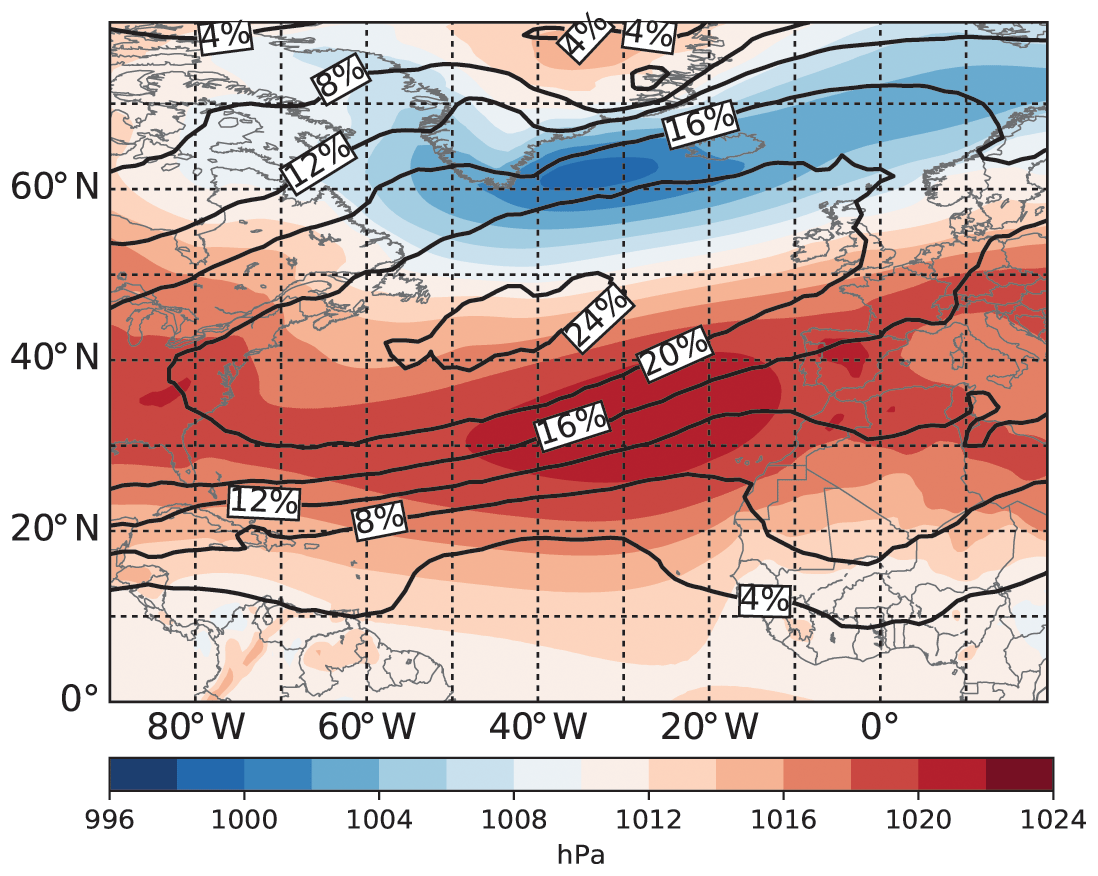
Figure 2Climatology of daily mean sea level pressure (SLP; colour shading). Contours mark regions over which ARs are located. Numbers indicate the relative amount of time that the respective area is covered by an ARs throughout the study period (1979–2015).
Table 1Number of compound events associated with AR landfall relative to the total number of compound events at the four coastal stations under investigation during the ERA-Interim period (1979–2015). For an explanation of terminologies and a definition of the different types of compound events please refer to the text.
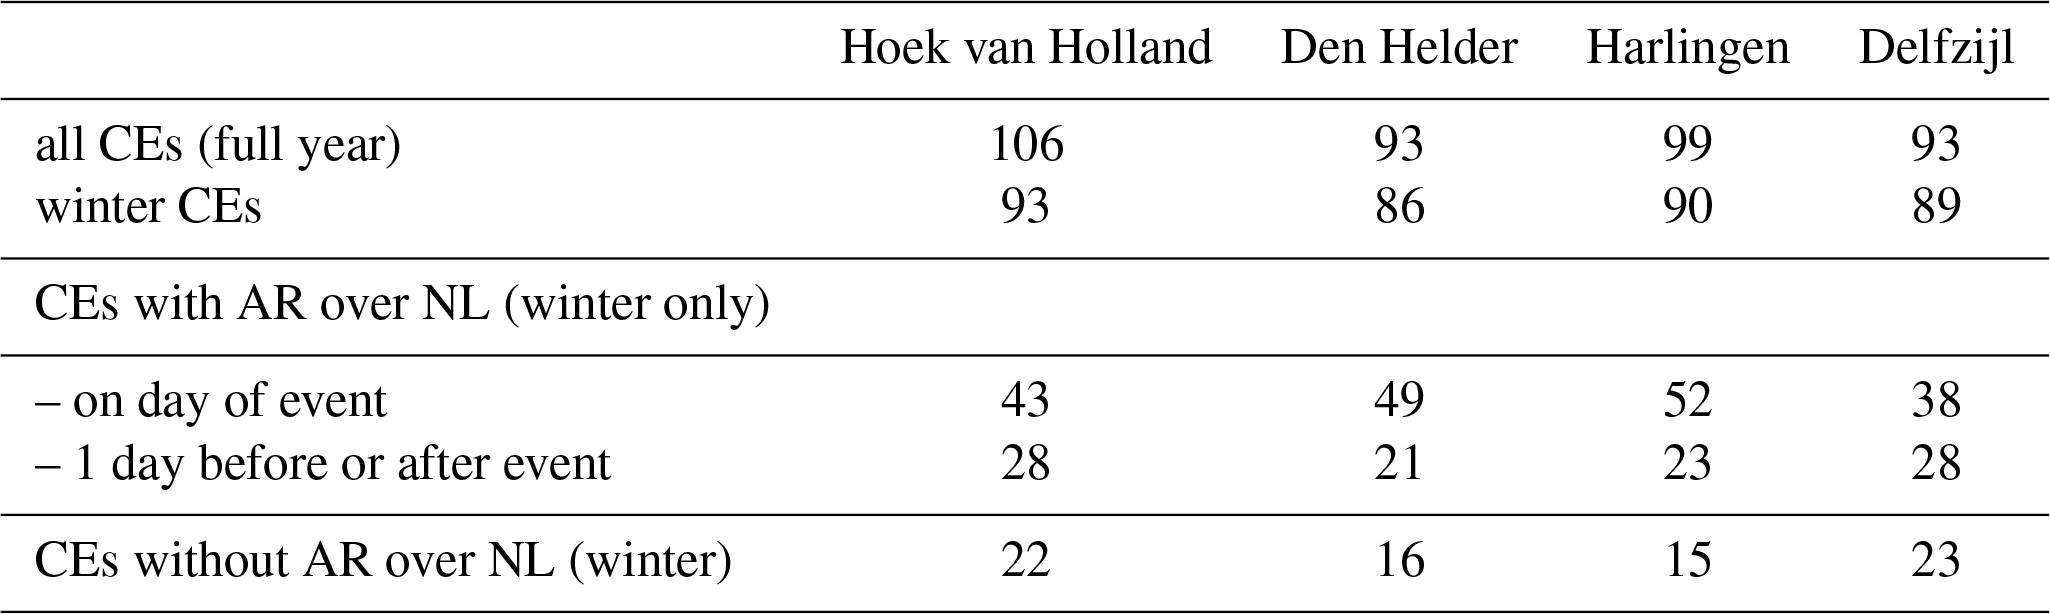
Compound events mainly occur in the winter 6 months (SON and DJF) with a peak in November at HvH and DHR and in January at HRL and DLZ (Fig. 3). CEs associated with ARs occur almost exclusively during the winter 6 months with the exception of a few events between one (DLZ) and five (HvH) in March. Due to the small total number of CEs with AR association in March and the lack of CEs in the summer months, the remainder of this study will focus the assessment on the extended winter (SON and DJF) only.

Figure 3Monthly climatological mean number of compound events at the four coastal stations assessed in this study. Black columns indicate the number of all CEs (CEs with AR + CEs without AR + CEs without ARs ± 1 day), while red bars show the number of CEs with association to an AR over the Netherlands (CEs with AR).
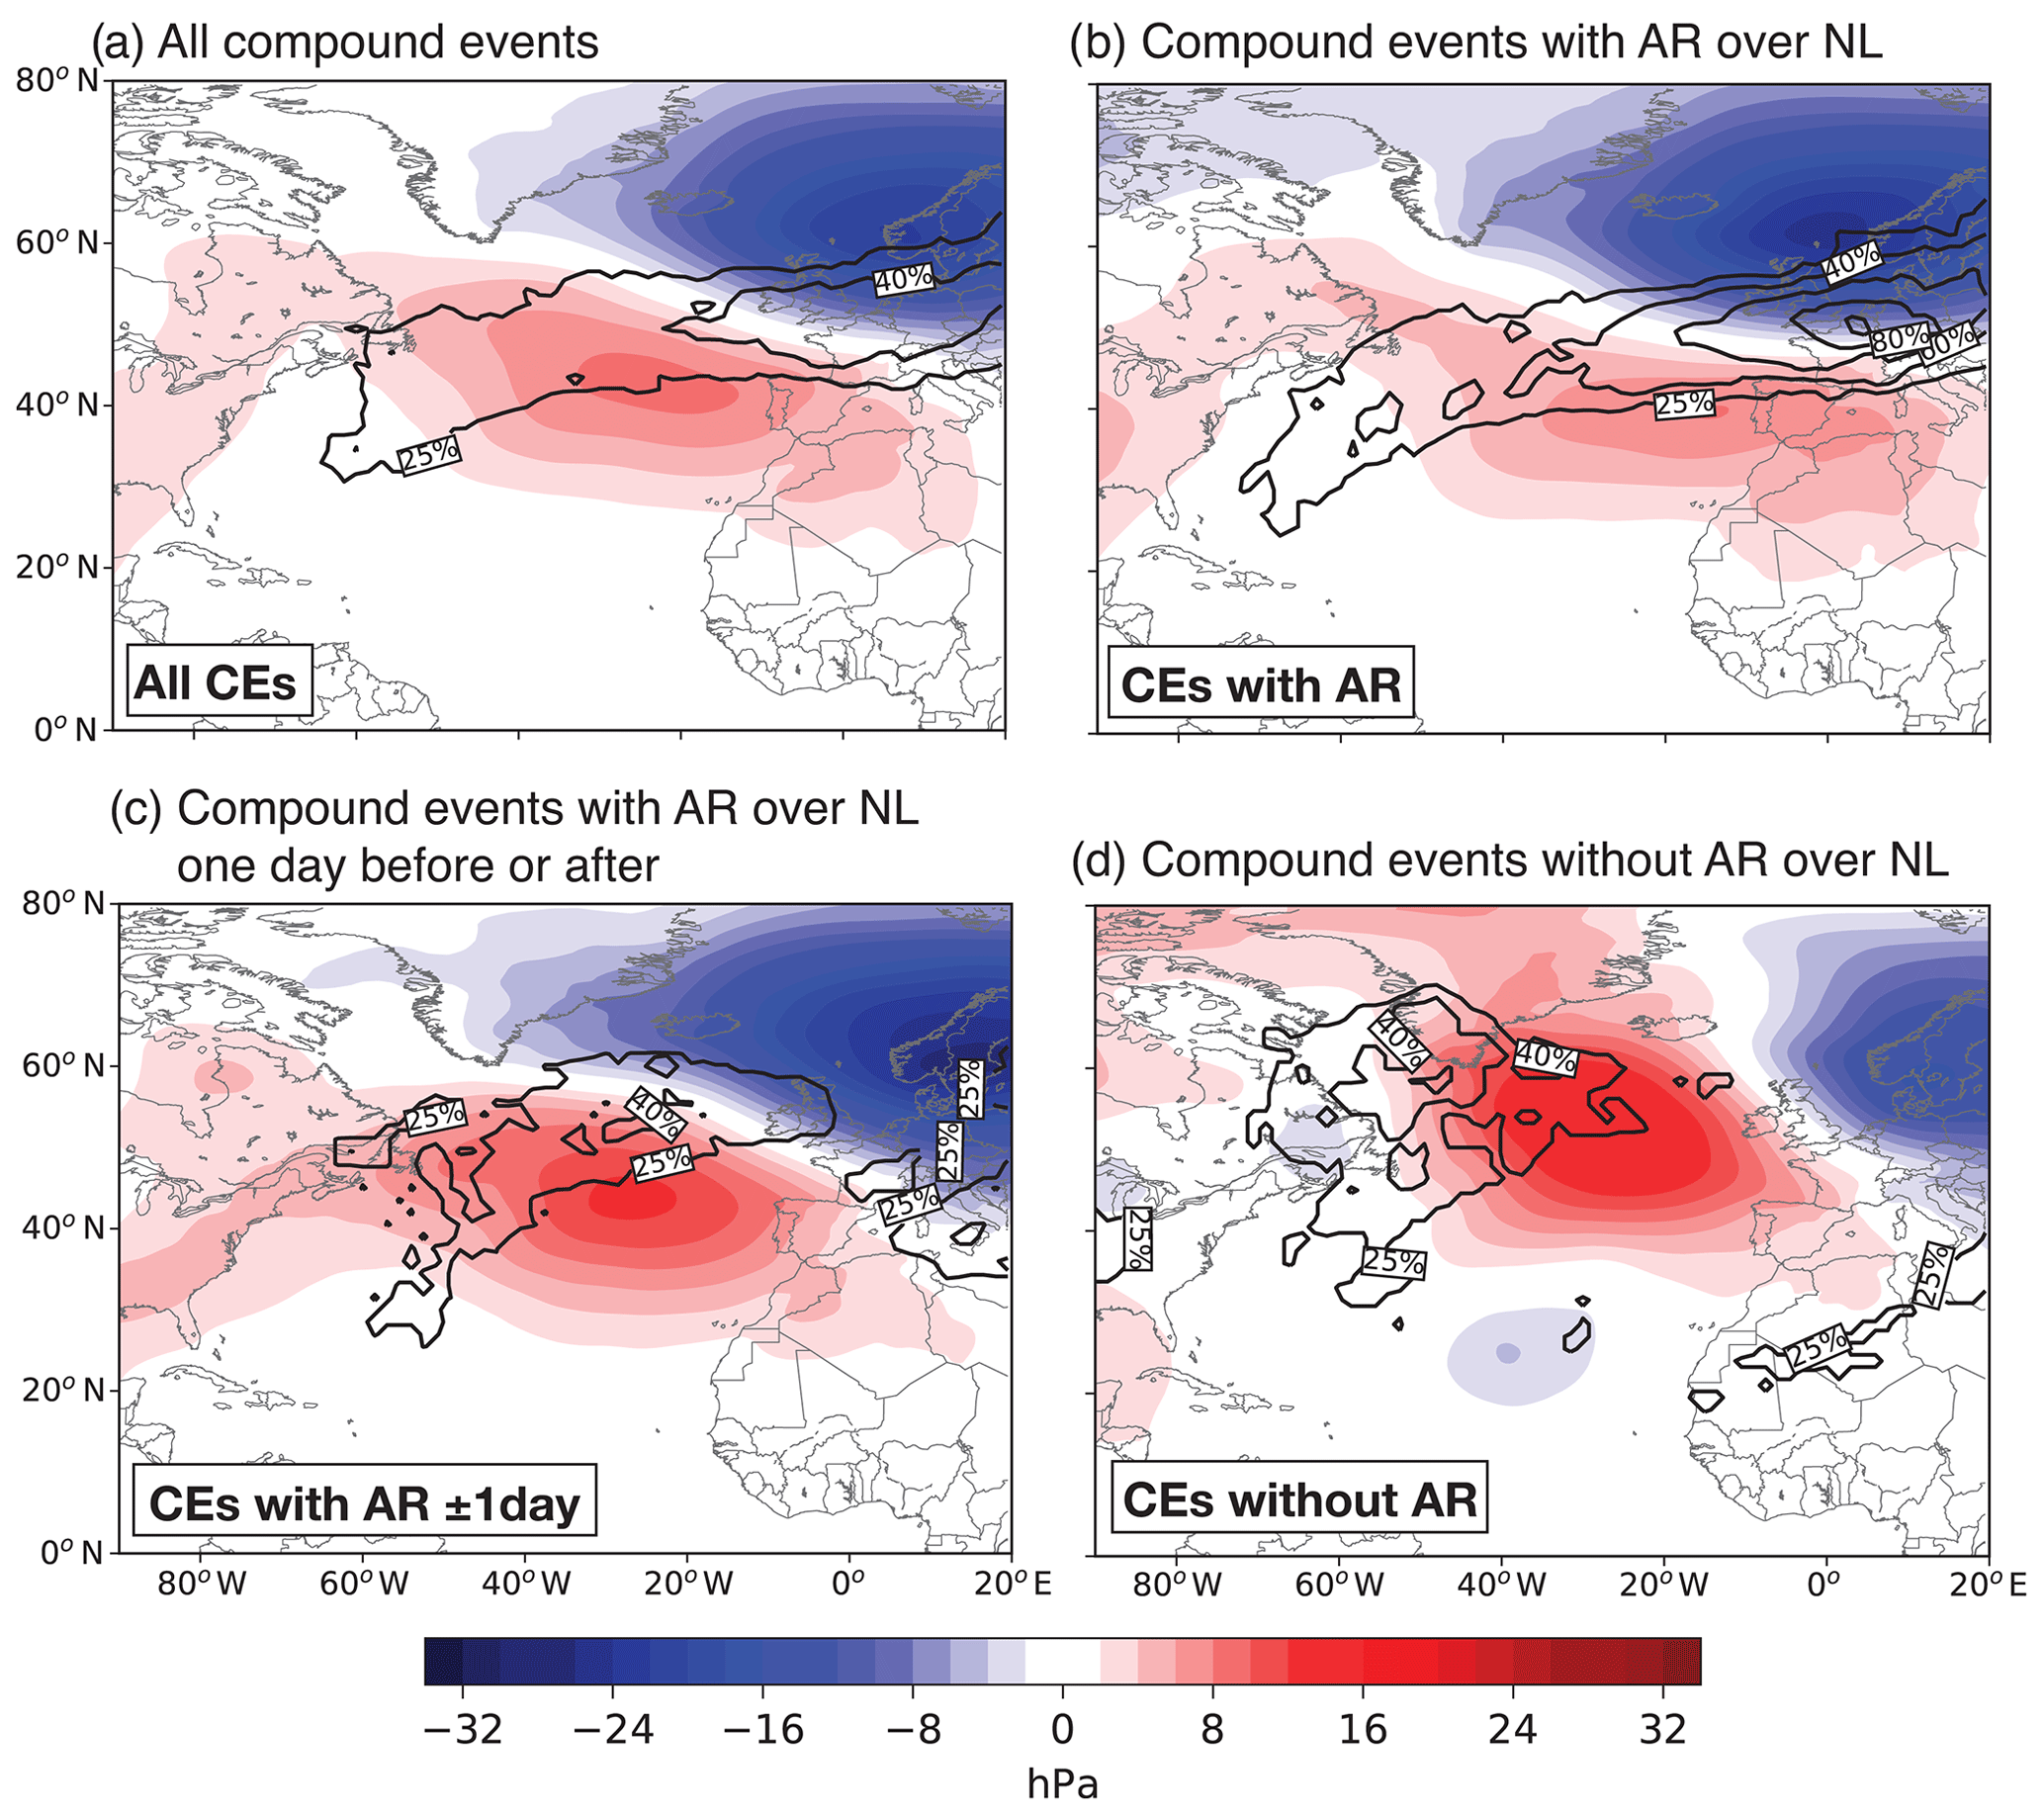
Figure 4(a) Mean anomalies in daily mean sea level pressure (colour shading) and relative area covered by ARs during all compound events at Den Helder during the study period. Panels (b), (c), and (d) are the same as (a) but for CEs occurring on days (b) with an AR over the Netherlands, (c) 1 day before or after a day with an AR over the Netherlands and (d) without AR over Netherlands within a 3-day period centred around the event.
The mean SLP anomaly pattern during all wintertime CEs in the ERA-Interim period shows a distinct difference to the mean climatology with a pressure dipole rover Europe and the eastern North Atlantic resembling the positive phase of the North Atlantic Oscillation (NAO+; Fig. 4a). To allow a thorough investigation of the impact of ARs on CEs in this study, we differentiate three types of CEs, namely those events that co-occur with an AR over the Netherlands, either on the day of the event (hereafter CEs with AR; Fig. 4b) or 1 day before and/or after (hereafter CEs with AR ±1 day; Fig. 4c), and those that occur in the absence of an AR in the 3 days around the event (hereafter CEs without AR; Fig. 4d). To illustrate the difference between these types of event, remember the example used in Sect. 3.5. Assume day_2 is a CE. If no AR is detected at any of the timesteps throughout day_1, day_2, and day_3, day_2 is considered a “CE without AR”. Should there be no ARs over the Netherlands on day_2 but on either day_1 and/or day_3, i.e. the day before and/or after the CE, then day_2 is considered to be a “CE with AR ±1 day”. Only if there is an AR over the Netherlands during one of the timesteps of day_2 itself, day_2 is considered a “CE with AR”. Since the latter two types of CEs, i.e. CEs with AR and CEs with AR ±1 day, show very similar atmospheric climatological anomalies (Fig. 4b and c) we will focus our analysis on the difference between CEs without AR and CEs with AR only and classify the CEs with AR ±1 day as only a slight variation of CEs with AR. Therefore, all conclusions drawn for CEs with AR are qualitatively the same as for CEs with AR ±1 day. In contrast, the third type of events, i.e. CEs without AR, occur under a significantly different anomaly pattern compared to CEs with AR (Fig. 4b and d). While anomalies during CEs with AR resemble the overall anomaly pattern of all CEs regardless of AR occurrence (Fig. 4b), the pressure dipole in case of the CEs without AR displays a tilted axes stretching from northwest to southeast, thus resembling the pattern of the second mode of variability of the circulation over the North Atlantic, namely the East Atlantic (EA) pattern (Fig. 4d). In the mean climatology, however, the EA pattern is overpowered by the NAO+ dipole due to the large number of CEs with an AR over the Netherlands compared to those without (Table 1). Thus, only the division of CEs into the two types of CEs with AR and CEs without AR reveals the EA pattern and allows a comprehensive analysis of the problem. A detailed analysis of the evolution of the SLP anomalies leading to both types of CEs is discussed in Sect. 4.3.1.
4.2 Joint probability distribution
To assess the impact of ARs on the correlation between precipitation and coastal water levels at the four study locations, Fig. 5 compares the joint probability density distributions of 3-day precipitation sums and maximum water levels for days without an AR over the Netherlands (hereafter noARdays; black contours) to the same distribution for days with an AR over the Netherlands (hereafter ARdays; red contours). The median of the distribution considering ARdays (red cross) is significantly shifted to higher precipitation sums compared to the median of the noARday distribution (black cross). The shift to higher 3-day maximum water levels is slightly less pronounced, but nevertheless clearly visible. This response in the median reflects the nature of the meteorological phenomenon causing ARs which induces positive precipitation and storm surge anomalies. This can also be seen in the differences between the two distribution with the distribution of ARdays (red contours) reaching further into the part of the graph indicating high precipitation and water levels than the distribution of noARdays (black contours).
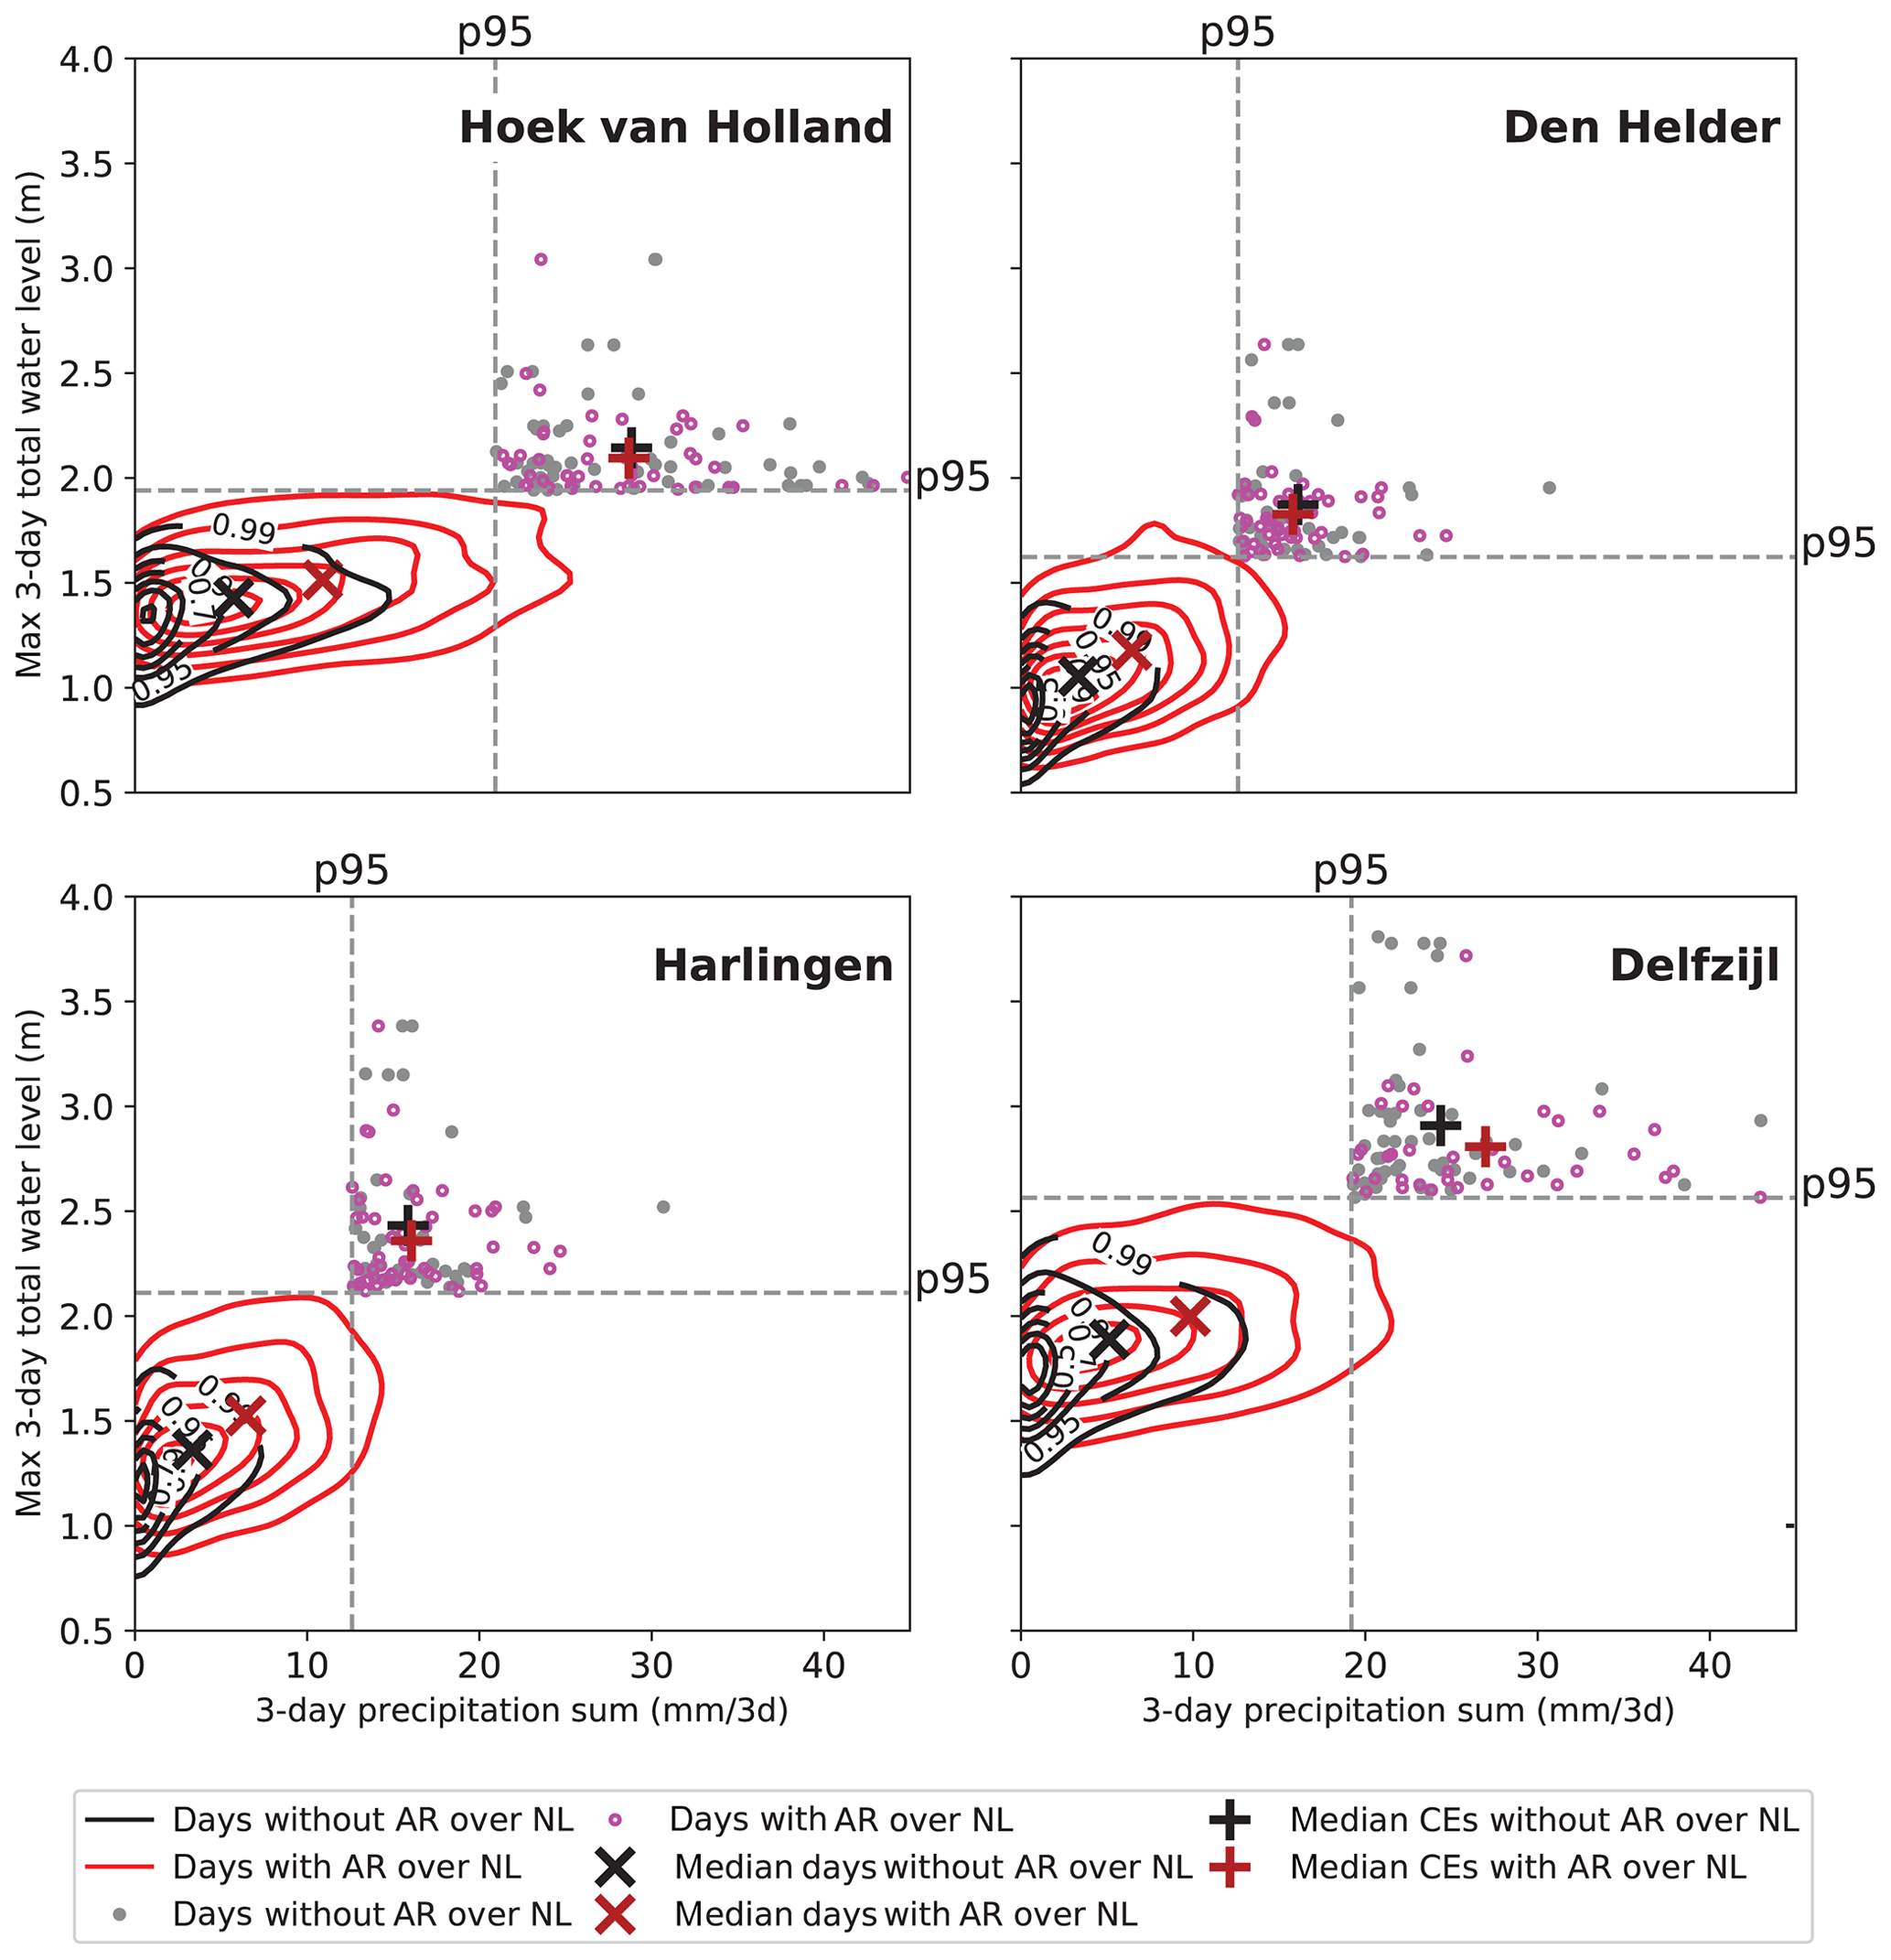
Figure 5Joint probability distribution of 3-day precipitation sums (mm) and 3-day maximum total water level (m). Contours denote the area enclosing indicated percentage of data (30 %, 50 %, 70 %, 90 %, 95 % and 99 % contours are shown). Black (red) contours show data for days without (with) an AR over the Netherlands. Scatter plot in the in the upper right corner of each subfigure show total water level and precipitation pairs with values higher than the 95th percentile of both variables, i.e. compound events. Data points identified as compound events without an AR over the Netherlands are shown in black, those with an AR over the Netherlands are red. Crosses indicate the position of the mean of the full time series, while pluses show the median of the two variables only taking into account data from days with a CE. The colour coding for both markers is the same as for the contours.
In order to understand the influence of ARs on coastal CEs the next step of the analysis focuses on the high tail of the two distributions. For this we select only those days with conditions that fulfil the definition of CE used in this study (grey and magenta scatter plot in Fig. 5). In this region the medians of the two distributions are almost identical (black and red plus) at Hoek van Holland, Den Helder and Harlingen (Fig. 5a–c). This suggests that the conditions during CEs with and without AR over the Netherlands have caused impacts of similar severity in terms of the joint effect of precipitation and water level at these three stations. Only at Delfzijl do the two medians differ significantly (Fig. 5d). Here CEs caused by conditions influenced by an AR tend to have a higher impact on precipitation, while storm surge levels seem to be less affected than in the case of CEs without AR.
4.3 Difference in meteorological conditions before and during compound events with and without AR association
To determine if ARs significantly alter CEs in the Netherlands this section assesses the conditions during CEs with and without association to ARs. The analysis is focused on CEs at Den Helder. This choice was motivated by the geographical location of this station close to the Wadden Sea and the fact that the station is situated at the northwestern corner of the Dutch coastline. Thus, Den Helder borders the North Sea at two sides, the north and west. As discussed in Sect. 2, this is not the case for the other stations. Thus, choosing Den Helder as representative ensures that the assessment accounts for synoptic systems moving in from the north as well as from the west. Further, most of the compound events at Den Helder occur in close temporal proximity to compound events at (at least one of) the other stations which makes Den Helder a valuable representative for all four stations when it comes to the occurrence of CEs.
4.3.1 Development of sea level pressure and integrated vapour transport
The comparison of the mean anomalies in daily sea level pressure (SLP) and integrated vapour transport (IVT) before and on the day of a CE at Den Helder shows a clear difference in the conditions of CEs with and without association to ARs (Fig. 6a, e and i; b, f and j, respectively).
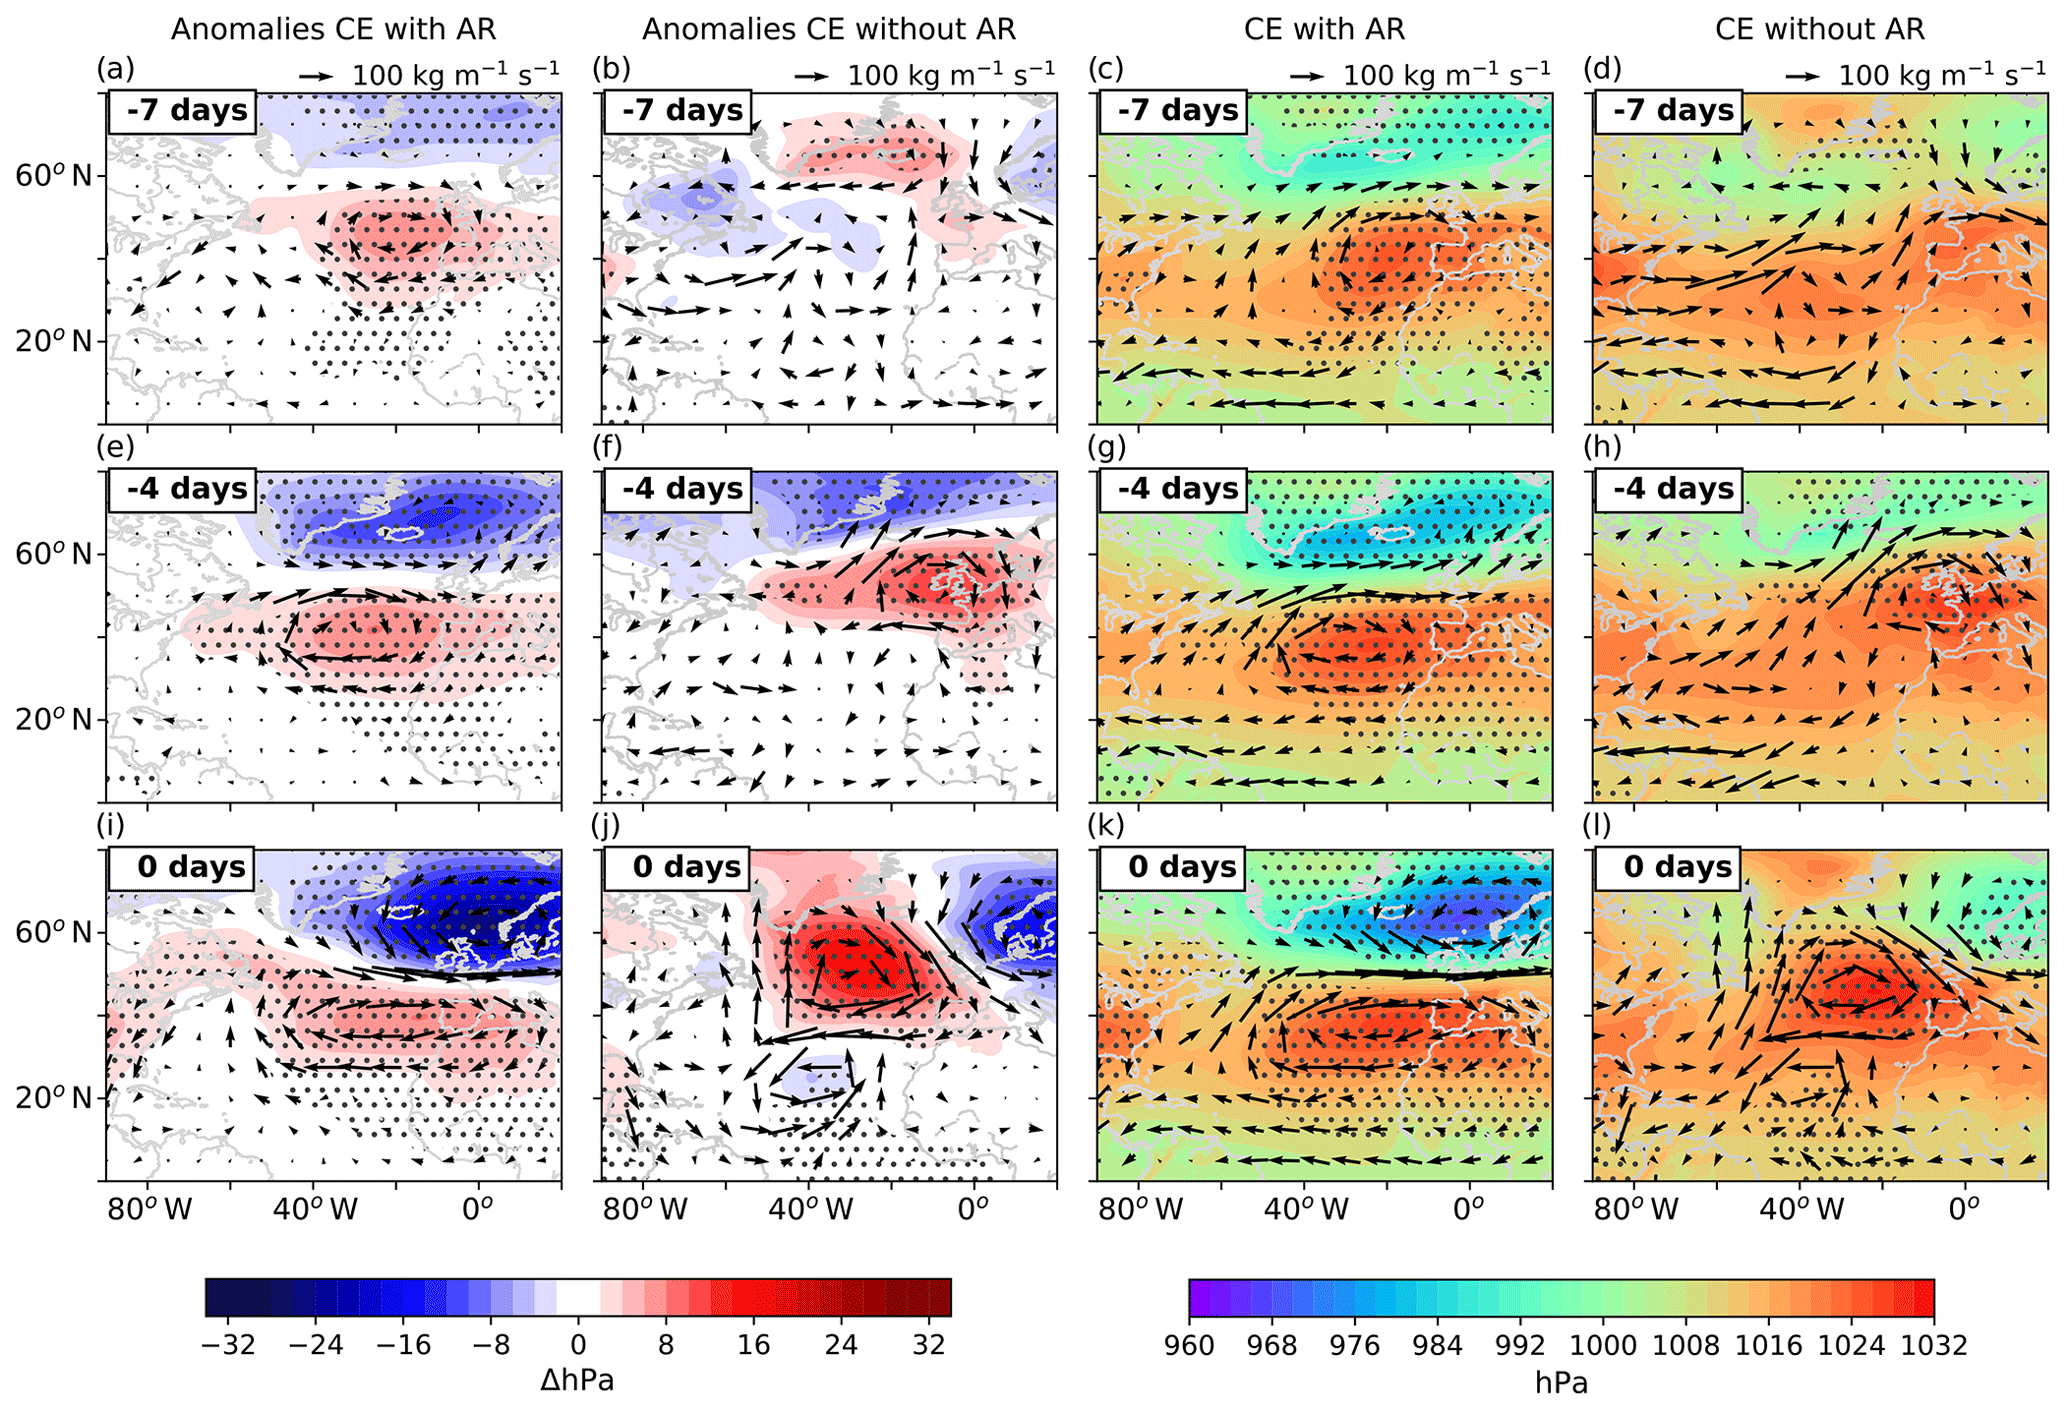
Figure 6Temporal evolution of mean conditions 7 (a–d) and 4 days (e–h) before a CE at Den Helder and on the day of the event itself (i–l). The left two columns, i.e. panels (a, e, i) and (b, f, j), show the evolution of anomalies in SLP (colour shading) and IVT (vector field) during CEs with and without AR association, respectively. The right two columns, i.e. panels (c, g, k) and (d, h, l), show the same but for absolute values of daily mean SLP and IVT. Results for the three other stations (not shown) are comparable. Stippled areas mark regions with a p value below 0.05 derived from a student t test of daily mean SLP values compared to the daily mean values of full time series.
CEs associated with ARs (CEs with AR) show little temporal variability in their mean anomaly pattern throughout the week before an event (Fig. 6a, e and i). The overall pattern is comparable to climatology with a high-pressure system over the Azores and a low-pressure system in the north, in this case stretching from the east of Greenland and the Norwegian Sea (Fig. 6c, g and k). The evolution of the atmospheric conditions during this time is mainly limited to changes in the amplitude of the sea level pressure features. Thus, the storm track remains unchanged and is comparable to that under the conditions of a positive North Atlantic Oscillation phase. The low-pressure system develops a stronger anomaly than its positive counter part. This hints to the importance of the storm system as a driving mechanism for CEs with AR. The horizontal dipole that the two pressure systems build and is typical for the North Atlantic Oscillation (NAO), guides the IVT through a small corridor over the UK to the north of France before hitting the Netherlands further inland. Therefore, ARs making landfall in the UK, France, and the Netherlands itself have the potential to be part of the synoptic system that causes a CE (Fig. S1 in the Supplement).
In contrast, for compound events without the involvement of ARs (CEs without AR) the spatial SLP anomaly patterns vary strongly with time during the week before the event (Fig. 6b, f and j). SLP anomalies show two moderate positive maxima 7 days before the event, one stretching from Greenland to east of Iceland and one off the coast of the UK (Fig. 6b). The first anomaly maximum is caused by a high-pressure system over Greenland; the latter by a high-pressure system over Spain stretching further north than the Azores High under normal conditions (Fig. 6d). Over the following few days the high-pressure system over Greenland and Iceland temporarily weakens and a low-pressure system moves in from the west (Fig. 6h) leading to a moderate negative SLP anomaly north of 60∘ N (Fig. 6f). At the same time the high-pressure system over Spain merges with a high-pressure system moving in from the western Atlantic (Fig. 6d and h). This causes a strengthening of the positive anomaly west of the UK and increases its extent to cover large parts of Western Europe, Scandinavia, and an area over the North Atlantic between 40 and 60∘ N reaching up to 55∘ W (Fig. 6f). On the last days before the CE, the Azores High moves back westward ending up in a position that is slightly further north than under normal conditions (Fig. 6l). At the same time, the low-pressure system in the north of the Azores High moves eastwards towards Scandinavia, and the high-pressure system over Greenland strengthens to contribute to the strong positive anomaly seen over most of the northern North Atlantic on the day of the CE. The resulting anomaly pattern resembles the anomalous conditions of the East Atlantic (EA) pattern, the second mode of interannual variability over the North Atlantic (Barnston and Livezey, 1987; Comas-Bru and McDermott, 2014). In this position the Azores High acts as an atmospheric blocking system together with the high-pressure system over Greenland that detains the negative pressure anomaly over Scandinavia (Fig. 6j). These conditions cause a northwards excursion of the storm track. In turn, the resulting meandering of the storm track causes winds and the IVT to hit the Dutch coast with a stronger northerly component than normal conditions. Thus, the conditions during CEs without AR favour high surge levels and higher precipitation along the northward facing European coastlines. The reason that the increased IVT in the case of CEs without AR cannot be classified as ARs, even if they occurred in long filaments fulfilling the geometric definition of the AR definition, lies in exactly this change of the storm track which forces the IVT to enter the North Sea basin from the north. As a result, the IVT, while significantly increased compared to climatology and in its absolute values comparable to the IVT during CEs with AR, lacks a distinct poleward component, which is one of the crucial characteristics of ARs according to their most commonly used definition.
4.3.2 Development of sea surface temperature (SST) anomalies
The changes in SLP conditions are also reflected in the anomalies in sea surface temperature (Fig. 7) through the connection between surface winds and ocean currents. This leads to spatial patterns that indicate the occurrence of compound events and provide a tool to predict the kind of compound event that will occur, i.e. CEs with AR association or CEs without. In the case of CEs with AR, SSTs respond to conditions that induce gradual, spatially consistent changes due to the small spatial variability of the SLP anomalies in this case as discussed in the previous section (Sect. 4.3.1). As a result, the wind anomalies, which increase with time getting stronger closer to the event (Fig. S2), induce a decrease in SSTs within the North Atlantic subpolar gyre that expands throughout the week before the event (Fig. 7a, c and e). On the day of the event this negative anomaly covers parts of the Labrador Sea and the subpolar North Atlantic. At the same time an increase in SSTs develops that covers large parts of the western and central (tropical and subtropical) North Atlantic, the North Sea and parts of the Norwegian Sea on the day of the event (Fig. 7a, c and e). Another significant feature, which is not present during CEs without AR, is the mean positive SST anomaly off the east coast of North America that is persistent throughout the week before an event. This positive anomaly is most likely maintained through the increasing transport of warm tropical waters into the mid-latitudes through a strengthening of the south–southeasterly component of the wind field throughout the week before an event. The negative SST anomaly pattern over the subpolar North Atlantic is most likely caused by changes in the transport of surface waters from higher latitudes to subpolar North Atlantic due to a strengthening of the north–northeasterly component of the wind field throughout the week before the event (Fig. S2). However, a detailed account on the driving mechanisms behind the response of SST can only be obtained by an in depth analysis of the complex interplay of changes in Ekman transport, upwelling/downwelling and ocean–atmosphere heat exchange which is beyond the scope of this paper.
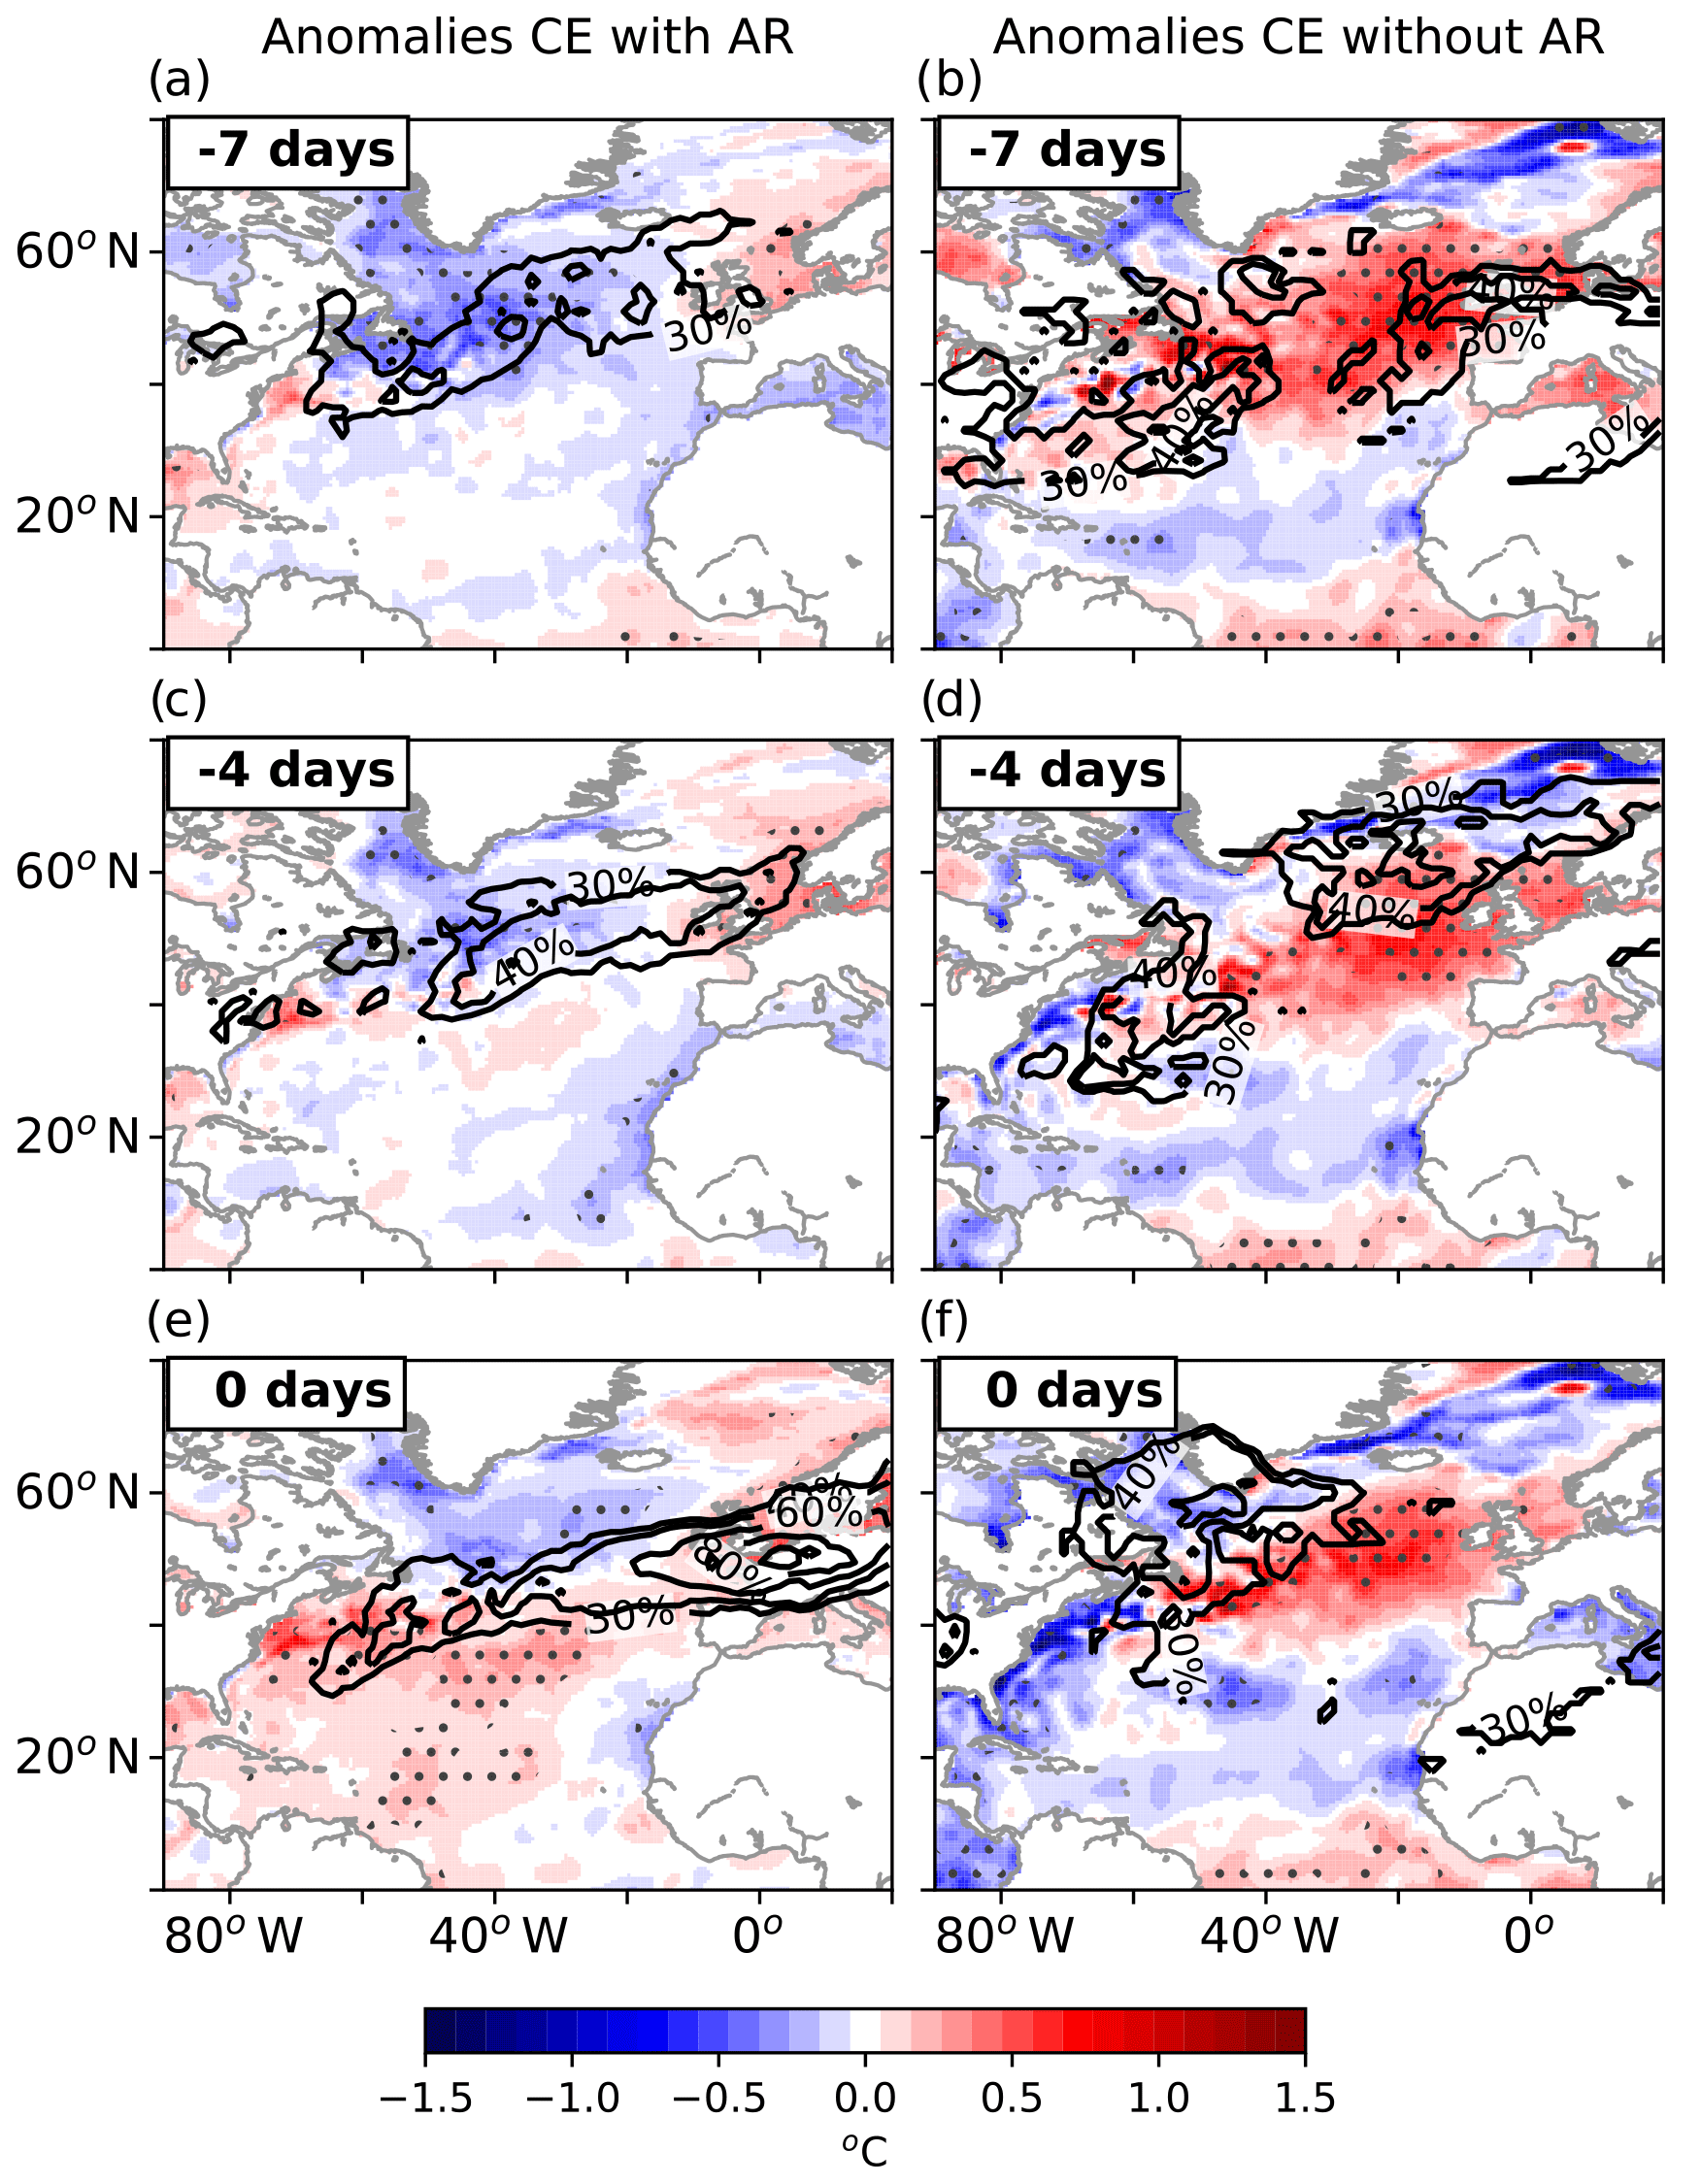
Figure 7Anomalies in daily mean SSTs (shading) related to CEs with (a, c, e) and CEs without AR association (b, d, f) 7 and 4 days before a CE (Panels a and b; panels c and d, respectively) and on the day of the event (e, f). Contours mark regions that are occupied by more than 30 % of all ARs in the specific category with contour intervals at 30 %, 40 %, 60 %, 80 %, 90 %, 99 % and 100 %. Stippled areas mark regions with a p value below 0.05 derived from a student t test comparing the monthly anomalies of daily mean SST values on the day of events to those throughout the full time series.
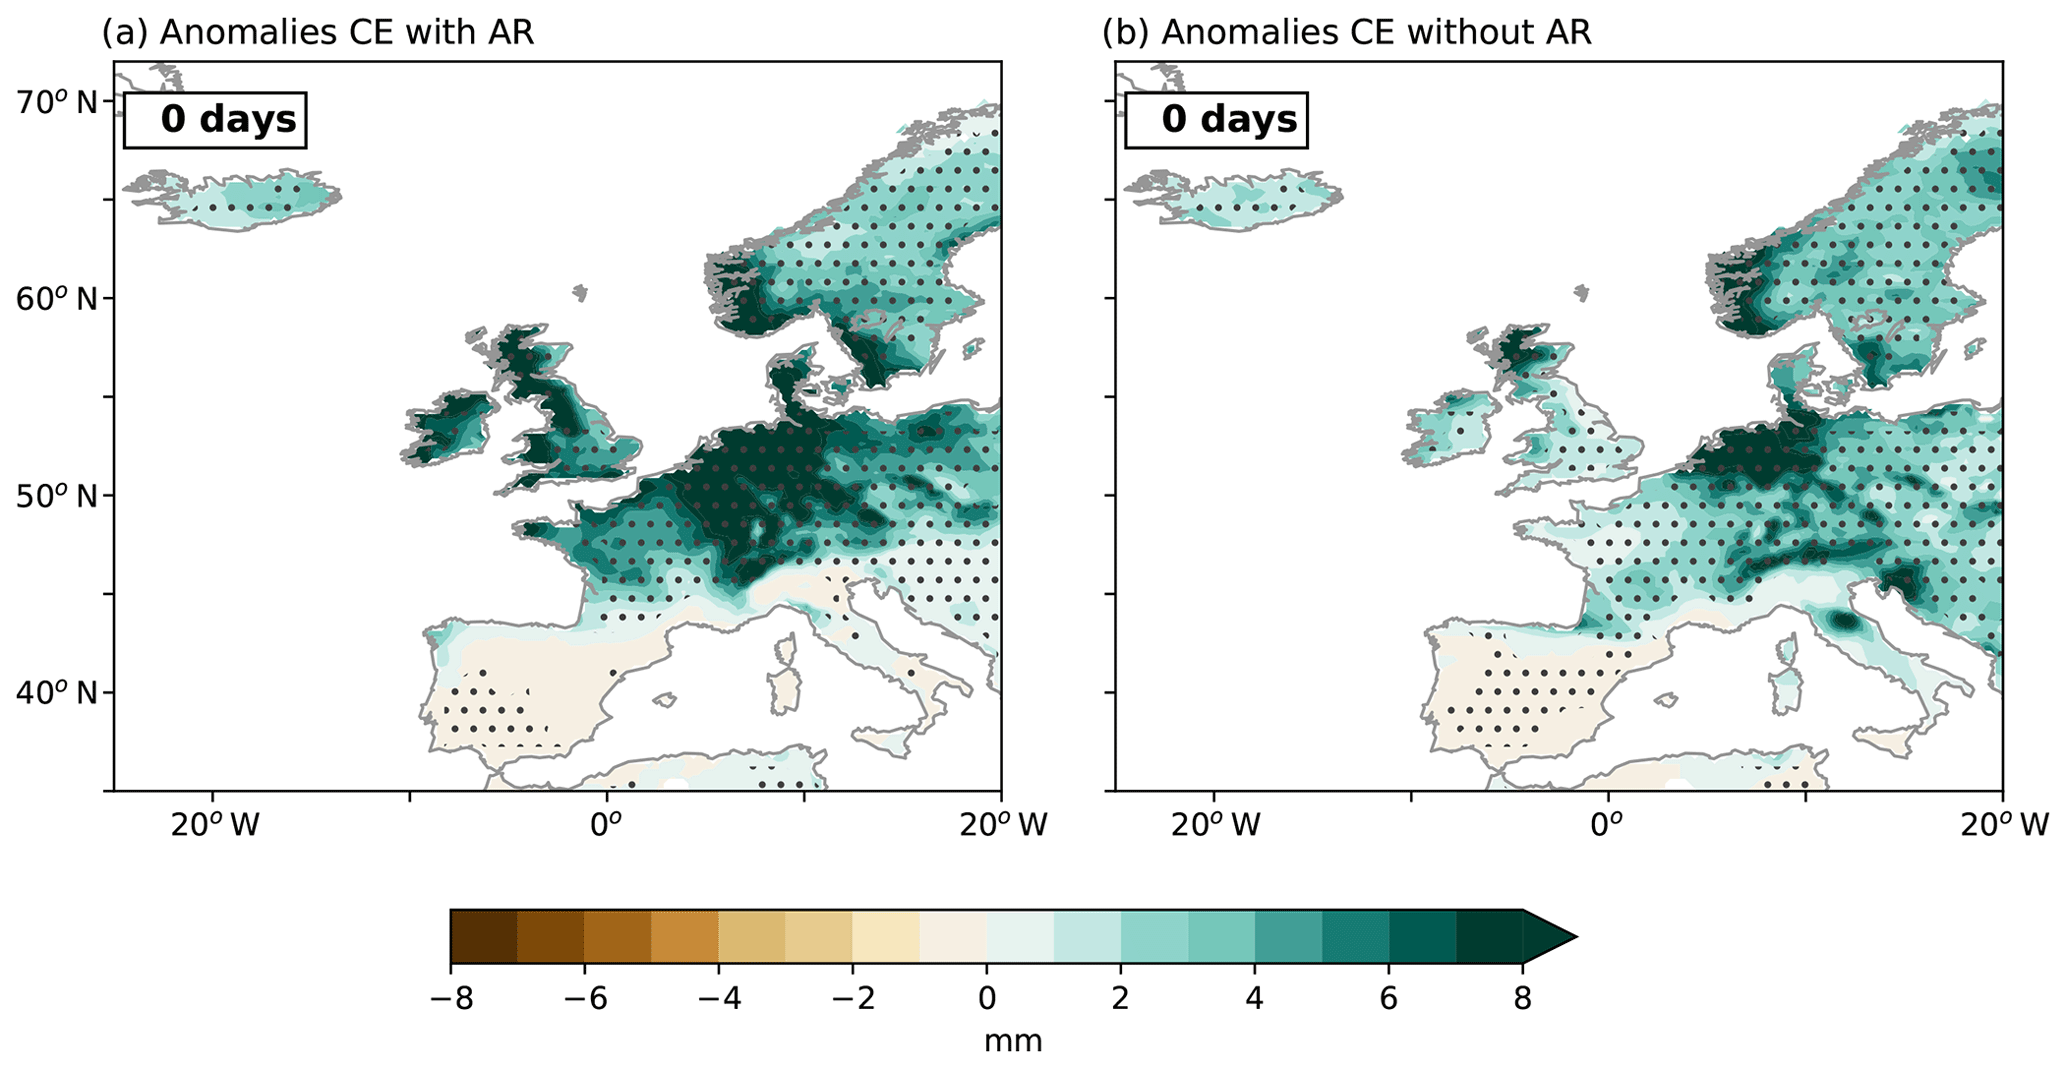
Figure 8Anomalies of daily mean precipitation sums during CEs with (a) and without (b) AR association. Stippled areas mark regions with a p value below 0.05 derived from a student t test of daily precipitation values during events and the full time series.
In contrast, SLP anomalies during CEs without AR, and with this the anomalies in 10 m wind fields (Fig. S2) over the North Atlantic trigger a warming in parts of the subpolar gyre, the equatorial North Atlantic, and at mid-latitudes (Fig. 7a, c and e). Interestingly, there is a negative SST anomaly along the western boundary of the North Atlantic and parts of the (sub-)tropical North Atlantic, i.e. the region from where ARs that hit Europe generally originate. This anomaly pattern is mainly driven by alterations in the Ekman transport across the basin. During the shift of the SLP anomaly pattern from conditions resembling the negative phase of the NAO towards an EA-like pattern closer to the event, the tilt of the North Atlantic pressure dipole changes. This induces alterations in wind conditions, which in turn lead in a flow of cold water from the northeast to the southwest. As a result a cold anomaly off the east coast of North America develops and the warm SST anomaly in the subtropical North Atlantic contracts to the eastern Atlantic. Other changes in SSTs in the case of CEs without AR are mostly statistically insignificant (Fig. 7b, d and f).
4.3.3 Development of precipitation anomaly patterns
The mean anomalies in precipitation during CEs without AR and CEs with AR reflect the differences in IVT between the two cases. For CEs with AR, precipitation anomalies occur on a much larger scale than in the case of CEs without AR (Fig. 8). Additionally they show a strong positive anomaly in central Europe reaching as far south as the Alps and far to the east (Fig. 8a). The strong mean positive precipitation anomalies in Northern Ireland and along the west coast of the UK are also noteworthy. Together with the increase in mean precipitation over northern France, this pattern reflects the mean direction with which the IVT, and thus the ARs, are moving over Europe. As mentioned earlier when discussing SLP and IVT conditions during CEs with AR, the IVT is travelling more zonally before and during CEs with AR. Therefore, ARs have the opportunity to affect larger regions and thus explain the large-scale precipitation anomalies under these conditions. For instance, the path over land of an air mass travelling zonally over the UK is much shorter than that of its counterpart travelling in a meridional direction and thus crossing the full latitudinal extent of the landmass. As a result the air mass travelling from west to east tends to lose less moisture through precipitation. Further, the air mass has the opportunity to replenish lost moisture on its way over the North Sea or while travelling along the English Channel before making landfall on the European mainland and precipitating the rest of its moisture there.
As mentioned earlier, the IVT in the case of CEs without AR tends to contain a stronger than normal northerly component which causes them to hit the Netherlands almost straight from the North due to the EA-like pattern of the prevailing mean SLP anomalies (Fig. 6i). Accordingly, the precipitation anomalies reflect this by exhibiting a positive anomaly along the Dutch coast (Fig. 8a). On their way over land the moisture lost through precipitation cannot be replenished as easily as over water which leads to quick drop-off in precipitation southwards of the coastline with the majority of precipitation being dropped north of 50∘ N. A similar anomaly pattern can also be seen in the north of the UK, where the same mechanism influences precipitation. This results in very localized precipitation anomalies in the northern most regions of northern Europe. The northern coast of France, however, which is located in the lee of the UK in the case of CEs without AR, shows hardly any anomalous precipitation as water vapour is removed through precipitation over the north of the UK and the English Channel is not sufficiently wide for the moisture to be replenished.
4.4 Difference between ARs with and without association to CEs
In order to be able to exploit the potential of AR systems to predict coastal CEs, this section assesses the differences in atmospheric and oceanic conditions of AR systems associated with CEs (hereafter ARs with CEs) and those without CEs (hereafter ARs without CEs). For the comparison of anomalies between the two types of ARs we focus on the developments of anomalies within the 7 days (for precipitation 2 days) before an AR over the Netherlands. Here, the mean monthly anomalies in daily SLP, IVT, SST, and precipitation in the case of ARs without CEs (Fig. 9) are significantly less pronounced than those during ARs with CEs (Fig. 6). This is based on the fact that the mean changes in SLP for ARs without CEs are not strong enough to create a significant dipole pattern (Fig. 9a, d and g). While the mean negative anomaly over the north of the UK is well established, there is no mean positive anomaly in the location of the Azores High comparable to that evolving in case of ARs with CEs on the day of the AR over the Netherlands (Fig. 6i). This indicates that the position and strength of the Azores High plays a major role in the determination of whether an AR system can lead to a coastal CE or not.
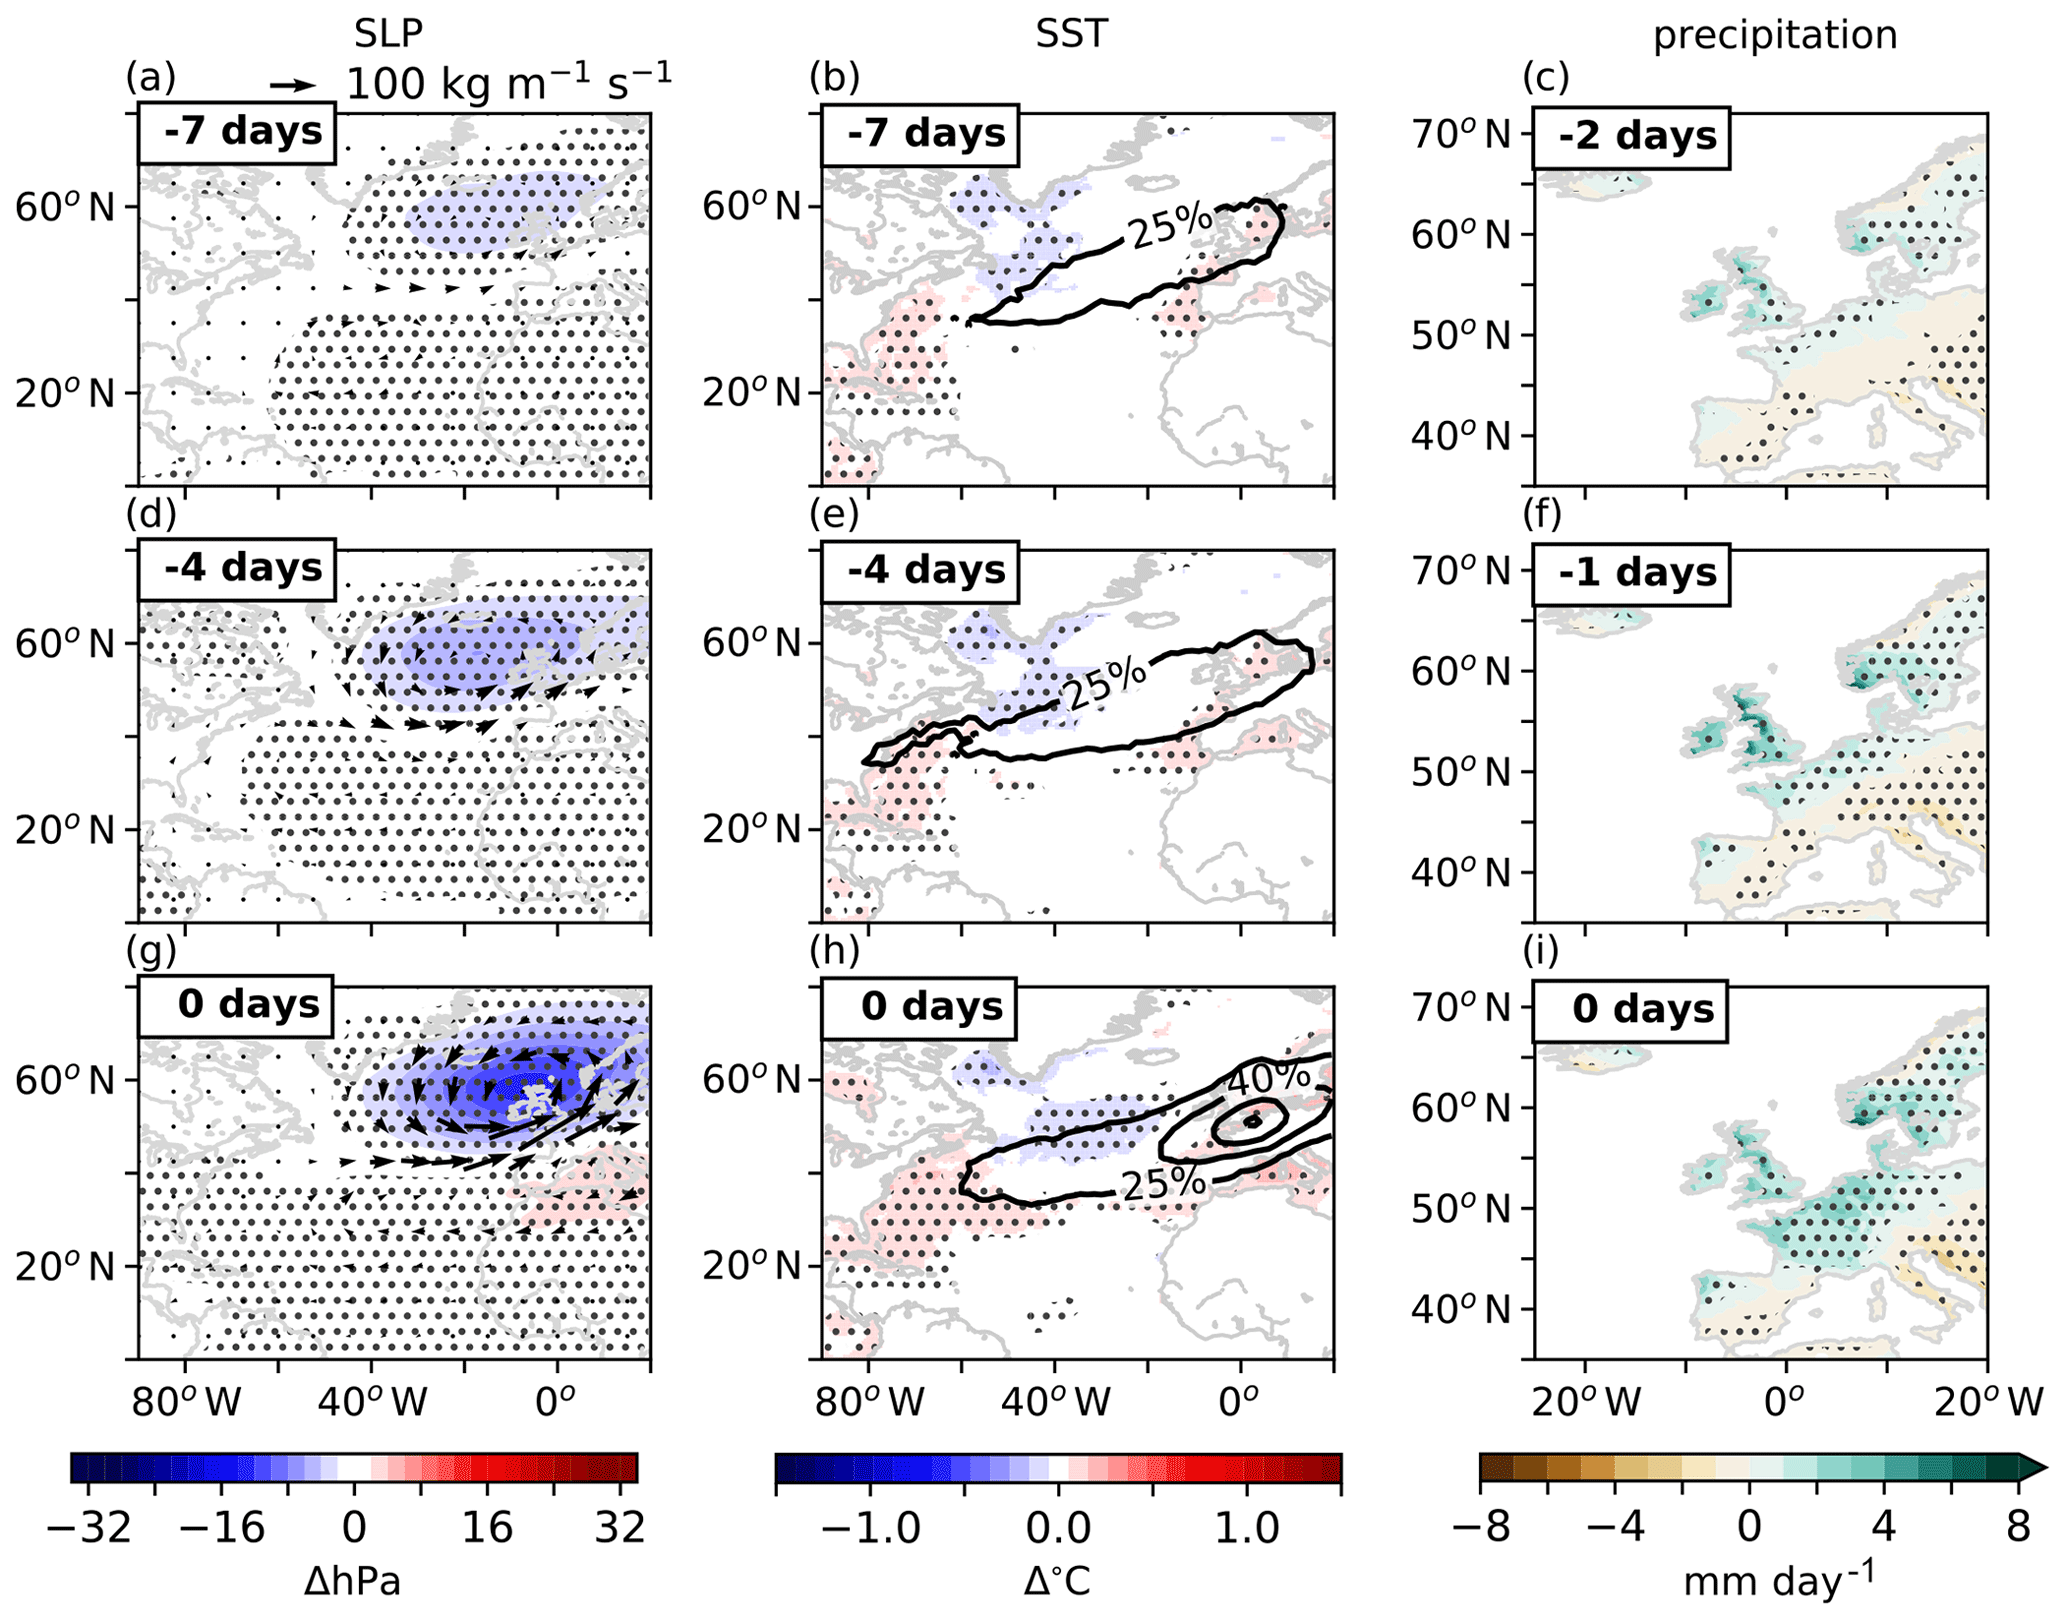
Figure 9Anomalies of (a) SLP (colour shading) and IVT (vectors), (b) SST (colour shading) and relative number of ARs covering an area, and (c) precipitation on days with an AR over the Netherlands without the occurrence of a CE. Stippled areas indicate regions where the difference in conditions between ARs with CEs and ARs without CEs are statistical significant with a p value below 0.05 derived from a student t test comparing monthly anomalies of daily mean values during events to those of the full time series.
As a result of the lack of a mean dipole structure, mean wind fields during ARs without CEs do not produce a consistent change in surface ocean circulation and thus do not show a strong mean SST anomaly pattern. The same is true for precipitation. This suggests that, overall, only strong AR systems, consisting of a strong SLP dipole and carrying high moisture amounts, have coincided with the occurrence of compound events in the Netherlands. However, this does not mean that all strong AR systems, i.e. those with strong SLP anomalies, have been associated with compound events since the mean of ARs without CEs is derived from a much higher number of events compared to ARs with CEs. Therefore some strong AR systems might have failed to induce sufficient precipitation due to the lack of air moisture or the necessary wind conditions in terms of wind direction to induce a compound event over the Dutch coast.
All features that characterize the mean conditions during ARs without CEs and make them different to the conditions during ARs with CEs, as described above, are statistically significant (dotted areas in Figs. 6–9). This opens the possibility to use the here presented results in the early identification of an upcoming event.
This study presents a first classification of coastal CEs by using one specific atmospheric phenomenon as a base resulting in two types of CEs, i.e. (i) events with AR involvement and (ii) events without. This classification can be used to determine the focus of future assessments and deepen the analysis of the driving processes of coastal CEs consisting of heavy precipitation and high coastal water levels. While other coastal CEs might require different categories based on other climatic or even socio-economic factors, the here presented choice of ARs as determining factor is the most suitable considering the purpose of this study, i.e. the investigation of the impact of ARs on coastal CEs in the Netherlands. Thus, it was possible to identify conditions leading to CEs that do not involve AR. These would have been masked if the analysis had only taken into account the mean conditions during CEs which are dominated by the large relative number of CEs with AR involvement. While these atmospheric conditions have been known to potentially cause hazardous conditions for the Netherlands and thus have already been thoroughly studied, conditions with the Azores High acting as a blocking system, as realized during the second type of coastal CE, have gotten little attention. With the findings of this study we provide an impetus to extend future investigations into this direction.
Further, by identifying large-scale atmospheric conditions that lead to coastal CEs and comparing them to similar conditions with low impact we provide a tool for the early identification of possible compound events. This is particularly useful in the light of the higher predictability of large-scale atmospheric features, such as SLP patterns and atmospheric moisture content, compared to small-scale events, such as precipitation and wind extremes (Lavers et al., 2014). Therefore, the results of this study could be used for the early identification of compound events that have the potential to cause disruptive impacts in the Netherlands and thus allow an early warning of up to one week in advance.
While this study focused on local precipitation rather than river discharge, we show that the presence of ARs leads to precipitation anomalies that cover large areas of the Rhine catchment. This indicates that, in addition to the chance of the occurrence of CEs in the form of heavy precipitation and high surge, it is likely that ARs are also linked to the co-occurrence of high surge levels and extreme river discharge. These two hazards have been shown to be correlated at a time-lag of several days with storm surge extremes preceding high river discharge (Khanal et al., 2018; Klerk et al., 2015). Our results are in agreement with this, taking into account the time it takes for hydrological processes to transform precipitation over a large catchment into river discharge at the coast or further downstream. As a result, it is possible that ARs aggravate coastal flood risk even further by causing extreme river discharge closely after a compound event consisting of heavy precipitation and high coastal water levels. We leave the investigation of the existence of a statistical connection between these two occurrences and the possible implications for local flood risk to future studies as this falls outside the scope of the work presented here.
We acknowledge that our findings are based on model results and observations and the used data contains the known biases and shortcomings associated with the respective data source. However, the impact of data biases is unlikely to affect the qualitative statements made in this study as most results are based on quantiles, thus dampening the effect of possible biases present in the used datasets.
We also note that the identification of ARs that are analysed in this study is influenced by the applied AR-detection algorithm. The particular algorithm applied here was chosen due to the fact that this study was motivated by the work of Waliser and Guan (2017). While the application of other algorithms might introduce some variations in the results of this study, it is not expected to significantly change the conclusions of this study.
However, we would like to remark that our analysis of the conditions during the second type of CEs, namely CEs without AR, highlights a limitation of the generally accepted condition often used in AR detection algorithms which excludes IVT structures that lack a significant poleward component. We have shown that during CEs without AR the IVT reaching the Dutch mainland is significantly increased with absolute values comparable to those in the case of CEs with AR. Further, we have demonstrated that both types of CEs lead to comparable impacts in terms of precipitation regardless of the inclusion of the underlying IVT structure into the AR catalogue or not. While it is possible that some of the IVT structures during CEs without AR were discarded due to the applied geometric constraints, some ARs only failing the poleward transport condition might have been falsely excluded. It is therefore possible that ARs play a much more important role in the occurrence of CEs than identified in this study. We thus suggest that excluding IVT patterns from an AR catalogue based on their lacking of poleward transport, could lead to an underestimation of the risk that ARs pose for coastal regions. Further, if poleward transport should no longer be considered as a detection criterion for ARs, the classification made in this paper of CEs into three types (CEs with AR, CEs with AR ±1 day and CEs without AR) might need to be extended accordingly. Therefore, we advise the application of the AR classification criterion requiring an IVT object to have a considerable poleward component with care and its implications kept in mind when assessing the influence of ARs on CEs. Nevertheless, our study provides a valuable extension of our understanding of coastal CEs and their driving mechanism at one specific geographic location focusing on one particular atmospheric phenomenon. With this, we hope to inspire future work to extend our assessment to include the impact of other phenomena to complement the results of this study. Further, we encourage the application of this and similar assessments to other geographical regions to elaborate on differences in the importance of drivers under different climatological conditions and identify other equally important atmospheric phenomena influencing coastal and other CEs.
In this study we used the output of a numerical storm surge model (WAQUA/DCSMv5) and observed precipitation data (E-OBS) throughout the ERA-Interim period (1979–2015) to assess the role of atmospheric rivers in the occurrence of compound events consisting of heavy precipitation and high coastal water levels at four stations along the Dutch coast. Our results show that the majority of past compound events have been associated with the presence of an AR over the Netherlands. Further, we demonstrate that days with an AR over the Netherlands tend to be wetter and have higher water levels than those without. However, this is not realized in the high tail of the joint distribution of the two variables, where the impact of ARs fails to significantly affect the median of the joint distribution (with the exception of Delfzijl). From this we conclude that, while ARs play an important role in the occurrence of compound events, their mean impact is comparable to that of events without AR involvement. Nevertheless, the introduced classification of compound events into two categories, (i) events with AR influence caused by a NAO-like SLP anomaly pattern and (ii) events without AR influence occurring under EA-like SLP anomaly conditions, is shown to be useful in order to isolate atmospheric patterns of events that are otherwise masked by the dominance of the number of compound events with AR involvement. Further, in combination with the mean SST anomaly patterns and the NAO- and EA-like SLP patterns specific to each type of event that we identified here, we provide crucial information for the possibility to predict compound events. As shown in this study, climatological anomalies leading to the two types of coastal CE are visible at least 7 days in advance of an event. It is thus possible to include the atmospheric and oceanographic features leading to CEs that have been identified in this study as indicators in an early warning system for possibly hazardous conditions along the Dutch coast.
The data for AR characteristics used in this study are made available in: Guan, B. and Waliser, D. E.: Evaluation and application of an algorithm for global studies, J. Geophys. Res.-Atmos., 120, 12514–12535, https://doi.org/10.1002/2015JD024257, 2015 (data available at: https://ucla.box.com/ARcatalog).
The supplement related to this article is available online at: https://doi.org/10.5194/nhess-18-3311-2018-supplement.
NR had the initial idea for the study, performed the surge model experiment, analysed the data, and authored the manuscript. HV contributed to bug fixes. HV and SD provided suggestions for analytical metrics and commented on the manuscript.
The authors declare that they have no conflict of interest.
The authors would like to thank Bin Guan and Duane Waliser for providing
access to the used AR database and sharing their AR-detection algorithm. We
also acknowledge the E-OBS dataset from the EU-FP6 project ENSEMBLES
(http://ensembles-eu.metoffice.com, last access: 4 September 2018) and
the data providers in the ECA&D project (http://www.ecad.eu, last
access: 4 September 2018). Further, we would like to thank the reviewers of
this paper for their time and effort. This study was funded by the
Netherlands Organisation for Scientific Research (NWO) as part of the project
“Impacted by Coincident Weather Extremes” (ICOWEX; grant no.
869.15.017).
Edited by: Ricardo
Trigo
Reviewed by: Jorge Eiras-Barca and one anonymous referee
Amante, C. and Eakins, B. W.: ETOPO1 1 arc-minute global relief model: procedures, data sources and analysis, US Department of Commerce, National Oceanic and Atmospheric Administration, National Environmental Satellite, Data, and Information Service, National Geophysical Data Center, Marine Geology and Geophysics Division Colorado, 2009. a
Barnston, A. G. and Livezey, R. E.: Classification, seasonality and persistence of low-frequency atmospheric circulation patterns, Mon. Weather Rev., 115, 1083–1126, 1987. a
Berrisford, P., Dee, D., Poli, P., Brugge, R., Fielding, K., Fuentes, M., Kallberg, P., Kobayashi, S., Uppala, S., and Simmons, A.: The ERA-Interim Archive, ERA report series, 1, 1–23, 2011. a
Beukema, I.: Atmospheric Rivers Causing Precipitation in the Netherlands?, Master thesis, Wageningen University, 2014. a
Comas-Bru, L. and McDermott, F.: Impacts of the EA and SCA patterns on the European twentieth century NAO–winter climate relationship, Q. J. Roy. Meteor. Soc., 140, 354–363, 2014. a
Dacre, H. F., Clark, P. A., Martinez-Alvarado, O., Stringer, M. A., and Lavers, D. A.: How do atmospheric rivers form?, B. Am. Meteorol. Soc., 96, 1243–1255, 2015. a
Dee, D. P., Uppala, S. M., Simmons, A. J., Berrisford, P., Poli, P., Kobayashi, S., Andrae, U., Balmaseda, M. A., Balsamo, G., Bauer, P., Bechtold, P., Beljaars, A. C. M., van de Berg, L., Bidlot, J., Bormann, N., Delsol, C., Dragani, R., Fuentes, M., Geer, A. J., Haimberger, L., Healy, S. B., Hersbach, H., Holm, E. V., Isaksen, L., Kollberg, P., Koehler, M., Matricardi, M., Mcnally, A. P., Monge-Sanz, B. M., Morcrette, J. J., Park, B. K., Peubey, C., de Rosnay, P., Tavolato, C., Thepaut, J. N., and Vitart, F.: The ERA-Interim reanalysis: Configuration and performance of the data assimilation system, Q. J. Roy. Meteor. Soc., 137, 553–597, https://doi.org/10.1002/qj.828, 2011. a
Espinoza, V., Waliser, D. E., Guan, B., Lavers, D. A., and Ralph, F. M.: Global Analysis of Climate Change Projection Effects on Atmospheric Rivers, Geophys. Res. Lett., 45, 4299–4308, 2018. a
Gerritsen, H., de Vries, H., and Philippart, M.: The Dutch continental shelf model, Quantitative skill assessment for coastal ocean models, in: Coastal and Estuarine Studies, edited by: Lynch, D. R. and Davies, A. M., 425–467, 1995. a
Gimeno, L., Nieto, R., Vazquez, M., and Lavers, D. A.: Atmospheric rivers: a mini-review, Front. Earth Sci., 2, 1–6, https://doi.org/10.3389/feart.2014.00002, 2014. a, b
Guan, B. and Waliser, D. E.: Detection of atmospheric rivers: Evaluation and application of an algorithm for global studies, J. Geophys. Res.-Atmos., 120, 12514–12535, https://doi.org/10.1002/2015JD024257, 2015. a, b, c, d
Guan, B., Waliser, D. E., and Ralph, F. M.: An Intercomparison between Reanalysis and Dropsonde Observations of the Total Water Vapor Transport in Individual Atmospheric Rivers, J. Hydrometeorol., 19, 321–337, 2018. a
Haylock, M. R., Hofstra, N., Klein Tank, A. M. G., Klok, E. J., Jones, P. D., and New, M.: A European daily high-resolution gridded data set of surface temperature and precipitation for 1950-2006, J. Geophys. Res.-Atmos., 113, D20119, https://doi.org/10.1029/2008JD010201, 2008. a
Hazeleger, W., Van den Hurk, B. J. J. M., Min, E., Van Oldenborgh, G. J., Petersen, A. C., Stainforth, D. A., Vasileiadou, E., and Smith, L. A.: Tales of future weather, Nat. Clim. Change, 5, 107, https://doi.org/10.1038/NCLIMATE2450, 2015. a
Kew, S. F., Selten, F. M., Lenderink, G., and Hazeleger, W.: The simultaneous occurrence of surge and discharge extremes for the Rhine delta, Nat. Hazards Earth Syst. Sci., 13, 2017–2029, https://doi.org/10.5194/nhess-13-2017-2013, 2013. a, b, c
Khanal, S., Ridder, N., de Vries, H., Terink, W., and van den Hurk, B.: Storm surge and extreme river discharge: a compound event analysis using ensemble impact modelling, Hydrol. Earth Syst. Sci. Discuss., https://doi.org/10.5194/hess-2018-103, in review, 2018. a
Klerk, W.-J., Winsemius, H., van Verseveld, W., Bakker, A., and Diermanse, F.: The co-incidence of storm surges and extreme discharges within the Rhine–Meuse Delta, Environ. Res. Lett., 10, 035005, https://doi.org/10.1088/1748-9326/10/3/035005, 2015. a
Lavers, D. A. and Villarini, G.: The nexus between atmospheric rivers and extreme precipitation across Europe, Geophys. Res. Lett., 40, 3259–3264, https://doi.org/10.1002/grl.50636, 2013. a, b
Lavers, D. A., Pappenberger, F., and Zsoter, E.: Extending medium-range predictability of extreme hydrological events in Europe, Nat. Commun., 5, 5382, https://doi.org/10.1038/ncomms6382, 2014. a
Ralph, F. and Dettinger, M.: Historical and national perspectives on extreme West Coast precipitation associated with atmospheric rivers during December 2010, B. Am. Meteorol. Soc., 93, 783–790, 2012. a
Ralph, F. M., Neiman, P. J., and Wick, G. A.: Satellite and CALJET aircraft observations of atmospheric rivers over the eastern North Pacific Ocean during the winter of 1997/98, Mon. Weather Rev., 132, 1721–1745, 2004. a
Ramos, A. M., Nieto, R., Tomé, R., Gimeno, L., Trigo, R. M., Liberato, M. L. R., and Lavers, D. A.: Atmospheric rivers moisture sources from a Lagrangian perspective, Earth Syst. Dynam., 7, 371–384, https://doi.org/10.5194/esd-7-371-2016, 2016a. a
Ramos, A. M., Tomé, R., Trigo, R. M., Liberato, M. L. R., and Pinto, J. G.: Projected changes in atmospheric rivers affecting Europe in CMIP5 models, Geophys. Res. Lett., 43, 9315–9323, https://doi.org/10.1002/2016GL070634, 2016b. a
Ridder, N., de Vries, H., Drijfhout, S., van den Brink, H., van Meijgaard, E., and de Vries, H.: Extreme storm surge modelling in the North Sea – The role of the sea-state, forcing frequency and spatial forcing resolution, Ocean Dynam., 68, 255–272, https://doi.org/10.1007/s10236-018-1133-0, 2018. a, b
Sterl, A., van den Brink, H., de Vries, H., Haarsma, R., and van Meijgaard, E.: An ensemble study of extreme storm surge related water levels in the North Sea in a changing climate, Ocean Sci., 5, 369–378, https://doi.org/10.5194/os-5-369-2009, 2009. a
van den Hurk, B., van Meijgaard, E., de Valk, P., van Heeringen, K.-J., and Gooijer, J.: Analysis of a compounding surge and precipitation event in the Netherlands, Environ. Res. Lett., 10, 035001, https://doi.org/10.1088/1748-9326/10/3/035001, 2015. a, b, c
Vorogushyn, S., Bates, P. D., de Bruijn, K., Castellarin, A., Kreibich, H., Priest, S., Schröter, K., Bagli, S., Blöschl, G., Domeneghetti, A., et al.: Evolutionary leap in large-scale flood risk assessment needed, Wires Water, 5, e1266, https://doi.org/10.1002/wat2.1266, 2018. a
Waliser, D. and Guan, B.: Extreme winds and precipitation during landfall of atmospheric rivers, Nat. Geosci., 10, 179–183, https://doi.org/10.1038/ngeo2894, 2017. a, b, c, d, e, f
Zhu, Y. and Newell, R. E.: A Proposed Algorithm for Moisture Fluxes from Atmospheric Rivers, Mon. Weather Rev., 126, 725–735, https://doi.org/10.1175/1520-0493(1998)126<0725:APAFMF>2.0.CO;2, 1998. a
Zscheischler, J., Westra, S., Hurk, B. J., Seneviratne, S. I., Ward, P. J., Pitman, A., AghaKouchak, A., Bresch, D. N., Leonard, M., Wahl, T., and Zhang, X.: Future climate risk from compound events, Nat. Clim. Change, 8, 469–477, https://doi.org/10.1002/wat2.1266, 2018. a, b, c