the Creative Commons Attribution 4.0 License.
the Creative Commons Attribution 4.0 License.
 | 19 Nov 2018
Brief communication: Meteorological and climatological conditions associated with the 9 January 2018 post-fire debris flows in Montecito and Carpinteria, California, USA
Forest Cannon
Robert Munroe
Jeremy T. Lancaster
David Gomberg
F. Martin Ralph
The Thomas Fire burned 114 078 ha in Santa Barbara and Ventura counties, southern California, during December 2017–January 2018. On 9 January 2018, high-intensity rainfall occurred over the Thomas Fire burn area in the mountains above the communities of Montecito and Carpinteria, initiating multiple devastating debris flows. The highest rainfall intensities occurred with the passage of a narrow rainband along a cold front oriented north to south. Orographic enhancement associated with moist southerly flow immediately ahead of the cold front also played a role. We provide an explanation of the meteorological characteristics of the event and place it in historic context.
- Article
(7236 KB) - Full-text XML
-
Supplement
(8950 KB) - BibTeX
- EndNote


The Thomas Fire was ignited on 4 December 2017 and burned 114 078 ha in Santa Barbara and Ventura counties in southern California before it was 100 % contained on 12 January 2018. It became the largest wildfire in California's modern history. Soil burn severity was predominately moderate with small areas mapped as high in the northern and western portions of the burn area (CAL FIRE, 2018). In combination with the steep terrain and underlying geology, the United States Geological Survey (USGS) rated watersheds north of the Santa Barbara coastal plain and Ojai as having high debris flow hazard based on a design rainstorm that has a 15 min rainfall intensity of 24 mm h−1 (USGS, 2018a; Fig. S1 in the Supplement).
In the first significant rainfall event of the wet season on 9 January 2018, high-intensity rainfall occurred over the westernmost portion of the Thomas Fire burn area between 11:30 and 12:00 UTC (03:30–04:00 LST). Rainfall rates exceeded the USGS 15 min design storm (USGS, 2018a) by more than 3-fold at some locations. Large-magnitude debris flow surges were triggered in multiple watersheds, overwhelming debris basins and issuing onto urbanized alluvial fans including the communities of Montecito and Carpinteria (Fig. 1). The debris flows were devastating, resulting in 23 deaths, 246 structures destroyed, and 167 damaged (County of Santa Barbara, 2018). Preliminary loss estimates for residential and commercial property alone have exceeded USD 421 million (California Department of Insurance, 2018).
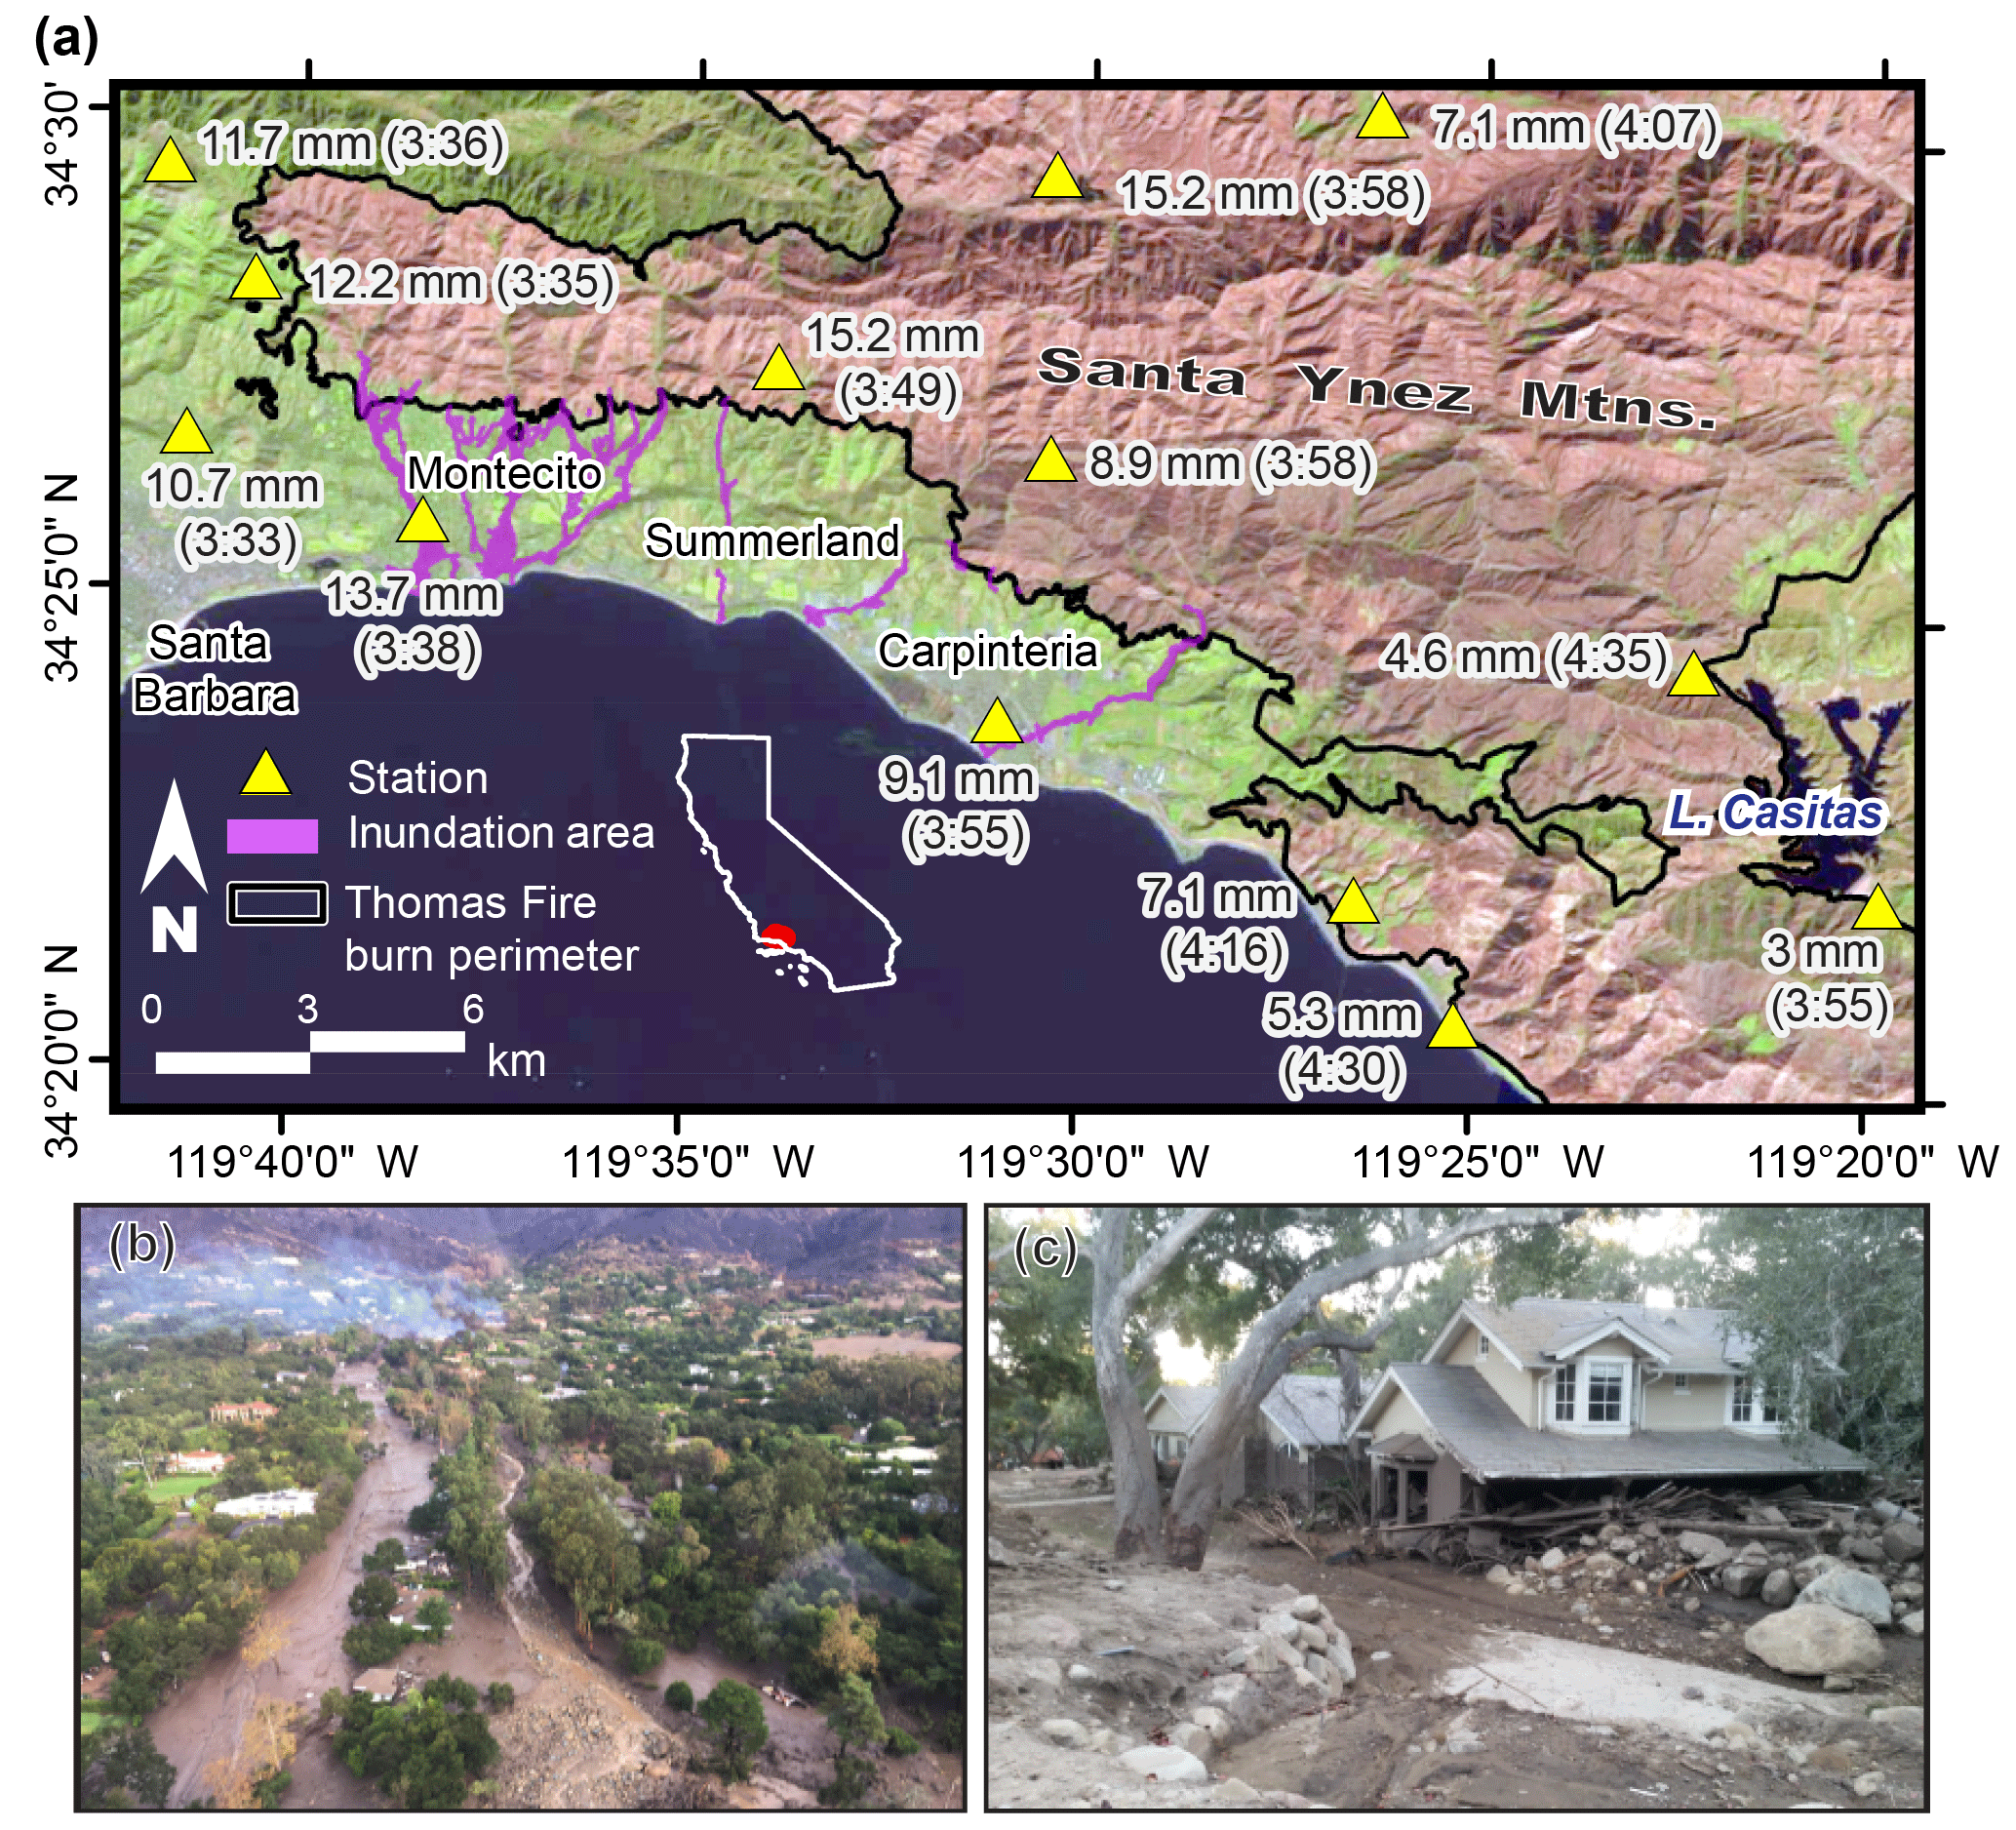
Figure 1(a) Burned areas within the perimeter of the Thomas Fire are depicted in red and unburned areas in green, as derived from the Landsat 8 thermal infrared sensor and surface reflectance imagery (USGS, 2018b). Inundated areas, as mapped by the California Geological Survey, are displayed in purple. Station-based observations of the greatest 5 min event precipitation and the start time of the interval (LST) are labeled. (b) Aerial photo of San Ysidro Creek in Montecito following the debris flow; areas that were once roads and homes appear as rivers of mud and debris. Photo: Ventura County Air Unit. (c) A home destroyed in the debris flow. Photo: Brian Swanson, CGS.
Over the past 3 decades, more than a dozen notable post-fire debris flow (hereafter “PFDF”) events have been observed across the Transverse Ranges of southern California (Oakley et al., 2017), where steep terrain, highly erodible soils, and frequent wildfires create favorable conditions for PFDFs (Wells II, 1987). In the Montecito area specifically, damaging PFDFs occurred following both the Coyote Fire of 1964 and Romero Fire of 1971 (U.S. Army Corps of Engineers, 1974).
This paper describes the meteorological origins of the high-intensity precipitation leading to the 9 January 2018 debris flow and places the event in a climatological context. This information is intended to appeal to a broad community of researchers and stakeholders (e.g., persons in engineering geology, geomorphology, social science, and floodplain and water resource management) to support understanding of meteorological triggers of PFDFs, which remains needed information in these communities (Garfin et al., 2016). The analysis presented here can also increase situational awareness for future events.
2.1 Synoptic conditions
In the 36 h preceding the debris flow event (∼12 UTC 9 January), an upper-level trough approached and deepened along the US West Coast (Fig. 2). By 06:00 UTC 9 January (Fig. 2f), a 500 hPa closed low-pressure system had developed offshore of Point Conception (centered at ∼34∘ N, 125∘ W) and moved eastward leading up to the event time, when it was situated at approximately 34∘ N, 122∘ W. At the time of the event, the attendant 1000 hPa surface low-pressure center was situated slightly further north and east, at approximately 36∘ N, 121∘ W (Figs. 2g, 3a).
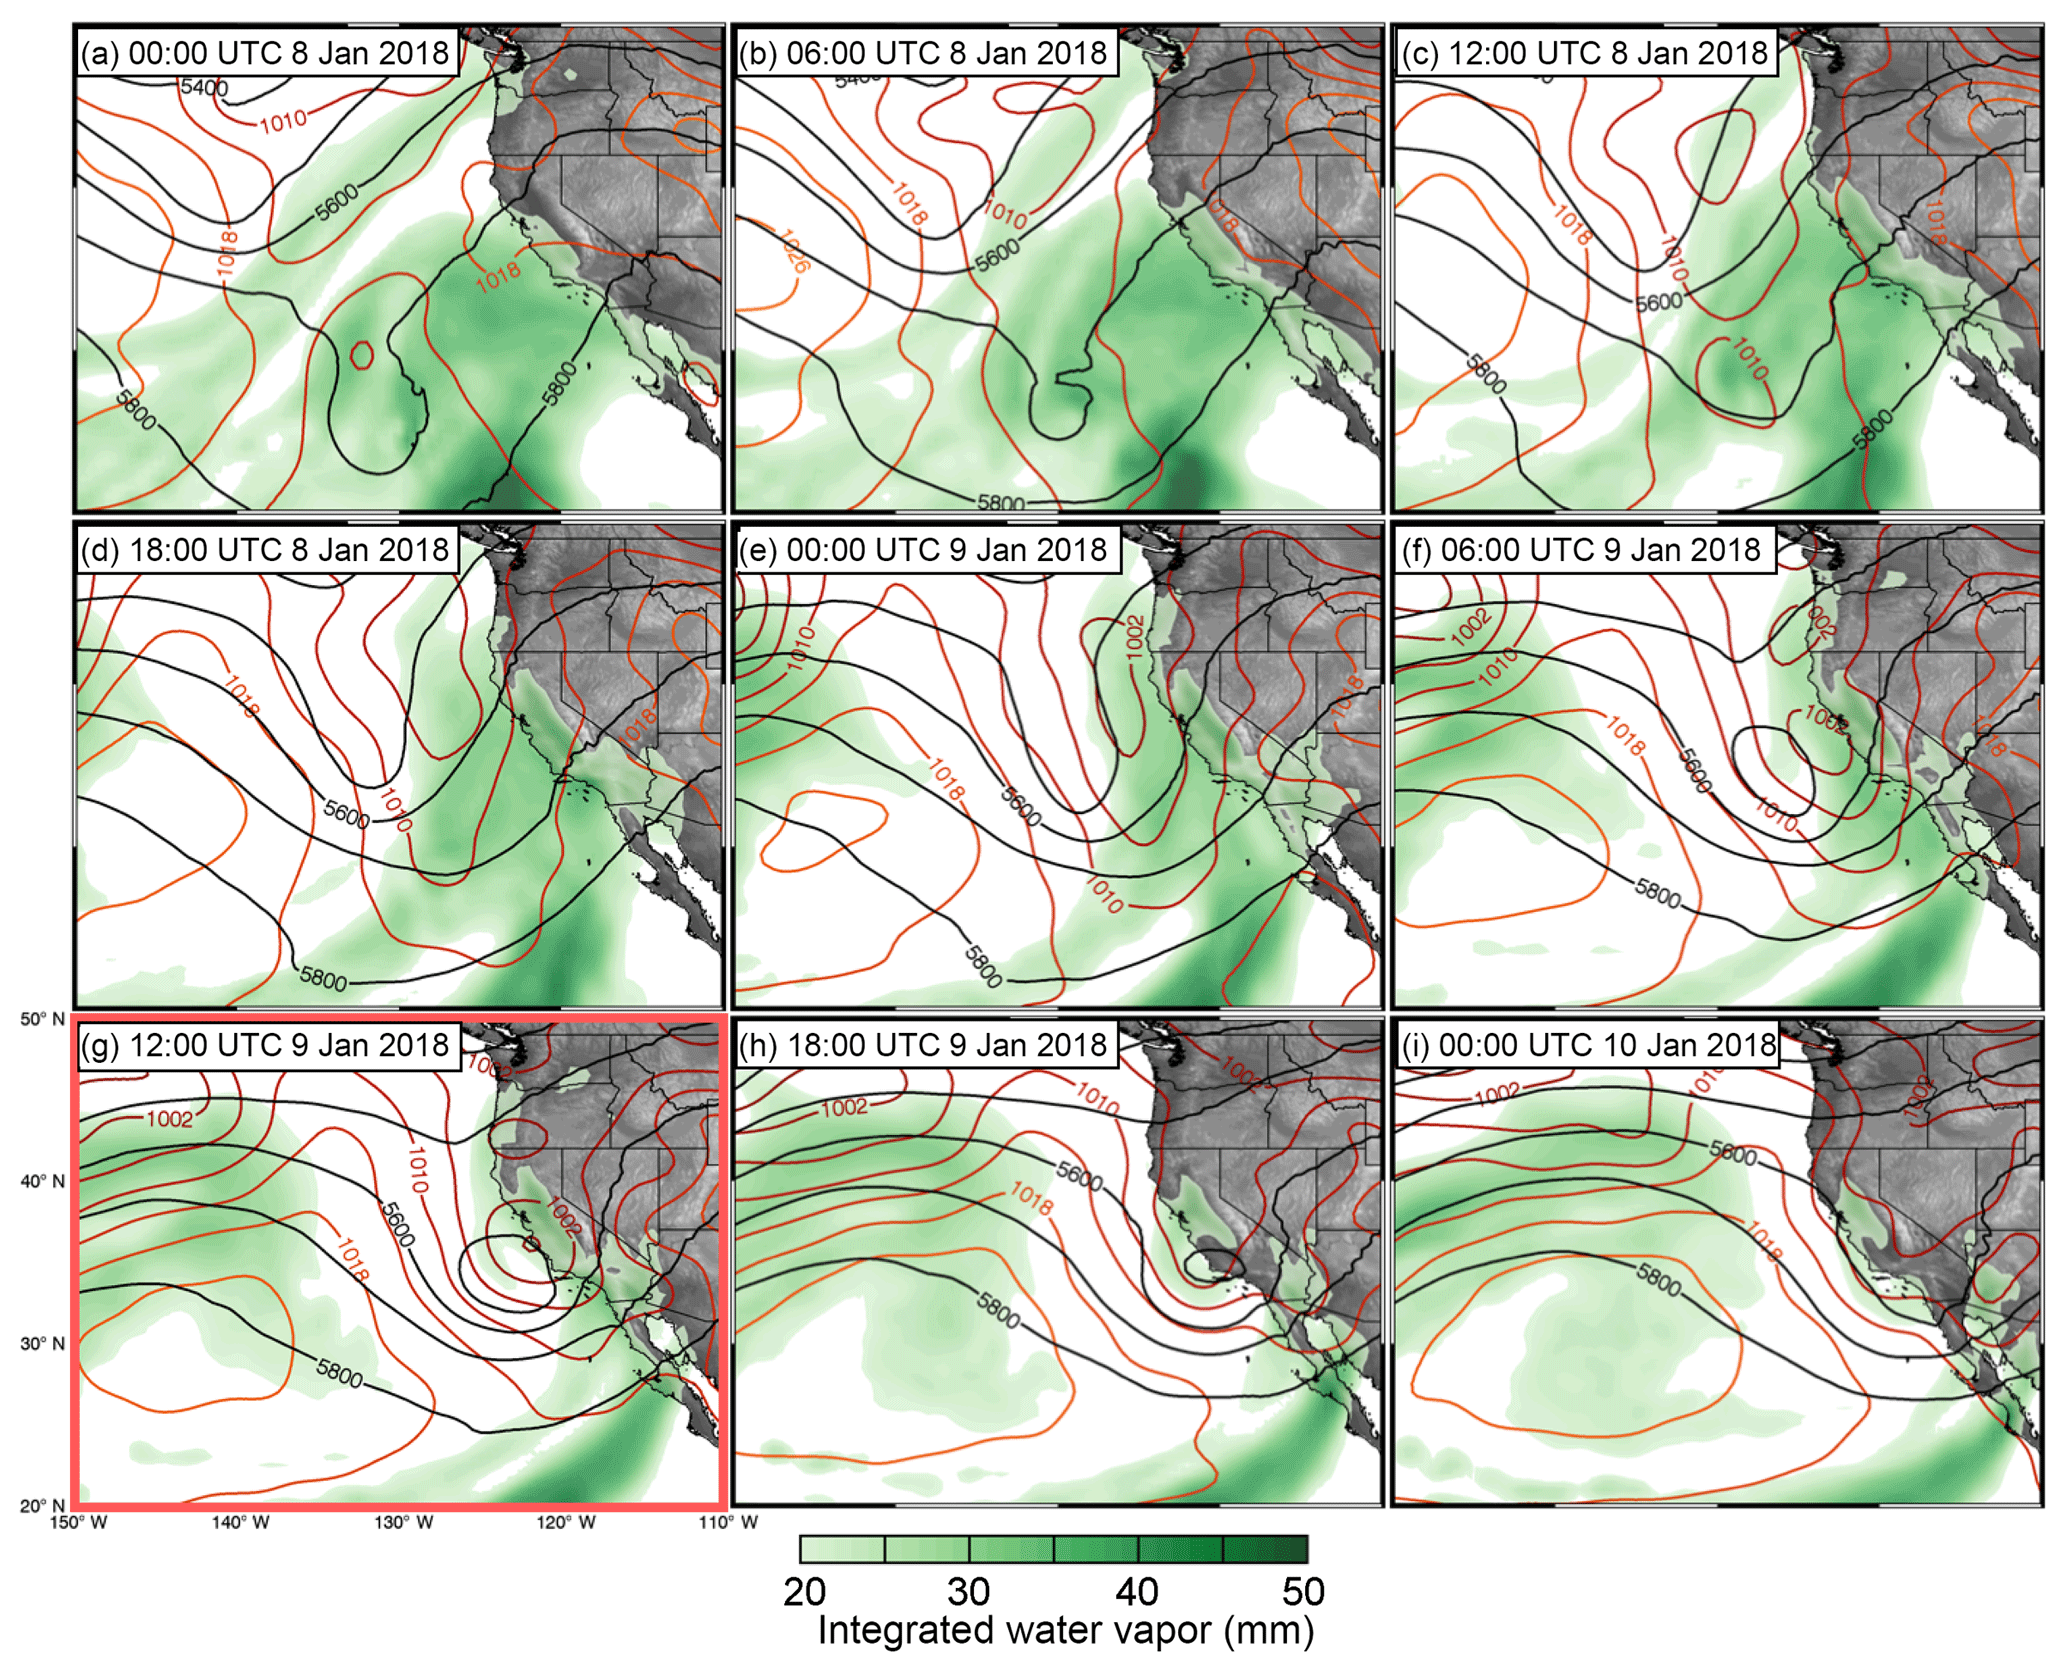
Figure 2The 500 hPa geopotential heights (black contour lines), sea level pressure (hPa; pink contour lines), and integrated water vapor (IWV; green filled contours) at 6 h intervals for 36 h preceding the event, the time nearest the event (outlined in pink), and 12 h following the event. Analysis based on Climate Forecast System version 2 operational analysis (Saha et al., 2014; https://www.ncdc.noaa.gov/data-access/model-data/model-datasets/climate-forecast-system-version2-cfsv2; last access: 5 November 2018).
About 24 to 36 h prior to the event (Fig. 2a–c), the approaching midlatitude trough and a weakening subtropical closed low-pressure system (centered at approximately 25∘ N, 130∘ W) facilitated the transport of subtropical moisture (shown as plumes of integrated water vapor (IWV) in Fig. 2) to the West Coast. These plumes interacted and were modified in the 36 h preceding the event. By the time of the event (Fig. 2g), two distinct plumes were present: a weaker plume to the north making landfall in southern California and a stronger plume (higher IWV) to the south making landfall in northern Baja California. IWV values in the flow impinging on the Santa Ynez Mountains at the time of the PFDF event were approximately 25–30 mm (Fig. 2g), and integrated vapor transport (IVT) of 250 to 400 kg m−1 s−1 was observed on the eastern side of the large-scale circulation over the Southern California Bight (Fig. S4). We define this moisture plume as a weak atmospheric river due to its long, narrow shape and associated IWV and IVT values (AMS, 2018).
At the time of the event, the downstream side of a cyclonically curved upper-level (250 hPa) jet was located over southern California with a 50 m s−1 jet streak exit region situated over the Santa Barbara area (Figs. 3a; S3). Model soundings indicate cold air advection between approximately 450 and 600 hPa, increasing the lapse rate in this layer and creating a region of potential instability (Figs. S5, S6). This was collocated with a region of inferred absolute vorticity advection by the geostrophic wind at 500 hPa (Fig. S2). These conditions were also associated with a well-defined cold front parallel to and impinging upon the moist low-level jet (LLJ) ahead of the front (Fig. 3). This scenario positioned the Thomas Fire burn area in a favorable region for large-scale ascent and destabilization of the atmosphere (Markowski and Richardson, 2010).
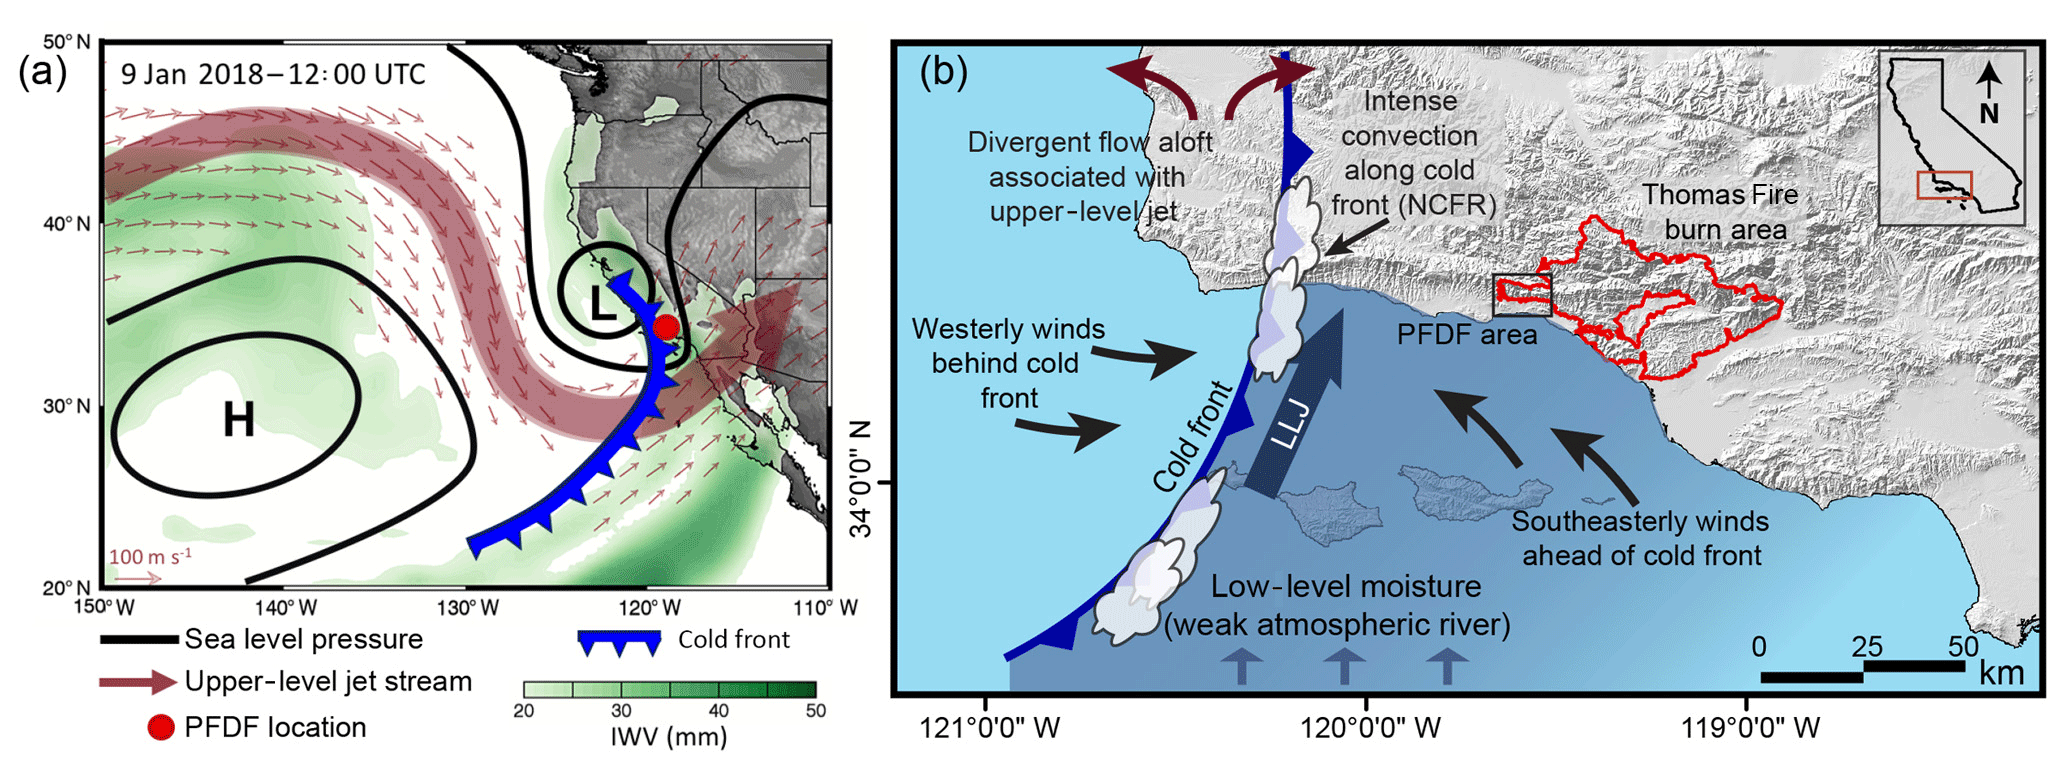
Figure 3(a) A conceptual synoptic view of conditions at 12:00 UTC 9 January 2018 based on information from the Climate Forecast System version 2 operational analysis (https://www.ncdc.noaa.gov/data-access/model-data/model-datasets/climate-forecast-system-version2-cfsv2, last access: 5 November 2018). (b) A conceptual mesoscale view of conditions preceding the event as the cold front approaches the Thomas Fire burn area.
2.2 Mesoscale conditions
At approximately 09:00 UTC 9 January, the north-to-south-oriented cold front was located just offshore of Point Conception and was propagating eastward across the Southern California Bight (Fig. 2b). Radar and satellite imagery reveal a narrow band of intense rainfall and vigorous convection parallel to and in the vicinity of the cold front (Figs. 4, S7), a feature known as a narrow cold-frontal rainband (NCFR; Markowski and Richardson, 2010). These features tend to form when there is strong convergent flow along the surface front and divergent flow aloft. This facilitates the release of potential instability through forced ascent and the generation of intense convective precipitation bands (Hobbs and Persson, 1982; Markowski and Richardson, 2010).

Figure 4Panels (a) and (b) show radar imagery (a) preceding and (b) at the time of PFDFs on the Thomas Fire burn area. Yellow to red colors indicate higher-intensity precipitation. Radar image source: California Nevada River Forecast Center (CNRFC; https://cnrfc.noaa.gov/, last access: 5 November 2018). Panel (c) shows precipitation observations at 15 min intervals from the KTYD station operated by SBCPWD. The station position is indicated by the yellow marker in panel (a). Panel (d) provides regional 48 h precipitation totals from CNRFC.
Ahead of the cold front, 10–20 ms−1 southeasterly winds were present below 1 km, as demonstrated in measurements from the 449 MHz radar wind profiler situated at Santa Barbara Airport (SBA; Fig. S8). The cold front passed over Santa Barbara and Montecito between 11:00 and 12:00 UTC. The passage of the cold front can be observed as a shift from strong southeasterly winds to weak south to southwesterly winds below 2 km (Fig. S8). The convergence of this southeasterly flow ahead of the front and westerly flow behind the front helped support the development of the NCFR. As the cold front made landfall and encountered the complex coastal terrain, the NCFR became segmented and dissipated in some areas. One segment became well organized north of Santa Rosa and Santa Cruz islands and intensified as it moved across the Santa Barbara Channel towards Montecito (Fig. 4b).
Strong low-level south to southeasterly winds peaking near 1 km were observed immediately ahead of the cold front, a feature known as a LLJ (Neiman et al., 2004; Figs. 3b, S8). The presence of the LLJ orthogonal to the terrain combined with available moisture (Figs. 3b, S8) created a situation favorable for orographic precipitation enhancement (Lin et al., 2001). However, due to the forcings described and presence of high radar reflectivity values over the ocean before the NCFR impacted the terrain (Fig. 4b), it appears that the NCFR was the dominant feature producing short-duration high-intensity rainfall in this case, with orographic forcing likely acting as a secondary factor.
Radar and surface-based precipitation observations reveal that the segment of the NCFR impacting Montecito and Carpinteria began to dissipate near the Santa Barbara–Ventura County line just after 12:00 UTC (04:00 PST; Figs. 1, S9). The subsequent weakening of rainfall intensity likely spared other portions of the burn area from additional catastrophic debris flows.
3.1 Historical context of precipitation event
The Santa Barbara County Public Works Department (SBCPWD) maintains a network of precipitation gauges used for flood hazard and water resource management, with records dating back to the 1960s. All precipitation data discussed herein have been archived and quality controlled by SBCPWD and can be accessed at http://www.countyofsb.org/pwd/hydrology.sbc (last access: 5 November 2018). Average return intervals (ARIs) described in this section are sourced from NOAA Atlas 14 (https://hdsc.nws.noaa.gov/hdsc/pfds/, last access: 5 November 2018; Bonnin et al., 2006) for the coordinates of each station. Tables S1–S3 provide further information on relevant observations in and around the Thomas Fire burn area.
The short-duration intense precipitation (Figs. 1, 4c) observed during the 9 January 2018 debris flow event was exceptional and in some cases broke individual station records, but was not unprecedented for Santa Barbara County. At the 5 min duration, a maximum of 15.24 mm was recorded at both Jameson Dam (a 25-year ARI event; 25–1000 years at 90 % confidence) and Doulton Tunnel (a 100-year ARI event; 25–1000 years at 90 % confidence). This exceeded the previous record 5 min observations at both stations, whose records began in 1965. In Montecito, 13.72 mm was observed in 5 min, setting a record for this station, though the station record is very short, beginning in 2009. This registers as a 200-year ARI event (100–1000 years at 90 % confidence). Values discussed in this section can be reviewed in Table S1 and Fig. 1.
The 15 min duration provides the most accurate prediction of PFDF generation (Staley et al., 2017). At this duration, Doulton Tunnel set a record of 26.16 mm, exceeding the previous record of 22.35 mm set in Water Year 2015 (WY2015). Jameson Dam also set a record at 25.15 mm, exceeding the previous record of 13.46 mm set in Water Year 1998 (WY1998). Additionally, a 15 min record of 18.54 mm was set at the Montecito station. At Doulton Tunnel, this was a 100-year ARI event (25–1000 years at 90 % confidence). At Jameson, this is a 25-year ARI event (10–500 years at 90 % confidence), and for Montecito, this is a 50-year ARI event (25–1000 years at 90 % confidence). Values discussed in this section can be reviewed in Table S2.
The records set at individual stations at the 5 and 15 min durations were well shy of the extremes observed in Santa Barbara County. At the 5 min duration, the county record is 18.29 mm at the UCSB station set in WY1998. The county record at the 15 min duration is 35.31 mm set at the San Marcos Pass station in WY2015.
At the 1 h and longer durations, precipitation intensities were generally less than the 10-year return interval (Table S3). Storm total precipitation over a 24 h period was roughly 50–75 mm at low elevations and 100–125 mm at higher elevations (Fig. 3d). These 24 h precipitation totals were mostly less than the 1-year return interval.
3.2 Context of intense rainband
No known documentation exists on the abundance of NCFRs or similar frontal convection in southern California, though several resources acknowledge their occurrence and impacts. We hypothesize that these features occur multiple times in a given year and are not uncommon in association with landfalling atmospheric rivers with strong cold fronts impacting the region. NCFRs such as the one observed during the 9 January 2018 event (Fig. 4a, b) have been previously associated with PFDFs in the Transverse Ranges of southern California.
On 12 December 2014, an NCFR produced intense rainfall over the Springs Fire burn area in Camarillo, CA, initiating a debris flow that destroyed several homes (Fig. S10; Sukup et al., 2016; Oakley et al., 2017). More recently, on 20 January 2017, a narrow band of high-intensity rainfall occurring along a cold front produced a debris flow on the Sherpa Fire burn area in western Santa Barbara County (Fig. S11). Five cabins and over 20 vehicles were damaged in El Capitan Canyon, and nearly 24 people had to be rescued (Lin II et al., 2017). Neiman et al. (2004) used observations from an intensive field campaign in 1998 to detail the synoptic and mesoscale forcing associated with a cold front that also generated high-intensity precipitation in this region of southern California. Observations of convective precipitation bands in the area and their precipitation impacts date back to the early 1960s (Elliot and Hovind, 1964). However, NCFRs are not the only mechanism for producing high-intensity precipitation and PFDFs in southern California. Other types of convection embedded within the cyclone system, thunderstorms, and orographically forced precipitation have also historically resulted in PFDFs (Oakley et al., 2017).
Intense precipitation associated with NCFRs is not unique to southern California and commonly occurs in other parts of the world where there is also complex terrain. These features have been observed to impact Chile (Viale et al., 2013) in South America and western Europe (Roux et al., 1993; Gatzen, 2011). These areas may experience severe wildfires, and NCFRs may serve as PFDF triggers in these regions as well.
The Transverse Ranges of southern California are prone to post-fire debris flows (PFDFs). Following a wildfire of moderate to high burn severity on steeply sloping terrain, short-duration, high-intensity precipitation over these areas may trigger a debris flow, as occurred on the morning of 9 January 2018.
The debris flows were triggered by a band of intense precipitation along a cold front, known as a narrow cold frontal rainband (NCFR; Figs. 3b and 4a, b) that impacted the westernmost portion of the Thomas Fire burn area. Such rainbands develop due to vertical circulations along the front that facilitate low-level convergence and lifting, which can force convection and intense rainfall. This mesoscale process may also benefit from destabilization at large scales through the inferred synoptic forcing for ascent.
A weak atmospheric river was present at the time of the event, demonstrating that catastrophic hydrologic impacts can occur even in the absence of substantial water vapor transport (i.e., a strong atmospheric river) due to synoptic to mesoscale forcing. The majority of PFDFs in southern California occur in the presence of atmospheric river conditions, but there are several examples of PFDF events that do not (Oakley et al., 2017). Observations suggest that the NCFR, and to a lesser extent orographic forcing, produced high-intensity rainfall in this event, with the weak atmospheric river serving as a moisture source.
Precipitation in this event was extreme at the 5 and 15 min durations. Three locations recorded > 13 mm in 5 min and records were set at a few stations with 50+ years of observations. Several stations demonstrated notable differences in the average return interval for these two durations. The Montecito station reported a 200-year precipitation event at the 5 min duration. At the 15 min duration, currently considered most pertinent to PFDF activity, the station reported a 100-year event. The maximum rainfall intensities observed in this event are not unprecedented for Santa Barbara County. Total storm precipitation was unremarkable for the area, with 24 h totals at the < 1-year return interval, demonstrating that significant total storm precipitation is not required to produce rainfall capable of initiating a PFDF.
This analysis supports improved situational awareness and understanding of rainfall events producing PFDFs for the natural hazards community in California and other midlatitude regions of the world that experience wildfires in complex terrain. It also serves as a meteorological description to inform research on a variety of topics related to the 9 January 2018 debris flows. Future work will examine the role of terrain in modifying the NCFR and precipitation processes described herein, the predictability of forced convection and extreme precipitation rates, and their relation to PFDFs in other regions of the world.
Climate Forecast System version 2 operational analysis (Saha et al., 2014; https://www.ncdc.noaa.gov/data-access/model-data/model-datasets/climate-forecast-system-version2-cfsv2; last access: 5 November 2018), California Nevada River Forecast Center (https://cnrfc.noaa.gov/, last access: 5 November 2018) Santa Barbara County Public Works Department (http://www.countyofsb.org/pwd/hydrology.sbc; last access: 5 November 2018) NOAA Atlas 14 (https://hdsc.nws.noaa.gov/hdsc/pfds/, last access: 5 November 2018) USGS: Emergency Assessment of Post-Fire Debris Flow Hazards: Thomas Fire, available at https://landslides.usgs.gov/hazards/postfire_debrisflow/; last access: 5 November 2018, USGS: Earth Explorer, Landsat 8, Operational Land Imager, Thermal Infrared Sensor Surface Reflectance (https://earthexplorer.usgs.gov/; last access: 5 May 2018)
The supplement related to this article is available online at: https://doi.org/10.5194/nhess-18-3037-2018-supplement.
NSO, FC, and FMR conceptualized this article. NSO, FC, JTL, RM, and DG participated in data collection, analysis, and interpretation. NSO and FC drafted the article. All authors participated in critical revision and final approval of the article.
The authors declare that they have no conflict of interest.
This material is based upon work supported by the U.S. Geological Survey
under cooperative agreement no. G16AC00266 for the Southwest Climate
Adaptation Science Center. The authors would like to thank Nick Nauslar at
the NOAA Storm Prediction Center for insights into this event.
Edited by: Andreas Günther
Reviewed by: two anonymous referees
American Meteorological Society (AMS): Glossary of Meteorology: Atmospheric River, available at: http://glossary.ametsoc.org/wiki/Atmospheric_river, last access: 1 April 2018.
Bonnin, G. M., Martin, D., Lin, B., Parzybok, T., Yekta, M., and Riley, D.: Precipitation-frequency atlas of the United States, NOAA Atlas, 14, 1–65, 2006.
CAL FIRE: Thomas Fire Watershed Emergency Response Team Final Report, available at: http://cdfdata.fire.ca.gov/admin8327985/cdf/images/incidentfile1922_3383.pdf, last access: 12 April 2018.
California Department of Insurance: Montecito mudslide claims top $421 million, available at: http://www.insurance.ca.gov/0400-news/0100-press-releases/2018/release033-18.cfm, last access: 4 April 2018.
County of Santa Barbara: Thomas Fire and 1/9 debris flow recovery strategic plan, available at: https://www.scribd.com/document/381185041/Santa-Barbara-County-Recovery-Strategic-Plan, last access: 8 June 2018.
Elliott, R. D. and Hovind, E. L.: On convection bands within Pacific Coast storms and their relation to storm structure, J. Appl. Meteorol., 3, 143–154, 1964.
Garfin, G., LeRoy, S., Martin, D., Hammersley, M., Youberg, A., and Quay, R.: Managing for future risks of fire, extreme precipitation, and post-fire flooding, Report to the U.S. Bureau of Reclamation, from the project Enhancing Water Supply Reliability, Tucson, AZ: Institute of the Environment, available at: https://bit.ly/2LRhCtQ (last access: 8 July 2018), 2016.
Gatzen, C.: A 10-year climatology of cold-season narrow cold-frontal rainbands in Germany, Atmos. Res., 100, 366–370, 2011.
Hobbs, P. V. and Persson, P. O. G.: The mesoscale and microscale structure and organization of clouds and precipitation in midlatitude cyclones. Part V: The substructure of narrow cold-frontal rainbands, J. Atmos. Sci., 39, 280–295, 1982.
Lin, Y. L., Chiao, S., Wang, T. A., Kaplan, M. L., and Weglarz, R. P.: Some common ingredients for heavy orographic rainfall, Weather Forecast., 16, 633–660, 2001.
Lin II, R. G., Xia, R., and Rañoa, R.: As California goes from drought to deluge a dangerous old foe returns: mudslides, available at: http://www.latimes.com/local/lanow/la-me-ln-how-landslides-work-20170121-story.html, last access: 10 March 2018.
Markowski, P. and Richardson, Y.: Mesoscale Meteorology in Midlatitudes, Wiley-Blackwell, Barcelona, 2010.
Neiman, P. J., Martin Ralph, F., Persson, P. O. G., White, A. B., Jorgensen, D. P., and Kingsmill, D. E.: Modification of fronts and precipitation by coastal blocking during an intense landfalling winter storm in southern California: Observations during CALJET, Mon. Weather Rev., 132, 242–273, 2004.
Oakley, N. S., Lancaster, J. T., Kaplan, M. L., and Ralph, F. M.: Synoptic conditions associated with cool season post-fire debris flows in the Transverse Ranges of southern California, Nat. Hazards, 88, 327–354, 2017.
Roux, F., Marécal, V., and Hauser, D.: The 12/13 January 1988 narrow cold-frontal rainband observed during MFDP/FRONTS 87. Part I: Kinematics and thermodynamics, J. Atmos. Sci., 50, 951–974, 1993.
Staley, D. M., Negri, J. A., Kean, J. W., Laber, J. L., Tillery, A. C., and Youberg, A. M.: Prediction of spatially explicit rainfall intensity–duration thresholds for post-fire debris-flow generation in the western United States, Geomorphology, 278, 149–162, 2017.
Sukup, S. J., Laber, J., Sweet, D., and Thompson, R.: Analysis of an intense narrow cold frontal rainband and the Springs Fire debris flow of 12 December 2014, NWS technical attachment 1601, https://www.weather.gov/media/wrh/online_publications/TAs/TA1601.pdf, (last access: 5 November 2018), 2016.
Saha, S., Moorthi, S., Wu, X., Wang, J., and Coauthors: The NCEP Climate Forecast System Version 2, J. Climate, 27, 2185–2208, https://doi.org/10.1175/JCLI-D-12-00823.1, 2014.
U.S. Army Corps of Engineers: Flood plain information, Montecito streams, vicinity of Montecito, Santa Barbara County, California, http://www.countyofsb.org/uploadedFiles/pwd/Content/Water/MontStreamsRpt1974.pdf (last access: 4 April 2018), 1974.
USGS: Emergency Assessment of Post-Fire Debris Flow Hazards: Thomas Fire, available at: https://landslides.usgs.gov/hazards/postfire_debrisflow/, last access: 12 April 2018a.
USGS: Earth Explorer, Landsat 8, Operational Land Imager, Thermal Infrared Sensor Surface Reflectance image dated 11 February 2018, available at: https://earthexplorer.usgs.gov/, last access: 5 May 2018b.
Viale, M., Houze Jr., R. A., and Rasmussen, K. L.: Upstream orographic enhancement of a narrow cold-frontal rainband approaching the Andes, Mon. Weather Rev., 141, 1708–1730, 2013.
Wells II, W. G.: The effects of fire on the generation of debris flows in southern California, in: Debris flows/avalanches – process, recognition, and mitigation, edited by: Costa, J. E. and Wieczorek, G. F., Geological Society of America, Reviews in Engineering Geology VII, 105–114, 1987.