the Creative Commons Attribution 4.0 License.
the Creative Commons Attribution 4.0 License.
 | 01 Aug 2018
Exceptionally cold water days in the southern Taiwan Strait: their predictability and relation to La Niña
Yu-Hsin Cheng
The objectives of this study were to assess the predictability of exceptionally cold water in the Taiwan Strait (TS) and to develop a warning system on the basis of the scientific mechanism, which is a component of the information technology system currently under development in Taiwan to protect aquaculture against extreme hazards. Optimum interpolation sea surface temperature (SST) data were used to find exceptionally cold water days from January 1995 to May 2017. We found that the SST and wind speed over the TS are low and strong in La Niña winters, respectively. According to tests conducted using relative operating characteristic curves, predictions based on the Oceanic Niño Index and integrated wind speed can be employed at lead times of 60–120 and 0–25 days, respectively. This study utilized these two proxies to develop a possible warning mechanism and concluded four colors of warning light: (1) blue, meaning normal (0 % occurrence probability); (2) cyan, meaning warning (∼ 50 % occurrence probability); (3) yellow, meaning moderate risk (∼ 60 % occurrence probability); and (4) red, meaning high risk (∼ 75 % occurrence probability). Hindcasting winters over the period 1995–2017 successfully predicted the cold water hazards in the winters of 2000, 2008, and 2011 prior to the coldest day by ∼ 20 days.
- Article
(6509 KB) - Full-text XML
-
Supplement
(257 KB) - BibTeX
- EndNote


The Taiwan Strait (TS) is a northeast-to-southwest passage, with a length of 300 km and width of 180 km, from the East China Sea to the South China Sea. The average depth of the TS is 50 m and two major shallow water regions, Taiwan Bank and Chang-Yuen Ridge, are both about 30 m deep (Fig. 1). Circulation in the TS, exhibiting strong seasonal variation, is mainly dominated by monsoon forcing and topography (Jan et al., 2002). The China Coastal Current brings cold and brackish water into the northern TS during winter from December to the following January (Jan et al., 2006; Chen et al., 2016). In addition, the strong northeast monsoon reduces the northward transport of the Kuroshio Branch Current, bringing warm and saline water from the western North Pacific. In summer, the southwestern monsoon replaces the northeast monsoon and dominates the circulation in the TS. During the southwest monsoon season, the northward transport is intensified and brings South China Sea water into the TS (Jan et al., 2006).
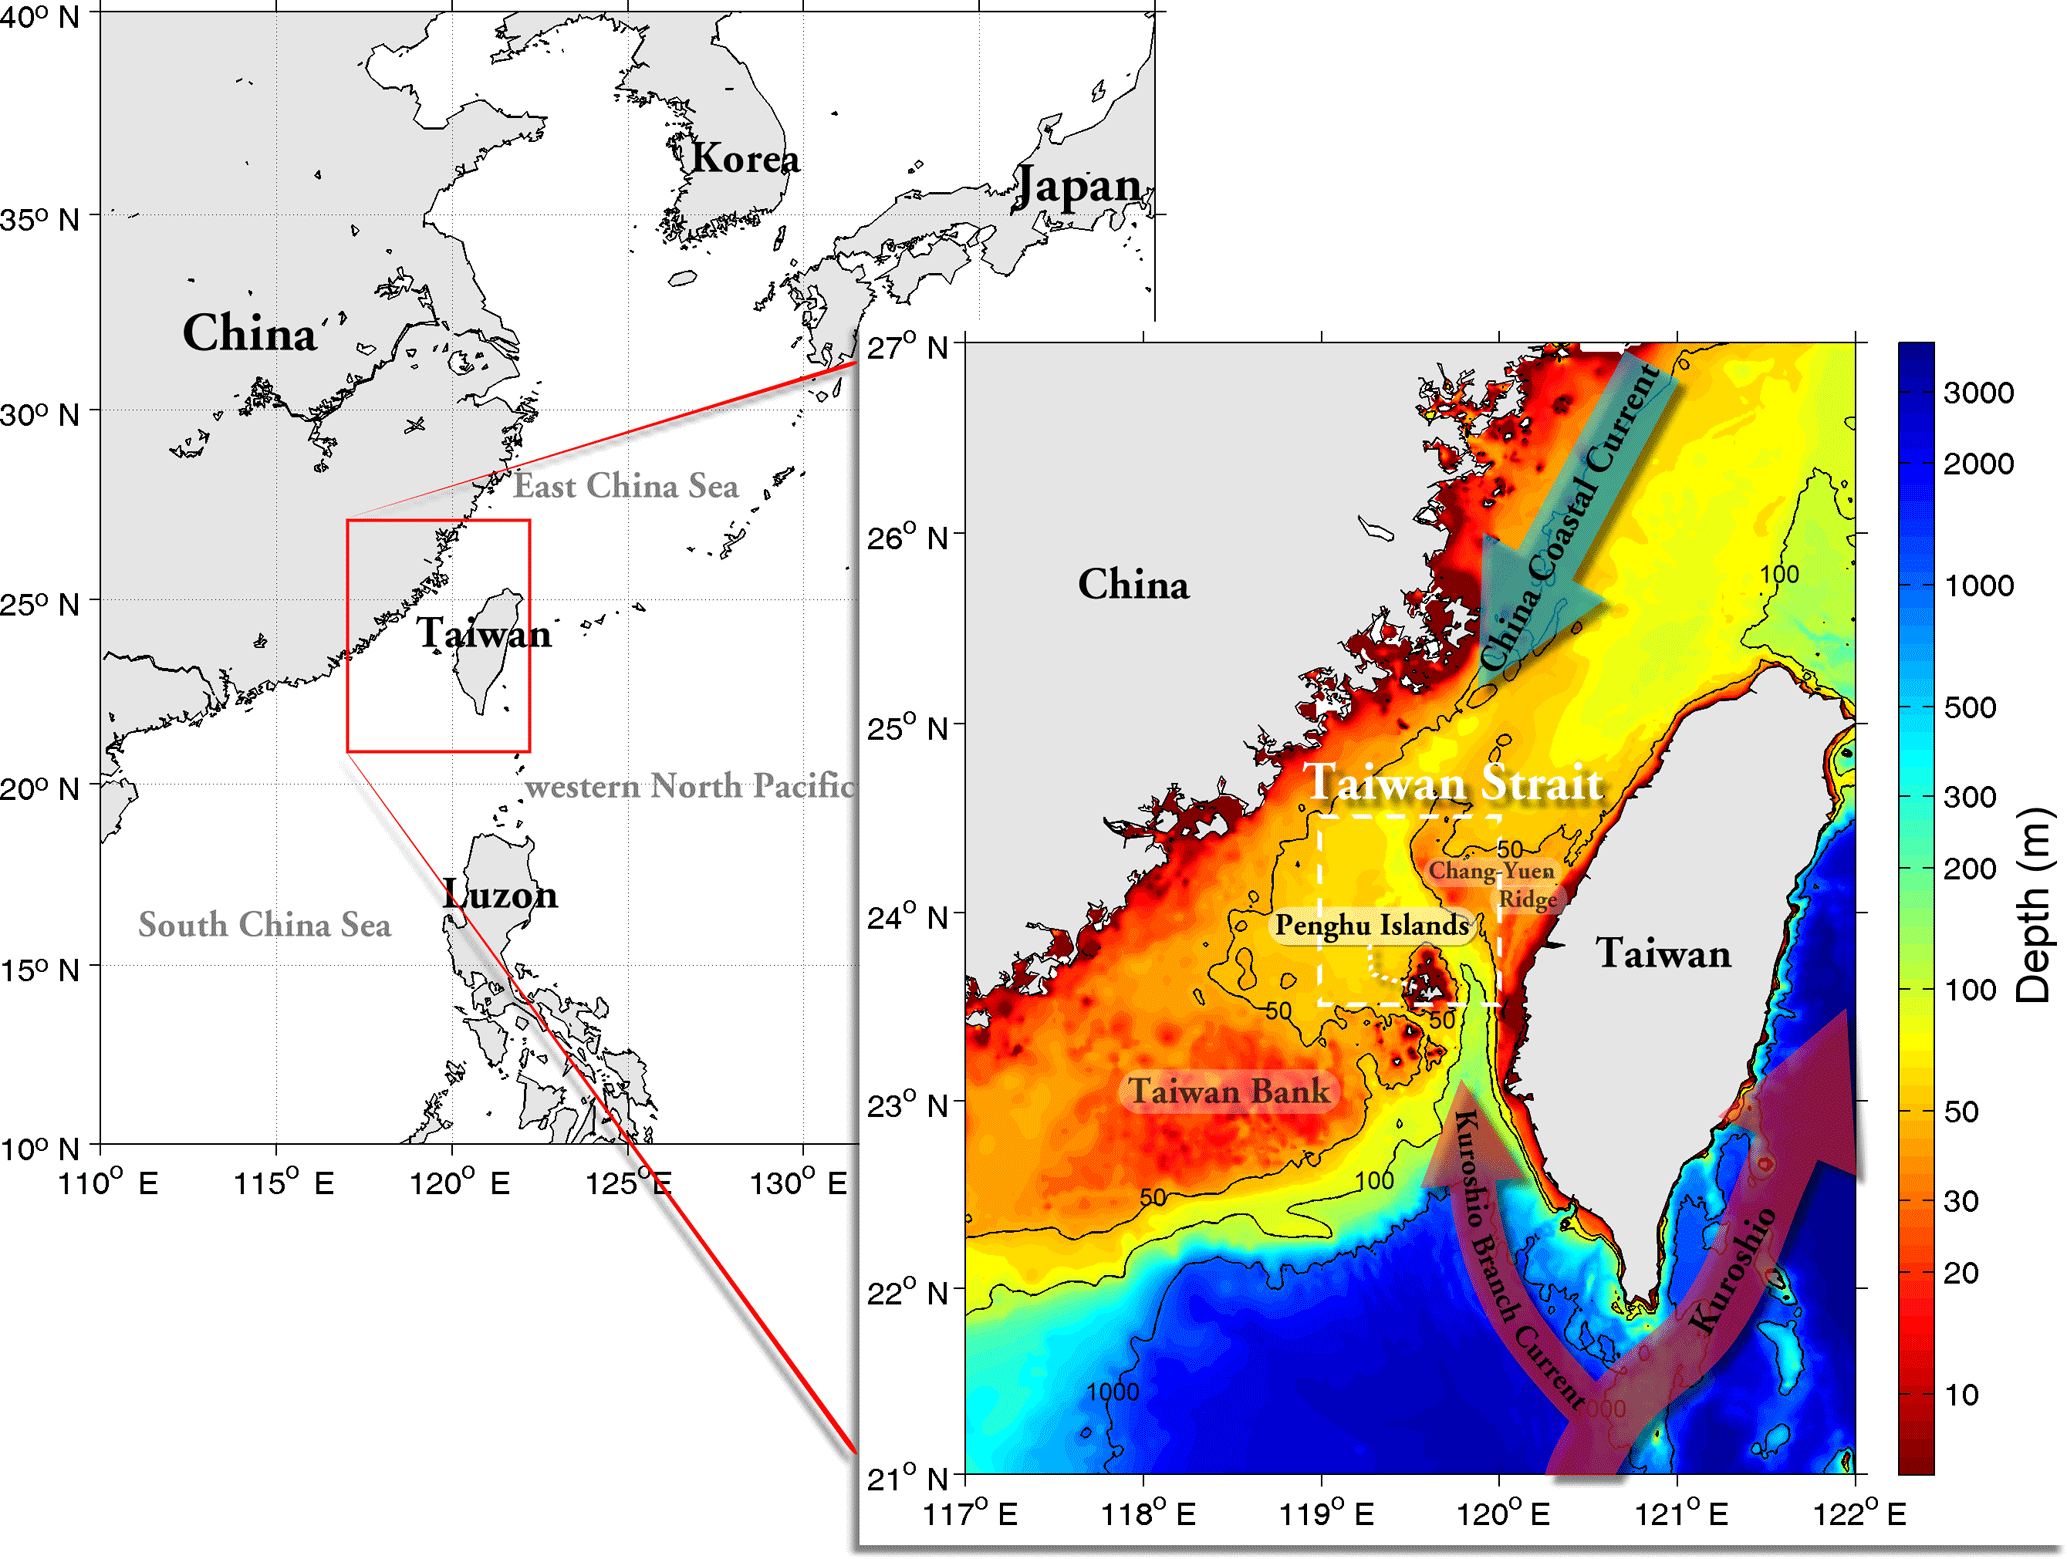
Figure 1Bathymetric chart (shaded color) and sketches of the China Coastal Current, Kuroshio, and Kuroshio Branch Current.
El Niño–Southern Oscillation (ENSO), which develops in the tropical Pacific and is caused by the mediation between surface wind stress and sea surface temperature (SST) variations (McPhaden et al., 2006), is an interannual climate fluctuation. Although ENSO originates in the tropical Pacific, it significantly influences patterns of weather variability worldwide, shifting the probability for droughts, floods, heat waves, severe storms, and extreme events (e.g., Alexander and Scott, 2002; Philippon et al., 2012). It is known that the cold phase of ENSO, La Niña, tends to intensify the East Asian winter monsoon, which often accompanies strong northerly winds and sharp air temperature drops. By contrast, the warm phase, El Niño, suppresses the East Asian winter monsoon (Wang et al., 2000; Lau et al., 2006). In addition, Kuo and Ho (2004) indicated that the stronger northeast monsoon during a La Niña winter may modulate the sea surface currents in the TS and further cause the lower SST. For example, the southward water transport was larger and the water in the TS was generally colder in November 2000 (La Niña winter) than that in 2002 (El Niño winter). The predominance of the cold China Coastal Current and the weakness of the warm Kuroshio Branch Current resulted in the water temperature of the TS decreasing in the early winter of 2000 (Wu et al., 2007). By contrast, when El Niño broke out in the winter seasons from 1997 to 1998, the warm water area (2 ∘C above the regional mean) in the TS increased by 25 % and nutrient concentrations decreased (Shang et al., 2005). Zhang et al. (2015) suggested that less Kuroshio water enters the southeastern TS during La Niña than El Niño events, which might modulate the interannual variability in SST in the TS. However, less severe but longer lasting phenomena, such as SST variability, may have catastrophic consequences or can be a trigger for other threats (Ustrnul et al., 2015). For example, the extreme cold or hot temperature can threaten life on earth and may even trigger a disaster (Mora and Ospina 2002). Previous studies have identified a correlation between local wind and circulation in the TS, and they have suggested that a La Niña winter would be a weather condition supporting cold-event occurrences, which are more likely to trigger cold disasters in the TS.
In the winter of 2008 (December 2007 to February 2008), exceptionally cold water affected the southern TS and hit the marine natural resources around the Penghu Islands in the southwestern TS, causing damage to aquaculture and high fish mortality rates; this phenomenon is referred to as “cold disaster”. Cold sea temperatures below the critical minimum for fish could lead to a high fish mortality (Hsieh et al., 2008). The death of wild fish was at least 73 t, and 80 % of cage aquaculture fish were damaged (Chang et al., 2013). Chang et al. (2009) used satellite SST images around the Penghu Islands to show that the minimum SST (12.6 ∘C) in February 2008 was lower than the February climatological temperature (20 ∘C). The strong northeast monsoon in the winter of 2008, associated with La Niña, may drive the cold China Coastal Current to intrude more southward into the southern TS and can even suppress the northward warm Kuroshio Branch Current intruding the TS (Chen et al., 2010; Lee et al., 2014). Liao et al. (2013) suggested that the cold disaster in 2008 can be divided into three stages: first, the branch of the China Coastal Current moved cold water from the western strait to the central strait; then, a strong northeast wind intensified the southwest current; and finally, cold water gradually retreated to the north due to weakened wind.
Specifically, cold disaster in historic records happened not only in 2008 but also in 2000 (Lu et al., 2012) and in 2011 (Chang et al., 2013). The cold disaster in 2008 is the most serious event among other events occurring in the Penghu Islands. Thus, reducing the negative consequences of damage is a major concern. Although numerous studies on the single event of a cold disaster in 2008 have been performed using satellite-recorded data and numerical models, there is no operational system for rapidly transmitting current information on potential sea threats to maricultureists or citizens at large. The main purposes of the current study are to assess the predictability of exceptionally cold water, that might potentially trigger a cold disaster in the TS, and to present a feasible warning system with respect to marine hazards around the Penghu Islands.
The optimum interpolation daily SST dataset from the National Oceanic and Atmospheric Administration (NOAA) are calculated from blended analyses, which is derived by combining multi-satellite data, ship observations, and buoy data (Reynolds et al., 2007). The dataset is averaged onto a 0.25∘ × 0.25∘ spatial grid and covers the period from 1981 to the present; however, the current study used only the data from January 1995 to May 2017. In this study, we confined the analysis to the 60 coldest days of winter based on the climatologically averaged SST (1 January–1 March in regular years, and 1 January–29 February in leap years; Supplement Fig. S1). During these climatologically coldest days of winter (hereafter referred to as just “winter days”), further cooling days may be expected to have the greatest implications for aquaculture.
The influence of temperature on fish is important not only in the surface layer but also in the subsurface layer. Although the methodology in the study is based on SST, it is expected that the water column is well mixed in the vertical due to shallow bathymetry in the TS and the strong wind in winter. An insignificant temperature difference between surface and subsurface in this region (< 1.2 ∘C) is shown by the climatological temperature profile (Supplement Fig. S2) during winter (averaged in December to February 1985–2017) near Penghu Islands (23.75∘ N, 119.75∘ E). Thus, SST could be a suitable indicator depicting the water temperature of whole layers.
The Oceanic Niño Index (ONI) values, defined as a 3-month running mean of SST anomalies in the region of 5∘ N–5∘S and 120∘ W–170∘ W, are taken from NOAA Climate Prediction Center (CPC; https://goo.gl/V6CtMD, last access: April 2018). The values are used for classifying the ENSO cycle into El Niño (ONI ≥ 0.5 ∘C) and La Niña (ONI ≤ −0.5 ∘C) (Huang et al., 2015). In addition, the daily surface wind fields used in this study were derived from the National Centers for Environmental Prediction global analyses at 2.5∘ spatial resolution and can be applied from 1980 to the present, which was downloaded from https://www.esrl.noaa.gov/psd/data/gridded/data.ncep.html (last access: 1 December 2017).
The cold disaster is a biological or ecological response to low water temperature as defined in the introduction. The critical temperatures inducing death of different fishes are not consistent. Chang et al. (2013) indicated that the activity of reef fish declines at water temperatures lower than 16 ∘C. Feeding activity of Cobia, a major species of cage aquaculture fish around Penghu Islands, declines lower than 18 ∘C and fish may die lower than 15 ∘C (Lu et al., 2012). The sophisticated prediction for the cold disaster requires understanding of the detailed physical and biological processes and will need information about marine resources. Unfortunately, we don't have data associated with a marine resource or aquaculture production. The most relevant information is the date of occurrence of cold disasters in 2000, 2008, and 2011, indicated from the previous literature (Chang et al., 2013; Lu et al., 2012). Therefore, we will not focus on exploring the value of critical temperature. Instead, a goal of this paper is to develop a warning system to predict the exceptionally cold water around the Penghu Islands in the southern Taiwan Strait. It is expected that the presence of the exceptionally cold water points to the high possibility of the occurrence of a cold disaster (referring to the events of a large amount of fish death).
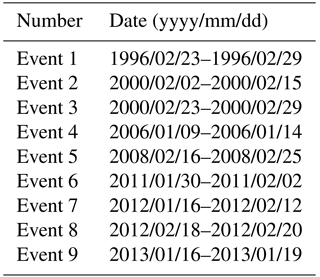
During the winter days (60 coldest days of winter as defined in Sect. 2), further cooling days are expected to cause the exceptionally cold water which may have the greatest implications for aquaculture (hereafter referred to “cold water days”). This study focused on hindcasting the occurrence of cold water days during the winter days. Noting that the long-term observations of water temperature around the Penghu Islands are absent (∼ 20-year time series needed), the cold water days were characterized by remotely sensed SST anomalies (SSTA) lower than a threshold (SSTA < −2.5 ∘C, i.e., SST <17 ∘C). SSTA is a deviation from the daily climatological average (Supplement Fig. S1) and the threshold is estimated by 1.6 times the standard deviation (approximately 95 % confidence interval of the normal distribution) of SSTA. To obtain a quantity representative of the magnitude of low SSTA, we selected the target area as a box in 23.5–24.5∘ N and 119–120∘ E (the white dashed rectangle in Fig. 1), mainly off the northern side of Penghu Islands, covering the coolest SST deviation feature in Fig. 3c, and a high correlation (r=0.94, p < 0.05) with observational water temperature (Supplement Fig. S3). Figure 2 shows the time series of SSTAs and highlights the SSTAs for the winter days (dots in Fig. 2a) from 1995 to 2017. Moreover, three or more consecutive cold water days were grouped into cold events; if any cold events were less than 4 days apart, they were grouped into the same event. According to these definitions, 1380 winter days of the study period, 95 cold water days and a total of 9 cold events (triangles in Fig. 2; Table 1) were observed. All of the cold events revealed in Fig. 2 were determined to occur during the La Niña events. Furthermore, the cold phase peak of ENSO tends to occur toward the end of a year and a lag correlation reflects the cold events in January–February after the negative peak of ENSO. A similar lag correlation (0–6 months) between rainfall anomalies and ONI values during the La Niña events was observed in the western Pacific (Wang et al., 2000). Kuo et al. (2017) indicated SST in the TS was warming with a trend of about 0.15 ∘ C year−1 during the period between 1980 and 2000. The possible interaction between the warming trend and cold events is unclear at this moment. However, the long-term trend of SST in the target area is gentle and its influence is insignificant (0.01 ∘C year−1) during our studying period of 1995–2017.
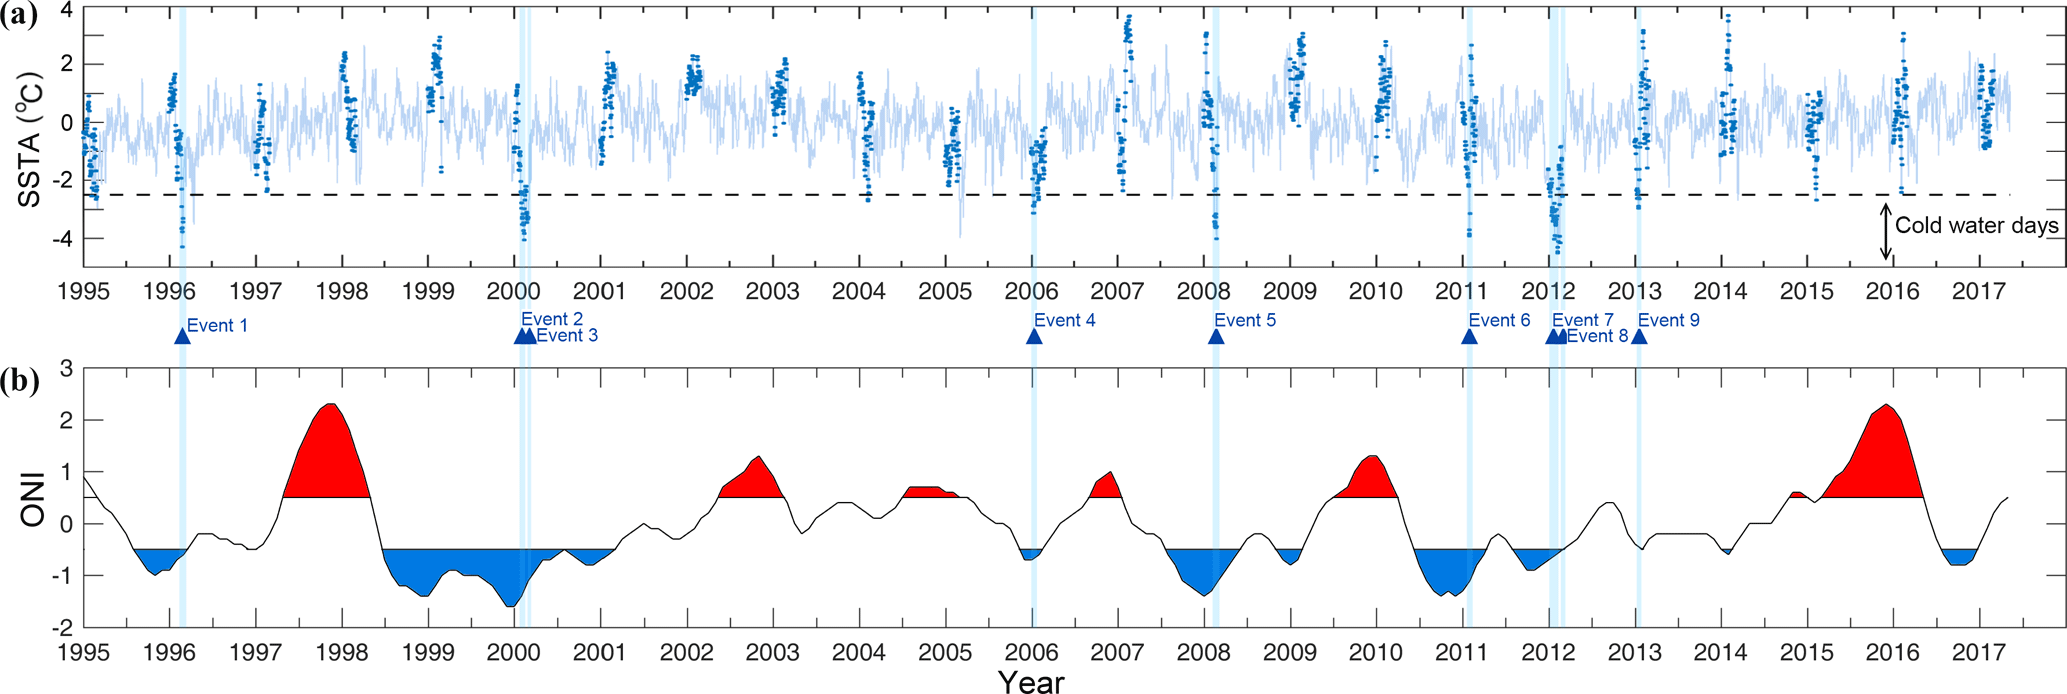
Figure 2(a) Time series of SSTAs (shading line) and that during the winter days are highlighted in dots. The dashed line denotes a magnitude of 1.6 times the standard deviation below the mean SSTA. (b) ONI time series within January 1995 and May 2017. Positive anomalies (≥ 0.5 ∘C, shaded red) indicate El Niño events, and negative anomalies (≤ −0.5 ∘C, shaded blue) indicate La Niña events. Blue bars and triangles denote the occurrences of cold events.
To clarify the interannual variability in cold events in the southern TS, we performed composite analyses of SST and surface wind fields for the winter days from 1995 to 2017. The spatial pattern of the long-term average for winter days was observed to show a moderate SST belt extending from southwest to northeast, and an isotherm of nearly 18 ∘C across the northern Penghu Islands was revealed to separate the colder water in the west from the warmer water in the southeastern TS (Fig. 3a). The cold-water China Coastal Current flows southwestward along the coast of China and meets the warm-water northward Kuroshio Branch Current near the Penghu Islands, forming a strong sea temperature front. The SST variability is obviously affected by the delicate balance between the southward China Coastal Current and the northward Kuroshio Branch Current, both of which are associated with the magnitude of the northeast monsoon (Kuo and Ho, 2004). Wind fields around Taiwan are strictly dominated by the East Asian monsoons. Wind data derived from weather stations across the TS (Jan et al., 2006) showed that a northeast monsoon occurs from September to the following May and that a southwest monsoon occurs during the rest of the year. During the winter days, the northeast monsoon dominates the environmental conditions around Taiwan (Fig. 3d), which illustrates it can drive the cold SST front into the southern TS.
Figure 3b, c show the SST deviation relative to the long-term average for the winter days. The SST across the TS was observed to get warmer along the China coast (Fig. 3b) when the northeast monsoon was weakened during the El Niño events, thus resulting in the wind anomaly fields illustrating southwest wind (Fig. 3h). By contrast, a negative SST deviation is shown to dominate all of the TS and to expand into the southern Penghu Islands during the La Niña events (Fig. 3c). The lowest deviation was approximately −0.6 ∘C near the central TS. In addition, a positive deviation regarding northeast wind was observed (Fig. 3i), which may intensify the northeast monsoon. The stronger wind generating turbulence mixing would likely lead to increased air–sea heat fluxes (Fig. 3f) and would substantially affect the extent of cold water in the TS. Figure 3d–f show surface total heat fluxes provided by NCEP/NCAR 40-year reanalysis project (Kalnay et al., 1996). More heat energy can be transferred from the ocean to the atmosphere in the La Niña (Fig. 3f) than that in the El Niño (Fig. 3e). These results imply that the SST variability in the TS is strongly associated with the ENSO cycle. Given the environmental conditions, exceptionally cold water is more likely to affect the southern TS and more potentially trigger cold disaster during La Niña than during El Niño events.

Figure 3Composite of SST (a–c), surface total heat fluxes (d–f), and surface wind fields (g–i) for (a, d, g) average winter days, (b, e, h) El Niño deviation, and (c, f, i) La Niña deviation. Only deviations above the 95 % confidence level are shown. Positive heat flux values represent heat energy gain to the atmosphere.
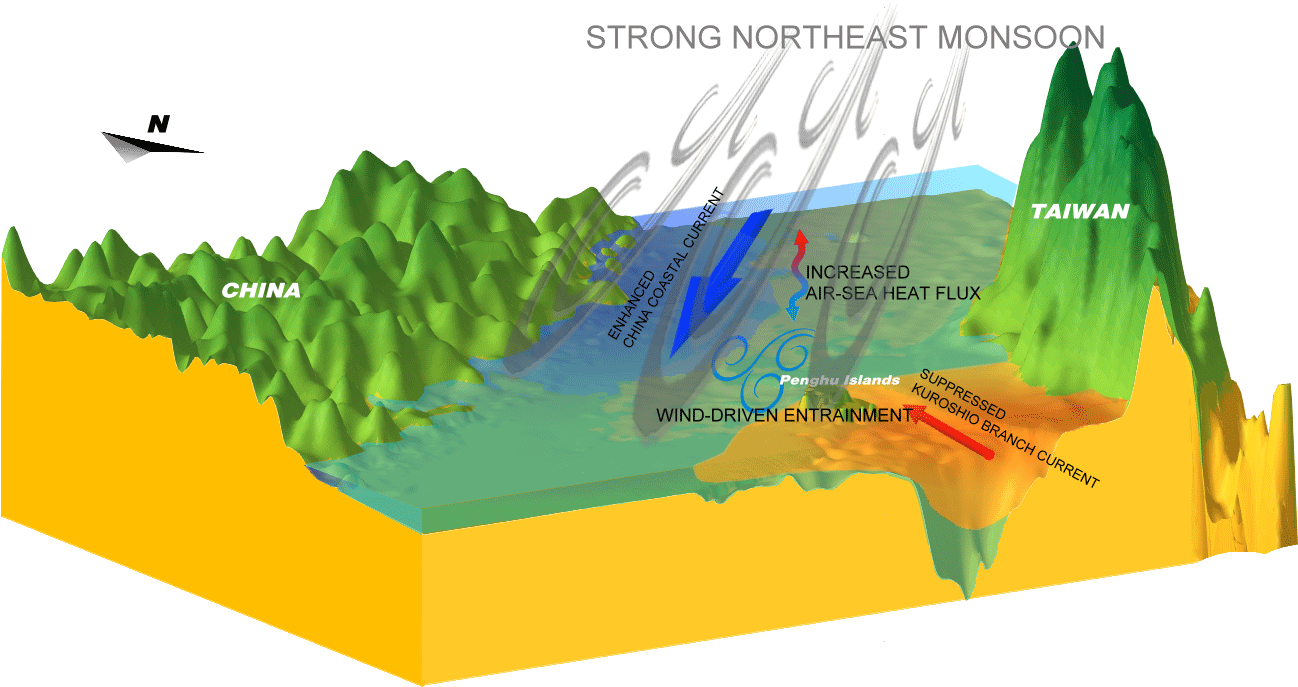
According to the above results, we summarize two possible physical mechanisms for triggering cold events in the TS. One is the balance between the southward China Coastal Current and the northward Kuroshio Branch Current, and the other one is local wind-driven entrainment. However, both processes are associated with the magnitude of wind. During the La Niña events (Fig. 4), a northeast monsoon dominates the environmental conditions around the TS with strong wind stresses. The cold China Coastal Current will have more chance to intrude into the southern TS and the warm Kuroshio Branch Current will even be suppressed by strong southwestward winds. In addition, strong wind stresses can drive turbulence mixing and enhance air–sea interaction to further cool the sea water across most of the TS. Therefore, ONI and local wind speed are used as prognostic indexes to find the cold days in the following sections.
4.1 Predicting by ONI
The results of the preceding analysis identify a significant correlation between cold water days and La Niña events. The association between them can be through the increased wind stress of the northeast monsoon, which may intensify the southwestward cold current. We extended this study by understanding the relationship with monthly ONI and evaluating the prediction skill as a function of lead time.
In this study, we primarily experiment with two-class prediction problems. The ENSO cycle was quantified using the ONI, and cold water days were predicted based on the ONI falling below a threshold. There are subsequently four possible results from the binary classification test: (1) the outcome predicted a cold water day is identical to the actual value (true positive, TP); however, (2) if the actual value is not a cold water day, it is classed as a false positive (FP). Conversely, (3) a true negative (TN) has been found while both the prediction state and the actual state are not cold water days; (4) the outcome predicted no cold water day is exactly opposite to the actual value (false negative, FN). For the following evaluations, an ONI of −0.9 was set as the threshold, and lead days were counted ahead of the cold day. For predictions at a 90-day lead time, ONI values below the threshold can be considered to correspond to the probability of cold water days occurring with a true positive rate (TPR, hit rate) of 72 % and a false positive rate (FPR, false alarm rate) of 15 % (the arrow in Fig. 5a). The hit rate is defined as (i.e., the percentage of cold water days which are correctly identified as having the condition), and false alarm rate is calculated as . In addition, we could examine the suitability of a threshold at a special lead time by an odds ratio, defined as . In the above case, the odds ratio was 14.8, which implies the probability of correct predictions is almost a 15-fold increase (the arrow in Fig. 5c).
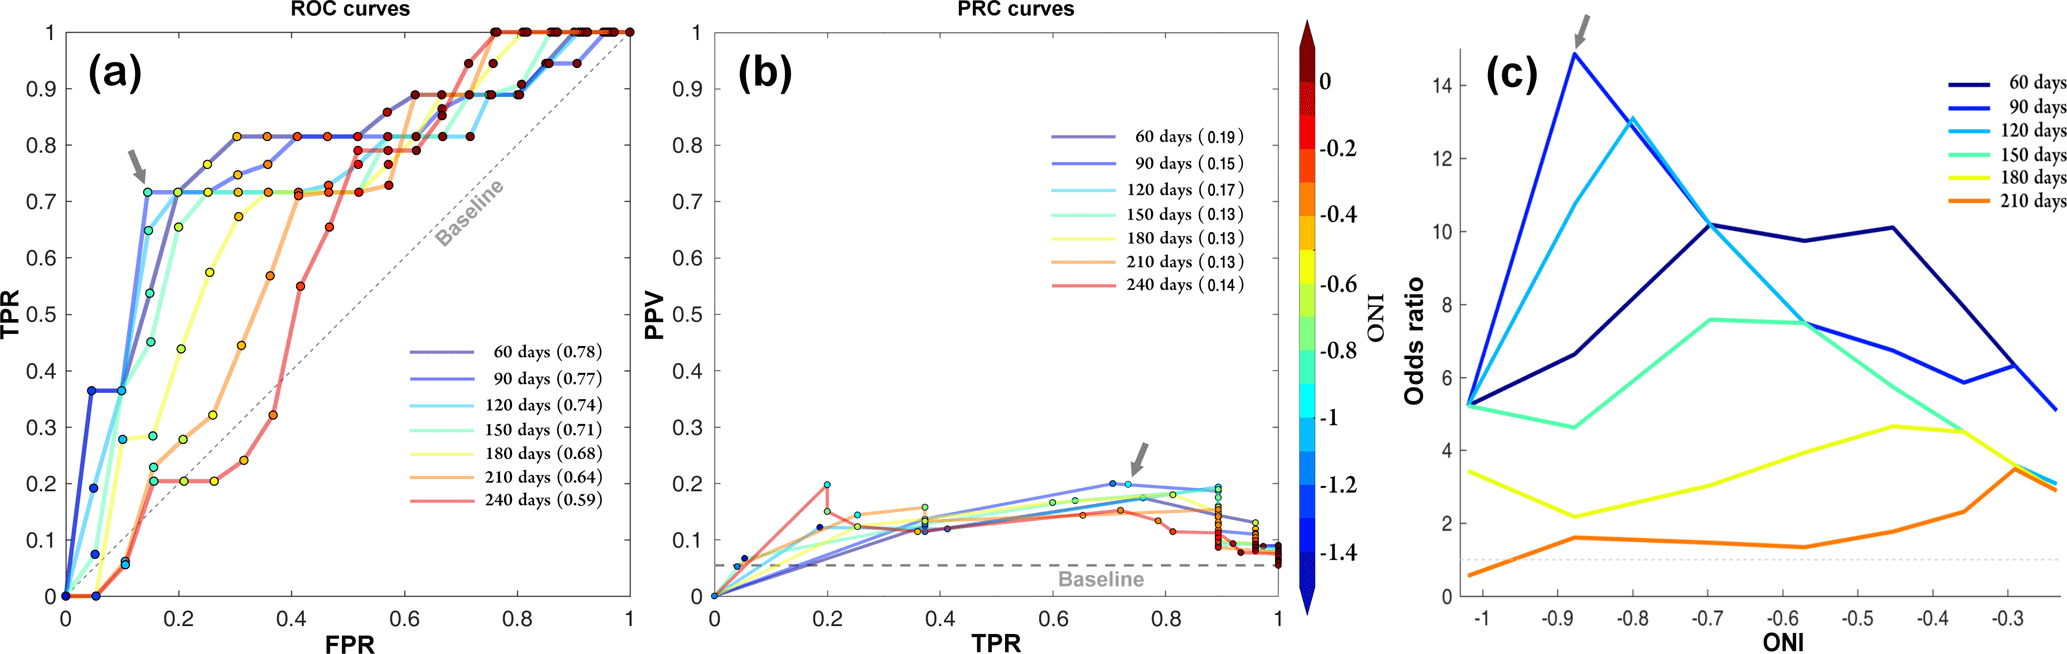
Figure 5(a) ROC curves for predicting cold water days at lead times of 60, 90, 120, 150, 180, 210, and 240 days using the negative ONI. Numbers in parentheses in the legend are ROC scores for each lead time. The thresholds used to calculate TPRs and FPRs are shown from the 100th (lower left squares) to the 0th (upper right squares) percentile of negative ONI in decrements of 5 %. ONIs at the dots are indexed by the color bar. ROC scores ≥ 0.6 indicate a significant (p < 0.05) proxy for predictability. (b) As in Fig. 5a but plotting precision-recall curves (PRC). The area under the curve (AUC) of PRC ≥ 0.15 indicate a significant (p < 0.05) proxy for predictability. (c) Odds ratios vary with ONI thresholds at lead times of 60, 90, 120, 150, 180, 210, and 240 days. The arrow denotes the point with a −0.9 threshold at a 90-day lead time.
Depending on the tolerance for the TPR and FPR, the choice of threshold for a prediction can be varied; more negative ONI thresholds reduce both the TPR and FPR. This trade-off is presented by relative operating characteristic (ROC) curves (Hanley and McNeil, 1982) that represent the relationship between the TPR and FPR as a function of threshold (Fig. 5a). The ROC curves are quantified by integrating the area under the curve (AUC), called ROC score or AUC. The score is used as the proxy throughout the analysis because it is appropriate for assessing unusual events (Stephenson et al., 2008; McKinnon et al., 2016). When a ROC score is higher, it would be a more discriminating prediction method. In this study, the skill of the ONI-based prediction was shown to peak at a lead time of 60 days, with a ROC score of 0.78, and generally decreased with increasing lead time. Moreover, significance can be estimated through the creation of a null distribution of the quantity of interest by using a block bootstrap (McKinnon et al., 2016), and significant results above the 95 % confidence level are presented throughout this article. We considered a ROC score greater than 0.6 to be statistically significant in the predictions of cold water days. As shown in Fig. 5a, ROC scores decreased with lead time and were no longer significant by a lead time of 240 days. Notably, the ONI provided by NOAA CPC was estimated according to the 3-month running mean of monthly SSTAs in the Niño 3.4 region (5∘ N–5∘ S, 120∘–170∘ W). Because of the running mean needed, the ONI value has a delay time of 2 months; in other words, the latest ONI value obtainable in December is the value for October. Hence, the ONI-based prediction of cold water days can actually be employed with a lead time of 0–150 days. For simplicity, we still used the time of the ONI ahead of the cold water days to describe the lead time in the subsequent analysis.
Further, Saito and Rehmsmeier (2015) indicated the precision-recall curves (PRC) could be more informative than the ROC curves on imbalanced datasets. PRC is a trade-off between positive predictive values (PPV), defined as , and TPR. Therefore, we also use the PRC to examine the predictability of cold water days (Fig. 5b). Although the baseline of ROC is fixed, the baseline of PRC is decided by . As a result, the baseline is PPV = 0.07 (a gray dashed line in Fig. 5b) and the prediction of cold water days become significant when the AUC of PRC is greater than 0.15. The results show that cold water days could be predicted with a lead time of 60–120 days, shorter than the ROC method (60–210 days).
4.2 Predicting by wind
The relationship between wind stress and cold water can be understood through local wind-driven entrainment, whereby a strong La Niña episode results in an enhanced winter monsoon and strong wind stress increases turbulent mixing in favor of heat fluxes.
We next focused on the relationship between wind speed and the probability of cold water days. Wind speed variability across the TS could be quantified using an average wind speed (AWS) over a pre-specified period. The AWS was calculated using averaged periods of 1 to 30 days, and the correlation coefficients between AWS and SSTAs are shown in Fig. 6a. The 10-day averaged period was observed to have the highest correlation with the SSTA variability, and the correlation coefficient was approximately −0.39 (p < 0.05). Therefore, we focused on the AWS with a moving-average period of 10 days in the subsequent analysis. Figure 6b shows that the water temperature dropped following a stronger AWS.
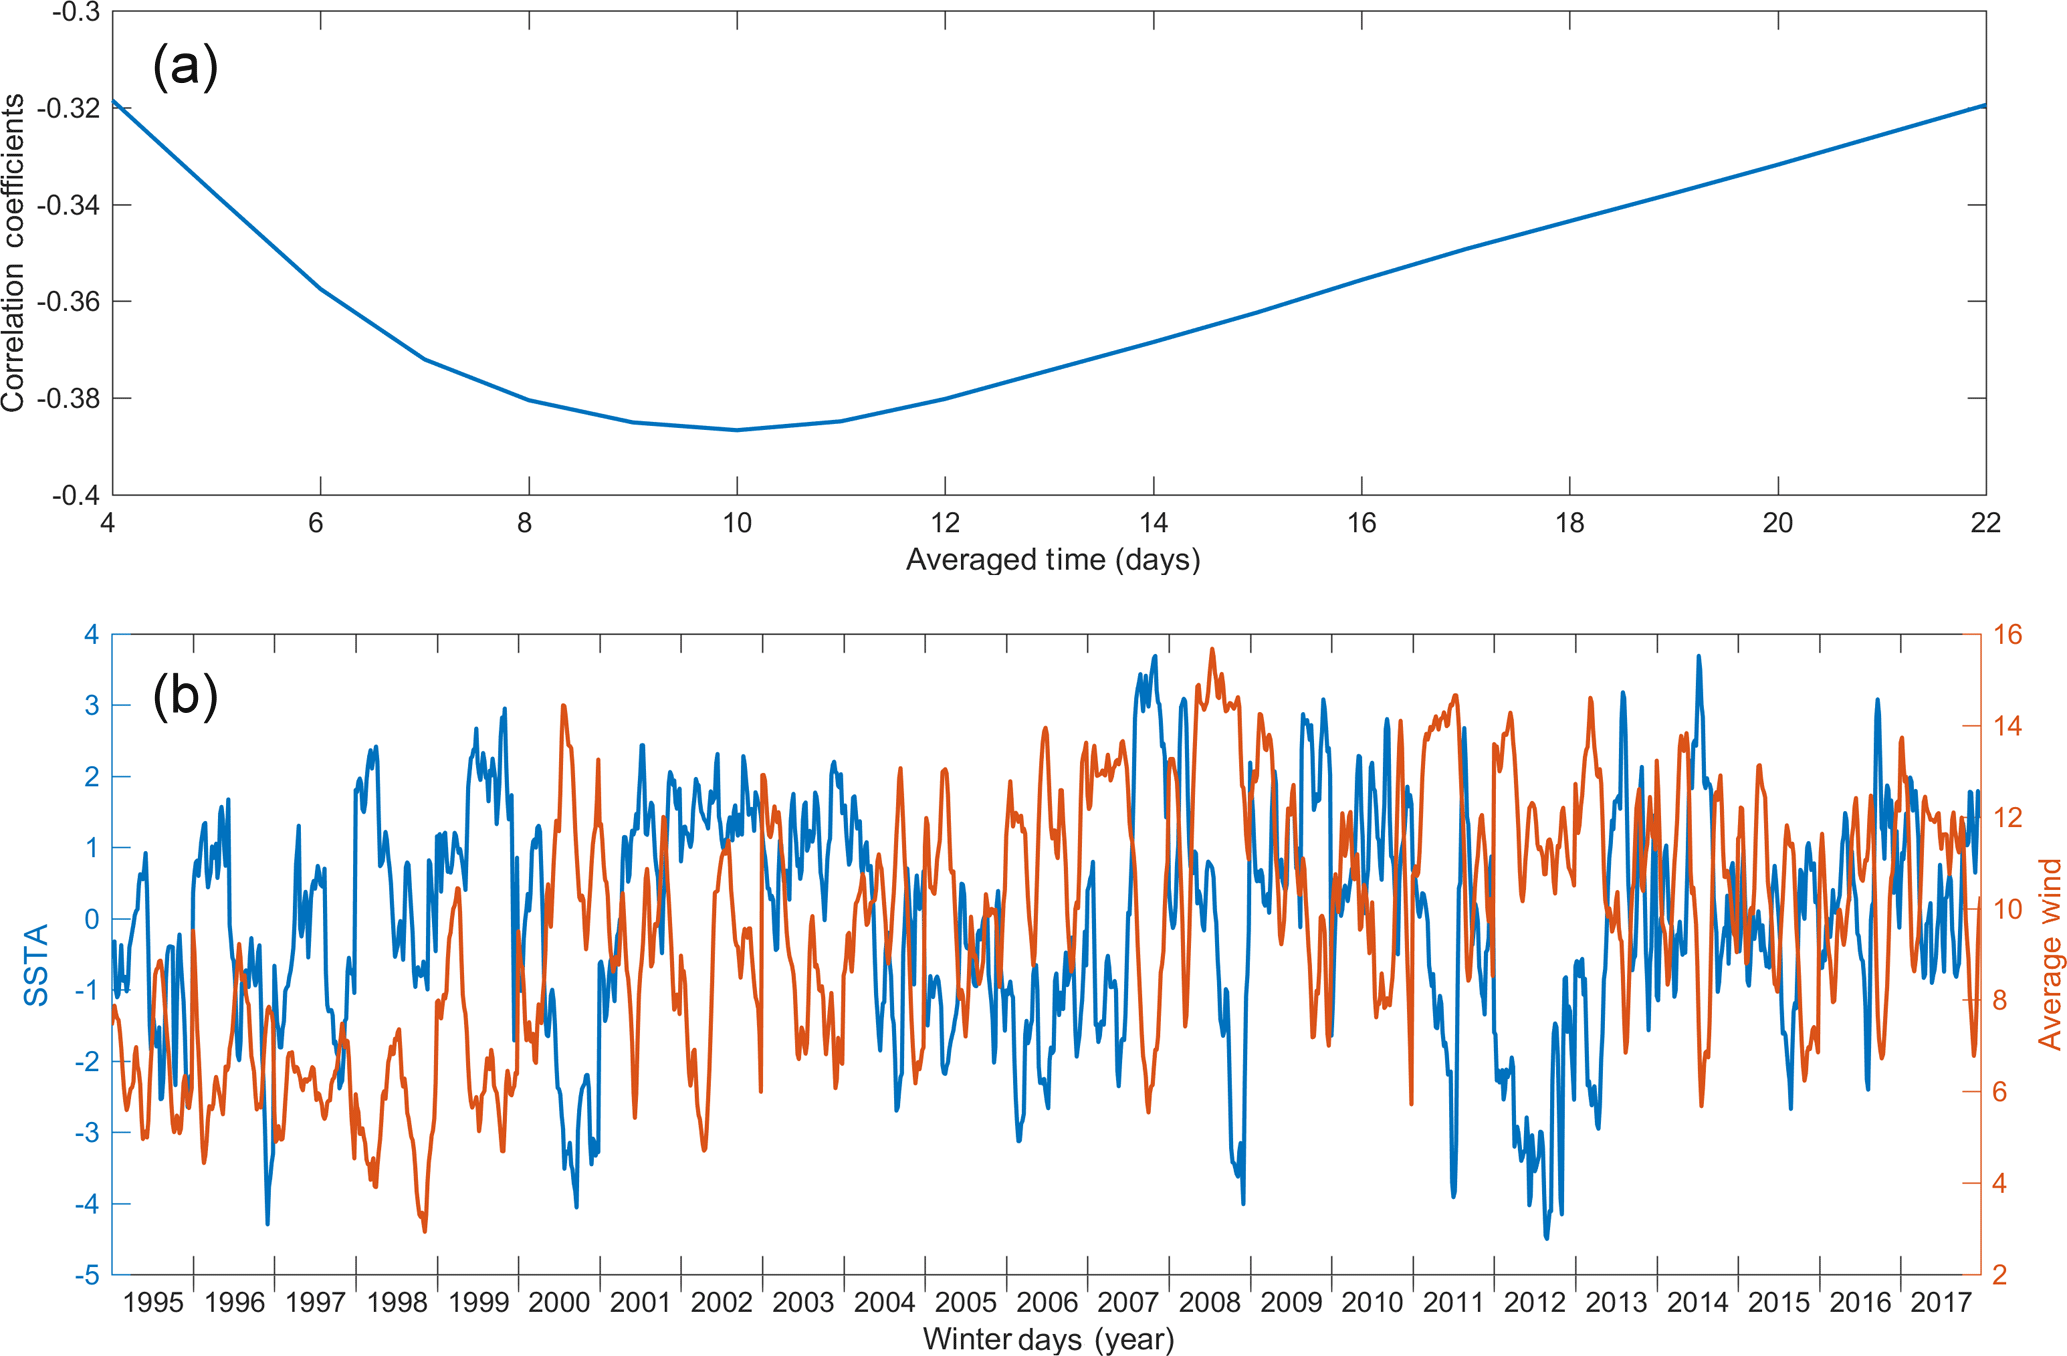
Figure 6(a) Correlation coefficients varied with integration time. (b) Time series during the winter days of SSTAs and AWS with an averaged time of 10 days.
As indicated by the ROC curves, the wind-based prediction had a ROC score of 0.8 at a lead time of 0 days, which is counted following the last day over which wind speed is averaged (Fig. 7). This result is consistent with the expected relationship between wind speed and sensible cooling. The wind-based predictions were observed to have significant prediction skill for lead times from 0 to 30 days (ROC score ≥ 0.6), and the prediction skill generally decreased with increasing lead time. For predictions at a 15-day lead time, the highest odds ratio (6.0) was determined using a threshold of 11.5 m s−1. An AWS below the special threshold was determined to correspond to the occurrence of cold water days with a TPR of 78 % and an FPR of 38 %. Moreover, the wind-based predictions were also examined through PRC (Fig. 7b). The results show that it has significant prediction skill for lead times from 0 to 25 days.
According to the analysis of predictability presented in the preceding section, cold water days can be predicted using the ONI for a long-lead prediction (60–120 days) and the AWS for middle- to short-lead predictions (0–25 days). We established a warning mechanism based on the ONI and AWS. The ONI-based prediction was employed to predict cold water days at a lead time of around 90 days. Hence, the ONI of −0.9, which engendered the highest accuracy (0.78) and odds ratio (14.8), was selected as the threshold. Moreover, the AWS-based prediction was employed for middle- and short-lead predictions. As shown in Fig. 8, the ROC scores varied with the integration periods and lead time. The prediction conducted at a lead time of around 15 days and an integration period of 10 days had a ROC score of approximately 0.74. The threshold was set at 11.5 m s−1 because this was observed to result in the highest accuracy (0.70) and odds ratio (6.0). In addition, the prediction conducted at a lead time of around 5 days and integration periods of around 20 days had higher ROC scores compared with those conducted at other integration periods. Regarding the prediction of cold water days at an integration period of 20 days, the prediction conducted with a threshold of 12.5 m s−1 had an accuracy of 0.76. Therefore, a warning mechanism could be established based on this analysis (Table 2). The three warning thresholds mean various degree of risk with a different probability of occurrence.
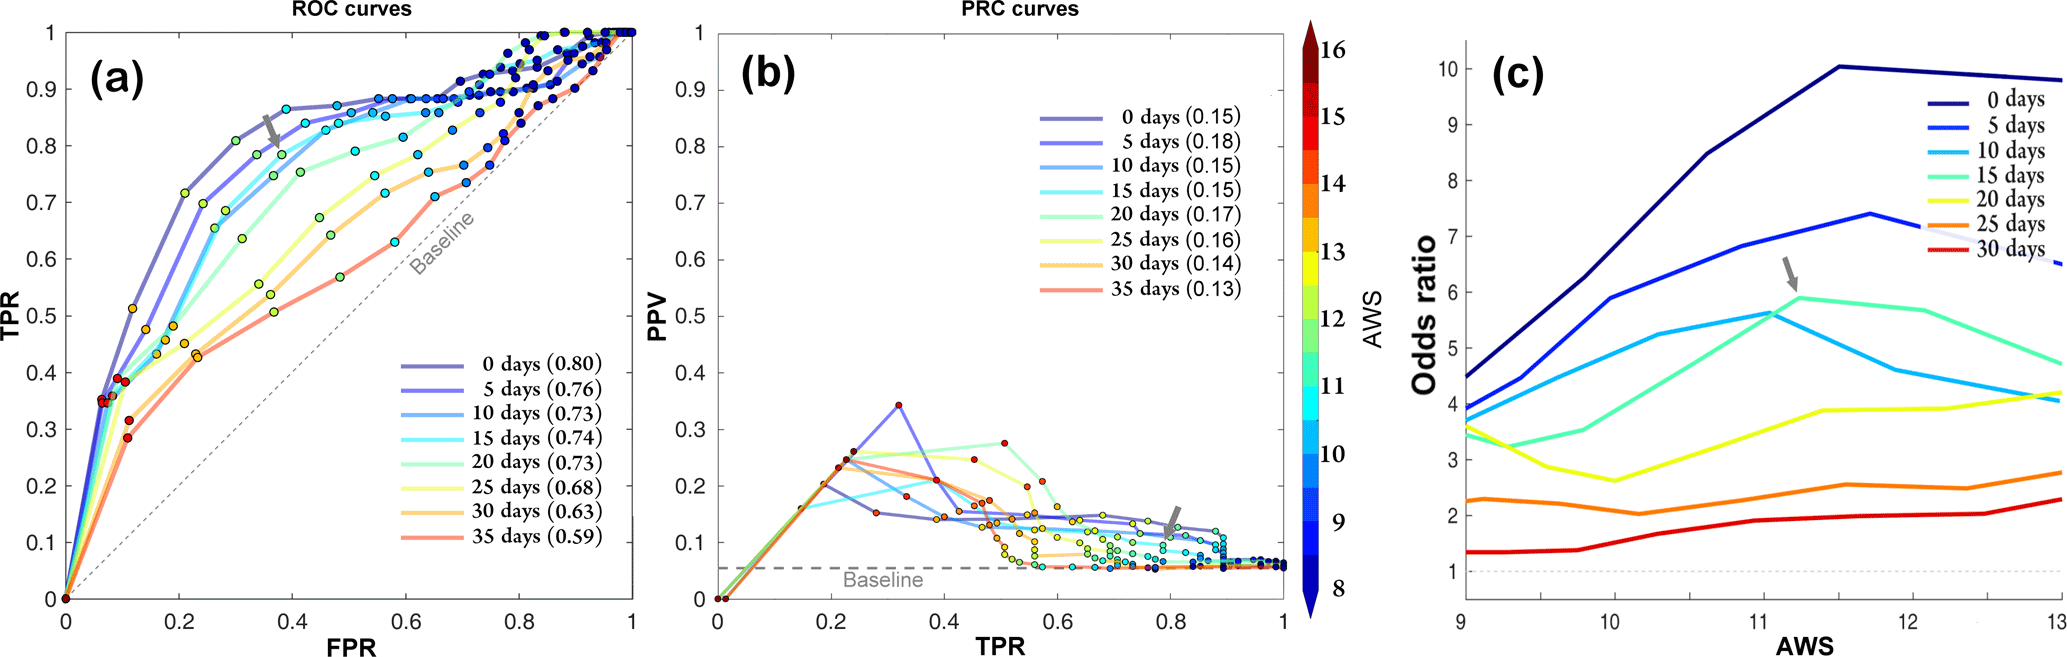
Figure 7As in Fig. 5, but for predictions of cold events at lead times of 0, 5, 10, 15, 20, 25, 30, and 35 days using the wind speed with an averaged time of 10 days. Arrows denote the point with an 11.5 m s−1 threshold at a 15-day lead time.
Table 2Warning thresholds suggested for exceptionally cold water days
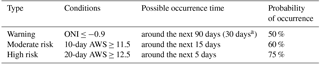
a real lead time considering when the ONI value can be obtained.
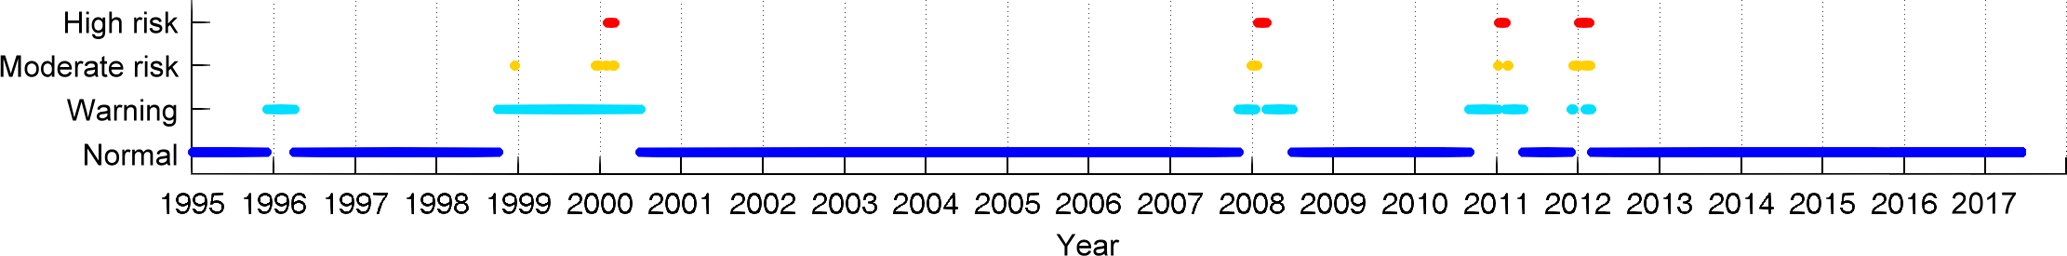
A hindcast of cold water days over the period 1995–2017 (Fig. 9) was obtained by using the warning mechanism in Table 2. The results clearly demonstrate high-risk warnings for the winters of 2000, 2008, 2011, and 2012. By monitoring the number of fish deaths around the Penghu Islands, Chang et al. (2013) and Lu et al. (2012) reported finding a large number of dead farmed fish in exceptionally cold water in the winters of 2000, 2008, and 2011. This agrees with the periods of high risk identified by this warning mechanism. Based on the results of hindcast and cold disasters in historic records (Chang et al., 2013; Lu et al., 2012), occurrence probabilities could be estimated within three warning thresholds (Table 2). For example, three of the high-risk years (red dots in Fig. 9) did indeed cause damage in historic records, indicating that the occurrence probability of damage is about 75 % within a high-risk warning.
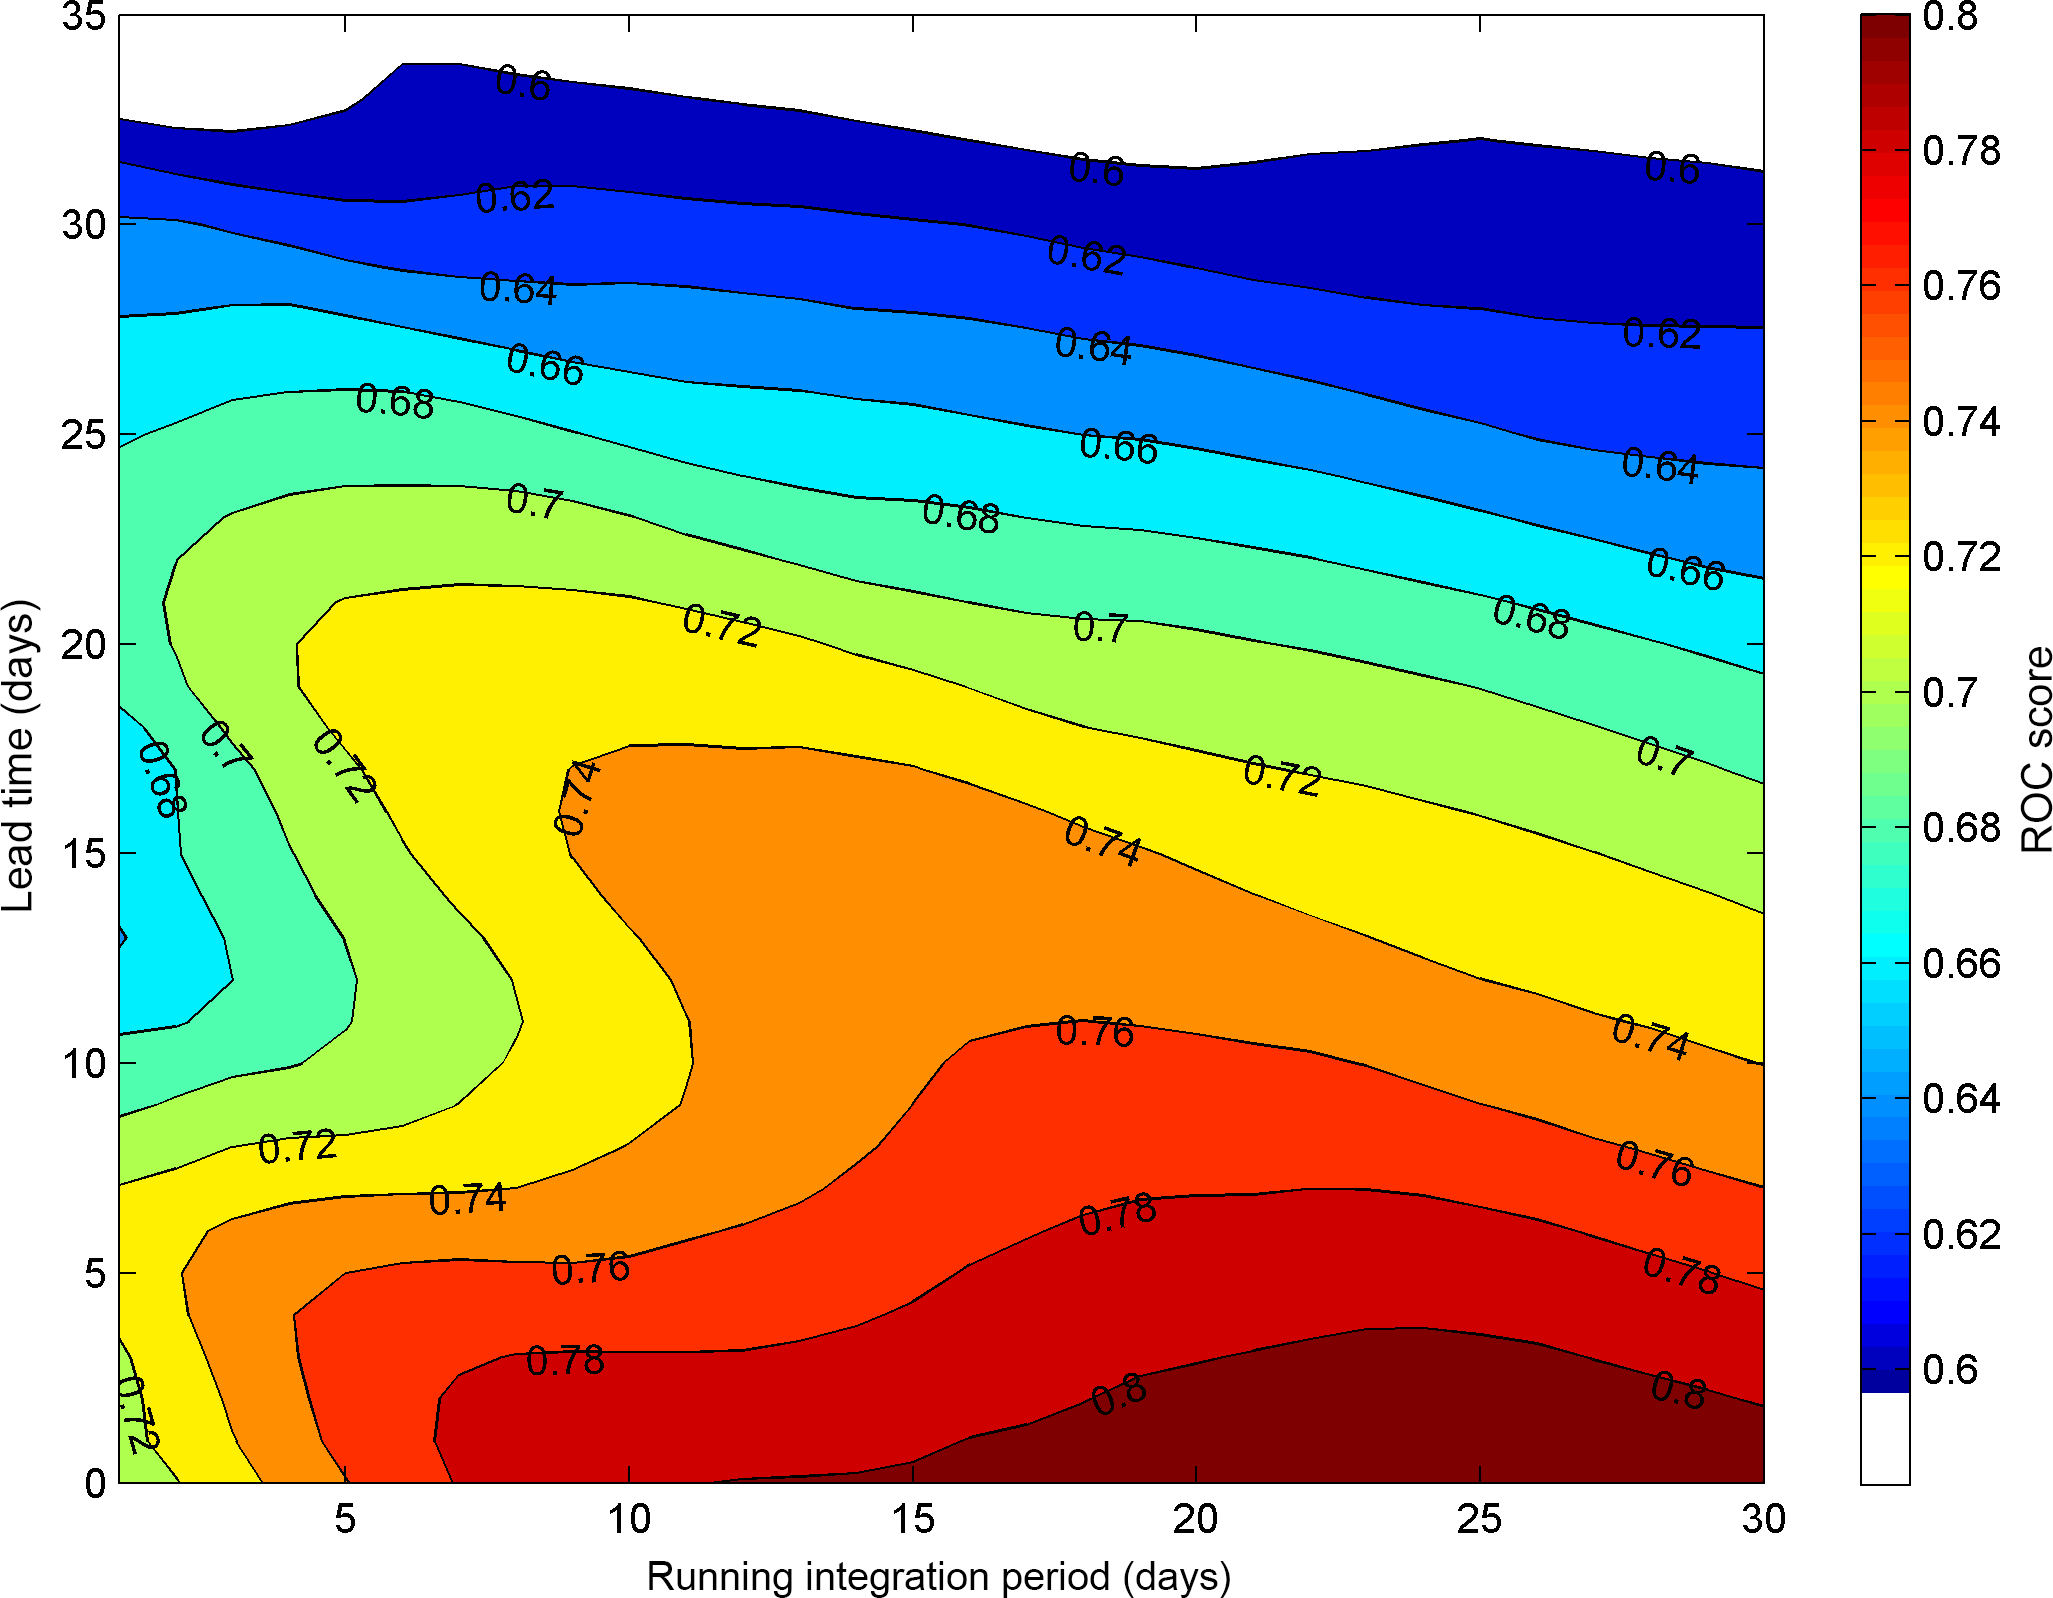
Figure 8ROC score diagram of AWS-based prediction. The white color masks nonsignificant regions, where ROC scores are below the 95 % confidence level.
To illustrate specific predictions that could be made using the warning mechanism, we conducted a case study for the winter of 2011. Figure 10 displays the developing process of a cold water event from six satellite SST maps. Before the occurrence of the cold water event, the SST in the TS was 16 ∘C (Fig. 10a). An obvious cold front crossed from the Taiwan Bank to the Chang-Yuen Ridge and approached the Penghu Islands. Cold water (approximately 14 ∘C) developed along the coast of China on 29 January 2011 (Fig. 10b), and it extended to the southern TS afterward (Fig. 10c, d). When the exceptionally cold water intruded into the southern TS, the Penghu Islands were surrounded by extremely cold water below 16 ∘C. Finally, at the end of the cold event, warmer water above 22 ∘C was re-established through the channel to the east of Penghu Islands (Fig. 10e, f), and the cold water gradually retreated to the north due to the weakening wind (Fig. 10g). Furthermore, observational SST from a buoy provided by the Central Weather Bureau of Taiwan (red star in Fig. 10a) was used to examine satellite SST. The temporal variation in satellite SST overall is similar to observational SST, but the magnitude of Satellite SST is often higher than that of observational SST (Fig. 10g). It should be noted that the coldest day detected by satellite SST have some time difference with the one detected by buoy SST. Even though the satellite SST used in this study is an optimum interpolation dataset combining multi-satellite data, the quality of SST is still low while over a long period with cloudy conditions. Most days of winter from December to February are often with a heavy coverage of clouds, and the quality of satellite SST is sensitive to water vapor in the atmosphere. Thus, high-quality satellite SST images are often not available in the TS during winter (Li et al., 2006). The result implies that observational water temperature is necessary when we would like to make a sophisticated prediction for the cold disaster. However, satellite SST in the target area could overall fit observational SST (r=0.94, p < 0.05; Supplement Fig. S3). It should be sufficient, for the present goal for this work, to develop a warning system to predict the cold water days in the southern TS. Furthermore, the SST variability was observed to be associated with the 10-day AWS in Fig. 10g. When the AWS remained at approximately 14 m s−1 from 10 January, the SST kept decreasing to approximately 14 ∘C until the AWS decreased on 2 February. After wind speed weakening, the SST around the Penghu Islands rose immediately, which agrees with the sequence of SST maps shown in Fig. 10d–f. A similar process was observed in the other cold events of 2000, 2008, and 2012.
SST measured by a buoy provided a means for examining the applicability of the warning mechanism. The buoy (red star in Fig. 10a) measures SST after January 2007. The observational period includes three extremely cold winters whose warning level reached high risk: 2008, 2011, and 2012. Winter 2008 has the severest cold event over the past decade and the minimum SST (approximately 11 ∘C) broke the record temperature, discussed in numerous previous studies (e.g., Chen et al., 2010; Liao et al., 2013; Lee et al., 2014). Through the application of the warning mechanism, the hindcast of the 2008 winter showed that a high-risk warning could precede the coldest water day by 19 days (Fig. 11b); similarly, the high-risk warnings for 2000, 2011, and 2012 could lead by 10, 22, and 26 days, respectively. It should be noted that the warning lights in Fig. 11 are only shown from January to February because cold disasters in historical records are almost happening in February.
Figure 11 shows SSTs in 2008 and 2011 are lower than those in 2000 and 2012. The lowest SST appears in February in most years except in 2012. The 10-day AWS stronger than 12 m s−1 mainly appears from January to February in 2000, 2008, and 2011, but appears from December to January in 2012; besides, AWS stronger than 14 m s−1 maintains a longer time in 2008 and 2011. The results imply damage could be more serious in 2008 and 2011 (mentioned by Chang et al., 2013 and Lu et al., 2012) than in 2000 (mentioned by Lu et al., 2012). However, SST in winter of these four years all can be lower than 16 ∘C (Fig. 11), which is cold enough to induce the death of caged fish around Penghu Islands (Chang et al., 2013). Notably, the SST variability over a ∼ 10-day period in February 2012 might be dominated by a sub-mesoscale process, which agrees with the higher correlation between the SST and 10-day AWS in Fig. 6a.
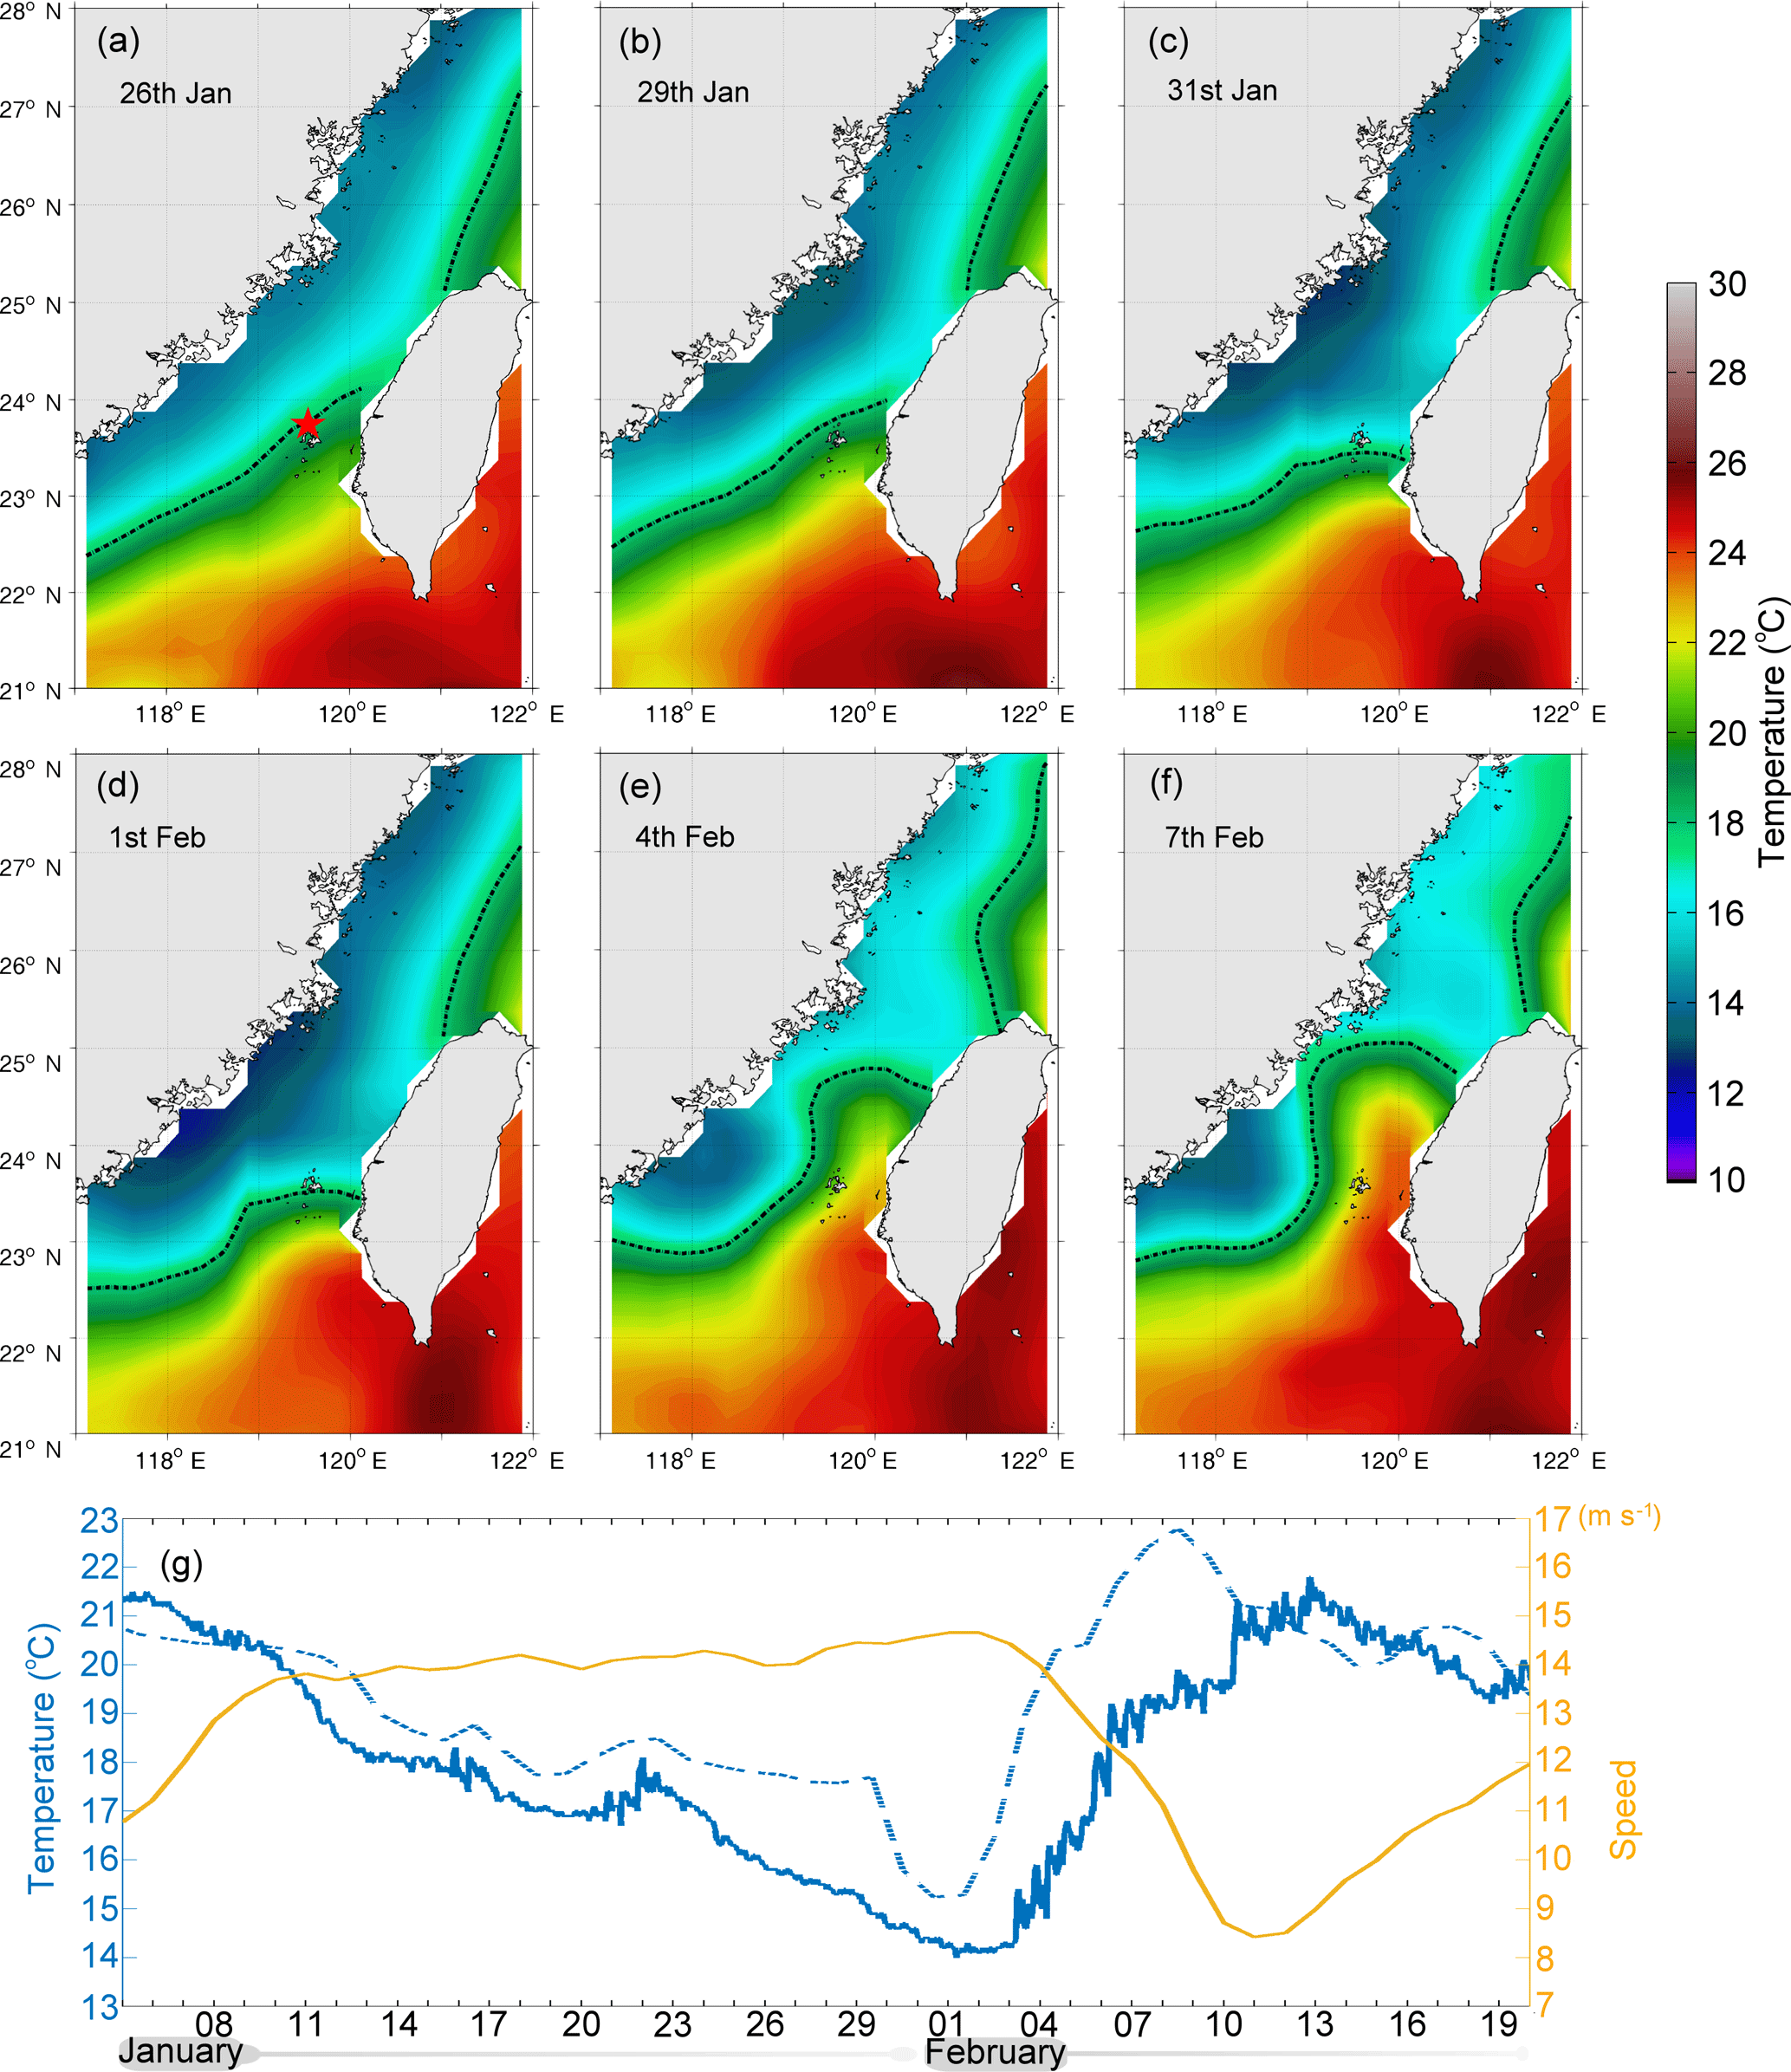
Figure 10A cold event in the winter of 2011. (a–f) A map sequence of satellite SST. The red star indicates the position of the buoy from the Central Weather Bureau of Taiwan. Dashed lines are isotherm lines of 18 ∘C. (g) Time series of satellite SST (blue dashed line), buoy SST (blue line), and 10-day AWS (yellow line) on the red star location from 5 January to 20 February.
We used optimum interpolation SST data to identify exceptionally cold water in the southern TS during the period 1995–2017. The results reveal a total of 107 cold water days and 9 cold events likely to trigger cold disasters in the TS. Cold water develops along the coast of China and extends to the southern TS with sustained strong winds. In addition, these exceptionally cold water days always occur during La Niña events, and climatological maps show that the SST and wind speed over the TS are extremely low and strong in La Niña winters compared with normal or El Niño winters. A correlation was also obtained for SSTAs and 10-day AWS, with a correlation coefficient of −0.39 (p < 0.05).
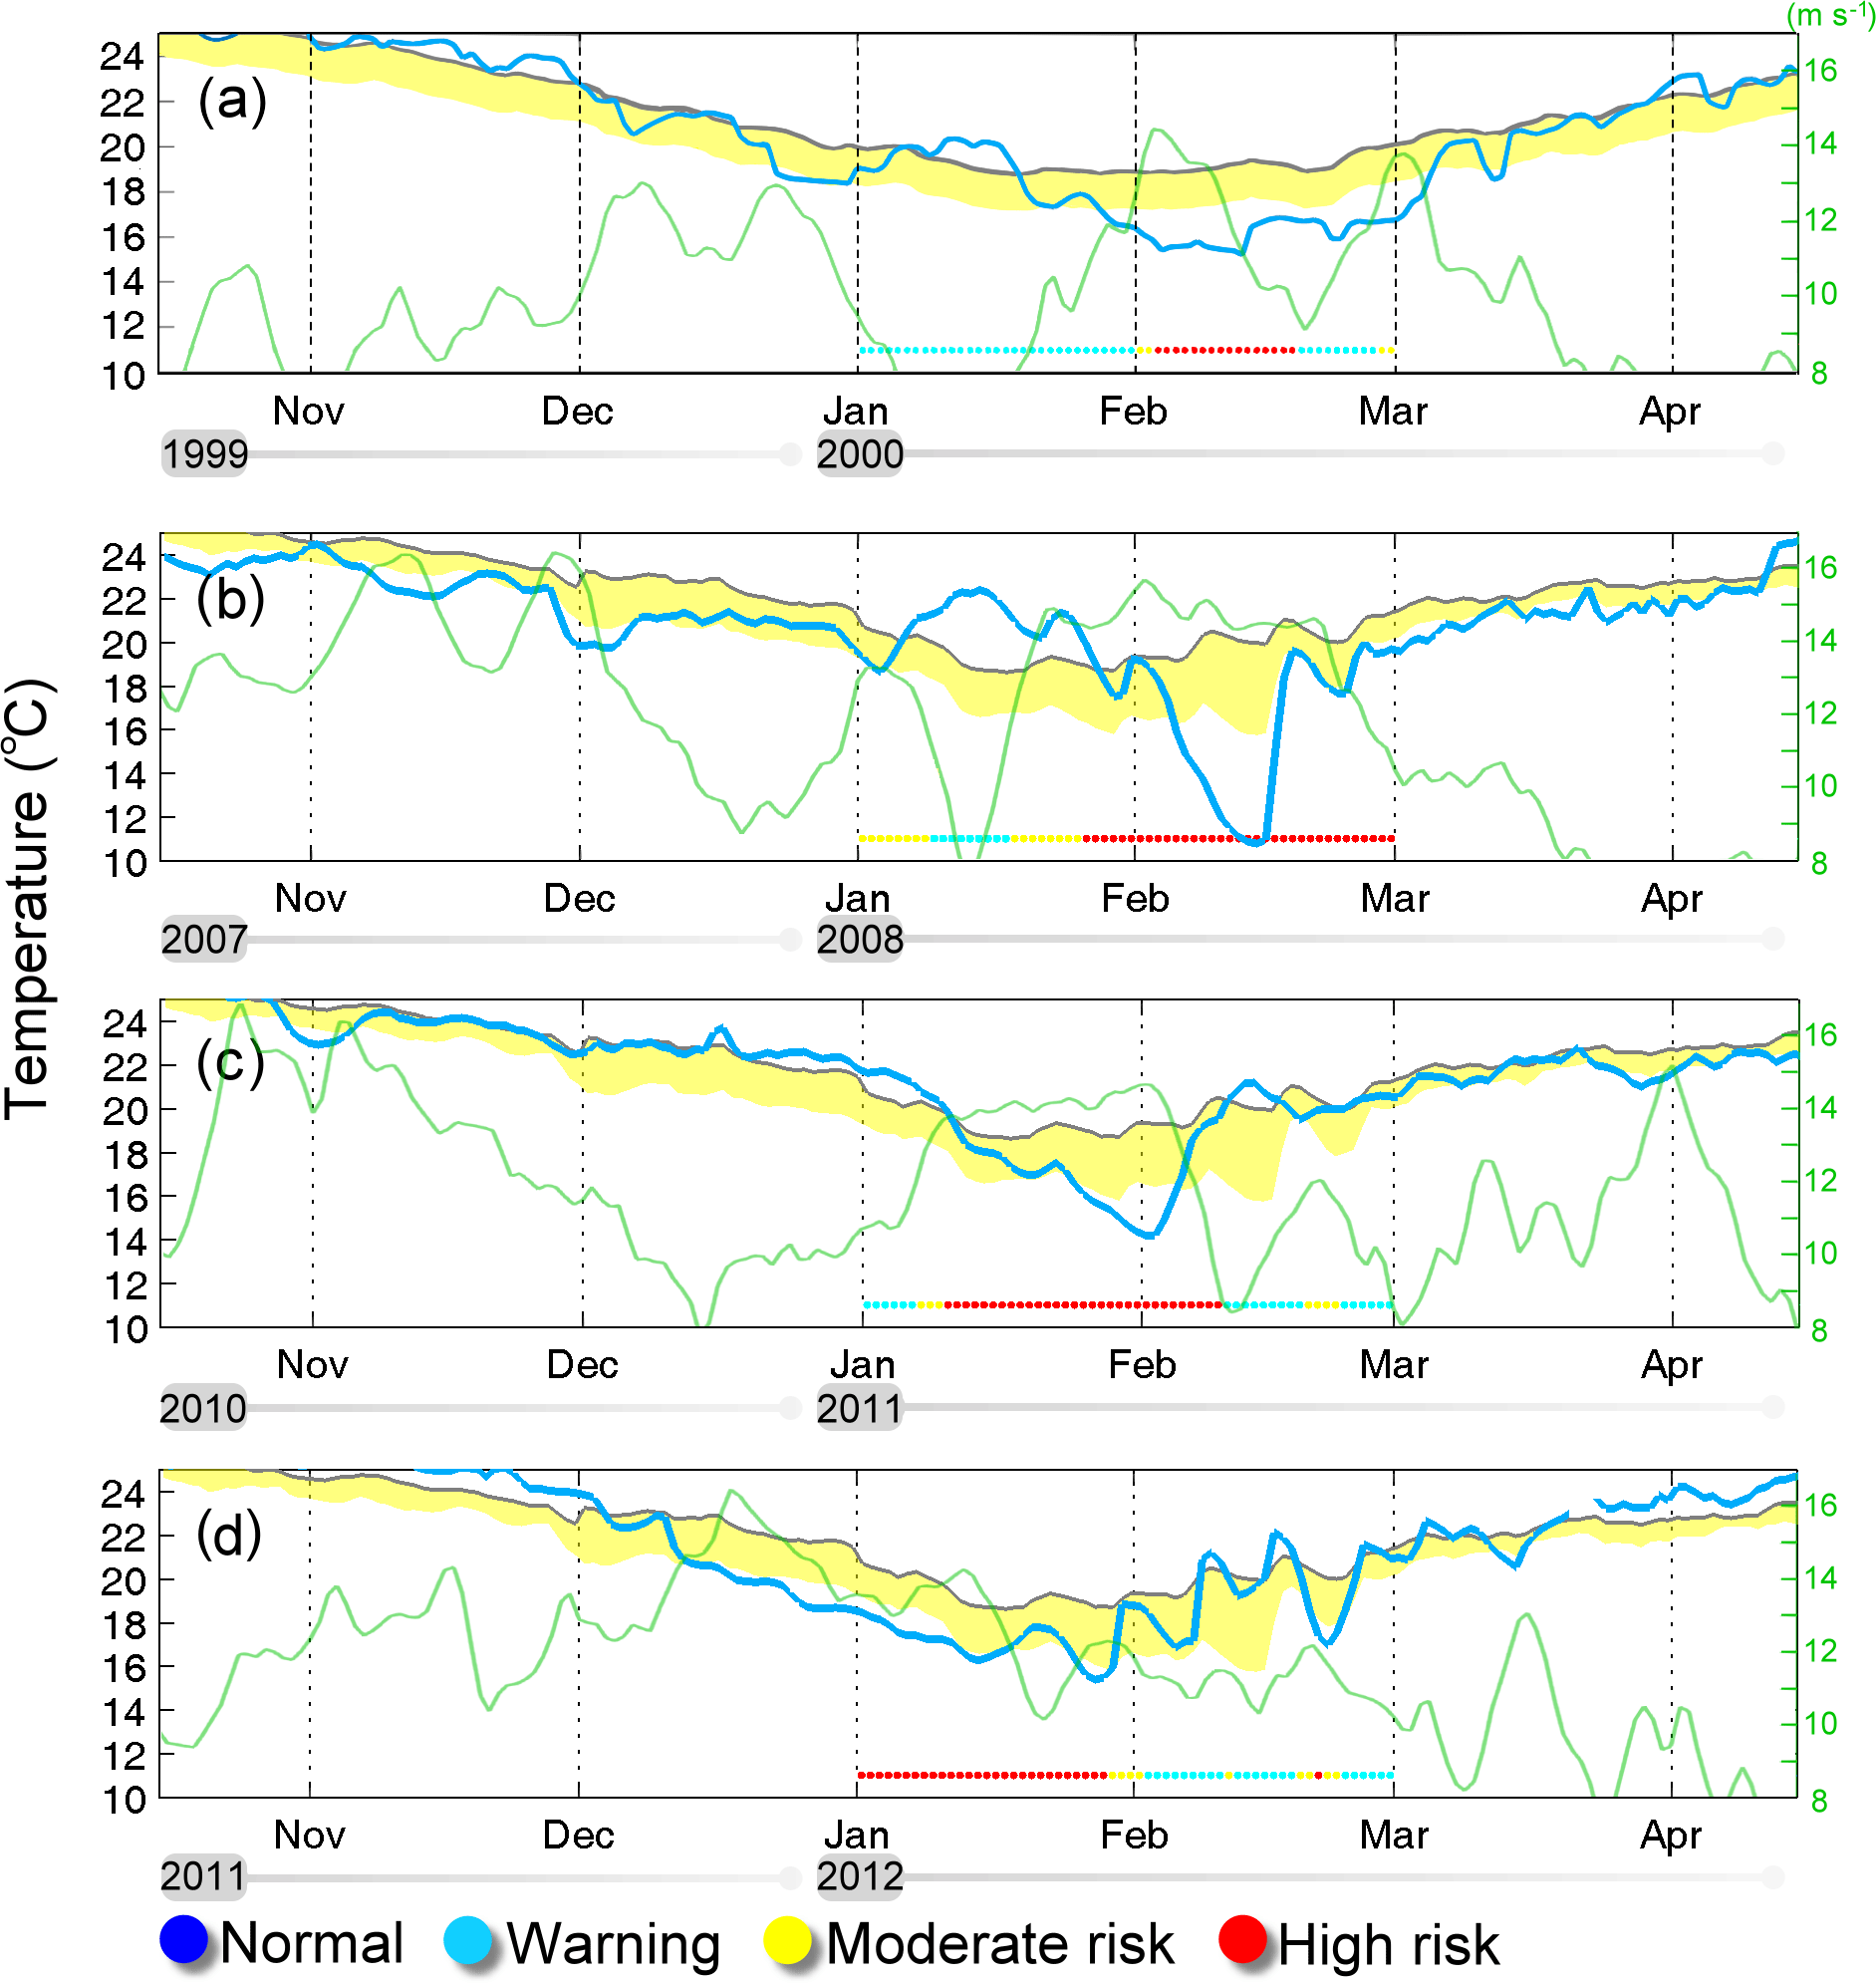
Figure 11Cold events in (a) 2000, (b) 2008, (c) 2011, and (d) 2012. Blue line: SST observed (a) by satellite and (b, c, d) by buoy; gray line: 10-year climatological average; yellow shading: range of standard deviation below the average; green line: 10-day AWS. Color dots are warning lights.
According to the results associated with ENSO and wind speed, the predictability of cold water days can be estimated by ROC and PRC curves; when ROC scores were higher than or equal to 0.6, methodologies based on the ONI or 10-day AWS were observed to be significant (above the 95 % confidence level) for predictions of cold water days. The ONI- and AWS-based predictions could be conducted at lead times of 60–120 and 0–25 days, respectively. Given this predictability, a possible warning mechanism based on the ONI and AWS was established. In this mechanism, if the monthly ONI is lower than or equal to −0.9, a cyan warning light indicating required action is triggered (∼ 50 % occurrence probability); this light turns yellow if the 10-day AWS is ≥ 11.5 m s−1, meaning a moderate risk of exceptionally cold water (∼ 60 % occurrence probability). Red light signaling high risk (∼ 75 % occurrence probability) displays when the 20-day AWS is ≥ 12.5 m s−1. After the application of the warning mechanism, a hindcast of cold water days over the period 1995–2017 revealed four winters (2000, 2008, 2011, and 2012) with a high risk of a cold event potentially triggering damage. Three of the high-risk years (2000, 2008, and 2011) did indeed cause damage in historical records.
The warning mechanism evidently fulfills the requirements of the recently developed methodology of early warning systems for weather-related hazards, as implemented by the Central Weather Bureau of Taiwan. Warning lights based on the ONI and AWS indicate characteristics of exceptionally cold water affecting the Penghu Islands, and they thus facilitate identifying possible periods of exposure to extremely cold water. The warnings thus generated can be sent in an efficient and timely manner to maricultureists.
NCEP Daily Global Analyses data provided by the NOAA/OAR/ESRL PSD, Boulder, Colorado, USA, and daily wind data can be found from their web site at http://www.esrl.noaa.gov/psd/ (last access: April 2018). NOAA high resolution SST data are provided by the NOAA/OAR/ESRL PSD, Boulder, Colorado, USA, from their web site at https://www.esrl.noaa.gov/psd/ (last access: April 2018). The historical CTD data can be download from http://www.odb.ntu.edu.tw/ctd/?p=1917 (last access: April 2018).
The supplement related to this article is available online at: https://doi.org/10.5194/nhess-18-1999-2018-supplement.
MC and YC proposed the fundamental idea initializing this work. YC carried out the data analysis. Both YC and MC contributed to the interpretation of the results of data analysis. YC completed the draft of the article. Both of the authors contributed to the final text.
The authors declare that they have no conflict of interest.
The Ocean Data Bank of the Ministry of Science and Technology, Taiwan,
provided the historical CTD data and bathymetry data. The Central Weather
Bureau (CWB) provided the buoy data sited near the Penghu Islands. Comments
from two reviewers improved the preliminary manuscript markedly. This work
was supported by the CWB of Taiwan through grant 1062076C and by the National
Natural Science Foundation of China (U1405233).
Edited by: Mauricio Gonzalez
Reviewed by: two anonymous referees
Alexander, M. and Scott, J.: The influence of ENSO on air-sea interaction in the Atlantic, Geophys. Res. Lett., 29, 4641–4644, 2002.
Chang, Y., Lee, K.-T., Lee, M.-A., and Lan, K.-W.: Satellite Observation on the Exceptional Intrusion of Cold Water in the Taiwan Strait, Terr. Atmos. Ocean. Sci., 20, 661–669, 2009.
Chang, Y., Lee, M.-A., Lee, K.-T., and Shao, K.-T.: Adaptation of fisheries and mariculture management to extreme oceanic environmental changes and climate variability in Taiwan, Mar. Policy, 38, 476–482, 2013.
Chen, C.-T. A., Jan, S., Huang, T.-H., and Tseng, Y.-H.: Spring of no Kuroshio intrusion in the southern Taiwan Strait, J. Geophys. Res.-Oceans, 115, C08011, https://doi.org/10.1029/2009JC005804, 2010.
Chen, H.-W., Liu, C.-T., Matsuno, T., Ichikawa, K., Fukudome, K.-i., Yang, Y., Doong, D.-J., and Tsai, W.-L.: Temporal variations of volume transport through the Taiwan Strait, as identified by three-year measurements, Cont. Shelf Res., 114, 41–53, 2016.
Hanley, J. A. and McNeil, B. J.: The meaning and use of the area under a receiver operating characteristic (ROC) curve, Radiology, 143, 29–36, 1982.
Hsieh, H., Hsien, Y.-L., Jeng, M.-S., Tsai, W.-S., Su, W.-C., and Chen, C.: Tropical fishes killed by the cold, Coral Reefs, 27, 599–599, 2008.
Huang, B., Banzon, V. F., Freeman, E., Lawrimore, J., Liu, W., Peterson, T. C., Smith, T. M., Thorne, P. W., Woodruff, S. D., and Zhang, H.-M.: Extended reconstructed sea surface temperature version 4 (ERSST. v4), Part I: upgrades and intercomparisons, J. Climate, 28, 911–930, 2015.
Jan, S., Wang, J., Chern, C.-S., and Chao, S.-Y.: Seasonal variation of the circulation in the Taiwan Strait, J. Marine Syst., 35, 249–268, 2002.
Jan, S., Sheu, D. D., and Kuo, H.-M.: Water mass and throughflow transport variability in the Taiwan Strait, J. Geophys. Res.-Oceans, 111, C12012, https://doi.org/10.1029/2006JC003656, 2006.
Kalnay, E., Kanamitsu, M., Kistler, R., Collins, W., Deaven, D., Gandin, L., Iredell, M., Saha, S., White, G., and Woollen, J.: The NCEP/NCAR 40-year reanalysis project, B. Am. Meteorol. Soc., 77, 437–471, 1996.
Kuo, N.-J. and Ho, C.-R.: ENSO effect on the sea surface wind and sea surface temperature in the Taiwan Strait, Geophys. Res. Lett., 31, L13309, https://doi.org/10.1029/2004GL020303, 2004.
Kuo, Y.-C., Chan, J.-W., Wang, Y.-C., Shen, Y.-L., Chang, Y., and Lee, M.-A.: Long-term observation on sea surface temperature variability in the Taiwan Strait during the northeast monsoon season, Int. J. Remote Sens., 39, 1–13, https://doi.org/10.1080/01431161.2017.1387311, 2017.
Lau, N.-C. and Nath, M. J.: ENSO modulation of the interannual and intraseasonal variability of the East Asian monsoon-A model study, J. Climate, 19, 4508–4530, 2006.
Lee, M.-A., Yang, Y.-C., Shen, Y.-L., Chang, Y., Tsai, W.-S., Lan, K.-W., and Kuo, Y.-C.: Effects of an unusual cold-water intrusion in 2008 on the Catch of Coastal Fishing Methods around Penghu Islands, Taiwan, Terr. Atmos. Ocean. Sci., 25, 107–120, https://doi.org/10.3319/TAO.2013.08.06.01(Oc), 2014.
Liao, E., Jiang, Y., Li, L., Hong, H., and Yan, X.: The cause of the 2008 cold disaster in the Taiwan Strait, Ocean Model., 62, 1–10, 2013.
Li, C., Hu, J., Jan, S., Wei, Z., Fang, G., and Zheng, Q.: Winterspring fronts in Taiwan Strait, J. Geophys. Res.-Oceans, 111, C11S13, 2006.
Lu, Y.-L., Hsien, I.-L., Chung, C.-S., Lin, C.-Y., Chen, S.-C., and Tsai, W.-S.: Aquaculture management during a cold spell in the Penghu Islands, Newsletter of Fisheries Research Institute, 37, 21–25, 2012 (in Chinese).
McKinnon, K. A., Rhines, A., Tingley, M. P., and Huybers, P.: Long-lead predictions of eastern United States hot days from Pacific sea surface temperatures, Nat. Geosci., 9, 389–394, 2016.
McPhaden, M. J., Zebiak, S. E., and Glantz, M. H.: ENSO as an Integrating Concept in Earth Science, Science, 314, 1740–1745, 2006.
Mora, C. and Ospina, A.: Experimental effect of cold, La Nina temperatures on the survival of reef fishes from Gorgona Island (eastern Pacific Ocean), Mar. Biol., 141, 789–793, 2002.
Philippon, N., Rouault, M., Richard, Y., and Favre, A.: The influence of ENSO on winter rainfall in South Africa, Int. J. Climatol., 32, 2333–2347, 2012.
Reynolds, R. W., Smith, T. M., Liu, C., Chelton, D. B., Casey, K. S., and Schlax, M. G.: Daily high-resolution-blended analyses for sea surface temperature, J. Climate, 20, 5473–5496, 2007.
Saito, T. and Rehmsmeier, M.: The precision-recall plot is more informative than the ROC plot when evaluating binary classifiers on imbalanced datasets, PloS one, 10, e0118432, https://doi.org/10.1371/journal.pone.0118432, 2015.
Shang, S., Zhang, C., Hong, H., Liu, Q., Wong, G. T. F., Hu, C., and Huang, B.: Hydrographic and biological changes in the Taiwan Strait during the 1997–1998 El Niño winter, Geophys. Res. Lett., 32, L11601, https://doi.org/10.1029/2005GL022578, 2005.
Stephenson, D. B., Casati, B., Ferro, C. A. T., and Wilson, C. A.: The extreme dependency score: a non-vanishing measure for forecasts of rare events, Meteorol. Appl., 15, 41–50, 2008.
Ustrnul, Z., Wypych, A., Henek, E., Maciejewski, M., and Bochenek, B.: Climatologically based warning system against meteorological hazards and weather extremes: the example for Poland, Nat. Hazards, 77, 1711–1729, 2015.
Wang, B., Wu, R., and Fu, X.: Pacific-East Asian teleconnection: How does ENSO affect East Asian climate?, J. Climate, 13, 1517–1536, 2000.
Wu, C.-R., Chao, S.-Y., and Hsu, C.: Transient, seasonal and interannual variability of the Taiwan Strait current, J. Oceanogr., 63, 821–833, 2007.
Zhang, W., Zhuang, X., Chen, C. A., and Huang, T.: The impact of Kuroshio water on the source water of the southeastern Taiwan Strait: numerical results, Acta Oceanol. Sin., 34, 23–34, 2015.