the Creative Commons Attribution 4.0 License.
the Creative Commons Attribution 4.0 License.
 | 20 Jun 2018
Analysis and validation of the PTVA tsunami building vulnerability model using the 2015 Chile post-tsunami damage data in Coquimbo and La Serena cities
Tatiana Izquierdo
Eduardo Fritis
Manuel Abad
Chile is highly exposed to tsunami hazard from large earthquakes often occurring along the Peru–Chile trench, like the 16 September 2015 event. However, only recently has tsunami hazard been considered in the land-use policies of the Chilean coast. These new regulations must enforce the identification of the most vulnerable sectors of the Chilean coastal cities. This paper analyses and validates the two latest versions of the Papathoma Tsunami Vulnerability Assessment (PTVA) model in the 2015 tsunami reconstructed scenario in the cities of La Serena and Coquimbo. Both models result in a similar number of very high and high relative vulnerability index (RVI) scores. However, the less vulnerable categories do not show a similar trend and the PTVA-4 model obtains a larger number of minor and average RVI scores. When compared to the damages caused by the tsunami, the PTVA-3 shows a more similar distribution to the actual damages than that obtained by the PTVA-4 model, which shows a more concentrated distribution of the RVI scores. These results suggest this version of the model should be used in Chilean coastal cities in future land-use or mitigation planning.
- Article
(3742 KB) - Full-text XML
- BibTeX
- EndNote


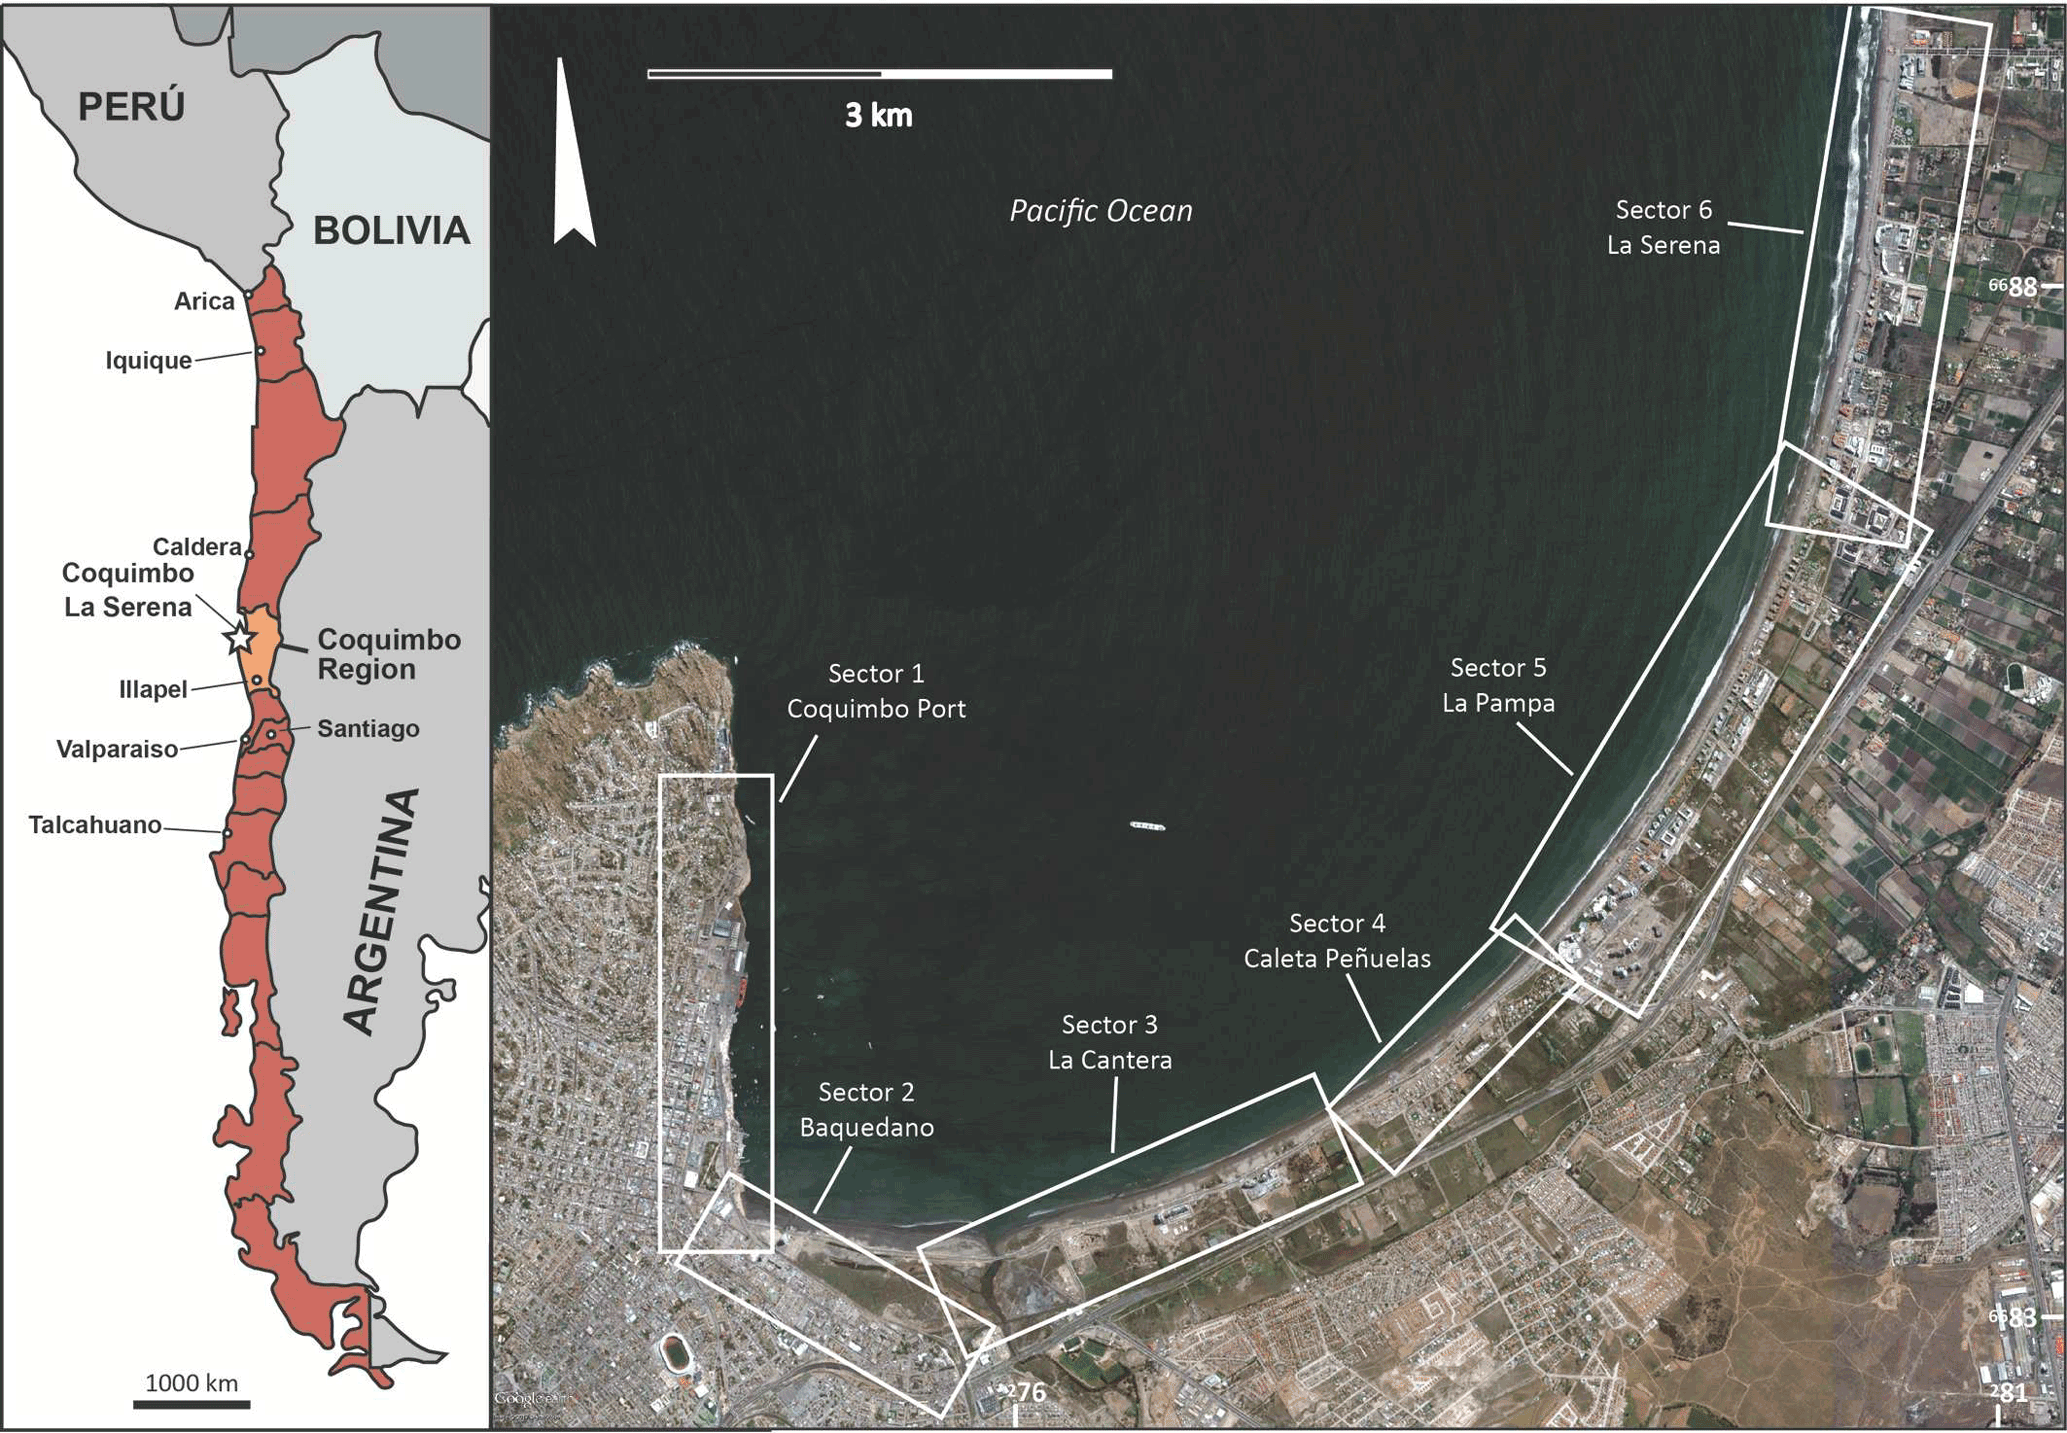
Figure 1Location of the study area and the analyzed sectors in the Coquimbo Bay (image courtesy of Google Earth).
Tsunamigenic events in Chile are a consequence of the convergence boundary in which the Nazca plate subducts under the South American plate at a rate of 65 mm yr−1 (DeMets et al., 2010). In fact, three of the eight largest earthquakes (Mw > 8) of the last 6 years around the world have happened in Chile: Maule in 2010, with Mw = 8.8; Iquique in 2014, with Mw = 8.2; and Illapel in 2015, with Mw = 8.4 (Fuentes et al., 2016; Omira et al., 2016; Satake and Heidarzadeh, 2017). All of them were tsunamigenic. The first historical observations of earthquakes and tsunamis on the Pacific coast of South America date from the 16th century with the arrival of the Spaniards to this region, although there are more ancient descriptions of these catastrophes in Peruvian and Chilean legends (Kulikov et al., 2005). Especially relevant was the earthquake on 22 May 1960 (Mw ∼ 9.5) with a rupture zone of almost 1000 km (Smith, 2010), which triggered a large tsunami. This event affected the entire Chilean coast as well as Hawaii, Japan, the Philippines, New Zealand, Australia and Alaska (SHOA, 2000). Likewise, tsunamigenic earthquakes that occur in other subduction zones of the Pacific Ocean can affect the Chilean coast. The most recent example is the earthquake that occurred on 11 March 2011 in Tōhoku, Japan (Mw = 9.0; Simons et al., 2011). The triggered tsunami waves arrived at the Chilean coasts after 21 h (Dunbar et al., 2011) with a maximum observed amplitude of 2.23 m in Arica and Talcahuano tidal gauges (SHOA, 2016).
The historical record includes dozens of destructive tsunamis on the Chilean coast while the geological record confirms tsunami occurrence in the last thousands of years (Cisternas et al., 2005, 2017; Ely et al., 2014; Kempf et al., 2017). In the Coquimbo Region one of the worst recorded tsunamis occurred after the Vallenar earthquake of 11 November 1922 with Mw ∼ 8.3. The deformation in the ocean floor triggered a wave train that caused an inundation height of 7 m on the coast of the epicentral region (Caldera–Coquimbo), and the cities of La Serena and Coquimbo were significantly damaged (Beck et al., 1998; Lomnitz, 2004). According to Bobillier (1926), the tsunami flooded Coquimbo with three waves, the third of which reached an elevation of 4.6 m a.s.l. Some zones reached 3 m flow depth and horizontal inundation distances of up to 800 m (Contreras-López et al., 2016). In the same context, the water penetrated 2 km at the most low-lying places and, as a result, part of the city situated at the southern apex of the Coquimbo Bay was completely destroyed by the combined effect of water, boats and other objects being washed ashore (Soloviev and Go, 1975).
Although Chile is highly exposed to these high-energy marine events, only in recent years have land-use policies begun to consider tsunami risk. The new planning tools include the study of both hazard and vulnerability of the coastal cities to these extreme waves. Despite this incipient development of national urban policies after the 27 February 2010 tsunami (Lunecke, 2016), tsunami impact remains a cause for economic and life losses. Among the main advances in land-use planning, the Chilean Ministry of Housing and Urban Planning (MINVU) has started to define tsunami hazards areas and, in addition, the National Emergency Office (ONEMI) has included civil protection plans for tsunamigenic events. However, to minimize the losses associated with future tsunamis, it is necessary to assess building vulnerability from the estimated the probable maximum loss. Recently, Aránguiz et al. (2017) have developed fragility curves to assess tsunami damage in Coquimbo after the 2015 tsunami. This method can serve as a complement to the Papathoma Tsunami Vulnerability Assessment (PTVA) models, although recently some authors have indicated the limitations of these vulnerability functions (Tarbotton et al., 2015; Dall'Osso et al., 2016). For example, they consider only the construction material as the attribute influencing the vulnerability to tsunami and do not include structural details or other engineering factors, whereas the PTVA models include a wider range of variables in the vulnerability assessment. Furthermore, most of these curves are based on local observations after actual tsunamis, making them difficult to apply in other locations (Tarbotton et al., 2015; Dall'Osso et al., 2016). Other methodologies have been proposed to assess tsunami building vulnerability, such as the Building Tsunami Vulnerability (BTV) (Omira et al., 2010) or the remote-sensing-based method of Mück et al. (2013). Recently, Vera San Martín et al. (2018) applied an adaptation of the PTVA and BTV methodologies to determine a vulnerability index for Salinas (Ecuador).
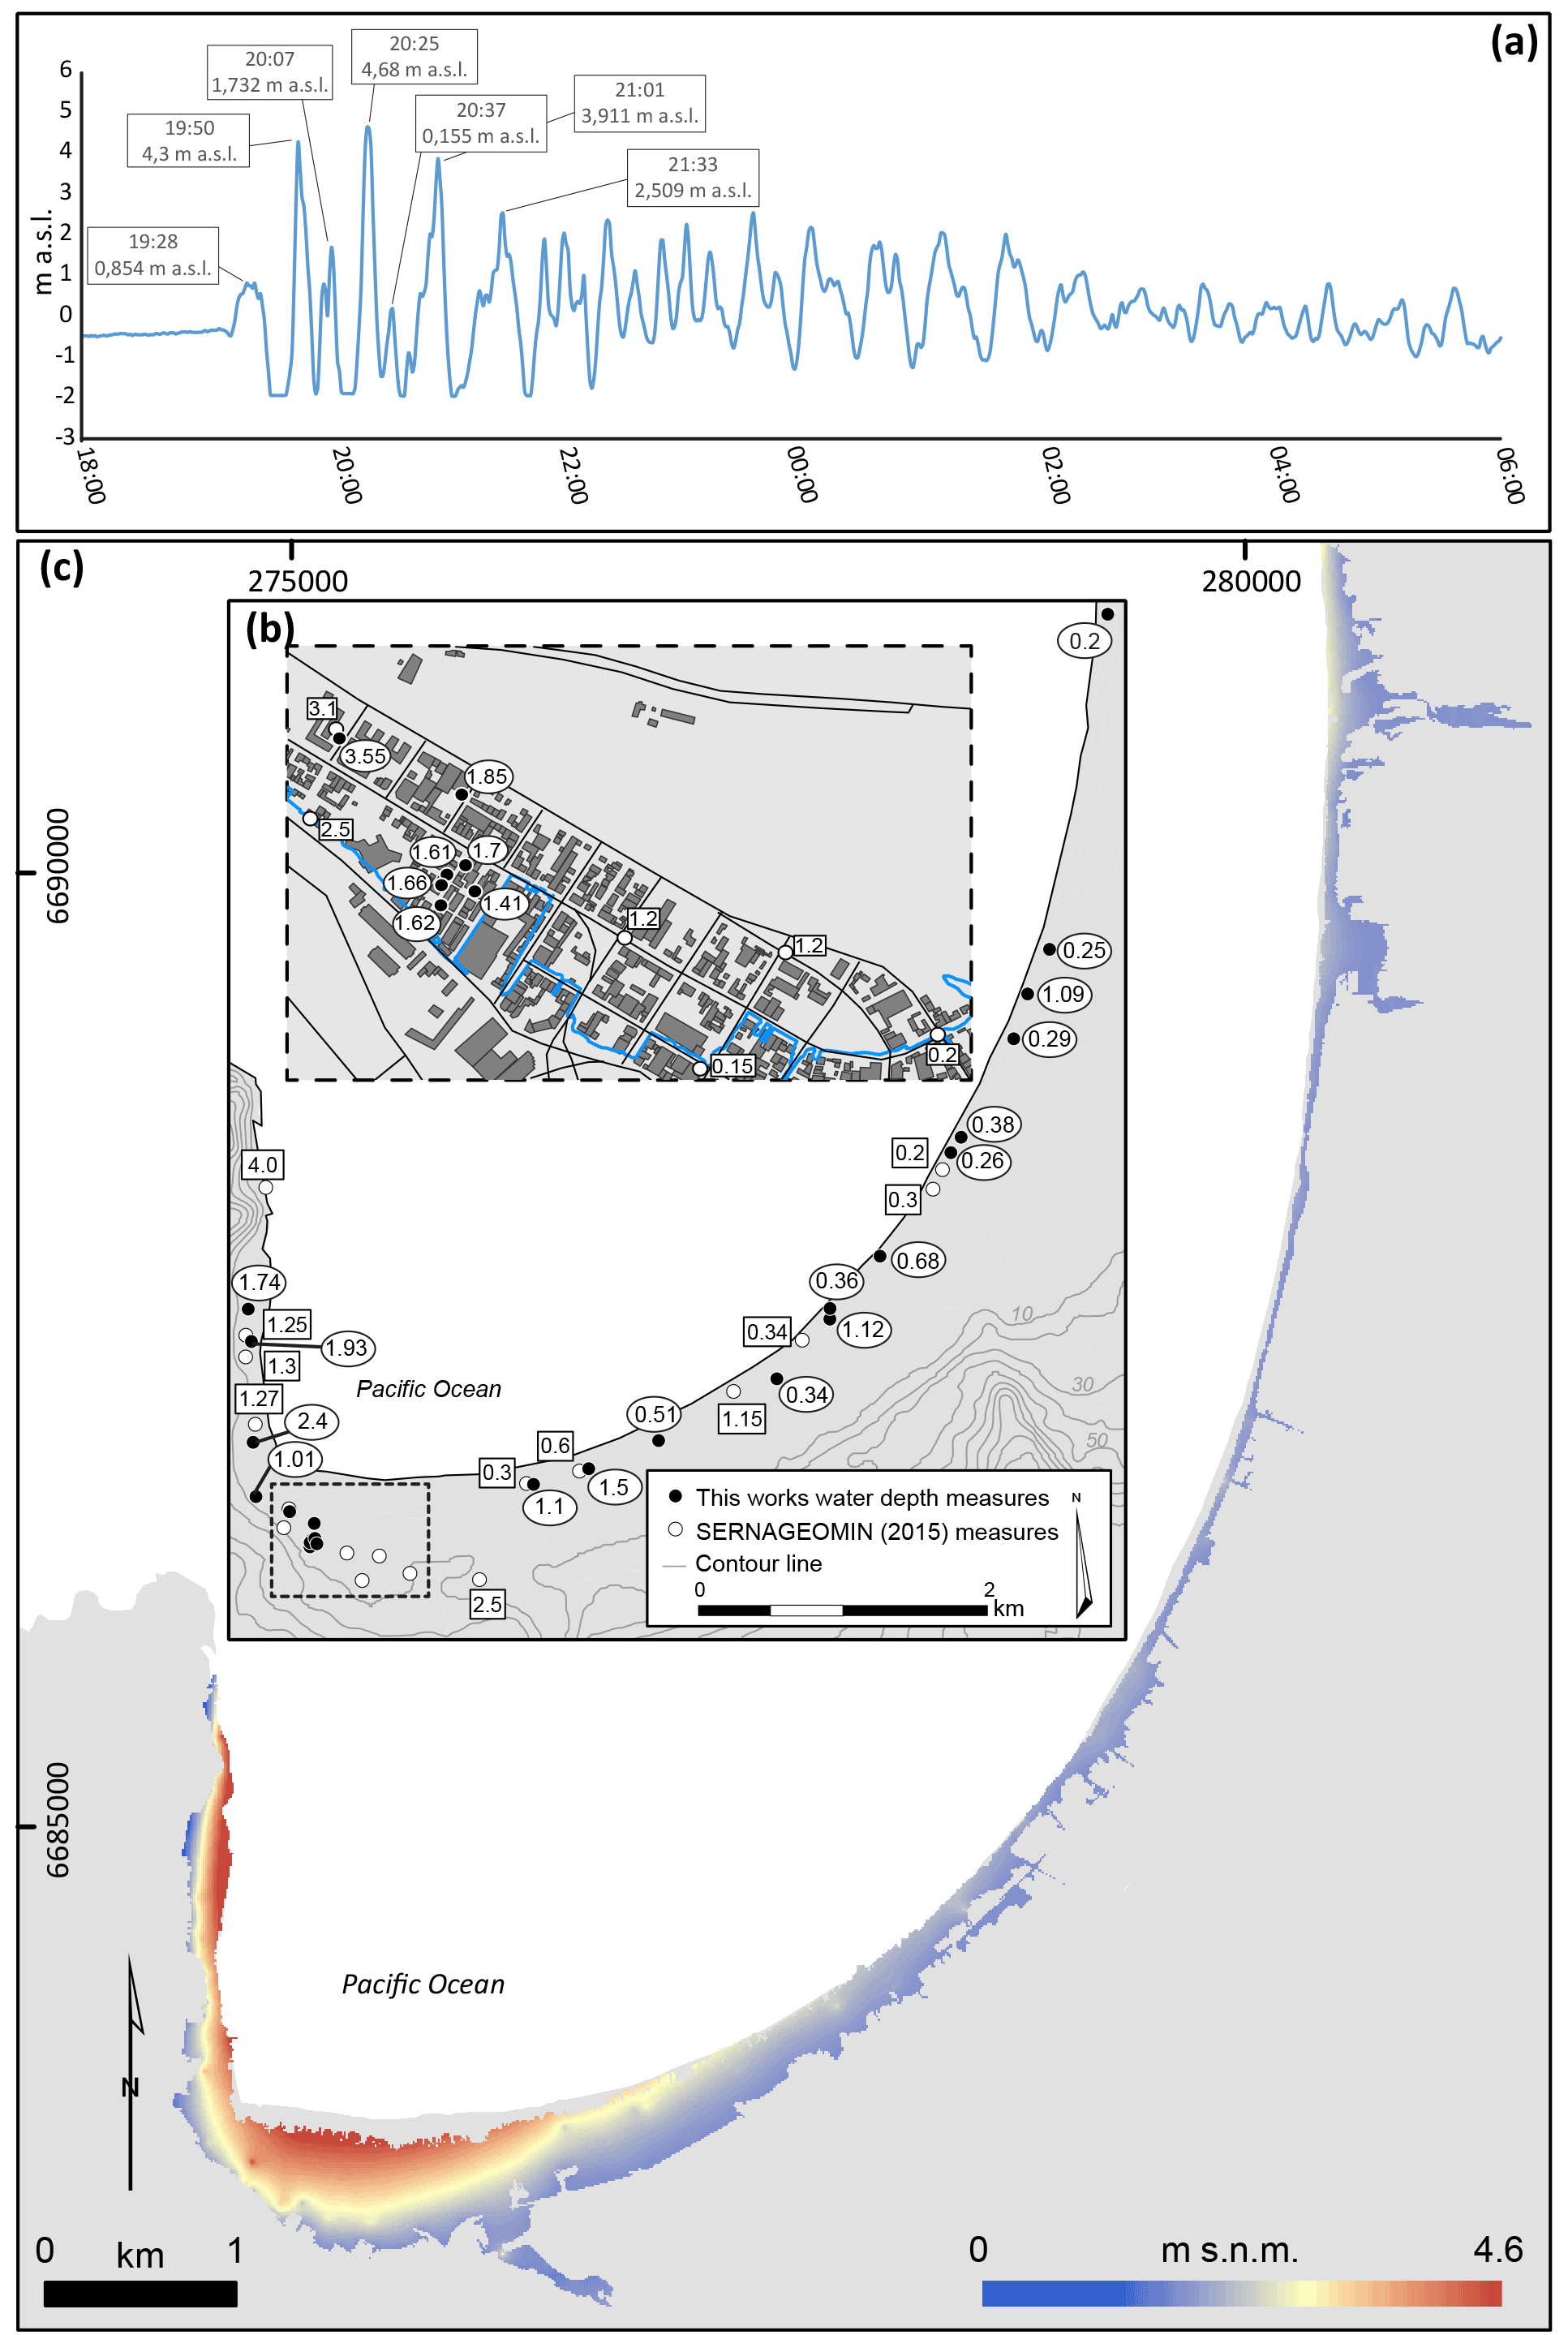
Figure 2(a) Coquimbo tide gauge measurements (SHOA). (b) Flow depth measurements along Coquimbo and La Serena; the blue line marks the limit of the flood. (c) Reconstructed tsunami inundation map and flow depths from the data collected in the field.
This work evaluates the tsunami vulnerability of the La Serena–Coquimbo conurbation in the reconstructed flood that occurred on 16 September 2015 after the tsunami generated by the Illapel earthquake (Mw 8.4). The tsunami had a maximum wave height of 4.7 m in Coquimbo (SHOA, 2016) and caused 11 fatalities (CCT-ONEMI, 2015). We first reconstruct the flood in the cities and we estimate the relative vulnerability index (RVI) using the PTVA-3 (Dall'Osso et al., 2009a) and PTVA-4 (Dall'Osso et al., 2016) models. Finally, we validate our results by comparing them with the real damages evaluated by MINVU after the event. The unique opportunity of studying a real case and validating the PTVA model results using post-tsunami damage data will help future urban planning in Chile by establishing which model can be considered a better approach for those cities in which other methodologies have not yet been developed.
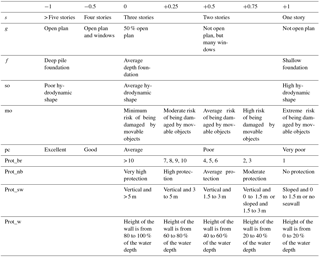
Table 1Attributes and their values influencing the structural vulnerability of a building (Bv) and its level of protection (Prot) in PTVA-3 model (Dall'Osso et al., 2009a).
The cities of La Serena and Coquimbo (412 586 inhabitants) are located in the Coquimbo Region (north-central Chile), in the so-called Norte Chico (Fig. 1). The distance between the oceanic trench and the coast here varies between 80 and 100 km; i.e., it is smaller than in other regions of Chile, where the most typical distances range between 120 and 140 km (Fuentes et al., 2016). According to Pardo et al. (2002) and Tassara et al. (2006), in this zone the subduction angle of the Nazca plate is almost horizontal at depths close to 100 km. This geometry of the plate gives rise to a strongly coupled inter-plate contact, a highly compressed continental crust with back-arc seismicity and shortening of the crust, together with the absence of active Quaternary volcanoes in the Andes Cordillera (Jordan et al., 1983).

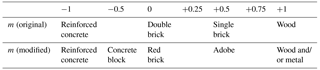
Table 2Original parameter (m) (Dall'Osso et al., 2009a) and modified according to the constructions of northern Chile.
The Coquimbo Bay is open to the northwest, providing natural protection against the dominant southwestern swells. The submarine part of the bay shows a 10 km wide marine platform with gentle slope on the seabed. The Coquimbo Bay exposes depths that do not exceed 50 m inside the bay (Aránguiz et al., 2016). It presents a gentle topography and a more than 10 km long sandy beach only interrupted by the mouth areas of the Culebrón stream and Elqui River, which are characterized by the existence of marshlands (much larger in the first case). This Culebrón marsh runs parallel to the coast, behind the foredune, and it is currently largely anthropized as a high percentage of its original surface is now part of the urban area (Fig. 1).
In Coquimbo–La Serena conurbation, the urbanization process and the coastal border occupation have caused a convergence in the coastal space of several uses causing conflicts (Hidalgo et al., 2009). At present, due to rapid growth, several uses appear in the littoral such as residential, commercial, industrial and tourist as well as illegal settlements, which results in different construction types (Maureira, 1998). Besides this heterogeneity a dominant construction type can be described in the different sectors of the bay. Buildings in La Serena (north of the study area) correspond to modern reinforced concrete structures with more than 10 stories whereas in Coquimbo the predominant building types are one- or two-story wood, adobe or masonry houses. In the Coquimbo Port, light metal structures can be observed and, finally, along the sandy beach several light wood structures corresponding to restaurants and other tourist facilities can be found.
3.1 Geodatabase and field survey
To reconstruct the flood a field survey was carried out the week after the occurrence of the tsunami. During the campaign, 24 flow depths or inundations depths were measured distributed across the flooded area (Fig. 2). These measures combined with those published by the National Geology and Mining Service (SERNAGEOMIN, 2015) and the inundation limit with a flow depth value of 0 allowed us to reconstruct the flow depth in the urban area. From a total number of 266 points a flow depth map was estimated using a kriging model in the ArcGIS 10.3 Geostatistical tool including a 1 m pixel−1 digital elevation model as an external drift as the flow depth is topography dependent. The obtained modeled map (10 m pixel−1) presents a root mean square error of 0.54. This field-based reconstructed tsunami flood was used to obtain the flow depth value for each assessed building along the affected area, an essential parameter for the vulnerability index calculation.
In addition, we developed a geodatabase based on a geographic information system (GIS) that gathers different spatial information needed for the calculation of the vulnerability. The cartography, including a cadastre for the cities, was downloaded from the Copernicus Emergency Management Service of the European Union webpage (http://emergency.copernicus.eu, last access: 25 June 2016). We first verified in the field that the spatial information integrated in the GIS geodatabase corresponded with the reality. In those cases where it did not, the polygons, which represent single buildings, were manually modified. Information was also added to buildings under construction as well as those destroyed by the 2015 tsunami. The attributes for each polygon were collected during a third post-tsunami survey. A total of 65 out of 1239 buildings (5.2 %) were not accessible and classified as “no access”.
3.2 Vulnerability model
From the different methods published for building vulnerability calculation, we chose the PTVA because it has proven to be a suitable model in the estimation of tsunami vulnerability across different coastal urban centers around the world. The first and second versions of the model were applied in the Gulf of Corinth, Greece (Papathoma and Dominey-Howes, 2003), and Seaside, Oregon, USA (Dominey-Howes et al., 2010), respectively. After improvements to the model, its third version was tested on the coast of New South Wales, Australia (Dall'Osso et al., 2009b), and has been widely used to assess the vulnerability of several coastal localities, such as the Aeolian Islands (Italy; Dall'Osso et al., 2010), Figueira da Foz (Portugal; Barros et al., 2013), Setúbal (Portugal; Santos et al., 2014), south of the Boso Peninsula (Japan; Voulgaris and Murayama, 2014), the southwest Atlantic coast of Spain (Abad et al., 2014), Naples (Italy; Alberico et al., 2015) and Chabahar Bay (Iran; Madani et al., 2016). Recently, a fourth version of the model has been tested at Botany Bay, Sydney (Australia; Dall'Osso et al., 2016). We select the two latest versions of the PTVA model because version 3 has been widely used and, according to their authors, version 4 is an improvement to the model (Dall'Osso et al., 2016).
3.2.1 The PTVA-3 model
The RVI calculation depends on the structural vulnerability (SV) and the vulnerability to water intrusion (WV) (Fig. 3). WV is calculated by the relation between the number of inundated levels and the total number of levels, while the SV calculation considers the attributes of the building structure (building vulnerability; Bv), the building flow depth (exposure; Ex) and its protection level (Prot) (Fig. 3).
The Bv calculation considers six different attributes (Fig. 3; Table 1). The material attribute (m) was modified and adapted to the constructions methods of northern Chile (Table 2). Concrete or cinder blocks is included as a construction material and adobe substitutes the original single brick as this construction style is no used in Chile according to the national building code. The Prot calculation includes four attributes (Fig. 3; Table 1) while the Ex parameter is classified from the water or flow depth map values (Table 3).
3.2.2 The PTVA-4 model
In the PTVA-4 model, the RVI calculation depends on the same parameters as in the PTVA-3 model, i.e., SV and WV (Fig. 3). However, the attribute movable objects (mo) is now included in the parameter Surr (previous Prot) instead of in Bv so all the attributes that consider the building surroundings are now included in a single parameter (Fig. 3; Table 4). The other modified attribute is shape and orientation (so) that was renamed to “shape of building footprint” (sh) and its values are described in Table 4 and Fig. 3. In addition, in this model, as in the PTVA-3 model, the attribute material (m) was modified and adapted to the constructions of northern Chile (Table 2). Finally, the Ex parameter is calculated using the ratio between the flow depth impacting the building (WD) and the maximum effective water depth in the study area (WD max). Dall'Osso et al. (2016) suggest that for a better displaying of the RVI results in the case of the PTVA-4 model a more sophisticated technique should be used. We used a technique based on the Jenks' Natural Breaks Algorithm (Jenks, 1977), obtaining the final scaling for the RVI classification.
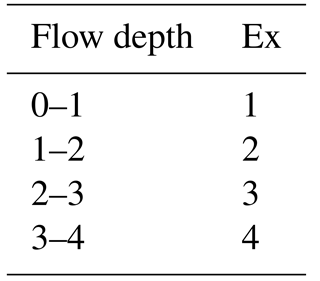
Table 4Attributes and their values influencing the structural vulnerability of a building (Bv) and its surroundings characteristics (Surr) in PTVA-4 model (Dall'Osso et al., 2016).
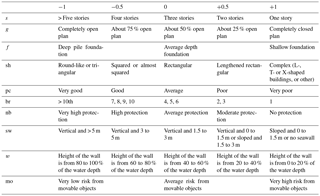
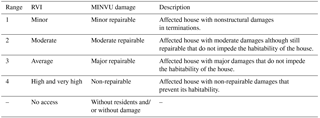
Table 5Established ranges for RVI and actual damage comparison.
3.3 Model validation
The vulnerability results obtained in the PTVA-3 and PTVA-4 models were compared with the real damages caused by the 2015 tsunami to validate both models with a real event on the northern coast of Chile. We used the information provided by MINVU, a total of 484 analyses, that corresponds to a technical evaluation for the residential houses located in the area hit by the tsunami focused on Baquedano (sector 2) in Coquimbo (Fig. 1). This information was integrated in the geodatabase and compare with our RVI results (Table 5). The building damage classification used by MINVU consists of four categories that range from minor damage to non-reparable, whereas the RVI obtained from the PTVA models involves five categories. To facilitate the comparison of both scales, we have unified the high and very high RVI scores. The expected RVI for each building can then be correlated with its degree of damage described after the tsunami impact. In this sense, Dall'Osso et al. (2016) specify that the RVI scores cannot be used to predict which buildings will reach or exceed a given damage state but to relatively compare the expected performance of each building. Therefore, the aim of our comparison is not to provide a damage description to a given RVI score but to verify if the low RVI scores correspond to minor building damages and vice versa.
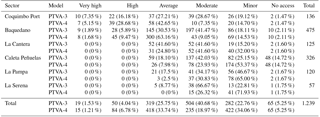
Table 6Number of analyzed polygon in each sector and the obtained RVI score for PTVA-3 and PTVA-4 models.
The epicenter of the Illapel earthquake (16 September 2015) was located at 71.741∘ W and 31.637∘ S at 23.3 km depth (http://www.sismologia.cl, last access: 30 June 2016), where the rupture velocities reached 1.5–2.0 km s−1 (Heidarzadeh et al., 2016). The Illapel earthquake occurred between two lower coupling zones: a small zone near 32∘ S and a larger one in the north, near 30.5∘ S in front of La Serena. This seismic event occurred near the northern end of the rupture zone of the 1730 mega-earthquake with magnitude Mw ∼ 9.0 that probably controls the seismic cycle of central Chile (Ruiz et al., 2016). Considering two earthquakes of magnitude Mw ∼ 8.0 that occurred previously (1943 and 1880; Beck et al., 1998), Nishenko (1985) suggested that the Illapel zone was a seismic gap.

Figure 4(a) Building with average RVI score in the first coastline with flow depths of 1.9 m after the 2015 tsunami in Coquimbo Port (sector 1). (b) Movable objects impacting residential buildings after the 2015 tsunami. (c) High vulnerability building with more than 50 % of its infrastructure flooded. (d) High vulnerability building with its damaged infrastructure after the 2015 tsunami. (e) Very high vulnerability building that resulted in non-repairable damage after the 2015 tsunami. (f) Modern buildings with minor vulnerability RVI score. (g) Very high vulnerability building highly affected by the tsunami in La Cantera sector. (h) Not open plan ground floor.
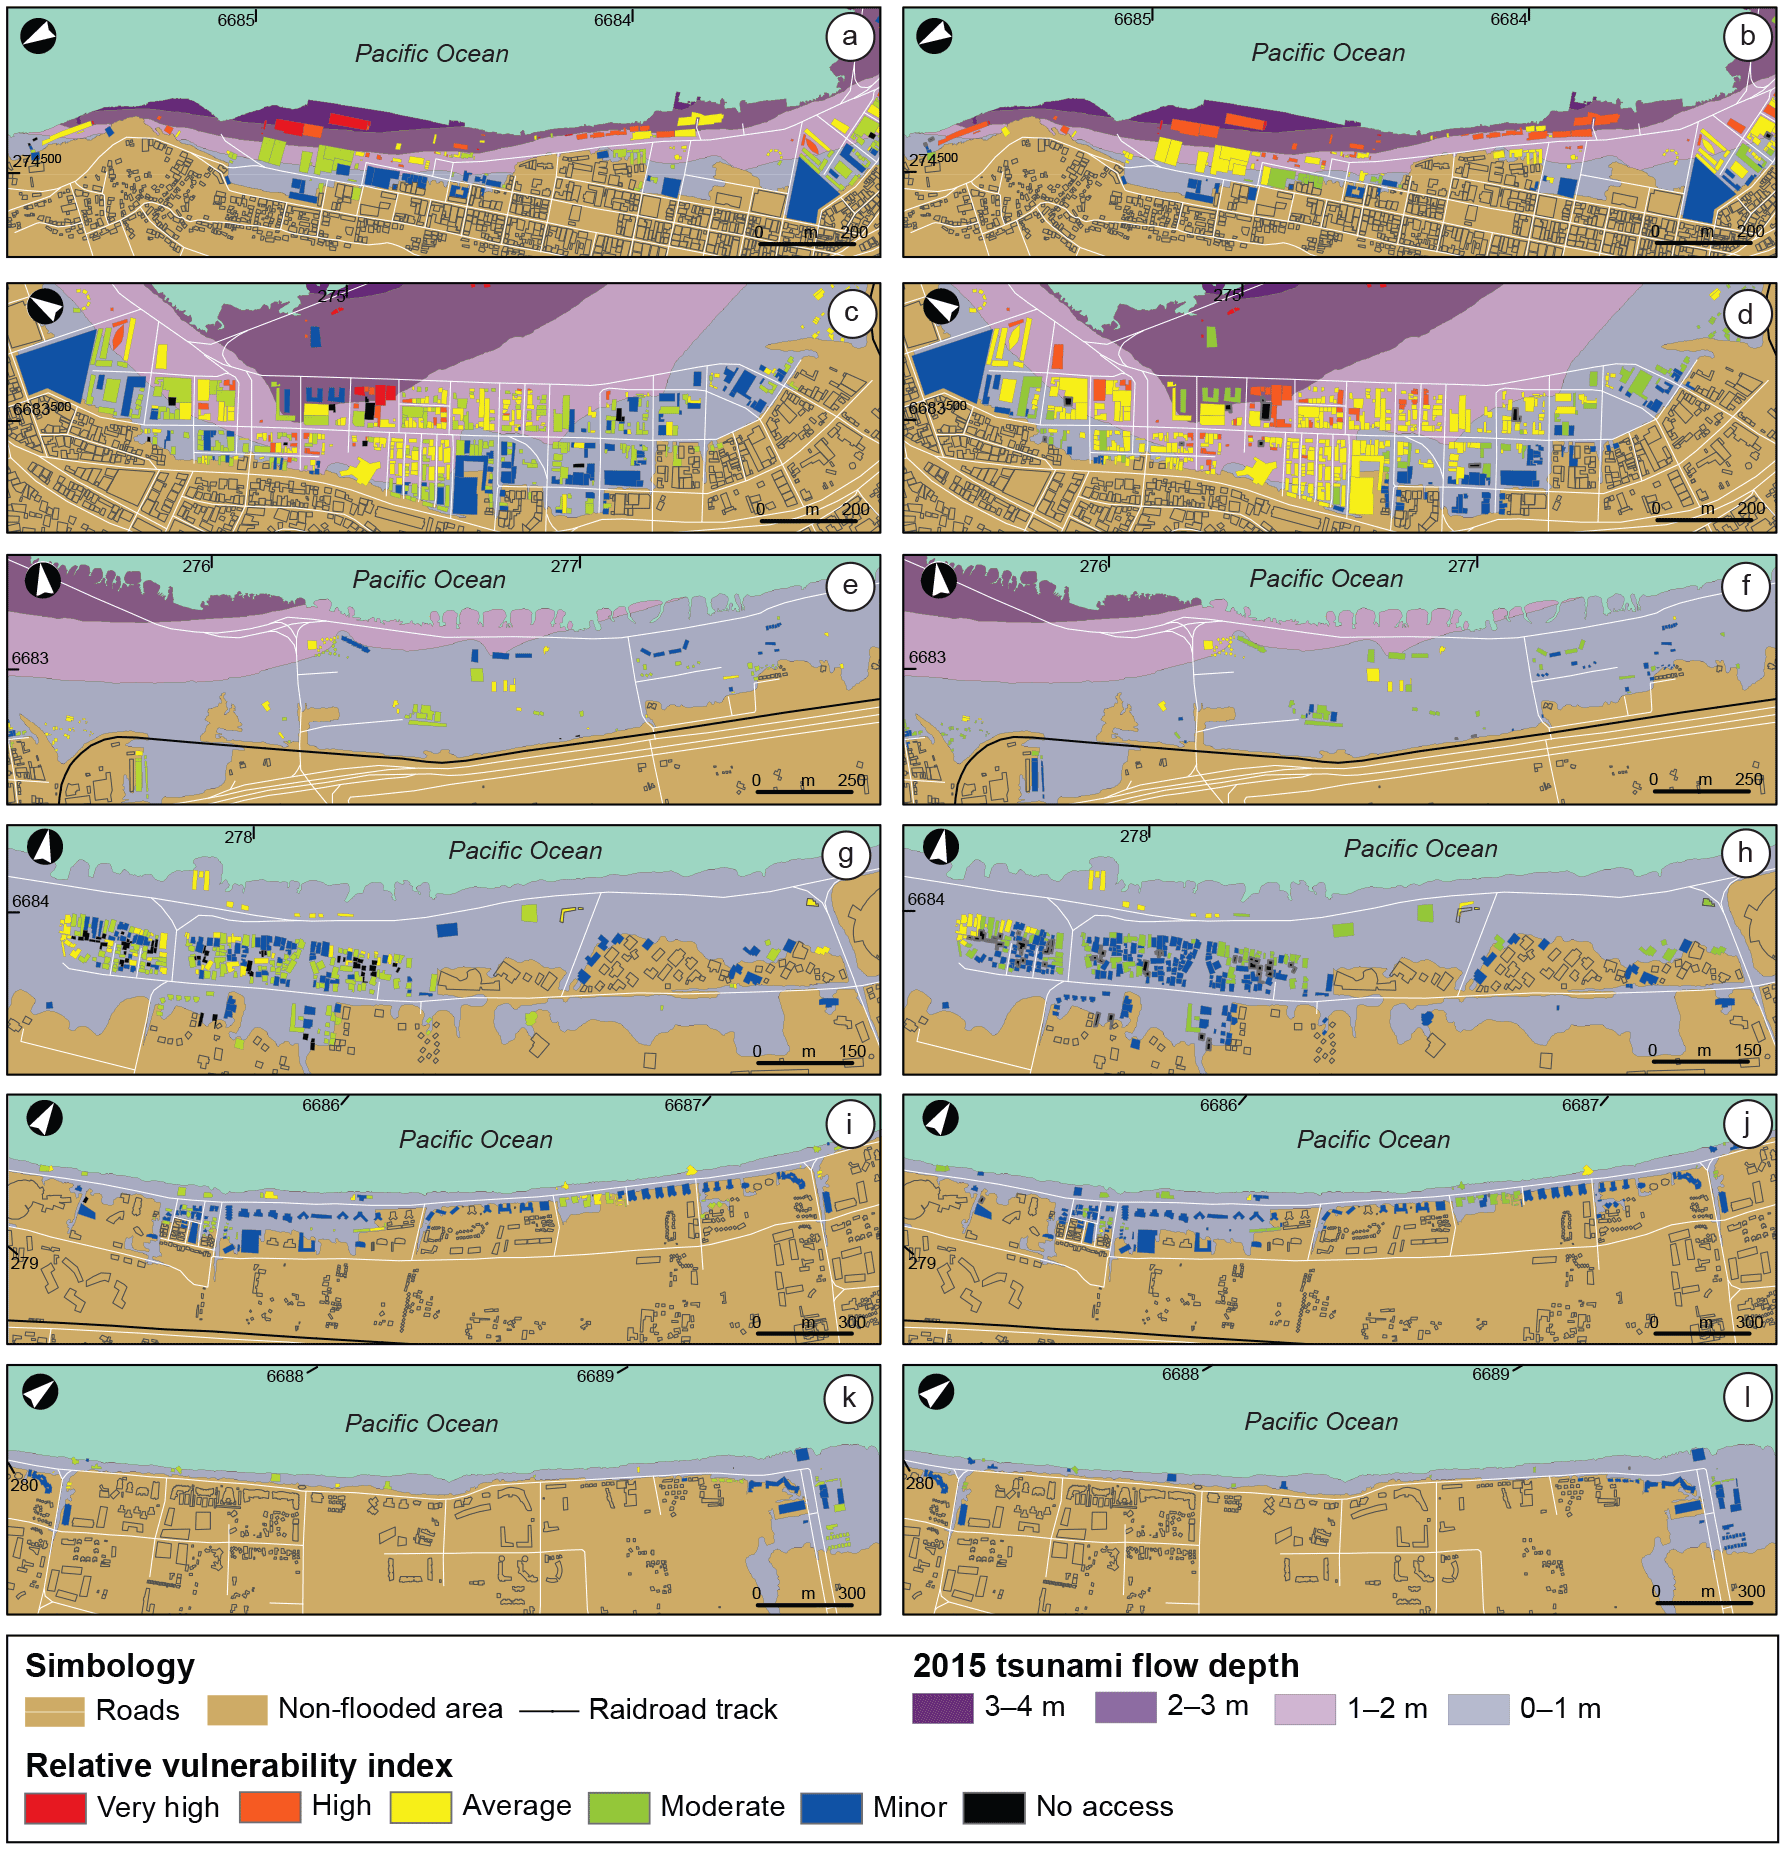
Figure 5Relative vulnerability index for (a) sector 1 – Coquimbo Port PTVA-3 model; (b) sector 1 – Coquimbo Port PTVA-4 model; (c) sector 2 – Baquedano PTVA-3 model; (d) sector 2 – Baquedano PTVA-4 model; (e) sector 3 – La Cantera PTVA-3 model; (f) sector 3 – La Cantera PTVA-4 model; (g) sector 4 – Caleta Peñuelas PTVA-3 model; (h) sector 4 – Caleta Peñuelas PTVA-4 model; (i) sector 5 – La Pampa PTVA-3 model; (j) sector 5 – La Pampa PTVA-4 model; (k) sector 6 – La Serena PTVA-3 model; and (l) sector 6 – La Serena PTVA-4 model.
Because of the inter-plate event, a transoceanic tsunami of moderate height was generated, causing damages along the Chilean coasts, especially in the Coquimbo Region. Aránguiz et al. (2016) indicated the tsunami run-up varied between 4 and 6 m in places close to the origin region, with maximum of 10.8 m. Moreover, local bathymetry and topography promoted the tsunami to cause greater damage in some urbanized coastal locations. The tide gauge record shows that the earthquake occurred shortly after the low tide at the epicenter (Fig. 2a). The arrival time at Coquimbo was 23 min after the earthquake, with 1.1 m of tsunami amplitude. The maximum tsunami amplitude (4.68 m) was measured with the fourth wave.
The Coquimbo Region was the most affected by the tsunami. Authors such as Tomita et al. (2016) indicate that the tsunami was diffracted and refracted by the Coquimbo Peninsula, and it then converged to the inner southwestern corner of Coquimbo Bay. In the bay, the maximum run-up was 14 m in the Baquedano sector (Fig. 1), whereas towards the north the run-up only reached < 0.5 m and, according to our reconstruction, the waves penetrated inland more than 950 m in the Elqui mouth and almost 700 m in Culebrón stream mouth, while in Coquimbo Port and Serena they only reached 100–200 m and ca. 30 m, respectively (Fig. 2b and c).
Both the earthquake and the tsunami caused 12 fatalities, 12 injuries and a total of 118 812 people affected in the Coquimbo Region (CCT-ONEMI, 2015). The most significant effects are recorded in the denominated “zero zone” located in the sector of Baquedano and Coquimbo Port. There, the tsunami hit hard, affecting the port structure, the local market, the fishing creek, commerce and a large number of private homes. In addition, 17 boats were dragging from the sea. After the tsunami event, MINVU elaborated an inventory that included 1921 houses with non-repairable damages and 5364 houses with various degrees of damages.
Coquimbo Port is in the southwestern sector of the Coquimbo Bay (Figs. 1 and 5). The analysis of this sector considers 136 buildings that represent 10.98 % of the total. Here the reconstructed flood shows flow depths higher than 2 m (Figs. 2 and 4a). Although it does not present a natural barrier, the buildings in this sector (mostly one and two stories) are protected by a 3–5 m vertical seawall. Very high or high RVI occur along the coastline and represent the most important category in the PTVA-4 model (33.83 %) while they only represent 23.53 % in the PTVA-3 model (Fig. 5a and b and Table 6). In this first building row, both the waves and movable objects available in the port would impact the buildings (as it happened in 2016; Fig. 4b), which are mainly constructed with light materials (Fig. 4a). Some isolated constructions are moderately vulnerable to a tsunami impact, regardless their distance from the coast, due to attributes such as the construction material, the preservation status or the foundations (Fig. 5a and b). For flow depths ranging from 1 to 2 m, the PTVA-3 model results vary according to the location of the buildings. Most of buildings located in second or third row have moderate or average vulnerability when compared with constructions in the first row that score high or average RVI. For PTVA-4, a high–moderate RVI is predominant in these flow depths interval. However, in both models, the buildings with minor RVI are affected by flow depths smaller than 1 m. Finally, our results indicate that PTVA-4 obtains the largest number of buildings with high and very high RVI scores (Table 6).
Sector 2, located south in the Coquimbo Bay, is partially protected by a small marshland (Figs. 1 and 5) that has been included in the model as a natural barrier (nb = 0.5). In contrast, the non-existence of a seawall in the area together with the low topographic elevation cause tsunami flow depths in this area up to 4 m (Fig. 5c and d), affecting a total of 475 buildings (38.34 %) (Table 6). Baquedano is the historical center of Coquimbo and its residential houses are more than 100 years old. The sector presents a wide variety of building materials from concrete block masonry to tin plate, red brick or adobe. First-row buildings present RVI scores ranging from minor to very high as the southern ones are protected by marsh bodies that retain the energy propagated by the tsunami wave. In addition, some building features included in the Bv parameter, such as the number of stories and the foundations, help to decrease the RVI scores. Although partially protected by the marshland, the area is exposed to flow depths > 3 m that result in a very high and high RVI score percentage (7.78 and 11.15 % for the PTVA-3 and PTVA-4 models, respectively) (Table 6). The most vulnerable buildings in the sector are one or two stories (Fig. 4c, d and e) and they are located in the first three building rows. In most cases, buildings with an average or minor RVI correspond to different types of buildings with flow depths < 1 m, moderately protected by natural or anthropogenic barriers and/or reinforced concrete story buildings with more than five floors and deep foundations (Fig. 4f), regardless of their location with respect to the coastline (Fig. 5c and d). Most of the buildings (63.16 %) obtain an average RVI score using the PTVA-4 model, whereas using the PTVA-3 model only 30.53 % obtained this classification. In the latter, most of the buildings are classified as moderate vulnerability (Fig. 5c).
La Cantera, located southeast of the Coquimbo Bay (Figs. 1 and 5) presents, as sector 2 did, a moderate extension of marshland, i.e., a natural barrier, and no seawall protection, with an overall low topographic elevation. The flood scenario shows flow depths that range from 0 to 3 m although in the urbanized area depths only reach up to 2 m. Most of the constructions in the sector are detached or bungalow houses that are isolated and separated by several hundred of meters. This circumstance increases the potential damage of the waves and the impact of movable objects (Fig. 4g). A total of 125 buildings have been considered in the sector (10.09 % of the total analysis; Table 6). For both PTVA models, buildings with flow depths ranging from 1 to 2 m due to their characteristics (small number of stories, poor ground floor hydrodynamics and/or average depth foundation) and the effect to direct exposure to the tsunami waves and movable objects obtain an average RVI score. In contrast, most of the buildings with flow depths < 1 m obtained RVI scores that range from minor to moderate using both models. In summary, in this sector the flood area reaches 350 m of inland penetration and most of the affected polygons present a moderate RVI (Table 6). However, the PTVA-3 model indicates an average–moderate RVI (83.2 %) whereas the PTVA-4 model shows a moderate–minor RVI classification (73.6 %) (Fig. 5e and f).
The location of Caleta Peñuelas, between Coquimbo and La Serena, results in almost all of its urbanized area being affected by the tsunami flood (Figs. 1 and 5). This sector analysis contemplates 26.31 % of the total evaluated buildings (326 buildings) (Table 6). In this area, most of the houses are one- or two-story buildings (322 houses; 98.77 % of buildings total) and according to the tsunami reconstruction they would be affected by flow depths < 1 m. In addition, the buildings are generally constructed using lightweight materials such as wood, aluminium or red brick, with average or shallow foundations. The ground floor hydrodynamics can be generally described as not open plan (Fig. 4h), which causes the building structure to directly receive the tsunami wave. The polygons located between the road and the Pacific Ocean (Fig. 5g and h) are directly constructed in the beach and correspond to restaurants and other facilities that results in average RVI scores in both models mainly due to the low flow depths. Landward, the main group of buildings shows a predominant moderate and minor RVI scores for the PTVA-3 and 4, respectively (Table 6).
The coastal border of La Pampa is one of the residential and touristic sectors in La Serena (Fig. 1) that according to the reconstructed scenario was very minimally affected. The flow depths in the sector are < 1 m and constrained to a narrow area next to the coastline. The urban development in this sector is mainly characterized by reinforced concrete story buildings with more than five floors and deep foundations (23.02 %). The other buildings features are quite heterogeneous, including different construction materials, shallower foundations and less floors, and are thus more vulnerable. A total of 120 buildings have been analyzed in this sector (9.68 % of the total). The results obtained (Fig. 5i and j) classify the area as a relatively safe sector under the 2015 tsunami scenario, with most of the obtained RVI scores being minor in both models (Table 6).
The last sector, La Serena, considers 4.6 % of the studied polygons, i.e., 57 (Table 6). The flow depth in this area is < 1 m with the smallest affected area. As in sector 5, buildings in La Serena correspond to reinforced concrete structures with more than five floors. The RVI assessment shows that La Serena is a sector with moderate–minor RVI scores for this tsunami scenario (89.48 and 98.25 % for the PTVA-3 and PTVA-4 models, respectively) (Table 6). These circumstances are associated with the flow depth in the sector and the type of constructions (Fig. 5k and l).
6.1 PTVA-3 vs. PTVA-4 results
The distribution of the final RVI scores in the cities of La Serena–Coquimbo allows us to compare the vulnerability scores. Figure 6a shows the distribution of the flow depth impacting each building according to the field-based reconstructed scenario. The maximum value is 3.49 m but most of the buildings were flooded less than 0.5 m. In general, both models show a spatial distribution with the highest RVI scores located closer to the shoreline and average to minor vulnerabilities in the inland buildings. Similar spatial patterns of the RVI scores have been described by different authors under different tsunami scenarios, geomorphologic settings and/or diverse urban features (e.g., Alberico et al., 2015; Dall'Osso et al., 2016).
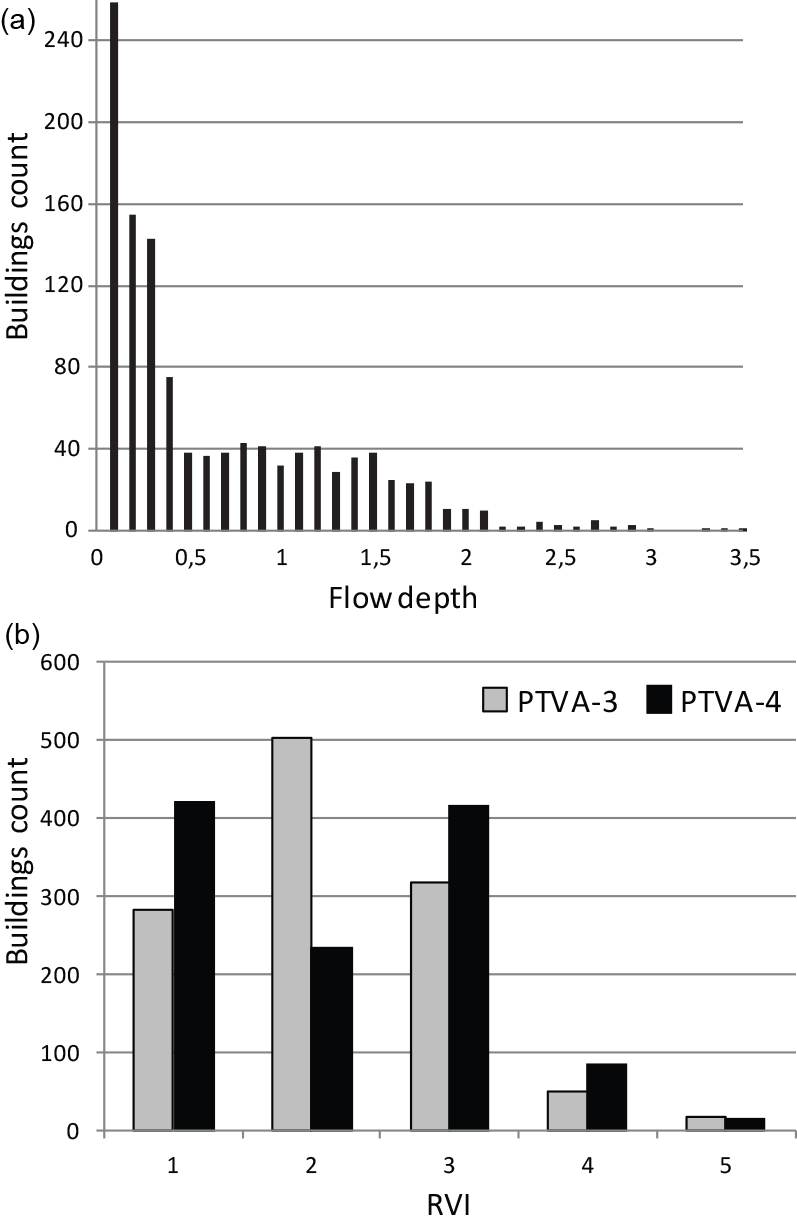
Figure 6(a) Number of buildings exposed to the different water depth (WD) ranges in Coquimbo Bay in the reconstructed 2015 tsunami scenario. (b) RVI scores obtained for the total 1239 buildings analyzed after the PTVA-3 and PTVA-4 models.
Dall'Osso et al. (2016) showed that the Ex, Bv and Prot parameters are better distributed using the PTVA-4 model than with the PTVA-3 due to the difference in the re-scaling procedure adopted by the models. Therefore, according to them, the newest model RVI scores should be more representative. Figure 6b shows the distribution of the final RVI scores obtained with the PTVA-3 and PTVA-4 models. To compare both models we used the Jenks' Natural Breaks Algorithm (Jenks, 1977), classifying the RVI scores in five categories for the PTVA-4 model. For the very high and high RVI, both models show a similar number of buildings, although the total number in these categories is small and only represents < 10 % of the total analyzed buildings. The less vulnerable categories do not show a clear tendency. While the number of buildings with minor and average RVI scores in the PTVA-4 is higher, this pattern is inverted for the moderate category. In this sense, according to the PTVA-4 model RVI results, the largest number of buildings will be classified as minor and average vulnerability, which should be a better reflection of the expected scenario then the PTVA-3 model results (Dall'Osso et al., 2016).
6.2 PTVA model vs. fragility curves
Very recently, Aránguiz et al. (2017) analyzed the buildings response to the 2015 tsunami in the most damaged area of Coquimbo (sector 2 in our study). They developed a tsunami fragility curve in the basis of field survey data and numerical modeling simulations without considering reinforced concrete or light structures. The authors only differentiated two damage categories and established a single fragility curve that indicates that for a 2 m flow depth a 20 % damage probability exists, i.e., 20 % of the buildings will present high structural damages or will collapse. According to this curve, the 100 % damage probability occur at 4 m flow depth. Unfortunately, this study does not include the analysis of all the buildings in the sector and only differentiates between two damage categories (repairable and non-repairable). Therefore, their results show a bias and a coarser and binary approach to the vulnerability whereas the PTVA approach provides more categorized results. Even though a simpler differentiation between two categories might be useful for emergency preparedness, more accurate damage results help identify areas that require structural or non-structural mitigation measures or evacuation routes and thus represent a better tool for land-use planning and disaster management.
6.3 Tsunami vulnerability model validation
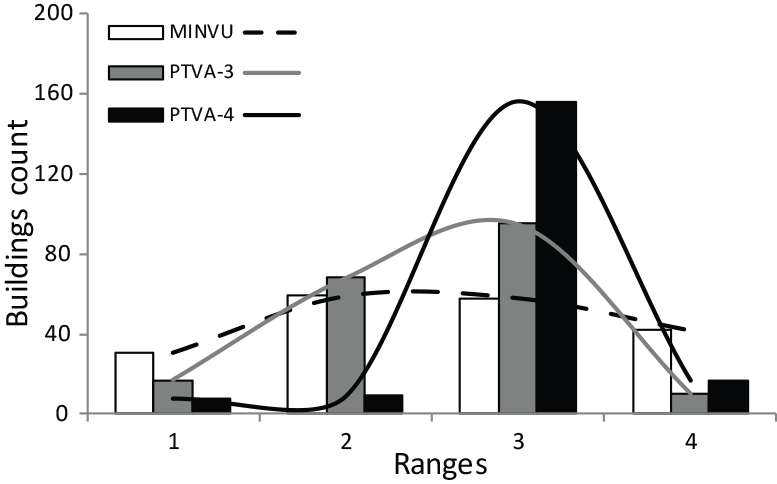
As pointed out by Dall'Osso et al. (2016) the PTVA-3 and PTVA-4 models provide a RVI score that can be used to compare the expected performance of buildings. We have compared the two models' results with the real damages occurred after the 2015 event, which was used for the flood scenario, in sector 2 (Fig. 7). This sector present a variety of architectonical characteristics and was flooded with high flow depths; therefore it can be used as a good example to check both models as it presents different flow depths and RVI scores in all the categories. After the tsunami, MINVU assessed a total of 190 buildings in this sector, which represents only 40 % of the total buildings we assessed in this study (Table 6).
We have compared the RVI trends with the MINVU data trend (Fig. 7): the curves show a unimodal distribution with the maximum located in the third range in the PTVA models and in the second range in the actual damages. The latter presents dispersed values along the range axis without any of the categories being more significant than the others. In contrast, the PTVA-3 RVI values reveal a normal distribution with a better-defined maximum and a negative asymmetry, resulting in smaller RVI scores. Finally, the RVI scores obtained in PTVA-4 show a well-defined peak; i.e., most of the values are concentrated in one range. Although PTVA-4 model shows better accuracy according to Dall'Osso et al. (2016), our data suggest a larger imbalance in the trend respect to the PTVA-3 model when compared to the actual performance of building trends. In any case, clear differences exist among both models and the real damages in the scenario.
This paper analyses and validates the use of the two latest versions of the PTVA model (PTVA-3 and PTVA-4) in a real case scenario, the 16 September 2015 event in the cities of La Serena and Coquimbo. Results of both models show that in the reconstructed scenario the most vulnerable areas are sectors 1 and 2 (Coquimbo Port and Baquedano), which agrees with the most damaged areas after the 2015 tsunami. Both models result in a similar number of very high and high RVI scores, although these categories only represent < 10 % of the total analyzed buildings; the less vulnerable categories do not show a similar trend and PTVA-4 model obtains a larger number of minor and average RVI scores that should be a better reflection of the expected buildings performance. However, when compared with the actual damages occurred after the 2015 tsunami in the Baquedano sector, the PTVA-3 RVI scores show a normal distribution that is more similar to the actual damage distribution trend than that obtained by the PTVA-4 model, which shows a more concentrated distribution of the RVI scores. Even though the Chilean construction regulation is severe, historical buildings are still vulnerable to tsunami impacts and, therefore, future tsunami mitigation measures should focus on these areas.
Data can be access via e-mail to the corresponding author.
The authors declare that they have no conflict of interest.
This work has been funded by the Project DIUDA 15/10 (22279) of the
Universidad de Atacama. The authors want to thank three anonymous reviewers
whose suggestions greatly improved the manuscript and the editor Maria Ana Baptista for her kind help during the revision process.
Edited by: Maria Ana Baptista
Reviewed by: three anonymous referees
Abad, M., Izquierdo, T., and Ruiz, F.: El registro de tsunamis como herramienta para el análisis y mitigación del riesgo en la costa de Huelva (SO de España), Fundación MAPFRE, Huelva, España, 46 pp., 2014.
Alberico, I., Di Fiore, V., Iavarone, R., Petrosino, P., Piemontese, L., Tarallo, D., Punzo, M., and Marsella, E.: The Tsunami Vulnerability Assessment of Urban Environments through Freely Available Datasets: The Case Study of Napoli City (Southern Italy), J. Mar. Sci. Eng., 3, 981–1005, https://doi.org/10.3390/jmse3030981, 2015.
Aránguiz, R., González, G., González, J., Catalán, P. A., Cienfuegos, R., Yagi, Y., Okuwaki, R., Urra, L., Contreras, K., Del Rio, I., and Rojas, C.: The 16 September 2015 Chile Tsunami from the Post-Tsunami Survey and Numerical Modeling Perspectives, Pure Appl. Geophys., 173, 333–348, https://doi.org/10.1007/s00024-015-1225-4, 2016.
Aránguiz, R., Urra, L., Okuwaki, Y., and Yagi, Y.: Tsunami fragility curve using field data and numerical simulations of the 2015 tsunami in Coquimbo, Chile, Nat. Hazards Earth Syst. Sci. Discuss., https://doi.org/10.5194/nhess-2017-364, in review, 2017.
Barros, L., Emídio, A., Tavares, A. O., and Santos, Â.: Metodologias de avaliação da vulnerabilidade ao risco de tsunami: aplicação ao sector costeiro Cova Gala – Leirosa; Figuiera da Foz, in: IX Congresso da Geografia Portuguesa, Évora, Portugal, 28–30 Novembro 2013, 839–845, 2013.
Beck, S., Barrientos, S., Kausel, E., and Reyes, M.: Source characteristics of historic earthquakes along the central Chile subduction zone, J. South Am. Earth Sci., 11, 115–129, https://doi.org/10.1016/S0895-9811(98)00005-4, 1998.
Bobillier, C.: Año de 1922: Terremoto de Atacama, Boletín del Servicio Sismológico de Chile – XVI, Santiago, Chile, 44 pp., 1926.
CCT-ONEMI: Análisis Multisectorial Eventos 2015: Evento Hidrometeorológico Marzo – Terremoto/Tsunami Septiembre, ONEMI, Chile, 56 pp., 2015.
Cisternas, M., Atwater, B. F., Torrejón, F., Sawai, Y., Machuca, G., Lagos, M., Eipert, A., Youlton, C., Salgado, I., Kamataki, T., Shishikura, M., Rajendran, C. P., Malik, J. K., Rizal, Y., and Husni, M.: Predecessors of the giant 1960 Chile earthquake, Nature, 437, 404–407, https://doi.org/10.1038/nature03943, 2005.
Cisternas, M., Garrett, E., Wesson, R., Dura, T., and Ely, L. L.: Unusual geologic evidence of coeval seismic shaking and tsunamis shows variability in earthquake size and recurrence in the area of the giant 1960 Chile earthquake, Mar. Geol., 385, 101–113, https://doi.org/10.1016/j.margeo.2016.12.007, 2017.
Contreras-López, M., Winckler, P., Sepúlveda, I., Andaur-Álvarez, A., Cortés-Molina, F., Guerrero, C. J., Mizobe, C. E., Igualt, F., Breuer, W., Beyá, J. F., Vergara, H., and Figueroa-Sterquel, R.: Field Survey of the 2015 Chile Tsunami with Emphasis on Coastal Wetland and Conservation Areas, Pure Appl. Geophys., 173, 349–367, https://doi.org/10.1007/s00024-015-1235-2, 2016.
Dall'Osso, F., Gonella, M., Gabbianelli, G., Withycombe, G., and Dominey-Howes, D.: A revised (PTVA) model for assessing the vulnerability of buildings to tsunami damage, Nat. Hazards Earth Syst. Sci., 9, 1557–1565, https://doi.org/10.5194/nhess-9-1557-2009, 2009a.
Dall'Osso, F., Gonella, M., Gabbianelli, G., Withycombe, G., and Dominey-Howes, D.: Assessing the vulnerability of buildings to tsunami in Sydney, Nat. Hazards Earth Syst. Sci., 9, 2015–2026, https://doi.org/10.5194/nhess-9-2015-2009, 2009b.
Dall'Osso, F., Maramai, A., Graziani, L., Brizuela, B., Cavalletti, A., Gonella, M., and Tinti, S.: Applying and validating the PTVA-3 Model at the Aeolian Islands, Italy: assessment of the Vulnerability of buildings to tsunamis, Nat. Hazards Earth Syst. Sci., 10, 1547–1562, https://doi.org/10.5194/nhess-10-1547-2010, 2010.
Dall'Osso, F., Dominey-Howes, D., Tarbotton, C., Summerhayes, S., and Withycombe, G.: Revision and improvement of the PTVA-3 model for assessing tsunami building vulnerability using “international expert judgment”: introducing the PTVA-4 model, Nat. Hazards, 83, 1229–1256, https://doi.org/10.1007/s11069-016-2387-9, 2016.
DeMets, C., Gordon, R. G., and Argus, D. F.: Geologically current plate motions, Geophys. J. Int., 181, 1–80, https://doi.org/10.1111/j.1365-246X.2009.04491.x, 2010.
Dominey-Howes, D., Dunbar, P., Varner, J., and Papathoma-Köhle, M.: Estimating probable maximum loss from a Cascadia tsunami, Nat. Hazards, 53, 43–61, https://doi.org/10.1007/s11069-009-9409-9, 2010.
Dunbar, P., McCullough, H., Mungov, G., Varner, J., and Stroker, K.: Tohoku earthquake and tsunami data available from the National Oceanic and Atmospheric Administration/National Geophysical Data Center, Geomat. Nat. Haz. Risk, 2, 305–323, https://doi.org/10.1080/19475705.2011.632443, 2011.
Ely, L. L., Cisternas, M., Wesson, R. L., and Dura, T.: Five centuries of tsunamis and land-level changes in the overlapping rupture area of the 1960 and 2010 Chilean earthquakes, Geology, 42, 995–998, https://doi.org/10.1130/G35830.1, 2014.
Fuentes, M., Riquelme, S., Hayes, G., Medina, M., Melgar, D., Vargas, G., González, J., and Villalobos, A.: A Study of the 2015 Mw 8.3 Illapel Earthquake and Tsunami: Numerical and Analytical Approaches, Pure Appl. Geophys., 173, 1847–1858, https://doi.org/10.1007/s00024-016-1305-0, 2016.
Heidarzadeh, M., Murotani, S., Satake, K., Ishibe, T., and Gusman, A. R.: Source model of the 16 September 2015 Illapel, Chile, Mw 8.4 earthquake based on teleseismic and tsunami data. Geophys. Res. Lett., 43, 643–650, 2016.
Hidalgo, R., Arenas, F., and Monsalve R.: La conurbación La Serena – Coquimbo: problemas y desafíos de su transformación metropolitana, Chile: del país urbano al país metropolitano, edited by: Hidalgo, R., de Mattos, C. A., and Arenas, F., Pontificia Universidad Católica de Chile, Santiago, Chile, 161–184, 2009.
Jenks, G. F.: Optimal data classification for choropleth maps, Occasional Paper No. 2, Department of Geography, University of Kansas, Kansas, USA, 1977.
Jordan, T. E., Isacks, B. L., Allmendinger, R. W., Brewer, J. A., Ramos, V. A., and Ando, C. J.: Andean tectonics related to geometry of subducted Nazca plate, Geol. Soc. Am. Bull., 94, 341–361, https://doi.org/10.1130/0016-7606(1983)94<341:ATRTGO>2.0.CO;2, 1983.
Kempf, P., Moernaut, J., Van Daele, M., Vandoorne, W., Pino, M., Urrutia, R., and De Batist, M.: Coastal lake sediments reveal 5500 years of tsunami history in south central Chile, Quaternary Sci. Rev., 161, 99–116, https://doi.org/10.1016/j.quascirev.2017.02.018, 2017.
Kulikov, E. A., Rabinovich, A. B., and Thomson, R. E.: Estimation of Tsunami Risk for the Coasts of Peru and Northern Chile, Nat. Hazards, 35, 185–209, https://doi.org/10.1007/s11069-004-4809-3, 2005.
Lomnitz, C.: Major Earthquakes of Chile: A Historical Survey, 1535–1960, Seismol. Res. Lett., 75, 368–378, https://doi.org/10.1785/gssrl.75.3.368, 2004.
Lunecke, M. G. H.: Planificación territorial y mitigación de impacto de tsunami en Chile después del 27 Febrero 2010, Revista de Urbanismo, 0, 20–33, 2016.
Madani, S., Khaleghi, S., and Jannat, M. R. A.: Assessing building vulnerability to tsunami using the PTVA-3 model: A case study of Chabahar Bay, Iran, Nat. Hazards, 85, 349–359, https://doi.org/10.1007/s11069-016-2567-7, 2016.
Maureira, G. C.: Estudio del impacto turístico-inmobiliario en el borde costero de Coquimbo y La Serena, Chile, Revista Turismo em Análise, 9, 88–106, https://doi.org/10.11606/issn.1984-4867.v9i2p88-106, 1998.
Mück, M., Taubenböck, H., Post, J., Wegscheider, S., Strunz, G., Sumaryono, S., and Ismail, F. A.: Assessing building vulnerability to earthquake and tsunami hazard using remotely sensed data, Nat. Hazards., 68, 97–114, 2013.
Nishenko, S. P.: Seismic potential for large and great interpolate earthquakes along the Chilean and southern Peruvian margins of South America: A quantitative reappraisal, J. Geophys. Res., 90, 3589–3615, https://doi.org/10.1029/JB090iB05p03589, 1985.
Omira, R., Baptista, M. A., Miranda, J. M., Toto, E., Catita, C., and Catalao, J.: Tsunami vulnerability assessment of Casablanca Morocco using numerical modelling and GIS tools, Nat. Hazards., 54, 75–95, 2010.
Omira, R., Baptista, M. A., and Lisboa, F.: Tsunami characteristics along the Peru–Chile trench: Analysis of the 2015 Mw8.3 Illapel, the 2014 Mw8.2 Iquique and the 2010 Mw8.8 Maule tsunamis in the near-field, Pure. Appl. Geophys., 173, 1063–1077, 2016.
Papathoma, M. and Dominey-Howes, D.: Tsunami vulnerability assessment and its implications for coastal hazard analysis and disaster management planning, Gulf of Corinth, Greece, Nat. Hazards Earth Syst. Sci., 3, 733–747, https://doi.org/10.5194/nhess-3-733-2003, 2003.
Pardo, M., Comte, D., and Monfret, T.: Seismotectonic and stress distribution in the central Chile subduction zone, J. South Am. Earth Sci., 15, 11–22, https://doi.org/10.1016/S0895-9811(02)00003-2, 2002.
Ruiz, S., Klein, E., del Campo, F., Rivera, E., Poli, P., Metois, M., Christophe, V., Baez, J. C., Vargas, G., Leyton, G., Madariaga, R., and Fleitout, L.: The Seismic Sequence of the 16 September 2015 Mw 8.3 Illapel, Chile, Earthquake, Seismol. Res. Lett., 87, 1–11, https://doi.org/10.1785/0220150281, 2016.
Santos, A., Tavares, A. O., and Emidio, A.: Comparative tsunami vulnerability assessment of an urban area: An analysis of Setúbal city, Portugal, Appl. Geogr., 55, 19–29, https://doi.org/10.1016/j.apgeog.2014.08.009, 2014.
Satake, K. and Heidarzadeh, M.: A Review of Source Models of the 2015 Illapel, Chile Earthquake and Insights from Tsunami Data, Pure. Appl. Geophys., 174, 1–9, 2017.
SERNAGEOMIN: Zonas afectadas por inundación por Tsunami Comuna de Coquimbo, Mapa de inundación del 21 de septiembre de 2015, 2015.
Simons, M., Minson, S. E., Sladen, A., Ortega, F., Jiang, J., Owen, S. E., Meng, L., Ampuero, J., Wei, S., Chu, R., Helmberger, D. V., Kanamori, H., Hetland, E., Moore, A. W., and Webb, F. H.: The 2011 Magnitude 9.0 Tohoku-Oki Earthquake: Mosaicking the Megathrust from Seconds to Centuries, Science, 332, 1421–1425, https://doi.org/10.1126/science.1206731, 2011.
SHOA: El Maremoto del 22 de Mayo de 1960 en las costas de Chile, 2, SHOA, Valparaíso, Chile, 72 pp., 2000.
SHOA: Registro de los principales tsunamis que han afectado a la costa de Chile, available at: http://www.shoa.cl/servicios/tsunami/data/tsunamis_historico.pdf, last access: 28 July 2016.
Smith, R.: The biggest one, Nature, 465, 24–25, https://doi.org/10.1038/465024a, 2010.
Soloviev, S. L. and Go, C. N.: Catalogue of Tsunamis on the Eastern Shore of the Pacific Ocean, Nauka Publ. House, Moscow, 204 pp., 1975. (in Russian; English translation: Canadian Transl. Fish. Aquatic Sci., Ottawa, 5078, 293 pp., 1984).
Tarbotton, C., Dall'Osso, F., Dominey-Howes, D., and Goff, J.: The use of empirical vulnerability functions to asses the response of buildings to tsunami impact: comparative review and summary of best practice, Earth. Sci. Rev., 142, 120–134, 2015.
Tassara, A., Götze, H. J., Schmidt, S., and Hackney, R.: Three-dimensional density model of the Nazca plate and the Andean continental margin, J. Geophys. Res., 111, B09404, https://doi.org/10.1029/2005JB003976, 2006.
Tomita, T., Arikawa, T., Takagawa, T., Honda, K., Chida, Y., Sase, K., and Olivares, R. A. O.: Results of Post-Field Survey on the Mw 8.3 Illapel Earthquake Tsunami in 2015, Coast. Eng. J., 58, 1–17, https://doi.org/10.1142/S0578563416500030, 2016.
Vera San Martín, T., Rodriguez Rosado, G., Arreaga Vargas, P., and Gutierrez, L.: Population and building vulnerability assessment by possible worst-case tsunami scenarios in Salinas, Ecuador, Nat. Hazards., in press, https://doi.org/10.1007/s11069-018-3300-5, 2018.
Voulgaris, G. and Murayama, Y.: Tsunami Vulnerability assessment in the Southern Boso Peninsula, Japan, Int. J. Disaster Risk Reduct., 10, 190–200, https://doi.org/10.1016/j.ijdrr.2014.09.001, 2014.