the Creative Commons Attribution 4.0 License.
the Creative Commons Attribution 4.0 License.
 | 04 Apr 2018
Regional rainfall thresholds for landslide occurrence using a centenary database
José Luís Zêzere
Susana Pereira
Sérgio Cruz Oliveira
Ricardo A. C. Garcia
Ivânia Quaresma
This work proposes a comprehensive method to assess rainfall thresholds for landslide initiation using a centenary landslide database associated with a single centenary daily rainfall data set. The method is applied to the Lisbon region and includes the rainfall return period analysis that was used to identify the critical rainfall combination (cumulated rainfall duration) related to each landslide event. The spatial representativeness of the reference rain gauge is evaluated and the rainfall thresholds are assessed and calibrated using the receiver operating characteristic (ROC) metrics.
Results show that landslide events located up to 10 km from the rain gauge can be used to calculate the rainfall thresholds in the study area; however, these thresholds may be used with acceptable confidence up to 50 km from the rain gauge. The rainfall thresholds obtained using linear and potential regression perform well in ROC metrics. However, the intermediate thresholds based on the probability of landslide events established in the zone between the lower-limit threshold and the upper-limit threshold are much more informative as they indicate the probability of landslide event occurrence given rainfall exceeding the threshold. This information can be easily included in landslide early warning systems, especially when combined with the probability of rainfall above each threshold.
- Article
(6557 KB) - Full-text XML
- BibTeX
- EndNote


Rainfall is the most important physical process for landslide triggering in Portugal (Zêzere et al., 2015; Vaz and Zêzere, 2016) as well as worldwide (e.g. Crozier, 1986; Crosta and Frattini, 2008). However, the relationship between rainfall and landslides is indirect and typically includes a process cascade where the rainfall is followed by infiltration into the soil, which increases the pore-water pressure that is responsible for the decrease in the shear strength of the slope materials (Terlien, 1998; Glade and Crozier, 2005).
During the last decades, the relationship between landslides and rainfall has been tentatively established by the assessment of rainfall thresholds, i.e. rainfall conditions (cumulated rainfall, intensity), that when reached or exceeded can induce a landslide event (Reichenbach et al., 1998; Guzzetti et al., 2007). The rainfall thresholds for slope failure have been proposed following a physical and empirical approach. The first approach considers the physical basis of the process using hydrological models and stability calculations (Terlien, 1998; Iverson, 2000; Frattini et al., 2009). However, it demands high-resolution data (e.g. groundwater conditions; shear strength properties) that often are not available for large areas (Guzzetti et al., 2007). The second approach is statistically based and is sustained by historical records regarding landslide events and rainfall data series (Guzzetti et al., 2007). Several thresholds have been proposed worldwide using the empirical approach, which can differ according to the kind of rainfall measurements and variables and the number of rain gauges used to calculate the threshold, as well as the geographical extent over which the threshold is applied.
The most common empirical rainfall thresholds used at local and regional scales are the rainfall intensity and duration (I–D) threshold, the event duration (E-D) threshold, the antecedent rainfall threshold and the combined threshold. The I–D threshold links the total height of rainfall and the rainfall intensity (Caine, 1980) and has been widely used as a power-law threshold (e.g. Guzzetti et al., 2008; Saito et al., 2010; Brunetti et al., 2010). It has shown good performance, especially for shallow landslides triggered by short and intense rainfall. Alternatively, the E-D threshold associates the cumulated-rainfall event with the rainfall event duration (e.g. Peruccacci et al., 2012). The antecedent rainfall thresholds assesses the influence of the antecedent rainfall on the groundwater levels and soil moisture, thus acting as a landslide preparatory factor. This is particularly important for deep-seated landslides induced normally by long-lasting rainfall periods (Martelloni et al., 2012). However, the definition of the critical rainfall period is an important source of bias for the antecedent rainfall (e.g. Guzzetti et al., 2007; Zêzere et al., 2015) and different periods have been proposed in the literature, ranging from a few days to several months (e.g. Glade et al., 2000; Cardinali et al., 2006). Finally, the combined thresholds include several combinations such as the rainfall event combined with rainfall intensity (e.g. Onodera et al., 1974), the event rainfall with the antecedent rainfall (e.g. Pereira and Zêzere, 2012), the event rainfall with the antecedent calibrated rainfall (e.g. Zêzere et al., 2005).
The rainfall thresholds for landslide activity obtained in a study area cannot be extrapolated for other regions, namely because of changes regarding the climatic regime (Glade et al., 2000). To allow the comparison of rainfall thresholds obtained in different areas, rainfall data have been normalized using two climatic indices: the mean annual precipitation (MAP) (Cannon, 1988) and the rainy day normal (RDN) (Wilson, 1997). The different rainfall parameters can be divided by the two climatic indices to obtain, for instance, the normalized intensity duration (e.g. Wieczorek et al., 2000), the normalized event duration (e.g. Giannecchini, 2005) and the normalized antecedent rainfall (e.g. Aleotti, 2004).
The rainfall measurements used to assess rainfall thresholds for landslide activity can be based on a single reference rain gauge (e.g. Zêzere et al., 2005; Marques et al., 2008; Martelloni et al., 2012) or on multiple rain gauges (e.g. Peruccacci et al., 2012). The close proximity, similar elevation and topographical and morphological settings are the preferable criteria with which to select the representative area of a rain gauge (Brunetti et al., 2010). However, the distance to where the rain gauge is spatially representative is a critical point that often is not addressed and can be an additional source of bias for the threshold definition, as pointed out by Nikolopoulos et al. (2015).
The assessment of rainfall thresholds implies the consideration of two types of information that link rainfall and landslides in a single study area: the rainfall events that triggered landslides in a defined time period in the past and the rainfall events that did not trigger landslides in the same time period. Considering the rainfall data sets associated (and non-associated) with landslide events two distinct rainfall thresholds can be defined: (i) the lower-limit threshold, which is the limit below which the landslides have not been recorded, and (ii) the upper-limit threshold, which is the limit above which landslides have always been recorded (Glade et al., 2000). The zone between the lower-limit and upper-limit thresholds includes rainfall conditions that triggered and did not trigger slope failures in the past. As a rule, the uncertainty increases with the gap between the lower-limit and upper-limit thresholds. Therefore, between the lower threshold and the upper threshold different probabilities of landslide occurrence exist that are important to quantify.
The main purpose of this study is to present and discuss a comprehensive method to assess rainfall triggering thresholds using a centenary landslide database associated with a single centenary daily rainfall data set. In addition, five specific objectives are stated: (i) to identify the critical combinations of cumulated rainfall duration for landslide occurrence, (ii) to compute the antecedent rainfall thresholds using linear and potential regression and define the lower-limit and the upper-limit rainfall thresholds, (iii) to assess the thresholds performance using receiver operating characteristic (ROC) metrics, (iv) to estimate the probability of rainfall threshold and the probability of landslide events above a specific rainfall threshold, and (v) to identify the geographical area where the rainfall thresholds can be applied.
The Lisbon region is located in the southern Portuguese Estremadura, which is divided into two parts by the Tagus River (Fig. 1). The landscape is marked by hills and valleys and three mountains of limited extension and altitude (Fig. 1): the Montejunto Mountain in the north-west (666 m altitude), the Sintra Mountain in the west (528 m) and the Arrábida Mountain in the south (501 m).
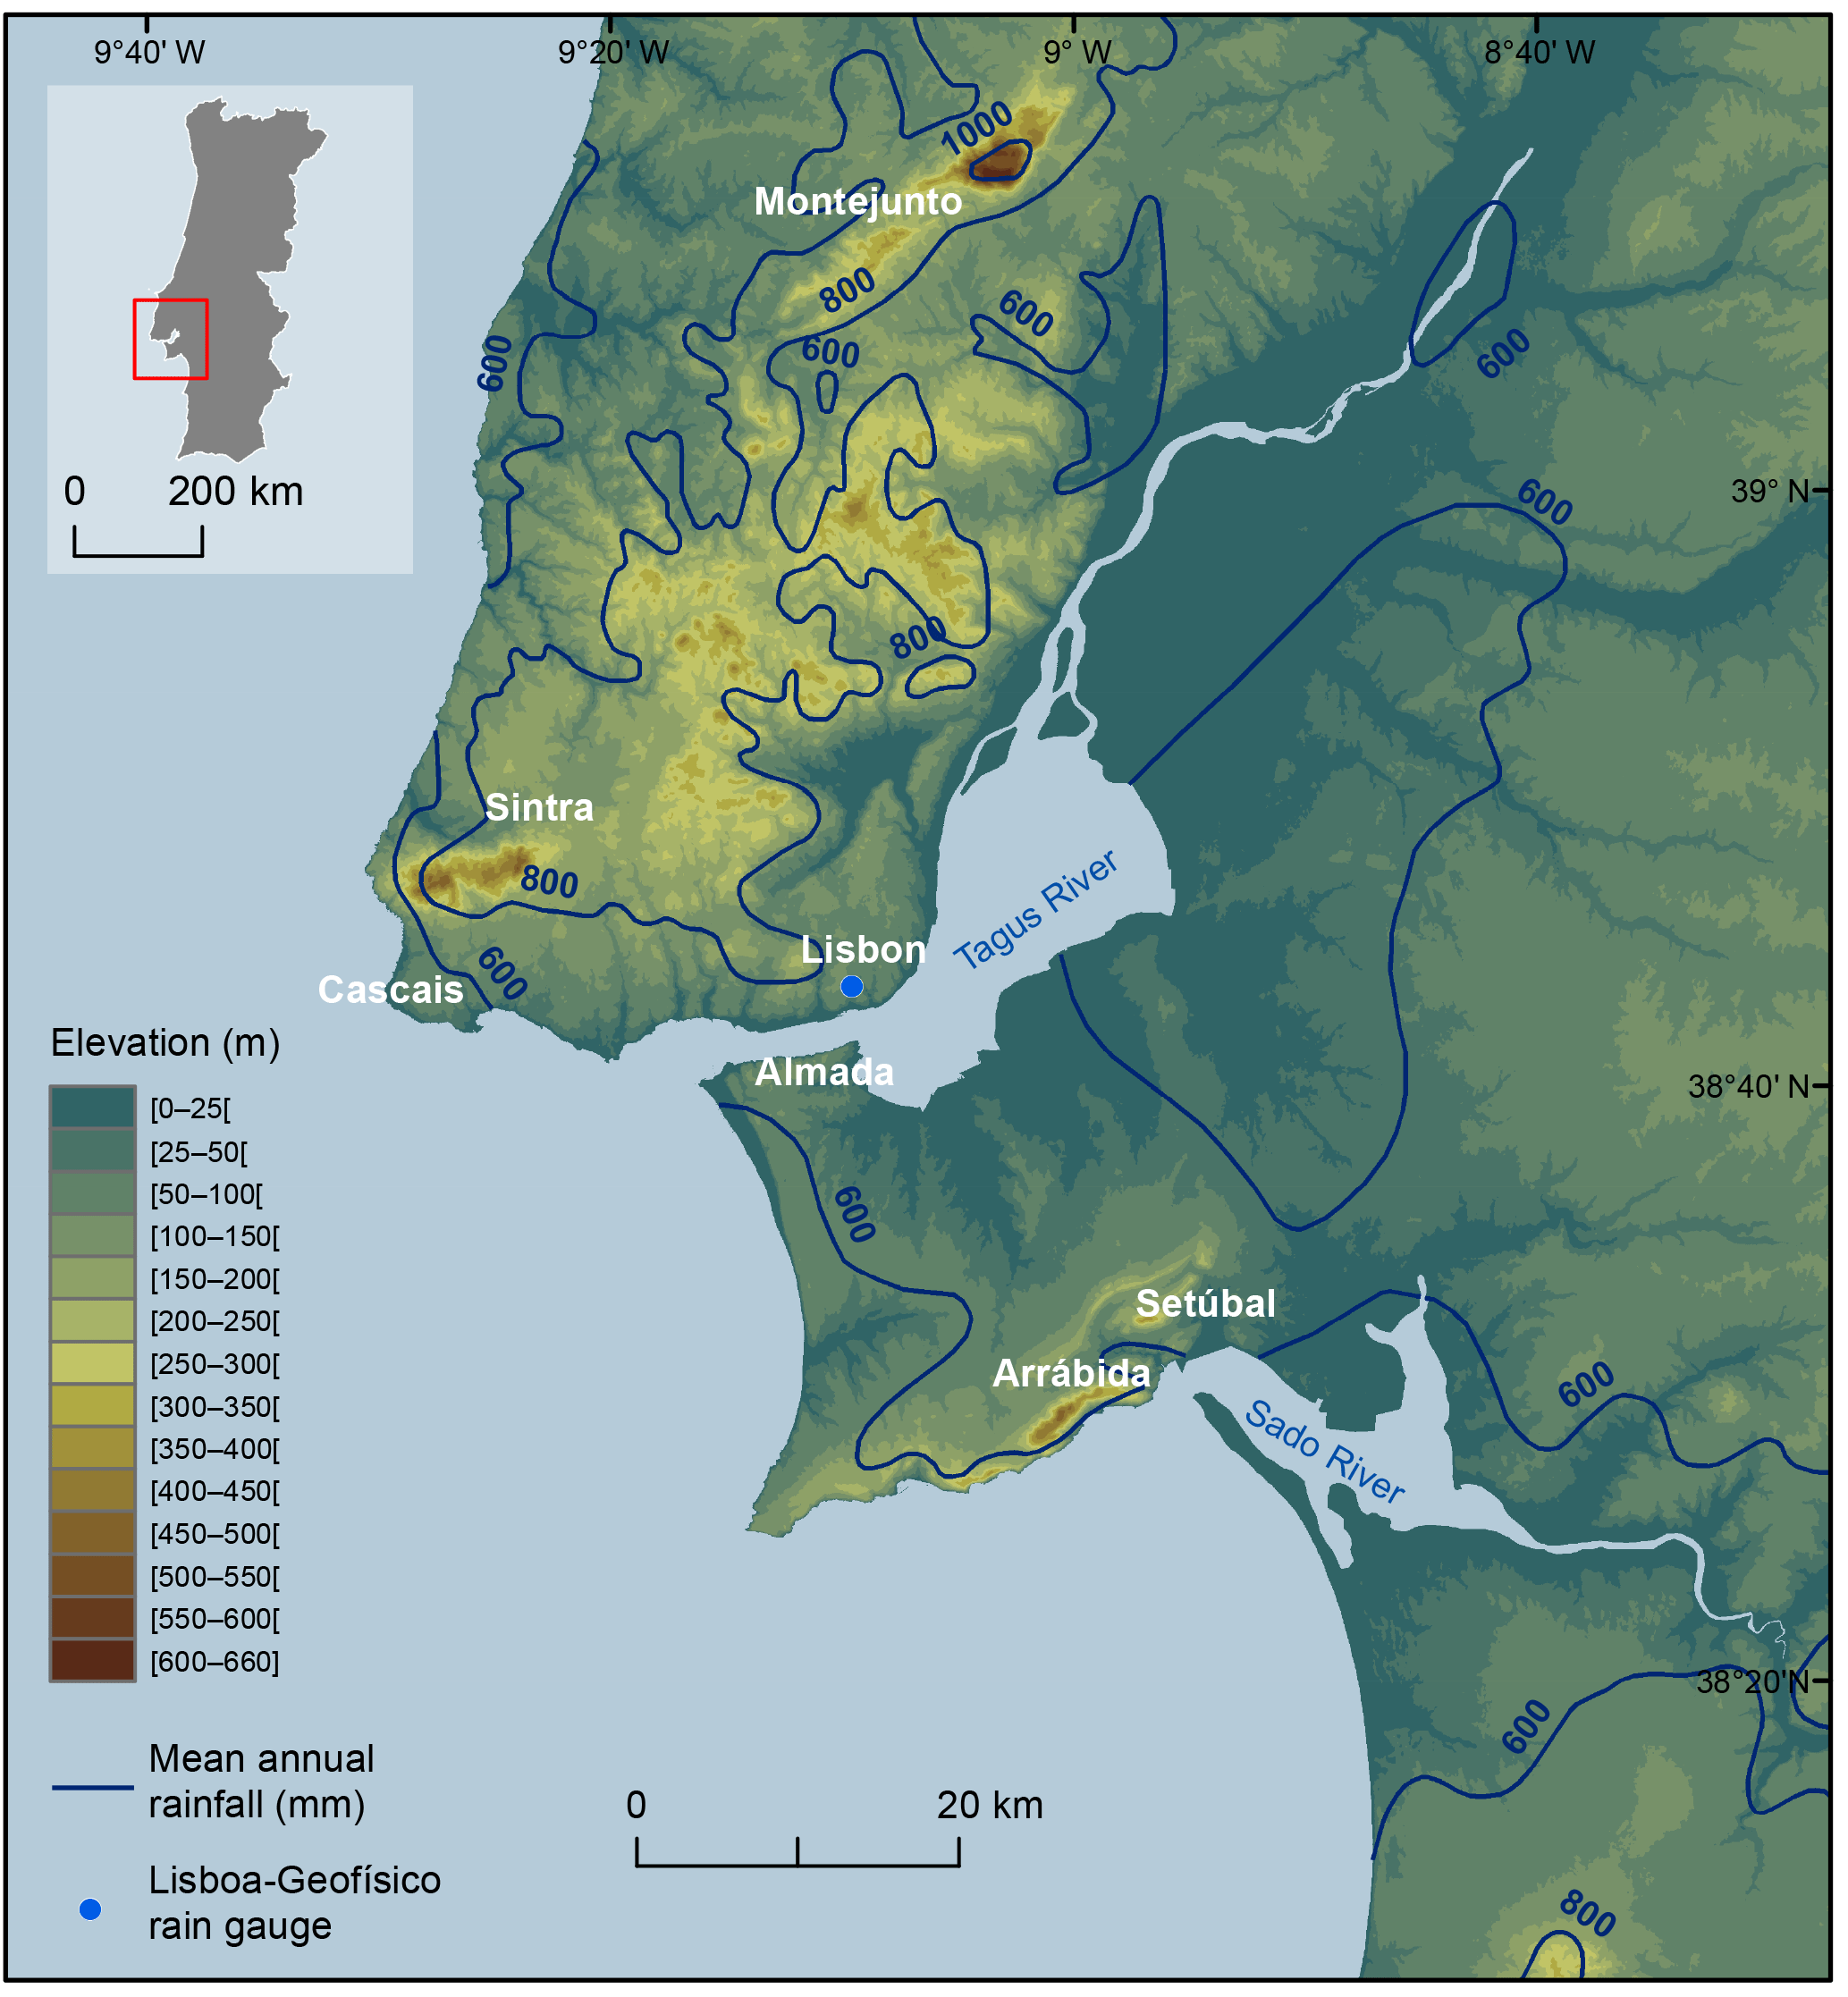
The climate in the Lisbon region, as in Portugal, is influenced by the subtropical anticyclone and the subpolar depression zone (Espírito Santo et al., 2014; Lima et al., 2015). The atmospheric general circulation combined with the orography and the oceanic and continental influences are the most important factors that shape the regional climate (Nunes and Lourenço, 2015). The rainfall regime is typically irregular, with an interannual and intra-annual variability (Kutiel and Trigo, 2014). The interannual variability is notorious in the centenary annual rainfall data registered at the Lisboa-Geofísico rain gauge (Fig. 2). The mean annual rainfall (MAR) is 709 mm, but the variability is very high and wet years can be followed by severely dry years. In some climatological years the annual rainfall reached twice the MAR (e.g. more than 1400 mm in 1876/1877), while other climatological years did not reach half of the MAR (e.g. less than 300 mm in 2004/2005).
The intra-annual rainfall regime is characterized by seasonality (Fig. 3), with two important seasons (dry and wet) separated by transition periods (Ribeiro et al., 1999). During 2 months of summer (July and August) the rainfall is almost absent in quantity and frequency. On average, only 1.3 % of the annual rainfall is concentrated in these months. The Azores anticyclone influence, in its north-westerly position, explains the warm and dry air that affects the Lisbon region during this season (Trigo and DaCamara, 2000). The monthly rainfall is highest from October to March, but with a strong interannual variability. On average, this period concentrates more than 75 % of the annual rainfall, with a frequent peak in November. This wet period is explained by the large-scale circulation led by the Icelandic low-pressure system, which brings moist air responsible for rainfall events (Trigo and DaCamara, 2000). September, April, May and June are transition months and can be highly variable from one year to another concerning the amount of rain.
As a rule, the types of weather circulation, associated with high rainfall amounts, are of cyclonic and westerly type (Trigo and DaCamara, 2000; Ramos et al., 2014). Recently, it was found that the winter storms in Europe, responsible for large amounts of precipitation, have a tendency to cluster temporally (Mailier et al., 2006; Vitolo et al., 2009; Pinto et al., 2013). Therefore, storms with high magnitude are followed by other storms, increasing the probability of inducing other natural hazards, such as floods and landslides.
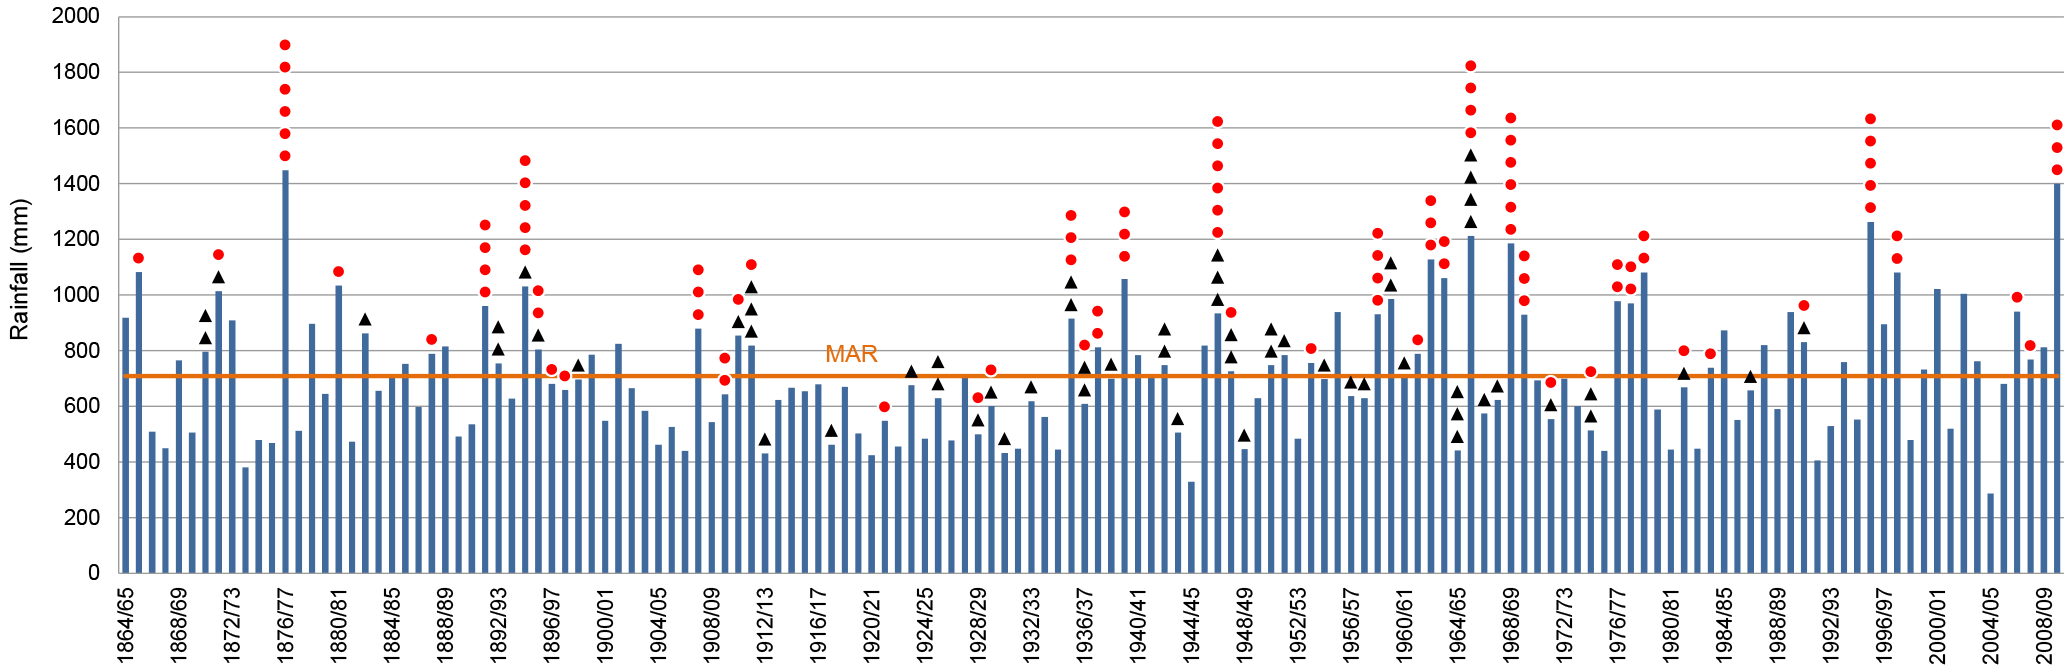
Figure 2Annual rainfall (climatological year: September to August) at Lisboa-Geofísico rain gauge for the period 1864/1865–2009/2010. Orange line symbolizes the mean annual rainfall (MAR); red dots and back triangles symbolize rainfall-triggered landslide events and non-rainfall-triggered landslide events, respectively, at a distance up to 10 km from the reference rain gauge.
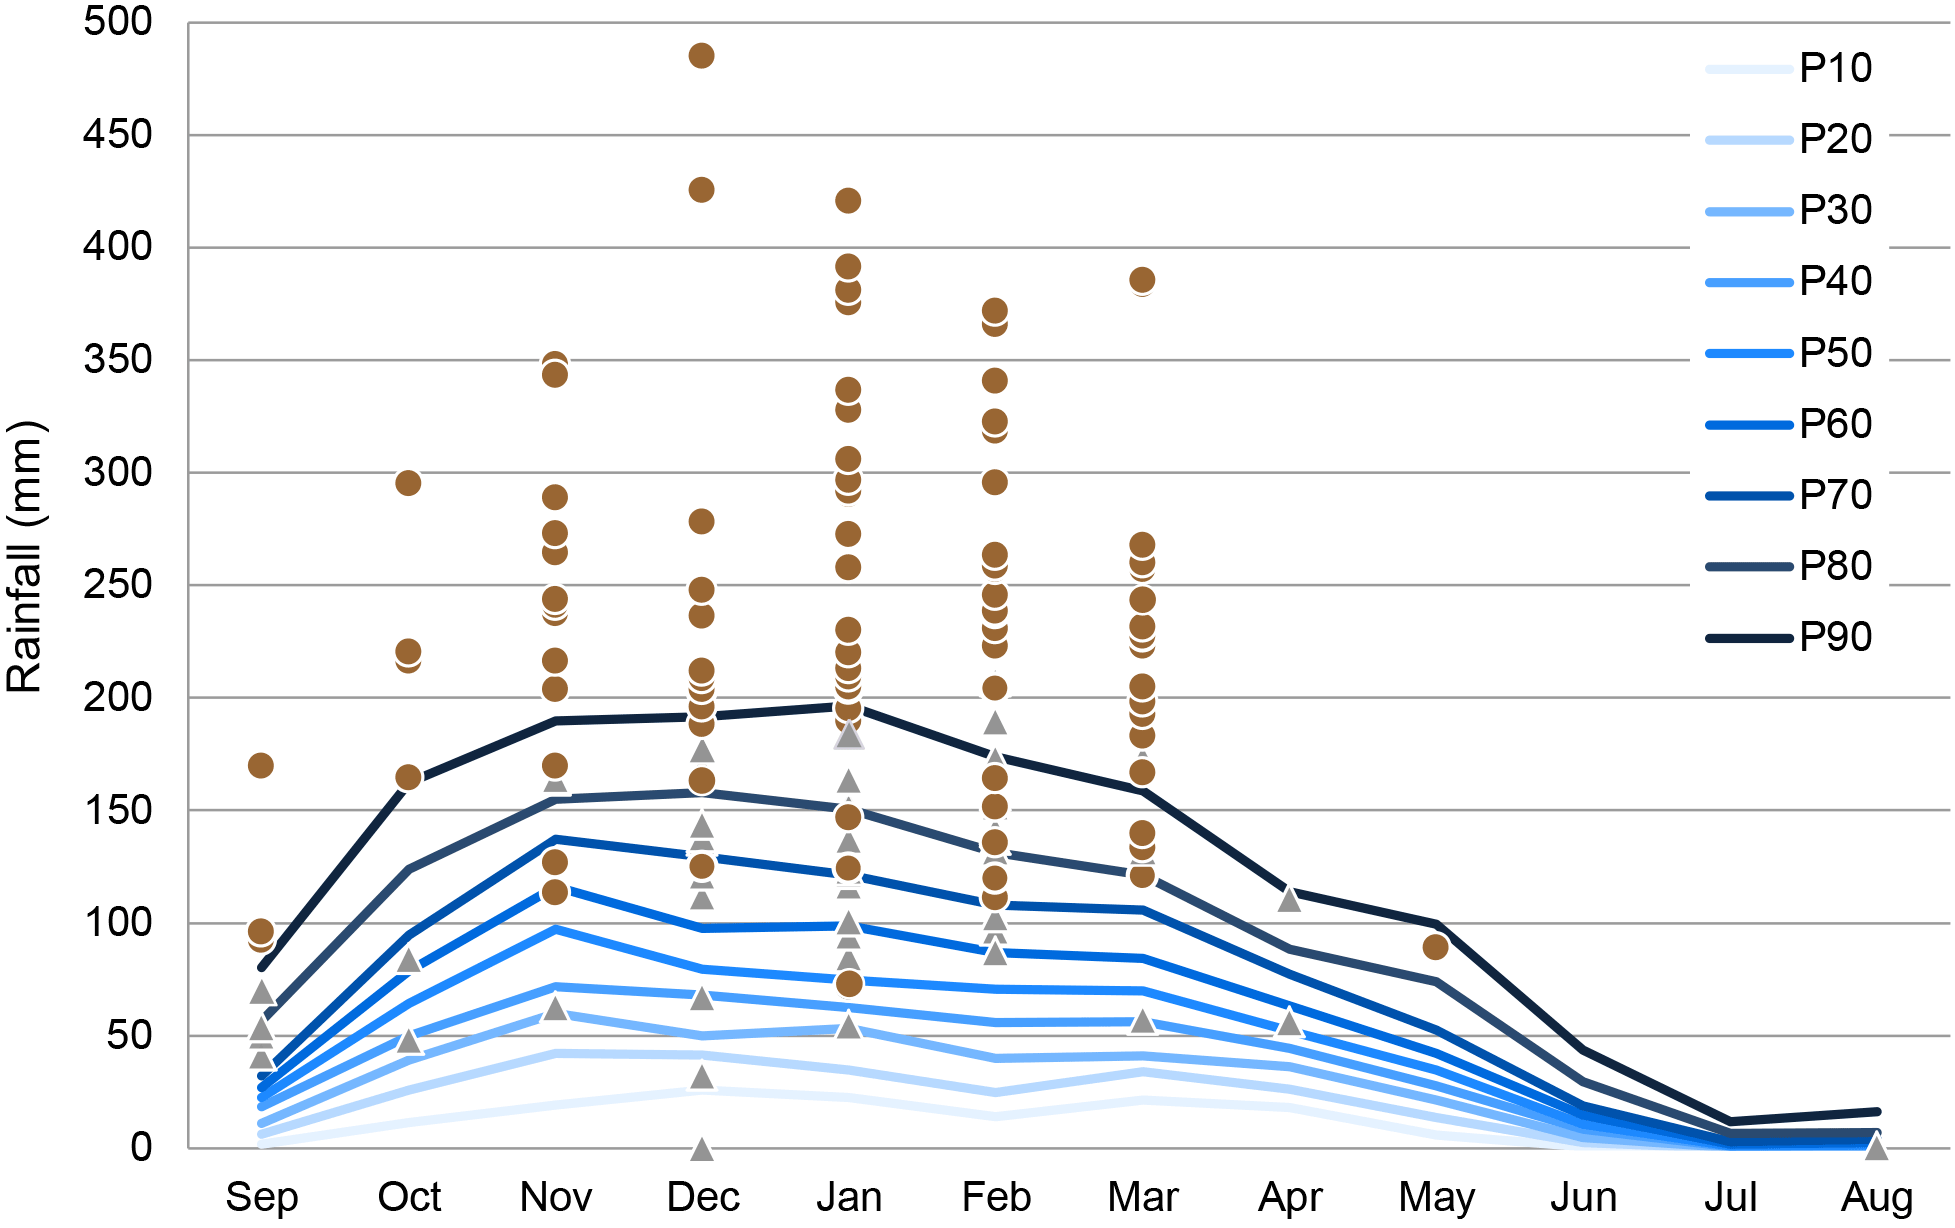
Figure 3Monthly rainfall percentiles at Lisboa-Geofísico rain gauge for the period 1864/1865–2009/2010. Brown dots and grey triangles symbolize the 30-day cumulated absolute antecedent rainfall for the rainfall-triggered landslide event and for the non-rainfall-triggered landslide event, respectively, at a distance up to 10 km from the reference rain gauge.
3.1 Identification of landslide events
The landslide database used in this study includes the DISASTER database and has detailed information about the date and location of landslide occurrence. The DISASTER database was carried out by exploring several daily and weekly newspapers, published in Portugal between 1865 and 2010, which include all the landslides that caused fatalities, injuries, missing people, evacuated and homeless people. The method used to construct the DISASTER database has been widely described and can be found in Zêzere et al. (2014). Additionally, using the same newspaper sources, landslides that did not cause any human damage during the same time period were identified and included in the database that supported this study. It should be pointed out that falling walls and instabilities directly resulting from engineering works were rejected. Similarly, the landslides in active coastal cliffs were not included in the database. The database structure is divided into two sections: landslide features and landslide damages. The first section includes information on landslide type, temporal and spatial location, triggering factors and newspaper metadata. The second section refers to the human consequences of landslides (fatalities, injuries, missing people, evacuated and homeless people), and direct and indirect damage to buildings, structures, roads and railroads.
Our analysis is focused on the dates of landslide occurrences. The newspapers are a reliable data source, despite the existing uncertainty concerning the spatial location of many reported landslide events, as well as on their type. Only landslides with at least 1 day of accuracy were included in the database. The spatial accuracy of landslide cases was divided into five classes, following Zêzere et al. (2014): (i) locations with the exact coordinates (accuracy associated with scale 1 : 1000), (ii) locations based on local toponymy (accuracy associated with scale 1 : 10 000), (iii) locations based on local geomorphology (accuracy associated with scale 1 : 25 000 scale), (iv) locations in the centre of the parish and (v) locations in the centre of the council. A total of 400 landslide cases were inventoried, with the majority (83 %) located with accuracy corresponding to classes (i) to (iii). These landslides affected clay (40.24 %), sandstone and conglomerate (22.52 %), limestone (16.52 %), volcanic (11.11 %), marly and marly limestone (9.01 %) and granite (0.60 %). The landslide type was classified following the Cruden and Varnes (1996) classification scheme. Slides are the dominant landslide type in the database (53.8 %), followed by falls (14.4 %). Flows and complex slope movements are less representative (2.4 and 1.5 %, respectively). The landslide type is unknown in 27.9 % of the cases. In this study the analysis was performed for all landslide types, following the approach of similar studies (e.g. Brunetti et al., 2010; Rosi et al., 2012; Peruccacci et al., 2017).
3.2 Selection of rain gauge and identification of critical rainfall combinations
In this study the following definition was adopted for landslide events: an individual landslide or a set of landslides that occurred on a precise date (day). In those cases where the activity period of a landslide was reported as lasting several days, the first day of the period was considered for the landslide event.
The selection of the reference rain gauge took into account the available time series, the data quality and resolution and the climatic representativeness. The daily rainfall data were collected at the Lisboa-Geofísico rain gauge (latitude 38.72∘ N, longitude 9.15∘ W, elevation 77 m), located within the city of Lisbon. The rainfall daily measurements at Lisboa-Geofísico started in 1864 and is one of the few rain gauges with centennial-long daily records in Portugal. A long time series of rainfall data is an important condition for creating comprehensive thresholds based on the analysis of the rainfall return period. In addition, this rain gauge presents reliable data, the quality and completeness of which was already tested and confirmed by Kutiel and Trigo (2014). The rainfall measurements have been taken without interruption and always in the same place since 1864. Furthermore, the rain gauge is climatically representative of the Lisbon region, with a rainfall regime influenced mainly by the atmospheric general circulation and the oceanic proximity.
The daily rainfall refers to the period between 09:00 UTC on the previous day and 09:00 UTC on the day of measurement, whereas the landslide dates are ascribed to a period from 00:00 to 23:59 UTC. Due to this difference, the date of each landslide event reported by the newspaper was compared with the daily rainfall registered in 3 days (from the day before up to the day after), and the day registering the highest rainfall amount was selected as the day of the landslide event.
The reconstruction of cumulated rainfall follows the method proposed by Zêzere et al. (2005). In a first step, the daily rainfall data registered at the Lisboa-Geofísico rain gauge during the period 1864/1865–2009/2010 were organized by climatological year (September to August). The decision to use the climatological year instead of the hydrological year (October–September) is justified by the rainfall regime of the study area. Starting the analysis in September, after the month with the low values of rainfall (August), we capture the complete transition period towards the wet season in each year. Afterwards, for each day, from 1864 to 2010 the cumulated antecedent rainfall was calculated for the durations of 1, 2, 3, 4, 5, 10, 15, 20, 30, 40, 50, 60, 75 and 90 days.
The maximum annual records of daily rainfall and cumulated rainfall for each duration were extracted and analysed using the theoretical distribution described by Gumbel (1958). This distribution is also known as the distribution of Fisher–Tippett and is applied to the extreme values. With the Gumbel law it is possible to obtain the probability of occurrence of each rainfall value within the series with N values. The reduced Gumbel distribution (y) is calculated with Eq. (1):
where m is the position number of the respective observations and N is the total number of observations. Considering this distribution, the theoretical frequencies can be calculated by the average and standard deviation for the reduced Gumbel distribution (My and Sy) and for the rainfall values (Mx and Sx). Eq. (2) expresses the theoretical trend:
where y is the reduced variable and x the rainfall value. The parameters α and μ are calculated as follows:
Finally, the probability of exceedance of any rainfall value is given by the Eq. (5):
For each landslide event the cumulated antecedent rainfall was assessed for the durations of 1, 2, 3, 4, 5, 10, 15, 20, 30, 40, 50, 60, 75 and 90 days. For each antecedent rainfall the return period (RP) was calculated with Eq. (6):
The pair (cumulated rainfall duration) with the highest return period was considered to be the critical rainfall combination, responsible for triggering the landslide event. This assumption is not physically based, but has been applied in previous work (e.g. Marques et al., 2008; Zêzere et al., 2008, 2015) and provides the best discrimination of the rainfall events related to landslide activity (Zêzere et al., 2005). Moreover, this approach agglomerates the rainfall that triggered the landslide event and the antecedent rainfall that contributed as a landslide preparatory factor.
As was previously mentioned, our landslide database was collected from newspaper sources and in some cases the rainfall triggering is not clear. Therefore to calculate the threshold we decided to use only the landslide events which have a critical rainfall combination with a return period exceeding 3 years. The boundary is arbitrary, but this criterion reduces the possibility of considering landslide events with a triggering factor other than rainfall (e.g. human action). The landslide events associated with critical rainfall combinations with return period less than 3 years were assumed to not be triggered by rainfall.
Finally, the climatological years without landslide records in the database were selected and the maximum yearly cumulated rainfall was identified for durations lasting from 1 to 90 consecutive days. These data were further used as rainfall events that did not generate landslide events and are crucial for the thresholds definition and calibration.
3.3 Critical distance from the rain gauge
The critical distance where the rain gauge is regionally representative was evaluated by drawing several buffers up to 60 km from the rain gauge (5, 10, 15, 20, 30, 40, 50 and 60 km). The ratio between the non-rainfall-triggered landslide events and the rainfall-triggered landslide events within each buffer was used to identify the area where the rain gauge is representative.
During the analysed time period (1864/1865–2009/2010) landslides in the study area were mostly triggered by rainfall and the earthquake trigger can be neglected (Vaz and Zêzere, 2016). The human action was an additional landslide-triggering factor, in particular through artificial cuts and drainage constraints associated with the progressive enlargement of urban areas. As it was already mentioned, the reference rain gauge is located in the city of Lisbon, where the landslides induced by human action are expected to be higher in number when compared with the outside of the urban area. Following this assumption, the ratio between the non-rainfall-triggered landslide events and the rainfall-triggered landslide events should decrease as the distance from the gauge increases. If this relation does not occur we assume that the rain gauge is no longer representative for the corresponding buffer. Therefore, the lowest ratio between non-rainfall-triggered landslide events and rainfall-triggered landslide events was considered to define the critical distance where the rain gauge is regionally representative to assess rainfall thresholds for landslide occurrence.
3.4 Rainfall triggering thresholds assessment and calibration
Landslide events registered within the critical distance from the rain gauge were considered and rainfall thresholds were established using linear and potential regression, based on cumulated rainfall duration with the highest return period. The lower-limit and the upper-limit rainfall thresholds were also defined following the suggestion by Glade et al. (2000). The lower-limit and the upper-limit rainfall thresholds were defined by linear regression based on two pairs. The lower limit was established by iteratively selecting two landslide events associated with different durations with the lowest values of cumulated critical rainfall and ensuring that the complete set of landslide events fall above the threshold. The upper limit was established by iteratively selecting the two highest pairs (cumulated rainfall/duration) that did not trigger landslides and ensuring that the complete set of non-landslide events fall below the threshold.
When representing thresholds we avoid using logarithm scales, and thresholds were established as linear relationships instead of using a power law, with a single exception (the potential regression threshold). These options maximize the zone between the lower-limit and upper-limit thresholds, thus allowing the distinction between rainfall events that generated (did not generate) landslide events.
The performance of rainfall thresholds was evaluated using ROC metrics. ROC analyses are commonly used to validate susceptibility landslide models (Beguería, 2006; Kappes et al., 2011) and it is based on confusion matrices. The principles used in these analyses can also be applied to calibrate the rainfall thresholds (e.g. Staley et al., 2013; Gariano et al., 2015a; Zêzere et al., 2015). The confusion matrix is used to assess the correct and incorrect predicted observations, for positive and negative cases (Beguería, 2006). Therefore, the analysis is based on the evaluation of true positive (TP), false negative (FN), true negative (TN) and false positive (FP) cases. When applied to rainfall thresholds the TP corresponds to the landslide events in which the rainfall combination (cumulated rainfall duration) is above the threshold. The FN are landslide events for which the rainfall combination (cumulated rainfall duration) is below the threshold. The rainfall combinations that did not resulted in landslide events are classified as TN if they are below the threshold or FP if they are above the threshold.
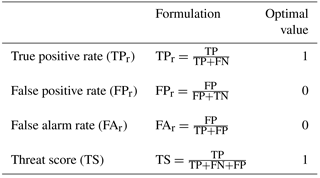
Also, four ROC metrics functions described by Staley et al. (2013) were used in this study (Table 1). The true positive rate (TPr) is the proportion of landslide events that were correctly predicted by the threshold (Table 1). The false positive rate (FPr) is the proportion of rainfall events above the threshold for which there is no information on landslide occurrence. The false alarm rate (FAr) is the ratio between false predictions and the complete set of rainfall events above the threshold. The threat score (TS) is used to evaluate the threshold to maximize the number of correct predictions while minimizing the rate of FP and FN. A TS = 1 represents a perfect model but is reduced by incorrect predictions.
The probability of a rainfall event above the rainfall threshold resulting in a landslide event was measured by the positive predictive rate (PPr), which was previously described by Bradley (1997) and Fawcett (2006). The PPr measures the relationship between the rainfall events above the threshold that resulted in landslide events and the complete set of rainfall events located above the threshold, as follows:
Therefore, the PPr is the opposite of the FAr and can also be calculated by the expression:
Using this approach, several linear rainfall thresholds were plotted in the zone between the lower-limit and the upper-limit rainfall thresholds, and the corresponding PPr were calculated in order to compute the probability of landslide events associated with each threshold. In addition, the probability of each rainfall threshold was computed based on the return period of the corresponding cumulated rainfall duration.
Lastly, the performance of the lower-limit threshold was assessed beyond the critical distance of the rain gauge. For each buffer referred to in Sect. 3.2 the ratio between the FN and the total set of landslide events (TP + FN) was systematically evaluated. We assume the lower-limit threshold can only be applied to those buffer distances where this ratio remains stable.
4.1 Landslide events and critical distance from the rain gauge
Within the area located up to 60 km from the reference rain gauge 223 landslide events were identified dating from 1865 to 2010 (Fig. 4). However, the return period computed for the cumulated rainfall does not exceed 3 years in 92 landslide events. Therefore, according to the criterion defined in Sect. 3.2, these landslide events were assumed not to have been triggered by rainfall.
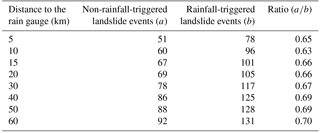
The ratio between the number of non-rainfall-triggered landslide events and the number of rainfall-triggered landslide events was calculated for each buffer zone shown in Fig. 4. The results are summarized in Table 2 and were used to define the critical distance at which the rain gauge is regionally representative, and to select the landslide events considered to compute the rainfall thresholds. We acknowledge the ratio differences that occurred only to the second decimal place (Table 2), but these differences can be interpreted considering the characteristics of the study area. Within the 5 km buffer the calculated ratio is relatively high (0.65). The first buffer zone includes Lisbon city centre, which explains the high number of landslides triggered by factors other than rainfall, mainly due to human actions. In the following buffer zone (10 km) the ratio decreases to 0.63. This decrease was expected as the urban area extension decreases in the second buffer, thus justifying the lower number of non-rainfall-triggered landslides. The ratio between the non-rainfall-triggered and the rainfall-triggered landslide events increases to 0.66 within the 15 km buffer zone, and the ratio ranges between 0.66 and 0.70 in the next buffer zones up to 60 km from the rain gauge. The increasing ratio in distance exceeding 10 km from the rain gauge cannot be attributed to the occurrence of an unexpectedly high number of non-rainfall-triggered landslide events, but can only be explained by a decrease in spatial representativeness of the rain gauge data in areas beyond 10 km. Therefore, we consider 10 km the critical distance at which the rain gauge is representative, and the rainfall thresholds were computed considering only the landslide events registered within this zone.
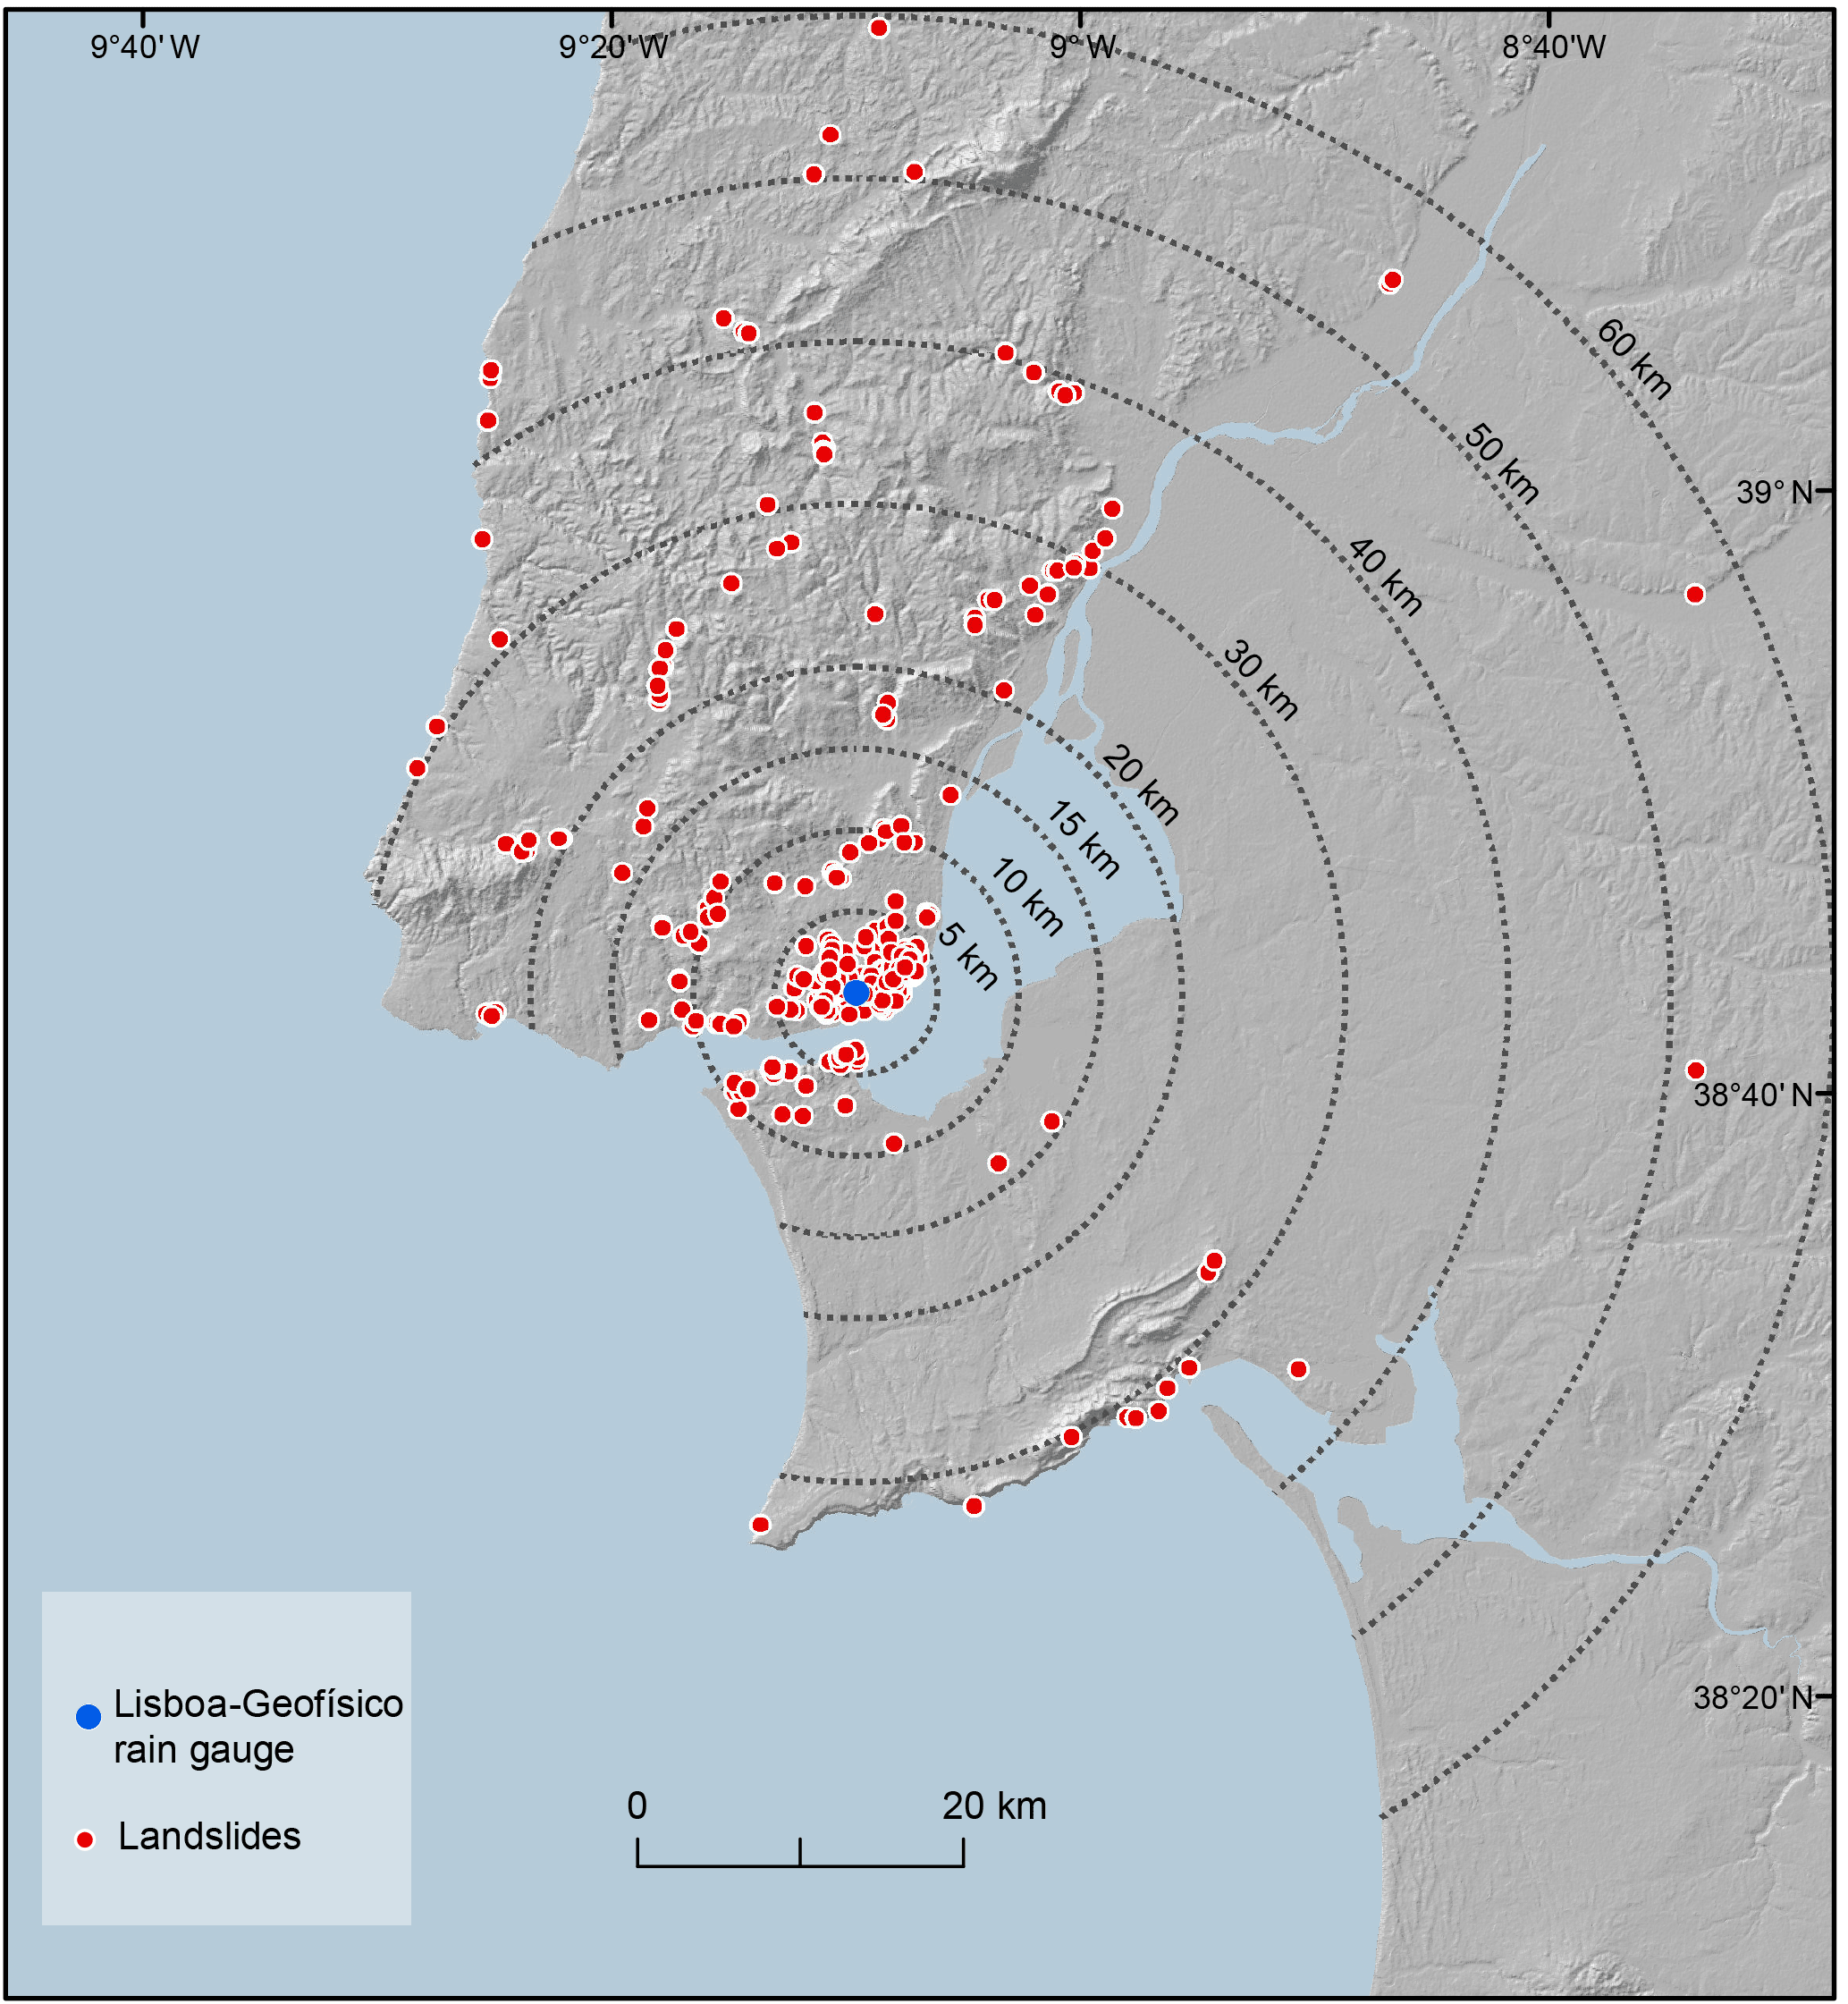
Figure 4Distribution of landslides in the Lisbon region (1865/2010) and buffer distances from the reference rain gauge.
Table 2Ratio of non-rainfall-triggered landslide events/rainfall-triggered landslide events for different buffer distance to the reference rain gauge.
In the area located up to 10 km from the reference rain gauge of Lisboa-Geofísico 60 landslide events, with return periods below 3 years, were assumed to be non-rainfall-triggered landslides, and therefore were not considered for the threshold calculation and analysis. Moreover, 96 rainfall-triggered landslide events were identified, which include 187 individual landslides. The yearly and monthly distributions of these landslide events are shown in Figs. 2 and 3, respectively. The rainfall-triggered landslide events occurred mainly in wet years: 89 % of landslide events were registered in years with rainfall above the MAR. The climatological years 1876/1877, 1946/1947 and 1968/1969 are in the top regarding the number of landslide events (six events in each year). In these three climatological years the annual rainfall was above 933 mm at the reference rain gauge, which exceeds the MAR by more than 30 %. However, there is not a direct relationship between the MAR and landslide events because landslide occurrence is usually related to rainfall events over a few days or weeks, which are not expressed by the mean annual rainfall. Indeed, landslide events were also registered in 10 years with annual rainfall below MAR, as was the case for 1909/1910, which registered two landslide events.
The monthly distribution of landslide events follows the rainfall distribution over the year in a Mediterranean climate, with dry summers and wet winters. The landslide events essentially coincide with most rainy months, as 92 % of events occurred from November to March. Within this period, January and February stand out with the highest concentration of landslide events (24 and 22.9 %, respectively). Besides the monthly rainfall percentile, Fig. 3 represents the 30-day cumulated antecedent rainfall for each landslide event and shows that 96 % of landslide events are above the 70th percentile. If we consider the 90th percentile this value decreases to 79 %, but it continues to highlight the exceptionality of rainfall during the 30 days before the landslides are triggered.
For each landslide event the critical cumulated rainfall duration was obtained following the method described in Sect. 3.2. The obtained critical durations associated with landslide events range from 1 to 90 consecutive days. The monthly distribution of critical durations is shown in Fig. 5 for the rainfall-triggered landslide events. The shorter rainfall events (less than 20 consecutive days) occurred mainly from September to December (56 %) at the beginning of the rainy period. On the contrary, when associated with longer rainfall periods (more than 20 consecutive days) the landslide events were more frequent from January to May (86 %).
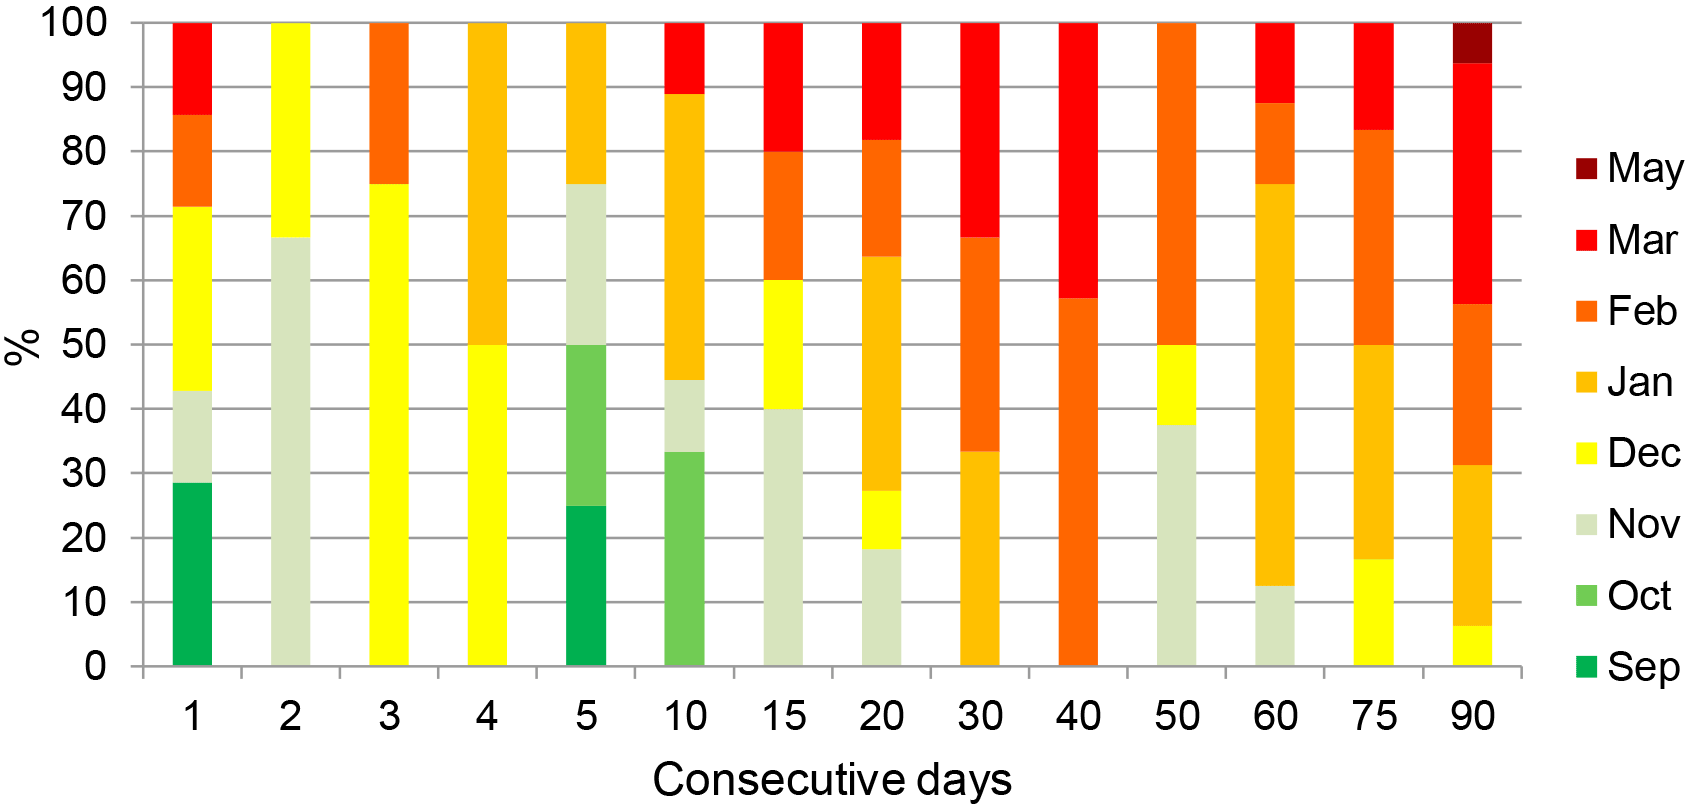
Figure 5Monthly frequency of the rainfall-triggered landslide events against the duration of the rainfall period.
Figure 6 illustrates the cumulated rainfall duration combinations that resulted in landslide events and the typical return periods established for 3, 5, 10, 25, 50, 100, 150 and 200 years. Around 64 % of the cumulated rainfall duration that resulted in landslide events have a return period below 10 years. However, four landslide events had a rainfall amount and duration with a very high return period, above 150 years. Figure 6 also identifies the landslide events that include multiple landslides and the landslide events that are constituted by a single landslide. The distribution of both groups is inconclusive, as the landslide events containing multiple landslides are not always directly related to the exceptionality of the rainfall event, i.e. the critical cumulated rainfall duration combination with a higher return period.

Figure 6Critical combination cumulated rainfall duration that resulted in landslide events (single and multiple landslides) and return period (RP) for 3, 5, 10, 25, 50, 100, 150 and 200 years. Distance up to 10 km from the reference rain gauge. The non-rainfall-triggered landslide events identified are also represented.
4.2 Rainfall thresholds for landslide triggering
The rainfall conditions (cumulated rainfall duration) associated with each landslide event were considered to define rainfall thresholds using linear and potential regression (Fig. 7). The linear regression follows the equation , where D is the duration in days, whereas the potential regression follows the equation R=67.8D0.46 (Table 3). The coefficient of determination is very high in both cases (R2=0.8 and 0.9, respectively). Both rules can be used as rainfall thresholds for landslide occurrence in the study area; however none of them ensure a low number of false negative occurrences (i.e. landslide events below the threshold).
To calibrate the thresholds, the maximum yearly rainfall for each duration (1 to 90 consecutive days) was calculated for those climatological years without records of landslide events in the analysed period (1865–2010). These records represent rainfall events not associated with landslides and are symbolized by grey dots in Fig. 7 (1428 dots). The majority of these rainfall events (96.6 %) drop below the threshold obtained with the potential regression. However, there are 57 false negatives occurrences (i.e. events that occurred without being predicted), as well as 48 false positives (i.e. rainfall events lying above the threshold, without any landslide reported).
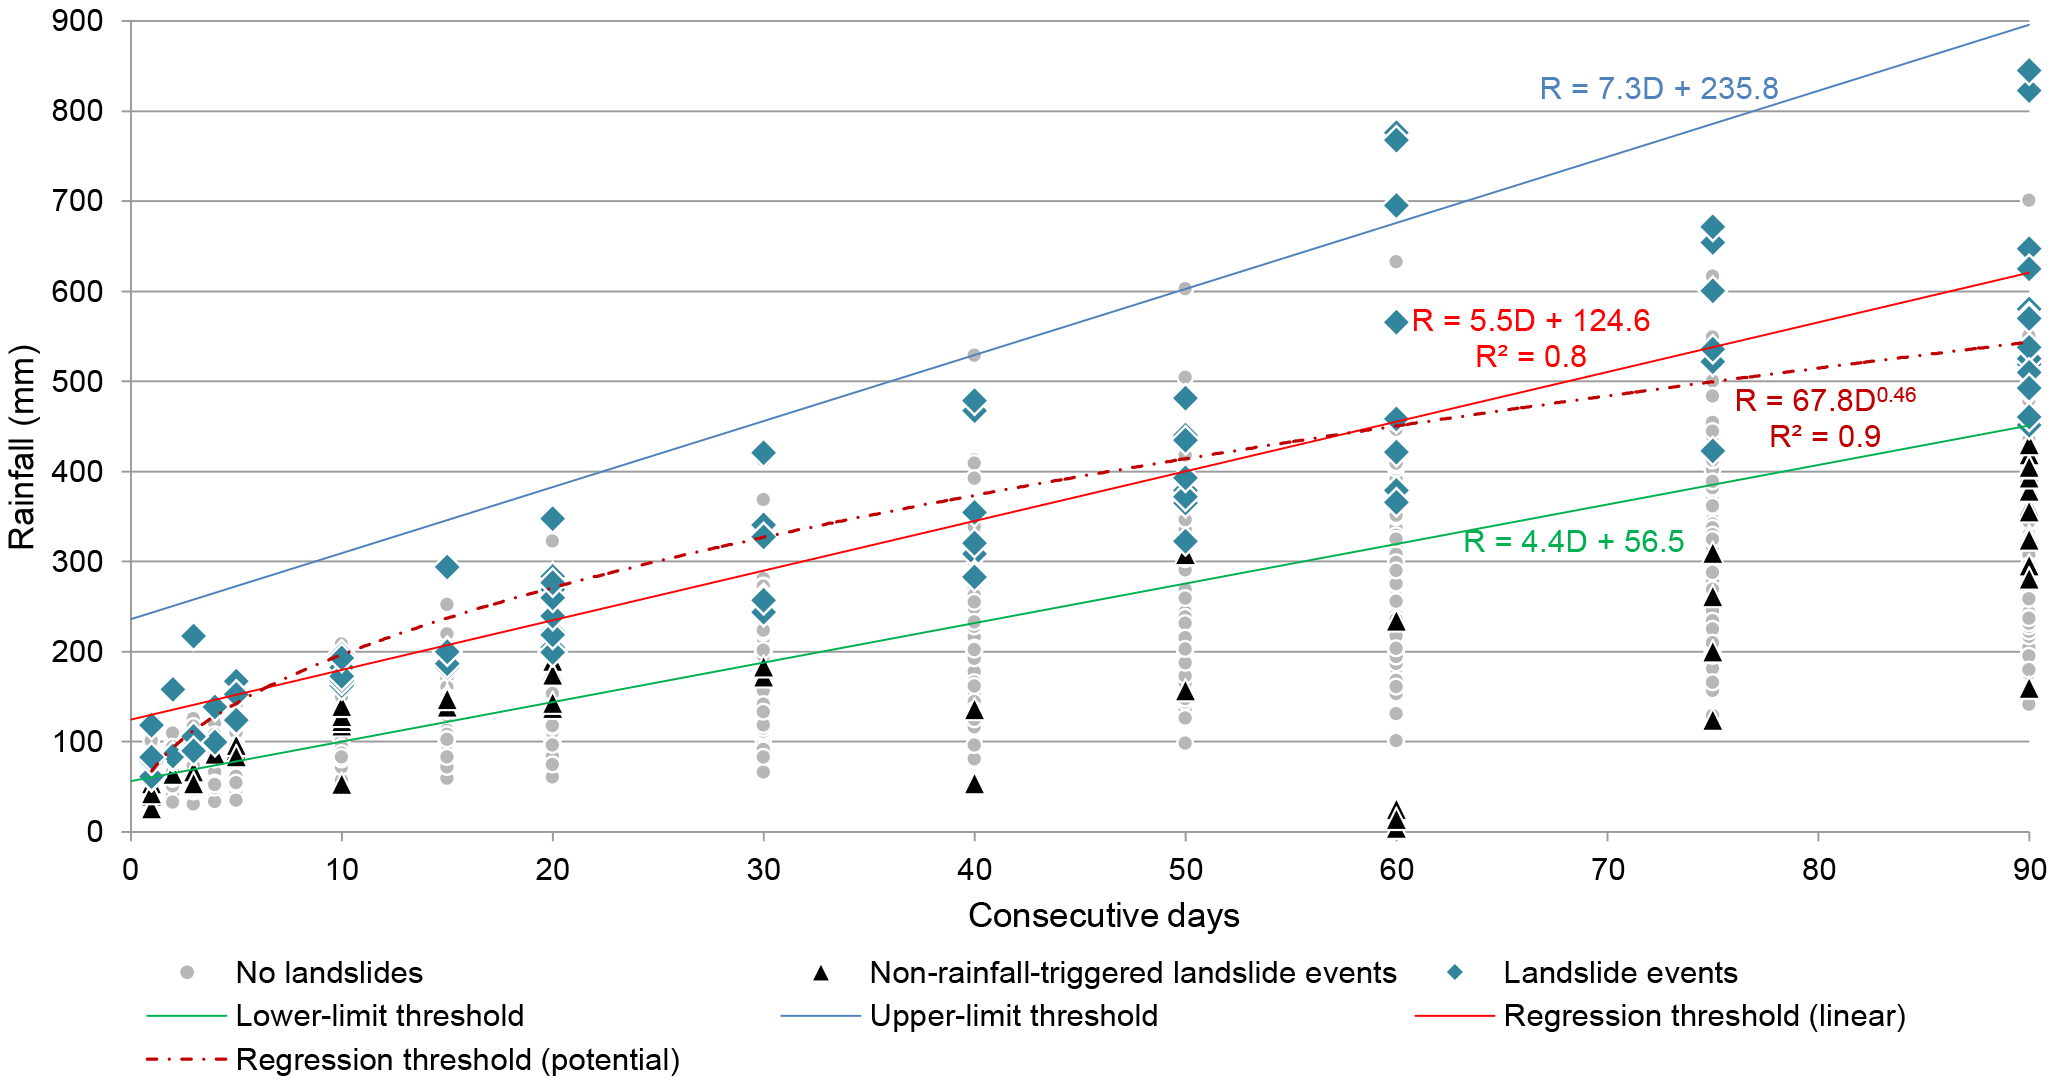
Figure 7Cumulated rainfall duration thresholds for landslide events in the Lisbon region (1865 to 2010). Distance up to 10 km from the reference rain gauge.
In the next step, the lower-limit and the upper-limit rainfall thresholds were determined. The former establish the threshold below which there are no true positives (landslide events), whereas the latter establish the threshold above which there are no false positives (rainfall events without landslides). The lower-limit threshold follows the equation , and the upper-limit threshold follows the equation , where D is the duration in days (Table 3).
Table 3ROC metrics associated with rainfall thresholds and intermediate thresholds for landslide events in the Lisbon region.
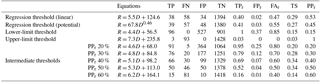
Table 3 also summarizes the ROC metrics for the regression thresholds (linear and potential) and the lower-limit and the upper-limit thresholds. The TPr measure the proportion of landslide events that occurred when the combinations of rainfall duration are exceeded and show the efficiency of a threshold to predict a landslide event. On the other hand, the FPr measures the proportion of combinations of rainfall duration that are above the threshold but did not result in any known landslide event. For the potential regression threshold, the TPr is not very high (0.41, best value is 1) but the FPr is a good result (0.03, the best value is 0), which means that the thresholds have a low probability of a false detection. The TPr is equal to 1 for the lower-limit threshold, considering that it was drawn to avoid FN occurrences. However, the FPr and the FAr are very high (0.37 and 0.85, respectively) as a consequence of the typical low values of the threshold. The lower limit is a conservative threshold, and its main advantage is predicting all the landslide events, but it also includes a very high number of false positive events. On the contrary, the upper-limit threshold is only surpassed by true positive occurrences, so the FPr and FAr have the best result (0 value). However, the TPr is very low (0.03) reflecting the high number of false negative events. The threat score (TS) provides a better understating of each threshold performance as it relates to the TP, FN and FP occurrences. The linear regression threshold has the best result with 0.29 of TS when compared with the potential regression threshold (0.27), the lower-limit (0.15) and the upper-limit (0.03) thresholds (Table 3). The false alarm rate (FAr) also gives a better result for the linear regression threshold in comparison with the potential regression threshold (0.47 and 0.55, respectively).
Although only the FPr returns very good values, the regression thresholds, linear or potential, can be used as acceptable thresholds to predict landslide events in the study area. However, the lower-limit and the upper-limit thresholds should not be excluded, as the zone between these rainfall thresholds defines the boundary conditions where any rainfall event may (or may not) cause a landslide event.
4.3 Probability of landslide event and probability of rainfall above the threshold

Figure 8Intermediate thresholds based on the probability of landslide events (20, 30, 40, 50 and 60 %) in the zone between the lower-limit threshold and the upper-limit threshold.
The PPr summarized in Table 3 gives the probability of a rainfall event resulting in a landslide event when the threshold is exceeded. The value ranges from 0 to 1 where 1 indicates 100 % probability of landslide occurrence. Accordingly, when the lower-limit threshold is exceeded, the probability of occurrence of a landslide event is relatively low (0.15). On the contrary, when the upper-limit threshold is reached the occurrence of a landslide event is certain (PPr=1). The PPr associated with the regression thresholds is close to 0.5, but higher for the linear trend in comparison with the potential trend (0.53 and 0.45, respectively).
The systematic comparison between true positives and false positives and the PPr calculation were taken into consideration to draw five intermediate rainfall thresholds in the zone between the lower-limit and the upper-limit rainfall thresholds, representing the 20, 30, 40, 50 and 60 % probabilities of the occurrence of a landslide event (Table 3 and Fig. 8). Within this chart, any rainfall event exceeding the PPr x % threshold has the x % probability of generating a landslide event in the study area. Further probabilities could not be computed due to a lack of data.
To analyse the performance of the PPr rainfall thresholds presented in Fig. 8, the ROC metrics were calculated and are summarized in Table 3. As expected, the false alarm rate decreases as the PPr increases, and the same occurs with the true positive rate and the false positive rate. According to the threat score (TS), the PPr 40 % and the PPr 50 % are the rainfall thresholds with the best performance (TS = 0.34 in both cases).
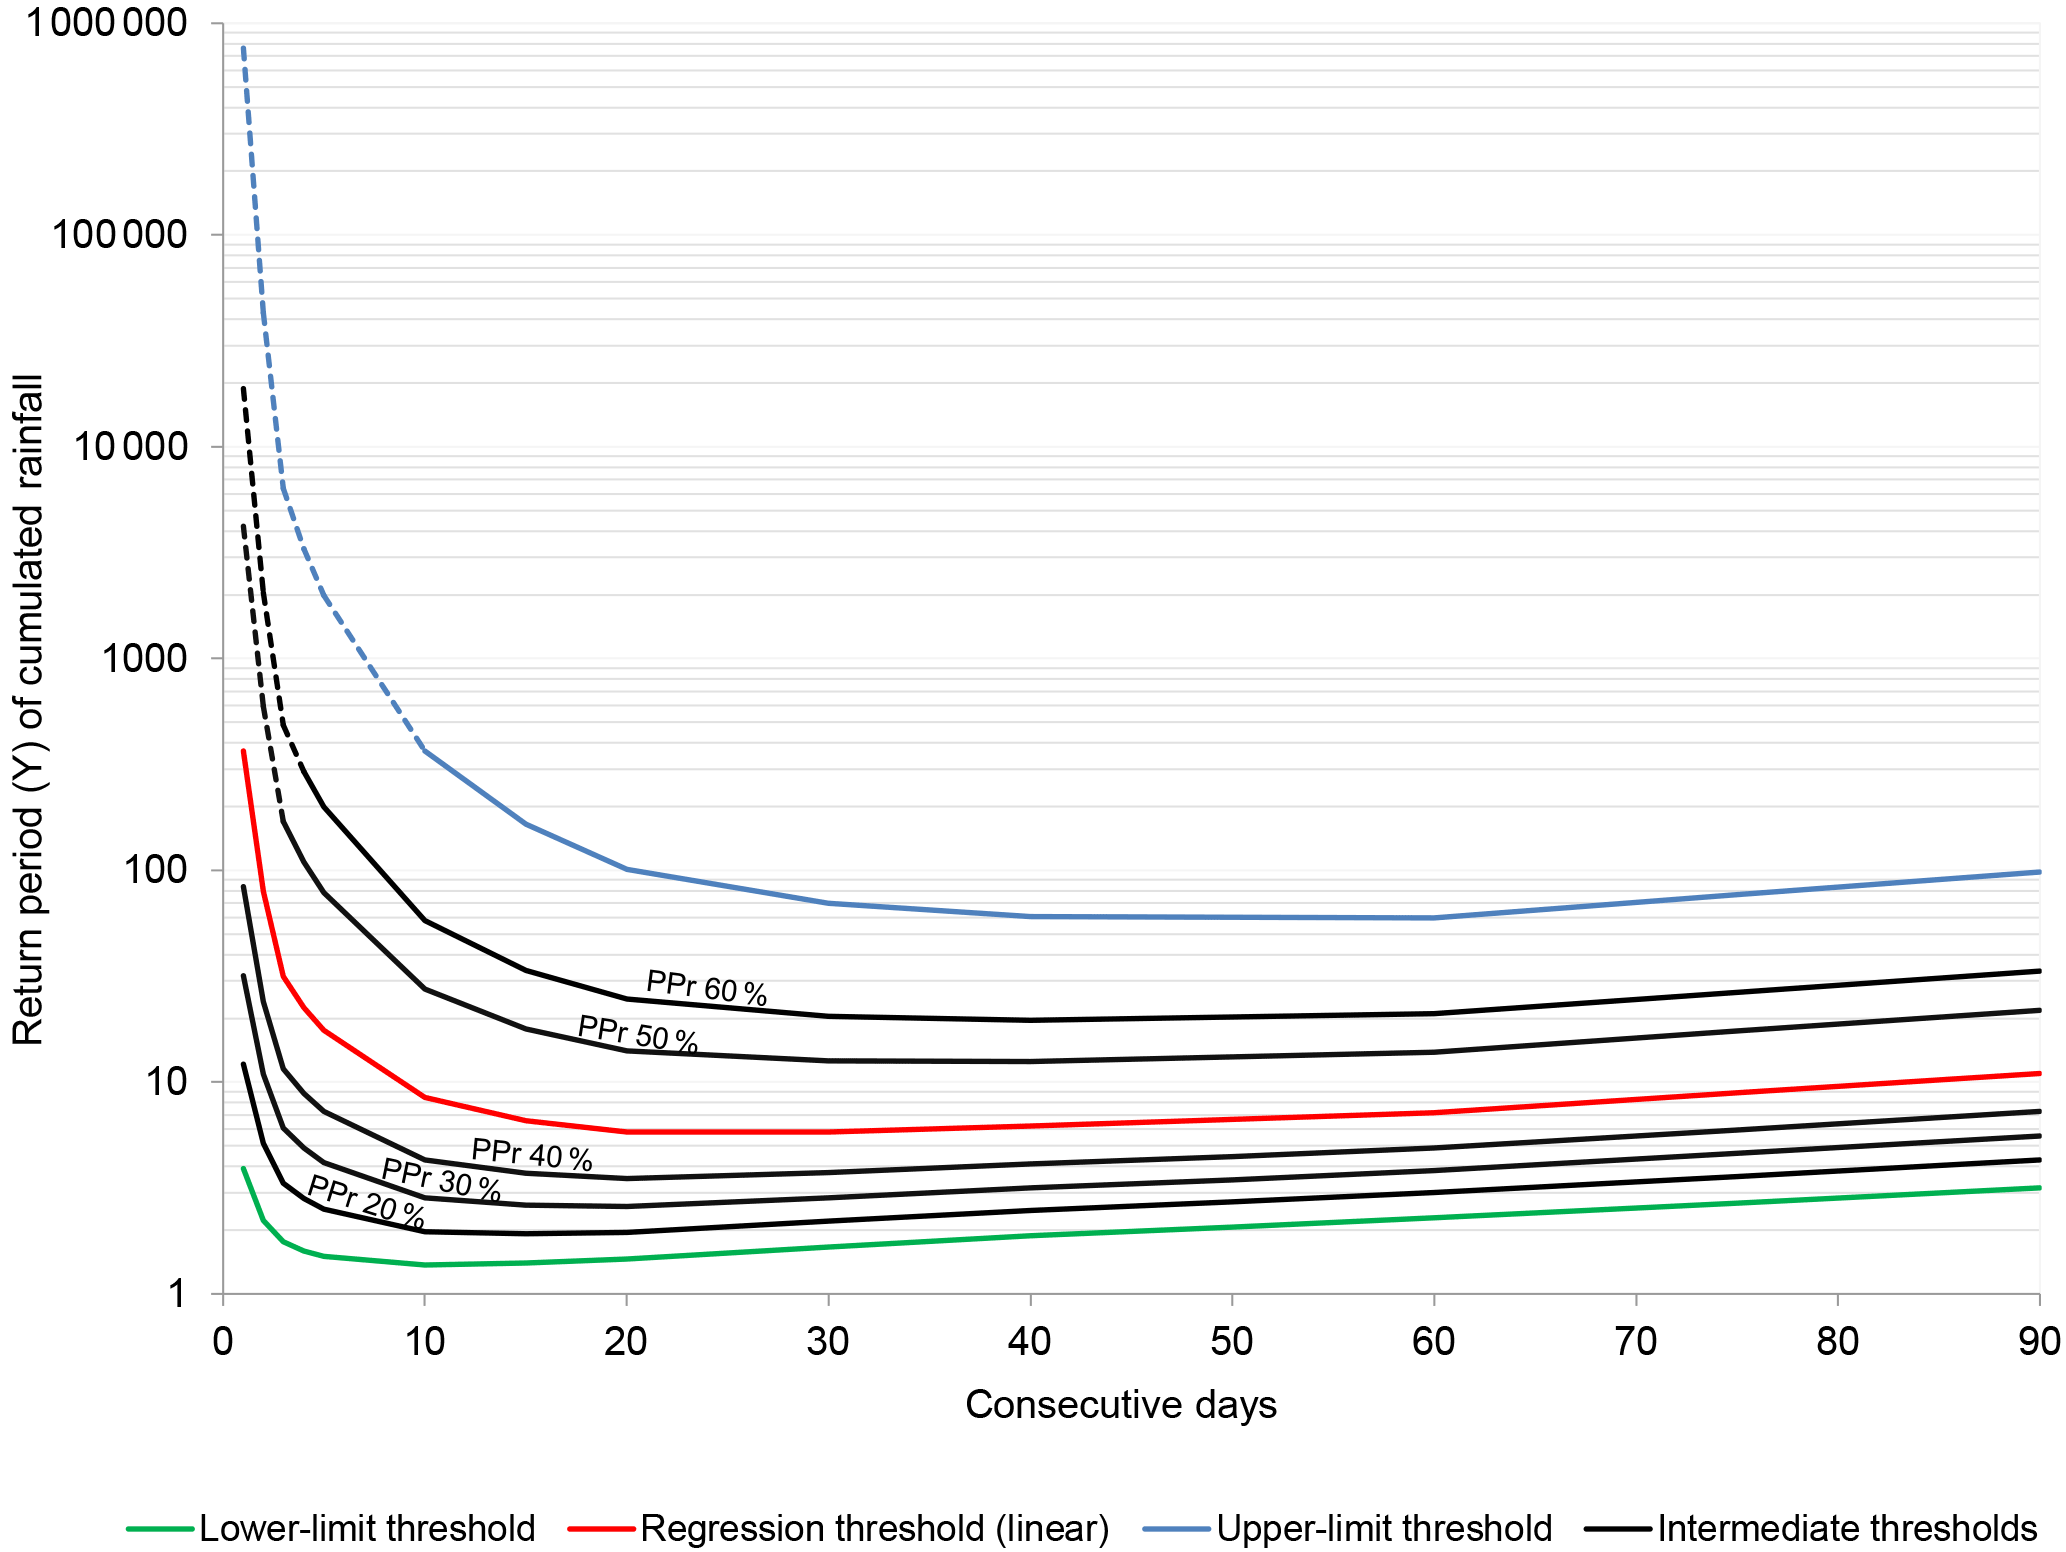
Figure 9Return period of rainfall thresholds computed for the Lisbon region (linear regression, lower-limit, upper-limit and intermediate thresholds PPr 20 %, PPr 30 %, PPr 40 %, PPr 50 %, and PPr 60 %). Dashed lines represent conditions never registered in the rain gauge.
The return period of the rainfall associated with each calculated threshold presents a wide variation according to the considered number of consecutive days of cumulated rainfall (Fig. 9). As a rule, shorter durations (below 10 days) present a high return period in comparison with longer durations, independently of the type of rainfall threshold. In the case of the upper-limit threshold, the PPr 60 % and the PPr 50 % thresholds, the obtained return periods for the shorter durations are less realistic and the corresponding rainfall values were never registered in the rainfall data series of the Lisboa-Geofísico rain gauge.
Figure 9 also shows that the rainfall threshold is easier to reach for periods ranging from 15 to 45 consecutive days, namely for the regression threshold (linear), the lower-limit threshold, and the PPr 20 %, PPr 30 % and PPr 40 % thresholds. For the mentioned durations these thresholds will be exceeded by rainfall events with return periods less than 10 years. However, for durations longer than 45 consecutive days, the return period of the corresponding rainfall denotes an increasing trend for all the thresholds, although the return period remains lower when compared with periods less than 10 consecutive days.
Data summarized in Figs. 8 and 9 can be combined to better characterize any rainfall threshold. Taking as an example the PPr 60 % threshold, we can state that the highest yearly probability that this threshold is exceeded is 5 % (20-year return period) associated with 30 to 60 consecutive days. The probability of landslide occurrence is 60 % given rainfall exceeding the threshold. Therefore, the maximum yearly combined probability of a landslide event associated with the PPr 60 % threshold is 3 %.
4.4 Regional performance of the lower-limit threshold
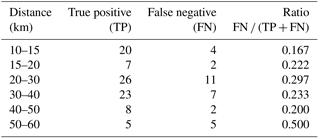
Although the rainfall thresholds for landslide occurrence were defined taking into consideration the landslide events registered up to 10 km from the reference rain gauge of Lisboa-Geofísico, we admit that the obtained thresholds may be valid for distances greater than 10 km. In accordance, the performance of the lower-limit threshold was evaluated for each buffer zone represented in Fig. 4. The ratio between the FN and the total set of landslide events, FN / (TP + FN), for the different buffer zones is summarized in Table 4. As expected, the lowest ratio (0.167) corresponds to the buffer zone of 10–15 km. The ratio remains relatively stable within buffer zones up to 50 km from the rain gauge (ratio ranging from 0.2 to 0.297), and increases significantly in the buffer zone of 50–60 km (0.5). Therefore, taking into account the ratio FN / (TP + FN) we can conclude that the prediction model remains efficient up to 50 km from the rain gauge. Consequently, although established with landslide data registered up to 10 km, the thresholds identified for the Lisboa-Geofísico rain gauge may be applied with reasonable confidence for the area within 50 km.
Table 4Ratio FN ∕ (TP + FN) considering the lower-limit rainfall threshold for different buffer distances to the rain gauge.
This work describes a comprehensive method that establishes rainfall thresholds based on a reference rain gauge located in an urban area. Throughout the work a few methodological issues were highlighted, which are discussed in the following subsections.
5.1 The concept of landslide event
The concept of a landslide event is not straightforward as has been applied in the literature to describe a landslide or a set of landslides usually related to a specific triggering factor, such as an intense rainstorm (Crozier and Glade, 1999; Zêzere et al., 2014). When the landslide event is a single landslide, generally there is no problem with identifying the date of the event that will be related to the daily rainfall data for the rainfall threshold assessment. However, when several landslides are triggered over consecutive days in a study area, this may be a source of bias for the rainfall threshold definition. Usually, a date between the start and the end of the rainfall event is selected (e.g. Gullà et al., 2012; Gariano et al., 2015b), and therefore, a unique combination of cumulated rainfall duration is calculated. The selection of the landslide event date is critical for this method as it can lead to an overestimation of the threshold, particularly if the end date of a long-lasting rainfall event is chosen. In these cases, the chosen cumulated rainfall duration may be not representative of the triggering conditions of landslides that occurred at the beginning of the event. To address this problem, in this work a landslide event was considered to be an individual landslide or a set of landslides that occurred on a precise date (day). Therefore, in those cases in which different landslides occurred on consecutive days, each day was considered a landslide event and the corresponding antecedent rainfall was used for the rainfall threshold assessment. In addition, when the activity period of a landslide was reported as lasting several days, the first day of the period was considered for the landslide event.
5.2 The use of one or several rain gauges to assess rainfall thresholds
Several benefits and drawbacks can be outlined regarding the use of a single rain gauge or multiple rain gauges to assess rainfall thresholds for landslide initiation. The use of multiple rain gauges is a typical option for assessing rainfall thresholds (e.g. Caine, 1980; Gariano et al., 2015b; Peruccacci et al., 2017). The main advantage lies in the proximity of the rain gauge from the landslides, which provides a better relationship between rainfall and landslide triggering. However, the rainfall thresholds obtained in different rain gauges may be biased due to the different topographic and physiographic contexts characterizing each point of rainfall measurement. In these circumstances, the obtained rainfall thresholds will be biased by the differences regarding the rainfall regime of each location. Therefore, the merging and comparison of several rainfall data sets obtained in different places should be preceded by the normalization of rainfall data.
In addition, this type of analysis demands a high density of rain gauges, which is only available for recent years. In Europe the number of stations increased after 1960 and peaked between 1980 and 1990 (Haylock et al., 2008). In Portugal, a reliable rain gauge network has only existed since 1980, when the mean distance between neighbouring rain gauges was about 7.9 km (Belo-Pereira et al., 2011). Therefore, the use of multiple rain gauges to assess rainfall thresholds in the Lisbon region before 1980 would increase the threshold uncertainty due to the very low density of the available rain gauges. The restriction of the analysis to the period 1980–2010 was a possible way of overcoming this limitation. However, this option was not considered because the number of landslide events would be drastically reduced (from 96 to 15 landslide events, Fig. 2), and the same would happen concerning the number of available rainfall events that did not generate landslides. The reduction of data representativeness would decrease the reliability of obtained rainfall thresholds.
Our landslide database covers a 145-year period (from 1865 to 2010) and we decided to analyse the complete period; thus, the selection of a single rain gauge was inevitable. The Lisboa-Geofísico rain gauge has taken uninterrupted rainfall measurements since 1864 and it is one of the few rain gauges in Portugal with long-term rainfall data set. The comparable rain gauges (Évora, Porto, Guarda and Coimbra) are located more than 100 km from Lisbon. A long time series is important for applying the return period and the Gumbel probability to the rainfall data. Moreover, it provides a more reliable relationship between the rainfall conditions and landslides, strengthening the reliability of the obtained thresholds. This is particularly important for a climate with great variability, such as the one existing in the study area.
5.3 Empirical definition of critical rainfall period
Identifying the rainfall responsible for the landslide occurrence is the basis for any empirical rainfall threshold calculation. A range of procedures that define the rainfall critical period associated with landslide events have been proposed in the literature (e.g. Guzzetti et al. 2007; Segoni et al., 2014). Moreover, even the definition of critical rainfall is not straightforward. Aleotti (2004) defined the critical rainfall as the rainfall period starting when a sharp increase in rainfall intensity is identified and ending when the first landslide is triggered. Therefore, in such circumstances, the cumulated rainfall before the rainfall increase is considered antecedent rainfall and is not included in the critical rainfall. Brunetti et al. (2010) and Peruccacci et al. (2012, 2017) use the concept of “rainfall event”, as a period of continuous rainfall separated by a dry period, with a seasonal variability concerning the length of the dry period (48 h in the dry season and 96 h in the wet season). In our study, the critical rainfall joins together the antecedent rainfall (acting as a landslide preparatory factor) and the rainfall that triggered the landslide event. Our procedure for defining the critical rainfall combination, which is responsible for preparing/triggering the landslide event, is based on the return period calculation and selects the cumulated rainfall with the highest return period.
This approach has the advantage of being objective and easily reproducible for other areas, and provides rainfall thresholds with the most optimistic results concerning the ROC metrics. However, the use of the return period implies a “rigid” statistical relationship between the rainfall and landslides, which does not always occur. Moreover, in some cases, the cumulated rainfall associated with the landslide triggering is not very high. However, the use of other empirical procedures to define the critical rainfall period, as previously mentioned, is based on subjective observations like the duration of the dry period that bounds the rainfall events.
Probably, the identification of the critical rainfall period for a specific landslide event can only be precise using coupled geotechnical and transient hydrological physical models. However, each slope is unique and the rainfall is not uniform both in time and space, which explains the difficulty of establishing rainfall thresholds based on physically based models at the regional scale.
5.4 Identification of rainfall-triggered landslide events
The uncertainty related to the triggering factor is particularly high when newspapers are the main source of information and, additionally, when a long time series is being analysed. As a rule, only newsworthy content is reported by newspapers, which certainly create bias in the landslide database. For instance, landslides that generated human damage or occurred in an urban environment are usually highlighted, which increases the probability that landslides triggered by human action are included in the database, despite their exclusion whenever a description suggests an anthropic intervention. On the contrary, landslides triggered by rainfall that did not generate any social or economic damage were probably unreported by the newspapers. In addition, the long time that elapsed since the occurrence of some landslides inhibits the use of recent methods and techniques to confirm the rainfall triggering. For example, the confirmation of landslide events using aerial photo interpretation is only possible in Portugal for the period after 1947.
Using field-based landslide inventories in the Lisbon region, Zêzere et al. (2015) considered a rainfall-triggered landslide event any date on which at least five individual landslides are known to have occurred on natural slopes. This criterion reduces the possibility of including landslides triggered by human action. However, this criterion cannot be used in the present study, because landslides reported in newspapers are a small sample of the total number of triggered landslides. Therefore, any reported date, even those reporting a single landslide, should be admitted as a “landslide event candidate”. Addressing the issue of the triggering factor, those landslide events associated with rainfall combinations (cumulated rainfall duration) with a return period below 3 years were rejected as rainfall triggered. Using field-based landslide inventories in the Lisbon region, Zêzere et al. (2015) showed that only 12 % of landslide events triggered by rainfall have a cumulated rainfall return period below 3 years and landslide events were not registered with rainfall conditions with return periods below 2 years. Given our data source feature (based in newspaper) and our study area (integrated in an urban area) a more conservative boundary was preferred, and therefore, the selection of a 3-year return period.
This criterion can eventually eliminate some (a few) landslide events triggered by rainfall in the study area. However, the possibility of including non-rainfall-triggered landslide events would increase by not applying this criterion. The inclusion of non-rainfall-triggered landslides in the analysis would bias the rainfall thresholds as well as the ROC metrics, generating a higher number of undesirable false alarms.
This criterion proved to be suitable for distinguishing between rainfall events that triggered and did not trigger landslide events in the study area. However, further investigations should be carried out on this topic, namely in other study areas. An alternative method to the 3-year return period criterion could be the calculation of the thresholds in the range 5–10 km, thus excluding the current urban area. However, the landslide database used in this analysis covers a very long time period (145 years) and the urban area extension did change considerably. For example, at the end of the 19th century extensive rural zones were present within the 5 km buffer. Moreover, this option would reduce the number of landslide events considered in the analysis from 96 to 37, which would reduce the reliability of the obtained rainfall thresholds.
5.5 The spatial representativeness of a rain gauge data series
The discussion on the spatial representativeness of a rain gauge data series used to assess rainfall thresholds for landslide activity is scarce in the literature, which is surprising, taking into consideration the large number of papers dealing with empirical rainfall thresholds published in recent years. In previous work using multiple rain gauges, the distance between the gauge and the landslides is the criterion used to select the rain gauge, along with the setting features (e.g. elevation difference and morphological settings) (e.g. Brunetti et al., 2010; Peruccacci et al., 2017). However discussion on the topic is scarce and different distances have been proposed for the same region. For instance, for the Calabria region (Italy) Vennari et al. (2014) used 12 km as a limit, whereas Gariano et al. (2015b) used 5 km.
To the best of our knowledge the spatial representativeness of a single rain gauge used to assess rainfall thresholds was never addressed before. In this work, we applied a method to compute the critical distance based on the ratio of non-rainfall-triggered landslide events and rainfall-triggered landslide events tested along several buffer zones starting from the rain gauge at 5, 10, 15, 20, 30, 40, 50 and 60 km. Our method takes into account both the source of landslide data (newspapers) and the location of the rain gauge in the urban area. We acknowledge that this method is valid in urban areas, as is the case of the Lisbon region, and can be applied in other zones with a similar context. However, the method cannot be directly applied in non-urban areas, which is a drawback.
In addition, effort was made to evaluate the regional performance of the lower-limit threshold, which was proved to be applied with reasonable results up to 50 km from the rain gauge. It should be pointed out that the climatic and topographic features of the study area allow for a spatial enlargement of the threshold. The rainfall regime of the region is spatially consistent and it is mainly influenced by the general circulation of the atmosphere and by proximity to the ocean, with the same weather types associated with high rainfall (Trigo and DaCamara, 2000; Ramos et al., 2014). In addition, the orographic effect on the rainfall distribution is low in the region, which enlarges the spatial representativeness of the reference rain gauge. However, the distance at which the thresholds can be applied will always be connected with high levels of uncertainty associated with the rainfall discontinuity both in space and time. Therefore, the consideration of the lower-limit threshold up to 50 km should be used only if no other threshold is available.
The definition of rainfall thresholds for landslide initiation is typically characterized by uncertainty, which makes the use of a probabilistic approach highly recommended (e.g. Frattini et al., 2009; Berti et al., 2012). In this study a comprehensive method was applied to assess the rainfall thresholds using a centenary database of landslides that occurred in the Lisbon region from 1865 to 2010, combined with a rainfall data set collected at the Lisboa-Geofísico rain gauge, with uninterrupted daily measurements since 1864. The identification of the critical rainfall combinations responsible for preparing and triggering the landslide events were identified by selecting the pairs (cumulated rainfall duration) with the highest return period. Rainfall events that did not generate landslides were also selected and included in the analysis.
The use of a single rain gauge to assess rainfall thresholds implies the definition of the geographical area in which the thresholds can be applied. In this study we demonstrated that 10 km is the optimal distance from which to compute the rainfall thresholds, although these may be spatially extended with enough confidence up to 50 km. These distances are based on the climatic and physiographic characteristics of the study area and should not be directly extrapolated to other study areas.
The zone between the lower-limit and the upper-limit thresholds (where landslide events may occur) was analysed following a probabilistic approach, based on the positive predictive rate. Therefore, a range of probabilities of landslide event were established in association with five intermediate thresholds (20, 30, 40, 50 and 60 %), which allow the uncertainty to be quantified. Additionally, the performance of each threshold was assessed using ROC metrics. This approach can be used within landslide early warning systems as different alert levels can be associated with different probabilities of a landslide occurrence. Future research should be focused on the validation and application of the thresholds in a prototypical landslide early warning system, as has been done in other areas (e.g. Tiranti and Rabuffetti, 2010; Calvello et al., 2015; Segoni et al., 2015; Piciullo et al., 2017).
The probability of exceedance of any rainfall event combined with the probability of landslide occurrence given rainfall exceeding the threshold was also calculated. This information can be more useful to the decision makers responsible for spatial planning, although additional information is needed regarding the landslide magnitude and the spatial distribution of future landslides.
The probabilistic approach used in this study is based on very long time series of landslide events and rainfall measurements, which are seldom available. This is a serious constraint on the application of the method to other study areas where long time series of landslide events and rainfall measurements are not available. In any case, the use of landslide inventories covering long time periods is crucial for obtaining reliable thresholds that are valid at the regional scale.
Landslides data are not publicly accessible because they are currently being used in an ongoing PhD thesis. Rainfall data should be requested from the Institute Dom Luiz (IDL).
The authors declare that they have no conflict of interest.
This article is part of the special issue “Landslide early warning systems: monitoring systems, rainfall thresholds, warning models, performance evaluation and risk perception”. It is not associated with a conference.
This work is financed by national funds from the FCT - Foundation for Science and Technology, I.P., in the framework of the project FORLAND – Disastrous floods and landslides in Portugal: driving forces and applications for land use planning (PTDC/ATP-GEO/1660/2014).
Teresa Vaz is a PhD fellow funded by FCT (SFRH/BD/74716/2010). Sérgio Cruz Oliveira is a postdoc fellow funded by the FCT (SFRH/BPD/85827/2012). The newspapers research was carried out by Ivânia Quaresma, Pedro Santos and Susana Pereira. The authors are thankful to the IDL for the Lisboa-Geofísico rainfall data.
The authors are grateful to the two anonymous reviewers for their comments
and suggestions, which improved the quality of this paper.
Edited by: Luca Piciullo
Reviewed by: two anonymous referees
Aleotti, P.: A warning system for rainfall-induced shallow failures, Eng. Geol., 73, 247–265, https://doi.org/10.1016/j.enggeo.2004.01.007, 2004.
Beguería, S.: Validation and Evaluation of Predictive Models in Hazard Assessment and Risk Management, Nat. Hazards, 37, 315–329, https://doi.org/10.1007/s11069-005-5182-6, 2006.
Belo-Pereira, M., Dutra, E., and Viterbo, P.: Evaluation of global precipitation data sets over the Iberian Peninsula, J. Geophys. Res.-Atmos., 116, D20101, https://doi.org/10.1029/2010JD015481, 2011.
Berti, M., Martina, M. L. V., Franceschini, S., Pignone, S., Simoni, A., and Pizziolo, M.: Probabilistic rainfall thresholds for landslide occurrence using a Bayesian approach, J. Geophys. Res.-Earth Surf., 117, F04006, https://doi.org/10.1029/2012JF002367, 2012.
Bradley, A. P.: The use of the area under the ROC curve in the evaluation of machine learning algorithms, Pattern Recognit., 30, 1145–1159, https://doi.org/10.1016/S0031-3203(96)00142-2, 1997.
Brunetti, M. T., Peruccacci, S., Rossi, M., Luciani, S., Valigi, D., and Guzzetti, F.: Rainfall thresholds for the possible occurrence of landslides in Italy, Nat. Hazards Earth Syst. Sci., 10, 447–458, https://doi.org/10.5194/nhess-10-447-2010, 2010.
Caine, N.: The Rainfall Intensity: Duration Control of Shallow Landslides and Debris Flows, Geogr. Ann. Ser. A Phys. Geogr., 62, 23–27, https://doi.org/10.2307/520449, 1980.
Calvello, M., D'Orsi, R. N., Piciullo, L., Paes, N., Magalhaes, M., and Lacerda, W. A.: The Rio de Janeiro early warning system for rainfall-induced landslides: Analysis of performance for the years 2010–2013, Int. J. Disaster Risk Reduct., 12(Supplement C), 3–15, https://doi.org/10.1016/j.ijdrr.2014.10.005, 2015.
Cannon, S.: Regional rainfall-threshold conditions for abundant debris-flow activity, in: Floods, and Marine Effects of the Storm of January 3–5, 1982, in the San Francisco Bay region, California, edited by: Ellen, D. and Wieczorek, G. F., 35–42, US Geological Survey Professional Paper 1434, 1988.
Cardinali, M., Galli, M., Guzzetti, F., Ardizzone, F., Reichenbach, P., and Bartoccini, P.: Rainfall induced landslides in December 2004 in south-western Umbria, central Italy: types, extent, damage and risk assessment, Nat. Hazards Earth Syst. Sci., 6, 237–260, https://doi.org/10.5194/nhess-6-237-2006, 2006.
Crosta, G. B. and Frattini, P.: Rainfall-induced landslides and debris flows, Hydrol. Process., 22, 473–477, https://doi.org/10.1002/hyp.6885, 2008.
Crozier, M.: Landslides: causes, consequences and environment, Croom Helm, London, 1986.
Crozier, M. J. and Glade, T.: Frequency and magnitude of landsliding: fundamental research issues, Zeitschrift für Geomorphol. Suppl. Vol., 115, 141–155, 1999.
Cruden, D. and Varnes, D.: Landslide types and processes, in: Landslides investigation and mitigation, edited by: Turner, A. and Schuster, R., Transportation research board, US National Research Council Special Report 247, Washington, DC., 1996.
Daveau, S., Coelho, S., Costa, V. G., and Carvalho, L.: Répartition et rythme des précipitations au Portugal, 3rd Edn., Memórias do Centro de Estudos Geográficos, Lisboa, 1977.
Espírito Santo, F., Ramos, A., de Lima, M. I., and Trigo, R.: Seasonal changes in daily precipitation extremes in mainland Portugal from 1941 to 2007, Reg. Environ. Chang., 14, 1765–1788, https://doi.org/10.1007/s10113-013-0515-6, 2014.
Fawcett, T.: An introduction to ROC analysis, Pattern Recognit. Lett., 27, 861–874, https://doi.org/10.1016/j.patrec.2005.10.010, 2006.
Frattini, P., Crosta, G., and Sosio, R.: Approaches for defining thresholds and return periods for rainfall-triggered shallow landslides, Hydrol. Process., 23, 1444–1460, https://doi.org/10.1002/hyp.7269, 2009.
Gariano, S. L., Brunetti, M. T., Iovine, G., Melillo, M., Peruccacci, S., Terranova, O., Vennari, C., and Guzzetti, F.: Calibration and validation of rainfall thresholds for shallow landslide forecasting in Sicily, southern Italy, Geomorphology, 228, 653–665, https://doi.org/10.1016/j.geomorph.2014.10.019, 2015a.
Gariano, S. L., Petrucci, O., and Guzzetti, F.: Changes in the occurrence of rainfall-induced landslides in Calabria, southern Italy, in the 20th century, Nat. Hazards Earth Syst. Sci., 15, 2313–2330, https://doi.org/10.5194/nhess-15-2313-2015, 2015b.
Giannecchini, R.: Rainfall triggering soil slips in the southern Apuan Alps (Tuscany, Italy), Adv. Geosci., 2, 21–24, https://doi.org/10.5194/adgeo-2-21-2005, 2005.
Glade, T. and Crozier, M. J.: The Nature of Landslide Hazard Impact, in: Landslide Hazard and Risk, 41–74, John Wiley & Sons, Ltd., 2005.
Glade, T., Crozier, M., and Smith, P.: Applying Probability Determination to Refine Landslide-triggering Rainfall Thresholds Using an Empirical “Antecedent Daily Rainfall Model”, Pure Appl. Geophys., 157, 1059–1079, https://doi.org/10.1007/s000240050017, 2000.
Gullà, G., Caloiero, T., Coscarelli, R., and Petrucci, O.: A proposal for a methodological approach to the characterisation of Widespread Landslide Events: an application to Southern Italy, Nat. Hazards Earth Syst. Sci., 12, 165–173, https://doi.org/10.5194/nhess-12-165-2012, 2012.
Gumbel, E. J.: Statistics of extremes, Columbia University Press, New York, 1958.
Guzzetti, F., Peruccacci, S., Rossi, M., and Stark, C. P.: Rainfall thresholds for the initiation of landslides in central and southern Europe, Meteorol. Atmos. Phys., 98, 239–267, https://doi.org/10.1007/s00703-007-0262-7, 2007.
Guzzetti, F., Peruccacci, S., Rossi, M., and Stark, C. P.: The rainfall intensity–duration control of shallow landslides and debris flows: an update, Landslides, 5, 3–17, https://doi.org/10.1007/s10346-007-0112-1, 2008.
Haylock, M. R., Hofstra, N., Klein Tank, A. M. G., Klok, E. J., Jones, P. D., and New, M.: A European daily high-resolution gridded data set of surface temperature and precipitation for 1950–2006, J. Geophys. Res.-Atmos., 113, D20119, https://doi.org/10.1029/2008JD010201, 2008.
Iverson, R. M.: Landslide triggering by rain infiltration, Water Resour. Res., 36, 1897–1910, https://doi.org/10.1029/2000WR900090, 2000.
Kappes, M. S., Malet, J.-P., Remaître, A., Horton, P., Jaboyedoff, M., and Bell, R.: Assessment of debris-flow susceptibility at medium-scale in the Barcelonnette Basin, France, Nat. Hazards Earth Syst. Sci., 11, 627–641, https://doi.org/10.5194/nhess-11-627-2011, 2011.
Kutiel, H. and Trigo, R. M.: The rainfall regime in Lisbon in the last 150 years, Theor. Appl. Climatol., 118, 1–17, https://doi.org/10.1007/s00704-013-1066-y, 2014.
Lima, M. I. P., Santo, F. E., Ramos, A. M., and Trigo, R. M.: Trends and correlations in annual extreme precipitation indices for mainland Portugal, 1941–2007, Theor. Appl. Climatol., 119, 55–75, https://doi.org/10.1007/s00704-013-1079-6, 2015.
Mailier, P. J., Stephenson, D. B., Ferro, C. A. T., and Hodges, K. I.: Serial Clustering of Extratropical Cyclones, Mon. Weather Rev., 134, 2224–2240, https://doi.org/10.1175/MWR3160.1, 2006.
Marques, R., Zêzere, J., Trigo, R., Gaspar, J., and Trigo, I.: Rainfall patterns and critical values associated with landslides in Povoação County (São Miguel Island, Azores): Relationships with the North Atlantic Oscillation, Hydrol. Process., 22, 478–494, https://doi.org/10.1002/hyp.6879, 2008.
Martelloni, G., Segoni, S., Fanti, R., and Catani, F.: Rainfall thresholds for the forecasting of landslide occurrence at regional scale, Landslides, 9, 485–495, https://doi.org/10.1007/s10346-011-0308-2, 2012.
Nikolopoulos, E. I., Borga, M., Creutin, J. D., and Marra, F.: Estimation of debris flow triggering rainfall: Influence of rain gauge density and interpolation methods, Geomorphology, 243(Supplement C), 40–50, https://doi.org/10.1016/j.geomorph.2015.04.028, 2015.
Nunes, A. N. and Lourenço, L.: Precipitation variability in Portugal from 1960 to 2011, J. Geogr. Sci., 25, 784–800, https://doi.org/10.1007/s11442-015-1202-y, 2015.
Onodera, T., Yoshinaka, R., and Kazama, H.: Slope failures caused by heavy rainfall in Japan, J. Japan Soc. Eng. Geol., 15, 191–200, https://doi.org/10.5110/jjseg.15.191, 1974.
Pereira, S. and Zêzere, J. L.: Empirically-based rainfall thresholds for debris flow occurrence in the North of Portugal, in Avances de la Geomorfología en España 2010–2012. Actas de la XII Reunión Nacional de Geomorfología, 109–112, Santander, 2012.
Peruccacci, S., Brunetti, M. T., Luciani, S., Vennari, C., and Guzzetti, F.: Lithological and seasonal control on rainfall thresholds for the possible initiation of landslides in central Italy, Geomorphology, 139–140, 79–90, https://doi.org/10.1016/j.geomorph.2011.10.005, 2012.
Peruccacci, S., Brunetti, M. T., Gariano, S. L., Melillo, M., Rossi, M., and Guzzetti, F.: Rainfall thresholds for possible landslide occurrence in Italy, Geomorphology, 290, 39–57, https://doi.org/10.1016/j.geomorph.2017.03.031, 2017.
Piciullo, L., Gariano, S. L., Melillo, M., Brunetti, M. T., Peruccacci, S., Guzzetti, F., and Calvello, M.: Definition and performance of a threshold-based regional early warning model for rainfall-induced landslides, Landslides, 14, 995–1008, https://doi.org/10.1007/s10346-016-0750-2, 2017.
Pinto, J. G., Bellenbaum, N., Karremann, M. K., and Della-Marta, P. M.: Serial clustering of extratropical cyclones over the North Atlantic and Europe under recent and future climate conditions, J. Geophys. Res.-Atmos., 118, 12476–12485, https://doi.org/10.1002/2013JD020564, 2013.
Ramos, A. M., Cortesi, N., and Trigo, R. M.: Circulation weather types and spatial variability of daily precipitation in the Iberian Peninsula, Front. Earth Sci., 2, 25, https://doi.org/10.3389/feart.2014.00025, 2014.
Reichenbach, P., Cardinali, M., De Vita, P., and Guzzetti, F.: Regional hydrological thresholds for landslides and floods in the Tiber River Basin (central Italy), Environ. Geol., 35, 146–159, https://doi.org/10.1007/s002540050301, 1998.
Ribeiro, O., Lautensach, H., and Daveau, S.: Geografia de Portugal II. O Ritmo Climático e a Paisagem, Edições João Sá da Costa, 1999.
Rosi, A., Segoni, S., Catani, F., and Casagli, N.: Statistical and environmental analyses for the definition of a regional rainfall threshold system for landslide triggering in Tuscany (Italy), J. Geogr. Sci., 22, 617–629, https://doi.org/10.1007/s11442-012-0951-0, 2012.
Saito, H., Nakayama, D., and Matsuyama, H.: Relationship between the initiation of a shallow landslide and rainfall intensity–duration thresholds in Japan, Geomorphology, 118, 167–175, https://doi.org/10.1016/j.geomorph.2009.12.016, 2010.
Segoni, S., Rossi, G., Rosi, A., and Catani, F.: Landslides triggered by rainfall: A semi-automated procedure to define consistent intensity–duration thresholds, Comput. Geosci., 63(Supplement C), 123–131, https://doi.org/10.1016/j.cageo.2013.10.009, 2014.
Segoni, S., Battistini, A., Rossi, G., Rosi, A., Lagomarsino, D., Catani, F., Moretti, S., and Casagli, N.: Technical Note: An operational landslide early warning system at regional scale based on space-time-variable rainfall thresholds, Nat. Hazards Earth Syst. Sci., 15, 853–861, https://doi.org/10.5194/nhess-15-853-2015, 2015.
Staley, D. M., Kean, J. W., Cannon, S. H., Schmidt, K. M., and Laber, J. L.: Objective definition of rainfall intensity–duration thresholds for the initiation of post-fire debris flows in southern California, Landslides, 10, 547–562, https://doi.org/10.1007/s10346-012-0341-9, 2013.
Terlien, M. T. J.: The determination of statistical and deterministic hydrological landslide-triggering thresholds, Environ. Geol., 35, 124–130, https://doi.org/10.1007/s002540050299, 1998.
Tiranti, D. and Rabuffetti, D.: Estimation of rainfall thresholds triggering shallow landslides for an operational warning system implementation, Landslides, 7, 471–481, https://doi.org/10.1007/s10346-010-0198-8, 2010.
Trigo, R. M. and DaCamara, C. C.: Circulation weather types and their influence on the precipitation regime in Portugal, Int. J. Climatol., 20, 1559–1581, https://doi.org/10.1002/1097-0088(20001115)20:13<1559::AID-JOC555>3.0.CO;2-5, 2000.
Vaz, T. and Zêzere, J. L.: Landslides and other geomorphologic and hydrologic effects induced by earthquakes in Portugal, Nat. Hazards, 81, 71–98, https://doi.org/10.1007/s11069-015-2071-5, 2016.
Vennari, C., Gariano, S. L., Antronico, L., Brunetti, M. T., Iovine, G., Peruccacci, S., Terranova, O., and Guzzetti, F.: Rainfall thresholds for shallow landslide occurrence in Calabria, southern Italy, Nat. Hazards Earth Syst. Sci., 14, 317–330, https://doi.org/10.5194/nhess-14-317-2014, 2014.
Vitolo, R., Stephenson, D. B., Cook, I. M., and Mitchell-Wallace, K.: Serial clustering of intense European storms, Meteorol. Zeitschrift, 18, 411–424, https://doi.org/10.1127/0941-2948/2009/0393, 2009.
Wieczorek, G. F., Morgan, B. A., and Campbell, R. H.: Debris-flow hazards in the Blue Ridge of central Virginia, Environ. Eng. Geosci., 6, 3–23, https://doi.org/10.2113/gseegeosci.6.1.3, 2000.
Wilson, R. C.: Normalizing rainfall/debris-flow thresholds along the U.S. Pacific coast for long-term variations in precipitation climate, in: Proceedings of the 1997 1st International Conference on Debris-Flow Hazards Mitigation: Mechanics, Prediction, and Assessment, 32–43, ASCE, San Francisco, CA, USA, 1997.
Zêzere, J. L., Trigo, R. M., and Trigo, I. F.: Shallow and deep landslides induced by rainfall in the Lisbon region (Portugal): assessment of relationships with the North Atlantic Oscillation, Nat. Hazards Earth Syst. Sci., 5, 331–344, https://doi.org/10.5194/nhess-5-331-2005, 2005.
Zêzere, J. L., Trigo, R. M., Fragoso, M., Oliveira, S. C., and Garcia, R. A. C.: Rainfall-triggered landslides in the Lisbon region over 2006 and relationships with the North Atlantic Oscillation, Nat. Hazards Earth Syst. Sci., 8, 483–499, https://doi.org/10.5194/nhess-8-483-2008, 2008.
Zêzere, J. L., Pereira, S., Tavares, A. O., Bateira, C., Trigo, R. M., Quaresma, I., Santos, P. P., Santos, M., and Verde, J.: DISASTER: a GIS database on hydro-geomorphologic disasters in Portugal, Nat. Hazards, 72, 503–532, https://doi.org/10.1007/s11069-013-1018-y, 2014.
Zêzere, J. L., Vaz, T., Pereira, S., Oliveira, S. C., Marques, R., and Garcia, R. A. C.: Rainfall thresholds for landslide activity in Portugal: a state of the art, Environ. Earth Sci., 73, 2917–2936, https://doi.org/10.1007/s12665-014-3672-0, 2015.