the Creative Commons Attribution 4.0 License.
the Creative Commons Attribution 4.0 License.
 | 03 Jun 2026
Morphological response of vegetated and urbanized barrier islands to Hurricane Ian
Hassan Ilyas
Ap van Dongeren
Dano Roelvink
Ellen Quataert
Christopher Daly
Barrier islands are vulnerable to extreme storm events which cause erosion and deposition of sediment. These morphological changes pose risks to both the built environment and natural habitats but are also affected by them. This study investigates the morphological impacts of Hurricane Ian (2022) on two barrier islands along Florida's Gulf Coast: the urbanized Fort Myers Beach, and Lovers Key, a naturally vegetated island and State Park. Using high-resolution pre- and post-storm topo-bathymetric datasets, we quantify patterns of erosion, sediment deposition and dune crest change. In addition, we investigated the morphological response of the developed and natural barrier islands by integrating spatially varying land cover data into the numerical model XBeach. Results show that the built environment on Fort Myers Beach significantly affects sediment transport pathways, causing localized erosion and deposition patterns distinct from those observed on the vegetated Lovers Key Island where dune crest lowering, landward migration, and storm-induced breach were prominent. Model simulations that incorporated detailed spatial variability of vegetation and built environment, replicated observed morphological changes with reasonable Brier Skill Scores, including the location of breach formation. Sensitivity analyses demonstrated that relatively small changes in roughness coefficient, wave skewness and asymmetry factor, morphological acceleration factor, and boundary water levels influence erosion intensity and sediment deposition patterns. Additionally, introducing supplemental vegetation patches in the model showed less dune erosion on vegetated barrier island, indicating that revegetation of islands may be beneficial. The findings provide insights into the complex interplay between storm forcing, land cover variability, and barrier island morphodynamics, and emphasize the importance of incorporating detailed land use and vegetation data in morphodynamic models to better assess barrier island responses to future storms under evolving climatic conditions, ultimately aiding efforts to enhance coastal resilience and adaptive management.
- Article
(13027 KB) - Full-text XML
- BibTeX
- EndNote


Barrier islands are integral components of sandy coastlines, covering 10 % of the world's coastlines (Stutz and Pilkey, 2011). They provide space for natural habitat, support livelihoods and recreation, and act as critical buffers that reduce backshore flooding during extreme events (Nordstrom, 2000). Storms continually reshape barrier islands by driving large-scale sediment transport through both landward and seaward processes under distinct impact regimes (Pardo-Pascual et al., 2014; Sallenger, 2000) causing berm erosion, dune crest lowering, overwash and breaching. Storms change the shoreline orientation and position (Almeida et al., 2012) as waves and storm surges erode and redistribute sediment (Harris et al., 2011; Lavaud et al., 2020). Storm surges transport sediments landward, forming overwash deposits and driving barrier island migration. However, in highly urbanized settings, the built environment alters overwash processes, disrupts the islands' natural ability to migrate, reorient and recover, and increases the risk of potential damages (Jiménez et al., 2011; Lazarus et al., 2021). Barrier islands are becoming increasingly vulnerable as human occupation intensifies and extreme storm events become more frequent (IPCC, 2018; Jiménez et al., 2011). This vulnerability is further exacerbated by sea-level rise, as even modest increases in mean sea level are projected to amplify storm impacts (FitzGerald et al., 2008; Tebaldi et al., 2012). Understanding the rapid morphological changes in the presence of vegetation and built environment resulting from storm events is essential not only for effectively managing the coastline but also for developing and implementing mitigation strategies to reduce future risk.
Morphodynamic models such as XBeach can simulate storm-induced coastal change of dunes and beaches by explicitly resolving hydrodynamic and sediment transport processes as well as morphological updating (McCall et al., 2010; Roelvink et al., 2009; Sherwood et al., 2022). In XBeach, the effects of vegetation and other land cover types (e.g., vegetated dunes, mangroves, buildings, or engineered terrain) can be represented by a bed roughness according to Land Use and Land Cover (LULC) data. Roelvink et al. (2009), McCall et al. (2010), and Lindemer et al. (2010) used a constant Chezy bed roughness across the entire model domain, regardless of vegetation presence. De Vet et al. (2015), Passeri et al. (2018), and Van der Lugt et al. (2019) advanced these approaches by incorporating spatially variable roughness and vegetation dynamics, such as applying different Manning's coefficients for vegetated and non-vegetated areas or implementing dynamic roughness modules that adjust in response to changes in vegetation cover during extreme storms, resulting in improved predictions of storm-driven morphological change.
In this study, we implemented XBeach area models to simulate the impact of Hurricane Ian (2022) on two Florida barrier islands, with a focus on the natural Lovers Key and the urbanized Fort Myers Beach. The study emphasizes how spatial variability in LULC influences morphological changes of the dunes during extreme storm events. We employed different LULC datasets to assess the effects of varying land cover configurations on sedimentation and erosion patterns and dune crest change, hereafter referred to as Scenarios. This study also investigated the sensitivity of model outputs to key parameters including wave skewness and asymmetry (facua), the morphological acceleration factor (morfac), and forcing conditions such as wave height and water levels. Additionally, the impact of supplemental vegetation on the Lovers Key's morphodynamics was evaluated. Section 2 presents the study area and data used, Sect. 3 describes the methodology and evaluation metrics, Sect. 4 reports the results, and Sects. 5 and 6 provide discussion and conclusions.
Hurricane Ian originated from a tropical wave that emerged off the west coast of Africa. It intensified over the Gulf of Mexico and made landfall as Category 4 in Lee County, Florida on 28 September 2022 at 14:05 EST. The storm followed a northward track across southwest Florida produced prolonged extreme forcing, with maximum sustained winds of ∼ 65–70 m s−1, minimum central pressure of ∼ 941 mb, and storm surge exceeding 3–4 m above mean sea level, resulting in widespread inundation of barrier islands including Fort Myers Beach and Lovers Key (Bucci et al., 2023). Our study focuses on Fort Myers Beach, on Estero Island, a low lying and densely developed barrier island bounded by San Carlos Bay to the north and Big Carlos Pass to the south, and on nearby Lovers Key on the Lovers Key State Park (Fig. 1). On Estero Island, more than 2400 structures were impacted, with damage to heavily affected buildings estimated to exceed USD 200 million (Hauptman et al., 2024). Lovers Key State Park comprises four interconnected barrier islands: Lovers Key, Inner Key, Long Key, and Black Island. It is bounded by Big Carlos Pass to the north and New Pass to the south and contains relatively natural beach dune and back barrier ecosystems. After Hurricane Charley in 2004, dune and vegetation restoration through nourishment and planting was undertaken, with major works completed by 2014 (FDEP, 2005). During Ian, storm surge inundated Lovers Key, driving substantial morphological change, including a breach near the northern end by the bridge and widespread dune lowering.
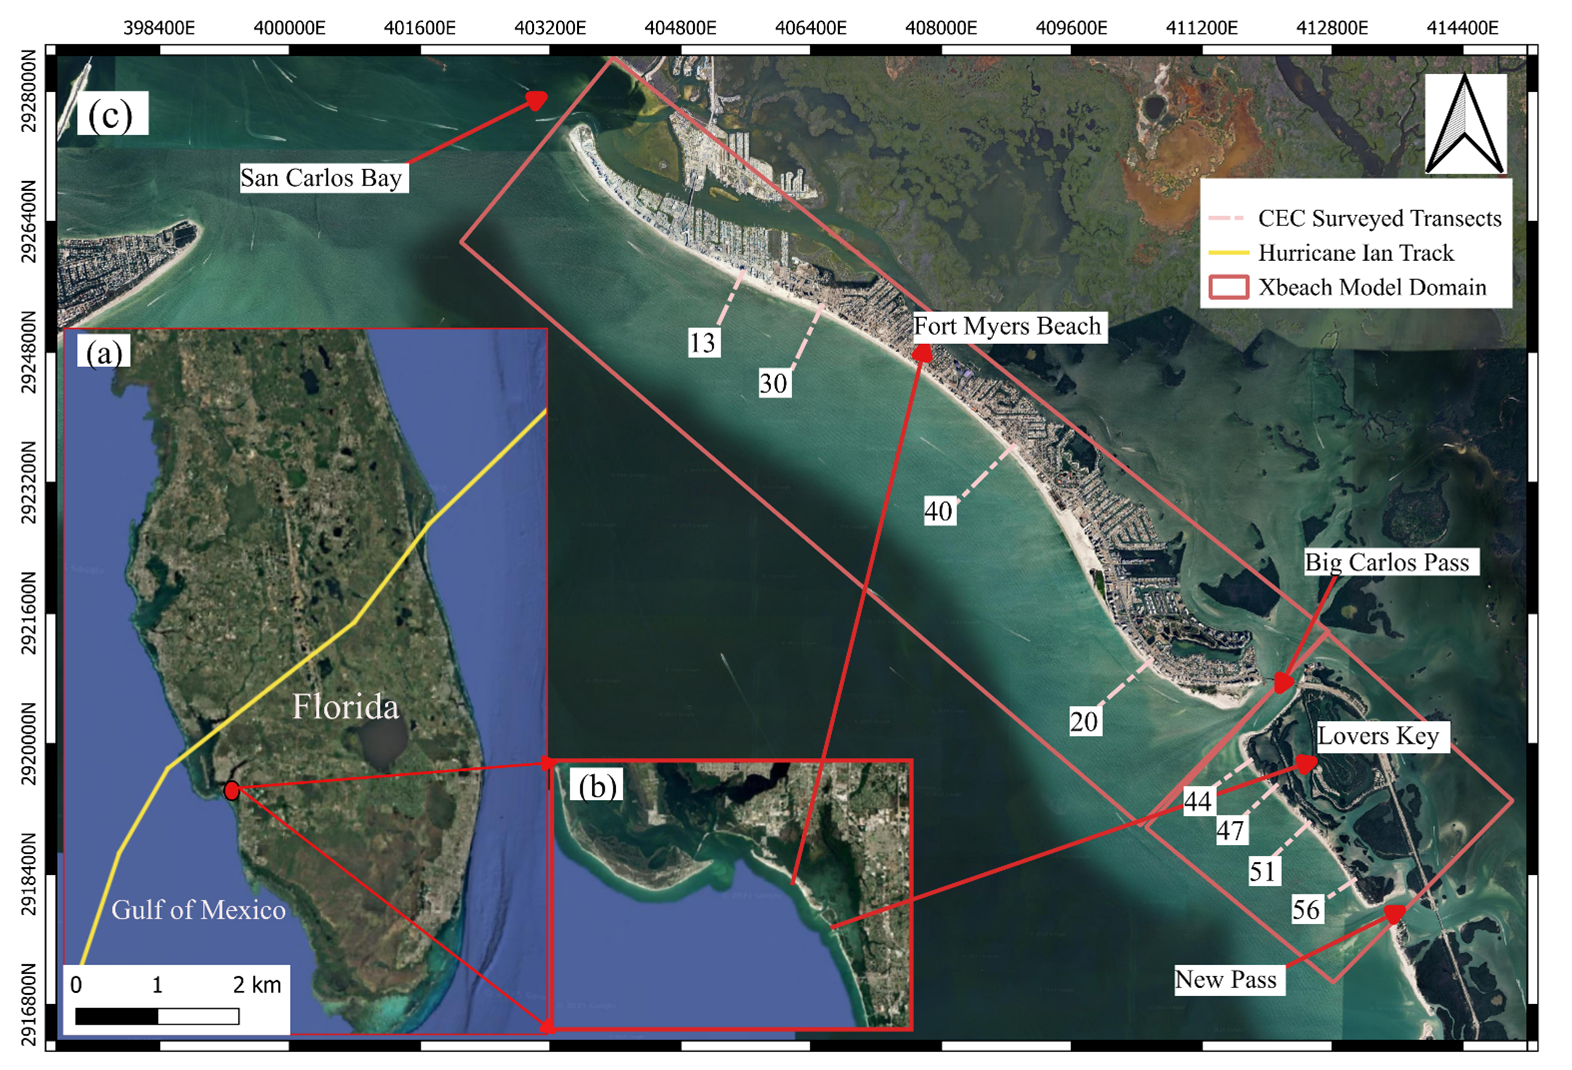
Figure 1Study area maps showing (a) Florida and the track of Hurricane Ian (yellow line), (b) the focus sudy area along the southwest coast of Florida, and (c) detailed views of Fort Myers Beach and Lovers Key with surrounding passes (Big Carlos Pass, New Pass) and San Carlos Bay, including CEC surveyed transects (dashed lines) and XBeach model domains (red rectangles) (Imagery © 2025 Google Earth).
The topo-bathymetric data sources consist of “NOAA Pre-Ian” and “NOAA Post-Ian” rasterized topo-bathymetric Digital Elevation Models (DEMs). These Hurricane Ian LiDAR datasets were obtained from NOAA's Digital Coast and collected using airborne LiDAR systems under standardized USACE–NOAA protocols, with a 1 m horizontal resolution and referenced to NAVD88. The NOAA Pre-Ian dataset (OCM Partners, 2025b) was collected between May and June 2022, and the NOAA Post-Ian dataset (OCM Partners, 2025a) in November 2022. The topographic data have a reported vertical accuracy of approximately 19.6 cm (95 % confidence), while bathymetric returns exhibit depth-dependent accuracy. The NOAA Post-Ian dataset has a smaller spatial coverage compared to the pre-storm dataset because LiDAR penetration was limited under high turbidity conditions following the hurricane. Additionally, an in-situ dataset is provided by Coastal Engineering Consultants (CEC). These transects, referred to as “CEC Pre-Ian” and “CEC Post-Ian”, were surveyed before and after Hurricane Ian in June–July 2022 and October–November 2022, respectively. In total, 57 transects were surveyed, with 43 transects on Fort Myers Beach (Transect No. 1 to Transect No. 43) and 14 transects on Lovers Key (Transect No. 44 to Transect No. 57). The surveys were conducted using RTK GPS across the subaerial beach and into the surf zone (to approximately −4 m NAVD88), while deeper nearshore bathymetry was collected using single-beam sonar, with an overlap of approximately 6 m between RTK GPS and sonar measurements to ensure continuity (Michael Poff, CEC, personal communication, 2025).
Note that in this paper we retain the original numbering assigned during the CEC field survey to maintain consistency with the source dataset, even though model-data comparisons are not shown for every transect. An additional dataset with a smaller spatial extent compared to the NOAA and CEC datasets is provided by Florida Gulf Coast University (FGCU), which conducted pre- and post-Hurricane Ian LiDAR surveys for Lovers Key in June 2022 and October 2022, respectively, referred to as “FGCU Pre-Ian” and “FGCU Post-Ian”. The post-storm LiDAR data were collected using a UAV-mounted Velodyne HDL-32 sensor flown at approximately 50 m altitude, with a swath width of about 60 m and an overlap of around 20 m between adjacent flight lines. The dataset is referenced to NAVD88 and has a reported vertical accuracy of approximately 5 cm (Christopher Daly, FGCU, personal communication, 2025; Bhatt et al., 2023).
Two main sources of LULC data are available for the study areas. The first is a nationally standardized land cover dataset derived from the NOAA 2022 satellite imagery, which provides 1 m resolution coverage of coastal intertidal areas, wetlands, and adjacent uplands (Office for Coastal Management, 2025a, b). The second data source is from the National Oceanographic Partnership Program (NOPP), which provides a fused high-resolution LULC dataset that integrates satellite imagery, with spatial resolutions ranging from 1 to 30 m (NOPP, 2021).
3.1 Model Setup
In this study, two 2DH XBeach area models (version 1.24.6057-Halloween Beta release) were set up for Lovers Key and Fort Myers Beach, both configured in surfbeat mode. A morphological acceleration factor (morfac) of 5 was applied to reduce computational expense, and all other parameters remained at their default settings. A uniform rectangular grid with 2 m spacing in the cross-shore direction and 5 m spacing alongshore was chosen for both domains, as shown in Fig. 1. The grid was extended alongshore to the channels around the barrier heads, to be able to include the hydrodynamics that may affect morphological change on the island heads during Hurricane Ian.
3.2 Bathymetry
The bathymetry was generated by combining the NOAA Pre-Ian DEM, which extends to depths of up to 7 m, with the 3-meter-resolution Continuously Updated Digital Elevation Model (CUDEM) dataset (NOAA, 2018) to provide coverage of deeper waters. However, the deeper-water bathymetry incorporated from CUDEM represents comparatively stable offshore morphology, where short-term storm-driven variability is typically lower than in the nearshore zone. Considering the Gulf of Mexico's shallow offshore bathymetry, the model domain was truncated at 9 m below NAVD88. Beyond this depth, the bathymetry was extended seaward to 25 m on a gentle slope of 1:50, minimizing numerical instabilities at the open boundary.
3.3 Boundary Forcings
The models were forced with time-varying wave and water level boundaries which were derived from the surge (SFINCS) and wave (HurryWave) models (Van Dongeren et al., 2024) using COAMPS-TC (Doyle et al., 2014) meteorological input. The wave conditions shown in Fig. 2a were imposed at the offshore boundary for each site. The slightly higher post-peak wave heights at Lovers Key are related to differences in offshore bathymetry and local exposure along the Gulf-facing boundary. Although Lovers Key includes back-barrier environments, the wave time series presented here correspond specifically to the open-coast boundary conditions rather than the bay side, where wave energy is substantially reduced. Neumann lateral boundary conditions were applied at the seaward and landward boundaries to maintain constant water levels, with two tidal signals specified at the offshore (sea) and landward (land) boundaries, as illustrated in Fig. 2b. A simulation duration of 30 hours was specified to capture the rise and fall of the storm.
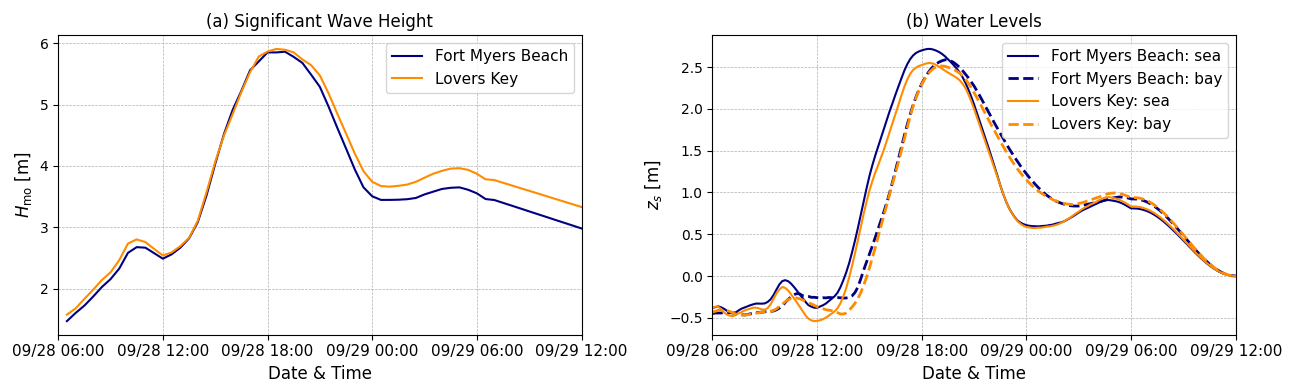
Figure 2Time series of (a) Significant Wave Height (Hmo) and (b) Water Levels (zs) at Lovers Key (orange lines) and Fort Myers (blue lines) Beach during Hurricane Ian. Solid lines indicate boundary locations on the Gulf side, while dashed lines indicate the bay side.
3.4 Land Use Land Cover Scenarios
To evaluate the modelled morphological change for different LULC data sources, we defined three baseline Manning's roughness scenarios to represent the influence of vegetation and built environment. The built environment (including buildings, roads, and warehouses) was represented based on the digital terrain model, which excludes above-ground raised topography (i.e., increased bed level). Their effects on hydrodynamics and sediment transport were captured through higher Manning's roughness values, as described below.
-
Scenario 1 (S1) applies a uniform Manning's roughness coefficient of 0.02 to simulate a sandy bed and serves as a reference case.
-
Scenario 2 (S2), shown for Fort Myers Beach in Fig. 3a and for Lovers Key in Fig. 3c, uses LULC data from the NOPP project, originally consisting of 23 classes, which were reclassified into four categories based on Mattocks and Forbes (2008) as reported by Salgado (2023): primary vegetation with a roughness of 0.04, secondary vegetation with 0.05, sandy bed with 0.02, and built environment with 0.10.
-
Scenario 3 (S3), shown for Fort Myers Beach in Fig. 3b and for Lovers Key in Fig. 3d, uses NOAA canopy cover and impervious surface data, assigning roughness values of 0.04 for scrub or shrub areas (primary vegetation), 0.05 for upland trees (secondary vegetation), and 0.10 for built environment.
Figure 3 illustrates the spatial distribution of land cover classifications used in Scenarios 2 and 3 for both study sites. For Fort Myers Beach, the NOAA dataset (Scenario 3) provides a more recent and higher-resolution (1 m) representation of the built environment, capturing finer details of built features such as roads and impervious surfaces. In contrast, the NOPP dataset (Scenario 2) has a resolution (1–30 m) and depicts a denser distribution of non-erodible areas, resulting in more extensive coverage of urban surfaces. For Lovers Key, several patches of primary vegetation along the back barrier and foredune zones are classified as secondary vegetation in Scenario 3, highlighting differences between the two land-cover datasets. These differences are related to variations in source data resolution, classification methodology, and preprocessing approaches, rather than representing actual changes in vegetation condition.
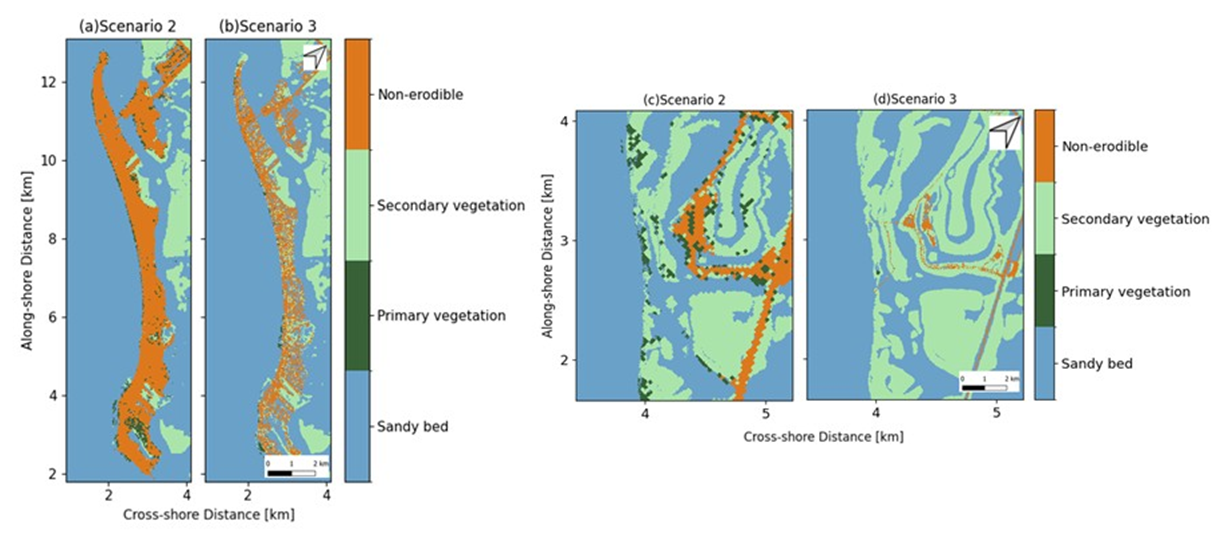
Figure 3Spatial Land Use Land Cover classification maps for Scenarios 2 (NOPP dataset) and Scenario 3 (NOAA dataset): (a, b) Fort Myers Beach, (c, d) Lovers Key. Manning's n values are 0.02 for sandy bed, 0.04 for primary vegetation, 0.05 for secondary vegetation, and 0.1 for non-erodible surfaces.
3.5 Evaluation Metrics
The performance of the model was evaluated using the bias and Brier Skill Score (BSS), which were calculated following Eqs. (1) and (2).
where zb, modelled is the predicted bed level, zb, measured is the post-Ian observed bed level, zb, inital is the pre-Ian bed level and N is the total number of points. BSS values were classified as Excellent (0.8–1.0), Good (0.6–0.8), Reasonable (0.3–0.6), Bad (0.0–0.3), and Poor (< 0.0), following (Van Rijn et al., 2003)
For Lovers Key, changes in dune crest elevation were evaluated using shore-normal transects extending approximately 200 m landward from the shoreline, a distance selected to ensure intersection with the primary dune. Along each transect, the dune crest was defined as the maximum elevation associated with the primary dune, thereby excluding lower elevation berm crests that may exist seaward before or following the storm (Eq. 3). The dune crest location was identified along each transect, and post-storm crest elevation was evaluated at the same location. Crest shift was defined as the horizontal displacement of this primary dune crest relative to its pre-storm position (Eq. 4):
where x and y are the coordinates corresponding to the maximum elevation.
4.1 Storm-Induced Dune Morphodynamics at Lovers Key
At Lovers Key, in Scenario 1, the all-sand bed roughness approach (Fig. 4b) fails to reproduce the observed post-hurricane topography (Fig. 4a). Erosion is significantly overestimated, leading to overprediction of sediment deposition landward and overprediction of the breach extent (BSS = −2.96). In Scenario 2 (Fig. 4c), the inclusion of increased Manning's n values in vegetated areas introduces flow resistance, leading to less exaggerated erosion and more localized sedimentation patterns which agrees better with the observations (BSS = 0.38). Scenario 3, based on NOAA LULC data (Fig. 4d), yields a bed-level distribution slightly more consistent with the observations (BSS = 0.40), capturing improved sediment retention and a breach width that aligns more closely with post-Ian observed data. For the Lovers Key model, the inclusion of vegetation, represented by locally increased bed friction, improves morphodynamic predictions, consistent with the conclusions of Van der Lugt et al. (2019). The application of the two different LULC datasets in Scenario 2 and Scenario 3 do not result in significant different sedimentation and erosion patterns, despite the differences in land use classification (Fig. 3c and d). Note that while the modelled peak water levels are in close agreement with the observations at NOAA station 8725520 at Ft. Myers (see Van Dongeren et al., 2024), recently published observations of ad hoc installed pressure sensors FLLEE03382 and FLLEE03284 on Ft Myers Beach (https://apps.usgs.gov/fev/event/2022-ian, last access: 20 August 2025) indicate that the observed peak water levels are underestimated by 0.6 m on those locations. However, both in the modelled case and in the observations the peak water level indicates that the island is in the Inundation Regime (Sallenger, 2000) with a modelled peak water depth of about 1 m over the pre-storm dune crest and 1.5 m and more over the main part of the island. Also, because both modelled and observed water level increases during the surge phase are similar, the processes governing the morphological change of the dune and beach are represented by the model.
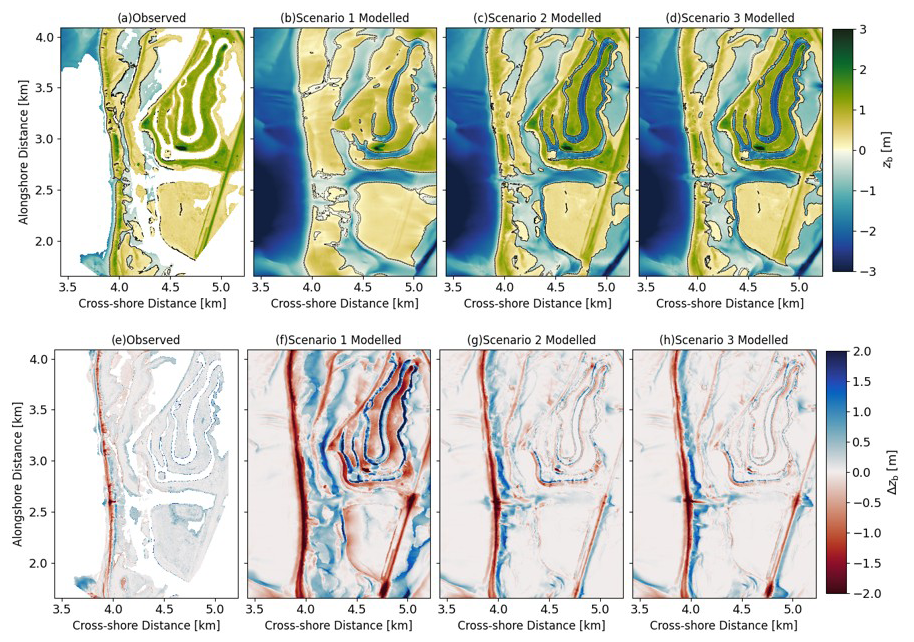
Figure 4Observed and computed post-Ian bed level and sedimentation and erosion patterns for Lovers Key. (a) NOAA observations; (b) XBeach modelled Scenario 1 with uniform sandy roughness; (c) Scenario 2 based on the NOPP LULC dataset; and (d) Scenario 3 based on the NOAA LULC dataset. The bottom row shows sedimentation and erosion plots for (e) observed, (f) Scenario 1, (g) Scenario 2, and (h) Scenario 3.
4.1.1 Dune Crest Change
The comparison of modelled and observed alongshore dune crest elevation change (Fig. 5a) and cross-shore crest shift (Fig. 5b) highlights differences across modelled scenarios. The profiles are labeled as NOAA+CEC because the two datasets were merged to construct continuous cross-shore profiles extending from the subaerial beach and dune into deeper nearshore waters. NOAA LiDAR provides high-resolution coverage of the subaerial and shallow nearshore regions but does not reliably capture deeper bathymetry, whereas the CEC surveys extend offshore beyond the LiDAR coverage. Both datasets are referenced to NAVD88 and were spatially aligned prior to merging, resulting in a continuous profile with consistent vertical referencing. All scenarios show dune crest lowering, but the magnitude of this change varies significantly. Scenario 1 overestimates crest lowering, with an average of 1.25 m, which is greater than the observed 0.35 m (NOAA) and 0.43 m (FGCU). In contrast, Scenario 3, with an average crest lowering of 0.44 m, closely matches the NOAA observations, while Scenario 2 predicts an average lowering of 0.57 m. The reduced erosion in Scenario 3 can be attributed to the higher proportion of secondary vegetated areas in the NOAA LULC dataset, which increases local bed roughness in the model (Fig. 3) and demonstrates that incorporating spatially varying bed friction improves dune erosion prediction (Van der Lugt et al., 2019; van Puijenbroek et al., 2017). Alongshore patterns reveal further differences, with NOAA and FGCU data showing alternating zones of moderate lowering and stability between 0.5 and 1.0 km, while Scenario 1 smooths out this variability and consistently predicts excessive lowering; Scenario 2 and Scenario 3 better reproduce the alongshore variability but overestimate the lowering on the northern side of the breach (x ≈ 0.65 km), where sediment transported into the breach was likely deposited by ebbing flows over time. Similarly, for crest shift, Scenario 3 provides the closest match to observations (30.05 m) compared to 19.87 m for NOAA and 20.10 m for FGCU. However, the alongshore variability in observed cross-shore crest shifts, with landward displacement peaking near the breach, is only partially reproduced, while Scenario 1 exaggerates this shift at 43.23 m and Scenario 2 predicts 32.61 m.
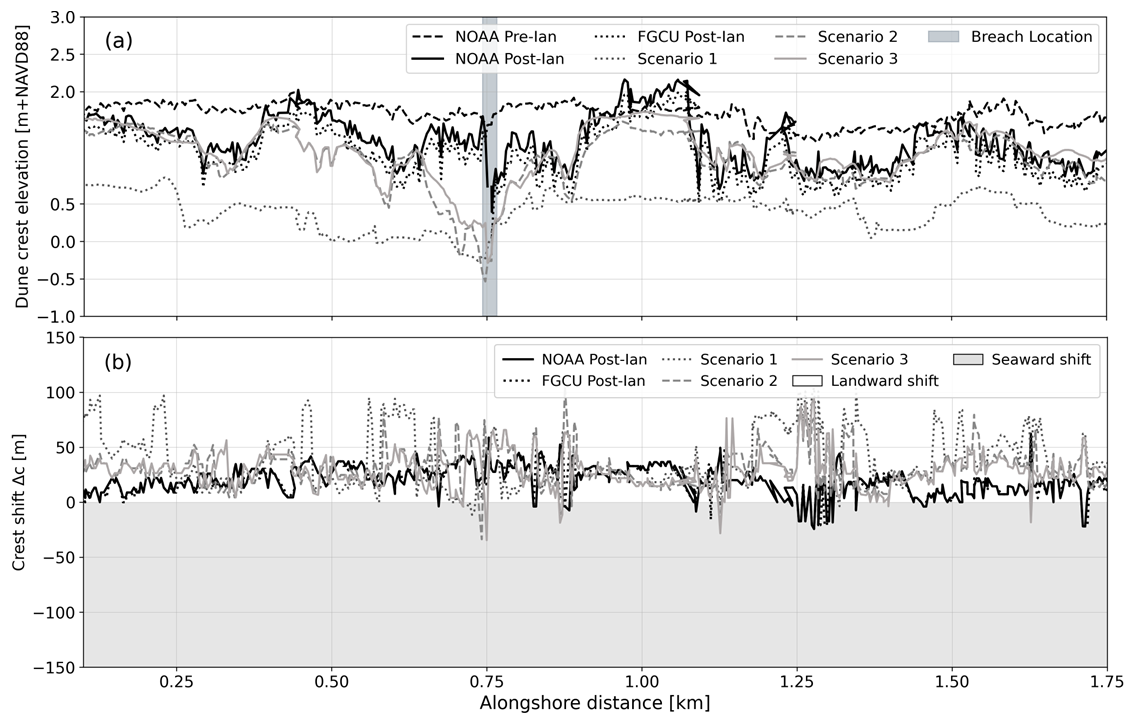
Figure 5(a) Dune crest elevation changes versus alongshore distance and (b) horizontal dune crest shift at Lovers Key for observed data (NOAA and FGCU) and XBeach modelled Scenarios 1, 2, and 3 (described in Fig. 4).
4.1.2 Model Versus Observed Cross-shore Profiles
Besides comparing to remotely sensed spatial patterns, we have also evaluated the model against in-situ observations, as shown by the CEC surveyed transects outlined in Fig. 1. In Transect 44 (Fig. 6a), the pre-storm dune crest elevation was approximately 1.75 m (at x = 425 m), but post-storm it was reduced to 1.15 m. In Scenario 1, the dune was fully eroded and sand was deposited between x = 100–300 m, while Scenario 2 and Scenario 3 capture the post-storm dune crest but show a slight overestimation of dune erosion, with the excess sediment deposited landward between x = 300–400 m. Similar onshore sediment transport patterns were observed for Transect 47 (Fig. 6b), Transect 51 (Fig. 6c), and Transect 56 (Fig. 6d). In Transect 47, which passes through dense vegetation cover, the crest remained stable; Scenario 2 and Scenario 3 showed similar dune crest positions, with deviations of approximately −0.5 m compared to the observed profile, while in Scenario 1 the dune was washed away entirely. In Transect 51, the crest migrated inland to x = 350 m, and XBeach modelled the dune crest at a similar horizontal position to the post-Ian observations, as was also the case for Transect 47. In Transect 56, the dune crest dropped by more than 0.5 m, and in the modelled Scenarios 2 and 3, the eroded sediment was deposited further inland. Across all modelled scenarios, dune erosion and inland deposition was greater than in the observed profiles Overall, among all transects, Scenario 2 and Scenario 3 matched the observed dune crest more closely than Scenario 1, whereas in Scenario 1 dune crest is fully eroded.
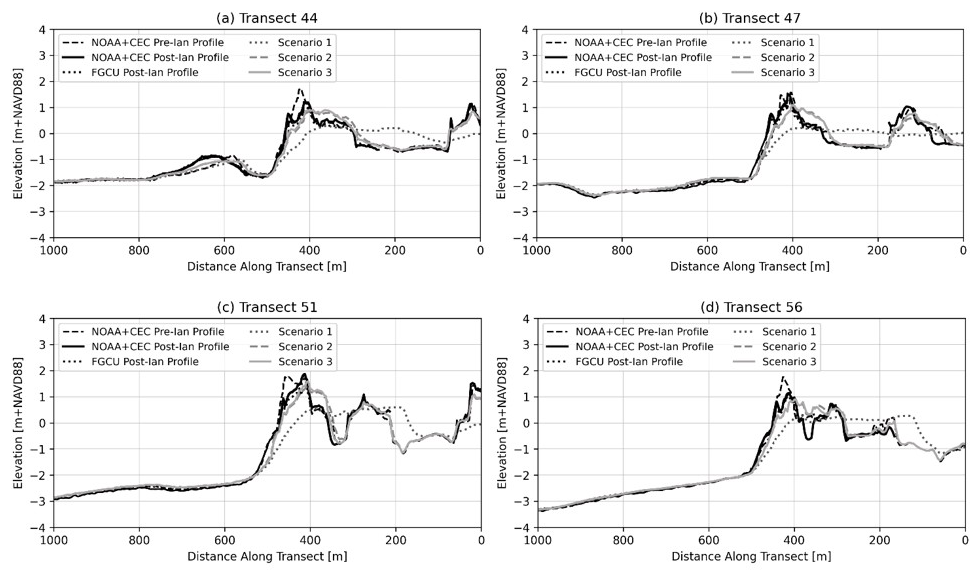
Figure 6Comparison of XBeach modelled Scenarios 1 (dotted line), 2 (dashed line), and 3 (solid line) (described in Fig. 4) with observed data at Transects 44, 47, 51, and 56 (shown in Fig. 1) at Lovers Key.
4.1.3 Impact of Supplemental Vegetation on Morphological Response of Vegetated Barrier Island
Vegetation influences coastal morphology by affecting hydrodynamic forces and sediment transport processes, as its presence enhances bed roughness, reduces erosion, and promotes sediment deposition (Feagin et al., 2015; Figlus et al., 2014; McGuirk et al., 2022). To evaluate the impact of supplemental vegetation, vegetation patches with a Manning's n value of 0.04 (primary vegetation) were added to Scenario 3, as shown in Fig. 7a, and referred to as Scenario 3a. These patches were placed at elevations above 1 m relative to the mean sea level (MSL = −0.188 m), and the same vegetation patches were then allowed to evolve into secondary vegetation (Manning's n = 0.05) to investigate what happens if the same vegetation matures over time. Transects 1 and 2 in Fig. 7b and c show the effect of vegetation, with Scenario 3a indicating noticeable sediment accumulation within these newly vegetated zones compared to the base case Scenario 3 without the added vegetation strips. The vegetated strips elevated the dune crest by approximately 0.5 m (Fig. 7b) at x = 450 m. Introducing narrow strips of primary vegetation (Fig. 8b) led to sediment accumulation at the breach location and showed that the overwash deposit did not connect to the back barrier over an alongshore distance of 2.8 km. Allowing these same strips to mature into full secondary vegetation (Fig. 8d) resulted in reduced erosion around the vegetated zones alongshore (x ≈ 2.5 km). Additionally, the breach location shifted southward, with increased sedimentation of the breach channel in both cases (shown in blue in Fig. 8c and e). Overall, these results demonstrate that vegetation establishment and maturation substantially increase surface roughness and reduce erosion.
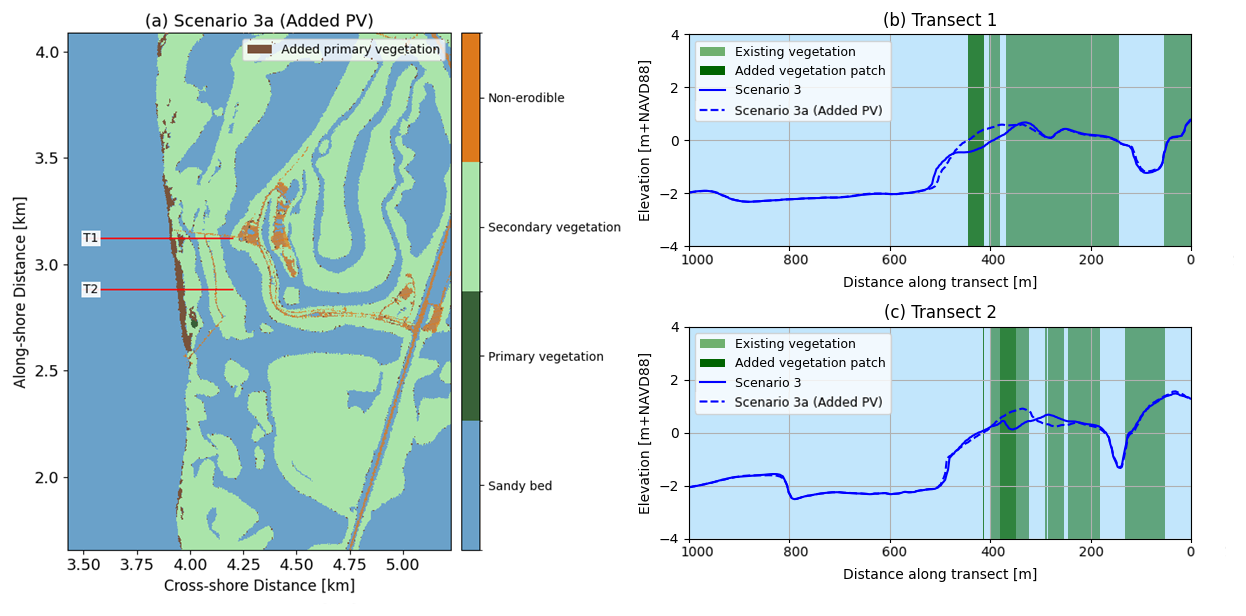
Figure 7Scenario 3 (based on NOAA LULC dataset) at Lovers Key with (S3a) and without (S3) added primary vegetation (PV). (a) Spatial distribution showing sandy bed, primary vegetation, secondary vegetation, and non-erodible areas, with transect locations (T1, T2). (b–c) Cross-shore profiles along Transects 1 and 2, comparing Scenario 3 (solid blue) and Scenario 3 with added PV (dashed blue), with existing vegetation (light green) and added patches (dark green).
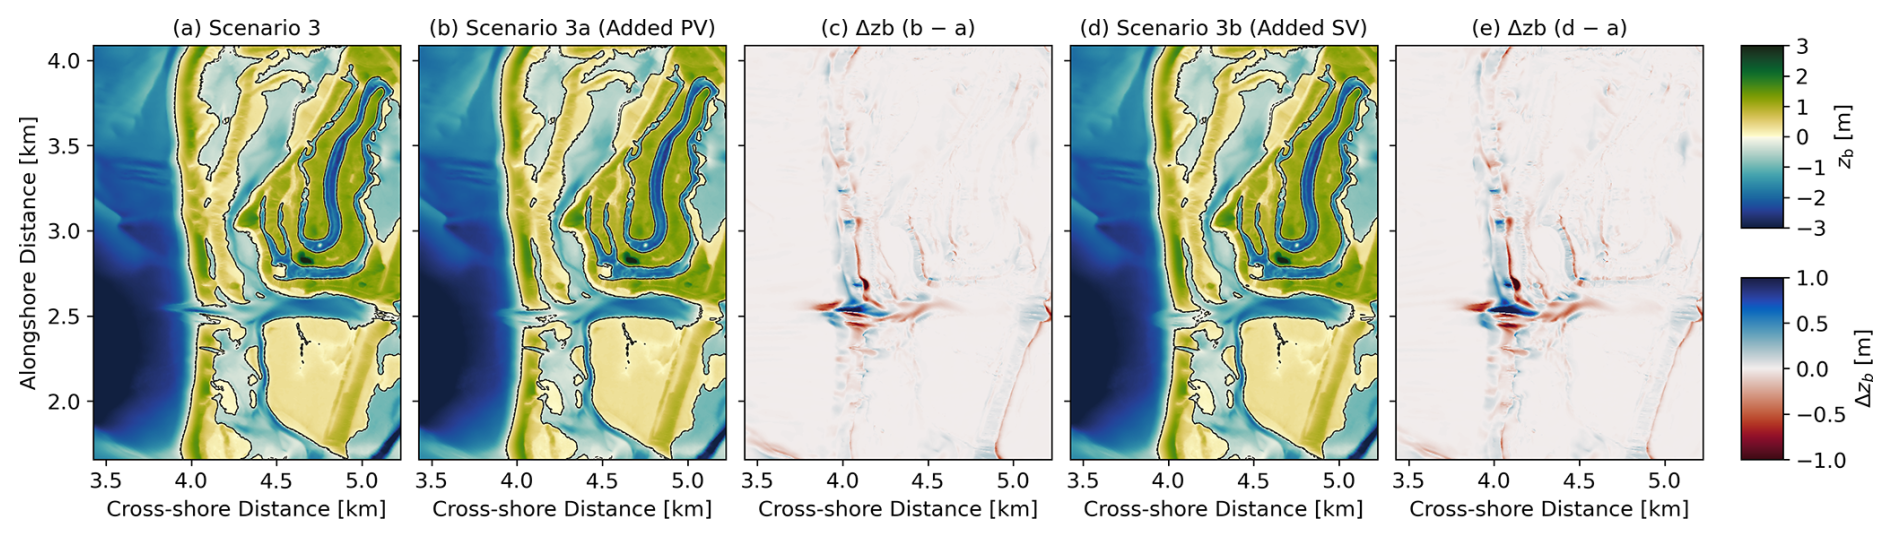
Figure 8Comparison of Scenario 3 with and without added vegetation at Lovers Key (see Fig. 9): (a) Scenario 3, base case based on the NOAA LULC dataset; (b) Scenario 3a with added primary vegetation; (c) relative change between Scenario 3a and Scenario 3; (d) Scenario 3b with added secondary vegetation; and (e) relative change between Scenario 3b and Scenario 3. Blue indicates sedimentation and red indicates erosion relative to the base case.
4.2 Storm-Induced Dune Morphodynamics at Fort Myers Beach
Fort Myers Beach's built environment strongly modulates sediment dynamics during Hurricane Ian, producing a continuous erosion band along the beach and landward overwash deposits (Fig. 9a). Observed bed elevations following the storm were compared with XBeach model outputs under the three scenarios, as shown in Fig. 9b, c and d. Scenario 1 predicts almost complete sediment loss, as it lacks the spatial variability provided by vegetation and hard structures that resist flow, resulting in widespread erosion (BSS = −0.58). This scenario highlights that without incorporating spatial roughness, the model cannot reproduce depositional features or localized variability, instead predicting uniform erosion across the barrier island. Scenario 2 applies a dense built environment bed roughness across the barrier island, which also maps some vegetated areas as urbanized, including both the northern end near Bowditch Park and the southern tip of the island (Fig. 3a). This results in impeded incoming flow and affecting the sediment transport, with BSS = 0.42. Although this improves predictive skill compared to Scenario 1, the oversimplified classification reduces accuracy by artificially blocking areas that should allow storm-driven flows. Scenario 3 combines detailed vegetation mapping with a hard-structure layer at higher resolution compared to Scenario 2, better matching observed deposition and erosion patterns with a BSS = 0.45. Buildings and infrastructure influenced overwash patterns by limiting landward sediment deposit behind buildings and roads while promoting sand accumulation on their seaward sides; urbanized areas also exhibited localized overwash deposits and scouring, reflecting the role of built structures in modifying flow pathways and sediment redistribution (Hapke et al., 2015; Houser et al., 2008). This contrasts with Lovers Key, where sand was transported more landward and the dune crest migrated landward, and vegetation led to less erosion, as shown by Scenario 3 based on NOAA data compared to Scenario 1, which was based only on a sandy bed approach. The summary of Brier Skill Scores and bias for Scenarios 1, 2, and 3 for Lovers Key and Fort Myers Beach is presented in Table 1.
Table 1Brier Skill Scores (BSS) and bias values for Lovers Key and Fort Myers Beach for Scenarios 1, 2, and 3.
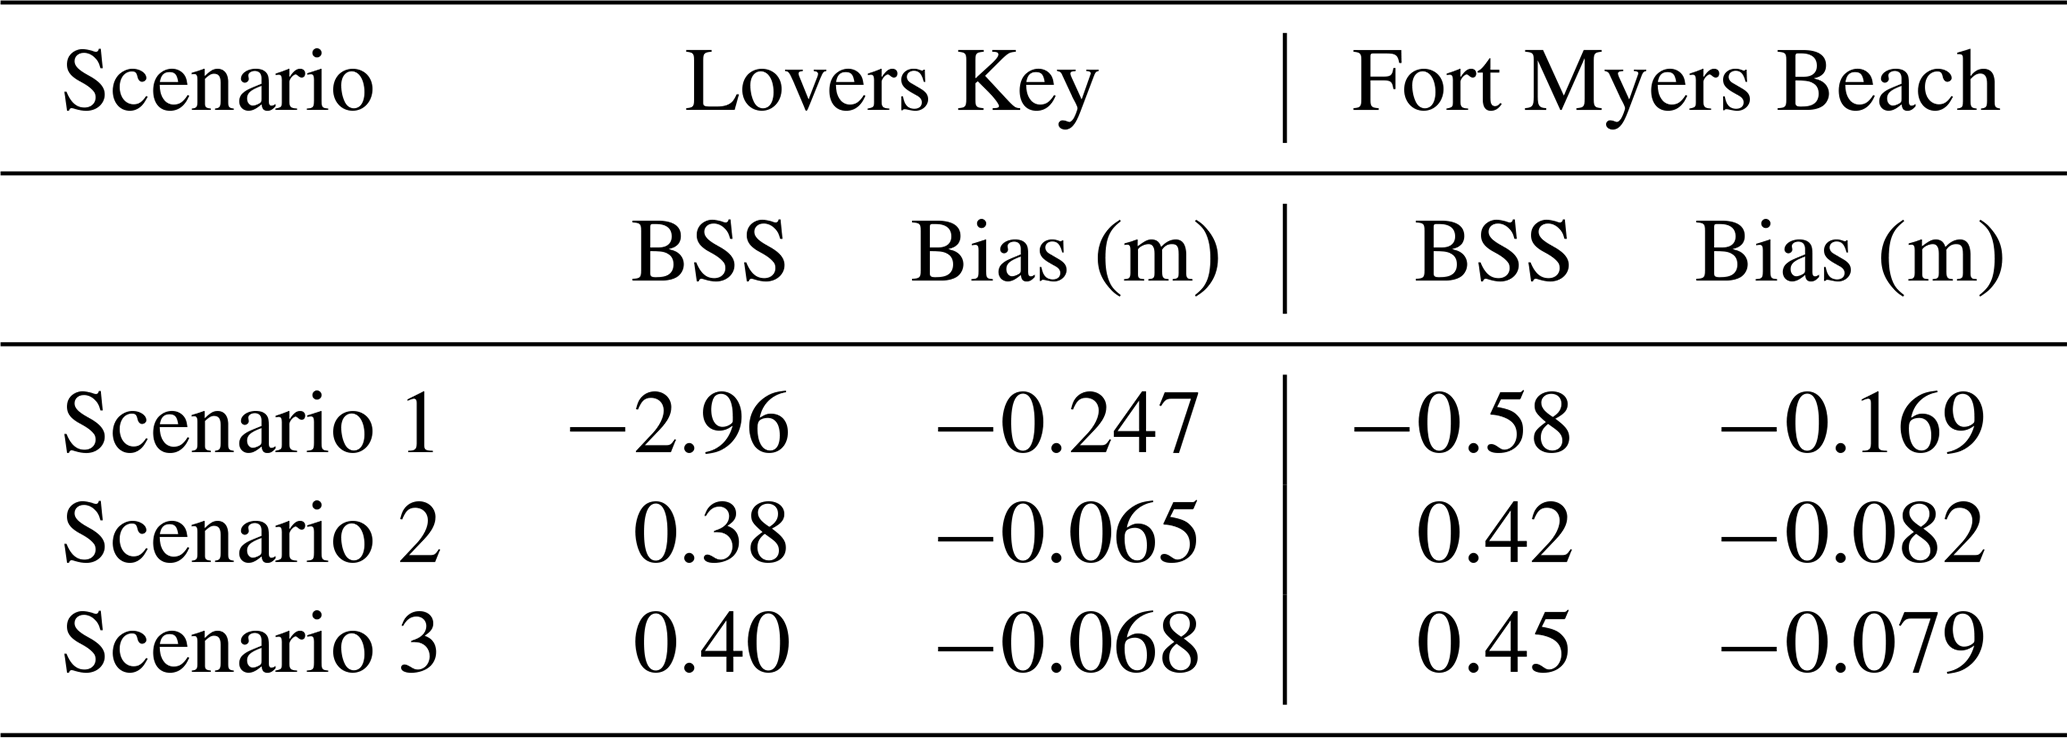
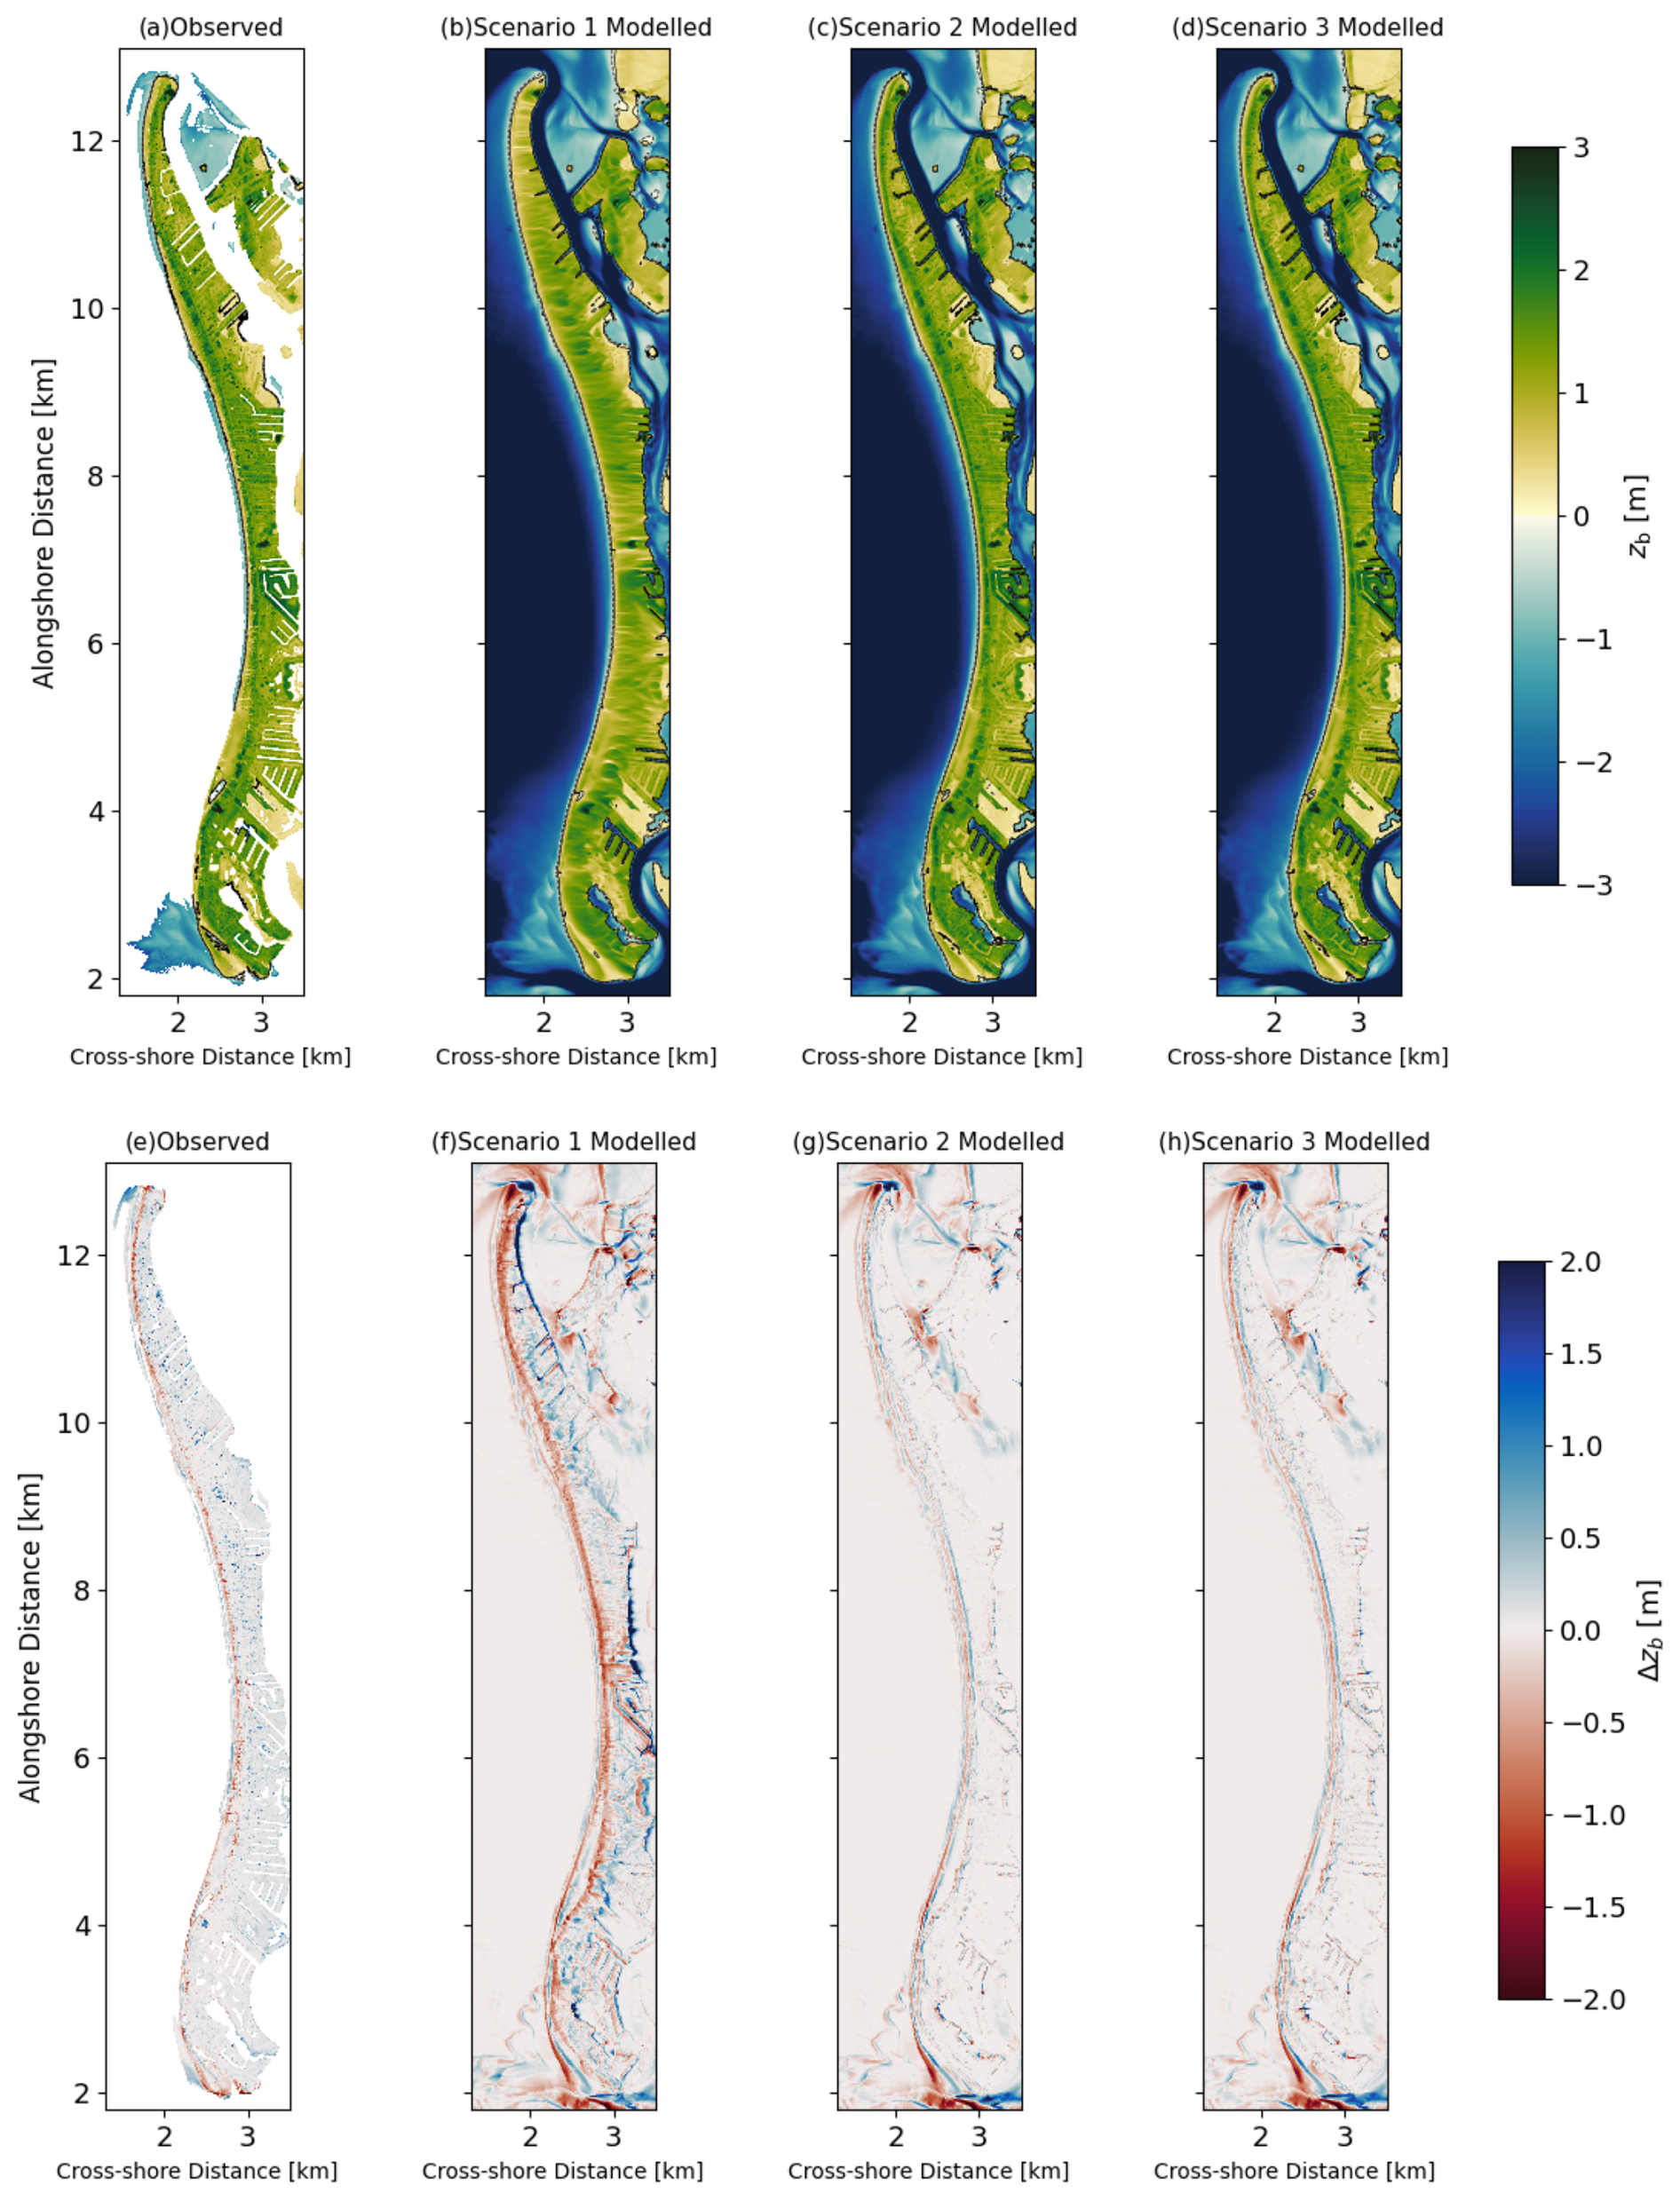
Figure 9Observed and computed post-Ian bed level and sedimentation and erosion patterns for Fort Myers Beach. (a) NOAA observations; (b) XBeach modelled Scenario 1 with uniform sandy roughness; (c) Scenario 2 based on the NOPP LULC dataset; and (d) Scenario 3 based on the NOAA LULC dataset. The bottom row shows sedimentation and erosion plots for (e) observed, (f) Scenario 1, (g) Scenario 2, and (h) Scenario 3.
Model Versus Observed Cross-shore Profiles
Similarly to Lovers Key, in addition to comparing with remotely sensed spatial patterns, we have also evaluated the model against in-situ observations from the CEC surveyed transects (Transects 13, 20, 31, and 40) shown in Fig. 1. In Transect 13 (Fig. 10a), the post-storm profile shows offshore sand accumulation between x = 400–600 m, which is not captured in any of the modelled scenarios. The absence of this offshore accumulation in the modelled results is likely related to localized alongshore gradients in sediment redistribution that may not be fully captured by the spacing of the cross-shore transects. Additionally, the parameterization of XBeach during storm events can favour onshore-directed sediment transport when wave skewness- and asymmetry-driven processes dominate, which may limit the representation of offshore deposition. These factors could contribute to the differences between the observed and simulated nearshore sediment accumulation. Scenario 1 fails to reproduce this trend, while Scenario 2 shows a small accumulation at x = 380 m. For Transect 20 (Fig. 10b), at the southward end, Scenario 2 and Scenario 3 results align with the post-Ian observed data, albeit with more sand transported landward between x = 200–350 m; both scenarios better predict the morphological change overland. In Transect 31 (Fig. 10c), the post-storm profile also shows offshore sand accumulation between x = 400–600 m, which is not reproduced in any modelled scenario. At approximately x = 250 m, deposition is observed where the transect intersects buildings, leading to localized sediment accumulation. In Transect 40 (Fig. 10d), Scenario 3 follows the post-storm observed profile more closely, particularly between x = 100–300 m. Overall, across all transects, Scenario 1 fails to reproduce observed patterns, highlighting the importance of incorporating bed roughness based on varying built environment and vegetation into the model to accurately simulate storm-driven morphodynamic response. The dune crest changes were not evaluated at Fort Myers Beach due to the absence of well-defined, continuous primary dunes and the strong influence of urban development, which makes consistent crest identification difficult.
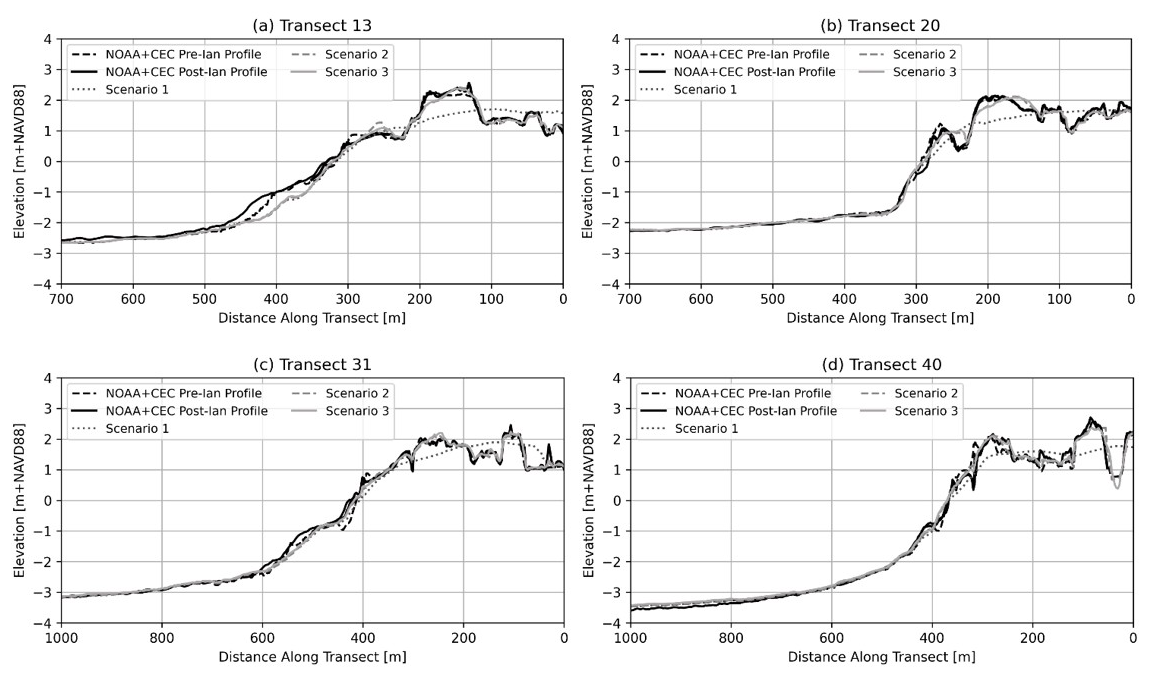
Figure 10Comparison of XBeach modelled Scenarios 1 (dotted line), 2 (dashed line), and 3 (solid line) (described in Fig. 4) with observed data at Transects 13, 20, 31, and 40 (shown in Fig. 1) at Fort Myers Beach.
In this section, we discuss the sensitivity of XBeach to key input parameters and forcing conditions influencing morphodynamic response, including Manning's n roughness coefficients, the wave skewness and asymmetry, the morphological acceleration factor, water levels, and offshore wave heights.
Sensitivity Analysis of Morphological Response to Model Parameters
A sensitivity analysis was conducted to evaluate how XBeach input parameters and forcing conditions influence morphodynamic predictions, with detailed results summarized in Appendix A. Overall, changes in Manning's n and facua values altered erosion and sedimentation patterns. Reducing Manning's n led to amplified dune erosion and enhanced deposition farther inland, while increasing Manning's n increased bottom friction, resulting in lower dune erosion and less sediment accumulation landward. Reducing facua resulted in reduced erosion and less pronounced back-barrier deposition, whereas increasing facua amplified wave skewness and asymmetry, leading to more erosion seaward of the dune toe and a broader inland deposition zone. For the morphological acceleration factor, morfac = 3 produced results very similar to morfac = 5, whereas morfac = 10 generated unrealistic morphodynamic responses despite reducing computational time. Boundary-condition tests were included to account for uncertainty in observed or forecast storm-surge and wave data, with results showing that water-level variation had a stronger impact than wave height.
The modelling approach applied in this study for South-West Florida is transferable to barrier-island locations worldwide. This study has shown that the critical input and forcing data required to obtain meaningful results are high-resolution topo-bathymetric data, land-use land-cover (LULC) data, and water levels. The availability of these input data may vary. Other U.S. locations can use the same NOAA sources of input and forcing data sets used here. For other locations, the availability and quality of the input and forcing data may vary, although it is improving. Data for European locations are available through Copernicus databases such as the Copernicus DEM (GLO-30, GLO-90 and EU-DEM) (European Space Agency (ESA), 2025) and products such as DeltaDTM (Pronk et al., 2024) which provide high-resolution topographic and bathymetric data. In addition, global bare-earth elevation data can be obtained from FABDEM, global bare-earth DEM derived from Copernicus GLO-30 (Meadows et al., 2024). These datasets generally provide sufficient spatial resolution for storm-impact assessment and scenario-based modeling, which are commonly used by coastal managers. However, their update frequency varies by region and dataset, and they may not be collected frequently enough to support continuous monitoring or rapid-response management applications in all locations. LULC data can be drawn from global products such as ESA WorldCover (Zanaga et al., 2022) and building footprints and infrastructure can be obtained from OpenStreetMap data. With these inputs and modelling approach presented here, coastal managers can assess storm-driven erosion and flooding hazards on urbanized and natural barrier islands under current conditions. The framework may also be used to explore the relative influence of land-cover characteristics, such as the presence or absence of vegetated dune areas, on modelled morphologic response. The sensitivity study may also provide guidance on the interpretation of results in cases where the input and forcing data are of lower than desired quality.
The results of this study add to the evidence base showing that it is now possible to predict morphological changes across all Sallenger (2000) regimes with a single numerical model. In this paper we show that the model can reasonably approximate the behavior in the Inundation Regime, while Van der Lugt et al. (2019) showed skill in simulating collision- and overwash-dominated responses, including cases of barrier-island breaching such as those documented for Fire Island (New York, USA) and Matanzas Inlet (Florida, USA), but also highlighted that variations in boundary water levels and wave characteristics influenced breach formation and dune response. They also demonstrated that using spatially variable roughness derived from land-cover data improved model skill. Hegermiller et al. (2022) likewise found that representing vegetation roughness improved the timing and extent of breach development. Moreover, Sherwood et al. (2022) provide a thorough overview of the state of morphological modelling up to recent years. Together with our results, these studies indicate that incorporating detailed land-cover-based roughness can significantly improve predictions of morphological response. These findings highlight that parameter settings, roughness, and boundary-forcing conditions can significantly influence the predicted morphological response, underscoring the importance of careful calibration and sensitivity testing when applying XBeach to storm-impact assessments.
The modelled morphologic response presented here indicate that dune crest lowering and landward crest migration are dominant responses at Lovers Key, with spatial variability influenced by vegetation cover, consistent with post-storm LiDAR-based interpretations of widespread beach–dune erosion under an inundation-dominated regime during Ian (Wang et al., 2024). At Fort Myers Beach, the modelled response exhibits pronounced alongshore variability that corresponds to the built environment, in agreement with observations from developed Estero Island showing spatially heterogeneous erosion and overwash, with landward sediment transport pathways enhanced along roads and between anthropogenic structures (McCormick et al., 2025). While these observational studies quantify measured post-storm change, the present framework reproduces the primary spatial patterns of dune response, supporting an inundation-dominated interpretation of storm impacts. XBeach simulations of Hurricane Sandy at Bay Head, New Jersey, further demonstrate that hard structures (a buried seawall) can materially alter modelled dune erosion and island response relative to an unarmored case (Smallegan et al., 2016), providing a relevant analogue for interpreting how development can modulate storm-driven morphodynamics. In contrast, the study by Ma et al. (2024) is useful primarily for methodological context (e.g., motivation for using non-hydrostatic XBeach for storm conditions such as Hurricane Michael) rather than as a direct analogue to our land-cover/structure-focused analysis, as its emphasis is on hydrodynamic representation and broader model capability rather than isolating the role of urban roughness elements or engineered features in controlling alongshore variability; therefore, it has not been included in our detailed discussion. Similarly, Hauptman et al. (2024) provides valuable post-storm, remote-sensing–based documentation of elevation-change patterns and damage hotspots on Estero Island, but it is not included as a primary model–data comparison framework here because its analysis focuses on event-scale damage assessment rather than process-based morphodynamic metrics.
The effect of vegetation and built environment on the morphodynamic response of the natural Lovers Key barrier island and adjacent urbanized Fort Myers Beach to Hurricane Ian was investigated using observed data (remotely-sensed and in-situ) and the numerical model XBeach with data analysis revealing sedimentation and erosion patterns across both study sites, as well as breach formation and dune crest changes at Lovers Key. Three model scenarios were developed: Scenario 1 represents a baseline sandy-bed case that does not account for vegetation or the built environment, while Scenarios 2 and 3 incorporate vegetation and built environments using NOPP and NOAA land use landcover (LULC) datasets, respectively. The modelled results from Scenarios 2 and 3 reproduced the NOAA and FGCU post-Ian observations, capturing erosion and deposition patterns with Brier Skill Scores of 0.38 and 0.40 for Lovers Key, and 0.42 and 0.45 for Fort Myers Beach, which are classified as “reasonable”. At Fort Myers Beach, the dense built environment introduced spatial heterogeneity in bed roughness, influencing sediment transport pathways. In contrast, Lovers Key's natural vegetation and dune systems enhanced hydraulic roughness, leading to less erosion. These results highlight that incorporating bed roughness based on LULC data as in Scenarios 2 and 3 vastly improves model performance compared to the uniform sandy-bed case. Sensitivity analyses indicated that variations in Manning's n value, wave skewness and asymmetry factor, the morphological acceleration factor, and boundary water levels affected predicted erosion and deposition at both sites, highlighting the model's sensitivity to parameter calibration. The supplemental vegetation analysis showed that introducing and maturing vegetation patches increased bed roughness, reduced dune erosion, and altered breach dynamics under storm conditions. Effective application to other beaches requires high-quality pre- and post-storm elevation data, vegetation and built environment, and reliable boundary forcing data (waves and surge). With these inputs, models can identify erosion hotspots, forecast overwash and breaching, and test adaptation measures.
The sensitivity of XBeach's morphodynamic predictions to bottom friction values was tested by varying Manning's n values for vegetated areas. Two runs were compared against the baseline Scenario 3 values (primary vegetation, PV, Manning's n = 0.04; secondary vegetation, SV, Manning's n = 0.05): a +10 % case (PV = 0.044, SV = 0.055) and a −10 % case (PV = 0.036, SV = 0.045). Increasing Manning's n increased friction, which resulted in less dune erosion and landward sediment transport (red band), as shown in Fig. A1e. Conversely, reducing roughness by 10 % amplified dune erosion, with red band indicating erosion and deposition farther inland (Fig. A1c). These results highlight the role of vegetation in stabilizing coastal features, as even small changes in roughness can alter sediment redistribution during storms.
The wave skewness and asymmetry parameters facAs, facSk, and facua control time-averaged flows driven by wave asymmetry, skewness, and their combined effects, respectively (facAs = 0.20, facSk = 0.15, facua = 0.175; Roelvink et al., 2009). Three simulations using Scenario 3's roughness map were performed: the base case (facua = 0.175), a lower value (facua = 0.150), and a higher value (facua = 0.30). Reducing facua produced light blue band along the dunes (Fig. A2c), indicating relatively lower crest change and less pronounced landward transport compared to the base case. In contrast, facua = 0.30 generated red bands seaward of the dune toe and broader inland blue zones (Fig. A2e), reflecting a relative increase in crest change and landward redistribution of sediment. These results demonstrate that facua is a key parameter in barrier island response, with modest reductions dampening morphologic change and higher values intensifying it (Van der Lugt et al., 2019).
The morphological acceleration factor (morfac) of 5 was selected for the final simulations, as tests showed that morfac = 3 produced very similar spatial patterns but at a higher computational cost, whereas morfac = 10 yielded unrealistic morphodynamic changes. Specifically, with morfac = 10 (Fig. A3e), bed-level change was exaggerated, producing greater erosion, multiple breaches, and wider sediment transport across the island. In contrast, morfac = 3 resulted in smoother, spatially constrained changes that more closely reflected observed patterns (Fig. A3c). These results demonstrate that excessively high morfac values can distort morphodynamic responses, while morfac = 5 provides a balance between physical realism and computational efficiency.
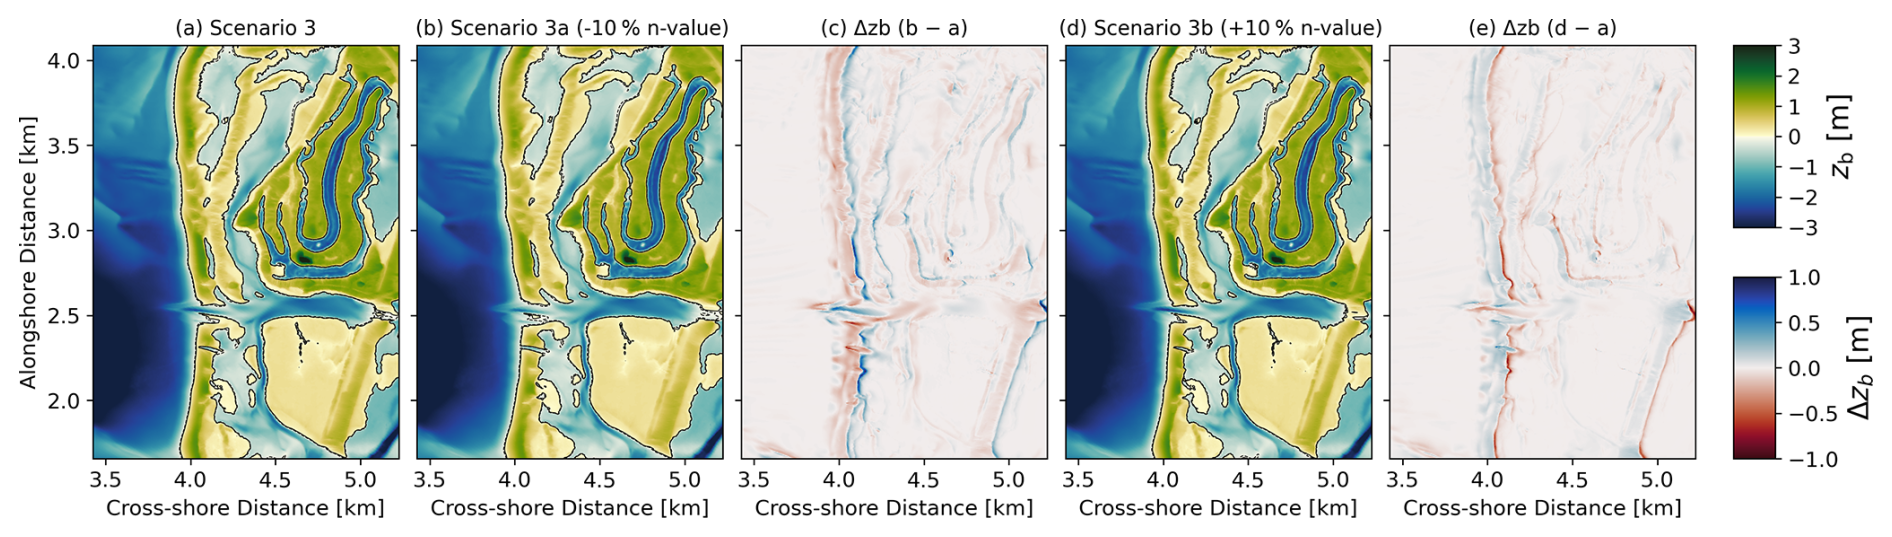
Figure A1Sensitivity analysis of Manning's roughness coefficient (n values) at Lovers Key: (a) Scenario 3, base case based on the NOAA LULC dataset; (b) Scenario 3a with a 10 % decrease in n value; (c) relative change between Scenario 3a and Scenario 3; (d) Scenario 3b with a 10 % increase in n value; and (e) relative change between Scenario 3b and Scenario 3. Blue indicates sedimentation and red indicates erosion relative to the base case.
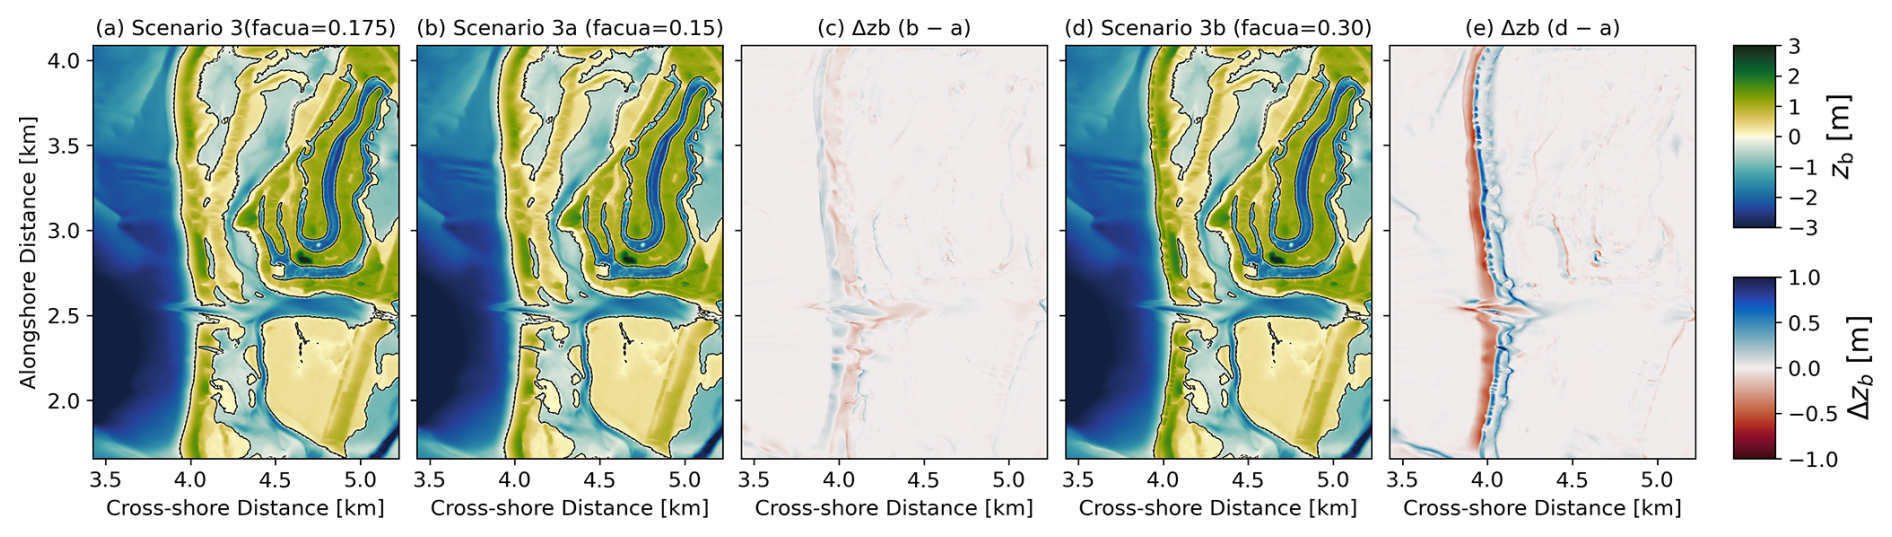
Figure A2Sensitivity analysis of wave skewness and asymmetry parameter (facua) at Lovers Key: (a) Scenario 3, base case with facua = 0.175; (b) Scenario 3a with a decrease in facua = 0.15; (c) relative change between Scenario 3a and Scenario 3; (d) Scenario 3b with an increase in facua = 0.30; and (e) relative change between Scenario 3b and Scenario 3. Blue indicates sedimentation and red indicates erosion relative to the base case.
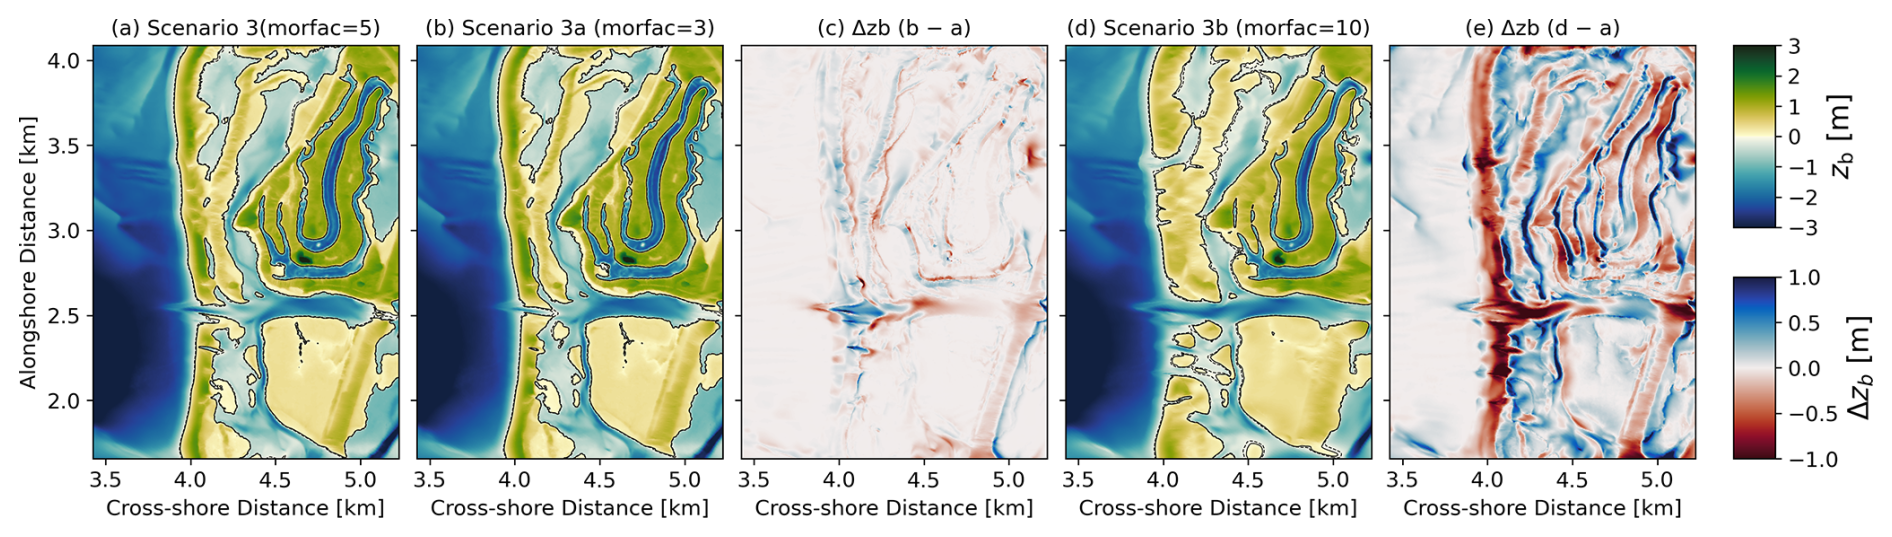
Figure A3Sensitivity analysis of the morphological acceleration factor (morfac) at Lovers Key: (a) Scenario 3, base case with morfac = 5; (b) Scenario 3a with a decrease in morfac = 3; (c) relative change between Scenario 3a and Scenario 3; (d) Scenario 3b with an increased in morfac = 10; and (e) relative change between Scenario 3b and Scenario 3. Blue indicates sedimentation and red indicates erosion relative to the base case.
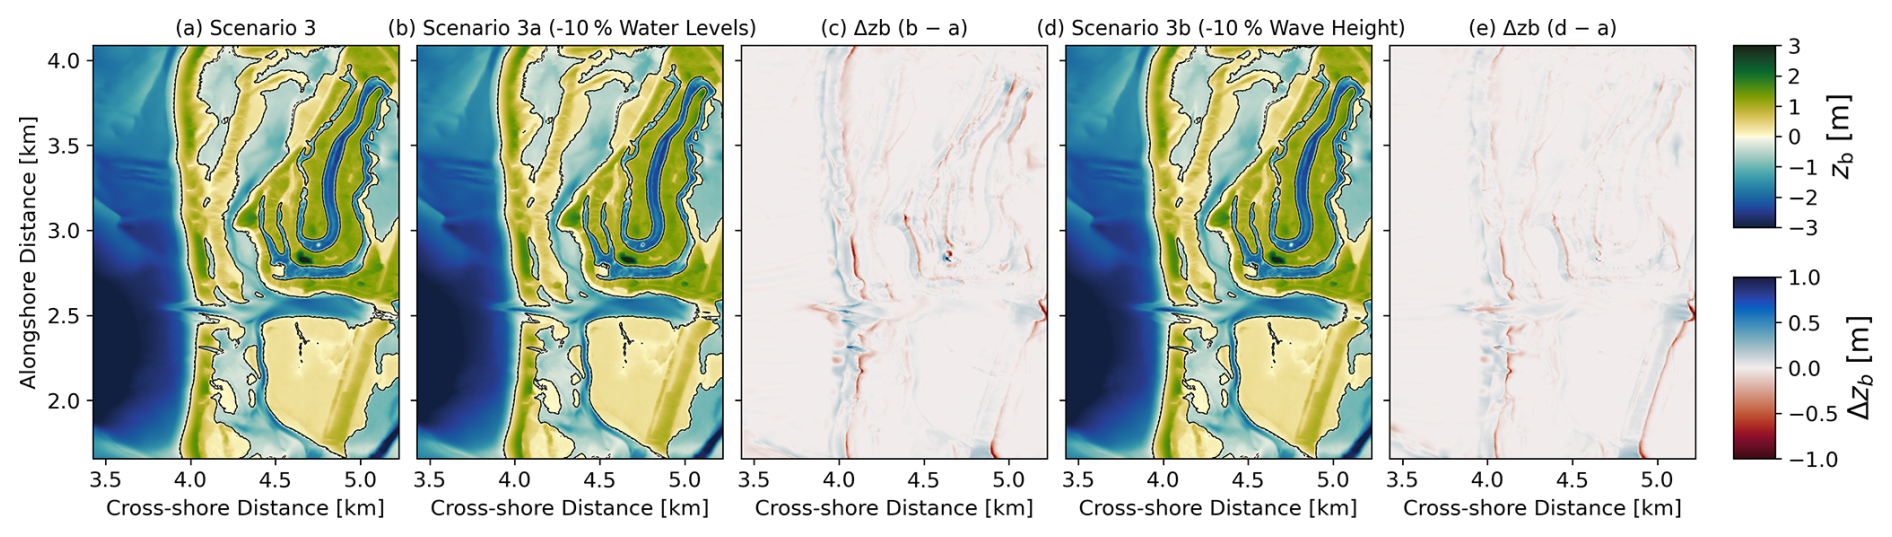
Figure A4Sensitivity analysis of forcing conditions at Lovers Key: (a) Scenario 3, base case; (b) Scenario 3a with a 10 % reduction in water levels; (c) relative change between Scenario 3a and Scenario 3; (d) Scenario 3b with a 10 % reduction in wave height; and (e) relative change between Scenario 3b and Scenario 3. Blue indicates sedimentation and red indicates erosion relative to the base case.
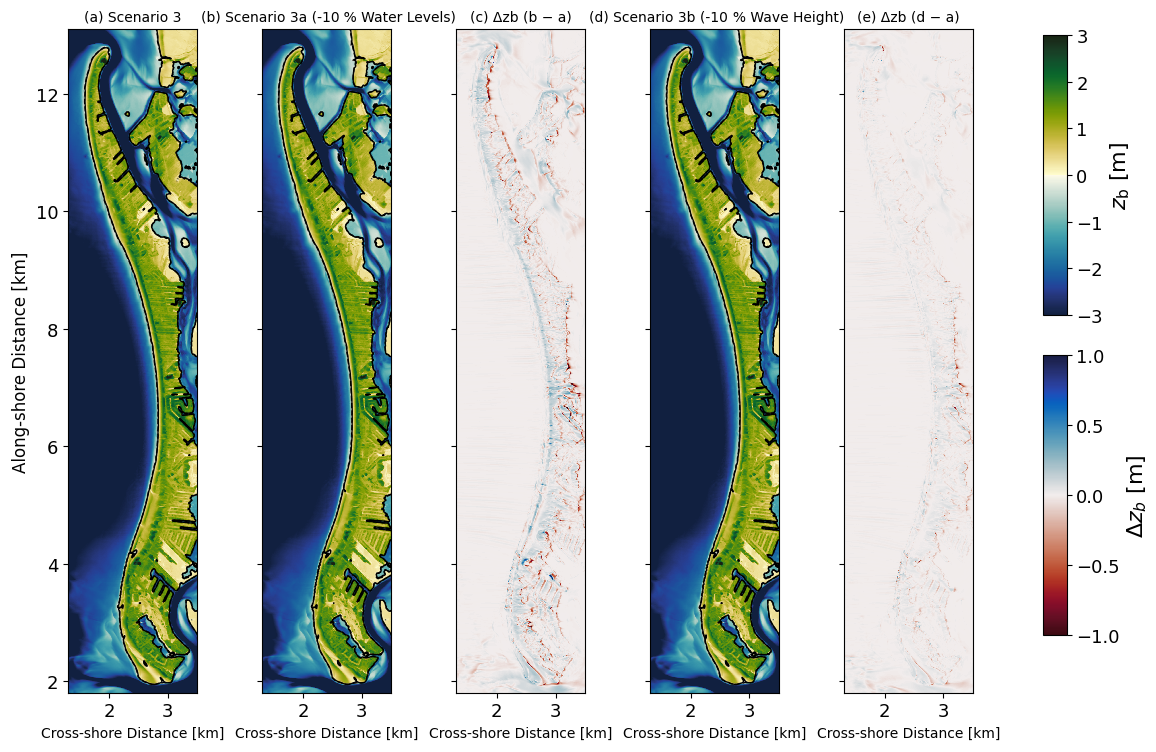
Figure A5Sensitivity analysis of forcing conditions at Fort Myers Beach: (a) Scenario 3, base case; (b) Scenario 3a with a 10 % reduction in water levels; (c) relative change between Scenario 3a and Scenario 3; (d) Scenario 3b with a 10 % reduction in wave height; and (e) relative change between Scenario 3b and Scenario 3. Blue indicates sedimentation and red indicates erosion relative to the base case.
Finally, the sensitivity of the model to boundary conditions, including water levels and wave height, was assessed by reducing both by 10 % (Figs. A4 and A5). This range was chosen to represent potential uncertainty in forecasted or observed forcing data. Lower water levels produced relatively smaller crest change along the primary dune front and beach (blue band) and decreased landward deposition (red band), while a 10 % reduction in wave height had a less pronounced effect. These results highlight that the model is more sensitive to storm surge levels than to offshore wave heights, underscoring the importance of accurate surge estimates in post-storm morphodynamic predictions.
Topographic and bathymetric data were obtained from the NOAA Data Access Viewer https://coast.noaa.gov/dataviewer (last access: 8 January 2025). Pre-Hurricane Ian topo-bathymetric data is labelled as 2022 USACE NCMP Topo-bathy Lidar DEM: Gulf Coast (FL), and post-Hurricane Ian data as 2022 USACE FEMA Post-Ian Topobathy Lidar DEM: Florida. Land cover datasets include the 2022 NOAA C-CAP Version 2 Canopy Cover: Florida and the 2022 NOAA C-CAP Version 2 Impervious Cover: Florida. The XBeach model (version 1.24.6057-Halloween) was used, accessible at https://oss.deltares.nl/web/xbeach/ (last access: 1 March 2025).
MHI: Data analysis, numerical modelling, and writing the original draft. AvD: Conceptual development, writing, and editing. DR: Quality control and editing. EQ: Writing and editing. CD: Data provision, writing, and editing.
The contact author has declared that none of the authors has any competing interests.
Publisher's note: Copernicus Publications remains neutral with regard to jurisdictional claims made in the text, published maps, institutional affiliations, or any other geographical representation in this paper. The authors bear the ultimate responsibility for providing appropriate place names. Views expressed in the text are those of the authors and do not necessarily reflect the views of the publisher.
We sincerely thank Mr. Michael T. Poff of Coastal Engineering Consultants and the Surveying Team at Florida Gulf Coast University for generously sharing the topo-bathymetric data used in this research. We also acknowledge Deltares for providing CUDEM 2018 and the Land Use Land Cover data from the National Oceanographic Partnership Program.
This paper was edited by Timothy Tiggeloven and reviewed by Freya Muir and one anonymous referee.
Almeida, L. P., Vousdoukas, M. V., Ferreira, Ó., Rodrigues, B. A., and Matias, A.: Thresholds for storm impacts on an exposed sandy coastal area in southern Portugal, Geomorphology, 143–144, 3–12, https://doi.org/10.1016/j.geomorph.2011.04.047, 2012.
Bhatt, D., Savarese, M., Hewitt, N. S., Gross, A. M., and Wilder, J.: REVEALING THE GEOMORPHOLOGIC IMPACTS OF HURRICANE IAN IN SOUTHWEST FLORIDA USING GEOSPATIAL TECHNOLOGY, Int. Arch. Photogramm. Remote Sens. Spatial Inf. Sci., XLVIII-M-3-2023, 43–48, https://doi.org/10.5194/isprs-archives-XLVIII-M-3-2023-43-2023, 2023.
Bucci, L., Alaka, L., Hagen, A., Delgado, S., and Beven, J.: National Hurricane Center tropical cyclone report: Hurricane Ian (AL092022), NOAA National Hurricane Center, 72 pp., https://www.nhc.noaa.gov/data/tcr/AL092022_Ian.pdf(last access: 1 March 2025), 2023.
De Vet, P. L. M., McCall, R. T., Den Bieman, J. P., Stive, M. J. F., and Van Ormondt, M.: Modelling dune erosion, overwash and breaching at Fire Island (NY) during Hurricane Sandy, in: Proc. Coastal Sediments 2015, San Diego, USA, July 2015, https://doi.org/10.1142/9789814689977_0006, 2015.
Doyle, J., Hodur, R., Chen, S., Jin, Y., Msokaitis, J., Wang, S., Hendricks, E., Jin, J., and Smith, T.: Tropical cyclone prediction using COAMPS-TC, Oceanography, 27, 104–115, https://doi.org/10.5670/oceanog.2014.72, 2014.
European Space Agency (ESA): Copernicus DEM (GLO-30 and GLO-90), ESA, https://doi.org/10.5270/ESA-c5d3d65, 2025.
FDEP: Lovers Key State Park approved management plan, Florida Department of Environmental Protection, https://floridadep.gov/sites/default/files/2005 Lovers Key State Park Approved Plan.pdf (last access: 5 January 2025), 2005.
Feagin, R. A., Figlus, J., Zinnert, J. C., Sigren, J., Martínez, M. L., Silva, R., Smith, W. K., Cox, D., Young, D. R., and Carter, G.: Going with the flow or against the grain? The promise of vegetation for protecting beaches, dunes, and barrier islands from erosion, Front. Ecol. Environ., 13, 203–210, https://doi.org/10.1890/140218, 2015.
Figlus, J., Sigren, J. M., Armitage, A. R., and Tyler, R. C.: Erosion of vegetated coastal dunes, Coast. Eng. Proc., 1, 20, https://doi.org/10.9753/icce.v34.sediment.20, 2014.
FitzGerald, D. M., Fenster, M. S., Argow, B. A., and Buynevich, I. V.: Coastal impacts due to sea-level rise, Annu. Rev. Earth Pl. Sc., 36, 601–647, https://doi.org/10.1146/annurev.earth.35.031306.140139, 2008.
Hapke, C. J., Brenner, O. T., and Henderson, R. E.: Quantifying the geomorphic resiliency of barrier island beaches, in: Proc. Coastal Sediments 2015, San Diego, USA, July 2015, https://doi.org/10.1142/9789814689977_0249, 2015.
Harris, L., Nel, R., Smale, M., and Schoeman, D.: Swashed away? Storm impacts on sandy beach macrofaunal communities, Estuar. Coast. Shelf S., 94, 210–221, https://doi.org/10.1016/j.ecss.2011.06.013, 2011.
Hauptman, L., Mitsova, D., and Briggs, T. R.: Hurricane Ian damage assessment using aerial imagery and LiDAR: a case study of Estero Island, Florida, J. Mar. Sci. Eng., 12, 668, https://doi.org/10.3390/jmse12040668, 2024.
Hegermiller, C. A., Warner, J. C., Olabarrieta, M., Sherwood, C. R., and Kalra, T. S.: Modeling of barrier breaching during Hurricanes Sandy and Matthew, J. Geophys. Res.-Earth, 127, e2021JF006307, https://doi.org/10.1029/2021JF006307, 2022.
Houser, C., Hapke, C., and Hamilton, S.: Controls on coastal dune morphology, shoreline erosion and barrier island response to extreme storms, Geomorphology, 100, 223–240, https://doi.org/10.1016/j.geomorph.2007.12.007, 2008.
IPCC: Global Warming of 1.5 °C – SR15, Intergovernmental Panel on Climate Change, https://www.ipcc.ch/sr15/ (last access: 13 January 2025), 2018.
Jiménez, J. A., Gracia, V., Valdemoro, H. I., Mendoza, E. T., and Sánchez-Arcilla, A.: Managing erosion-induced problems in NW Mediterranean urban beaches, Ocean Coast. Manage., 54, 907–918, https://doi.org/10.1016/j.ocecoaman.2011.05.003, 2011.
Lavaud, L., Bertin, X., Martins, K., Arnaud, G., and Bouin, M.-N.: The contribution of short-wave breaking to storm surges: the case Klaus in the southern Bay of Biscay, Ocean Model., 156, 101710, https://doi.org/10.1016/j.ocemod.2020.101710, 2020.
Lazarus, E. D., Goldstein, E. B., Taylor, L. A., and Williams, H. E.: Comparing patterns of hurricane washover into built and unbuilt environments, Earth's Future, 9, e2020EF001818, https://doi.org/10.1029/2020EF001818, 2021.
Lindemer, C. A., Plant, N. G., Puleo, J. A., Thompson, D. M., and Wamsley, T. V.: Numerical simulation of a low-lying barrier island's morphological response to Hurricane Katrina, Coast. Eng., 57, 985–995, https://doi.org/10.1016/j.coastaleng.2010.06.004, 2010.
Ma, M., Huang, W., Vijayan, L., and Jung, S.: Modeling wave–surge effects on barrier-island breaching in St. Joseph Peninsula during Hurricane Michael, Nat. Hazards, 120, 14199–14226, https://doi.org/10.1007/s11069-024-06768-x, 2024.
Mattocks, C. and Forbes, C.: A real-time, event-triggered storm surge forecasting system for the state of North Carolina, Ocean Model., 25, 95–119, https://doi.org/10.1016/j.ocemod.2008.06.008, 2008.
McCall, R. T., Van Thiel de Vries, J. S. M., Plant, N. G., Van Dongeren, A. R., Roelvink, J. A., Thompson, D. M., and Reniers, A. J. H. M.: Two-dimensional time-dependent hurricane overwash and erosion modeling at Santa Rosa Island, Coast. Eng., 57, 668–683, https://doi.org/10.1016/j.coastaleng.2010.02.006, 2010.
McCormick, W. M., Briggs, T. R., Hauptman, L., and Wang, P.: Morphologic and sedimentological signatures resulting from Hurricane Ian, southwest Florida, USA: Insight into intra-storm bidirectional sediment transport processes, Geomorphology, 471, 109563, https://doi.org/10.1016/j.geomorph.2024.109563, 2025.
McGuirk, M. T., Kennedy, D. M., and Konlechner, T.: The role of vegetation in incipient dune and foredune development and morphology: a review, J. Coastal Res., 38, https://doi.org/10.2112/JCOASTRES-D-21-00021.1, 2022.
Meadows, M., Jones, S., and Reinke, K.: Vertical accuracy assessment of freely available global DEMs (FABDEM, Copernicus DEM, NASADEM, AW3D30 and SRTM) in flood-prone environments, Int. J. Digit. Earth, 17, 2308734, https://doi.org/10.1080/17538947.2024.2308734, 2024.
NOAA: Continuously updated digital elevation model (CUDEM) – Ninth arc-second resolution bathymetric-topographic tiles, NOAA National Centers for Environmental Information (NCEI) [data set], https://chs.coast.noaa.gov/htdata/raster2/elevation/NCEI_ninth_Topobathy_2014_8483/FL/ (last access: 10 January 2025), 2018.
NOPP (National Oceanographic Partnership Program): NHCI Task 1 (Gesch), NOAA NCEI [data set], https://nopphurricane.sofarocean.com/updates/task-1-p-i-gesch(last access: 10 January 2025), 2021.
Nordstrom, K. F.: Reestablishing naturally functioning dunes on developed coasts, Environ. Manag., 25, 37–51, https://doi.org/10.1007/s002679910004, 2000.
OCM Partners: 2022 USACE FEMA Post Ian Topobathy LiDAR DEM: Florida from 2022-01-01 to 2022-12-31, NOAA NCEI [data set], https://www.fisheries.noaa.gov/inport/item/71740 (last access: 10 January 2025), 2025a.
OCM Partners: 2022 USACE NCMP Topobathy LiDAR DEM: Gulf Coast (FL) from 2022-01-01 to 2022-12-31, NOAA NCEI [data set], https://www.fisheries.noaa.gov/inport/item/71772 (last access: 10 January 2025), 2025b.
Office for Coastal Management: 2020–2023 CCAP Version 2 Canopy Cover, NOAA NCEI [data set], https://www.fisheries.noaa.gov/inport/item/70562 (last access: 10 January 2025), 2025a.
Office for Coastal Management: 2020–2023 CCAP Version 2 Impervious Cover, NOAA NCEI [data set], https://www.fisheries.noaa.gov/inport/item/70563 (last access: 10 January 2025), 2025b.
Pardo-Pascual, J. E., Almonacid-Caballer, J., Ruiz, L. A., Palomar-Vázquez, J., and Rodrigo-Alemany, R.: Evaluation of storm impact on sandy beaches of the Gulf of Valencia using Landsat imagery series, Geomorphology, 214, 388–401, https://doi.org/10.1016/j.geomorph.2014.02.020, 2014.
Passeri, D. L., Long, J. W., Plant, N. G., Bilskie, M. V., and Hagen, S. C.: The influence of bed friction variability due to land cover on storm-driven barrier island morphodynamics, Coast. Eng., 132, 82–94, https://doi.org/10.1016/j.coastaleng.2017.11.005, 2018.
Pronk, M., Hooijer, A., Eilander, D., Haag, A., de Jong, T., Vousdoukas, M., and Eleveld, M.: DeltaDTM: A global coastal digital terrain model, Sci. Data, 11, 273, https://doi.org/10.1038/s41597-024-03091-9, 2024.
Roelvink, D., Reniers, A., Van Dongeren, A., Van Thiel de Vries, J., McCall, R., and Lescinski, J.: Modelling storm impacts on beaches, dunes and barrier islands, Coast. Eng., 56, 1133–1152, https://doi.org/10.1016/j.coastaleng.2009.08.006, 2009.
Salgado, S. C.: Predicting erosion of vegetated dunes during hurricanes, Master's thesis, Delft University of Technology, https://resolver.tudelft.nl/uuid:96076fda-d0c7-450e-951d-b62d0f3675bf (last access: 10 March 2025), 2023.
Sallenger, A. H.: Storm impact scale for barrier islands, J. Coastal Res., 16, 890–895, 2000.
Sherwood, C. R., Van Dongeren, A., Doyle, J., Hegermiller, C. A., Hsu, T.-J., Kalra, T. S., Olabarrieta, M., Penko, A. M., Rafati, Y., Roelvink, D., Van der Lugt, M., Veeramony, J., and Warner, J. C.: Modeling the morphodynamics of coastal responses to extreme events: what shape are we in?, Annu. Rev. Mar. Sci., 14, 457–492, https://doi.org/10.1146/annurev-marine-032221-090215, 2022.
Smallegan, S. M., Irish, J. L., van Dongeren, A. R., and den Bieman, J. P.: Morphological response of a sandy barrier island with a buried seawall during Hurricane Sandy, Coast. Eng., 110, 102–110, https://doi.org/10.1016/j.coastaleng.2015.12.005, 2016.
Stutz, M. L. and Pilkey, O. H.: Open-ocean barrier islands: global influence of climatic, oceanographic, and depositional settings, J. Coastal Res., 272, 207–222, https://doi.org/10.2112/09-1190.1, 2011.
Tebaldi, C., Strauss, B. H., and Zervas, C. E.: Modelling sea-level rise impacts on storm surges along US coasts, Environ. Res. Lett., 7, 014032, https://doi.org/10.1088/1748-9326/7/1/014032, 2012.
Van der Lugt, M. A., Quataert, E., Van Dongeren, A., Van Ormondt, M., and Sherwood, C. R.: Morphodynamic modeling of the response of two barrier islands to Atlantic hurricane forcing, Estuar. Coast. Shelf S., 229, 106404, https://doi.org/10.1016/j.ecss.2019.106404, 2019.
Van Dongeren, A. R., De Goede, R., Van Ormondt, M., Nederhoff, C. M., Athanasiou, P., Quataert, E., Lilly, J., Langeraert, F., and Van Asselt, K.: Forecasting hurricane impacts on U.S. coasts, ArcGIS StoryMaps, Zenodo, https://doi.org/10.5281/zenodo.13710966, 2024.
van Puijenbroek, M. E. B., Nolet, C., de Groot, A. V., Suomalainen, J. M., Riksen, M. J. P. M., Berendse, F., and Limpens, J.: Exploring the contributions of vegetation and dune size to early dune development using unmanned aerial vehicle (UAV) imaging, Biogeosciences, 14, 5533–5549, https://doi.org/10.5194/bg-14-5533-2017, 2017.
Van Rijn, L. C., Walstra, D. J. R., Grasmeijer, B., Sutherland, J., Pan, S., and Sierra, J. P.: The predictability of cross-shore bed evolution of sandy beaches at the time scale of storms and seasons using process-based profile models, Coast. Eng., 47, 295–327, https://doi.org/10.1016/S0378-3839(02)00120-5, 2003.
Wang, P., Royer, E. L., Jackson, K., and Gutierrez, S.: Impacts of Hurricane Ian along the low lying southwest Florida coast (USA) in 2022: Lessons learned, J. Coastal Res., 40, 827–851, https://doi.org/10.2112/JCOASTRES-D-24-00003.1, 2024.
Zanaga, D., Van de Kerchove, R., Daems, D., De Keersmaecker, W., Brockmann, C., Kirches, G., Bontempi, I., Cartus, O., Santoro, M., and Arino, O.: ESA WorldCover 10 m 2021 v200, Version v200, Zenodo [data set], https://doi.org/10.5281/zenodo.7254221, 2022.