the Creative Commons Attribution 4.0 License.
the Creative Commons Attribution 4.0 License.
 | 31 Mar 2026
Analysis on Multi-Factor Synergistic Hazards Mechanism of Wet Micro-Downburst: a Multi-Source Data Fusion Analysis Based on Passenger Vessel Capsizing Accident in Qianxi, Guizhou on 4 May 2025
Xi Guo
Dan Yao
Xiaoling Du
Dongpo He
Jue Li
Shisheng Jin
Tienan Bai
The research on the multi-factor synergistic disaster-causing mechanism of wet microbursts, constrained by the scarcity of monitoring data, constitutes a crucial bottleneck restricting the early warning and prevention of major accidents such as water vessel capsizing. Focusing on the catastrophic “5.4” passenger ship capsizing accident that occurred at 08:32 UTC (UTC is used throughout the paper) on 4 May 2025 at Dongfeng Reservoir in Qianxi, Guizhou Province, this study integrates multi-source data encompassing weather radar observations, surface meteorological observations, lightning monitoring, on-site surveillance videos, and disaster trace investigations. It overcomes the limitations of single-source or low-resolution monitoring data in previous cases such as the “Eastern Star” incident, and conducts a systematic analysis by integrating minute-level high-resolution observations, which cover dynamic characteristics, surface thermal responses, as well as video and disaster trace verification. The study reveals that the rapid descent of the strong radar echo core within the convective system triggers an explosive near-surface divergent wind field (with an instantaneous wind speed of 34.7 m s−1), accompanied by an abrupt drop of 14.9 °C in surface temperature and a sudden surge of 5.4 hPa in atmospheric pressure. The phase transition of ice-phase particles indicated by the radar differential reflectivity (ZDR) column, enhanced the downward motion through a feedback mechanism, and a hailfall occurred subsequent to the wind direction reversal. Meanwhile, the high-density zone of lightning activity coincided with the convective path, and the high consistency among surveillance video records as well as the on-site disaster trace distributions, and wind field evolution, which verified the synergistic disaster-causing chain of dynamic – thermal – microphysical coupling in this case. This study fills the gap in multi-source data fusion analysis of the multi-factor synergistic disaster-causing mechanism of wet microbursts, and provides vital scientific support for the optimization of early warning and emergency response to similar water vessel capsizing disasters.
- Article
(10328 KB) - Full-text XML
- BibTeX
- EndNote


As an extremely destructive strong wind phenomenon in severe convective weather, downbursts exhibit intricate formation mechanism and enormous hazards impacts. Its destructive capacity reaching F3 intensity level (70–92 m s−1) and a damage level equivalent to that of a tornado (Fujita, 1981). Since Fujita first proposed the concept in 1976 to characterize the intense downdrafts of the storm and its outward explosive divergent airflow that caused the aircraft crash at John F. Kennedy International Airport in the United States in 1975, downbursts have garnered extensive attention and in-depth research within the meteorological community (Fujita, 1976).
According to Fujita's classification framework, downbursts are categorized by horizontal scale into microbursts (4 m–4 km) and macrobursts (4–40 km), and by precipitation characteristics accompanying the strong winds into dry microbursts and wet microbursts (Fujita and Byers, 1977). The suddenness and localized intense wind characteristics of downbursts pose multiple threats to aviation safety, maritime affairs, and public security. In the aviation sector, microbursts are recognized as a core risk source during aircraft takeoff and landing phases (Xu et al., 2001). In the maritime domain, ships navigating in open waters, unobstructed by terrain, are significantly more vulnerable to the impacts of strong-wind divergent flow fields. For instance, the 2015 “Eastern Star” shipwreck in Jianli (Meng et al., 2016), the Ningbo recreational fishing vessel capsizing accident (Gu et al., 2025), and the Liuzhi Zangke River passenger ship capsizing incident are all closely associated with wet microbursts. The coupling of heavy precipitation and strong winds not only impairs visibility but also alters water surface friction, exacerbating the difficulty of ship maneuvering (Wang et al., 2023). In terms of public safety, strong winds generated by downbursts are prone to triggering secondary disasters such as building damage, tree lodging, and power outages. However, existing research on downburst disaster analysis predominantly relies on macro-scale data, such as weather radar, satellite remote sensing, and synoptic background conditions, while lacking ground-based meteorological element monitoring with high spatiotemporal resolution, which hinders the accurate characterization of wet microbursts rapid evolution processes (Zheng et al., 2016). Particularly in inland water disaster research, most analyzes rely on disaster losses combined with meteorological monitoring data. It is difficult to achieve the integration of meteorological monitoring (including radar, ground-based meteorological stations, and lightning observations) with on-site surveillance imagery and real-time disaster traces for multi-source data collaborative analysis, and thus achieving full-chain correlation from meteorological processes to disaster-causing processes (Fu and Guo, 2007; Proctor, 1989; Wakimoto and Bringi, 1988).
The passenger vessel capsizing accident that occurred at Dongfeng Reservoir in Qianxi, Guizhou on 4 May 2025 (hereinafter referred to as the “5.4” event) was found to be closely associated with a wet microbursts through investigation. The incident area is situated in the Wujiang Baili Gallery Scenic Area, where a large number of video surveillance cameras and two sets of ground-based automatic weather stations have been deployed. In combination with the surrounding weather radar and lightning monitoring networks, these data sources can provide multi-source data support to comprehensively elucidate the disaster-causing mechanism of wet microbursts during the “5.4” event. To this end, this study comprehensively utilizes multi – source data including weather radar, automatic weather stations, lightning monitoring, video surveillance, and on – site disaster traces to conduct a systematic analysis of the wet microburst during the “5.4” event. It aims to reconstruct the complete formation and evolution process, elucidate the disaster – causing mechanism of dynamic-microphysical coupling, fill the gap in multi-source data fusion analysis of wet microbursts in inland waters, provide scientific support for the optimization of water traffic safety early warning, and reduce losses caused by extreme weather events.
The data utilized in this study primarily encompasses multi-dimensional information such as meteorological observations and on-site disaster situation data.
- 1.
Weather radar data. It includes multi-band weather radar composite reflectivity factor provided by the Guizhou Provincial Meteorological Data Center, as well as reflectivity factor (REF), radial velocity (VEL), and differential reflectivity (ZDR) data from the Guiyang S-band weather radar, which are used to analyze the echo characteristics and wind field structure of downburst.
- 2.
Surface meteorological observation data. Minute-level instantaneous data (temperature, humidity, pressure, precipitation, and wind speed/direction) and extreme value data from automatic meteorological stations surrounding the incident area. Since the operational sampling frequency for some elements is 5 min, higher temporal resolution records were obtained through remote sampling from device-side storage. Data covering the 3 h period before and after the event were selected. Specifically, 1 min resolution data including wind speed/direction, air temperature, pressure, and rainfall was extracted from the “Tianqing” Big Data Meteorological Cloud Platform. This dataset was designed to capture abrupt changes in surface meteorological elements induced by the downburst.
- 3.
Other supplementary data. It includes lightning monitoring data from the Guizhou Province 3D Lightning Monitoring Network, which is used to correlate the spatiotemporal characteristics of severe convective activities. Additionally, video surveillance data along the path of the weather process and on-site disaster damage investigation data were collected, providing direct evidence for analyzing the disaster-causing process and impact range of the downburst.
From 06:00 to 12:00 on 4 May, as shown in Fig. 2, scattered severe convective weather occurred along the northwest to southeast stretch of Guizhou Province, dominated by thunderstorm gales, short-term heavy precipitation, and locally accompanied by hailfall process. A total of 31 stations across the province experienced thunderstorm gales of force level 8 (17.2 m s−1) or above, mainly concentrated in the east-central part of Bijie City, western part of Zunyi City, Guiyang City, and central part of Qiannan Prefecture. In Qianxi City of Bijie, two stations had wind speeds of force level 10 (24.5 m s−1) or above. Among them, the Huawu Village Meteorological Observatory (Point C in Fig. 1) recorded an instantaneous wind gale of 34.7 m s−1 (exceeding wind force level 14) between 08:32 and 08:33. Hailfall was observed at 40 stations, with the maximum hail diameter of 60 mm in Majiang County, the southeast of the province. Short-term heavy precipitation occurred at 38 stations, with the highest precipitation intensity of 52.9 mm h−1 recorded at the Chanong Station in Duyun City. The maximum cumulative precipitation within 6 h was 53.2 mm, which was observed in Gulong Town of Longli County.
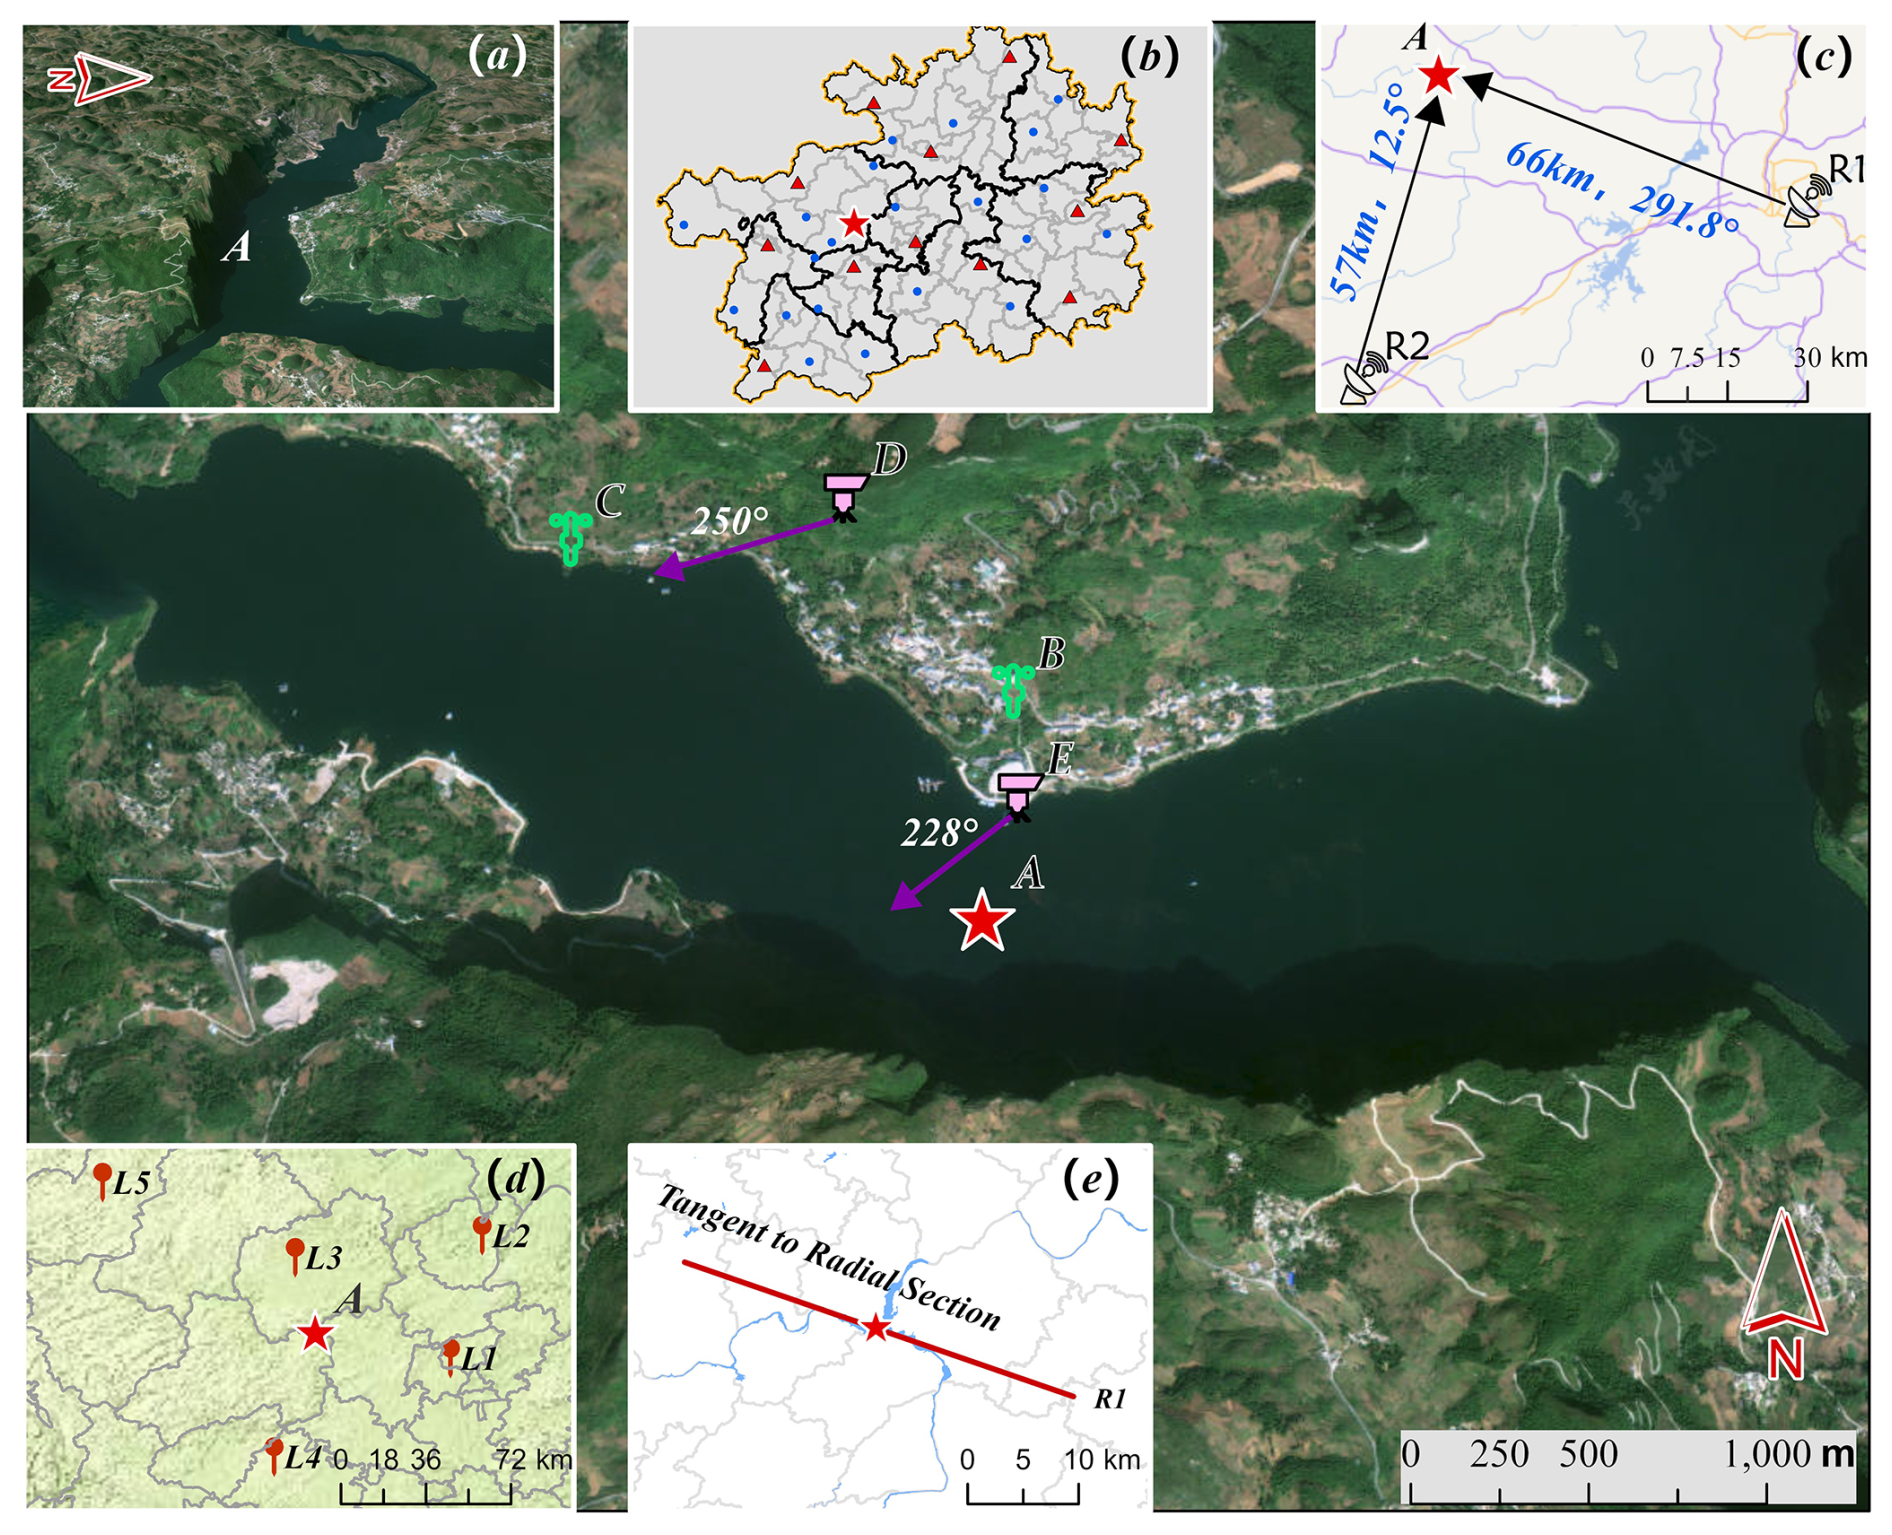
Figure 1Distribution of Meteorological Observations and Video Surveillance in the Incident Area and Surroundings. A denotes the water area where the passenger ship capsized. B and C are nearby automatic weather stations R7676 and R7657, respectively. D is Shoubayan surveillance camera, located at Wangjiangtai on the Migratory Ancient Path, with an altitude of approximately 1263 m and monitoring center orientation of about 250°. E is wharf square camera, which at an altitude of approximately 940 m, with a monitoring center orientation of about 228°. (a) The incident water area is a confluence of three rivers. Vertical limestone cliffs (200–300 m high) stand like screens to the south and east, and the north side lies a gentle-slope forest and a terraced artificial wharf square carved out in accordance with the mountain terrain. The water surface altitude is approximately 912 m. (b) Layout of 12 S/C-band and 21 X-band weather radars in Guizhou. (c) Locations, distances, and orientations of 2 S-band dual-polarization weather radars near the incident area. (d) L1–L5 lightning monitoring network coverage around the incident area. (e) Radial cross-section tangent of the Guiyang radar along the incident area. (The base map image is derived from Tianditu images, with the map review number: GS (2024)0568.)
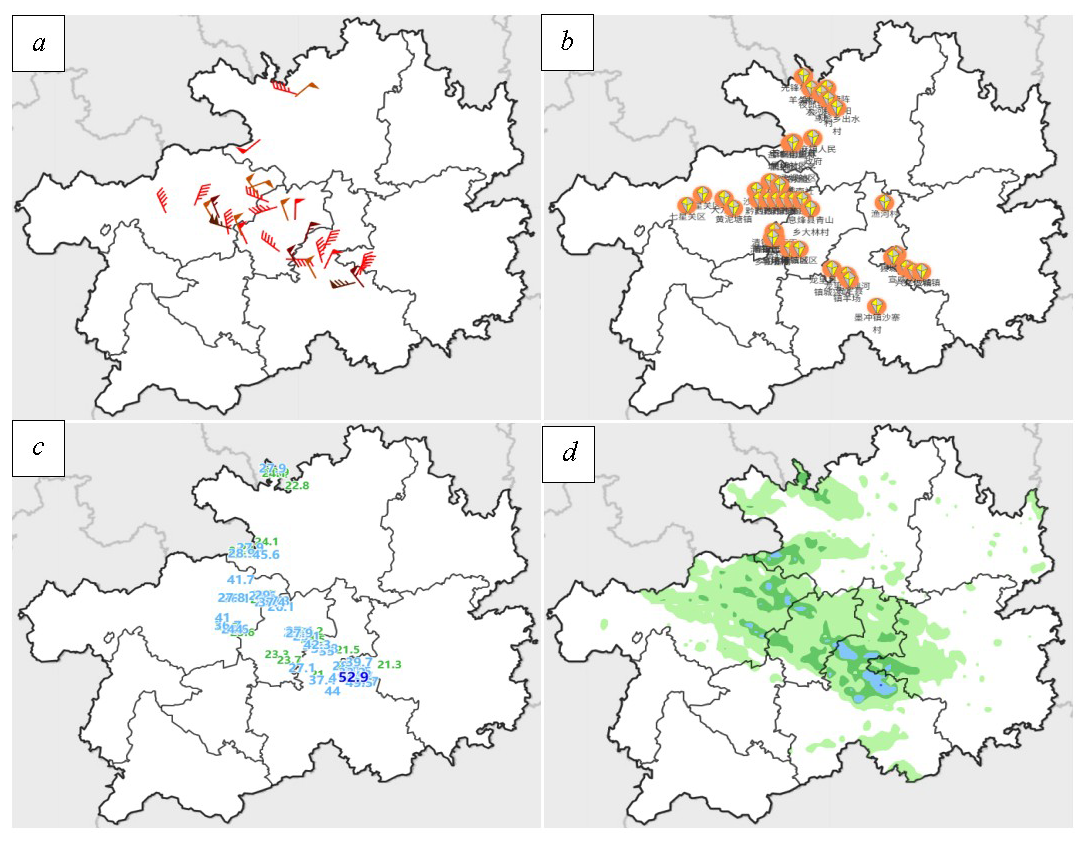
Figure 2Real-time Weather Conditions. (a) Thunderstorm Gales of Force 8 and Above. (b) Hail. (c) Short-duration Heavy Precipitation. (d) Accumulated Precipitation.
This weather process entered through the northwest entrance of the incident water area at approximately 08:24, and affected about 25 min before moving out from the southeast entrance. During this period, extreme gale accompanied this weather process, which was the highest wind speed observed in Guizhou since 1961 when we had complete meteorological records.
4.1 Weather radar detection characteristics and downburst flow-microphysical mechanisms
The analysis, which drew on composite reflectivity mosaics from 33 radars (Fig. 1b) recorded between 08:18 and 08:48 on 4 May 2025 and incorporated observations from Fig. 3, indicated that the edge of strong echoes approached the incident area and the range of strong echoes (65 dBZ) at the initial stage was limited, and it concentrated in the Guanyindong-Yangchang junction zone (northwest of the incident location). Convective cells were in the initial development stage, which laid the foundation for subsequent strong echo system formation. From 08:18 to 08:24, strong echoes moved southeastward in cirrocumulus pattern with the reflectivity field expanding and intensifying trend. Dual high-reflectivity cores formed in the Yangchang-Xinren junction area, which indicated the convective system had entered a stage of rapid development and organization phase with significantly increased echo energy density.
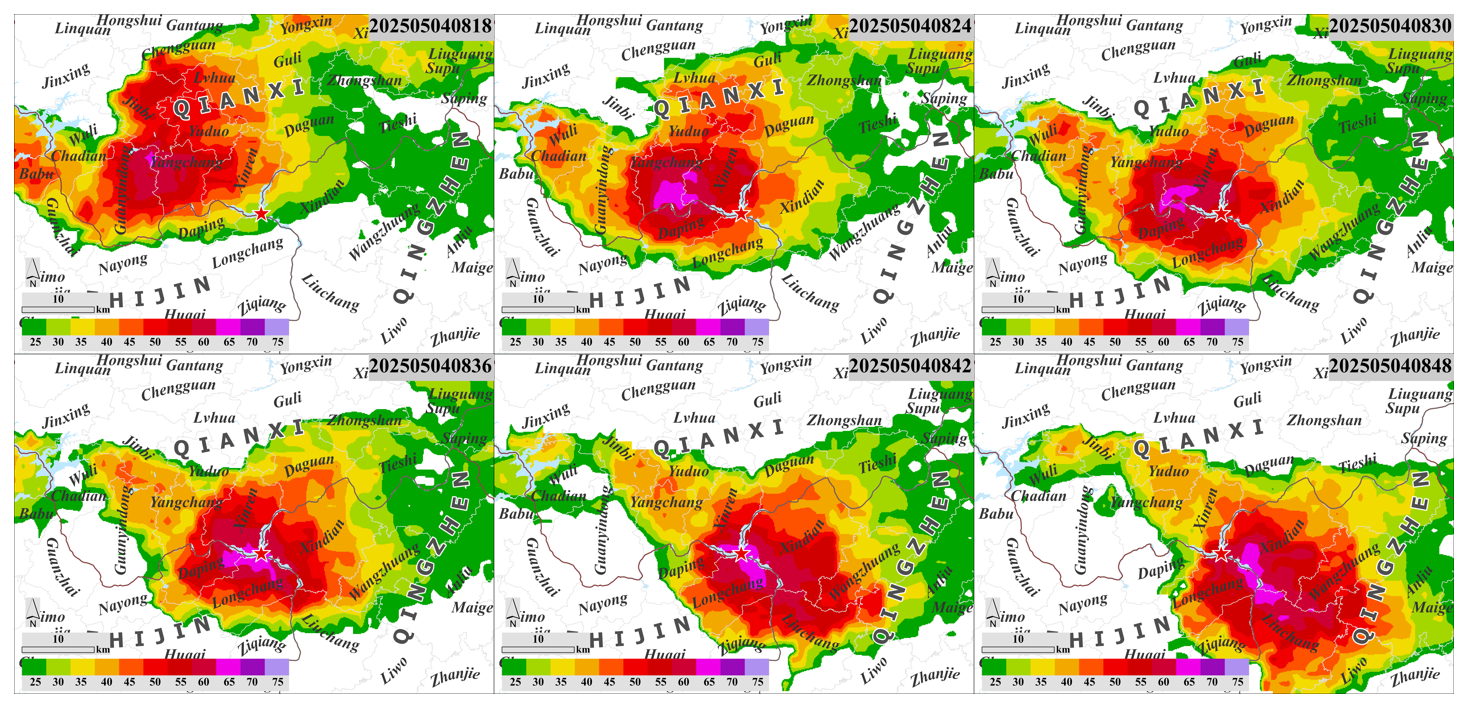
Figure 3Evolution of Weather Radar Echoes (08:18–08:48 on 4 May 2025, every 6 min).
From 08:24 to 08:30, the main body of strong echoes covered the incident area with the echo pattern merging from dual-core structure into a “crescent shape” accompanied by secondary echo center weaker than 65 dBZ. This reflected the convective system readjustments in dynamic and microphysical processes, which resulted in stable coverage of strong echoes over the incident area. From 08:30 to 08:42, high-reflectivity cores continuously acted on the incident area with the intensity of the strong reflectivity field (up to 74 dBZ) and the spatial range remained stable. The convective system entered into an efficient and continuous stage, providing a critical dynamic environment for downburst disaster formation. From 08:42 to 08:48, the main body of the strong echo subject gradually moved away from the incident area, and the influence of high-reflectivity cores on the accident area ceased.
Due to the northwest-southeast movement path of convective cells, it is aligned with the radial direction of the Guiyang radar relative to the incident location. Figure 4 displays a vertical profile of radar along the radial direction of the incident area (as shown in Fig. 1e) from 08:23 to 08:44, including reflectivity (REF, left column), differential reflectivity (ZDR, middle column), and radial velocity (VEL, right column). The red pentagram (A) marks the capsizing location of the passenger ship, the blue solid line (B) indicates the 0° layer height (approximately 8 km) determined from surrounding sounding data, and the bottom curve (C) represents ground altitude changes along the radial direction. The evolution process of the wet microburst is analyzed from two aspects: microphysical characteristics and dynamic structure:
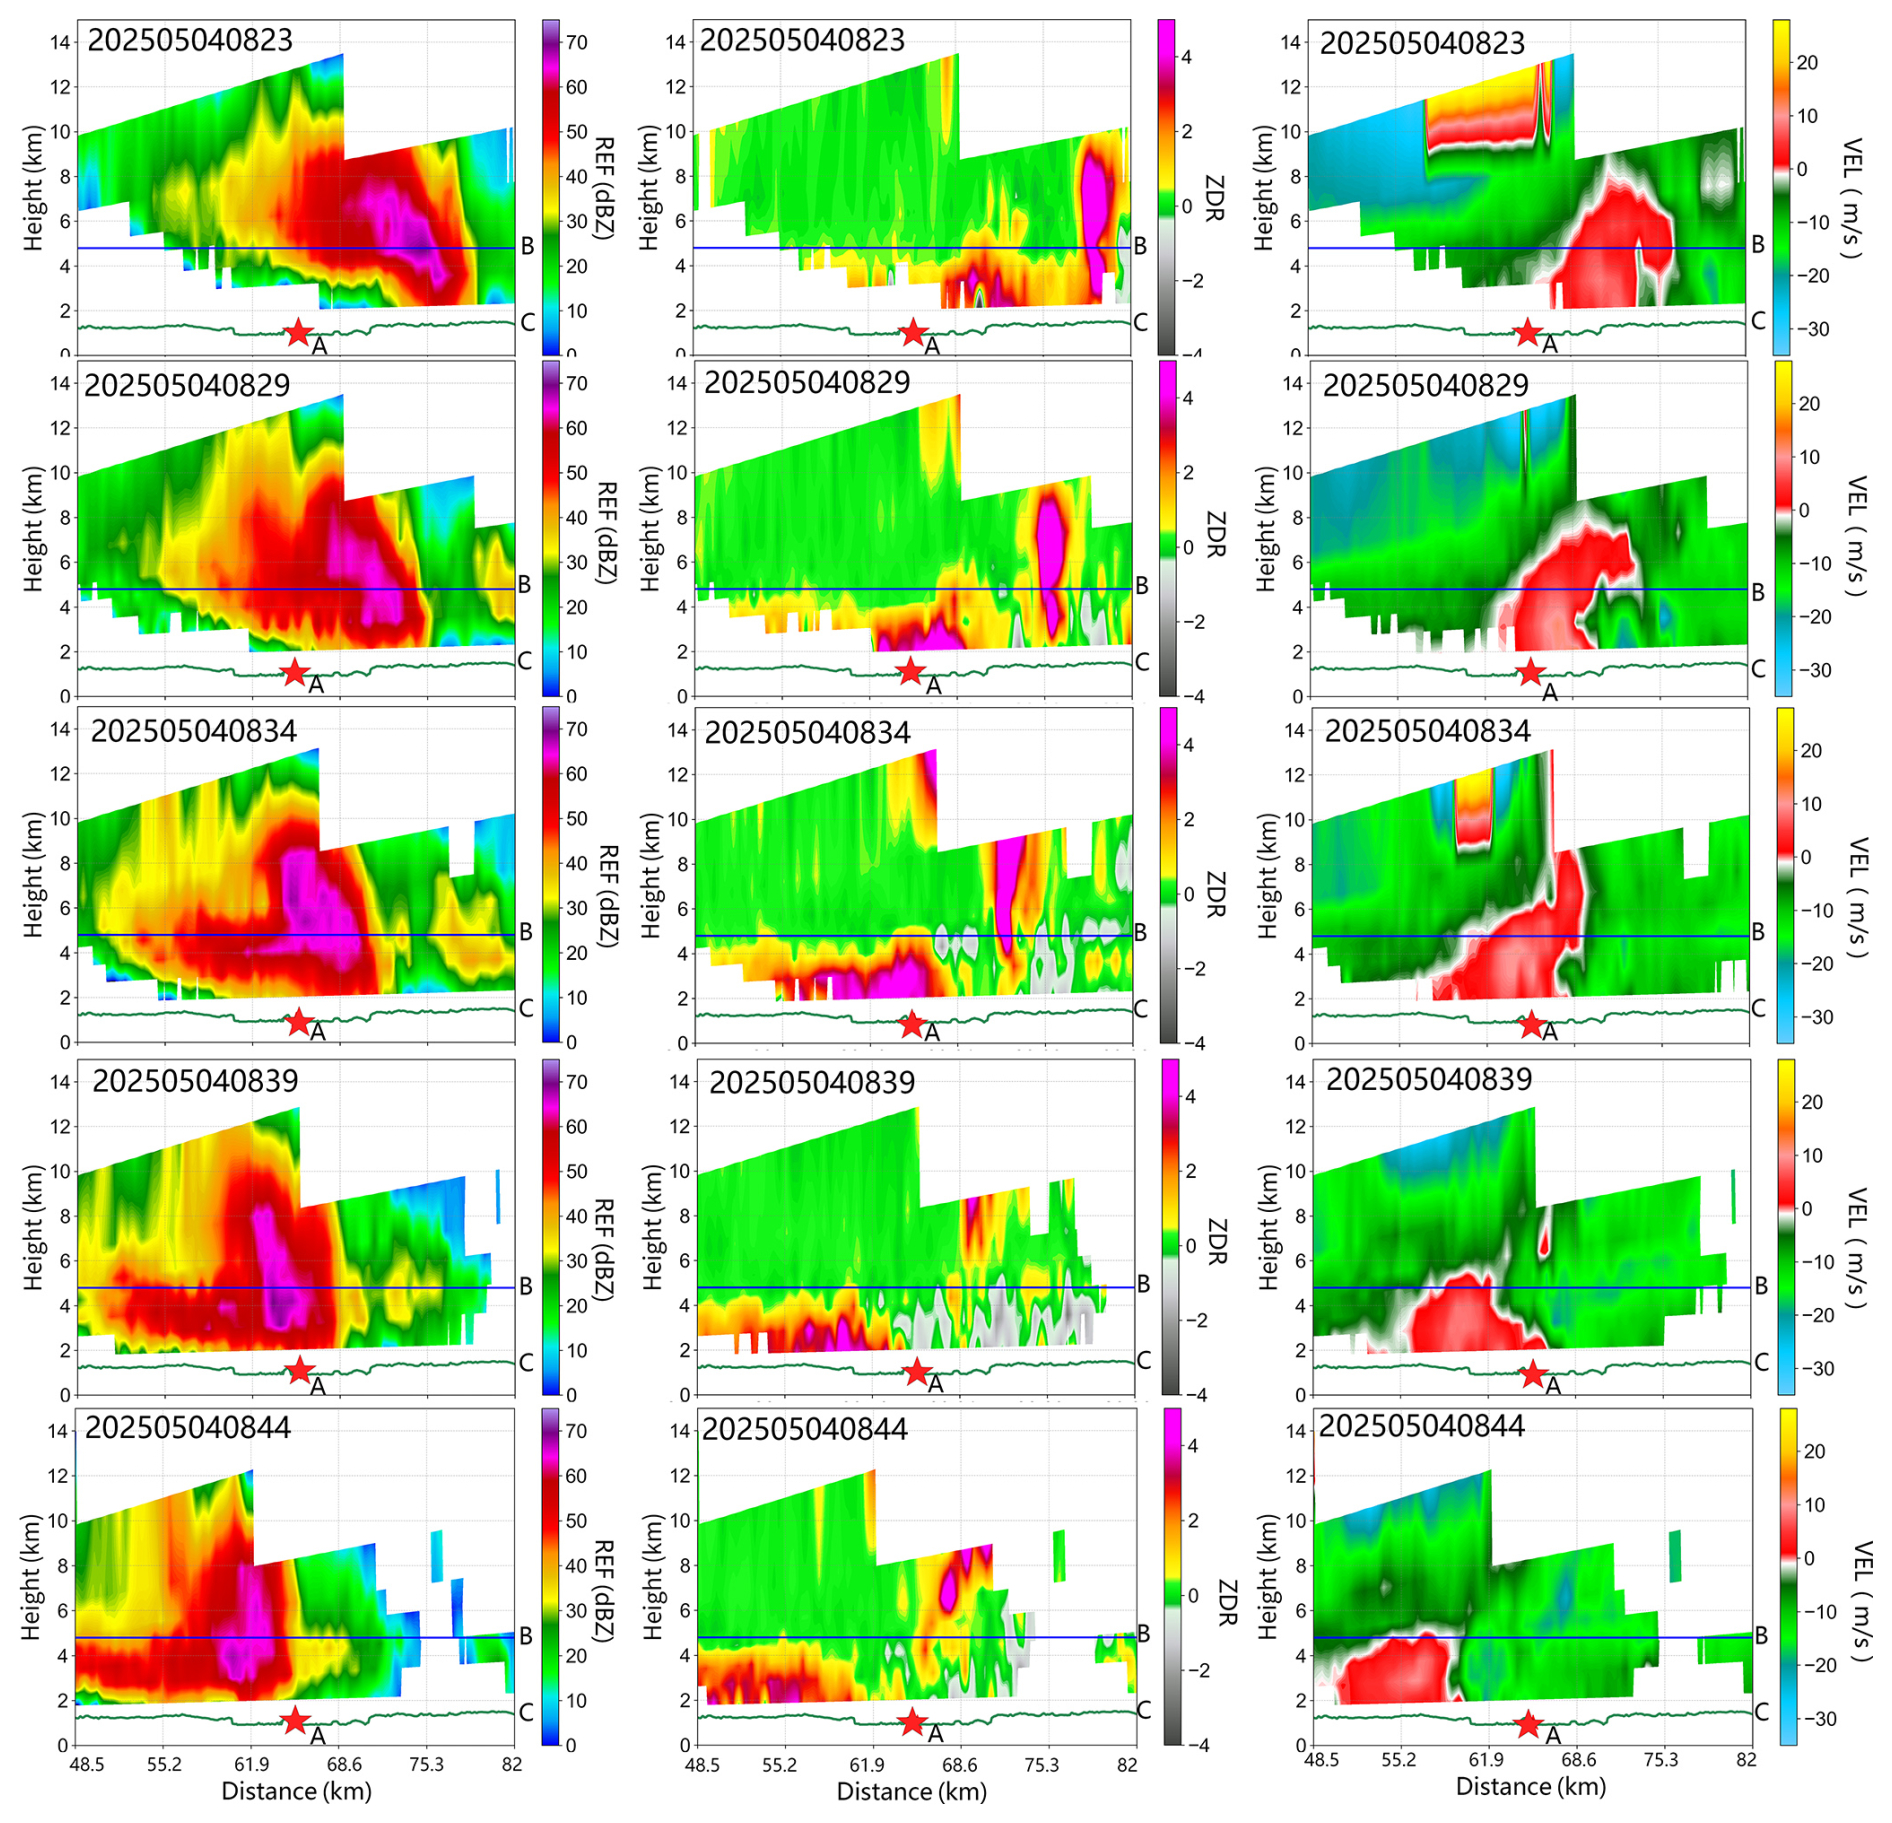
Figure 4Guiyang S-band Weather Radar Radial Vertical Profile. A indicates location of the passenger ship capsizing incident. B indicates 0° line position determined from nearby 3 d sounding data. C indicates ground elevation changes along the radial direction.
The left column REF profile shows that between 08:23 and 08:44, a strong echo core (intensity > 50 dBZ) persisted above the incident location (Point A), with its height gradually descending from an initial 6–8 to 2–4 km. The vertical extension and rapid descent characteristics of strong echoes reflected the rapid growth and gravitational fall of hydrometeor particles (hail, graupel, etc.) within convective clouds, which directly related to the mass loading mechanism of downburst formation. The descent of abundant precipitation particles dragged the airflow, triggering and enhancing the descending motion (Proctor, 1989). The strong echo core reached its lowest height (near 2 km) between 08:29 and 08:34, which corresponds to the critical stage of explosive radial divergence of descending airflow hitting the ground. This is highly consistent with the temporal characteristics of strong echoes steep descent and strong wind outbreaks on the ground observed by Zheng et al. (2016). in the “Eastern Star” incident, revealing disaster-causing features commonalities of such processes.
The middle column ZDR profile reveals the phase evolution of precipitation particles. From 08:23 to 08:34, a high ZDR region (2 dB, red area) appeared at 2–4 km altitude above Point A, which exactly located in the melting layer below the 0° layer (Line B, 5 km). High ZDR value typically indicates the dominance of flattened water droplets, combined with the 0° layer position, it can be inferred that upper-level ice-phase particles (hail, graupel) melted after passing through the 0° layer during their falling, forming abundant supercooled water droplets (Laroche, 2002). After 08:34, the high value of ZDR region further descended to near the surface with the strong echo core, indicating that the melted water droplets continued to be transported to the ground, enhancing near-surface precipitation intensity and air cooling effects near the ground, and providing sustained momentum for downdraft airflow.
The right column VEL profile clearly depicts the dynamic structure of the downburst. After 08:23, a negative VEL region (toward the radar) appeared above Point A at 4–8 km (near the 0° layer height), indicating the dynamic power activation of downdraft airflow in the convective storm middle layer. From 08:29 to 08:39, the negative VEL zone region in the middle layer continued to extend downward, and the VEL at Point A shifted from negative to positive, indicating the impact of downdraft airflow hitting the ground. The positive VEL zone region near-surface expanded and formed a divergent field with surrounding negative VEL, corresponding to the peak value of surface divergence of downburst with strong winds directly acting on the incident area. This process aligns with Fujita's (Fujita, 1976) classic model of “upper level outflow – middle level descend motion – surface divergence”, confirming the strong wind disaster mechanism of the capsizing incident at Point A. After 08:44, the velocity of the descending airflow weakened with the divergence range narrowed, and the dynamic structure gradually dissipated.
Furthermore, the persistent presence of the REF strong echo core above the 0° layer (6–8 km) indicates sufficient growth of ice-phase particles (hail, graupel) at the same time, the development of high ZDR value regions below the 0° layer (2–4 km) confirms the dominant role of supercooled droplets formed by melting ice-phase particles. Meanwhile, the synchronous downward extension of the negative velocity zone in the middle level of VEL further verifies the driving effect of this chain process on downward dynamic motion. This chain process of “ice-phase growth – water-phase melting – evaporative cooling” provided sustained negative buoyancy driving for descending airflow (Mahale et al., 2016). In particular, the strong echo core breaking through the 0° layer and rapidly descending at 08:29, which synchronized with the strongest descending airflow shown by VEL, the spatiotemporal matching of the three signals completely closes the logical chain from the microphysical processes to dynamic disaster-causing, verifying the enhancement effect of particle phase change on descending motion.
4.2 Evolution Characteristics of Surface Meteorological Elements and Cold Pool Outflow Response Analysis
Minute-scale surface meteorological element monitoring is shown in Fig. 5. Before 08:23, the instantaneous wind speed at Station R7676 (indicated by the green polyline) fluctuated slightly within the range of 0–3 m s−1, with wind direction (indicated by red arrows) stably pointed towards the east direction. During this stage, warm and moist airflows were smoothly transported along the river surface, and the low-roughness underlying surface significantly reduced airflow disturbance, resulting in a weakly disturbed and highly stable wind field. From 08:23 to 08:26, a slight disturbance occurred in the wind field with wind speed dropping to the minimum value, and then followed by an explosive abrupt change. Starting from 0.8 m s−1 at 08:26, wind speed continuously surged to the peak (exceeding 34.7 m s−1 around 08:32), reaching a wind scale of Level 12. This corresponds to the phase when the core of the strong echo touched the ground between 08:29 and 08:34 as observed by radar. Concurrently, wind direction sharply shifted from northeasterly (56° NE) to westerly (near 270° NW), with a crisply decisive and lag-free direction turning process. This combination of “wind speed jump + abrupt wind direction turning” is a classic indicator of cold outflows formed by thunderstorm cloud downdrafts impact on the ground (Orf and Anderson, 1999).
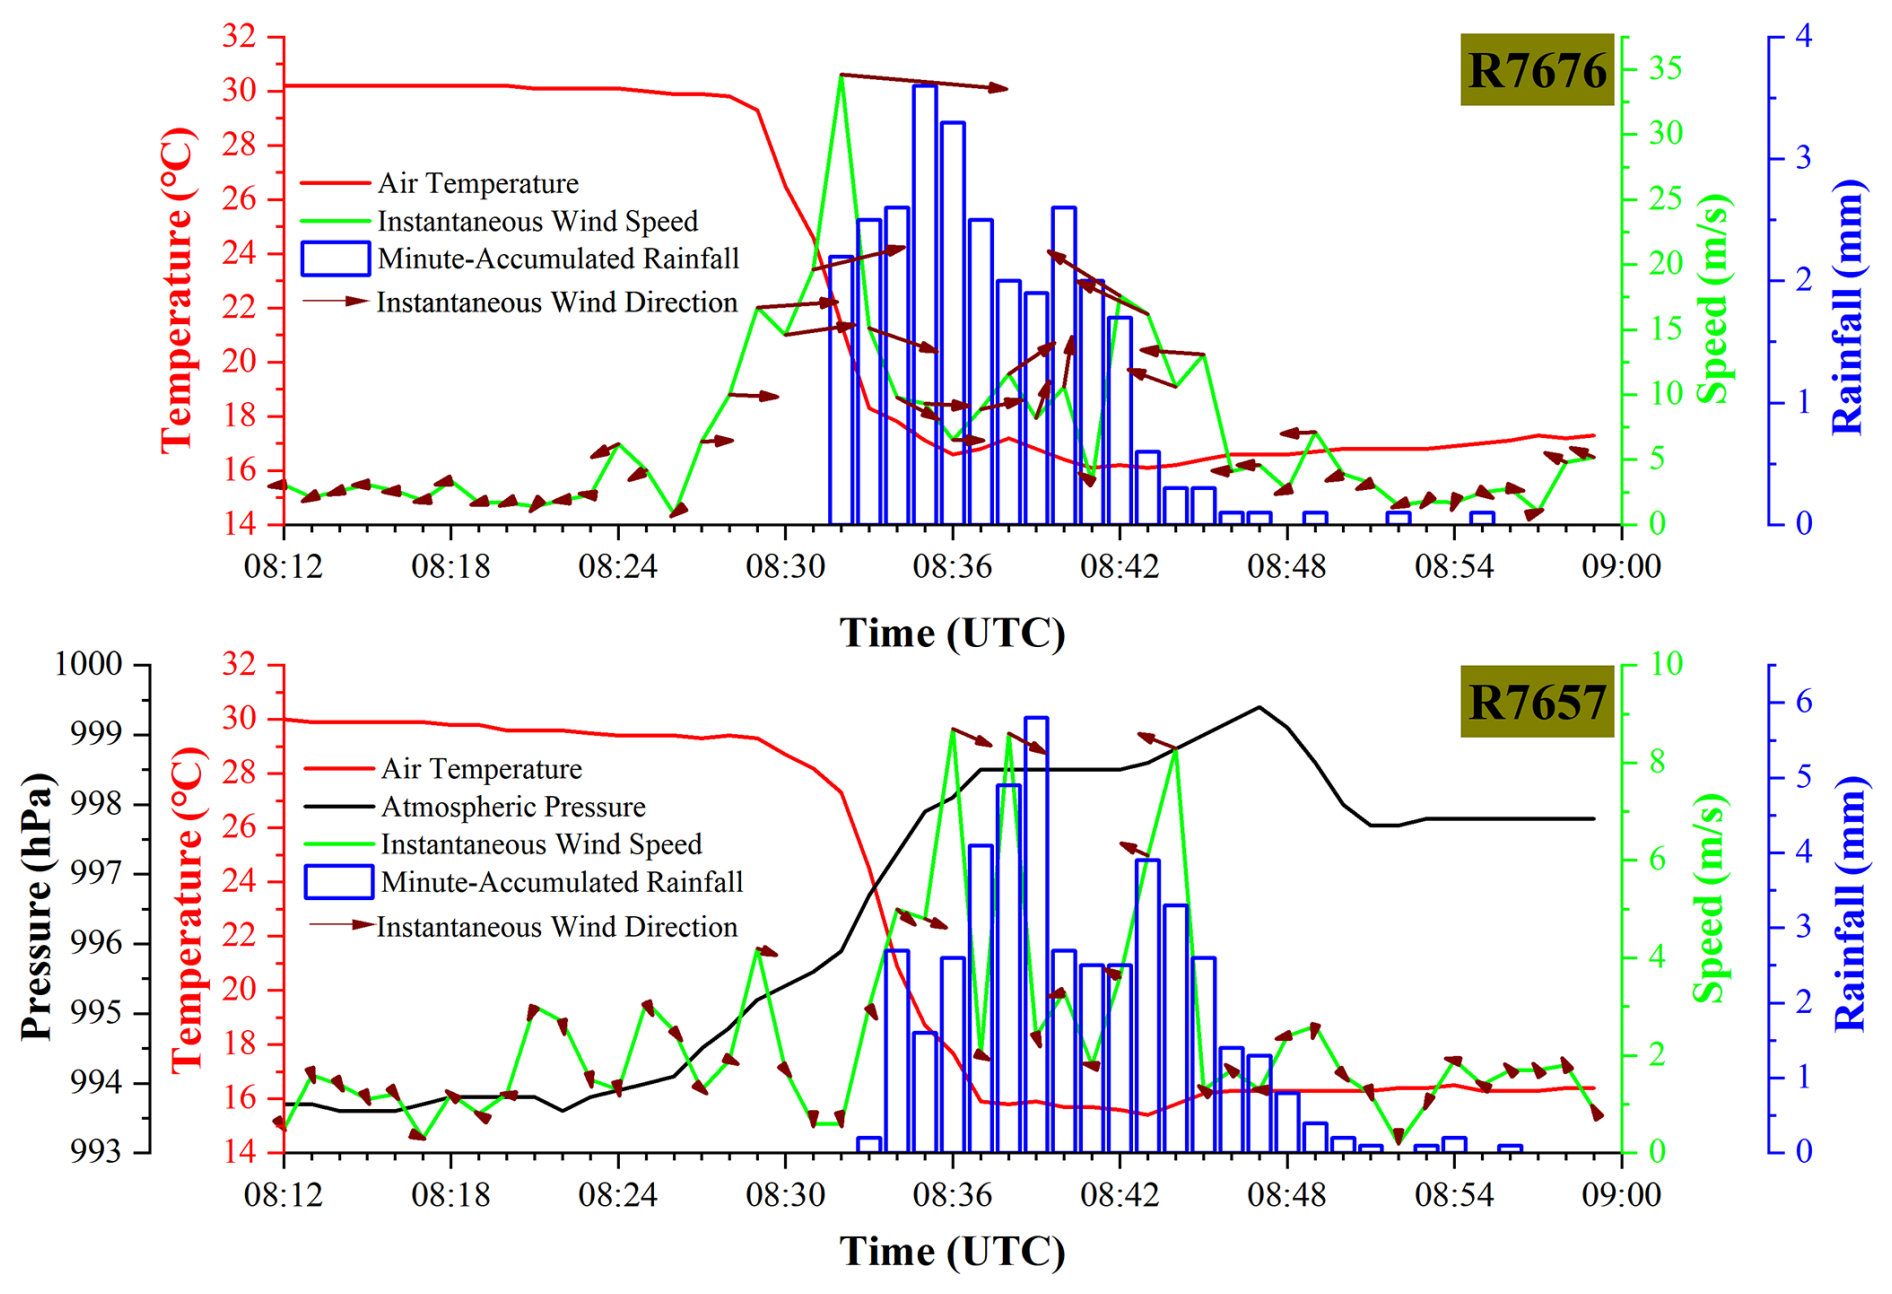
Figure 5Time Series of Meteorological Observation Elements at Huawucun Station (R7676) and Baili Gallery Station (R7657).
From 08:32 to 08:38, wind speed gradually weakened to approximately 10 m s−1, maintaining a predominantly westerly direction. Subsequently, wind direction shifted to counterclockwise. It turned southerly from 08:39 to 08:40, then easterly again after 08:41, with wind speed re-intensifying to 17.6 m s−1. After maintaining a wind speed of approximately 10 m s−1 for 3 min, wind speed rapidly dropped below 5 m s−1 at 08:46 as cold pool outflow energy dissipated, and wind direction returned to a stable state. Station R7676 is adjacent to an open river surface with extremely low roughness of underlying surface, and the airflow is minimally disturbed by topographic obstructions. In contrast, surface station R7657 is restricted by geographical environment and ultrasonic wind measurement conditions, which recorded significantly lower wind speeds than R7676. However, both stations exhibited consistent wind direction trends.
Temperature changes (red curve) showed a clear temporal correlation with wind field abrupt changes. During the initial stage of wind field abrupt changes (before 08:26), temperature remained stable at approximately 30 °C. As the cold pool outflow continued to advance, temperature began to drop after 08:30, with the thermal response lagging behind the dynamic response by approximately 3 min, plummeting to 16.1 °C within 10 min. The accompanying small-scale cold pool was significant, with a 10 °C temperature difference between downburst and ambient environment proposed by Atkins and Wakimoto (1960). During this period, precipitation processes (blue bars represent minute cumulative rainfall) occurred simultaneously. Cumulative precipitation at station R7676 reached 26.9 mm within 10 min, while station R7657 recorded even higher cumulative precipitation of 40.6 mm due to topographic uplifting and enhanced cold pool convergence, confirming the intensifying effect of cold pool outflow on vertical transport of water vapor. Air pressure changes (black curve) also exhibited typical high-pressure response characteristics of thunderstorms. Before 08:23, air pressure fluctuated at a low level of 994 hPa. As the cold pool outflow hit the ground, high-density cold air rapidly accumulated near the surface, which caused air pressure to rise by 5.4 hPa. This is consistent with observations by Mahale et al. (2016) and Zhai et al. (2019) that surface pressure increases associated with wet downbursts accompanied by heavy precipitation. The sudden increase of air pressure, wind field abrupt changes, and temperature plummet were highly coincident in time dimension, verifying the synergistic evolution mechanism of “dynamic disturbance–thermal response–air pressure adjustment” driven by cold pool outflow, and providing multi-element observational evidence for the energy release process of severe convective weather systems.
4.3 Analysis of Lightning Activity Characteristics and Dynamic Coupling Mechanisms
Downburst is a common type of disastrous weather. Outfield experiments have demonstrated that the occurrence of downburst can be detected in 60 %–80 % of thunderstorms (Wakimoto, 2001). According to the data from the lightning monitoring network as shown in Fig. 6, 1983 lightning flashes were detected near the incident area between 08:00 and 09:00, including 1688 cloud flashes (accounting for over 85.1 %). Lightning frequency ranged from 5 to 66 flashes min−1 with cloud-to-ground (CG) flashes maintaining a low overall proportion (< 25 %). Most flashes occurred within clouds, attributed to “cold pools” formed by downdrafts, which hinder the transimission and discharge of electric charges to the ground. The high-density cold air of the cold pools forms a stable stratification near the surface, cutting off the conduction path of negative charges from the cloud base to the ground. Meanwhile, the downdrafts suppress the vertical transport of charges by updrafts, further reducing the effective cloud-to-ground discharge channels (Shi et al., 2025).
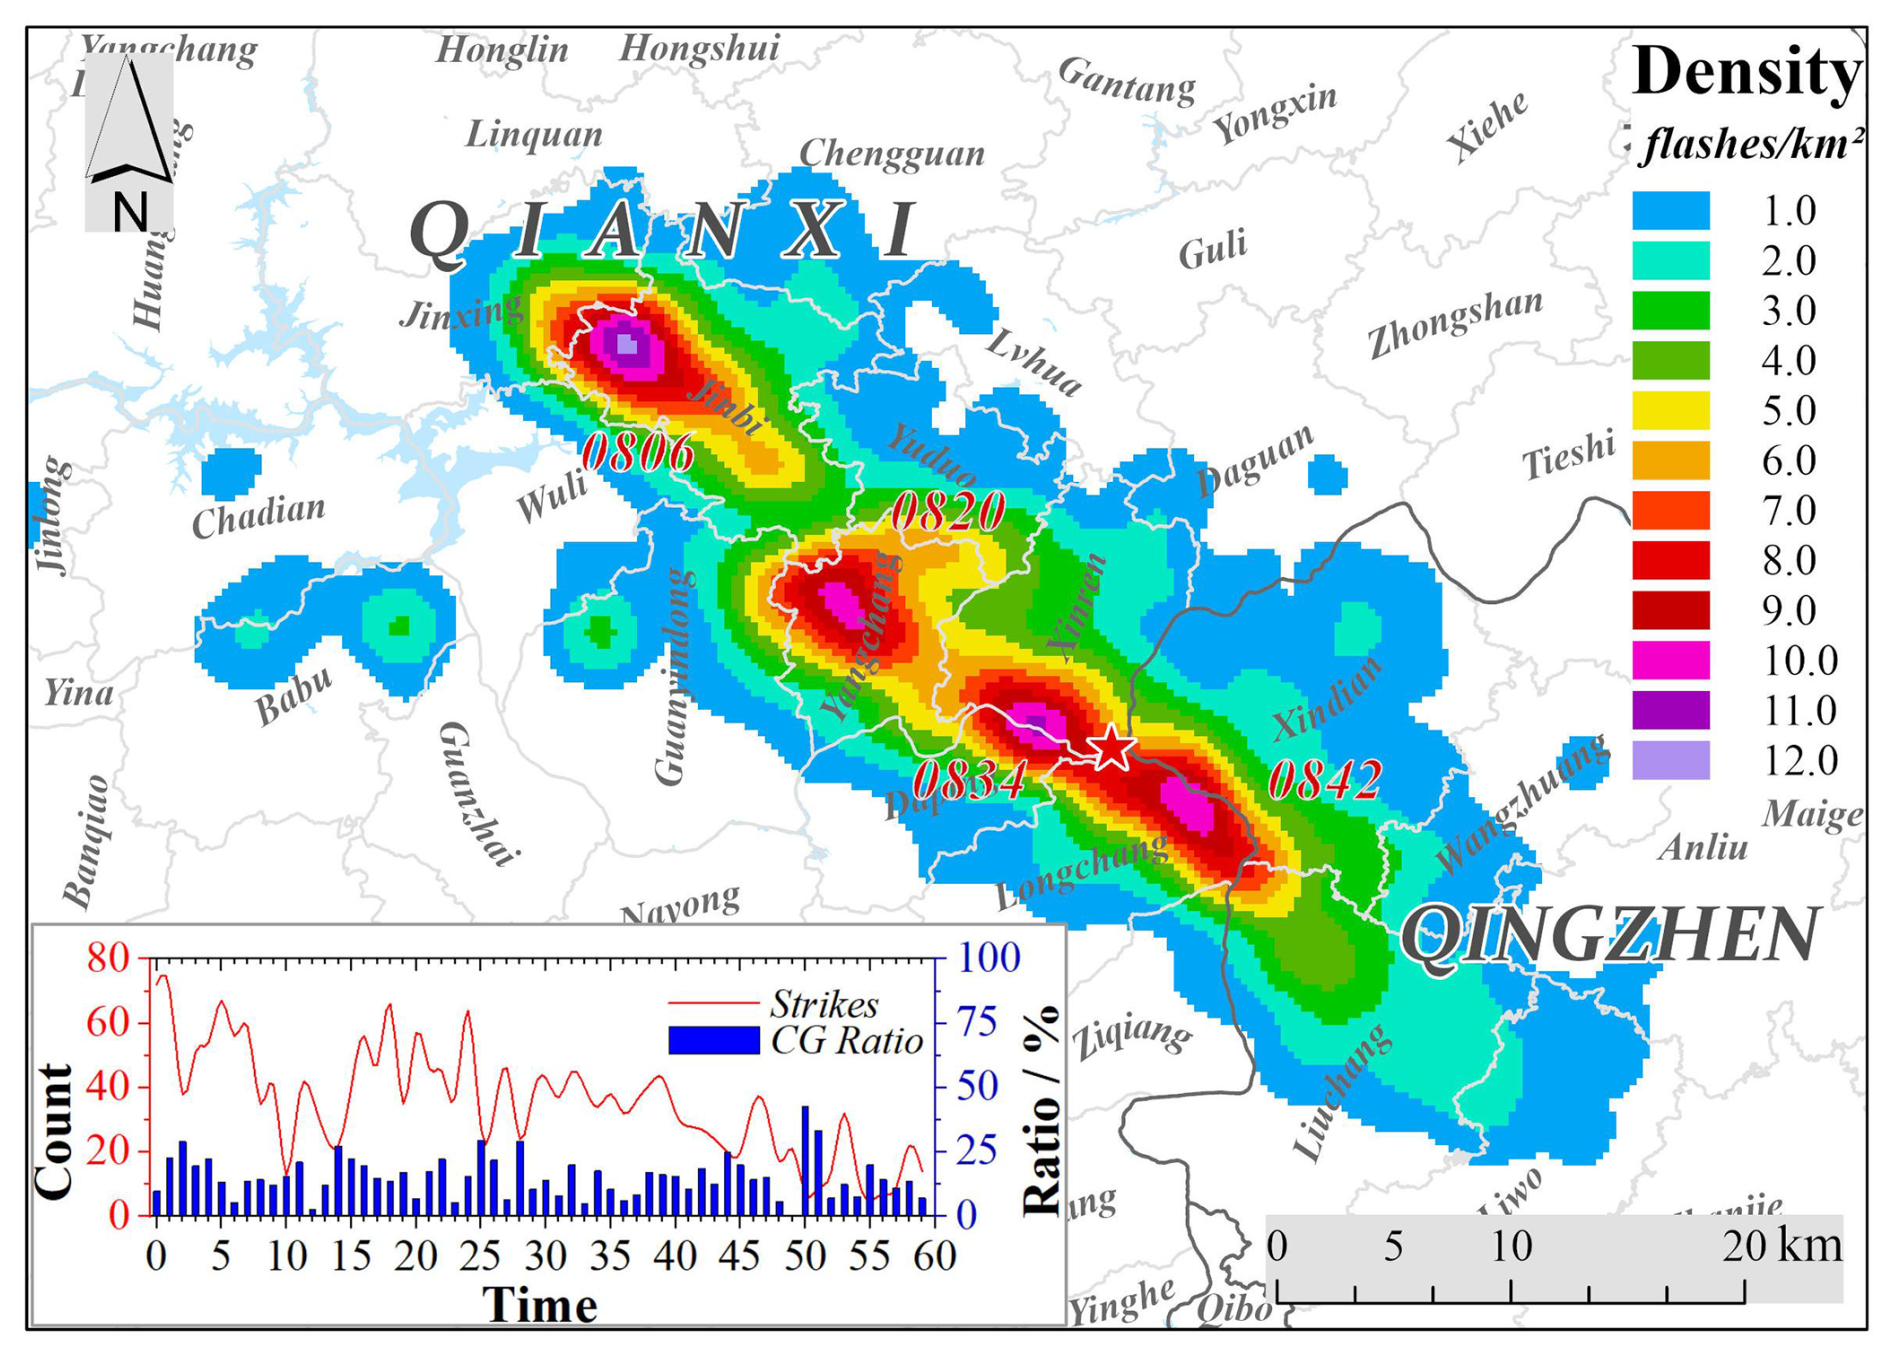
Figure 6Spatio-Temporal Distribution of Lightning Density (08:00–09:00).
Spatially, lightning distributed in a northwest–southeast direction in a strip-like pattern, consistent with the movement direction of downburst convective cells. Four high-density areas (> 8 flashes km−2) formed along the strip in northwestern of Jinbi, central of Yangchang, southern of Xinren, and northeastern of Longchang. Their occurrence times (approximately at minutes 06, 20, 34, and 42 of 08:00) coincided with strong echo core centers, reflecting coupling between charge activity and dynamic structure in the convective system. The incident site was located in a sub-high lightning density zone (green-yellow, 4–6 flashes km−2), which was in the “tail–transition zone” of the main lightning belt – the downdrafts outflow region of downburst. Although it is not the most lightning-dense area, it was directly affected by charge activity in the convective system.
4.4 Verification of Disaster-Causing Process via Video Surveillance and On-Site Disaster Traces
4.4.1 Temporal Correlation of Video Surveillance
Based on real-time videos from surveillance cameras at Shoubayan (position D in Fig. 1) and the wharf (position F in Fig. 1), combined with collaborative analysis of meteorological elements. We observed that the main cumulonimbus body continuously moved into the monitoring field of view at 08:18. The high-layer cloud anvil exhibited cyclonic rotation characteristics (extending and spreading southeastward), and its bottom was accompanied by an explosive downward airflow forward – airflow propagation speed was significantly faster than that of cloud anvil advection. It indicated that downdraft momentum in the severe convection core area began to transmit downward, accumulating kinetic energy for downburst touchdown ground (Fig. 7a). At 08:24, the high-altitude cloud system underwent an abrupt morphological change (anvil structural distortion marked by red dashed lines), and mountain vegetation showed a weak westerly response. This corresponds to the touchdown of the upstream front of downburst downdrafts, where high-altitude momentum downward transfer airflow arrived before the main body, forming an initial wind field disturbance at the mountain top. At this time, downdrafts had not completely diverged yet, and the wind field was dominated by unidirectional advection, which is the initial signal “point-source divergence” of downburst (Fig. 7b). At 08:29, wharf cameras showed rapid advancement of rain and fog (water vapor phase transition triggered by downdraft descending cooling) with waves ≥ 1 m were triggered on the river surface (red zone Z). The cruise ship flag and directions of wind and wave were dominated by northwest winds. It is verified that downburst frontal divergent airflow diverged from the convection center to southeastward, forming linear shock waves in the water area (Fig. 7e). At 08:32, the main body of strong wind reached Shoubayan (Fig. 7c), and the meteorological station R7676 recorded an instantaneous maximum wind speed of 34.7 m s−1.
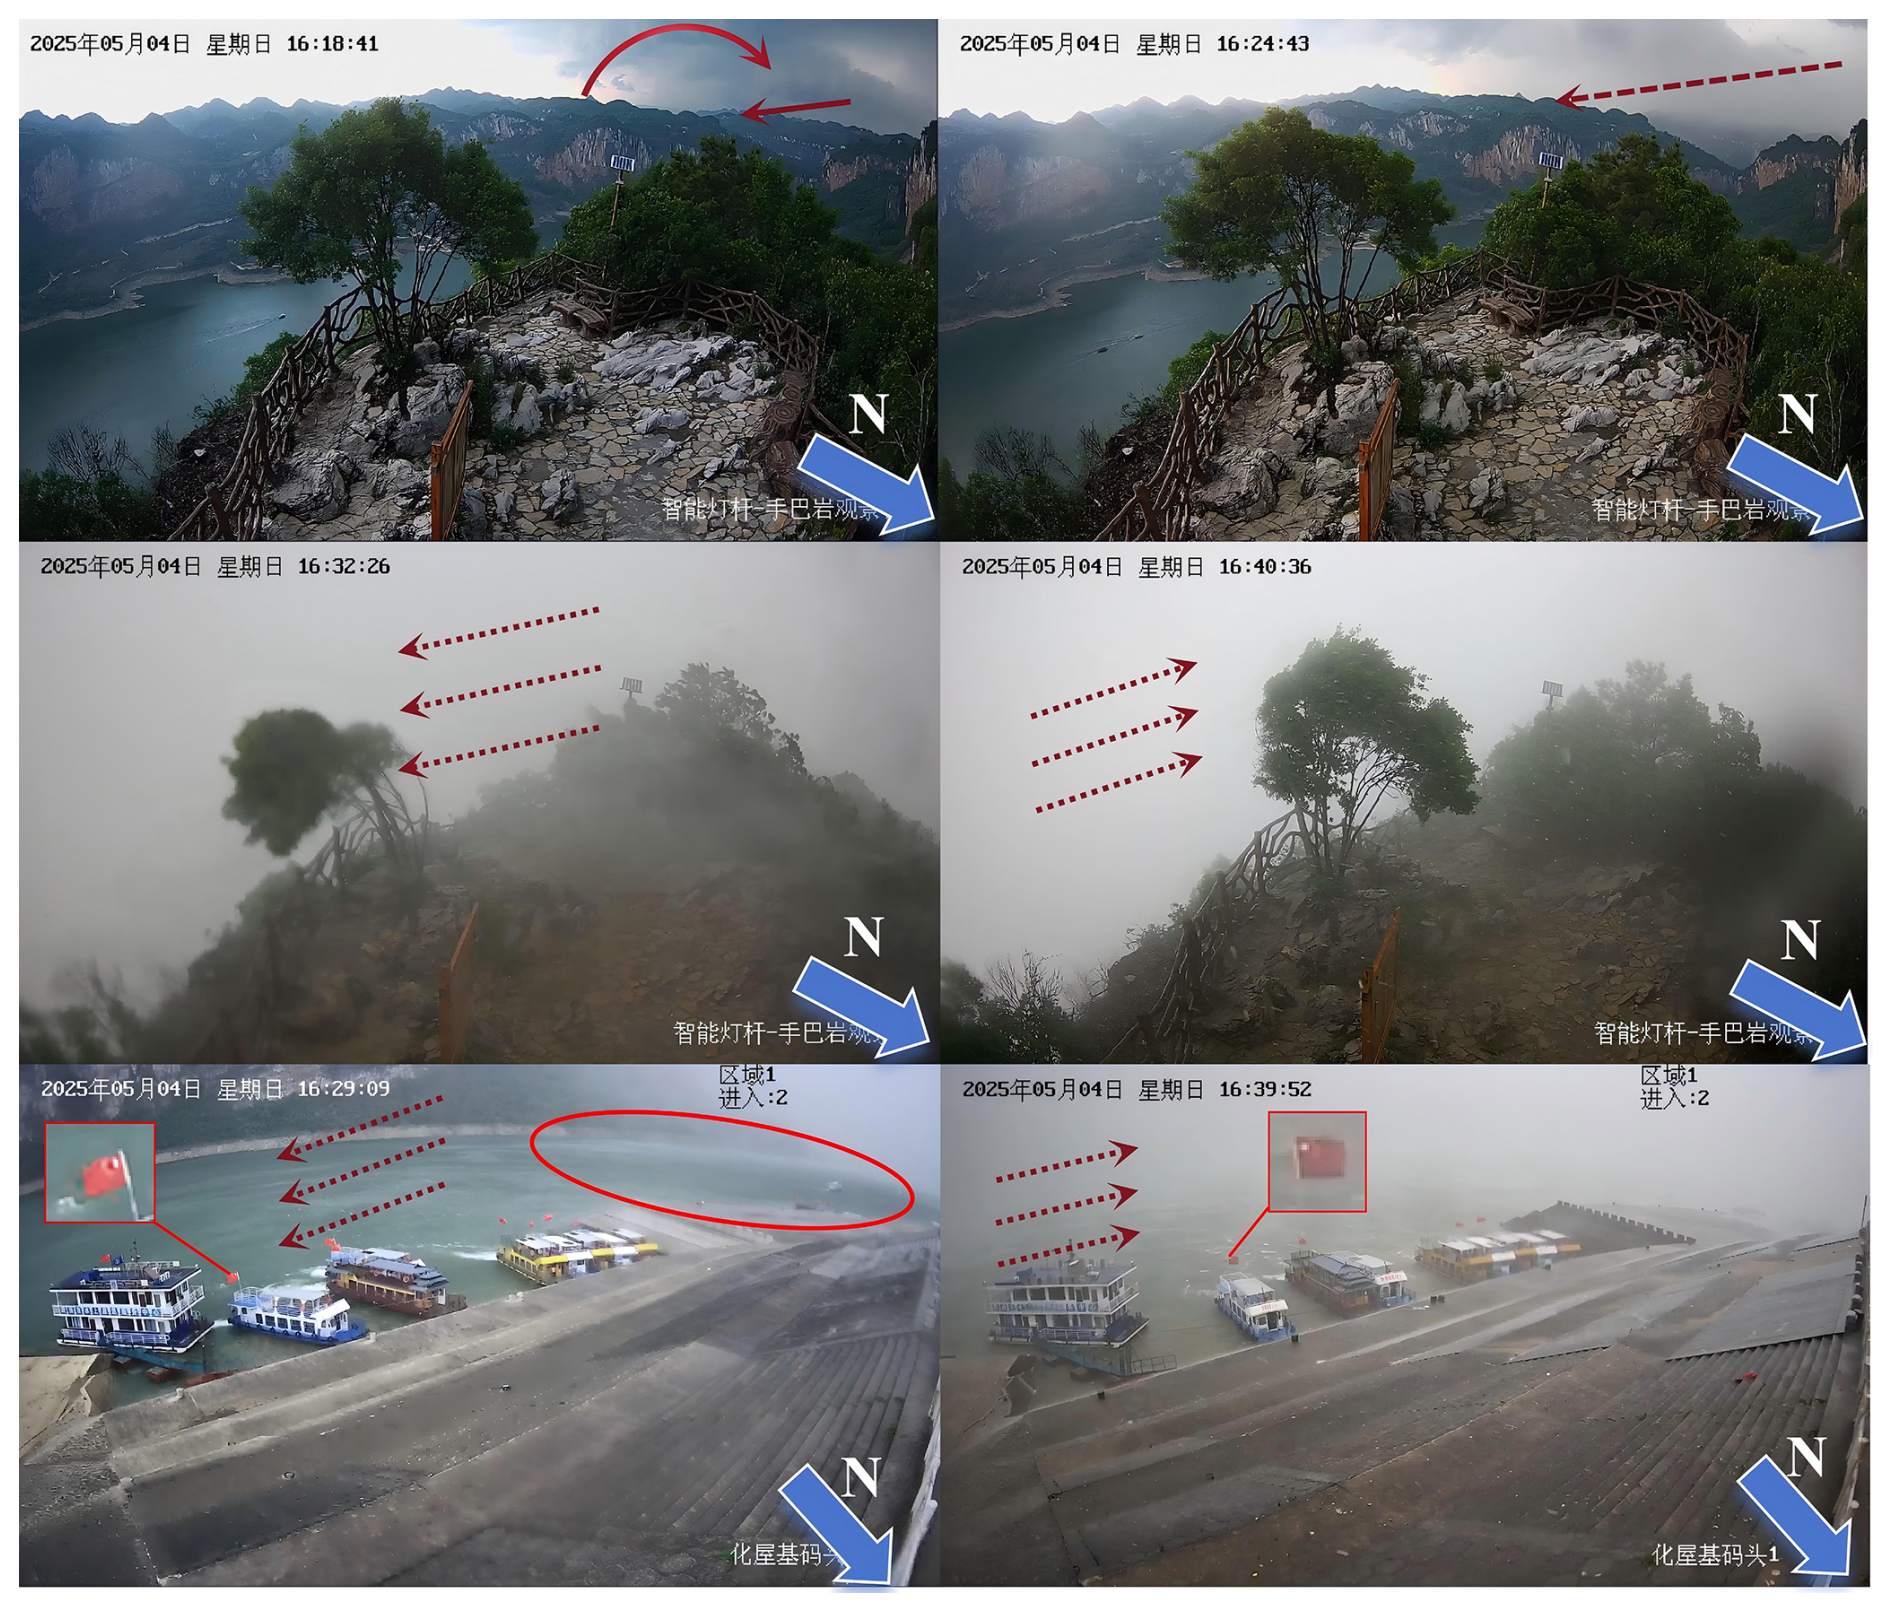
Figure 7On-Site Video Surveillance. (The video is sourced from scenic area cameras and the Tianyan Security System. Researchers, as authorized members of the investigation team, have no involvement in copyright issues.)
Mountain-top vegetation is significant tilted (with the northwest wind continuously dominating), and cold air carried by downdrafts mixed with ambient warm and moist air, triggering local rain and fog outbursts (visibility < 10 m). This stage corresponded to the energy peak of downburst divergent wind field, with the highest momentum transmission efficiency and the greatest disaster risk. After 08:40, the wind direction shifted from northwesterly to southeasterly dominance, which were visible on mountain top trees (Fig. 7d) and riverbank cruise ship flag (Fig. 7f), accompanied by the descent of small hailstones. This phenomenon “wind direction reversal + hail” resulted from the synergy of downburst cold pool divergence and ice-phase particle transport, where cold pool's low temperatures preserved upper-level incompletely melted graupel particles, which were transported to the surface by southeasterly winds. This process demonstrated the coupled disaster mechanism of dynamic downdrafts and microphysical processes.
4.4.2 Spatial Response of On-Site Disaster Damage and Dynamic Wind Fields
Based on field disaster damage traversal and spatial correlation analysis as shown in Fig. 8, we found five significant damaged areas, which could verify the analysis. Z4 is the first significant disaster area of the downburst upstream, trees showed “uprooting and directional breakage” with lodging/breakage directions eastly southeastly, which is highly consistent with the downburst movement path (northwest-southeast) and initial divergent wind field (northwesterly-dominated stage). Rapeseed “patchy lodging” reflected three-dimensional wind field disturbances (horizontal divergence + vertical disturbance force) after strong downdraft touchdown, verifying the initial damage characteristics “explosive outflow” of downburst. The scope and intensity of disaster damage in Z4 (first touchdown zone) were significantly weaker than subsequent zones. Disaster damage Z2 (riverbank group construction square) showed a “wind field quadrant switching” response. Guardrails and billboards exhibited “unidirectional collapse”, and the direction of square trees lodging was northeast, corresponding to the “southeastern quadrant airflow” of the downburst divergent wind field. Cornfields showed “small hail damage”, and trees had “twisted but unbroken branches”, confirming the residual effect of “weak dynamics force + ice-phase particles” in the outflow from the cold pool. The disaster damage in the Z3 area is distributed in a point-like pattern with non-directional lodging of trees and streetlights, reflecting multi-quadrant airflow confrontation of the strong divergent wind field. The disaster damage exhibited “omnidirectional divergence” characteristics. In the Z1 area, trees showed patchy eastward lodging and breakage, consistent with the downburst movement path, demonstrating the directional momentum transfer of the marginal wind field. Z5 (residential houses) west-east walls exhibited “wall peeling + hail impact marks”, corresponding to the downburst “wind direction reversal process” – first affected by westerly winds (initial divergent northwest quadrant), then easterly winds (switched to southeast quadrant), with hail impacted walls successively with bidirectional wind fields. Additionally, in Z1 and Z3 areas, the circumference of uprooted tree trunks measured on-site ranges from 100 to 140 cm (corresponding to a diameter of 30 to 45 cm). Calculated using the simplified model v = fitted from material mechanics principles and wind disaster observation data (where k is the wind resistance coefficient of tree species, taken as 4.5 in this case), and combined with a 15 % to 20 % gust effect correction (Jia, 2014), the estimated range of disaster-causing instantaneous wind speed is 28.3 to 36.1 m s−1, corresponding to wind force levels 11 to 12, which is consistent with the wind speed observed by ground meteorological stations.
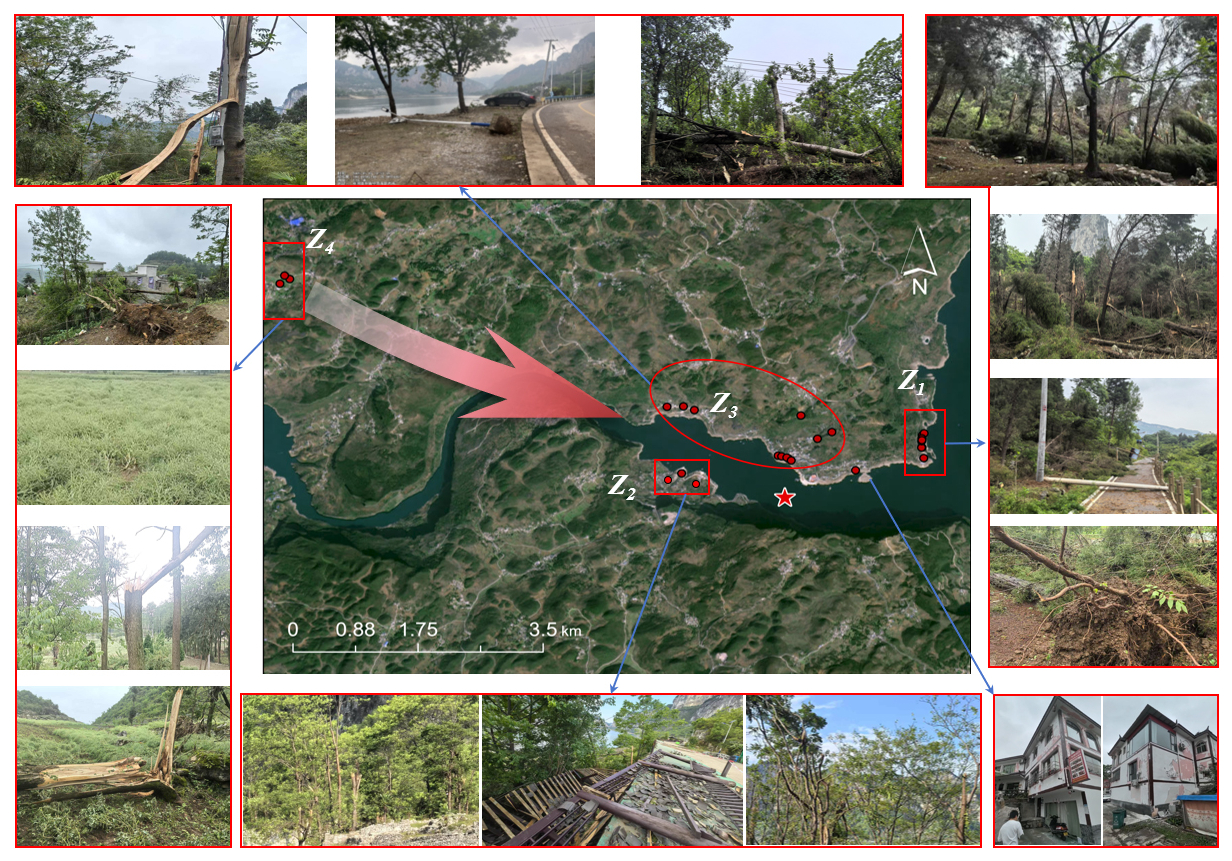
Figure 8Situation of On-Site Disaster Damage. (The base map image is derived from Tianditu images, with the map review number: GS (2024)0568. The on-site photos are taken by the research and investigation team at the scene.)
Based on multi-source data including ground observations, lightning monitoring, video surveillance, and on-site disaster traces, this study systematically revealed the multi-factor synergistic evolution mechanism and disaster-causing process of the downburst event in the central of Guizhou on 4 May 2025. The main conclusions are as follows.
The intense echo core (60 dBZ) rapidly descended from 6–8 to 2–4 km (08:23–08:44), and reached its lowest altitude (near 2 km) between 08:29–08:34, which corresponded to the occurrence time of maximum ground extremely wind speed (34.7 m s−1), verifying the temporal sequence law of “strong echo steep descent-ground wind disaster”. A ZDR high-value zone (2 dB) appeared at 2–4 km below the 0° layer (5 km), indicating dominance of flattened water droplets formed by melting ice particles, which enhanced the near-surface cooling effect. The downward extension of the negative VEL zone in the middle layer (4–8 km) triggered the expansion of the near-ground positive VEL zone, forming a dynamic structure of “middle layer descending initiation-ground divergence”. Synchronous ground elements responses included: wind speed at Station R7676 jumping from 0.8 to 34.7 m s−1 within 6 min, and the wind direction abruptly shifting from northeast (56° NE) to northwest (270° NW). The cold pool outflow temperature caused a sudden drop of 14.9 °C within 10 min and 5.4 hPa air pressure rose within 5 min due to thunderstorm high pressure. These three factors collectively constituted the wind-temperature-pressure coupling characteristics of the micro-downburst upon ground contact.
During the downburst period (08:00–09:00), lightning activity presented characteristics of “high cloud flash proportion (85.1 %) + strip-shaped distribution”. The dominant cloud flash resulted from cold pool hindering charge transmission to the ground (cloud-to-ground CG flashes < 25 %). High lightning density areas (> 8 flashes km−2) were distributed along the northwest-southeast direction, which is spatially and temporally coinciding with convective cell paths and intense echo core centers, verifying the coupling between charge activity and dynamic structure. The intense echo core descent of the REF (mass loading) and high-value ZDR zone (particle phase transition) jointly enhanced descent motion, triggering the “wind direction reversal + hail” phenomenon (after 08:40). Unmelted graupel particles fall to the ground with southeast winds, demonstrating the synergistic disaster-causing effect of cold pool and ice particle transport.
Radar-video-ground collaborative verification showed that from 08:18–08:32, the video recorded cyclonic rotation of the cloud anvil, advancement of the descending airflow front (with a speed exceeding that of the cloud anvil advection), and wind waves ≥ 1 m on the river surface, all of which were highly synchronized with the time sequence of radar REF intense echo touchdown (08:29–08:34) and ground extreme wind speed (08:32). Spatial matching between disaster traces and wind fields revealed: ”directional tree lodging” (east-southeast) in Zone Z4 corresponding to initial divergent wind fields (northwest wind dominance). “Wind direction quadrant switching” (northeast lodging) in Zone Z2 consistent with VEL southeast quadrant airflow, and “bidirectional damage to west-east walls” of civilian houses in zone Z5 directly reflected the wind direction reversal, verifying the coupling effect of cold pool divergence and dynamic wind fields.
The study proposed multi-factor collaborative criteria, which break through limitations of traditional single-factor identification through coupling analysis of dynamics-microphysics-surface responses, providing new insights for severe convection warning in complex terrain areas. In the future, we will integrate ground meteorological station observation data along the movement path of upstream severe convective systems in the incident area and “Sky Eye” surveillance videos to conduct quantitative correlation analysis between radar observation characteristics, surface environmental parameters, lightning activity patterns, and disaster loss severity, thereby advancing the application of multi-source data fusion in research on downburst disaster-causing mechanisms.
The dataset used in this study can be provided upon request to the corresponding author.
WAK, YD, DXL, and HDP participated in the on-site accident investigation and completed the collection and organization of relevant materials. WAK and GX were responsible for data analysis, chart plotting, and manuscript writing. LJ, JSS, and BTN were responsible for the remote retrieval and processing of minute-level data from the observation equipment side.
The contact author has declared that none of the authors has any competing interests.
Publisher's note: Copernicus Publications remains neutral with regard to jurisdictional claims made in the text, published maps, institutional affiliations, or any other geographical representation in this paper. The authors bear the ultimate responsibility for providing appropriate place names. Views expressed in the text are those of the authors and do not necessarily reflect the views of the publisher.
We would like to thank the anonymous reviewers for their constructive feedback on the article.
This work was supported by Guizhou Provincial Basic Research Program (No. Qiankehe Jichu MS (2026)339).
This paper was edited by Ankit Agarwal and reviewed by two anonymous referees.
Atkins, N. T. and Wakimoto, R. M.: Wet Microburst Activity over the Southeastern United States: Implications for Forecasting, Weather Forecast., 6, 470–482, https://doi.org/10.1175/1520-0434(1991)006<0470:WMAOTS>2.0.CO;2, 1960.
Fu, D. H. and Guo, X. L.: Numerical study on a severe downburst-producing thunderstorm on 23 August 200l in Beijing, Adv. Atmos. Sci., 24, 227–238, https://doi.org/10.1007/s00376-007-0227-2, 2007.
Fujita, T. T.: Spearhead echo and downburst near the approach end of a John F. Kennedy Airport runway, New York City, Contractor Report (CR), NASA-CR-146561/SMRP-RP-137, Meteorology and Climatology, 1976.
Fujita, T. T.: Tornadoes and downbursts in the context of generalized planetary scales, J. Atmos. Sci, 38, 1511–1534, https://doi.org/10.1175/1520-0469(1981)038<1511:TADITC>2.0.CO;2, 1981.
Fujita, T. T. and Byers, H. R.: Spearhead Echo and Downburst in the Crash of an Airliner, Mon. Weather Rev., 105, 129–146, https://doi.org/10.1175/1520-0493(1977)105<0129:SEADIT>2.0.CO;2, 1977.
Gu, X. L., Xiao, W. X., and Tu, X. P.: A comparative study on environmental conditions and doppler radar echo characteristics of two downburst events in Ningbo, Torrential Rain and Disasters, 44, 340–351, https://doi.org/10.12406/byzh.2023-157, 2025.
Jia, J.: Tree windthrow analysis under combined action of steady wind and gust, Journal of Zhejiang A&F University, 31, 604–610, https://doi.org/10.11833/j.issn.2095-0756.2014.04.017, 2014.
Laroche, S.: Doppler weather radar: principles and applications, Atmos. Res., 63, 159–160, https://doi.org/10.1016/S0169-8095(02)00024-8, 2002.
Mahale, V. N., Zhang, G., and Xue, M.: Characterization of the 14 June 2011 Norman, Oklahoma, Downburst through Dual-Polarization Radar Observations and Hydrometeor Classification, J. Appl. Meteorol. Clim., 55, 2635–2655, https://doi.org/10.1175/JAMC-D-16-0062.1, 2016.
Meng, Z. Y., Yao, D., Bai, L. Q., Zheng, Y. G., and Xue, M.: Wind estimation around the shipwreck of Oriental Star based on field damage surveys and radar observations, Sci. Bull., 61, 797–798, https://doi.org/10.1007/s11434-016-1005-2, 2016.
Orf, L. G. and Anderson, J. R.: A Numerical Study of Traveling Microbursts, Mon. Weather Rev., 127, 1244–1258, https://doi.org/10.1175/1520-0493(1999)127<1244:ANSOTM>2.0.CO;2, 1999.
Proctor, F. H.: Numerical Simulations of an Isolated Microburst. Part II: Sensitivity Experiments, J. Atmos. Sci., 46, 2143–2165, https://doi.org/10.1175/1520-0469(1989)046<2143:NSOAIM>2.0.CO;2, 1989.
Shi, T., Yang, Y., Lu, G., Zheng, Z., Zi, Y., Tian, Y., Liu, L., and Lolli, S.: Urban underlying surface modulates summertime thunderstorm processes and associated lightning activities, Atmos. Chem. Phys., 25, 9219–9234, https://doi.org/10.5194/acp-25-9219-2025, 2025.
Wakimoto, R. M.: Convectively Driven High Wind Events, in: Severe Convective Storms, Meteorological Monographs, edited by: Doswell, C. A., American Meteorological Society, Boston, MA, https://doi.org/10.1007/978-1-935704-06-5_7, 2001.
Wakimoto, R. M. and Bringi, V. N.: Dual-polarization observations of microbursts associated with intense convection: The 20 July storm during the MIST project, Mon. Weather Rev., 116, 1521–1539, https://doi.org/10.1175/1520-0493(1988)116<1521:DPOOMA>2.0.CO;2, 1988.
Wang, X. M., Yu, X. D., Fei, H. Y., Liu, X. L., and Zhu, H.: A review of downburst genesis mechanism and warning, Meteor. Mon., 49, 129–145, https://doi.org/10.7519/j.issn.1000-0526.2022.100301, 2023.
Xu, Q., Gu, H. D., and Qiu, C. G.: Simple Adjoint Retrievals of Wet-Microburst Winds and Gust-Front Winds from Single-Doppler Radar Data, J. Appl. Meteorol., 40, 1485–1499, https://doi.org/10.1175/1520-0450(2001)040<1485:SAROWM>2.0.CO;2, 2001.
Zhai, L. P., Nong, M. S., Liang, W. L., and Lai, Z. Q.: Observational Analysis of a Supercell Storm Causing Extreme Gale in Lingui, Torrential Rain and Disasters, 38, 346–353, https://doi.org/10.3969/j.issn.1004-9045.2019.04.007, 2019.
Zheng, Y. G., Tian, H. Y., Meng, Z. Y., Xu, M., Yao, D., Bai, L. Q., Zhou, X. X., Mao, X., and Wang, M. J.: Survey and Multi-Scale Characteristics of Wind Damage Caused by Convective Storms in the Surrounding Area of the Capsizing Accident of Cruise Ship “Dongfangzhixing”, Meteor. Mon., 42, 1–13, https://doi.org/10.7519/j.issn.1000-0526.2016.01.001, 2016.