the Creative Commons Attribution 4.0 License.
the Creative Commons Attribution 4.0 License.
 | 20 Mar 2026
Characterizing geologic and climatic controls on rockfall hazards using an inventory and integrated kinematic and runout model: Skagway, Alaska, USA
Ian D. Wachino
Reuben Cash
Annette I. Patton
Rockfall is common in steep terrain and poses a hazard to nearby communities. While rockfall triggering mechanisms are highly variable and difficult to quantify, the susceptibility of rock slopes to planar, wedge, or toppling failure can be readily assessed using kinematic analysis. As such, valley slopes with favourable joint orientations exhibit high rockfall susceptibility although the potential for rockfall runout to impact infrastructure and public safety depends on the morphology of downslope terrain. Integrating rockfall susceptibility and runout models with maps of talus deposits accumulated from past rockfall events is an effective combination of tools to inform mitigation but can be difficult to accomplish across extensive areas. Here, we combine these methods with a rockfall inventory spanning 2005 to 2022 to assess geologic and climate controls on rockfall activity in the steep and forested postglacial valleys proximal to Skagway, Alaska, where recent rockfall activity has imperilled public safety, infrastructure, and tourism. The inventory reveals rockfall activity throughout the year with peak activity in early spring that coincides with a rapid rise in minimum daily temperatures. Our field investigations identified two steeply dipping orthogonal joint sets that favour toppling failure along NW-facing hillslopes in the lower Skagway River valley as well as the NW-facing valleys that bound nearby Dyea Bay and Nahku Bay. We used new and existing lidar data and 405 field-derived joint orientations to inform a kinematic toppling failure model that identifies source zones upslope of abundant talus slopes that we mapped from field observations and lidar analyses. We coupled the predicted source zones with RAMMS:Rockfall to simulate 197 800 rockfall runout events for scenarios with varying block size and ground cover. The runout predictions highlight zones of low and high rockfall propagation susceptibility that are negatively correlated with hillslope roughness which results from the combined influence of joint orientations that generate bedrock benches and the spatial pattern of glacial erosion. High-hazard segments of the ridgeline exhibit distinct bedrock cliffs and slope-spanning talus slopes that result from the accumulation of rockfall activity over millennia. Taken together, our findings illustrate past controls on rockfall location and timing to inform mitigative measures.
- Article
(16096 KB) - Full-text XML
-
Supplement
(393 KB) - BibTeX
- EndNote


In steep, rocky landscapes, the detachment and downslope movement of discrete rock fragments (i.e., rockfall) can occur frequently and poses a significant hazard to proximal communities and infrastructure (Hungr et al., 2014). Rockfall activity has been attributed to an array of highly disparate conditioning and triggering processes, including precipitation, frost weathering, insolation, seismic activity, and slope modification (Collins and Stock, 2016; Rosser and Massey, 2022). In Yosemite Valley, California, for example, rockfall triggers include rainfall events, snow melt, and freeze-thaw action that can increase pressure along joints (Stock et al., 2011; Wieczorek and Jäger, 1996). Furthermore, rockfalls in Yosemite Valley may also be triggered on warm summer days by cyclic solar heating, which can propagate exfoliation fractures and lead to detachment (Collins and Stock, 2016). In the European Alps, warming and permafrost degradation have been implicated in significant increases in rockfall activity (Allen and Huggel, 2013; Bajni et al., 2021; Bodin et al., 2015; Paranunzio et al., 2015, 2016). Despite significant progress in characterizing rockfall triggering mechanisms, prediction of rockfall timing and location has limited ability to inform warning systems (Rosser and Massey, 2022). Precursory rock deformation can signal future activity (Abellán et al., 2010; Rosser et al., 2007; Royán et al., 2014), but current methods to quantify precursor deformation across extensive areas composed of steep, high-relief surfaces are limited and oftentimes rockfall occurs without prior deformation (Abellán et al., 2011). As a result, identifying rock slopes with the propensity to generate rockfall, often referred to as rockfall source areas, is a key first step in mitigating rockfall hazards.
A wide array of methods has been proposed to assess the extent to which hillslopes are prone to rockfall activity. Delineating potential source zones (e.g., Loye et al., 2009) can be accomplished from direct observation of past events, which assumes the location of past detachments coincides with the likely location of future rockfall activity (Luckman, 1976; Matsuoka and Sakai, 1999; Rapp, 1960; Whalley, 1984). Source zones can also be inferred from distinctive evidence such as talus and scree deposits that have accumulated below cliff faces (Borella et al., 2019; Frattini et al., 2008; Moore et al., 2009; Stock and Collins, 2014). Coupled assessment of rock slope morphology and the properties of potential source zones is another common approach that uses digital elevation models (DEMs) for assessing source zones over large areas (Frattini et al., 2008; Guzzetti et al., 2003; Messenzehl et al., 2017; Samodra et al., 2016), while more data-intensive and physically-based deformation models can be used for slope-scale analyses (Matasci et al., 2018). In the absence of rock structure data, some studies (e.g., Guerriero et al., 2024) have applied morphologic criteria (e.g., slope and curvature thresholds) to DEMs to identify anomalous rock slope protrusions that are likely to experience rockfall events (Aksoy and Ercanoglu, 2006; Frattini et al., 2008; Guzzetti et al., 2003; Marquínez et al., 2003; Sarro et al., 2025). Taken together, these studies suggest that the approach to rockfall characterization is highly dependent on the availability of data, expansiveness of the study area, and the desired level of confidence.
Because rockfall is typically localized along bedding planes, fractures, or joints, collectively referred to as discontinuities, susceptibility can also be evaluated by determining the geometry of these planes of weakness with respect to the slope and orientation of rock slopes. Kinematic analysis identifies blocks that can experience instability according to sliding, toppling, or wedge failure criteria as determined by the geometry of rock slopes and discontinuities (Fig. 1) (Bovis and Evans, 1996; Wyllie and Mah, 2004). Combining high-resolution DEMs with rock structure data can inform kinematic analyses and determine the relative likelihood (often defined as susceptibility) of different failure modes across extensive study areas (Grant et al., 2016; Günther, 2003; Kundu et al., 2023; Meentemeyer and Moody, 2000; Stock and Collins, 2014). Recent applications of kinematic analysis leverage lidar or photogrammetry to extract bedrock discontinuity data and test kinematic failure criteria on complex slope geometries, like overhanging rock quarries (Fanos and Pradhan, 2018; Gigli et al., 2022). Increasingly, the acquisition of discontinuity data is accomplished using automated analysis of point cloud data acquired from terrestrial laser scanning (TLS) (Matasci et al., 2018) or lidar or photogrammetry acquired from uncrewed aerial systems (UAS) (Utlu et al., 2023). These approaches are powerful but can be challenging to implement across large areas characterized by steep, rocky forested slopes where the details of rock structure are often obscured by vegetation.
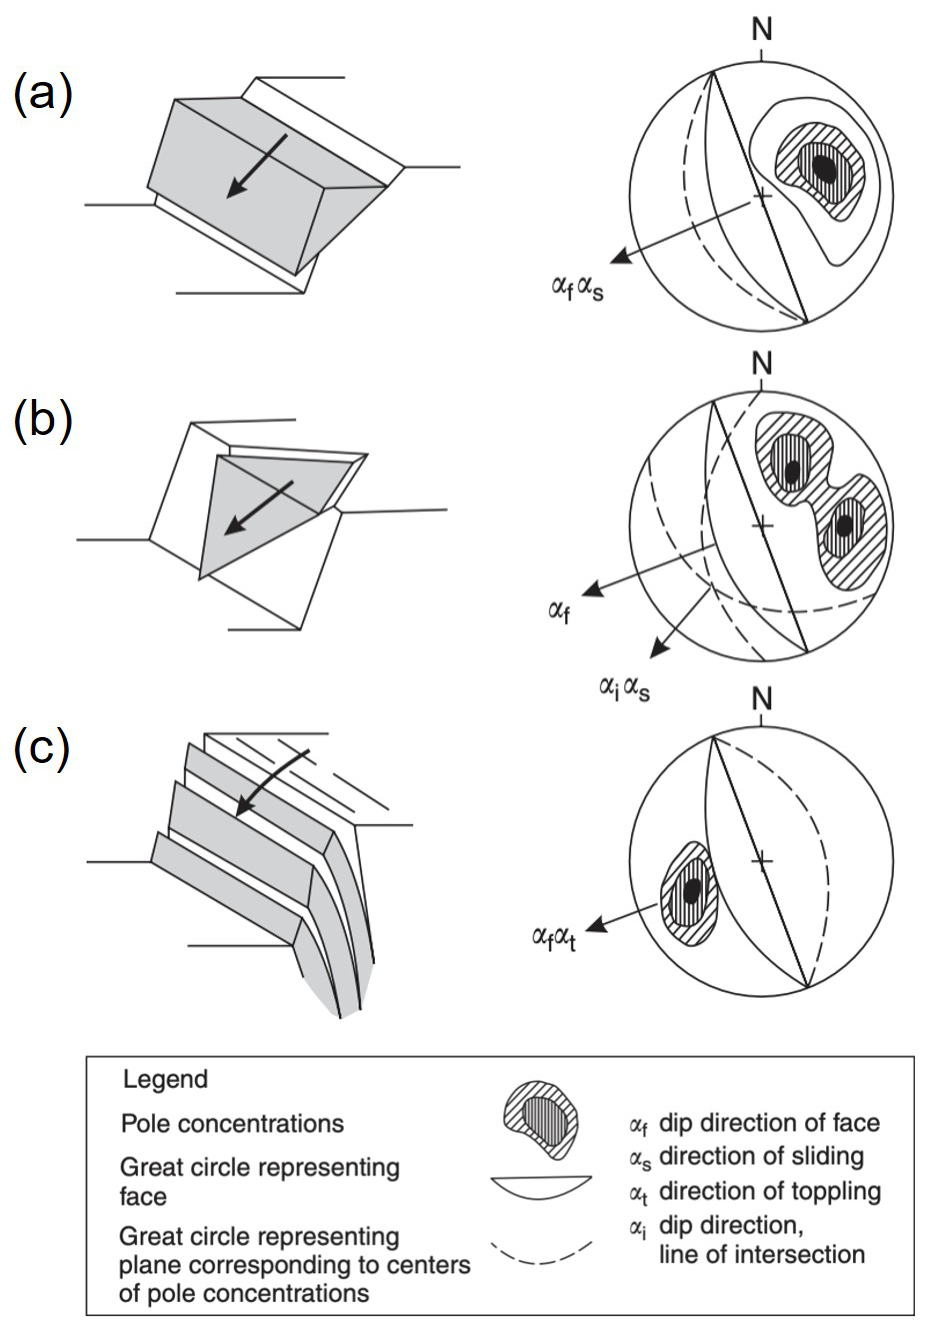
Figure 1Schematic and corresponding stereonet representations of common rock slope failure modes: (a) planar sliding, (b) wedge, and (c) toppling. On the stereonet plots, the rock slope face orientation is represented by a solid black line, and poles to planar discontinuities that meet conditions for failure are shown in shaded contours. Dashed lines represent planes of these discontinuities. Modified from Wyllie and Mah (2004).
Initially, rock fragments move via creep, sliding, toppling, or falling before traveling downslope by following ballistic paths, sliding, and rolling across rocky or talus slopes until stopping when sufficient energy dissipation has occurred via impacts and/or friction (Caviezel et al., 2021). Computational rockfall runout models that account for the physics of these rockfall processes can estimate the trajectories and kinetic energy of falling rocks to determine potential downslope impacts (Dorren et al., 2007; Lu et al., 2021; Scheidl et al., 2020). Many DEM-based tools exist with a range of parameterization options to perform physically-based rockfall simulations and predict the path of rocks over complex terrain and across variable land cover (Lu et al., 2021; Moos et al., 2021). These models have been successfully employed to mitigate rockfall hazards with diversion and attenuation structures, development setbacks, signage, or other means, in a variety of settings, including mines and national parks (Guerriero et al., 2024; Klimeš et al., 2024; Stock and Collins, 2014; Stoffel et al., 2024). As a result, the risk associated with rockfall activity can be reduced even though accurate prediction of triggering events remains elusive (Rosser and Massey, 2022).
Although rockfall activity occurs in a wide range of geologic and climatic settings, it is particularly commonplace in post-glacial landscapes owing to glacial erosion that alters near-surface stresses, fracture density, topographic variations from glacial erosion, and changes in environmental conditions that occur in the wake of retreating glaciers (Ballantyne, 2002; Leith et al., 2014). In particular, the spatial pattern of glacial erosion can align with the fabric of bedrock discontinuities and set up failure-prone conditions across extensive areas. As such, relatively small changes in the orientation and geometry of glacial valleys relative to the orientation of discontinuities can result in significant and systematic variations in rockfall susceptibility. Although rockfall runout susceptibility is often simulated, the terrain characteristics that govern why and where rockfall events tend to propagate long distances and pose risks downslope are seldom quantified. Rather most studies focus on rockfall source areas whereas hillslope morphology and characteristics may impart a underappreciated role in regulating runout pathways. As a result, geologic and geomorphic controls on rockfall hazard potential are typically not well understood, which prevents us from addressing basic research and applied hypotheses such as how the magnitude and frequency of events accumulate and contribute to mountain-scale erosion and how post-glacial slope morphology affects the efficacy of mitigation efforts (Barlow et al., 2012; Corominas et al., 2014; Hales and Roering, 2007; Hungr et al., 1999; Moore et al., 2009; Rosser and Massey, 2022).
Rockfall activity is common across much of Southeast Alaska but has been particularly acute in the Municipality of Skagway, which is situated in a narrow, glacially carved valley herein referred to as the “Skagway River valley” and hosts vigorous cruise ship tourism from late spring to early fall. Indigenous knowledge of avalanches in the area has been established (Thornton, 2010) and documentation of rockfall activity in Skagway by colonial settlers began in the late 1800s when gold prospecting fuelled the establishment of the town. Following decades of sporadic activity, several large rockfall events in summer 2022 impacted cruise docks along Skagway Harbor and generated renewed concern about the extent and scope of rockfall hazards in the area. In particular, the extent and timing of past rockfall activity is not well known and the susceptibility of rockfall initiation and runout in the area, and particularly along a ∼ 5 km long ridgeline that abuts the harbour, town centre, and railroad, has not been characterized. This study area affords an opportunity to explore novel approaches to combining kinematic and runout models to assess how glacial erosion and bedrock properties modulate the spatial pattern of rockfall hazard. In this contribution, we summarize a rockfall inventory and geologic data that reflects the distribution and timing of past rockfall activity, document rock structure data from field observations, and synthesize new and existing lidar data from airborne and UAS platforms to inform an integrated kinematic analysis susceptibility and dynamic runout model. Our findings establish the pervasive imprint of rockfall activity along slopes oriented to promote toppling failure and demonstrates how slope morphology determines rockfall propagation susceptibility. We highlight how the pattern of glacial erosion resulted in substantial rockfall erosion and cliff retreat along favourably oriented slopes while unfavourably oriented slopes experienced minimal modification since glacial retreat. Our integrated mapping and modelling approach suggests that postglacial feedbacks between rock structure and hillslope evolution can generate strong variability in potential rockfall impacts and thus inform current mitigation efforts and anticipate future needs.
2.1 Geology and glacial history
Near the northern extent of the Alaska Panhandle, Skagway is situated in the Taiya Inlet atop deltaic and fluvial deposits near the outlet of a deep fjord (Fig. 2). The surrounding terrain is steep and rugged, composed of Tertiary granodiorite of the Coast Range Batholith, a belt of plutonic and metamorphic rocks that extends to northern Washington (Yehle and Lemke, 1972). Deformation in southeastern Alaska and southwest Yukon is governed by the subduction and translation of the Pacific-Yakutat plates relative to the North American plate in the St. Elias region (Biegel et al., 2024). The Eastern Denali Fault and the Chatham strait fault lineaments, both strike-slip fault systems, meet just south of Skagway (Choi et al., 2021). Deformation associated with these structures appears to impart a significant influence on the orientation of glacial valleys, as fjords in the area tend to be linear, striking north and northeasterly (Yehle and Lemke, 1972). A dam reconnaissance study focused on West Creek, a drainage just 9 km northwest of Skagway, identified three joint sets in the granodiorite bedrock, including two abundant sets with northeast-strike and vertical or steep dips to the south, and one less abundant set with northwest-strike and a consistent vertical dip (Callahan and Wayland, 1965). That study also noted the coincident orientation of topographic lineations in the area and the strike of joints interpreted to be splays from the Chatham strait lineament, which is related to the nearly 3000 km long Denali fault system. Spacing between the joints is variable, ranging from 1 to 4 m, and the joints do not exhibit slickensides or cataclastic fabric (Fig. 3a–c). Sheeting joints in granodiorite observed near the tops of glaciated ridges are slightly curved or irregular, tend to parallel the ground surface, and spaced from 1 to 2 m apart at the surface. Regional studies of glacial history imply that the most recent episode of major glacial retreat and valley exposure in Skagway occurred 10 to 12 ka (Baichtal et al., 2021; Menounos et al., 2017) and icefields persist today in nearby inland valleys. The steep slopes around Skagway are generally devoid of glacial till owing to post-retreat erosion and deposition in valley floors in the form of alluvial fans and colluvial deposits.

Figure 2Study area. (a) Oblique view looking N-NE into Skagway River valley, Alaska. Note active rockfall along the NW-facing ridgeline and escarpment above the harbour and cruise ship docks. Use of Imagery © 2025 USGS, Map data © 2025 Google permitted for non-commercial use. (b) Oblique view from AB Ridge looking SE across Skagway towards the NW-facing ridgeline and escarpment. This undated and uncredited historic image postdates the late 1890s construction of the current Skagway City Hall and Museum (photo provided by Andrew Beierly). Local steep cliff faces with fresh bedrock exposure signify active rockfall. Note the lack of vegetation and the sharp bedrock escarpment along the crest of the ridgeline and the abundance of active talus slopes that connect to the harbour.

Figure 3Images (a, b) of open joints and incipient toppling along the bedrock escarpment on the NW-facing ridgeline above Skagway Harbor. (c) Image of joint orientations along shore of Nahku Bay. (d) Schematic of toppling prone hillside with opening joints and talus accumulation modified from Wyllie and Mah (2004). Photos (a), (b), and (c) by Ian D. Wachino and Joshua J. Roering.
2.2 Climate and vegetation
Currently, Skagway experiences a subarctic maritime climate, characterized by cool summers and cold, snowy winters. Current average summer temperatures range from 10 to 21 °C, with occasional rainfall, and winter temperatures range from −12 to −1 °C, with heavy snowfall, and freezing conditions (Western Regional Climate Center, 2025). High winds that funnel up the Taiya Inlet are common and for decades it was reported that Skagway's name originated from Lingít words describing north winds (Thornton, 2010) although recent research concludes that the name derives from a contraction of “Áa Wushigagu Ye”, which translates as “the Place with Solid Core Trees” (X'unei Lance Twitchell, personal communication, 2024). Compared to other areas in SE Alaska, Skagway receives relatively low annual precipitation (mean annual precipitation is 1.1 m) owing to the rain shadow imposed by the bounding coastal ranges to the south (Daly et al., 2018). Atmospheric rivers account for nearly 70 % of annual rainfall in Skagway and intense precipitation associated with these phenomena occur with highest frequency and intensity from August to October (Nash et al., 2024). Skagway hosts a coastal rainforest of spruce (Picea sitchensis), pine (Pius contorta), and cedar (Chamaecyparis nootkatensis) trees with dense underbrush at low elevations (under 1000 m above sea level) and high-alpine tundra above tree line (Harris and Farr, 1974). Historical photographs and descriptions suggest that forests covering the slopes perched above Skagway Harbor and township were disturbed through timber harvest and burning in the early 1900s (Wright et al., 2021).
2.3 Historic rockfall activity
Early Western descriptions of rockfall activity in Skagway tend to focus on impacts to the harbour and railroad, including a series of events in 1901 that recorded burial of the tracks near the approach to the wharf (The Daily Alaskan, 1901). The location of this event coincides with the steep rocky slopes above Skagway Harbor, which have generated numerous rockfalls since that account (Fig. 2). A study of geologic hazards in Skagway noted the striking linearity of N- and NE-oriented fjords and valleys and identified abundant actively eroding bedrock escarpments on a NW-facing ridgeline that coincides with a zone of historic rockfall activity adjacent to the township and harbour (Yehle and Lemke, 1972). Downslope of these escarpments are colluvial deposits, consisting of landslide deposits, including talus from historic rockfall events. The abundance and extent of these deposits implies significant slope adjustment and retreat since glacial retreat and the relative activity of the deposits is reflected by the relative abundance of vegetation cover (Ruffner and Abrams, 1998; van Steijn, 2002). Across the valley on the western side of Skagway, these talus deposits are much less prevalent, and the Yehle and Lemke (1972) maps do not indicate the presence of erosional escarpments.
Rockfall hazard mitigation in the area is currently focused on the active rockfall source areas above the cruise ship dock in Skagway Harbor. On June 23, 2022, rocks detached from the eastern ridgeline and impacted the cruise ship dock where pedestrian traffic is frequent (Munson, 2022b). Two more rockfall events originating in the rocky slopes above the harbour followed in rapid succession on 3 and 5 August 2022 (Munson, 2022a). Engineering efforts have been completed, which include wrapping rock mesh covers over source areas, installing attenuator nets to block falling rocks, and scaling loose rocks (Brennan and Whistler, 2022). Instrumentation has been installed to monitor the source area, including extensometers installed at the top of the slope, which show that movement in the slide mass has increased from 4 to 6.5 cm yr−1 as of 2022 (Brennan and Whistler, 2022). Notably, the small section of rocky slopes above Skagway's cruise ship dock is a small fraction of the roughly 5 km long stretch of ridgeline that borders the eastern margin of Skagway. Rocky escarpments and talus deposits have been noted along the entire ridge (Yehle and Lemke, 1972), including the “Cemetery Slide”, a rockfall source area and runout zone stripped of vegetation by falling debris, which is similar to the active source areas above the cruise ship dock. Although these zones of localized activity are well known, forest cover obscures the geologic and topographic signature of past rockfall activity along the remainder of the ridge such that the pattern of relative susceptibility and runout remains ambiguous.
3.1 Overview
Motivated by renewed rockfall activity, this study seeks to identify areas susceptible to rockfall initiation and runout within the steep, post-glacial valleys around Skagway. Our analysis extends to the west of Skagway along Dyea Road to the Taiya River, which hosts the Lingít settlement of Dyea and the Chilkoot Trailhead. Dyea Road is a well-travelled corridor that also provides the opportunity to test our methodology across a wider range of topographic and structural configurations (Fig. 4).

Figure 4Location map of Skagway, Nahku Bay, and Dyea Road showing a merged hillshade image of the 2014 airborne and 2023 UAS lidar bare earth data. White lines denote roads and the thick black line denotes a section of White Pass Railroad and cruise ship dock used for our rockfall runout susceptibility analyses. The 2023 UAS lidar data was acquired along the ridge southeast of the railroad while the 2014 airborne lidar accounted for the remainder of the study area imagery shown here. Location of Fig. 5 is shown by black/white filled dot. Background image from USGS NAIP (National Agriculture Imagery Program).
3.2 Rockfall inventory
To investigate controls on rockfall timing, we accessed data generated for rockfall events between 2005 and 2022 from the GeoEvent Slope Stability Database generated by the Alaska Department of Transportation & Public Facilities (AKDOT&PF) Geotechnical Asset Management Program (Thompson, 2017). This database includes AKDOT&PF maintenance and operations reports, including the location, date, event type (e.g., debris flows, rockfalls, landslides, snow avalanches, flooding), relative magnitude, and cost, of slope processes that impact the Alaska highway system. Notably, this database does not include information for activity along the White Pass Railroad that abuts the rockfall-prone ridgeline along the eastern margin of Skagway. Nonetheless, it includes 866 rockfall event reports along segments of Skagway-Dyea Road and Klondike Highway within our study area (Fig. 4) that enabled us to assess climatic controls on rockfall activity. We aggregated rockfall events according to Julian day to investigate seasonal trends in activity over the 17-year record. For climate context and comparison, we accessed Skagway Airport (PAGY) mean daily rainfall and mean daily maximum and minimum temperature data for 2005 to 2025 (Horel et al., 2002).
3.3 High-resolution topography: Airborne and UAS lidar
Our analysis used two sources of lidar data to inform geomorphic and bedrock mapping, kinematic analysis, and runout modelling. We used a 2014 airborne lidar dataset with an average ground classified point density of 4.6 m−2 acquired by the Alaska Department of Geological and Geophysical Surveys (DGGS Staff, 2013) which includes low-elevation terrain in the Skagway River valley, Nahku Bay, and part of Dyea valley (Macpherson et al., 2014). Because this lidar acquisition does not span a significant portion of Skagway's rockfall-prone east ridge that abuts the township and harbour, we conducted a UAS lidar survey in 2023 (Fig. 4). We acquired lidar data across the 2.3 km2 area with peak elevations of 220 m near the cruise ship docks and 320 m near the northern extent of the ridgeline (Roering et al., 2025). For the acquisition, the NSF RAPID facility used a Trinity F90+ fixed wing drone with a Qube 240 lidar payload to fly ∼ 120 m above ground with 90 % coverage overlap. The surveyed area was slightly abbreviated due to a patch of extremely steep terrain where the UAS could not be flown safely at distances sufficiently close to the ground surface to acquire data. The UAS survey produced a point cloud containing 650 million total points with 200 million ground classified points, giving an average ground point density of 43 m−2. We used the ground points to create a 1 m DEM using Cloud Compare (version 2.12.3) and combined it with the 2014 airborne lidar data to provide a continuous lidar coverage for our analyses (Fig. 4).
3.4 Geomorphic mapping
We used field observations, historic photographs, and slope thresholds and surface texture from the combined lidar DEM to identify and map talus deposits that reflect the accumulation of rockfall deposits. These talus deposits include both forested and unforested occurrences. To define the characteristic slope angles associated with active talus slopes we measured slope angles from 20 to 45° that coincide with mapped talus deposits along the eastern ridge. Slopes steeper than 45° tend to correspond with bedrock cliffs and outcrops, whereas slopes gentler than 20° often reflect relatively uneroded bedrock surfaces or deposits from fluvial or other mass wasting processes. The relatively smooth texture of accumulated rockfall deposits identified with hillshade and slopeshade layers (Burns and Madin, 2009) was also used to identify active talus slopes as well as bedrock cliffs or outcrops that constitute a rockfall source area. Talus deposits occur on a wide range of scales and for this analysis we focused on mapping patches of talus with area > 100 m2 to ensure accuracy and highlight zones of significant activity (Fig. 5). Specifically, we identified terrain that exhibits the relevant slope values as well as surface textures consistent with talus deposits and then mapped polygons that enclose these zones when their areas exceeded 100 m2. The polygons were often separated by bedrock outcrops, gullies, and anthropogenic features.
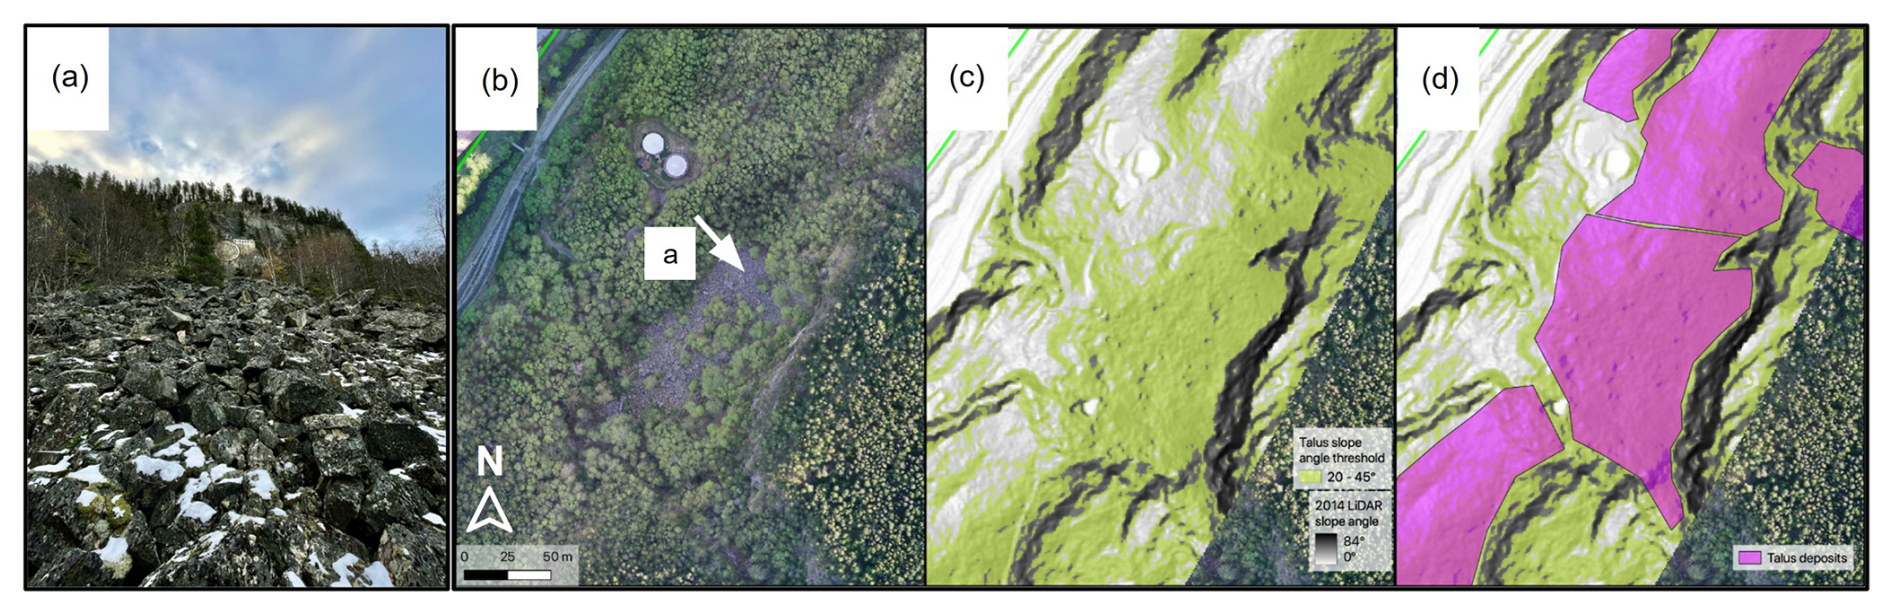
Figure 5Field images and lidar mapping of talus mantled slopes. (a) View looking SE along an exposed talus deposit with boulder sized blocks at the base of a 40 m cliff known as Kirmse's Cliff (lat: 59.45251, long: −135.31147). (b) Aerial imagery from 2023 UAS survey showing a talus deposit and bedrock cliff, white arrow shows view direction for panel (a). (c) Terrain within the slope angle range of 20–45° colored in light green, and (d) map of talus polygons (pink) generated from lidar slope shade and slope angle maps and orthoimagery. Hillshades in panels (c) and (d) derived from 2023 UAS lidar data. Background image from USGS NAIP (National Agriculture Imagery Program).
3.5 Bedrock structure and discontinuities
To quantify the geometry of joints and discontinuities that contribute to rockfall initiation, we collected 405 structural measurements (specifically, the strike and dip of planes that define the interfaces) at nearly 50 locations within the study area and combined them to generate a representative sample of discontinuities for our study area (Chaminé et al., 2015; Kundu et al., 2023). The steep, forested, and uneven terrain surrounding Skagway limits access to outcrops such that strict adherence to the traditional “scanline” method (Priest and Hudson, 1981) was untenable. Furthermore, the significant forest cover and expansiveness of the study area precluded the use of ground-based laser or SfM (structure from motion) methods for acquiring structural information. Instead, we traversed the base of outcrops throughout the study area as an approximation of scanlines and measured the orientation of planar surfaces expressed in the outcrop with FieldMoveClino, a digital compass-clinometer smartphone app (Oliinyk et al., 2020), which enabled rapid and accurate data acquisition. Our measurements were acquired across a wide range of locations in the study area to characterize spatial variations in discontinuity orientations for implementation in a pixel-based kinematic analysis (Günther et al., 2012). In particular, we visited outcrops along the eastern, southern, and western corners of the study area to ensure that the full range of relevant joint orientations was represented (Chaminé et al., 2015; Chiles and Marsily, 1993; Terzaghi, 1965; Zhou et al., 2017). We identified joint clusters by converting the strike and dip of discontinuity planes to poles on stereonets and used smoothed Kamb contours with StereoNet v11 to separate clusters (Cardozo and Allmendinger, 2013).
3.6 Kinematic analysis of rockfall susceptibility
To assess the spatial pattern of rockfall susceptibility across the study area, we adopted a kinematic analysis approach with our discontinuity data and applied criteria for planar sliding and toppling failure within our combined lidar DEM. This approach foregoes the mechanical complexity and extensive parameterization of more sophisticated analyses that incorporate three-dimensional stability models and joint filling, roughness, and persistence data, (e.g., Matasci et al., 2018) in order to generate results that span an extensive area. Rather, our analysis incorporates both topography and bedrock structure data and thus provides insights beyond those provided by susceptibility criteria that are informed by simple thresholds defined by slope angle alone. Kinematic analysis requires discontinuity data that is locally representative in order determine rockfall susceptibility at locations of interest (Albarelli et al., 2021; Dorren et al., 2007; Günther et al., 2012). Traditionally, discontinuity measurements are taken in the field, whereas many modern applications extract discontinuity orientations from high-resolution point clouds of the rock slope face (Albarelli et al., 2021; Utlu et al., 2023). Field measurements remain a reliable and relevant means to capture joint orientations (Kundu et al., 2023; Zhou et al., 2017), especially in locales where terrestrial laser scans are not feasible due to hazardous terrain or where slope faces are obscured by vegetation.
As described below, the remarkable consistency of discontinuity orientations across the study area inspired this approach and therefore we invoked the entire distribution of measured joint orientations at all locations to perform the kinematic analysis. Specifically, we applied the stability criteria for each failure mode at each pixel in the merged lidar DEM by estimating the fraction of the 405 joint orientations that are predicted to be unstable given the topographic aspect and slope angle of that pixel. The failure criteria for planar and toppling failure are defined following Wyllie and Mah (2004) and described below. Essentially, this approach is equivalent to locally performing a stereonet analysis of rock slope failure across our study area and aggregating the results to identify potential rockfall failure modes and areas of high relative susceptibility. For the analysis, we used a friction angle of 40°, consistent with measured values for jointed granodiorite similar to Skagway's lithology (Alejano et al., 2019). To assess the accuracy of our modelled rockfall susceptibility maps, we visually compared our predictions to the location of recent rockfall events in Skagway, as well as mapped bedrock cliffs and talus deposits, which serve as a proxy for prior rockfall activity (Loye et al., 2009; Stock and Collins, 2014). In addition, we compared the downslope direction of talus deposits with the aspect of topple-prone slopes to assess their relative correspondence.
Planar slides occur when the inclination of a bedrock slab exceeds the friction angle and it slides along a planar discontinuity. Toppling failures occur when discontinuities steeply dipping into the rock slope face form slabs or columns of rock that rotate forward along a fixed base (Fig. 1). Two types of toppling failures can occur that are influenced by the strength of the rock mass and the geometry of discontinuities. Flexural toppling, where slabs of rock bend forward until they break in flexure, is typical in shale and slate where orthogonal jointing is not well developed. Block toppling is common in crystalline bedrock with orthogonal joint sets, where two steeply dipping joint sets form the sides of blocks, and a third set of low angle, widely spaced joints form a basal failure plane. The active rockfall source area situated above Skagway's cruise ship dock has been described as a progressive toppling failure with a stair-stepped basal feature (Brennan and Whistler, 2022). Topple failures observed in the field are consistent with this description, which is described by the block toppling failure mechanism. As a result, our analysis focuses on block toppling and planar sliding given that field observations and geotechnical reports do not identify wedge failures as a prevalent mechanism of rock slope instability. The challenge of implementing multiple discontinuity orientations required for wedge analyses across our entire study area also encouraged us to focus on block toppling and planar sliding in our analyses.
The criteria for planar, wedge, or toppling failure is based on the orientation of discontinuities and their orientation relative to the rock slope face (Wyllie and Mah, 2004). The dip direction of the discontinuity (A) and rock slope (f) is given by αA and αf, respectively, and the dip angle of the discontinuity and rock slope, both relative to horizontal, is given by ψA and ψf, respectively. The friction angle of the joint interfaces is given by ϕ.
Accordingly, a rock slope is susceptible to planar sliding failure along a discontinuity if the following three conditions are simultaneously met:
The first condition requires that the interfaces are aligned in a sufficiently similar orientation (in this case within 20°) while the second ensures that the discontinuity dip is shallower than the angle of the bedrock slope such that the discontinuity intersects or “daylights”. The third and final condition demands that the interface slope angle exceeds the angle of friction. All three conditions must be met at a given location for planar sliding to be deemed likely.
For block toppling failure, the following two conditions must be met simultaneously:
The first condition asserts that the discontinuity must dip into the rock slope face and be parallel, or nearly parallel (e.g., within 20°), to the dip direction of the slope face. The second condition indicates that the discontinuity dip must exceed the friction angle allowing for interlayer slip between the blocks. In our model, the maximum allowable dip direction deviation is ±20° for both planar slide and block toppling failure. Although this value is sometimes chosen to be ±10° for block toppling we expanded the constraint to ±20° (Cruden, 1989; Gigli et al., 2022).
Using Eqs. (1) and (2), we estimated the number of joints in our field-derived dataset (n = 405) that are predicted to exhibit planar and toppling failure, respectively, for each pixel in our merged lidar DEM. Also, by simultaneously accounting for both modes of potential failure at a given location it is possible to assess the combined susceptibility to toppling and planar sliding although we do not formally account for this possibility in our analysis. Our maps of planar and toppling failure are then calculated as the percentage of joints that meet the conditions required for failure conditions at each pixel in our study area. For example, a toppling failure index value of 0.21 for a given pixel in our DEM indicates that 21 % of the joints in our joint dataset satisfy the two conditions in Eq. (2). This approach provides a description of relative rockfall initiation susceptibility across our study area.
3.7 Rockfall runout modelling with RAMMS
To model potential runout paths associated with rock slopes that have high rockfall susceptibility, as determined by our kinematic analyses, we used the 3D rockfall simulation software RAMMS:Rockfall (https://ramms.ch/ramms-rockfall/, last access: 1 March 2026) to represent the sliding, bouncing, and rolling motion of blocks as well as the internal, gravitational, and contact forces of a rigid body that can translate and rotate. This model accounts for the energy balance (including rotational momentum) of falling rocks and has been used extensively at a range of scales for both applied and fundamental research studies (e.g., Caviezel et al., 2021; Kleinn et al., 2024; Leine et al., 2014; Lu et al., 2019; Ringenbach et al., 2023). The primary inputs required for the RAMMS:Rockfall model include digital elevation data (i.e., DEM), the location of rockfall source areas, specification of ground cover, and the shape and size of the falling blocks.
The model integration between our kinematic rockfall susceptibility analysis and the RAMMS:Rockfall simulations was accomplished using the following workflow. First, we used our merged lidar DEM, which has a 1 × 1 m pixels (Fig. 4) to generate rockfall susceptibility index values for toppling and sliding failure. Given that toppling instability dominates our study area, we identify potential source areas as pixels with toppling susceptibility values greater than 5 %. Pixels with > 5 % toppling susceptibility demarcate rocky cliffs situated above our mapped talus deposits as well as areas of recent rockfall activity in the Skagway Harbor (Fig. 5). To link the susceptibility model to our runout model, the pixels with a > 5 % high toppling susceptibility were converted to polygons and only polygons with area greater than 25 m2 were retained to eliminate small, local high-relief features like boulders and trees that can perpetrate the characteristics of rockfall source zones. Then, rockfall source points for RAMMS modelling were randomly distributed within the resulting polygon coverage with a density of 0.04 m−2 and a minimum point spacing of 5 m. The resulting 4945 points serve as our rockfall initiation source point coverage and we used these points as input for RAMMS rockfall runout modelling. This methodology follows convention used in other studies (Lu et al., 2021) and we generated an array of vector and raster output files described below.
The slopes east of Skagway are heavily forested, except in locations where falling debris has stripped vegetation, such as the cruise ship dock and at the northern extent of the eastern ridge bordering Skagway. In RAMMS, we represented forested areas as spruce alpine forests and trees were simulated in these areas using the “dense forest” category in RAMMS, which is defined by a stem density of 600 trees ha−1 with a mean diameter of 30 cm. These parameters were chosen based on our field observations and the typical density of mixed red alder coniferous stands in Southeast Alaska (Poage et al., 2007). The effect of trees in the RAMMS rockfall runout module is to attenuate energy and reduce velocity, thus constituting a significant impact on hazard potential. We mapped the distribution of trees by visually assessing the USGS NAIP imagery as well as our UAS orthoimagery. The small amount of terrain (less than 5 % of the study area) that exists outside these forested areas was set to the fine talus cover category in RAMMS, which reflects negligible ground cover atop relatively fine-grained talus deposits consistent with our field observations. We performed simulations with two land cover scenarios: (1) dense forest and (2) fine talus cover, assigned across the entire simulation area to assess the potential role of timber harvest and fire on rockfall runout and provide a conservative assessment of the hazard extent.
Consistent with previous studies, we estimated representative block size and shape by measuring the major axes of randomly selected blocks in exposed talus piles (Hales and Roering, 2007; Messenzehl and Dikau, 2017; Pérez, 1998). To estimate representative block sizes, the intermediate axis of 74 blocks was measured from field measurements and high-resolution point clouds combined with orthoimagery (Fig. S1). We determined the mean intermediate axis size to be 1.08 m while the 50th percentile was 0.66 m and the 95th percentile was 3.56 m. Blocks observed in the field are typically tabular and the characteristic geometry of blocks was estimated by measuring the long, intermediate, and short axes of 10 blocks with sufficient exposure to allow measurement using our UAS-derived point clouds. We applied the characteristic aspect ratio to the 50th percentile and 95th percentile intermediate axis values from our measurements. The dimensions of the resulting rocks used in the simulation were 0.94 m × 0.66 m × 0.37 m (medium, 50th percentile), and 5.10 m × 3.56 m × 1.99 m (large, 95th percentile), which represent moderate and large block sizes, respectively. Given the tendency for large blocks to travel longer distances, our 95th percentile blocks are intended to reflect the conservative (or long runout) scenario (Statham, 1976). For these simulations, we assumed rock density of 2700 kg m−3.
To simulate the range of potential rockfall impacts, we focused on four scenarios for RAMMS simulation with the following parameterizations: (1) 50th percentile block with fine talus cover, (2) 50th percentile block with dense forest, (3) 95th percentile blocks with fine talus cover, and (4) 50th percentile block with dense forest. To account for the stochastic nature of rockfall release, we used RAMMS to select 1 of 10 randomly chosen block orientations to be released at each source point, yielding 49 450 individual rockfall runout paths for each of the four scenarios. Our results presented here focus on the two end-member scenarios (50th percentile with dense forest cover and 95th percentile with fine-grained talus over) to illustrate the extreme range of rockfall behaviour. In particular, the 50th percentile block size and dense forest represents the most typical scenario whereas the 95th percentile and fine talus cover reflects an extreme case of large block detachments coupled with slope clear conditions that would result from burning or extensive forest harvest.
For our runout analysis, we focused on the eastern NW-facing ridgeline of the Skagway River valley to assess potential impacts to the harbour and township. We used an array of analyses to investigate rockfall runout patterns and topographic controls on the runout behaviour. First, to identify terrain with high likelihood of rockfall runout we used RAMMS to calculate the number of rockfall events that traversed each pixel in our model domain for each of the scenarios. As such, the cumulative number of rockfall passages at each pixel accounts for both the abundance of upslope source areas as well as the tendency for topography to steer or direct rockfall into particular pathways. Second, we used RAMMS to create a “digital” boundary (or barrier) coincident with the railroad tracks along the base of the ridgeline to record rockfalls that bypass the boundary and have the potential to impact the harbour and township. Third, to estimate how topographic properties moderate rockfall runout, we calculated local slope and terrain roughness across the simulation domain. Roughness was calculated as the standard deviation of local slope values within a 5 m radius window. This approach has been successfully used to differentiate the kinematics and age of landslide deposits (Booth et al., 2017; LaHusen et al., 2020) and in this case, we choose the 5 m scale to be consistent with the scale of blocks, fractures, and bedrock landforms. Finally, we generated a 5.4 km long transect coincident with the railroad within our simulation domain to quantify along-ridge variations in rockfall passages, upslope source areas, slope angle, and terrain roughness.
4.1 Rockfall inventory
The AKDOT&PF database includes 866 reports of rockfall-related maintenance and operation activities along the 10.3 km long segment of Skagway-Dyea and Klondike Hwy within our study area between 2005 and 2022 (Figs. 6, 7). This implies an average rockfall frequency of 50 events yr−1, although this value is an overestimate because some of the reports are redundant given that multiple days are reported in response to a single event. Among the events, 7 resulted in road closures that lasted 3 d or longer in March 2012, October 2012, January 2014, March 2015, February 2016, September 2016, and December 2020.
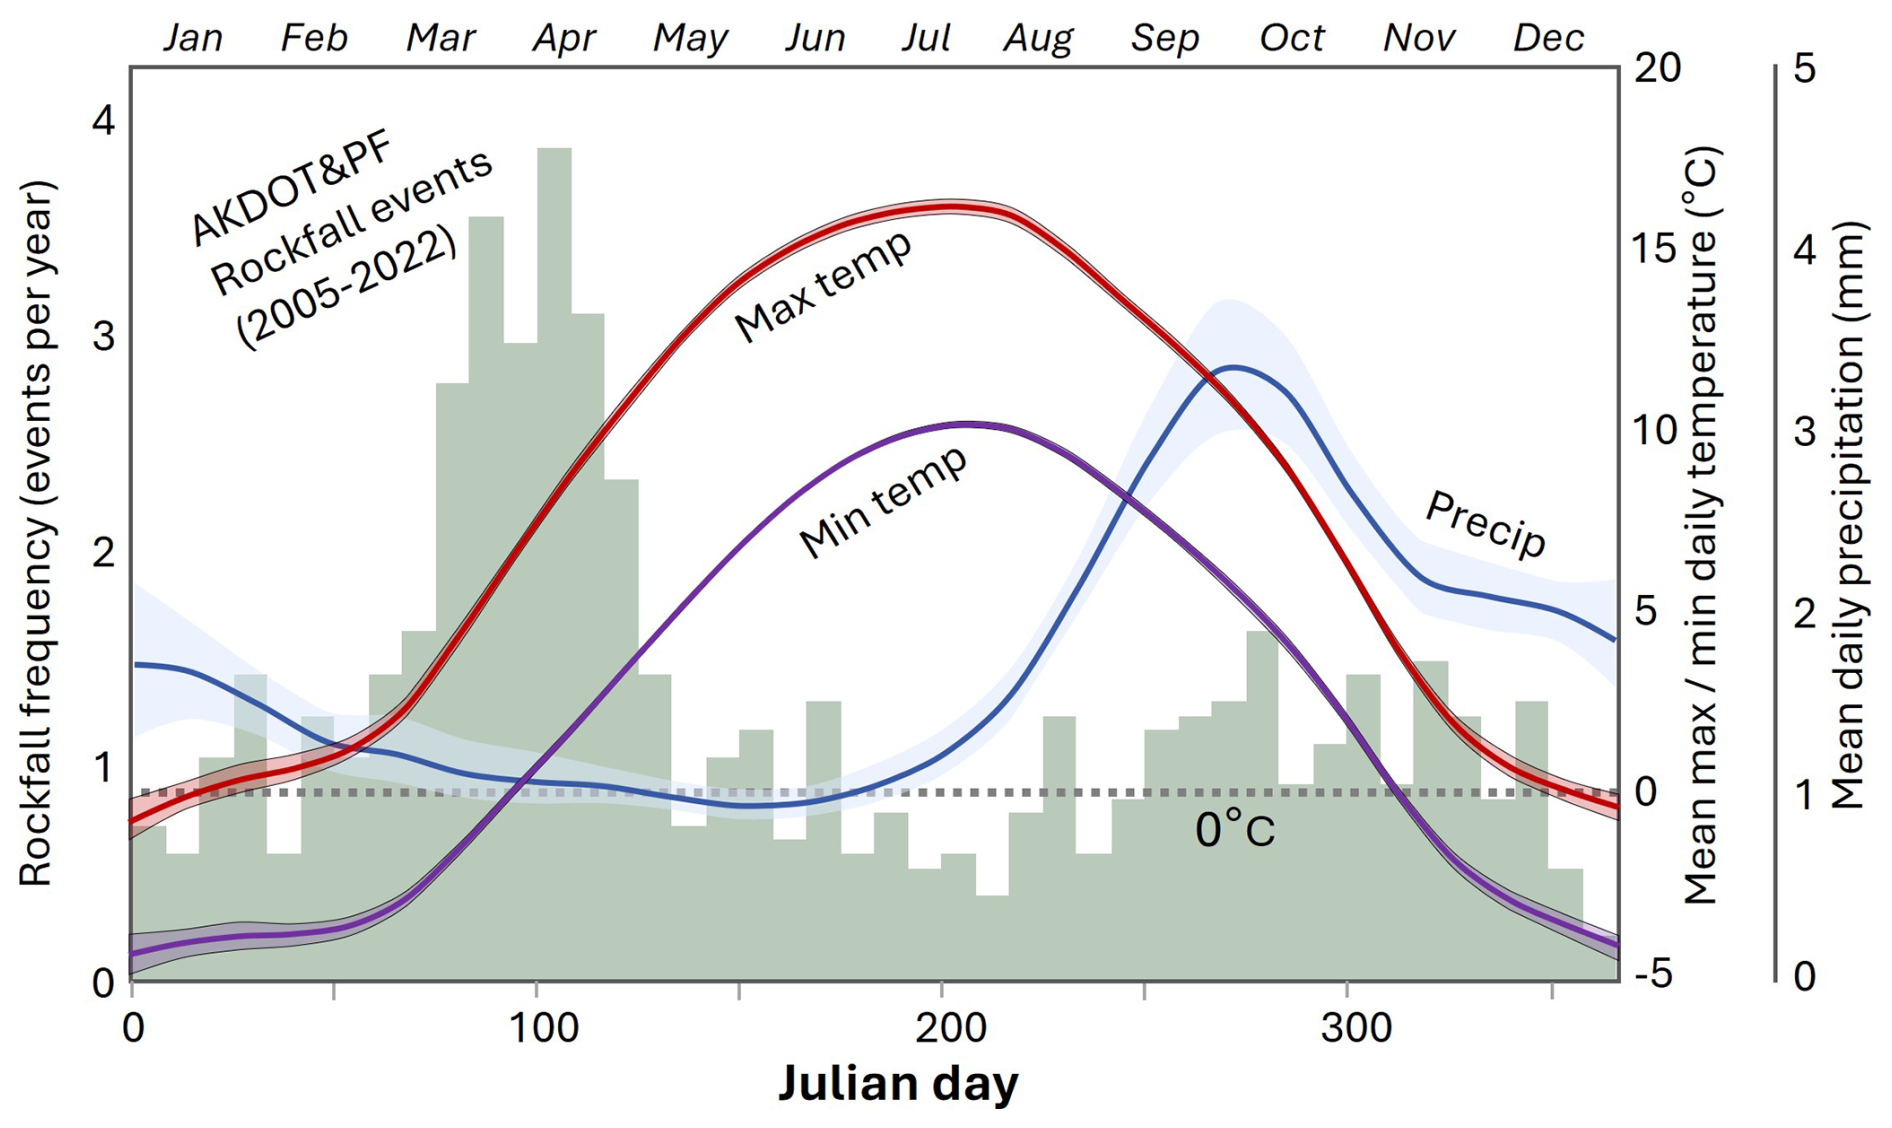
Figure 6Analysis of seasonal variation in rockfall frequency and climate variables from the AKDOT&PF geoevent database (2005–2022) and daily mean precipitation and daily maximum and minimum temperature from the Skagway Airport (PAGY) for the period 2005–2025. The number of rockfall events (green bars) exhibits seasonal variations that don't obviously align with precipitation (blue) although maximum temperature (red) and minimum temperature (purple) increase significantly during the typical period of rockfall activity in March and April. The horizontal dashed grey line represents freezing. The confidence intervals for the climate data represent standard error of mean values over the period of record.
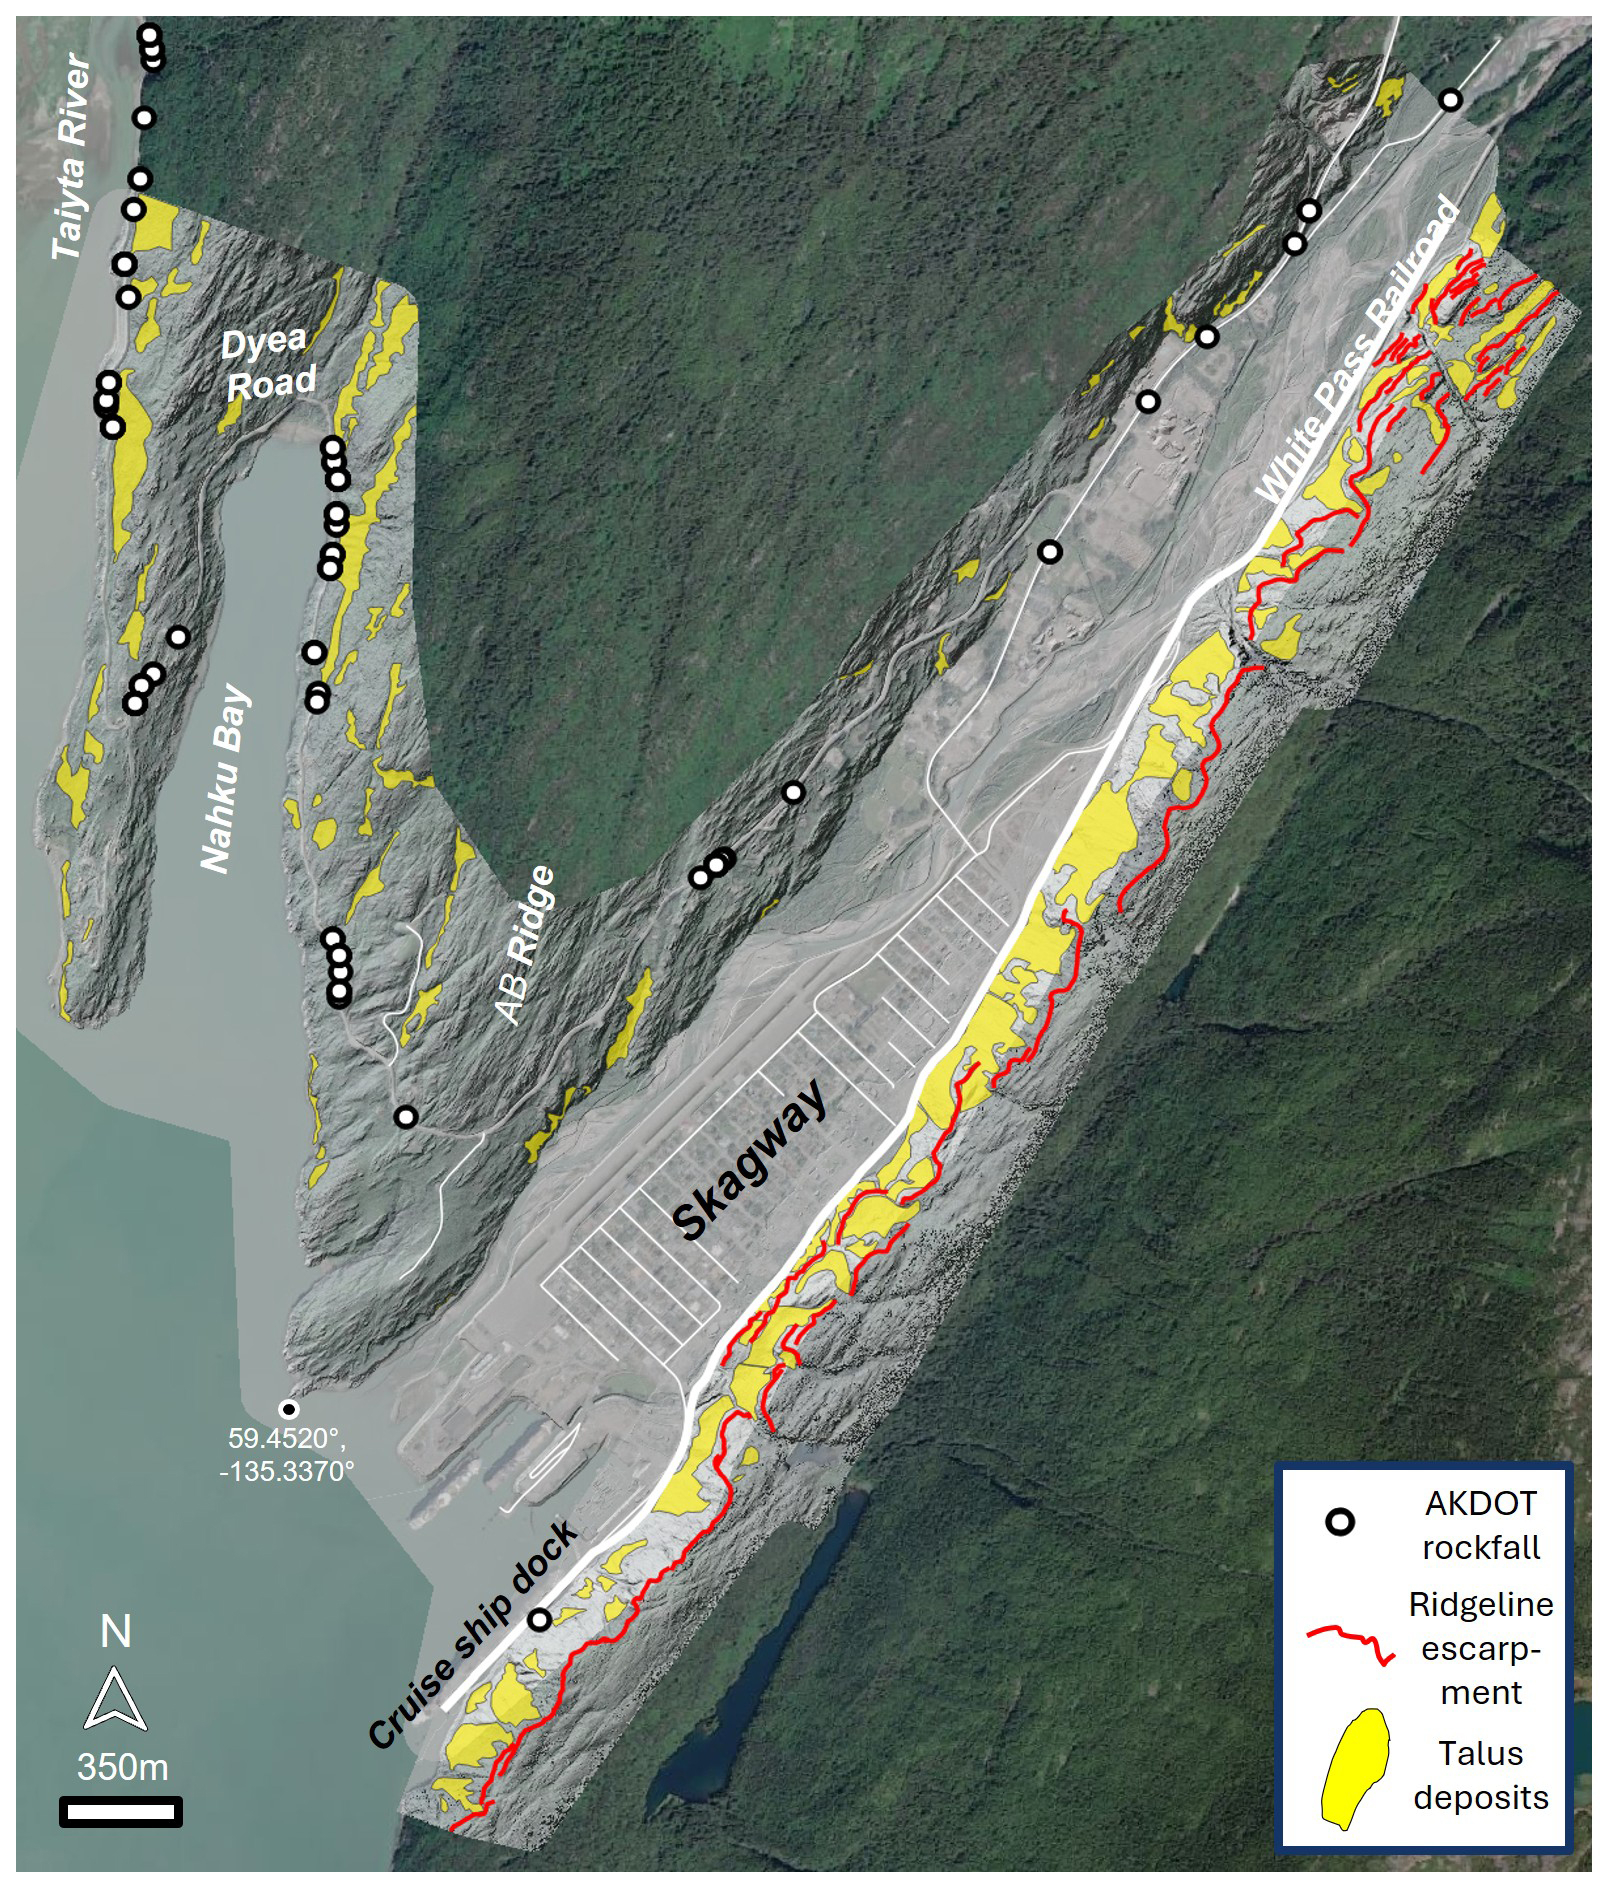
Figure 7Distribution of talus deposits (yellow polygons), AKDOT&PF rockfall geoevents (2005–2022) (white/black dots), and Eastern ridge bedrock escarpment (red lines). Note the abundance of talus deposits on the NW-facing ridgeline in Skagway and on NW-facing slopes in Nahku Bay and along Dyea Road. Background image from USGS NAIP (National Agriculture Imagery Program). Merged lidar hillshade image has 50 % transparency.
According to our analysis, rockfall events peak in late March and April, occurring at a pace that is 4 × greater than the remainder of the year (Fig. 6). This substantial uptick in activity corresponds with a seasonal increase in daily temperatures, particularly when the minimum daily temperature exceeds zero. This temporal pattern is consistent with the well-documented observation that thawing of frozen rock slopes promotes the destabilization of blocks through the loss of tensile strength and increases in pore pressure from melting ice and snow (Birien et al., 2024; Imaizumi et al., 2025; Matsuoka, 2019). In the fall, increased daily rainfall associated with atmospheric rivers with a detectable but small increase in activity. The mid-summer period of warm temperatures and dry conditions corresponds with the least active period. Some notable high impact rockfall events correspond with intense rainfall events, including 2 December 2020, when widespread events were preceded by over 3 in. (7.5 cm) of rainfall in the previous 24 h.
4.2 Geomorphic mapping
The morphology of glaciated valleys around Skagway is variable owing to bedrock structure, differential glacial erosion, and post-glacial landscape evolution (Fig. 4). These factors generate systematic variations in the abundance of bedrock cliffs that serve as rockfall source areas as well as long, steep slopes that facilitate long rockfall runout. On the east side of Skagway River valley, our lidar DEM and field observations reveal a distinct northwest-facing bedrock escarpment that runs parallel just below the crest of the ridgeline (Fig. 7). This feature is particularly distinct above the cruise ship dock, where the ridgeline has high relief compared with sections to the north that abut the township. Below these bedrock escarpments, we observe abundant talus deposits that extend continuously downslope to the base of the ridgeline and the valley floor (Fig. 7). An undated historic photograph which postdates the 1899 construction of the current Museum and City Hall depicts the eastern ridgeline in a state of minimal forest cover such that the escarpment and talus slopes above the harbour are clearly visible (Fig. 2b). These observations imply substantial post-glacial erosion through lateral (southeastward) retreat of the ridgeline as talus slopes convey bedrock downslope creating long and relatively smooth pathways for rockfall runout. In Fig. 2b, the ridge on the left side of the image exhibits gentler slope angles (< 20°) and a benchy morphology which implies less extensive post-glacial erosion and slope modification via rockfalls. Atop the ridge and east of the escarpment, the ridgeline contains abundant evidence of unmodified glacial erosion features (Fig. 4).
By contrast, the west side of the Skagway River valley has a very different morphology, in that it lacks a distinct escarpment and instead exhibits consistent and gradual slopes that imply minimal post-glacial modification. Locally, we observe vertical cliffs along the Skagway River, but otherwise the west side of the Skagway River valley consists of gentle rock slopes that form prominent ridges and parallel the strike of the valley. We observe a similar pattern of bedrock escarpments and talus deposits along the NW-facing slopes of two parallel ridgelines between Skagway and the Taiya River (Fig. 7).
Our lidar and field mapping revealed abundant talus slopes on northwest-facing ridgelines across our study area. More generally, talus deposits compose 12 % of the 7.2 km2 total mapped area (Fig. 7). Along the eastern ridgeline, we identified abundant talus slopes which collectively make up 25 % of that ridgeline area. On the west side of the Skagway River valley, the southeast-facing ridgeline hosts sparse talus cover that constitutes only 3 % of that side of the valley. Similarly, talus deposits on the southeast-facing ridgelines bordering Nahku Bay are much less abundant (1 %) and smaller in area than on the northwest-facing ridgeline that abuts the bay (11 %). In summary, talus slopes are significantly more abundant on NW-facing slopes across our study area and their location tends to correspond with AKDOT&PF geoevents along Dyea Road (Fig. 7).
4.3 Bedrock structure and discontinuities
To characterize the geometry of discontinuities with the potential to generate rockfalls, we collected 405 joint orientations from 48 granodiorite outcrops across the study area (Fig. 8a, Supplement) and plotted the data as poles to planes on an equal area stereonet with Kamb contours to identify dense clusters of poles which were then grouped into joint sets (Fig. 8b–e). The clustering algorithm identified two dominant joint sets were identified in this survey (J1 & J2), which are steeply dipping and approximately orthogonal (Fig. 8e). The steeply dipping joints are conducive to toppling, which is the most observed failure mode in Skagway. The most densely defined joint set is J1, which parallels the strike of the lower Skagway River valley and the eastern ridgeline and predominantly dips to the southeast. The less densely defined joint set (J2), is approximately orthogonal to J1, has near vertical dips, and strikes northwest.
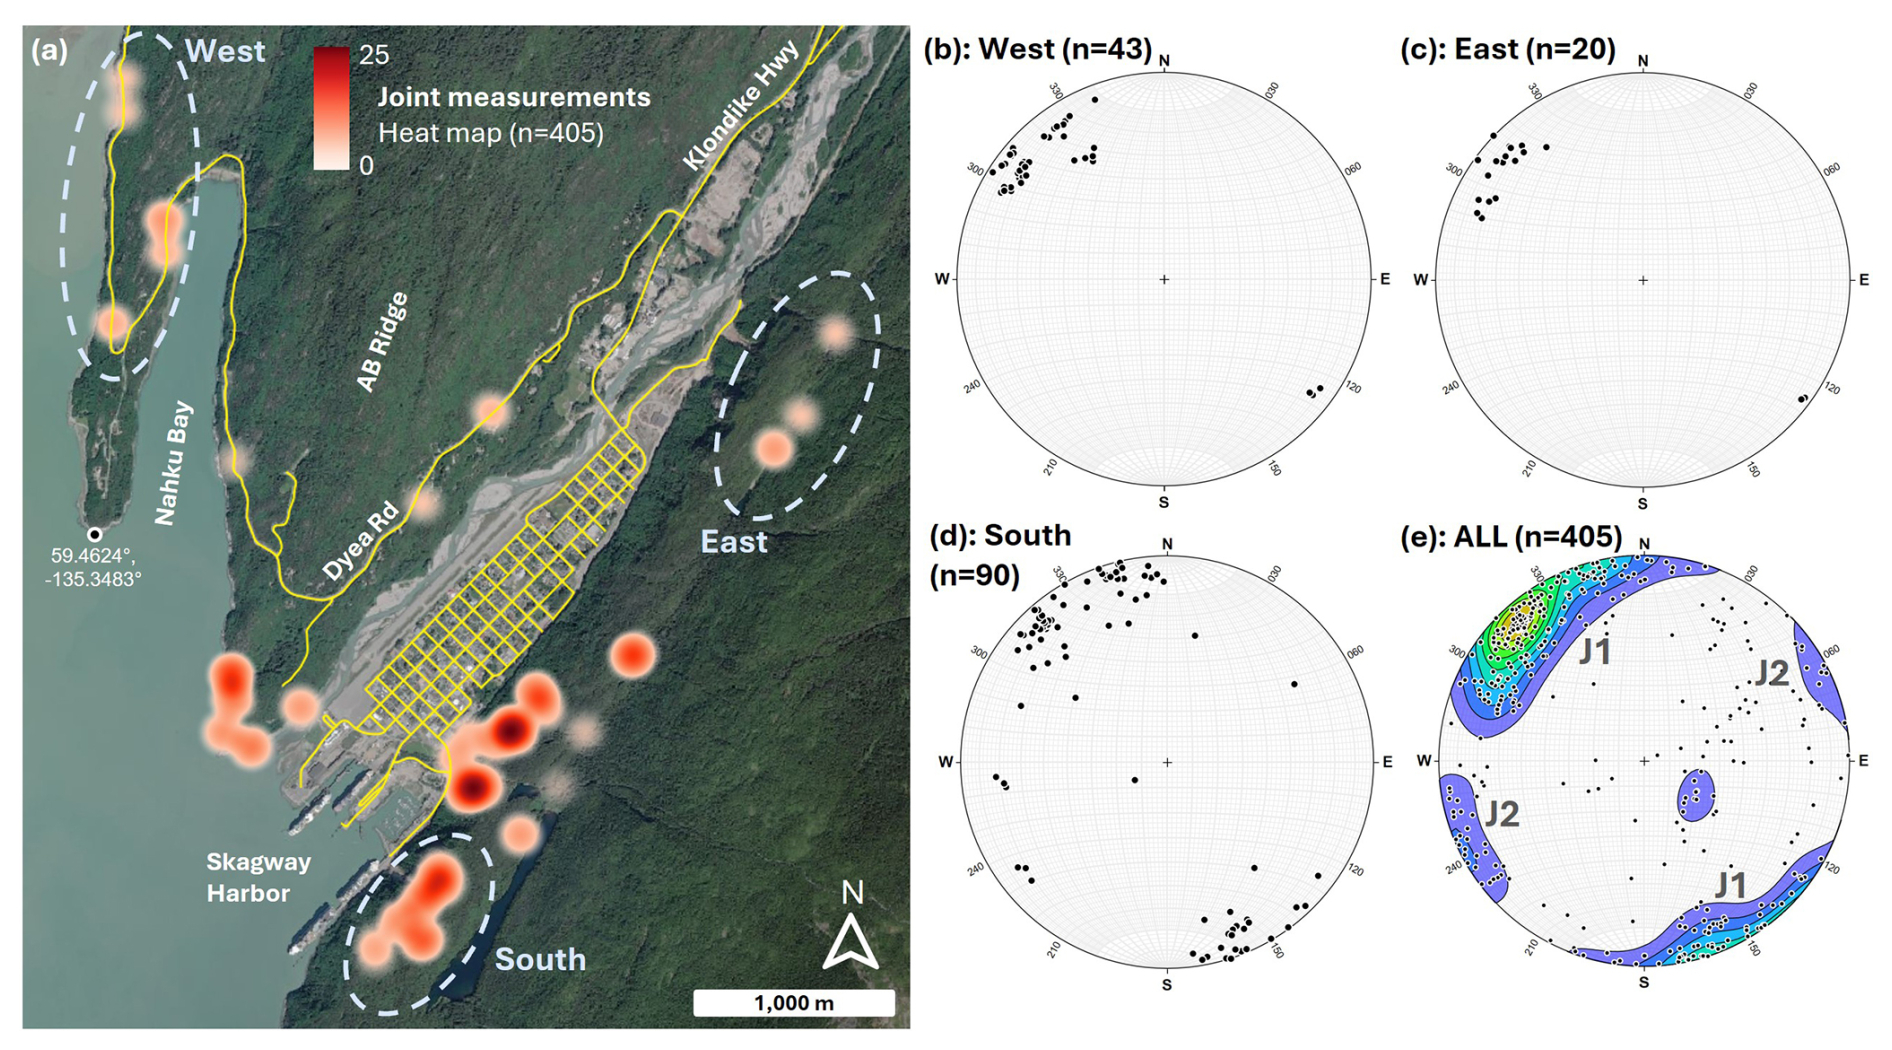
Figure 8Joint survey data. (a) Location of 405 structural measurements from 48 outcrop locations with heat map showing relative abundance and dashed ellipses showing subsampled data shown in panels (b)–(d). (b–e) Lower hemisphere equal area stereonet plots of joint measurements visualized as poles to planes for West (b), East (c), South (d), and ALL joint data (e). The plot in panel (e) shows Kamb contours to highlight dense clusters of poles (warm colours reflect high density and cool colours convey low density) and two dominant joint sets (J1 and J2) are labelled. Background image in panel (a) from USGS NAIP (National Agriculture Imagery Program).
In order to assess the consistency of rock structure, we subsampled the joint orientation data in three geographic zones at the western, eastern, and southern corners of our study area. Joint orientations from the western portion of the study area are remarkably similar to those observed in the eastern and southern sections of our study area (Fig. 8b–d). Although some of the secondary and surface parallel joints were less prominent at these locations, our finding of similar major joint orientations supports our use of the same bedrock structure data for kinematic analysis across the entire study area.
4.4 Kinematic analysis of rockfall susceptibility
By combining Eqs. (1) and (2) with our joint orientation data (Fig. 8) and merged lidar dataset (Fig. 4), we mapped susceptibility to planar sliding and block toppling, respectively, across our study area (Fig. 9a, b). Terrain susceptible to planar failure is sparse and 83 % of the terrain has zero values of susceptibility such that none of the measured joint orientations satisfy the planar sliding criteria. Furthermore, the terrain with non-zero planar sliding susceptibility values has very low values with a small fraction exceeding 5 % (Fig. 9c). By contrast, our analysis demonstrates that 29 % of the terrain has non-zero values of block toppling susceptibility and a substantial fraction of the non-zero values exceed 5 % (Fig. 9d). This result emerges because the abundance of consistently oriented joints with vertical or sub-vertical dips promotes block toppling, which is supported by field observations. Furthermore, given the consistent orientation of sub-vertical joints across our study area (Fig. 8), the primary control on rockfall susceptibility to toppling is the orientation and inclination of rock faces according to Eq. (2). Along the ridge that borders the eastern margin of Skagway River valley, for example, the glacially flattened bench at the ridge crest is not steep enough (< 20°) to meet topographic conditions for either failure mode (Fig. 9a, b). Moving to the west side of the crest, however, the gentle ridgetop abruptly transitions to the steep escarpment where overhanging, cliffy bedrock slopes are perched above extensive talus deposits (Fig. 7). In these locations, our analyses show that a substantial portion (> 20 %) of observed joints promote toppling failure (see deep red colours in Fig. 9b). Furthermore downslope, we observe patchy zones of high toppling susceptibility, many of which are in close proximity to Skagway township and harbour. Along the southeast-facing rock slopes that border the west side of Skagway, our analyses show few and small patches of terrain with toppling susceptibility approximating 5 %, indicating low susceptibility. This asymmetric susceptibility pattern continues along the sub-parallel ridges west of Skagway along Dyea Road with west- and northwest-facing ridgelines exhibiting abundant patches of terrain with high propensity for toppling failure and east- and southeast-facing slopes showing negligible toppling susceptibility (Fig. 9b).

Figure 9Maps of (a) planar sliding and (b) block toppling susceptibility indices using combined 2014 airborne and 2023 UAS lidar datasets and joint orientation data. Histograms of (c) planar sliding and (d) block toppling susceptibility indices for non-zero values. The mapped and plotted values are the percentage of field-surveyed joints deemed unstable at each pixel according to Eq. (1) (planar sliding) and Eq. (2) (block toppling). Yellow polygons denote talus deposits. Note the abundance of toppling failure zones on NW-facing rock slopes that border Skagway and Nahku Bay as well as the correspondence between toppling susceptibility and talus deposits. Hillshade imagery derived from combined 2014 and 2023 lidar data. Background image from USGS NAIP (National Agriculture Imagery Program).
By combining our talus deposit map with our toppling susceptibility map, we note a strong correspondence such that zones with > 5 % toppling failure tend to occur just upslope of talus-mantled slopes (Fig. 9b). Using visual validation (e.g., Albarelli et al., 2021), our maps show that zones with values of toppling susceptibility less than 5 % tend to be more isolated and less clearly connected with talus deposits. As a result, the 5 % (or 0.05) toppling susceptibility index value serves as an effective threshold for defining rockfall source areas.
4.5 Rockfall runout modelling using RAMMS
Using zones of high toppling susceptibility (i.e., susceptibility index > 5 %) as source areas for rockfall initiation, we applied RAMMS to model the runout of 49 450 rockfall events for each of the four scenarios that account for differences in block size and ground cover. We applied the runout model along the ridge bordering the eastern margin of Skagway and used the 5.4 km long section of the White Pass Railroad extended along the cruise ship dock to demarcate rockfall passages with potential impact to the harbour and township (Fig. 10a–f). The ridge is steeper in the southern (4500 to 5500 m on the railroad transect) and central (1500 to 3000 on the transect) sections where extensive bedrock cliffs protrude above steep, low roughness talus deposits (Fig. 10a, b). These cliffs are identified as zones of high toppling susceptibility and thus designated as rockfall source areas (Fig. 10c). Our simulations showing the number of rockfall events that pass through each pixel reveal distinct zones subject to high rockfall susceptibility as well as extensive downslope transport (Fig. 10d, e). For both the 50th block/dense forest and 95th block/fine talus scenarios shown here, the southern end of the ridgeline above the harbour (between 4500 and 5500 on the transect) exhibits > 10 specific chutes or paths of efficient rockfall runout whereby initiation near the escarpment results in the concentration of rockfall runout along these paths and conveyance to the cruise ship docks and/or harbour. Both scenarios exhibit a zone of events that pass across the railroad as depicted by the heat map (Fig. 10d, e). In contrast, the central portion of the ridgeline (between 3000 and 4500 m on the transect) immediately adjacent to much of the township exhibits patchy and less frequent rockfall activity along gentle and irregularly oriented bedrock steps and benches. Further north, our simulations reveal abundant long rockfall runout paths at the northern extent of the township with concentrated activity near the Cemetery Slide area (between 1500 and 3000 m on the transect) with a high concentration of blocks predicted to pass across the railroad (Fig. 10e). Finally, at the northernmost extent of our simulation domain (from 0 to 1500 m on the transect), the results show patchy and short rockfall transport paths coincident with gentle, benchy topography. Taken together, these simulations demonstrate a large fraction of the ridge has similar morphology and modelled rockfall runout behaviour as the zone of recent activity above the cruise ship dock. Notably, the zone of extensive 2022 rockfall activity at 5000 m along our transect is associated with abundant modelled rockfall paths (Fig. 10d, e). The fraction of these that are modelled to pass over the railroad is relatively low, however, owing to retaining structures that are well-represented in the combined in lidar dataset (Fig. 4). While site-specific analysis and mitigation plans are critical for addressing currently active rockfall areas (Munson, 2025), our regional approach highlights that extensive portions of the ridgeline are highly susceptibility to rockfall activity that could impact the Skagway community and transportation infrastructure.
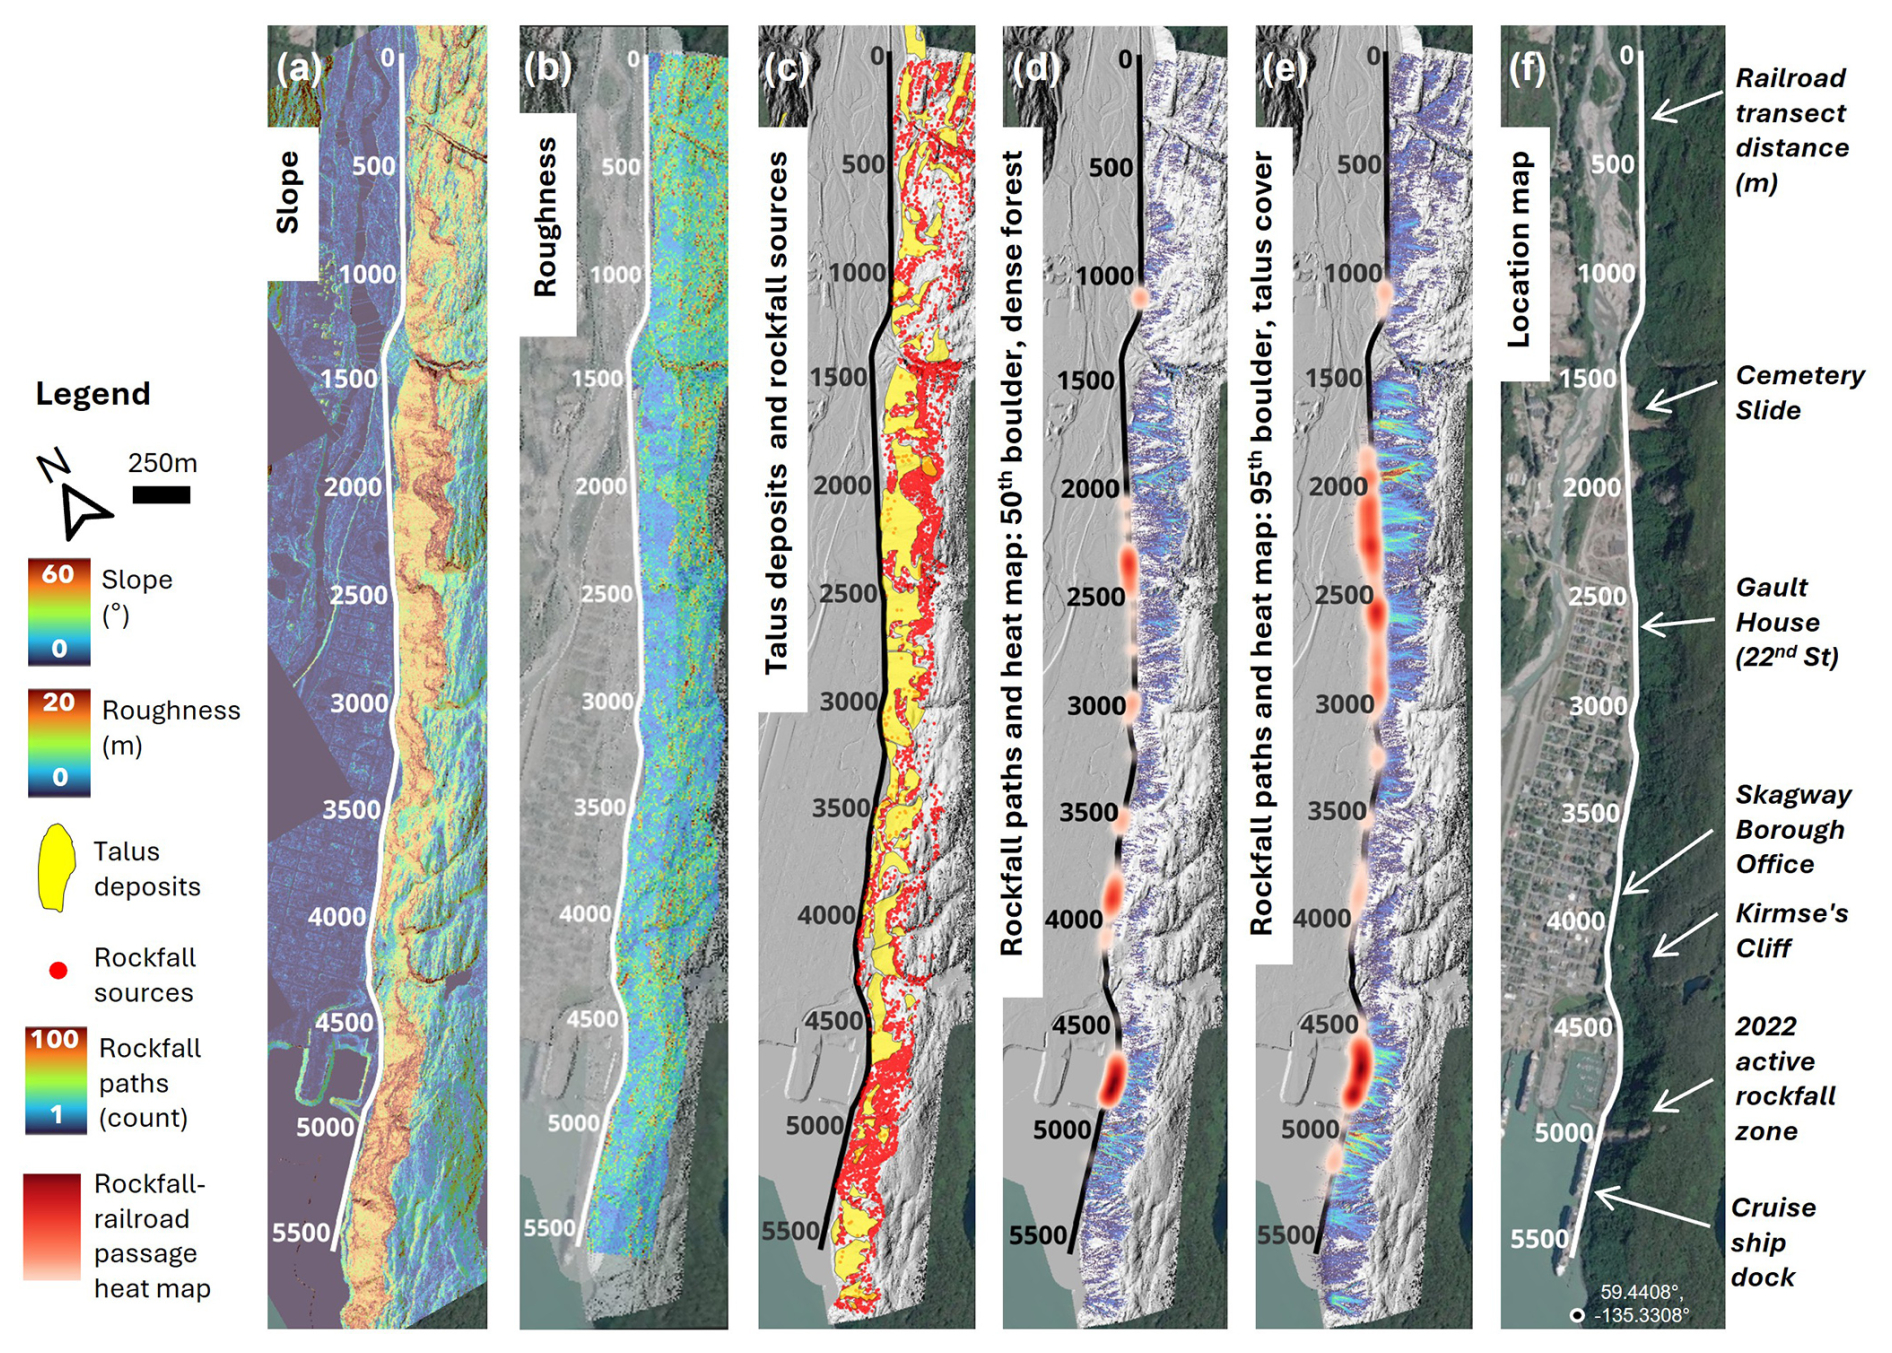
Figure 10Map of topography and rockfall models along the ridgeline that abuts Skagway township and Harbor. (a) Map of slope angle using merged 2014 airborne and 2023 UAS lidar. (b) Map of roughness defined as the standard deviation of slope angle within a 15 m radius (m). (c) Map of rockfall sources (red points) and talus deposits (yellow polygons). (d, e) Maps of modeled rockfall paths for 2 scenarios with variable block size and land cover. The number of rockfall events that traverse each pixel is indicated by the color ramp. Heat map (red shades) denotes relative density of modeled rockfalls that pass over the railroad. (f) Satellite image from USGS NAIP (National Agriculture Imagery Program) with annotated locations indicated. All maps include railroad transect demarcations. Hillshade images in panels (c)–(e) derived from merged lidar datasets.
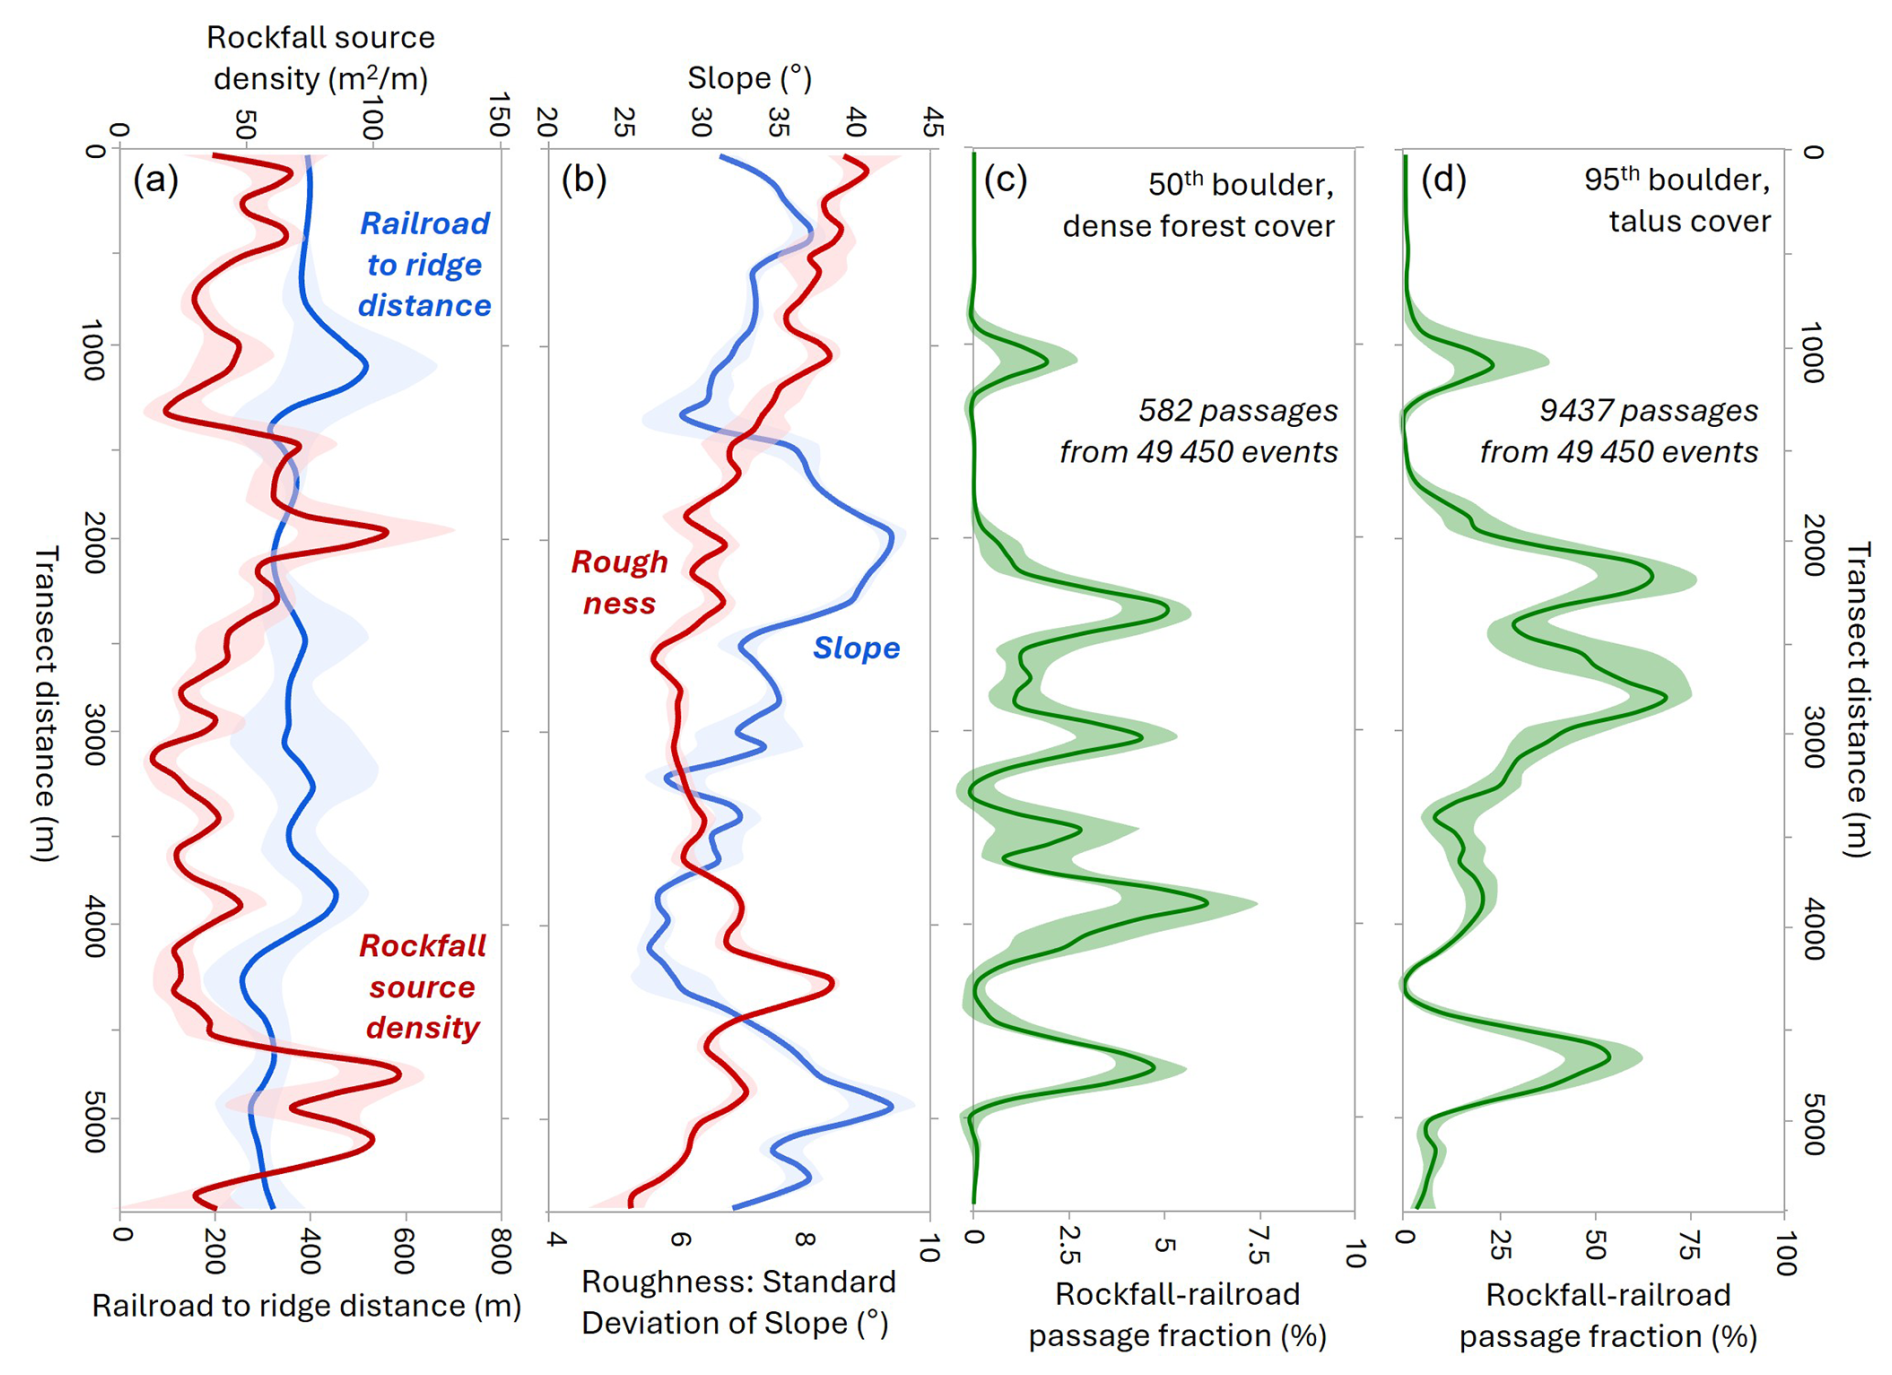
Figure 11Plots of rockfall model variables and topographic properties along the railroad transect that bisects Skagway and the rockfall prone ridgeline (see Fig. 10 for location). (a) Profile of rockfall source density (m2 m−1), which depicts the upslope area of toppling-prone terrain (normalized by distance along transect) calculated with Eq. (2) for terrain between the railroad and the ridge crest, and plot of the horizontal distance between the railroad and ridge crest. (b) Profile of average slope and roughness (estimated as standard deviation of local slope within a 5 m radius window) for terrain between railroad and the ridge crest. (c) Profile of modeled rockfall-railroad passage percentage for the scenario with 50th percentile block size and dense forest cover. (d) Profile of modeled rockfall-railroad passage percentage for the scenario with 95th percentile block size and fine talus land cover. Shaded intervals convey standard deviation of values in all plots.
To assess controls on rockfall propagation susceptibility along the railroad transect, we tallied the number of simulated rockfall events that traverse the railroad track and quantified topographic properties of the ridge (Fig. 11). Although the railroad-to-ridge distance (or ridge width) is relatively consistent along the transect, the density of rockfall source area (defined as the upslope area of rockfall susceptibility per length of railroad) varies substantially (Fig. 11a). The southern section of the ridge (4500 to 5400 m) has a concentration of toppling source areas, which is ∼ 4 × higher than slopes in the central section (2500 to 4000 m) of our transect. Another zone of high source density occurs at ∼ 2000 m on the transect and values to the northern extent are low to moderate in magnitude. Average slope angle along the ridge varies substantially with high values (> 35°) in the southern (4500 to 5400 m) and north-central (1500 to 2500 m) sections and low values in the south-central section (3000 to 4500 m) (Fig. 11b). Average values of slope roughness (estimated as the standard deviation of slope estimated for local windows with 5 m radius) are relatively high in the southern section of the transect and low in the central section before increasing monotonically to the north (Fig. 11b). Notably, our analysis shows that slope angle, rockfall source density, and roughness exhibit distinctive patterns along the ridge enabling us to distinguish their influence on the modelled runout pattern.
Although the relative pattern of simulated runout is consistent for the two scenarios shown here (Fig. 10d, e), our transect analysis shows that only 1.2 % of the simulated events for the 50th block/dense forest scenario result in passage across the railroad whereas 19.1 % of the 95th block/fine talus scenario events travel across the railroad (Fig. 11c, d). In several sections, the passage fraction for the 95th block/fine talus scenario exceeds 50 %, implying that the destabilization of a large block will likely result in downslope impacts (Fig. 11d). By contrast, the passage fractions for the 50th block/dense forest scenario rarely exceed 4 % such that unstable blocks have a low probability of impacting the valley (Fig. 11c). This disparity reveals the profound influence of block size and land cover on rockfall propagation susceptibility. Furthermore, the modelled runout patterns reveal how slope morphology controls rockfall propagation. In both scenarios, sections of the ridge with high passage fractions correspond with low roughness values and the zone of high roughness at 4000 to 4500 m on the transect corresponds with negligible rockfall passage (Fig. 11b). By contrast, our analyses show that mean slope angle and rockfall source density do not strongly correlate with the pattern of rockfall passage across the railroad.
Although rainfall has been responsible for triggering some notable rockfall events in Skagway, a substantial seasonal increase in rockfall events documented in the AKDOT&PF inventory occurred in late March and April. This period corresponds to rapid increases in temperatures, particularly the minimum daily temperature, which implies that thawing of ice, snow, and rock mass may contribute to increased activity (Fig. 6). This observation is consistent with many studies that have documented thermal-driven rockfall activity in alpine environments in Europe and elsewhere; the proposed mechanisms include active layer thaw, ice-filled fracture destabilization, and thermal stress cycles, with peak activity typically occurring during spring and early summer months when temperatures rise above freezing (Draebing et al., 2022; Gruber et al., 2004; Krautblatter et al., 2013; Matsuoka and Sakai, 1999; Mayer et al., 2024). Given that the low-elevation rock slopes around Skagway are too warm to support permafrost, ice-filled fracture destabilization may be a relevant mechanism. Field-based studies have noted cleft ice in rockfall scars which implies that ice segregation processes during cold periods followed by warming and thaw-induced weakening can destabilize fractured rock masses (Huggel et al., 2012; Ravanel et al., 2013). Dendrochronological studies in Switzerland reveal that 88 % of rockfall scars occur between mid-October and end of May, with peak activity in April when ice lenses formed from meltwater slowly infiltrate into fractures (Stoffel et al., 2005). These studies highlight the critical role of spring thaw in destabilizing previously frozen rock masses which may be relevant to the timing of rockfall activity in Skagway. Nonetheless, the specific timing of seasonal activity remains challenging to predict, motivating efforts to determine the spatial pattern of rockfall initiation and propagation susceptibility to mitigate hazard.
Taken together, our analyses of block toppling susceptibility and talus deposition maps demonstrate that rockfall source areas and runout paths tend to be situated on northwest-facing rock slopes in the Skagway River valley, Nahku Bay, and lower Taiya River valley. Our joint dataset suggests that this strong topographic control on rockfall activity owes to the coincident alignment of glacial valleys and joint orientations, both of which are remarkably consistent in the area. The joints measured in this study are consistent with the steeply dipping, orthogonal joint sets measured in a nearby (∼ 15 km northwest of Skagway) structural survey in on a tributary to the Taiya River (Callahan and Wayland, 1965) and described in a geotechnical assessment of the rock slopes above Skagway's cruise ship dock (Brennan and Whistler, 2022). These high angle joints are likely formed by the tensile component of shearing from the nearby Chatham Strait fault and Eastern Denali fault systems. Rock slopes with orthogonal jointing are often predisposed to block toppling failure particularly where steep orthogonal joints form the sides of toppling blocks and low angle joints act as the basal failure plane (Wyllie and Mah, 2004).
In their rockfall analysis, Albarelli et al. (2021) state that “visual validation indicates that the areas of higher and moderate rockfall susceptibility on the 3D model of the rocky slope are adjacent to rockfall source areas marked by the presence of fallen blocks on the foot of the slope.” In adopting this approach, we note that toppling susceptibility index values > 5 % serve to accurately differentiate terrain upslope of talus deposits (Fig. 9). The results of our kinematic analysis demonstrate that rock slopes in the steep rugged terrain surrounding Skagway are highly susceptible to block toppling failure. The preference for topping failure is due to the steep inclination of joints, which are conducive to toppling failure as their near verticality tends to preclude them from daylighting in rock slope faces, a necessary condition for planar sliding or wedge failure (Fig. 1). The abundance of talus deposits situated just downslope of zones with high toppling susceptibility (Fig. 9b) is consistent with other studies (Guerriero et al., 2024) and supports the utility of our modelling approach.
Consistent with previous studies (e.g., Loye et al., 2009), our rockfall susceptibility maps are consistent with the failure mode and location of rock slope deformation observed in the field. On the uphill side of the prominent escarpment along the eastern ridgeline in the lower Skagway River valley (Fig. 7), we observed numerous instances of detached parallel slabs of rock separated by open tension cracks that extend downward for several meters (Fig. 3). These blocks appear to be experiencing the early phases of toppling failure as vegetation and other environmental perturbations can contribute to crack widening (Pawlik et al., 2016; Rempel et al., 2016). These observations also indicate that our predicted zones of toppling failure are likely to continue propagating southeast with the active bedrock escarpment providing additional blocks to initiate rockfall. More generally, these observations suggest that erosion and southeast-oriented lateral migration of the ridgeline has been substantial since glacial retreat 10 to 12 ka. Approximate reconstruction of the ridge to its immediate post-glacial geometry (Moore et al., 2009) implies that 10 to 100 m of lateral erosion has occurred during the Holocene. The linear character of the escarpment and pervasive indicators of active toppling also imply parallel retreat over geomorphic timescales, which occurs given the favourable combination of dip and slope angle as well as erosion rate (Imaizumi et al., 2015). As such, the unravelling and lateral retreat of the escarpment will likely continue until the interface encounters a different configuration of slope and structural geometry.
As our simulations demonstrate, extensive rockfall activity and lateral divide migration does not occur along the entire ridge. Rather, our results show large sections with patchy and localized talus deposits and benchy bedrock landforms that arise because of variations in the depth and pattern of glacial erosion. Our novel roughness index serves as a proxy to reflect the integrated effect of these slope properties on rockfall runout potential. Notably, our results show that zones with high rockfall passage correspond with low roughness values upslope (Fig. 11), supporting the relevance of this morphologic proxy for assessing rockfall propagation. Roughness can be assessed in numerous ways and the slope angle standard deviation approach used here can be readily generated in GIS platforms (Booth et al., 2017). Our use of a 5 m radius for calculating roughness implies that hillslope elements of this scale are relevant for regulating rockfall runout. Roughness calculated for smaller length scales (∼ 2 m) shows a very different spatial pattern that does not correspond with rockfall passage. More sophisticated approaches for estimating roughness, including wavelets (e.g., Struble et al., 2021), affords an opportunity to dissect the scale dependence of hillslope properties that regulating runout behaviour.
In our study area, locations along the ridgeline illustrate morphologic controls on runout behaviour. On Kirmse's Cliff (at 4200 m on the transect, Fig. 10f), for example, talus deposits extend upslope from the valley floor to vertical cliff faces that terminate at the ridgeline (Fig. 5). In this area, toppling susceptibility is relatively high, but concentrated in a relatively small area of vertical rock slope, and a forested talus deposit and benchy zone sits between the cliff and the valley floor (Fig. 10c). By contrast, several areas along the escarpment exhibit high potential for rockfall runout to reach the valley. At the cruise ship dock (4500 m on the transect), continuous, rockfall-prone slopes above the cruise ship dock span from the escarpment to the base of the slope, resulting in a large area with high rockfall propagation susceptibility in close proximity to harbour infrastructure. Similarly, from 1500 to 2000 m on our railroad transect, a high-relief escarpment with steep vertical bedrock outcrops near the crest exhibits a continuous steep slope to the valley floor (Fig. 10a). In this area, which is the source area for the Cemetery Slide, rockfall susceptibility and long runout potential are high and we observed frequent spalling and rolling rocks traversing the talus deposits during our field work (Fig. 10d, e). In fact, The Daily Alaskan reported a 1914 rockfall event just south of the Cemetery Slide at 2500 m along the transect which coincides with our simulations of high rockfall runout potential (Fig. 10d, e). During that event, L. Gault noted “an avalanche of earth and stone” that “leaped the railroad track … pounding against the fence.” Gault also noted that the railroad track served as a “safety barrier” because “the force of the descent had been so much lessened.” Further afield in the northeast section of Nahku Bay, another zone of high rockfall susceptibility is revealed by our analysis. Steep rocky slopes rise to an elevation of 250 m with close proximity to Dyea Road (Fig. 7). This area lacks a well-developed runout path, but it does coincide with source areas for dozens of events in the AKDOT rockfall inventory that impacted Dyea Road. More advanced runout treatments that explicitly account for individual trees, land cover features, and source block geometry would improve the local accuracy of our simulations although the regional-scale results presented here are robust and helpful for informing mitigation efforts.
Our analyses reveal distinctive zones of high rockfall initiation and runout (or propagation) susceptibility in the Skagway region that result from the combination of glacial erosion that sets the morphology of bedrock slopes and the orientation of joint sets that determine the geometry of potential bedrock failures. Most likely, the orientation and extent of glacial erosion is not independent of the joints (Hooyer et al., 2012; Krabbendam and Glasser, 2011). Rather, we suspect that the nearly parallel orientation of joints and the N-NE trending ridge along the eastern margin of the Skagway River valley arise due to glacial erosion tracking discontinuities that facilitate erosion more readily than undeformed bedrock. This long-term evolution implies feedbacks between rock structure and bedrock erosion processes from glaciers and rockfalls that support strong gradients in rockfall activity. In assessing how these factors moderate the current hazard context, our findings critically depend on the combination of kinematic modelling and runout susceptibility to provide constraints for identifying areas at risk to inform mitigation efforts. Additional work is needed, however, to conduct a rigorous characterization of rockfall risk in Skagway that includes estimation of occupation and usage of structures and transportation corridors to be coupled with our results (e.g., Michoud et al., 2012).
Analysis of a rockfall inventory indicates a strong preference for rockfalls initiating on northwest-facing slopes in the Skagway area. Combined with climate data, the inventory also shows a seasonal peak in rockfall activity in late March and April that results from thawing of ice-filled joints and reduction of rock mass strength. Our integrated kinematic analysis and the runout modelling presented here matches well with field observations and provides the basis for a sophisticated approach in rockfall hazard assessment. The steeply dipping orthogonal joints in Skagway's rock slopes are highly conducive to block toppling failure which has resulted in highly asymmetric rockfall susceptibility. Our results highlight a distinct contrast in the morphology of Skagway River valley's eastern and western ridgelines, which is primarily determined by the predisposition of northwest-facing slopes to block toppling failure along a densely fractured joint set that dips steeply to the southeast. This is consistent with geomorphic evidence of extensive rockfall activity, where talus deposits are more abundant and larger on the eastern side of the lower Skagway River valley than the west. This structural control on rockfall activity is also evident in the east and west sides of Nahku Bay, situated to the west of Skagway. Our integrated simulations of rockfall initiation and runout show areas with high rockfall propagation susceptibility that may merit further investigation and mitigation: (1) the ridgeline and slopes above the cruise ship dock, (2) the high-relief topography at the north end of Skagway, and (3) the eastern ridgeline bordering Nahku Bay. Recent rockfall source areas located in these regions are characterized by steep northwest-facing slopes that are highly susceptible to block toppling failure and reach > 200 m in elevation which facilitates long runout paths. Our results also demonstrate that slope roughness over ∼ 10 m scales serves as a better predictor of rockfall propagation that slope angle and the density of rockfall source areas. Our integrated modelling approach and field assessment provides a simple but robust approach to assess rockfall hazard.
All topographic data used for analyses are cited within the text. The structural data are available as Supplement.
The supplement related to this article is available online at https://doi.org/10.5194/nhess-26-1435-2026-supplement.
IW and JR conceived and designed the study and IW and JR executed the study, RC provided on-site context, knowledge and guidance, AP contributed to study design and fieldwork, IW and JR prepared the manuscript with contributions from all other co-authors.
The contact author has declared that none of the authors has any competing interests.
Publisher's note: Copernicus Publications remains neutral with regard to jurisdictional claims made in the text, published maps, institutional affiliations, or any other geographical representation in this paper. The authors bear the ultimate responsibility for providing appropriate place names. Views expressed in the text are those of the authors and do not necessarily reflect the views of the publisher.
The authors thank leaders and members of the Skagway Traditional Council and residents of Skagway for their observations, critical insights, hospitality, and field assistance; the Municipality of Skagway for sharing rockfall reports; and the NSF-funded UW RAPID facility for the timely acquisition of UAS lidar data. Conversations with Joe Wartman, Ben Leshchinsky, Alex Grant, Chris Massey, and Dimitrios Zekkos were insightful and contributed to our understanding of rock slope processes. The authors are grateful for the comments of A. Günther, D. May and two anonymous reviewers that substantially improved the manuscript.
This research was funded by NSF award no. 2052972 (Focused CoPe: Building Community Sensor Networks for Coastal Hazards and Climate Change Impacts in Southeast Alaska), which supports community-driven fundamental and translational geohazard science for project partners across SE Alaska.
This paper was edited by Andreas Günther and reviewed by Dominik May and two anonymous referees.
Abellán, A., Calvet, J., Vilaplana, J. M., and Blanchard, J.: Detection and spatial prediction of rockfalls by means of terrestrial laser scanner monitoring, Geomorphology, 119, 162–171, https://doi.org/10.1016/j.geomorph.2010.03.016, 2010.
Abellán, A., Vilaplana, J. M., Calvet, J., García-Sellés, D., and Asensio, E.: Rockfall monitoring by Terrestrial Laser Scanning – case study of the basaltic rock face at Castellfollit de la Roca (Catalonia, Spain), Nat. Hazards Earth Syst. Sci., 11, 829–841, https://doi.org/10.5194/nhess-11-829-2011, 2011.
Aksoy, H. and Ercanoglu, M.: Determination of the rockfall source in an urban settlement area by using a rule-based fuzzy evaluation, Nat. Hazards Earth Syst. Sci., 6, 941–954, https://doi.org/10.5194/nhess-6-941-2006, 2006.
Albarelli, D. S. N. A., Mavrouli, O. C., and Nyktas, P.: Identification of potential rockfall sources using UAV-derived point cloud, Bull. Eng. Geol. Environ., 80, 6539–6561, https://doi.org/10.1007/s10064-021-02306-2, 2021.
Alejano, L. R., Veiga, M., Pérez-Rey, I., Castro-Filgueira, U., Arzúa, J., and Castro-Caicedo, Á. J.: Analysis of a complex slope failure in a granodiorite quarry bench, Bull. Eng. Geol. Environ., 78, 1209–1224, https://doi.org/10.1007/s10064-017-1160-y, 2019.
Allen, S. and Huggel, C.: Extremely warm temperatures as a potential cause of recent high mountain rockfall, Global Planet. Chang., 107, 59–69, https://doi.org/10.1016/j.gloplacha.2013.04.007, 2013.
Baichtal, J. F., Lesnek, A. J., Carlson, R. J., Schmuck, N. S., Smith, J. L., Landwehr, D. J., and Briner, J. P.: Late Pleistocene and early Holocene sea-level history and glacial retreat interpreted from shell-bearing marine deposits of southeastern Alaska, USA, Geosphere, 17, 1590–1615, https://doi.org/10.1130/GES02359.1, 2021.
Bajni, G., Camera, C. A. S., and Apuani, T.: Deciphering meteorological influencing factors for Alpine rockfalls: a case study in Aosta Valley, Landslides, 18, 3279–3298, https://doi.org/10.1007/s10346-021-01697-3, 2021.
Ballantyne, C. K.: A general model of paraglacial landscape response, Holocene, 12, 371–376, https://doi.org/10.1191/0959683602hl553fa, 2002.
Barlow, J., Lim, M., Rosser, N., Petley, D., Brain, M., Norman, E., and Geer, M.: Modeling cliff erosion using negative power law scaling of rockfalls, Geomorphology, 139–140, 416–424, https://doi.org/10.1016/j.geomorph.2011.11.006, 2012.
Biegel, K. M., Gosselin, J. M., Dettmer, J., Colpron, M., Enkelmann, E., and Caine, J. S.: Earthquake Relocations Delineate a Discrete Fault Network and Deformation Corridor Throughout Southeast Alaska and Southwest Yukon, Tectonics, 43, e2023TC008140, https://doi.org/10.1029/2023TC008140, 2024.
Birien, T., Gauthier, F., and Meloche, F.: Global warming impacts on rockfall frequency and magnitude due to changing frost distribution and frost cracking effectiveness, Earth Surf. Proc. Land., 49, 3399–3418, https://doi.org/10.1002/esp.5913, 2024.
Bodin, X., Schoeneich, P., Deline, P., Ravanel, L., Magnin, F., Krysiecki, J.-M., and Echelard, T.: Mountain permafrost and associated geomorphological processes: recent changes in the French Alps, Rev. Géogr. Alp., https://doi.org/10.4000/rga.2885, 2015.
Booth, A. M., LaHusen, S. R., Duvall, A. R., and Montgomery, D. R.: Holocene history of deep-seated landsliding in the North Fork Stillaguamish River valley from surface roughness analysis, radiocarbon dating, and numerical landscape evolution modeling: Landsliding in the N. Fork Stillaguamish, J. Geophys. Res.-Earth, 122, 456–472, https://doi.org/10.1002/2016JF003934, 2017.
Borella, J., Quigley, M., Krauss, Z., Lincoln, K., Attanayake, J., Stamp, L., Lanman, H., Levine, S., Hampton, S., and Gravley, D.: Geologic and geomorphic controls on rockfall hazard: how well do past rockfalls predict future distributions?, Nat. Hazards Earth Syst. Sci., 19, 2249–2280, https://doi.org/10.5194/nhess-19-2249-2019, 2019.
Bovis, M. J. and Evans, S. G.: Extensive deformations of rock slopes in southern Coast Mountains, southwest British Columbia, Canada, Eng. Geol., 44, 163–182, https://doi.org/10.1016/S0013-7952(96)00068-3, 1996.
Brennan, K. and Whistler, R.: Railroad dock landslide, initial site visit trip report, Skagway, Alaska, Geotechnical/Environmental Report, No. 109508-001, Shannon & Wilson, Anchorage, AK, USA, 2022.
Burns, W. J. and Madin, I. P.: Protocol for Inventory Mapping of Landslide Deposits from Light Detection and Ranging (lidar) Imagery, Oregon Department of Geology and Mineral Industries (DOGAMI) Special Paper 42, 36 pp., https://www.oregon.gov/dogami/pubs/pages/sp/sp-55.aspx (last access: 1 August 2025), 2009.
Callahan, J. E. and Wayland, R. G.: Geologic reconnaissance of the West Creek damsite near Skagway, Alaska, Geological Survey Bulletin, 1211-A, https://doi.org/10.3133/b1211A, 1965.
Cardozo, N. and Allmendinger, R. W.: Spherical projections with OSXStereonet, Comput. Geosci., 51, 193–205, https://doi.org/10.1016/j.cageo.2012.07.021, 2013.
Caviezel, A., Ringenbach, A., Demmel, S. E., Dinneen, C. E., Krebs, N., Bühler, Y., Christen, M., Meyrat, G., Stoffel, A., Hafner, E., Eberhard, L. A., Rickenbach, D. von, Simmler, K., Mayer, P., Niklaus, P. S., Birchler, T., Aebi, T., Cavigelli, L., Schaffner, M., Rickli, S., Schnetzler, C., Magno, M., Benini, L., and Bartelt, P.: The relevance of rock shape over mass – implications for rockfall hazard assessments, Nat. Commun., 12, 5546, https://doi.org/10.1038/s41467-021-25794-y, 2021.
Chaminé, H. I., Afonso, M. J., Ramos, L., and Pinheiro, R.: Scanline Sampling Techniques for Rock Engineering Surveys: Insights from Intrinsic Geologic Variability and Uncertainty, in: Engineering Geology for Society and Territory – Volume 6, Cham, 357–361, https://doi.org/10.1007/978-3-319-09060-3_61, 2015.
Chiles, J.-P. and Marsily, G.: Stochastic Models of Fracture Systems and Their Use in Flow and Transport Modeling, in: Flow and Contaminant Transport in Fractured Rock, Academic Press, 169–236, https://doi.org/10.1016/B978-0-12-083980-3.50008-5, 1993.
Choi, M., Eaton, D. W., and Enkelmann, E.: Is the Eastern Denali fault still active?, Geology, 49, 662–666, https://doi.org/10.1130/G48461.1, 2021.
Collins, B. D. and Stock, G. M.: Rockfall triggering by cyclic thermal stressing of exfoliation fractures, Nat. Geosci., 9, 395–400, https://doi.org/10.1038/ngeo2686, 2016.
Corominas, J., van Westen, C., Frattini, P., Cascini, L., Malet, J.-P., Fotopoulou, S., Catani, F., Van Den Eeckhaut, M., Mavrouli, O., Agliardi, F., Pitilakis, K., Winter, M. G., Pastor, M., Ferlisi, S., Tofani, V., Hervás, J., and Smith, J. T.: Recommendations for the quantitative analysis of landslide risk, Bull. Eng. Geol. Environ., 73, 209–263, https://doi.org/10.1007/s10064-013-0538-8, 2014.
Cruden, D. M.: Limits to common toppling, Can. Geotech. J., 26, 737–742, https://doi.org/10.1139/t89-085, 1989.
Daly, C., Smith, J., and Halbleib, M.: 1981–2010 High-Resolution Temperature and Precipitation Maps for Alaska Final Report, Oregon State University, Corvallis, Oregon, 2018.
DGGS Staff: LiDAR Datasets of Alaska, Alaska Division of Geological & Geophysical Surveys, https://doi.org/10.14509/25239, 2013.
Dorren, L., Berger, F., Jonsson, M., Krautblatter, M., Mölk, M., Stoffel, M., and Wehrli, A.: State of the art in rockfall – forest interactions, Schweizerische Zeitschrift fur Forstwesen, 158, 128–141, https://doi.org/10.3188/szf.2007.0128, 2007.
Draebing, D., Mayer, T., Jacobs, B., and McColl, S. T.: Alpine rockwall erosion patterns follow elevation-dependent climate trajectories, Commun. Earth Environ., 3, 1–12, https://doi.org/10.1038/s43247-022-00348-2, 2022.
Fanos, A. and Pradhan, B.: Laser Scanning Systems and Techniques in Rockfall Source Identification and Risk Assessment: A Critical Review, Earth Systems and Environment, 2, https://doi.org/10.1007/s41748-018-0046-x, 2018.
Frattini, P., Crosta, G., Carrara, A., and Agliardi, F.: Assessment of rockfall susceptibility by integrating statistical and physically-based approaches, Geomorphology, 94, 419–437, https://doi.org/10.1016/j.geomorph.2006.10.037, 2008.
Gigli, G., Lombardi, L., Carlà, T., Beni, T., and Casagli, N.: A method for full three-dimensional kinematic analysis of steep rock walls based on high-resolution point cloud data, Int. J. Rock Mech. Min., 157, 105178, https://doi.org/10.1016/j.ijrmms.2022.105178, 2022.
Grant, A., Wartman, J., and Abou-Jaoude, G.: Multimodal method for coseismic landslide hazard assessment, Eng. Geol., 212, 146–160, https://doi.org/10.1016/j.enggeo.2016.08.005, 2016.
Gruber, S., Hoelzle, M., and Haeberli, W.: Permafrost thaw and destabilization of Alpine rock walls in the hot summer of 2003, Geophys. Res. Lett., 31, https://doi.org/10.1029/2004GL020051, 2004.
Guerriero, L., Annibali Corona, M., Di Martire, D., Francioni, M., Limongiello, M., Tufano, R., and Calcaterra, D.: Rockfall susceptibility analysis of the “San Michele Arcangelo” historic trail (Central Italy) based on virtual outcrops and multiple propagation models, Bull. Eng. Geol. Environ., 83, 263, https://doi.org/10.1007/s10064-024-03764-0, 2024.
Günther, A.: SLOPEMAP: programs for automated mapping of geometrical and kinematical properties of hard rock hill slopes, Comput. Geosci., 29, 865–875, https://doi.org/10.1016/S0098-3004(03)00086-4, 2003.
Günther, A., Wienhöfer, J., and Konietzky, H.: Automated mapping of rock slope geometry, kinematics and stability with RSS-GIS, Nat. Hazards, 61, 29–49, https://doi.org/10.1007/s11069-011-9771-2, 2012.
Guzzetti, F., Reichenbach, P., and Wieczorek, G. F.: Rockfall hazard and risk assessment in the Yosemite Valley, California, USA, Nat. Hazards Earth Syst. Sci., 3, 491–503, https://doi.org/10.5194/nhess-3-491-2003, 2003.
Hales, T. C. and Roering, J. J.: Climatic controls on frost cracking and implications for the evolution of bedrock landscapes, J. Geophys. Res., 112, https://doi.org/10.1029/2006JF000616, 2007.
Harris, A. S. and Farr, W. A.: The forest ecosystem of southeast Alaska: 7. Forest ecology and timber management, Gen. Tech. Rep. PNW-GTR-025, U.S. Department of Agriculture, Forest Service, Pacific Northwest Research Station, Portland, OR, 025, 116 pp., 1974.
Hooyer, T. S., Cohen, D., and Iverson, N. R.: Control of glacial quarrying by bedrock joints, Geomorphology, 153–154, 91–101, https://doi.org/10.1016/j.geomorph.2012.02.012, 2012.
Horel, J., Splitt, M., Dunn, L., Pechmann, J., White, B., Ciliberti, C., Lazarus, S., Slemmer, J., Zaff, D., and Burks, J.: MESOWEST: Cooperative Mesonets In The Western United States, B. Am. Meteorol. Soc., https://doi.org/10.1175/1520-0477(2002)083<0211:MCMITW>2.3.CO;2, 2002.
Huggel, C., Allen, S., Deline, P., Fischer, L., Noetzli, J., and Ravanel, L.: Ice thawing, mountains falling – are alpine rock slope failures increasing?, Geology Today, 28, 98–104, https://doi.org/10.1111/j.1365-2451.2012.00836.x, 2012.
Hungr, O., Evans, S. G., and Hazzard, J.: Magnitude and frequency of rock falls and rock slides along the main transportation corridors of southwestern British Columbia, Can. Geotech. J., 36, 224–238, https://doi.org/10.1139/t98-106, 1999.
Hungr, O., Leroueil, S., and Picarelli, L.: The Varnes classification of landslide types, an update, Landslides, 11, 167–194, https://doi.org/10.1007/s10346-013-0436-y, 2014.
Imaizumi, F., Nishii, R., Murakami, W., and Daimaru, H.: Parallel retreat of rock slopes underlain by alternation of strata, Geomorphology, 238, 27–36, https://doi.org/10.1016/j.geomorph.2015.02.030, 2015.
Imaizumi, F., Matsuoka, N., Hayakawa, Y. S., Samikshya, D., and Stoffel, M.: Linkages between abundant rockfall and debris-flow activity at Täschgufer, Swiss Alps, Geomorphology, 110009, https://doi.org/10.1016/j.geomorph.2025.110009, 2025.
Kleinn, J., Christen, M., and Bartelt, P.: Probabilistic event-based rockfall modelling for deriving continuous intensity-frequency curves in the impact area, Interpraevent 2024, Conference proceedings, 648–652, https://www.dora.lib4ri.ch/wsl/item/wsl:37537 (last access: 1 August 2025), 2024.
Klimeš, J., Kilnar, J., Kopačková-Strnadová, V., Pánek, T., McColl, S., and Jelének, J.: Landslides in the glaciated mountains of the Cordillera Blanca, Peru – types, spatial distribution, and conditioning factors, Landslides, https://doi.org/10.1007/s10346-024-02387-6, 2024.
Krabbendam, M. and Glasser, N. F.: Glacial erosion and bedrock properties in NW Scotland: Abrasion and plucking, hardness and joint spacing, Geomorphology, 130, 374–383, https://doi.org/10.1016/j.geomorph.2011.04.022, 2011.
Krautblatter, M., Funk, D., and Günzel, F. K.: Why permafrost rocks become unstable: a rock–ice-mechanical model in time and space, Earth Surf. Proc. Land., 38, 876–887, https://doi.org/10.1002/esp.3374, 2013.
Kundu, J., Sarkar, K., Ghaderpour, E., Mugnozza, G. S., and Mazzanti, P.: A GIS-Based Kinematic Analysis for Jointed Rock Slope Stability: An Application to Himalayan Slopes, Land, 12, https://doi.org/10.3390/land12020402, 2023.
LaHusen, S. R., Duvall, A. R., Booth, A. M., Grant, A., Mishkin, B. A., Montgomery, D. R., Struble, W., Roering, J. J., and Wartman, J.: Rainfall triggers more deep-seated landslides than Cascadia earthquakes in the Oregon Coast Range, USA, Sci. Adv., 6, eaba6790, https://doi.org/10.1126/sciadv.aba6790, 2020.
Leine, R. I., Schweizer, A., Christen, M., Glover, J., Bartelt, P., and Gerber, W.: Simulation of rockfall trajectories with consideration of rock shape, Multibody Syst. Dyn., 32, 241–271, https://doi.org/10.1007/s11044-013-9393-4, 2014.
Leith, K., Moore, J. R., Amann, F., and Loew, S.: In situ stress control on microcrack generation and macroscopic extensional fracture in exhuming bedrock: Fracture Generation In Exhuming Bedrock, J. Geophys. Res.-Sol. Ea., 119, 594–615, https://doi.org/10.1002/2012JB009801, 2014.
Loye, A., Jaboyedoff, M., and Pedrazzini, A.: Identification of potential rockfall source areas at a regional scale using a DEM-based geomorphometric analysis, Nat. Hazards Earth Syst. Sci., 9, 1643–1653, https://doi.org/10.5194/nhess-9-1643-2009, 2009.
Lu, G., Caviezel, A., Christen, M., Demmel, S. E., Ringenbach, A., Bühler, Y., Dinneen, C. E., Gerber, W., and Bartelt, P.: Modelling rockfall impact with scarring in compactable soils, Landslides, 16, 2353–2367, https://doi.org/10.1007/s10346-019-01238-z, 2019.
Lu, G., Ringenbach, A., Caviezel, A., Sanchez, M., Christen, M., and Bartelt, P.: Mitigation effects of trees on rockfall hazards: does rock shape matter?, Landslides, 18, 59–77, https://doi.org/10.1007/s10346-020-01418-2, 2021.
Luckman, B. H.: Rockfalls and rockfall inventory data: Some observations from surprise valley, Jasper National Park, Canada, Earth Surf. Processes, 1, 287–298, https://doi.org/10.1002/esp.3290010309, 1976.
Macpherson, A. E., Nicolsky, D. J., and Suleimani, E. N.: Digital elevation models of Skagway and Haines, Alaska: Procedures, data sources, and quality assessment, Alaska Division of Geological & Geophysical Surveys, https://doi.org/10.14509/29143, 2014.
Marquínez, J., Menéndez Duarte, R., Farias, P., and JiméNez Sánchez, M.: Predictive GIS-Based Model of Rockfall Activity in Mountain Cliffs, Nat. Hazards, 30, 341–360, https://doi.org/10.1023/B:NHAZ.0000007170.21649.e1, 2003.
Matasci, B., Stock, G. M., Jaboyedoff, M., Carrea, D., Collins, B. D., Guérin, A., Matasci, G., and Ravanel, L.: Assessing rockfall susceptibility in steep and overhanging slopes using three-dimensional analysis of failure mechanisms, Landslides, 15, 859–878, https://doi.org/10.1007/s10346-017-0911-y, 2018.
Matsuoka, N.: A multi-method monitoring of timing, magnitude and origin of rockfall activity in the Japanese Alps, Geomorphology, 336, 65–76, https://doi.org/10.1016/j.geomorph.2019.03.023, 2019.
Matsuoka, N. and Sakai, H.: Rockfall activity from an alpine cliff during thawing periods, Geomorphology, 28, 309–328, https://doi.org/10.1016/S0169-555X(98)00116-0, 1999.
Mayer, T., Deprez, M., Schröer, L., Cnudde, V., and Draebing, D.: Quantifying frost-weathering-induced damage in alpine rocks, The Cryosphere, 18, 2847–2864, https://doi.org/10.5194/tc-18-2847-2024, 2024.
Meentemeyer, R. K. and Moody, A.: Automated mapping of conformity between topographic and geological surfaces, Comput. Geosci., 26, 815–829, https://doi.org/10.1016/S0098-3004(00)00011-X, 2000.
Menounos, B., Goehring, B. M., Osborn, G., Margold, M., Ward, B., Bond, J., Clarke, G. K. C., Clague, J. J., Lakeman, T., Koch, J., Caffee, M. W., Gosse, J., Stroeven, A. P., Seguinot, J., and Heyman, J.: Cordilleran Ice Sheet mass loss preceded climate reversals near the Pleistocene Termination, Science, 358, 781–784, https://doi.org/10.1126/science.aan3001, 2017.
Messenzehl, K. and Dikau, R.: Structural and thermal controls of rockfall frequency and magnitude within rockwall–talus systems (Swiss Alps), Earth Surf. Proc. Land., 42, 1963–1981, https://doi.org/10.1002/esp.4155, 2017.
Messenzehl, K., Meyer, H., Otto, J.-C., Hoffmann, T., and Dikau, R.: Regional-scale controls on the spatial activity of rockfalls (Turtmann Valley, Swiss Alps) – A multivariate modeling approach, Geomorphology, 287, 29–45, https://doi.org/10.1016/j.geomorph.2016.01.008, 2017.
Michoud, C., Derron, M.-H., Horton, P., Jaboyedoff, M., Baillifard, F.-J., Loye, A., Nicolet, P., Pedrazzini, A., and Queyrel, A.: Rockfall hazard and risk assessments along roads at a regional scale: example in Swiss Alps, Nat. Hazards Earth Syst. Sci., 12, 615–629, https://doi.org/10.5194/nhess-12-615-2012, 2012.
Moore, J. R., Sanders, J. W., Dietrich, W. E., and Glaser, S. D.: Influence of rock mass strength on the erosion rate of alpine cliffs, Earth Surf. Proc. Land., 34, 1339–1352, https://doi.org/10.1002/esp.1821, 2009.
Moos, C., Khelidj, N., Guisan, A., Lischke, H., and Randin, C. F.: A quantitative assessment of rockfall influence on forest structure in the Swiss Alps, Eur. J. Forest Res., 140, 91–104, https://doi.org/10.1007/s10342-020-01317-0, 2021.
Munson, M.: Railroad Dock landslides continue, declaration of emergency in place, 12 August 2022, The Skagway News, https://issuu.com/publisher-skagwaynews/docs/sn8_12_22_8_ppfinal (last access: 1 August 2025), 2022a.
Munson, M.: Small landslide closes cruise ship dock in Skagway, 23 June 2022, The Skagway News, https://www.alaskasnewssource.com/2022/06/23/small-landslide-closes-cruise-ship-dock-skagway/ (last access: 1 August 2025), 2022b.
Munson, M.: Skagway gets first look at possible plans for expensive and complicated rock fall mitigation, KTOO, https://www.ktoo.org/2025/10/27/skagway-gets-first-look-at-possible-plans-for-expensive-and-complicated-rock-fall-mitigation/ (last access: 1 August 2025), 2025.
Nash, D., Rutz, J. J., and Jacobs, A.: Atmospheric Rivers in Southeast Alaska: Meteorological Conditions Associated With Extreme Precipitation, J. Geophys. Res.-Atmos., 129, e2023JD039294, https://doi.org/10.1029/2023JD039294, 2024.
Oliinyk, M., Bubniak, I., and Vikhot, Y.: Using Move software by geological field works, International Conference of Young Professionals “GeoTerrace-2020”, 1–5, https://doi.org/10.3997/2214-4609.20205706, 2020.
Paranunzio, R., Laio, F., Nigrelli, G., and Chiarle, M.: A method to reveal climatic variables triggering slope failures at high elevation, Nat. Hazards, 76, 1039–1061, https://doi.org/10.1007/s11069-014-1532-6, 2015.
Paranunzio, R., Laio, F., Chiarle, M., Nigrelli, G., and Guzzetti, F.: Climate anomalies associated with the occurrence of rockfalls at high-elevation in the Italian Alps, Nat. Hazards Earth Syst. Sci., 16, 2085–2106, https://doi.org/10.5194/nhess-16-2085-2016, 2016.
Pawlik, Ł., Phillips, J. D., and Šamonil, P.: Roots, rock, and regolith: Biomechanical and biochemical weathering by trees and its impact on hillslopes – A critical literature review, Earth-Sci. Rev., 159, 142–159, https://doi.org/10.1016/j.earscirev.2016.06.002, 2016.
Pérez, F.: Talus fabric, clast morphology, and botanical Indicators of Slope Processes on the Chaos Crags (California Cascades), U.S.A., Géogr. Phys. Quatern., 52, 47–68, https://doi.org/10.7202/004861ar, 1998.
Poage, N. J., Marshall, D. D., and McClellan, M. H.: Maximum Stand-Density Index of 40 Western Hemlock–Sitka Spruce Stands in Southeast Alaska, West. J. Appl. For., 22, 99–104, https://doi.org/10.1093/wjaf/22.2.99, 2007.
Priest, S. D. and Hudson, J. A.: Estimation of discontinuity spacing and trace length using scanline surveys, Int. J. Rock Mech. Min., 18, 183–197, https://doi.org/10.1016/0148-9062(81)90973-6, 1981.
Rapp, A.: Talus slopes and mountain walls at Tempelfjorden, Spitsbergen: a geomorphological study of the denudation of slopes in an Arctic locality, Skritfter, Norsk Polarinstitutt, 119 pp., 1960.
Ravanel, L., Deline, P., Lambiel, C., and Vincent, C.: Instability of a High Alpine Rock Ridge: the Lower Arête Des Cosmiques, Mont Blanc Massif, France, Geogr. Ann. A, 95, 51–66, https://doi.org/10.1111/geoa.12000, 2013.
Rempel, A. W., Marshall, J. A., and Roering, J. J.: Modeling relative frost weathering rates at geomorphic scales, Earth Planet. Sc. Lett., 453, 87–95, https://doi.org/10.1016/j.epsl.2016.08.019, 2016.
Ringenbach, A., Bebi, P., Bartelt, P., Rigling, A., Christen, M., Bühler, Y., Stoffel, A., and Caviezel, A.: Shape still matters: rockfall interactions with trees and deadwood in a mountain forest uncover a new facet of rock shape dependency, Earth Surf. Dynam., 11, 779–801, https://doi.org/10.5194/esurf-11-779-2023, 2023.
Roering, J. J., Dedinsky, K., Grilliot, M., Wachino, I. D., and Cash, R.: Skagway Landslide Hazard, RAPID Facility, https://doi.org/10.17603/ds2-2e3p-yn12, 2025.
Rosser, N. and Massey, C.: Rockfall hazard and risk, in: Landslide Hazards, Risks, and Disasters, Elsevier, 581–622, https://doi.org/10.1016/B978-0-12-818464-6.00013-5, 2022.
Rosser, N., Lim, M., Petley, D., Dunning, S., and Allison, R.: Patterns of precursory rockfall prior to slope failure, J. Geophys. Res.-Earth, 112, https://doi.org/10.1029/2006JF000642, 2007.
Royán, M. J., Abellán, A., Jaboyedoff, M., Vilaplana, J. M., and Calvet, J.: Spatio-temporal analysis of rockfall pre-failure deformation using Terrestrial LiDAR, Landslides, 11, 697–709, https://doi.org/10.1007/s10346-013-0442-0, 2014.
Ruffner, C. M. and Abrams, M. D.: Relating land-use history and climate to the dendroecology of a 326-year-old Quercus prinus talus slope forest, Can. J. For. Res., 28, 347–358, https://doi.org/10.1139/x97-220, 1998.
Samodra, G., Chen, G., Sartohadi, J., Hadmoko, D. S., Kasama, K., and Setiawan, M. A.: Rockfall susceptibility zoning based on back analysis of rockfall deposit inventory in Gunung Kelir, Java, Landslides, 13, 805–819, https://doi.org/10.1007/s10346-016-0713-7, 2016.
Sarro, R., Rossi, M., Reichenbach, P., and Mateos, R. M.: From rockfall source area identification to susceptibility zonation: a proposed workflow tested on El Hierro (Canary Islands, Spain), Nat. Hazards Earth Syst. Sci., 25, 1459–1479, https://doi.org/10.5194/nhess-25-1459-2025, 2025.
Scheidl, C., Heiser, M., Vospernik, S., Lauss, E., Perzl, F., Kofler, A., Kleemayr, K., Bettella, F., Lingua, E., Garbarino, M., Skudnik, M., Trappmann, D., and Berger, F.: Assessing the protective role of alpine forests against rockfall at regional scale, Eur. J. Forest Res., 139, 969–980, https://doi.org/10.1007/s10342-020-01299-z, 2020.
Statham, I.: A scree slope rockfall model, Earth Surf. Processes, 1, 43–62, https://doi.org/10.1002/esp.3290010106, 1976.
Stock, G. M. and Collins, B. D.: Quantitative Rockfall hazard and risk assessment for Yosemite Valley, Yosemite National Park, California, USGS Scientific Investigations Report 2014-5129, https://doi.org/10.3133/sir20145129, 2014.
Stock, G. M., Bawden, G. W., Green, J. K., Hanson, E., Downing, G., Collins, B. D., Bond, S., and Leslar, M.: High-resolution three-dimensional imaging and analysis of rock falls in Yosemite Valley, California, Geosphere, 7, 573–581, https://doi.org/10.1130/GES00617.1, 2011.
Stoffel, M., Lièvre, I., and Monbaron, M.: Seasonal timing of rockfall activity on a forested slope at Täschgufer (Swiss Alps) – a dendrochronological approach, Z. Geomorphol., 49, 89–106, 2005.
Stoffel, M., Trappmann, D. G., Coullie, M. I., Ballesteros Cánovas, J. A., and Corona, C.: Rockfall from an increasingly unstable mountain slope driven by climate warming, Nat. Geosci., 1–6, https://doi.org/10.1038/s41561-024-01390-9, 2024.
Struble, W. T., Roering, J. J., Dorsey, R. J., and Bendick, R.: Characteristic Scales of Drainage Reorganization in Cascadia, Geophys. Res. Lett., 48, e2020GL091413, https://doi.org/10.1029/2020GL091413, 2021.
Terzaghi, R. D.: Sources of Error in Joint Surveys, Géotechnique, 15, 287–304, https://doi.org/10.1680/geot.1965.15.3.287, 1965.
The Daily Alaskan: SLIDE: Hill again caves in near Moore's Wharf, 20 October 1901, The Daily Alaskan, 1, 1901.
Thompson, P.: Alaska Department of Transportation & Public Facilities (AKDOT) Geotechnical Asset Management Program, Technical Report STP000S(802)(B), Juneau, AK, 2017.
Thornton, T. F.: Our Grandparents' Names on the Land/Haa Leelk'w Has Aani Saax'u, University of Washington Press, Seattle, WA, 256 pp., ISBN 9780295988580, 2010.
Utlu, M., Öztürk, M. Z., Şimşek, M., and Akgümüş, M. F.: Evaluation of rockfall hazard based on UAV technology and 3D Rockfall Simulations, International Journal of Environment and Geoinformatics, 10, 1–16, https://doi.org/10.30897/ijegeo.1323768, 2023.
van Steijn, H.: Long-term landform evolution: evidence from talus studies, Earth Surf. Proc. Land., 27, 1189–1199, https://doi.org/10.1002/esp.420, 2002.
Western Regional Climate Center: https://wrcc.dri.edu, last access: 14 August 2025.
Whalley, B.: Rockfalls, in: Slope Instability, Wiley, Chichester, UK, 217–256, 1984.
Wieczorek, G. F. and Jäger, S.: Triggering mechanisms and depositional rates of postglacial slope-movement processes in the Yosemite Valley, California, Geomorphology, 15, 17–31, https://doi.org/10.1016/0169-555X(95)00112-I, 1996.
Wright, B. E., Plumb, P., Wright, J., and Biles, F. E.: Historical photographs from U.S. Forest Service research and development activities in Alaska, https://doi.org/10.2737/RDS-2021-0084, 2021.
Wyllie, D. C. and Mah, C. W.: Rock Slope Engineering, 4th edn., Spon, 456 pp., 2004.
Yehle, L. A. and Lemke, R. W.: Reconnaissance engineering geology of the Skagway area, Alaska with emphasis on evaluation of earthquake and other geologic hazards, USGS Open File Report, https://doi.org/10.3133/ofr72454, 1972.
Zhou, X., Chen, J., Chen, Y., Song, S., Shi, M., and Zhan, J.: Bayesian-based probabilistic kinematic analysis of discontinuity-controlled rock slope instabilities, Bull. Eng. Geol. Environ., 76, 1249–1262, https://doi.org/10.1007/s10064-016-0972-5, 2017.