the Creative Commons Attribution 4.0 License.
the Creative Commons Attribution 4.0 License.
 | 26 Feb 2025
Content analysis of multi-annual time series of flood-related Twitter (X) data
Heidi Kreibich
Jens A. de Bruijn
Jeroen C. J. H. Aerts
Andrea Cominola
Social media can provide insights into natural hazard events and people's emergency responses. In this study, we present a natural language processing analytic framework to extract and categorize information from 43 287 textual Twitter (X) posts in German since 2014. We implement bidirectional encoder representations from transformers in combination with unsupervised clustering techniques (BERTopic) to automatically extract social media content, addressing transferability issues that arise from commonly used bag-of-words representations. We analyze the temporal evolution of topic patterns, reflecting behaviors and perceptions of citizens before, during, and after flood events. Topics related to low-impact riverine flooding contain descriptive hazard-related content, while the focus shifts to catastrophic impacts and responsibilities during high-impact events. Our analytical framework enables the analysis of temporal dynamics of citizens’ behaviors and perceptions, which can facilitate lessons-learned analyses and improve risk communication and management.
- Article
(1635 KB) - Full-text XML
-
Supplement
(763 KB) - BibTeX
- EndNote


Flood frequency and the severity of their impacts are exacerbated by climate change and urbanization (Paprotny et al., 2018). Developing new strategies to improve human response to flooding is crucial to safeguard lives, protect property, and enhance community resilience (Baldassarre et al., 2015).
Human response to natural hazards improves with people's ability to communicate and share information and experiences (Mileti, 1995; McCarthy et al., 2007; Giordano et al., 2017; Hong et al., 2018; Sermet and Demir, 2018). An emerging research topic is the role of social media in the communication of disaster risk management (Sermet and Demir, 2018; Zhang et al., 2019). Social media is used to quickly distribute critical information; enable real-time communication; aid in emergency response coordination; and provide a platform for affected individuals to share firsthand observations, insights, and personal experiences (Houston et al., 2015). Those mechanisms help enhance situational awareness, support, and resilience (Houston et al., 2015). For many years, individuals and organizations have engaged with social media platforms alongside traditional means of communication (Houston et al., 2015). This frequent usage of social media provides new opportunities for risk assessment and management (Fraternali et al., 2012; Lin et al., 2016). Social media captures immediate personal experiences and emotional impacts that might be overlooked in conventional assessments but lacks the standardized methodology and detailed technical measurements found in traditional sources. Therefore, analyses of social media data should be seen not in isolation but as complementary analyses that enhance traditional flood impact assessments by providing rapid situational awareness and capturing the social dimensions of flood impacts that might otherwise go undocumented.
Previous research has demonstrated correlations between the number of tweets and hazard extent or impact (de Bruijn et al., 2019; Barker and Macleod, 2019; Sodoge et al., 2024). Furthermore, studies have developed methodologies to evaluate the content (topics) and function of social media posts for specific hazard events (Kent and Capello, 2013; Cho et al., 2013; Huang and Xiao, 2015; Spence et al., 2015; Barker and Macleod, 2019; Donratanapat et al., 2020). Temporal and spatial patterns of social media use during disasters vary for different hazard types (Zhang et al., 2019). The rise in tweets related to floods or hurricanes is shallower and less abrupt than the spikes observed in relation to earthquakes (Cresci et al., 2017). Several case studies have reported that users located close to a natural hazard, for example, the Horsethief Canyon Fire in 2012 (Kent and Capello, 2013) or Hurricane Sandy (Huang and Xiao, 2015), are more likely to post on social media than those at a distance. Huang and Xiao (2015) evaluated Twitter posts during Hurricane Sandy in 2012, showing that, before the hurricane, an increase in sharing traditional news outlets that published warnings was observed. During and after the event, the tweets focused on reporting impact. Focusing on the 2011 earthquake in Japan, Cho et al. (2013) assessed the content of tweets during a 40 h period. They found that the tweets associated with emotional content decreased from 23.0 % in the beginning to 5.3 % in the aftermath of the earthquake. A study on Hurricane Sandy in 2012 revealed that, as the event unfolded, the number of tweets displaying emotional reactions increased, while those providing information about the hurricane decreased (Spence et al., 2015). Understanding the content of flood-related social media posts can be beneficial for risk management, but challenges related to social media data reliability and retrieving actionable information from social media (Gopal et al., 2024), along with the lack of long-term evidence on the effectiveness of crisis communication on social media (Lin et al., 2016), are still open. Furthermore, social media analyses can provide a basis for validating flood risk models based on reports and pictures of inundated areas and related impacts (Fohringer et al., 2015; Rözer et al., 2021).
While the literature consistently shows that it is feasible to deduct information on disaster risk and management from social media posts, the methodologies that are used to extract the contents lack transferability and the underlying data are mostly event-specific (Zhang et al., 2019; Gopal et al., 2024). Previously applied methodologies use keyword-based pre-selection when retrieving content online and apply methodologies that rely on manual labels or word counts. Word meaning, word frequency, and specific keywords change over time, making these approaches not adaptable to evolving language dynamics and new events. Additionally, the number of posts that can be analyzed is limited by either the availability of a labeled training dataset, for example when using a supervised classification approach such as logistic regression (Huang and Xiao, 2015), or the feasibility of completely manual labeling (Cho et al., 2013; Spence et al., 2015). Another common approach is latent Dirichlet allocation (LDA) (Aubert et al., 2013; Han and Wang, 2019; Wu et al., 2021). The hierarchical Dirichlet process (HDP) extends LDA by automatically determining the number of topics, enabling more flexible and scalable topic discovery. Latent semantic analysis (LSA) utilizes singular value decomposition to reduce dimensionality and capture underlying relationships between terms and documents. Non-negative matrix factorization (NNMF) decomposes the term–document matrix into non-negative matrices (Churchill and Singh, 2022). However, since language and word usage can vary based on different events and places, these methods are not feasible for consistently studying multiple events. Moreover, word-frequency-based methods do not account for semantic relationships. Unsupervised approaches that do not require labeling and context-dependent representation of the input data are required to apply content modeling over longer time spans automatically.
The recent development of open-source large-scale language models that are pre-trained on a big corpus of text data (see, for example, Reimers and Gurevych, 2019) provides an opportunity to study multiple events; however, these models are underrepresented in environmental modeling applications (Konya and Nematzadeh, 2024). Transformer models outperformed other embedding-based content modeling approaches that have extracted information from textual Twitter (X) data on Covid-19 (Egger and Yu, 2022) and have been applied to sentiment analysis on geolocated tweets from Hurricane Ida (Tounsi et al., 2023). Based on these recent insights, the objective of our research is to analyze the content of social media posts to gain knowledge about citizens' behavior and their perceptions of floods over a long time period for multiple heterogeneous flood events. In this study, we aim to develop a transferable approach for the automatic extraction of content from multi-annual social media posts and to derive insights into the behaviors and perceptions of citizens before, during, and after flood events.
To track the content of flood-related textual Twitter (X) posts before, during, and after several flood events in Germany from 2014 to 2023, we employ a transformer-based model as our topic detection method. First, the text data are embedded into a high-dimensional vector space, leveraging the context-dependent meaning of the words contained. This approach ensures applicability across various events and large datasets in different languages. Next, utilizing the vectorized representation of the text data, we perform clustering to extract topics. The resulting clusters serve as a meaningful representation of the content in terms of topics within the data (Grootendorst, 2022).
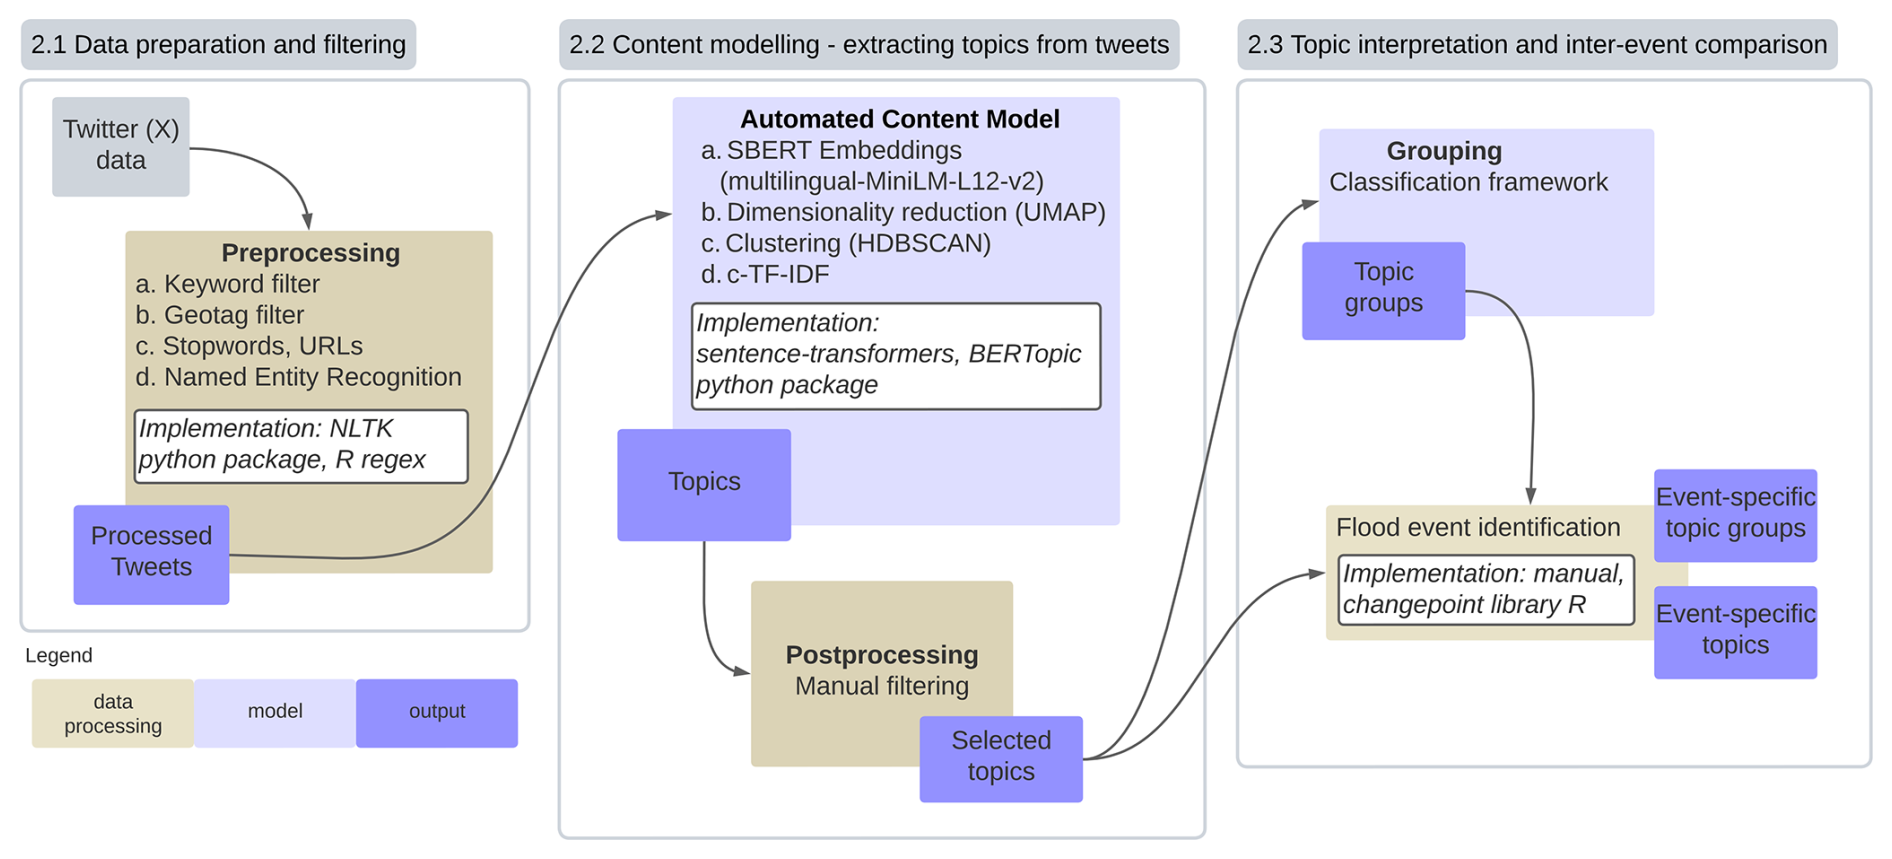
We adapt the topic modeling pipeline proposed by Grootendorst (2022) to analyze content and extract topics from flood-related textual Twitter (X) posts. Figure 1 shows the three main steps of our framework, which relies on textual Twitter (X) data as input.
-
In a data preparation step, the input textual Twitter (X) data are prepared by cleaning, for example removing URLs, and filtering out non-flood-related keywords (step “Data preparation and filtering” in Fig. 1, Sect. 2.2, and Sect. S1.2.1 in the Supplement).
-
The “Content modeling – extracting topics from tweets” (Sect. 2.3) step is to extract a vectorized representation of the text (embeddings) utilizing a sentence transformer model (SBERT, version: paraphrase-multilingual-MiniLM-L12-v2; Reimers and Gurevych, 2019). Here, the text data are transformed, capturing the semantic meaning of sentences (middle box, step a, in Fig. 1). This enables the model to understand the contextual relationships between words and phrases. To handle the high-dimensional nature of the embeddings, we apply a dimensionality reduction technique: uniform manifold approximation and projection for dimension reduction (UMAP) (McInnes et al., 2018) (middle box, step b, in Fig. 1). This reduces the complex data while preserving their essential structure and improves the performance in the next steps. To this simplified representation, we apply the HDBSCAN clustering algorithm to group similar embeddings together, forming clusters that represent distinct topics within the data (middle box, step c, in Fig. 1).
-
The last step (“Topic interpretation and inter-event comparison”) facilitates the identification of common themes and subjects discussed in the text. The clustered topics are refined through post-processing, where undetected noise and irrelevant information are further filtered out (middle box, Fig. 1). This step ensures that the extracted topics are meaningful and relevant to the research objectives. For interpretation purposes, we apply a manual process to assign a meaningful category to each cluster (right-hand box, Fig. 1). Here, we provide context for and interpretation of the identified topics, aligning them with a state-of-the-art classification framework (Houston et al., 2015).
Additional information on implementation and software is available in Sect. S1.1.
2.1 Data collection
The specifics of data collection can be found in de Bruijn et al. (2017, 2019). The following section describes the processing performed by de Bruijn et al. (2017, 2019) followed by an overview of the additional processing performed in this study, which is described in detail in Sect. 2.2. The full dataset was collected based on the former Twitter (X) API in 11 languages (de Bruijn et al., 2019). The data collection and processing involve three main types of input data. First, the authors of de Bruijn et al. (2017, 2019) used a database of known geolocations, which contains over 4 million geographical locations including cities, towns, villages, and administrative divisions, along with alternative names and translations. Second, they collected tweets and associated metadata in real time through the Twitter (X) streaming API using flood-related keywords in 11 languages, gathering 55.1 million tweets between July 2014 and July 2017. The keywords included terms like “flood”, “flooding”, and “inundation” and their equivalents in other languages. Third, they utilized GIS shapefiles of global time zones and analyzed Wikipedia articles to obtain lists of the 1000 most commonly used words per language (excluding location names with populations over 100 000). The data processing involved matching tweet text to the gazetteer through toponym recognition, scoring candidate locations based on spatial indicators, grouping related tweets, and using a voting process for toponym resolution. The system processes tweets in 24 h windows and maintains a toponym resolution table to enable real-time geoparsing of new incoming tweets. Relevance to flooding was further ensured by classification and pre-selection based on BERT.
Based on these data, we additionally performed a combination of keyword and geolocation searches during the data pre-processing to obtain tweets related to flooding events in our study areas. We analyze a sample of textual Twitter (X) posts (n=43 287) collected from 2014 to 2022. Our sample includes all tweets posted during this time containing one or more of the three flood-related keywords (Hochwasser, Überflutung, Flut) written in German and geotagged within Germany. The table for all keywords in other languages is available at https://www.nature.com/articles/s41597-019-0326-9/tables/2 (last access: 21 February 2025, de Bruijn et al., 2019).
2.2 Data preparation and filtering
Before passing the data to our modeling pipeline, we performed several cleaning, filtering, and pre-processing steps. First, posts were eliminated based on 13 keywords that indicate non-flood-related contexts. For example, any tweet containing variations of the words “fachkräfte-flut” [flood of skilled workers] was removed from the dataset. The keywords were identified in the exploratory data analysis when screening the texts. Second, we removed URLs and stop words from the remaining tweets based on a dictionary of German stop words. To avoid creating topics based on frequently mentioned locations or users while keeping sentence structure intact, we replaced mentions of locations of users with general examples. We replaced locations with the German word describing the NUTS 3 region associated with the respective geotag. The geotags were linked to each tweet available and extracted according to the method proposed by de Bruijn et al. (2017). The removal was performed by matching the identified words with the words within the tweet. If a user was tagged specifically with their username (@thisusernamewastagged), we replaced the username with the German word for user (Benutzer). Details about how often Twitter users post are elaborated in Sect. S1.2.3. We removed all other entities, such as names of people, places, and organizations, automatically after named entity recognition was performed. In this pre-processing step, we tokenized the tweets and performed part-of-speech tagging, where each chunk of a sentence was labeled according to its grammatical function. Those words labeled as entities were removed from the text. The resulting pre-processed tweets were then passed to the automated content model.
2.3 Content modeling
In the following we formulate and describe the methodological details of the transformer embedding, clustering steps, and class-based term frequency–inverse document frequency (c-TF-IDF). The algorithm of bidirectional encoder representations from transformers in combination with unsupervised clustering techniques (BERTopic) represents the fully automated core of our proposed framework. We interpret the automatically formulated topics in Figs. 3 and 4 and Sect. 3.2 and 3.3. Results in Figs. 3 and 4 are independent of the manual classification that follows in the results of Sect. 3.4 and Fig. 5.
(a) SBERT
We process the tweets with a pre-trained transformer model (SBERT, version: paraphrase-multilingual-MiniLM-L12-v2), which creates a 384-dimensional dense vector representation of the tweets (Reimers and Gurevych, 2019). SBERT is an extension of BERT (Devlin et al., 2019), which is optimized for classification or clustering semantically similar sentences. SBERT is suitable for our study, since we aim to cluster the embeddings to extract topics which represent tweets with similar content. While SBERT is pre-trained on general-purpose datasets, we found its performance on our disaster-related corpus to be robust. For verification, we conducted an experiment where we compared a German model (German BERT) (Darji et al., 2023) and a model trained on tweets specifically (TwHIN-BERT) (Zhang et al., 2023), where we found that the topics were less distinct and interpretable. Thus, we proceeded with the pre-trained SBERT model to maintain generalizability, aiming to demonstrate an approach which, in the future, can be adapted to different contexts and case studies.
(b) UMAP and (c) hierarchical density-based clustering
As clustering performance has been shown to decline in high-dimensional space (Allaoui et al., 2020), we reduce the embeddings to a three-dimensional space using UMAP (McInnes et al., 2018). The reduced embeddings are categorized with hierarchical density-based clustering (HDBSCAN) (McInnes et al., 2017). More information on the hyperparameter tuning is described in Sect. S1.2.2. To evaluate the quality of our HDBSCAN clustering, we calculate the density-based clustering validation (DBCV) score (Moulavi et al., 2014). Based on the definition whereby clusters represent areas of higher density amongst regions of lower density, a relative validity measure is calculated by combining the shape and density properties of the cluster. The density is evaluated relative to the density in a cluster representing the background noise. We obtained a positive score of 0.24 within the DBCV range of −1 to 1, which validates the effectiveness of our clustering approach in identifying distinct topics within the tweet corpus.
While the thorough pre-processing significantly improved our textual data quality, some unstructured, non-actionable textual Twitter (X) posts will still show up in clustering. The chosen BERT embeddings are robust when confronted with word substitution attacks (Hauser et al., 2021). Further, we chose HDBSCAN, which combines hierarchical clustering to avoid ambiguity and density-based methods to account for the noise in the dataset. In the first clustering step, the denser areas are separated from the surrounding points to separate areas of interest from the background noise, that is, in our case, unstructured texts. Following the separation of unstructured text and clusters of similar content discussed often, a minimum spanning tree is constructed based on a weighted graph containing the embedded textual tweets as vertices and their weighted connection based on the mutual reachability distance. Based on this, we construct a hierarchy of connected components, which is then used to cut the dataset into clusters within the hierarchical structure. These steps minimize ambiguity between the clusters by using a condensed clustering tree and defining the clusters by minimum cluster size (in this case 20). Our further analysis accounts for this limitation by focusing on aggregate trends rather than individual posts.
(d) Class-based term frequency–inverse document frequency
In the next step we aim to understand the meaning of each topic by representing a topic with 10 keywords. The representative words may contain two consecutive words as one keyword. To achieve this we use class-based term frequency–inverse document frequency (c-TF-IDF) as proposed by Grootendorst (2022). All tweets from the same cluster are combined and treated as one document. With this representation, the c-TF-IDF of a word x in cluster c (Wx,c) is calculated as described in Eq. (1). The c-TF-IDF is calculated based on the frequency of a word in all classes (fx), frequency of words (tfx,c) within a cluster, and mean number of words (A) within a class.
Post-processing
With this approach we obtained a large number of topics that were passed to a post-processing pipeline. Similarly to the filtering steps in the pre-processing, we manually scanned and excluded the topics based on whether the keywords indicated flood-related content. Additionally, topics with fewer than 50 instances over the whole time span were excluded in this analysis. To aid the inter-event comparison, we adopted a functional framework for social media use from Houston et al. (2015). The authors proposed that social media can have 15 types of functions that are associated with the three phases of an event (pre-event, event, post-event). Pre-event, the tweets can be used to spread preparedness information or provide warnings. Shortly before the event or once the event has started, users can signal and detect the disaster on social media. During the event, requesting help and sharing the condition and location of flood-affected individuals become more important. Documentation, consuming news coverage, receiving response information, volunteering, and receiving health support as well as expressing emotions and sharing stories about the disaster happen during and after the event. Post-event tweets can start discussions on scientific and socio-political causes as well as connecting community members and coordinating the implementation of traditional crisis communication activities. We manually associate the topics obtained from our model with their respective function in the framework. We refer to the direct model results as topics and to the classified topics as topic groups. We manually classify all topics with 50 instances or more into the topic groups. To counteract confirmation bias, we assign the topic groups before we examine the temporal results.
2.4 Topic interpretation and inter-event comparison
To evaluate our model we follow a “zoom-in” approach to gain insights at varying levels of detail and context. Initially, we analyze the entire time series but divide it into periods of flooding and non-flooding as a baseline. We observe distinct topic patterns in Twitter (X) by comparing the topics and topic diversity for the two subgroups. Next, we narrow our focus to the weeks around five distinct flood events, comparing how individual topics evolve over time during these periods. With this approach, we evaluate which topics arise commonly and how they vary across different flood types by looking at specific topics over time. Lastly, we aggregate topics throughout the entire event duration to compare broader categories. This allows us to compare the general topics across different flood types.
2.5 Flood events
We analyze a sample of textual Twitter (X) posts (n=43 287) collected from 2014 to 2022. Our sample includes all tweets posted during this time containing one or more of the three flood-related keywords in German (Hochwasser, Überflutung, Flut). The table for all keywords in other languages is available at https://www.nature.com/articles/s41597-019-0326-9/tables/2 (last access: 21 February 2025, de Bruijn et al., 2019). Figure 2 shows the number of daily tweets we used for our analysis after the initial filtering steps. We selected five events between 2016 and 2021 (Table 1). Based on these events, we will qualitatively evaluate our approach and results. The most discussed flood in our dataset (E5) occurred in July 2021 in Europe and western Germany. This event was caused by the atmospheric low-pressure system Bernd, which brought heavy rainfall to two German federal states as well as adjacent countries (Luxembourg, Belgium, and the Netherlands) (Mohr et al., 2023). The flood caused 189 fatalities and losses of around EUR 33 billion in Germany, making it the most severe natural disaster in recent German history (Munich Re, 2022). In 2016 persistent atmospheric conditions triggered a large number of heavy convective rainfall events, resulting in local but extreme flash floods, particularly affecting the towns of Simbach am Inn in Bavaria and Braunsbach in Baden-Württemberg (E1). These events caused 54 fatalities in Simbach and substantial economic damage in both towns (Laudan et al., 2017; Hübl and Rimböck, 2018; Bronstert et al., 2018). The flood events were associated with a return period above 100 years, and the discharge of the Simbach Creek was further increased by dam and dike failures (Hübl and Rimböck, 2018). E1 and E5 represent flash floods with high impact in terms of fatalities as well as economic damage that occurred in our observation period. During both events the peak daily tweet frequency exceeded 1500 tweets per day.
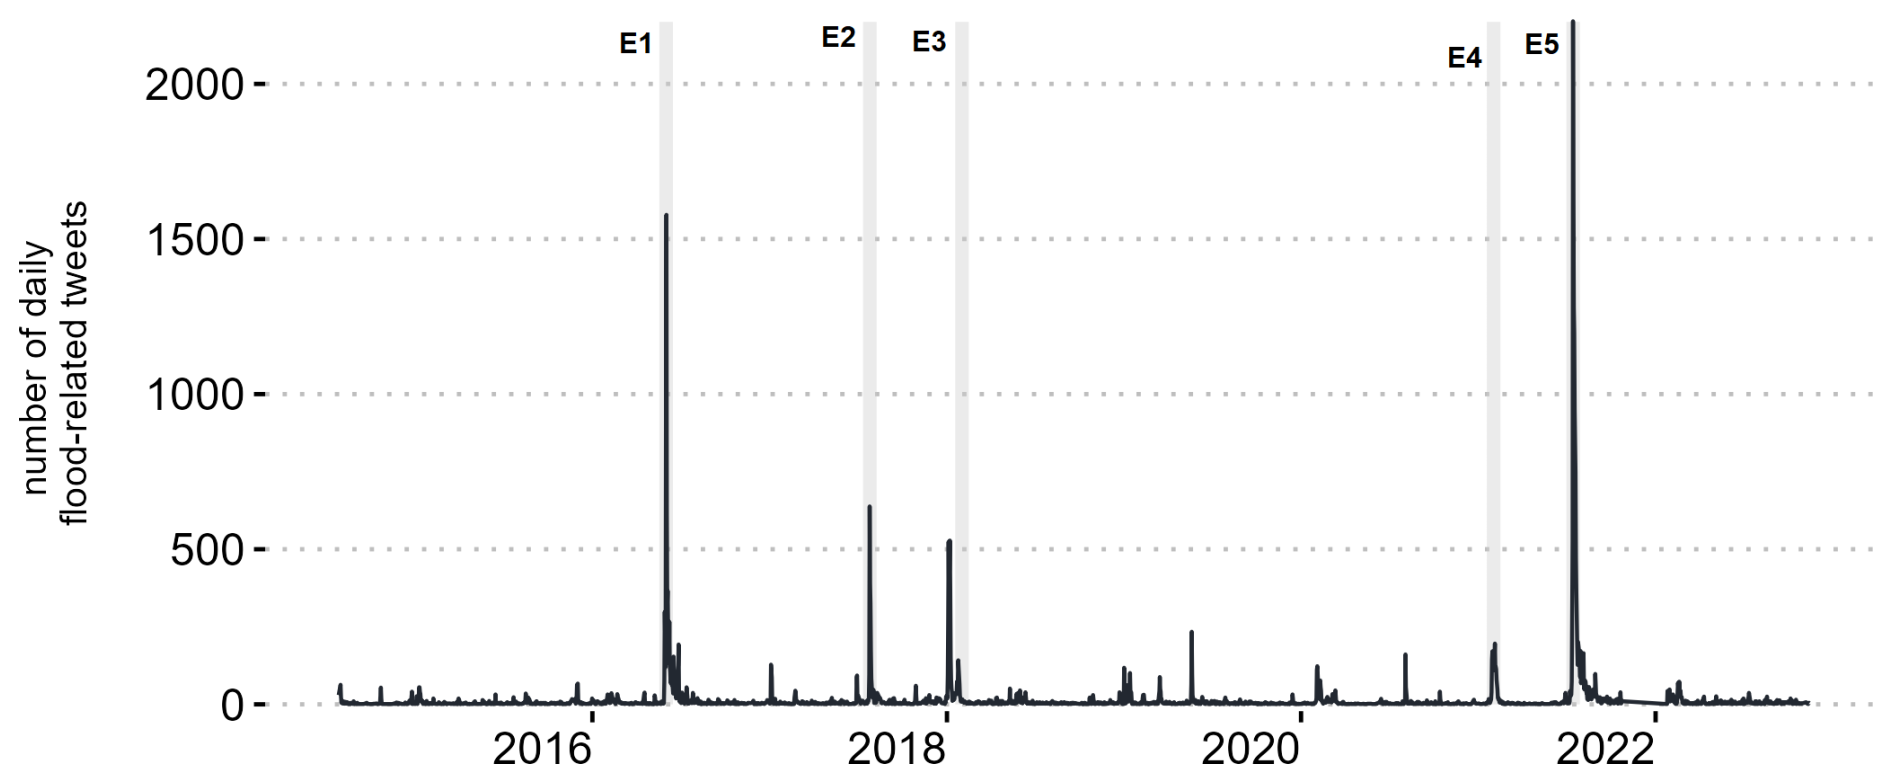
Figure 2Daily number of tweets over the observed time period (black line). The gray lines labeled E1–E5 mark the occurrence of the selected flood events within the time series, which are further described in Table 1. The shaded areas show their time frames and highlight the specific peak time we consider for the selected flood events.
Table 1Features of the five flood events selected for comparison in this study.
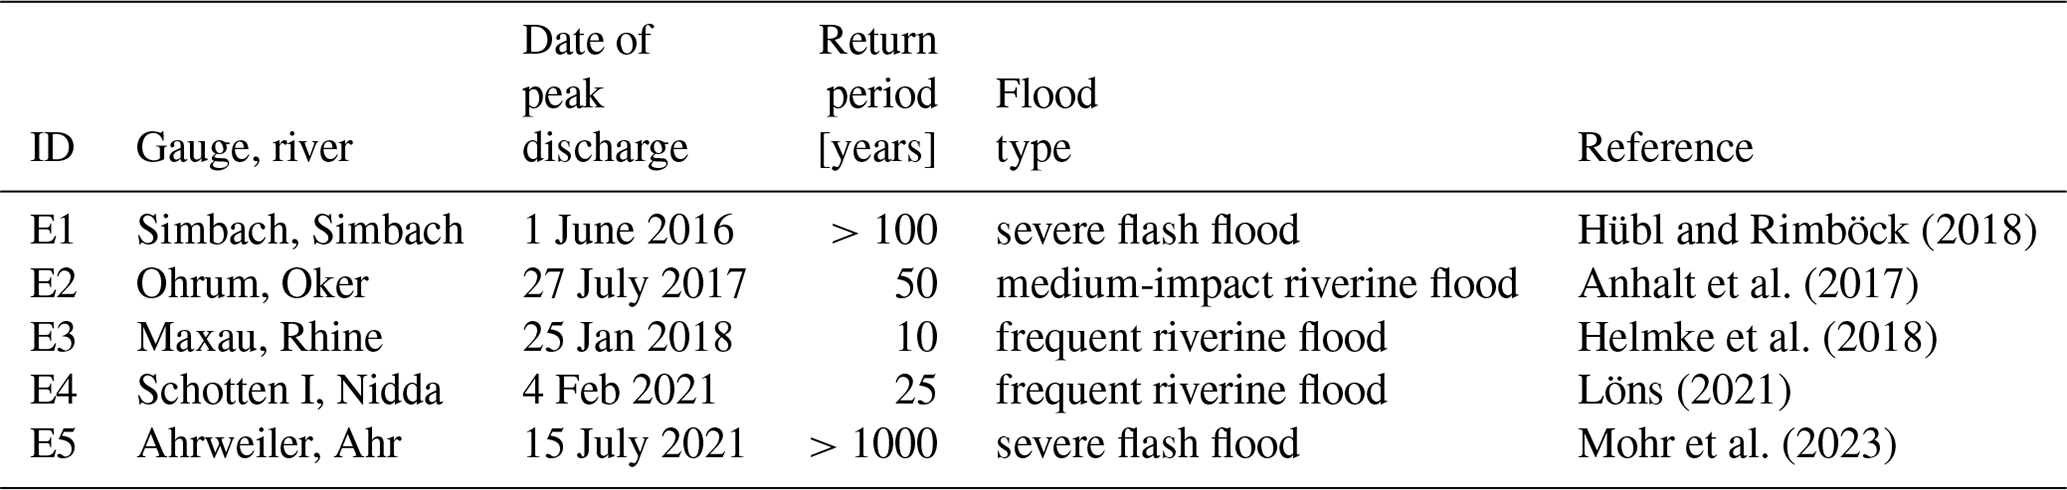
On 25 July 2017, the area between Göttingen and Braunschweig in Lower Saxony was affected by a flood (E2) caused by 3 d of continuous rain due to the low-pressure system Alfred. In the Nette and Oker rivers, two gauges reported return periods of 100 years, and on the Innerste River, two gauges reported even higher return periods (Anhalt et al., 2017). No fatalities occurred; however, 12 individuals were displaced by the flood (Brakenridge, 2025) and reported damages were on the order of millions of euros (Anhalt et al., 2017). In our topic analysis, E2 is evaluated separately and represents a medium-impact event.
In January 2018, torrential rains and storms combined with snowmelt resulted in high water levels in many German regions, with moderate floods (maximum return period of 10 years in Maxau, Rhine) (E3) (Helmke et al., 2018). In the last week of January and the beginning of February 2021, continuous rain along with a thaw period led to increasing discharge in Hesse (E4) (Löns, 2021). In February 2018 the municipality of Büdingen was affected increasingly by the flood and 70 people were evacuated from the old town (Löns, 2021). The discharge in the river Nidder, which caused the flooding, exceeded a return period of 100 years; most of the other rivers in the region experienced maximum discharge levels with return periods of between 2 and 50 years. E3 and E4 represent events that are expected to occur more frequently with lower impact in terms of monetary damage and fatalities.
To evaluate the topic model, we compare the topic group frequency for the high-impact flash floods E1 and E5, moderate flooding, and low-impact riverine flooding and the temporal development of topics over time for E3 and E4.
Flood severity was classified based on official warning levels by LUBW (2024) using return periods of water levels. This classification corresponds to the official warning levels in Germany.
3.1 Full dataset results
Our first key finding from the tweet analysis shows that approximately 78 % of the analyzed tweets contain valuable information for disaster management. While this is a promising result to dig further into in the following topic extraction and analysis phase, it also shows that a non-negligible portion of tweet posts in our dataset are classified as noise or irrelevant information despite the thorough selection of tweets according to flood-related keywords. A total of 10 183 tweets are identified as noise by the algorithm. Of these, 7233 tweets belonging to 34 topics were manually removed (post-processing in Fig. 1). Those tweets were not considered for our further analysis due to their lack of meaningful content with respect to our research objective. Figure S2 in the Supplement shows the temporal development of monthly tweets that were not assigned to a relevant topic. Here, we find that the progression of the noise in the data follows the path of the daily time series (see Fig. 2). This leads to the conclusion that noise is proportionally equally distributed during the selected events and the baseline.
Over the whole time period of our analysis, we found 500 distinct topics in flood-related tweets. To refer to topics in this section, we use the numerical topic ID followed by the most accessible keyword or element from the representative tweets reported in Tables S1 and S2 (for example topics “T-0 information” and “T-1 weather extremes”). The topic ID starts at 0 and is inversely correlated to the number of tweets assigned to the topic across the entire temporal span. Consequently, topic T-0 shows the highest tweet count, while topic T-489 achieves the lowest incidence over the course of 5 years. Specific topics are analyzed in Figs. 3 and 4.
3.2 Aggregated topic analysis
As a first step to analyze the content of tweets, we focus on the topics that were most frequently observed in a single day (Fig. 3). The numbers on the bars represent the topic labels, with labels increasing in value from the most to the least frequent across the entire time period. Each bar shows an event period or the event-free period. Therefore, if the same topic numbers appear in different bars, the content of tweets during these events is similar. Figure 3 shows that the most frequent topics over the whole time period (“T-0 water authorities” and “T-1 weather extremes”) are also represented in the maximum daily occurrence for E3 and E4, which is in the low-impact event group. “T-0 water authorities” and “T-1 weather extremes” primarily contain tweets that describe reports of water levels (representative tweets: “pegel bundesland aktuelle hochwasser info liegt vor mehr unter” [water gauge federal state current flood more info available below]). These topics are mostly linked to generic posts on water levels as posted by @hochwasserportal_de (flood portal) and then shared among users. Event-free times are marked by a consistent, small number of tweets related to “T-0 information”, “T-1 weather extremes”, “T-3 meters mark”, and so on. This pattern leads to a high overall sum (as shown in Fig. S1 in the Supplement) but with only a few daily occurrences. Topics that received the highest daily attention on Twitter (X) for E1 and E5, which represent high-impact flash floods, are related to reports of fatalities and missing people (“T-110 deaths”, representative tweet: “three dead in flood in district”; “T-48 destruction”, representative tweet: “four dead in flood disaster in federal state”; “T-7 disaster management”, representative tweet: “civil protection rehearsed the emergency months ago and failed flood”) as well as to political implications (“T-24 chancellor”, representative tweet: “new contribution after flood Merkel in city Tagesschau”; “T-122 euro”, representative tweet: “Soeder announces euro immediate aid for flood victims federal state pays the affected”). A full list of representative tweets and keywords of the topics mentioned in this paragraph is included in Tables S1 and S2. In contrast to the topics observed for E3 and E4, these are event-specific topics that are most likely shared due to personal concern and shock. During E2 (medium-impact flooding) the discussion on Twitter (X) focused on event-specific topics that described impacts (“T-152 dam guards”, representative tweet: “flood in country the night was calm flood in federal state is somewhat relaxing”; “T-154 electronics fair”, representative tweet: “flood district declares disaster alarm”; “T-178 falling”, representative tweet: “flood in federal state water levels are dropping only slowly”). The wording of topics related to E2 is not predominantly generic like for the low-impact flood events, but it still remains pragmatic, analytical, and descriptive compared to the wording of topics related to E1 and E5.
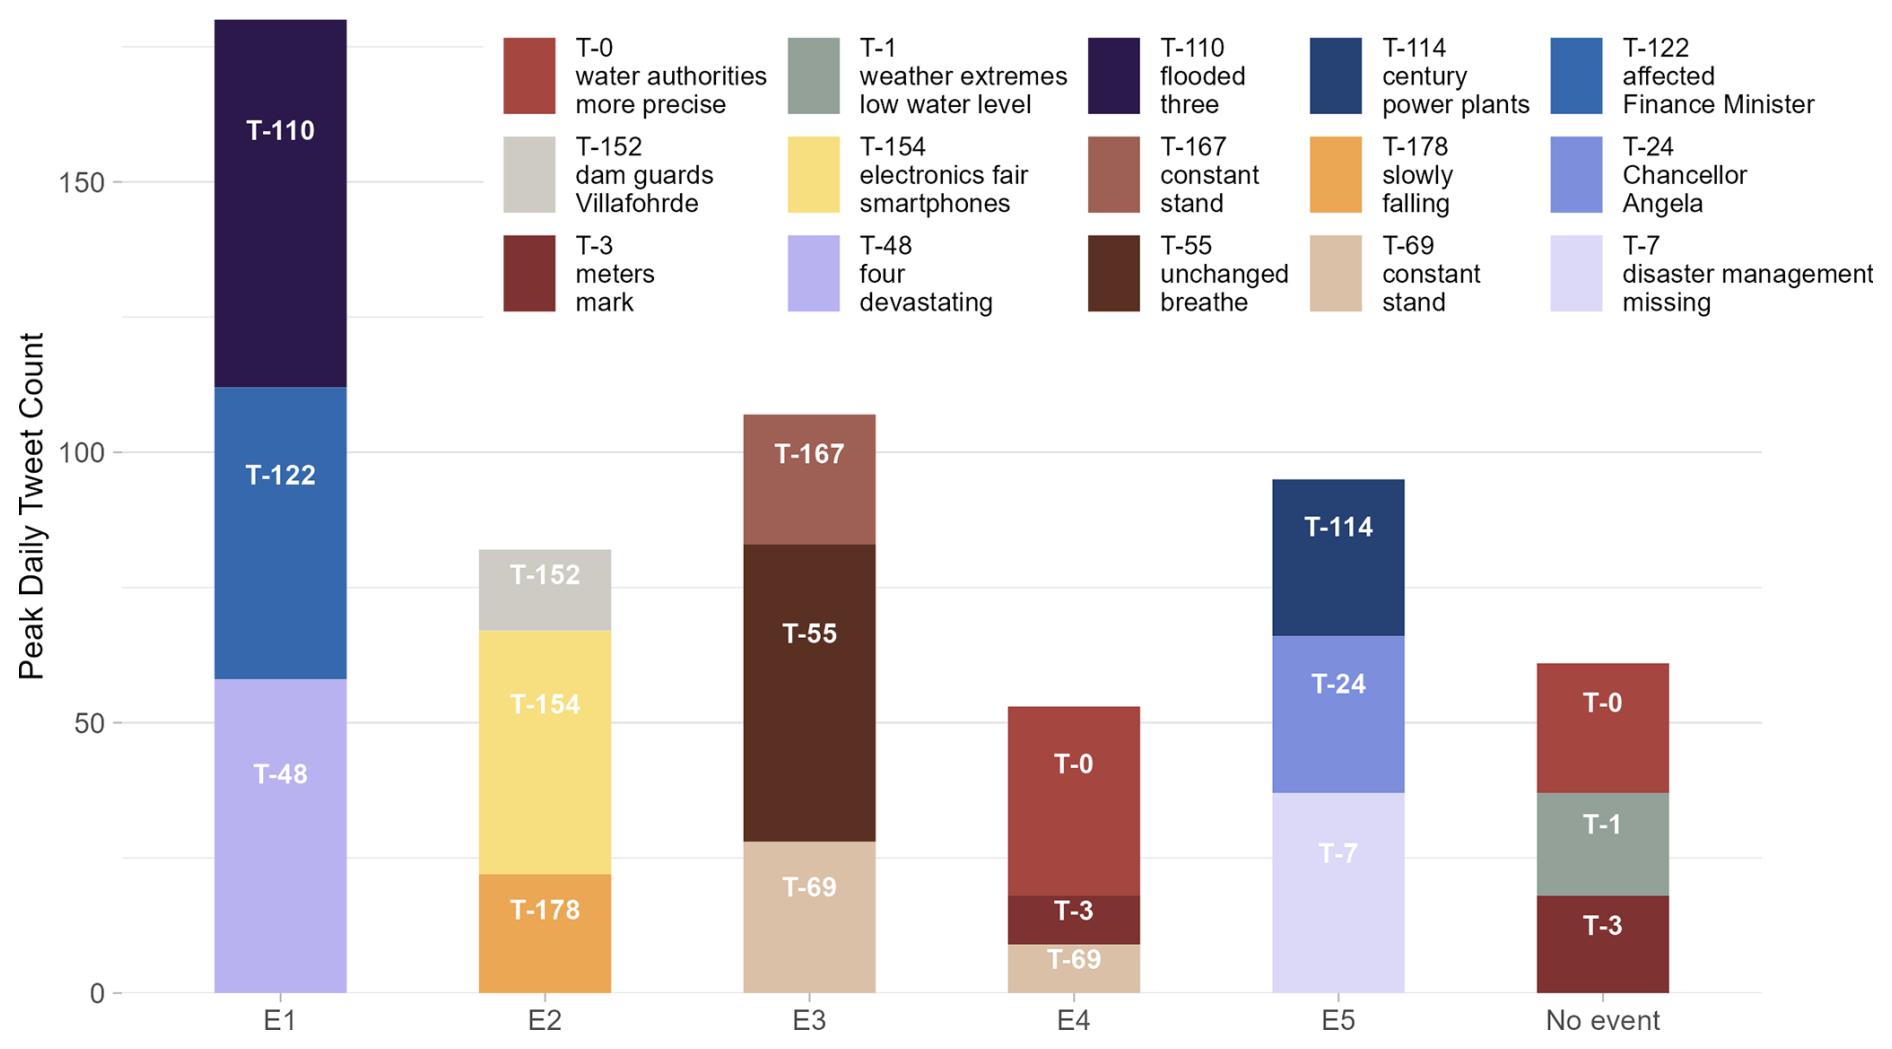
Figure 3Stacked bar chart for topics that occurred most frequently in a day during the baseline period (no event) and the different flood events (E1–E5). E4 and times without events show textual Twitter (X) posts with the topic administrative updates (T-0 water authorities), weather conditions (T-1 weather extremes), and infrastructure status (T-3 meter marks); E5 also includes a topic related to infrastructure status (T-114 power plants). During E1, disaster impacts (T-48 devastating damage, T-110 flooded) are discussed. E5 includes a topic on emergency response (T-7 disaster relief), while the retreat of water levels (T-55 unchanged) is mentioned frequently during E3. The topics presented in this figure are the results from the HDBSCAN clustering and c-TF-IDF analysis.
Overall, we observe a shift in tweet topics from spreading general information about water levels to discussing more complex and impact-focused topics during events. To gain a better understanding of this dynamic and particularly of the content shared over time during the different phases of a disaster, we further undertake a temporal analysis.
Table 2Number of different topics that occur in a 40 d time window enveloping the flood peak.
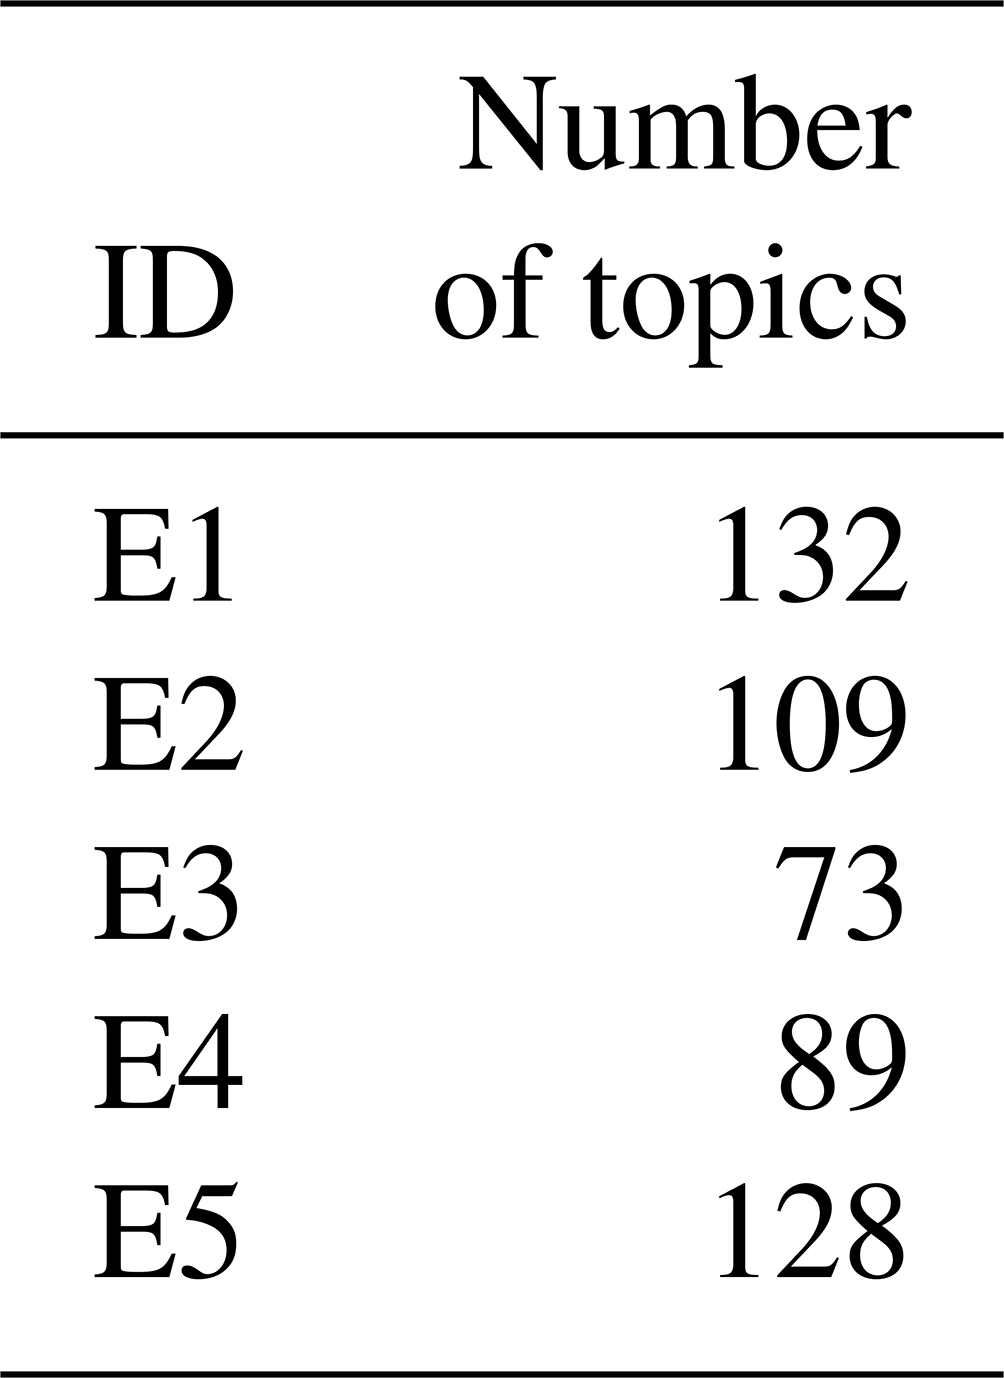
Additionally, aggregated topic patterns during floods are characterized by the number of different topics that occur in a 40 d time window enveloping the flood peak (see Table 2). Events that are predominantly flash floods with a higher impact result in a wide range of topics (E1: 132; E5: 128). Lower-impact riverine flood events resulted in fewer different topics discussed on Twitter (X) (E2: 109; E3: 73; E4: 89). Moreover, the distribution of topic appearances related to high-impact floods is more heterogeneous. Table 2 shows the distribution of the count of all topics for E4 and E5, both of which occurred within the same year and region. To mitigate the potential noise introduced by topic diversity, we used the HDBSCAN clustering algorithm, which contains a hierarchical topic extraction step. Primary topics, i.e., topics which occur consistently, are given higher weights in the methodology, based on their mutual reachability distance. Topics with a lower relevance, while contributing to the overall understanding of the event, were given lower weights when condensing the clusters. This approach allows us to maintain focus on critical information while still capturing the broader context of the event. For E4 there is one distinct peak in Fig. 5, indicating a focus on few topics within the 89 total topics. For E5 we see many peaks, indicating frequent occurrence of many of the 128 topics. This shows that the tweet content of high-impact events is more diverse and complex. These findings suggest that topic diversity might be used as an indicator to rapidly predict flood impact. We observe that the presence of greater topic diversity in tweets may be indicative of potential for high-impact events.
3.3 Temporal topic analysis
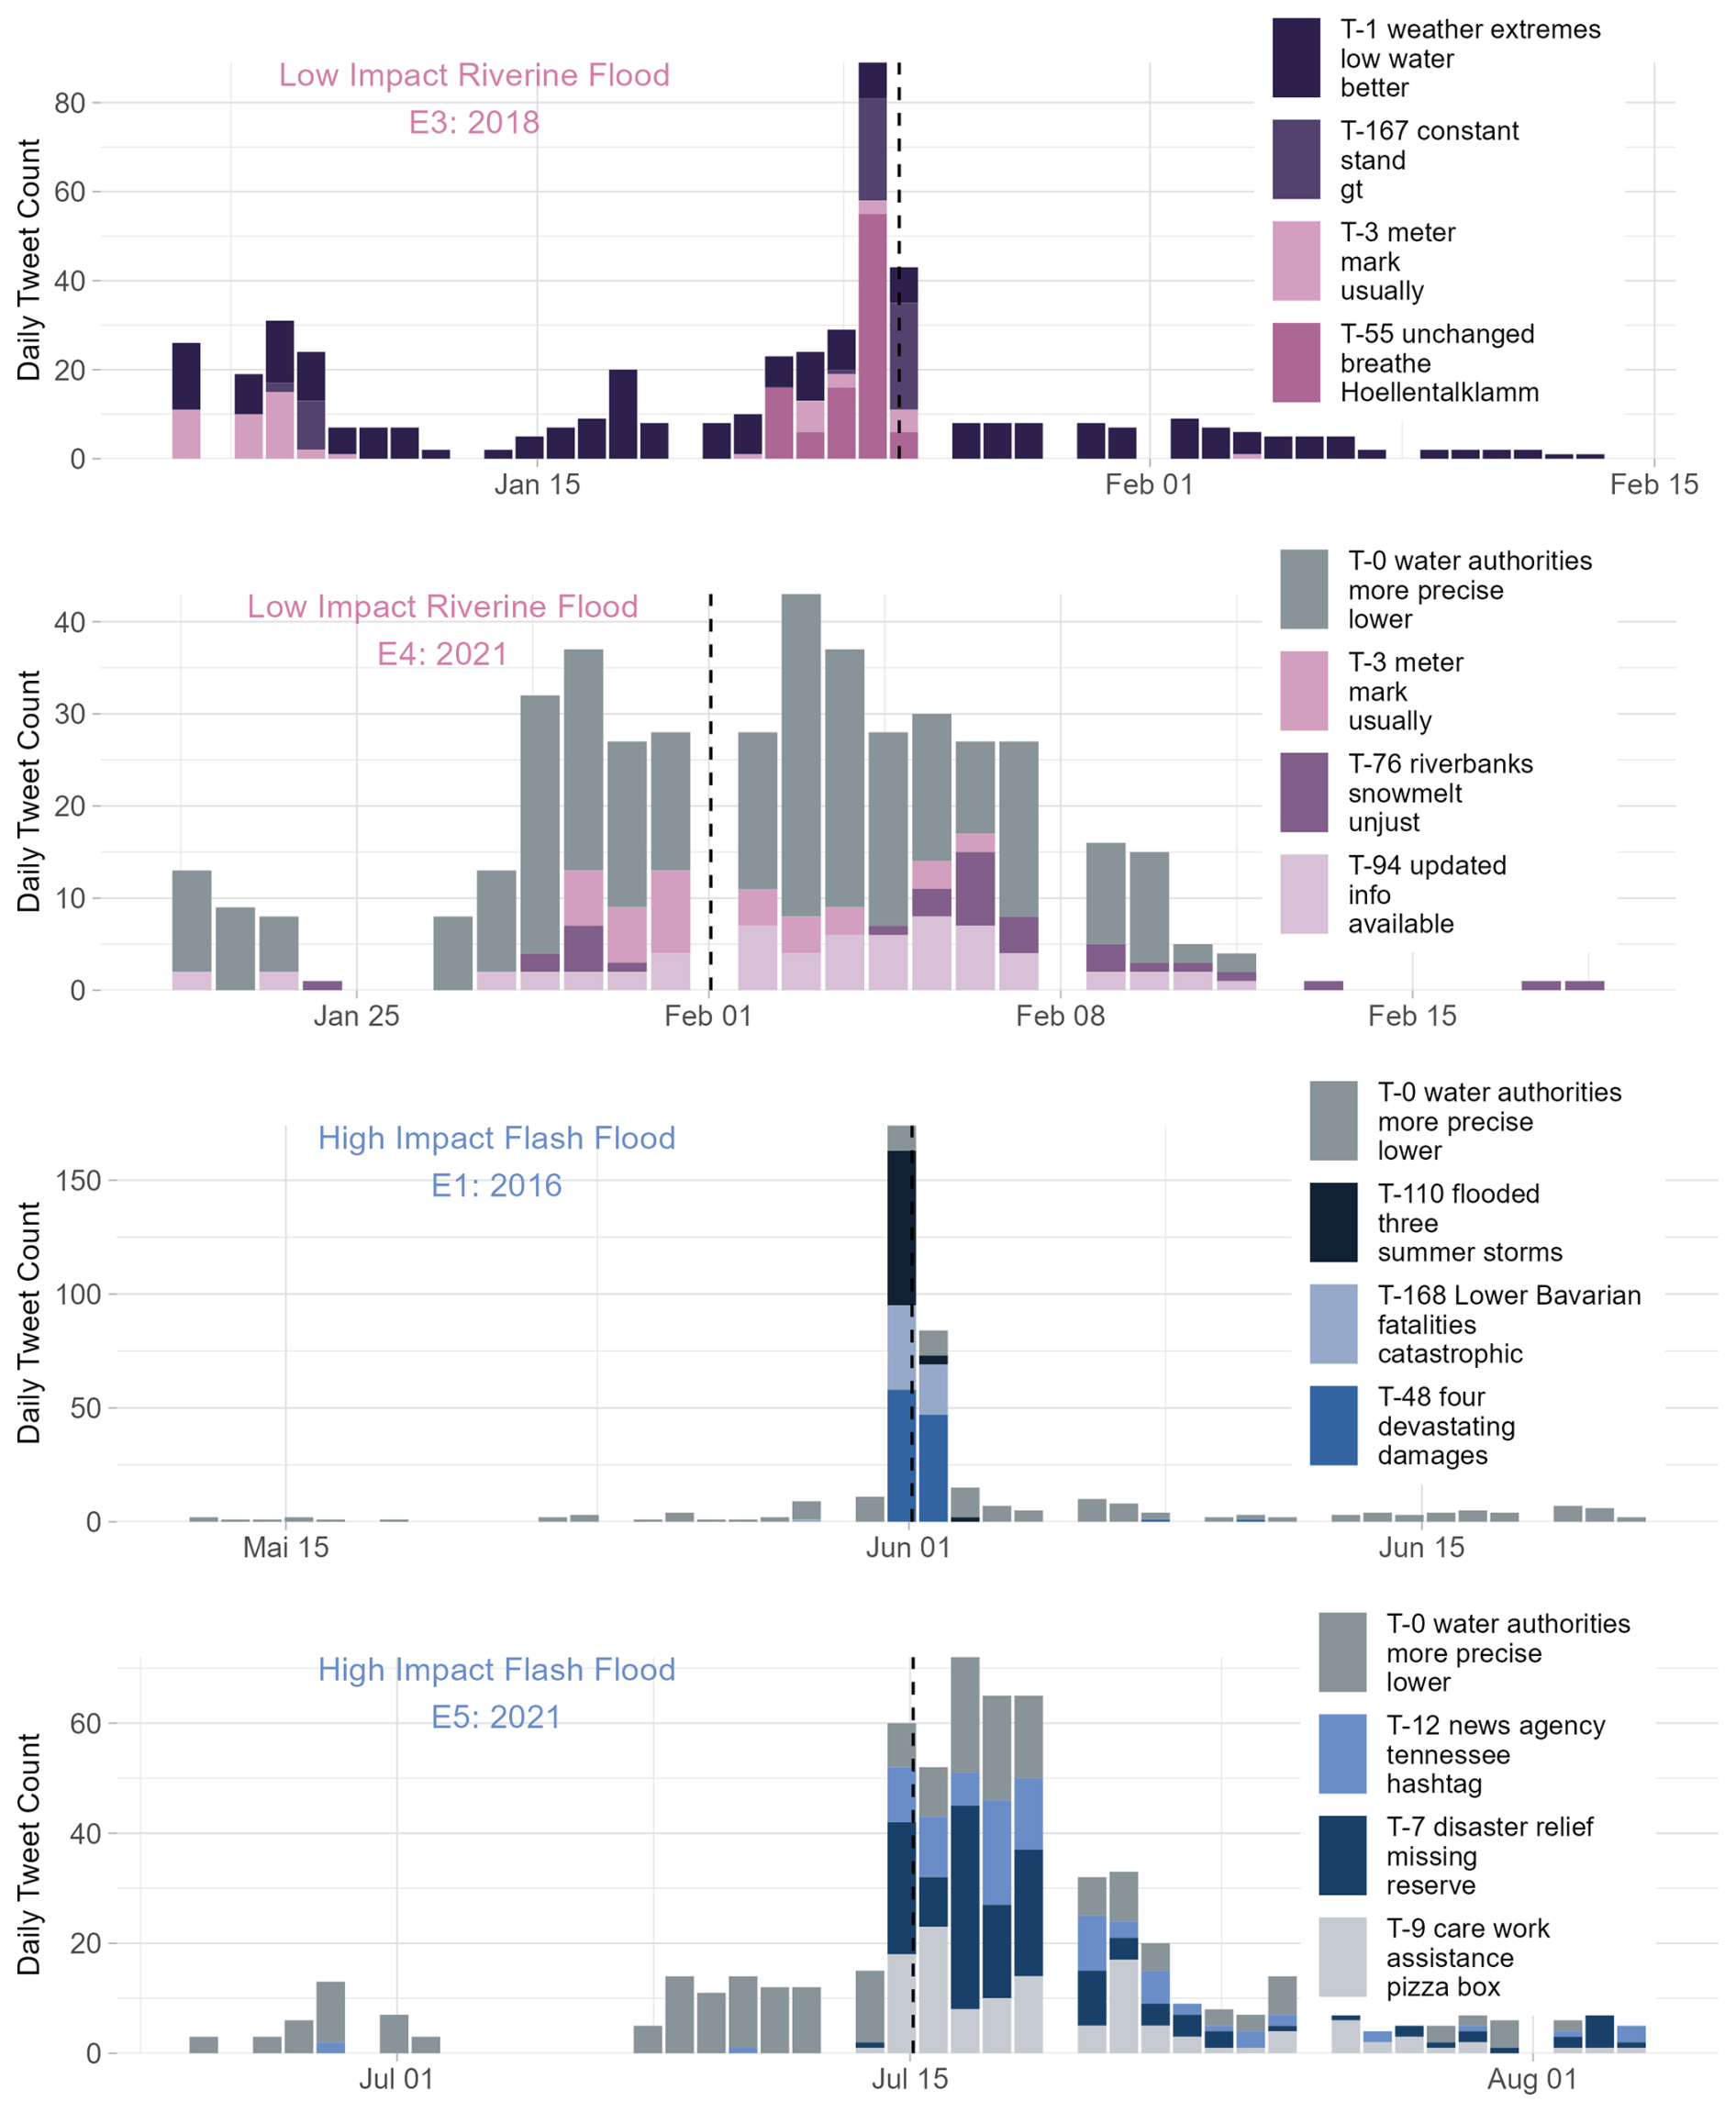
Figure 4Progression of tweet count per topic for low-impact riverine floods (E3, E4) and high-impact flash floods (E1, E5). The dashed line in each panel represents the time of observed peak discharge. The legend indicates different topics of textual Twitter (X) posts, including weather conditions (T-1 weather extremes), administrative updates (T-0 water authorities), infrastructure status (T-3 meter marks), general information updates (T-94 updated info), disaster impacts (T-48 devastating damage, T-110 flooding), and emergency response (T-7 disaster relief). The topics are the result of the HDBSCAN clustering and c-TF-IDF analysis.
The temporal evolution of tweet activity and content on Twitter (X) varies significantly depending on the type and impact of the flooding event. Figure 4 shows the event time window for the events categorized as low-impact riverine flooding and events categorized as predominantly flash floods with high impact. Twitter (X) users engage differently on Twitter (X) during flash floods compared to during riverine flooding. When it comes to flash floods with a high impact, a surge in tweet activity is observed shortly after the peak discharge occurs. In contrast, for riverine flooding, we note a gradual increase in tweet activity that begins days before the flood event. Additionally, for high-impact flash floods we find a sharp decline in the discussion of valuable topics following the peak discharge. This indicates that social media platforms may be exploited for immediate response and coordination, with limited utility for preparedness or long-term recovery activities.
The content of these flood-related tweets varies for the different flood types. Table S2 offers detailed descriptions of all topics including representative tweets. For E3 and E4 (Fig. 4), the progression of topics spans the entire duration of the event, with a focus on aspects like water depths and natural processes (E3: “T-55 unchanged”; E4: “T-76 snowmelt”). Especially “T-3 meter” and “T-94 updated” point towards more generic Twitter (X) content. The consistent presence of these topics throughout the event timeline suggests that, during low-impact flooding, people tend to be more proactive and prepared. They actively share information before, during, and after the flood, in contrast to impulsive tweeting when they are directly affected by the event. Here, “T-55 unchanged”, referring to the stagnation of and decline in water levels, is an exception since during the 2018 flood there was a peak of tweets indicating that a previous warning or alarm had been lifted.
During high-impact flood events, people start discussing topics like reporting fatalities, offering help (“T-9 care work”), disaster management (“T-7 disaster management” and “T-168 fatalities”), and sharing traditional media like newspaper articles (“T-12 news agency”). This shift is clear in the lower plots in Fig. 4, which highlight the four most common topics for E1 and E5. The wording in the topics for high-impact flood events is more impact-focused (“damage”, “fatalities”) and urgent (“missing”, “reserve”) or even catastrophic (“devastating”, “catastrophic”).
The progression of “T-9 care work” in Fig. 4 (extract from representative tweet: “betrifft kreis stadt gezielte hilfsangebote werden unter URL gesammelt” [concerns city targeted offers of help are collected under URL]) shows that Twitter (X) is used to coordinate response activities. The topic emerges predominantly after the peak discharge of E5. This self-organized disaster response on Twitter (X) can potentially be channeled and used as an information source for organizationally coordinated response activities.
For E5, we initially see fewer than 15 daily posts related to “T-0 water authorities”, which is similar to the number of textual Twitter (X) posts during non-flooding times. The discussion on flood-related topics starts suddenly on the day of the flood event. This timing matches previous evaluations of how well the emergency management and warning system worked, as discussed by Thieken et al. (2023). This finding shows that the topics retrieved with our approach reveal real-world flood aspect problems, with early warning reported in this case.
3.4 Event comparison within a state-of-the-art functional framework for topic classification
By grouping the topics within an established framework, we qualitatively validate our results and put them in the context of findings from other studies. In this step, we consider topics with more than 50 instances over the whole time series. Houston et al. (2015) outlined 15 distinct functions of social media, as detailed in the “Materials and methods” section. We categorize the topics we found in our previous analysis according to these different functions and display the resulting functional distribution in Fig. 5. Within our dataset, we did not find evidence of Twitter (X) being utilized for four of these designated functions (implementing traditional communication activities, (re)connecting community members, health support, or generally expressing emotions).
A limitation to the applicability of our model to different platforms and circumstances is the need for manual filtering and the associated uncertainties. The manual steps limit the transferability and may introduce a bias due to the individual variability in keyword selection. This limitation can be addressed by improved or combined embedding models (Laskar et al., 2020) or embedding-based pre-selection.
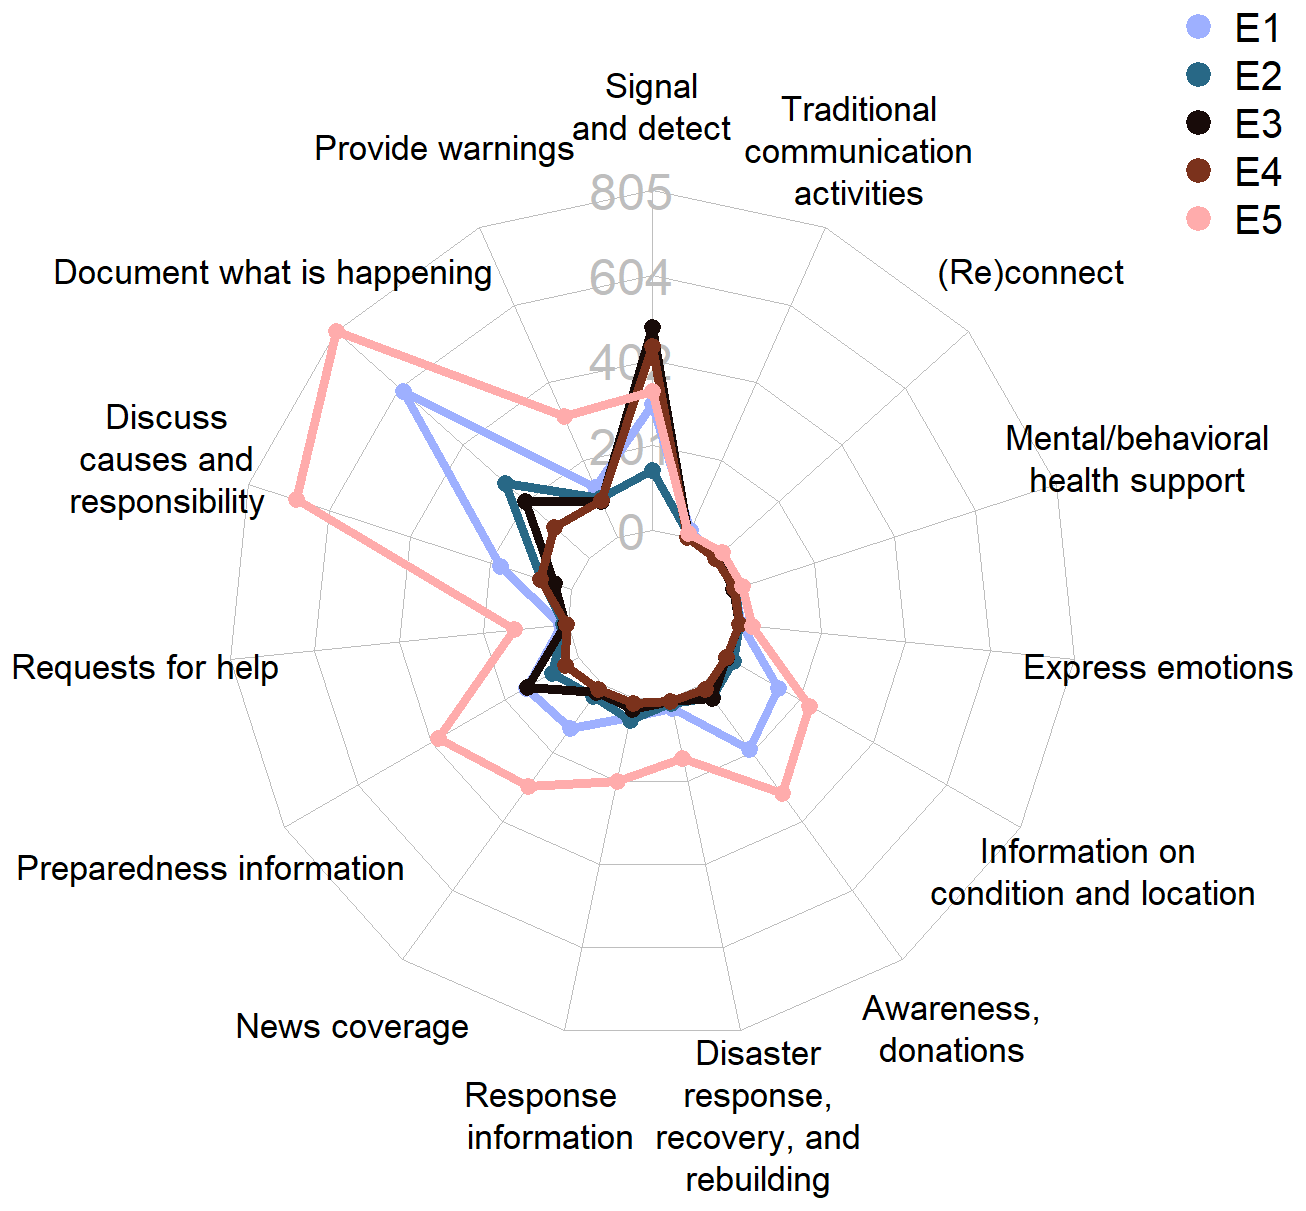
Figure 5Representation of topics categorized according to the 15 functions proposed in the functional framework for social media usage types during disasters by Houston et al. (2015). The results presented here are a manual aggregation of the topics presented in previous figures.
E3 and E4 have the most tweets related to topics with the function of signaling and detecting disasters. During E2, which we view as a moderate-impact event, most of the tweets were assigned to topics which had the function of documenting what is happening in the disaster, with a slight indication of preparedness information being shared on social media. E1 shows a similar pattern with a higher magnitude and an increasing interest in documenting the flood. During E1, Twitter (X) users also started to discuss socio-political impacts and responsibilities and shared links to traditional news outlets.
Regarding E1, we also observe an emergence of topics that indicate awareness and financial support. With the increasing impact of the flood event, we can see the progression of this trend for topic groups. For E5, we see that the focus is on documenting the disaster and discussing socio-political responsibilities with a further increase in interest in the topic groups that emerged for E1.
These findings underscore the substantial shifts in topics and topic groups associated with events of varying impact and magnitude.
In this study, we develop a transferable natural language processing analytic approach for automatic extraction of content from flood-related social media posts collected over a multi-annual time period. Our approach is based on openly available software, data, and pre-trained models, making it accessible to researchers and users.
Despite the general value and applicability of our proposed approach, along with our key findings, our analysis is associated with uncertainties and can be further improved. The pre-trained transformer model by Reimers and Gurevych (2019) and the quality of the clustering of the embeddings extracted from the transformer encoder provide the basis for the quality of topics that are extracted. Therefore, this methodology may be improved with the development of large-scale language models that focus on clustered encoding. The identification of distinct topics within tweets is susceptible to the possibility of topic overlap and separation. By using the HDBSCAN clustering approach, we are setting the level of topic separation through the minimum cluster size, which is a rigid threshold technique. Future model refinement should emphasize strategies to allow more flexibility while ensuring topic separation and improving the clarity and robustness of topic-based interpretations. A similar issue arises with topic representation. We represented the topics with 10 keywords alongside a representative tweet. Defining the meaning of this combination of keywords is a subjective task that leaves room for different interpretations, leading to uncertainty. Here, the framework is also limited in terms of expert-based manual steps, for example for topic exclusion after modeling and for classification in an existing framework. We acknowledge that this process would benefit from multiple people labeling topics independently; however, the team of authors continuously discussed the topic assignment and exclusion in the process. The embeddings retrieved from the sentence transformer model vary slightly for each run. In more detail, this may cause slightly different results for tweets at cluster borders when re-running the framework. However, this does not notably affect the topic size and representation in this study because of the robustness of the HDBSCAN algorithm. Furthermore, social media platforms like Twitter (X) represent only a subset of society. Consequently, insights drawn from textual Twitter (X) data may not fully capture the different experiences, perspectives, and actions present within the broader population. This limitation can be addressed by evaluating the topics discussed on social media platforms other than Twitter (X), which would also ensure robustness towards the fluctuations in access to data from individual providers. In de Bruijn et al. (2019), their Fig. 3, the textual Twitter (X) data are successfully validated against NatCatSERVICE data provided by Munich Re, further ensuring robustness. Additionally, we recommend conducting an analysis that takes the geolocation of tweets into account and evaluating to what extent the identified social media topics can improve flood models and simulations predicting, for example, flood impact measures such as expected damage by including tweet topic distribution alongside tweet counts, similar to, for example, Re et al. (2022). Non-textual information contained in social media posts could be included to reduce uncertainties associated with unstructured grammar or spelling mistakes, for example by comparing the image content and text content of a post.
We show that the proposed methodology and extracted content allow discovery of citizens' behavior and perception of floods before, during, and after different disaster types. We successfully validated our model results qualitatively, based on previous knowledge about past events. Approximately 78 % of tweets contain potentially valuable information for flood risk management, which indicates an opportunity to encourage social media users to share flood-related content online. Our results confirm that there are distinct topic patterns in the Twitter (X) time series. These patterns are associated with a shift from tweets focused on sharing generic information and warning topics towards more diverse topics including coordination of response activities and more complex discussions surrounding the event. This shift is confirmed when looking at different event types. From low- to high-impact events, we see a progression in the number of topics as well as a progression in the content from signaling the disaster to discussing causes and responsibilities in addition to documentation activities. This shows the importance of social media in the response process. However, we see that the potential for the coordination of immediate response activities is the most promising risk management intervention, as long-term activities such as rebuilding or remembering floods are not visible in our dataset. During low-impact riverine floods, citizens respond more routinely, and information on water levels was effectively shared on Twitter during E3 and E4. Therefore, we recommend including spreading information on social media platforms for early warning and risk management strategies. We show that risk management interventions on social media can be supported through institutional posts. This appears to be particularly helpful for immediate response coordination, particularly during the time shortly after a high-impact flood when citizen engagement is high and organization-focused. Moreover, spreading water level information as soon as it becomes available before the event of flash flooding is recommended to shift awareness dynamics towards those exposed during riverine floods with lower impact. We find that we can partly reproduce functions that were attributed to social media use during disasters in a theoretical framework for flood events in Germany. However, not all assumptions that Houston et al. (2015) made about social media usage during disasters can be shown in our dataset. This might be because some functions of social media are platform-dependent and therefore outside of our horizon of observation. The proposed methodology, however, is not limited to be applied to tweets but can be applied to any text-based social media platform with an accessible API, which is extremely useful in the context of quickly evolving and changing online platforms.
The scripts used for the analysis are available at https://github.com/SWN-group-at-TU-Berlin/SocialMediaNLP_FloodTopics (de Bruijn et al., 2025). Tweet location identification is based on an algorithm developed by https://doi.org/10.1007/s41651-017-0010-6 (de Bruijn et al., 2017). The dataset of flood-related Twitter posts is from https://doi.org/10.1038/s41597-019-0326-9 (de Bruijn et al., 2019). The data are available at https://www.globalfloodmonitor.org/ (last access: 21 February 2025) upon request.
The supplement related to this article is available online at https://doi.org/10.5194/nhess-25-879-2025-supplement.
NV: conceptualization, methodology, software, validation, formal analysis, visualization, writing (original draft). HK: conceptualization, writing (review and editing), supervision. JdB: data curation, methodology, conceptualization, writing (review and editing). JJHA: conceptualization, writing (review and editing), supervision. AC: conceptualization, methodology, writing (review and editing), supervision.
At least one of the (co-)authors is a member of the editorial board of Natural Hazards and Earth System Sciences. The peer-review process was guided by an independent editor, and the authors also have no other competing interests to declare.
During the preparation of this work, the authors used ChatGPT to improve language. After using this tool/service, the authors reviewed and edited the content as needed, and they take full responsibility for the content of the publication.
Publisher’s note: Copernicus Publications remains neutral with regard to jurisdictional claims made in the text, published maps, institutional affiliations, or any other geographical representation in this paper. While Copernicus Publications makes every effort to include appropriate place names, the final responsibility lies with the authors.
The authors would like to thank the Helmholtz Einstein International Berlin Research School in Data Science (HEIBRiDS) for supporting this project.
The article processing charges for this open-access publication were covered by the GFZ Helmholtz Centre for Geosciences.
This paper was edited by Vassiliki Kotroni and reviewed by Samar Momin and one anonymous referee.
Allaoui, M., Kherfi, M. L., and Cheriet, A.: Considerably improving clustering algorithms using UMAP dimensionality reduction technique: A comparative study, International conference on image and signal processing, 317–325 pp., https://doi.org/10.48550/arXiv.1810.04805, 2020. a
Anhalt, M., Bindick, S., and Meyer, S.: Das Juli-Hochwasser 2017 im südlichen Niedersachsen, Niedersächsischer Landesbetrieb für Wasserwirtschaft, Küsten- und Naturschutz, https://www.nlwkn.niedersachsen.de/download/124949 (last access: 21 February 2025), 2017. a, b, c
Aubert, A. H., Tavenard, R., Emonet, R., de Lavenne, A., Malinowski, S., Guyet, T., Quiniou, R., Odobez, J.-M., Merot, P., and Gascuel-Odoux, C.: Clustering flood events from water quality time series using Latent Dirichlet Allocation model, Water Resour. Res., 49, 8187–8199, https://doi.org/10.1002/2013wr014086, 2013. a
Baldassarre, G. D., Viglione, A., Carr, G., Kuil, L., Yan, K., Brandimarte, L., and Blöschl, G.: Debates-Perspectives on socio-hydrology: Capturing feedbacks between physical and social processes, Water Resour. Res., 51, 4770–4781, https://doi.org/10.1002/2014wr016416, 2015. a
Barker, J. and Macleod, C.: Development of a national-scale real-time Twitter data mining pipeline for social geodata on the potential impacts of flooding on communities, Environ. Modell. Softw., 115, 213–227, https://doi.org/10.1016/j.envsoft.2018.11.013, 2019. a, b
Brakenridge, G.: Global Active Archive of Large Flood Events. DFO – Flood Observatory, University of Colorado, USA, http://floodobservatory.colorado.edu/Archives/ (last access: 21 February 2025), 2025. a
Bronstert, A., Agarwal, A., Boessenkool, B., Crisologo, I., Fischer, M., Heistermann, M., Köhn-Reich, L., López-Tarazón, J. A., Moran, T., Ozturk, U., Reinhardt-Imjela, C., and Wendi, D.: Forensic hydro-meteorological analysis of an extreme flash flood: The 2016-05-29 event in Braunsbach, SW Germany, Sci. Total Environ., 630, 977–991, https://doi.org/10.1016/j.scitotenv.2018.02.241, 2018. a
Cho, S. E., Jung, K., and Park, H. W.: Social Media Use during Japan's 2011 Earthquake: How Twitter Transforms the Locus of Crisis Communication, Med. Int. Aust., 149, 28–40, https://doi.org/10.1177/1329878X1314900105, 2013. a, b, c
Churchill, R. and Singh, L.: The Evolution of Topic Modeling, ACM Comput. Surv., 54, 1–35, https://doi.org/10.1145/3507900, 2022. a
Cresci, S., Avvenuti, M., La Polla, M., Meletti, C., and Tesconi, M.: Nowcasting of Earthquake Consequences using Big Social Data, IEEE Internet Computing, 1–1 pp., https://doi.org/10.1109/MIC.2017.265102211, 2017. a
Darji, H., Mitrović, J., and Granitzer, M.: German BERT model for legal named entity recognition, https://doi.org/10.5220/0011749400003393, 2023. a
de Bruijn, J. A., de Moel, H., Jongman, B., Wagemaker, J., and Aerts, J. C. J. H.: TAGGS: Grouping Tweets to Improve Global Geoparsing for Disaster Response, J. Geovisual. Spat. Anal., 2, 1–14, https://doi.org/10.1007/s41651-017-0010-6, 2017. a, b, c, d, e
de Bruijn, J. A., de Moel, H., Jongman, B., de Ruiter, M. C., Wagemaker, J., and Aerts, J. C.: A global database of historic and real-time flood events based on social media, Sci. Data, 6, 311, https://doi.org/10.1038/s41597-019-0326-9, 2019. a, b, c, d, e, f, g, h, i
de Bruijn, J. A., de Moel, H., Jongman, B., de Ruiter, M. C., Wagemaker, J., and Aerts, J. C.: A global database of historic and realtime flood events based on social media, Sci. Data, 6, 311, https://doi.org/10.1038/s41597-019-0326-9, 2019 (data available at: https://github.com/SWN-group-at-TU-Berlin/SocialMediaNLP_FloodTopics, last access: 21 February 2025). a
Devlin, J., Chang, M.-W., Lee, K., and Toutanova, K.: BERT: Pre-training of Deep Bidirectional Transformers for Language Understanding, 4171–4186, https://doi.org/10.18653/v1/N19-1423, 2019. a
Donratanapat, N., Samadi, S., Vidal, J., and Sadeghi Tabas, S.: A national scale big data analytics pipeline to assess the potential impacts of flooding on critical infrastructures and communities, Environ. Modell. Softw., 133, 104828, https://doi.org/10.1016/j.envsoft.2020.104828, 2020. a
Egger, R. and Yu, J.: A topic modeling comparison between lda, nmf, top2vec, and bertopic to demystify twitter posts, Front. Soc., 7, 886498, https://doi.org/10.3389/fsoc.2022.886498, 2022. a
Fohringer, J., Dransch, D., Kreibich, H., and Schröter, K.: Social media as an information source for rapid flood inundation mapping, Nat. Hazards Earth Syst. Sci., 15, 2725–2738, https://doi.org/10.5194/nhess-15-2725-2015, 2015. a
Fraternali, P., Castelletti, A., Soncini-Sessa, R., Vaca Ruiz, C., and Rizzoli, A.: Putting humans in the loop: Social computing for Water Resources Management, Environ. Modell. Softw., 37, 68–77, https://doi.org/10.1016/j.envsoft.2012.03.002, 2012. a
Giordano, R., Pagano, A., Pluchinotta, I., del Amo, R. O., Hernandez, S. M., and Lafuente, E. S.: Modelling the complexity of the network of interactions in flood emergency management: The Lorca flash flood case, Environ. Modell. Softw., 95, 180–195, https://doi.org/10.1016/j.envsoft.2017.06.026, 2017. a
Gopal, L. S., Prabha, R., Thirugnanam, H., Ramesh, M. V., and Malamud, B. D.: Review Article: Leveraging Social Media for Managing Natural Hazard Disasters: A Critical Review of Data Collection Strategies and Actionable Insights, EGUsphere [preprint], https://doi.org/10.5194/egusphere-2024-1536, 2024. a, b
Grootendorst, M.: BERTopic: Neural topic modeling with a class-based TF-IDF procedure, 1–10, https://doi.org/10.48550/arXiv.2203.05794, 2022. a, b, c
Han, X. and Wang, J.: Using Social Media to Mine and Analyze Public Sentiment during a Disaster: A Case Study of the 2018 Shouguang City Flood in China, ISPRS Int. J. Geo-Info., 8, 1–16, https://doi.org/10.3390/ijgi8040185, 2019. a
Hauser, J., Meng, Z., Pascual, D., and Wattenhofer, R.: Bert is robust! a case against synonym-based adversarial examples in text classification, 1–12 pp., https://doi.org/10.48550/arXiv.2109.07403, 2021. a
Helmke, P., Mürlebach, M., Supper-Nilges, D., and Wiechmann, W.: Januar-Hochwasser 2018 in Deutschland – 4. Update, Bundesanstalt für Gewässerkunde, https://www.bafg.de/DE/5_Informiert/4_Infothek/Aktuelles/_doc/2018/20180105_5download.pdf?__blob=publicationFile&v=1 (last access: 21 February 2025), 2018. a, b
Hong, L., Lee, M., Mashhadi, A., and Frias-Martinez, V.: Towards Understanding Communication Behavior Changes During Floods Using Cell Phone Data, in: Social Informatics, edited by: Staab, S., Koltsova, O., and Ignatov, D. I., 97–107 pp., Springer International Publishing, https://doi.org/10.1007/978-3-030-01159-8_9, 2018. a
Houston, J. B., Hawthorne, J., Perreault, M. F., Park, E. H., Goldstein Hode, M., Halliwell, M. R., Turner McGowen, S. E., Davis, R., Vaid, S., McElderry, J. A., and Griffith, S. A.: Social media and disasters: a functional framework for social media use in disaster planning, response, and research, Disasters, 39, 1–22, https://doi.org/10.1111/disa.12092, 2015. a, b, c, d, e, f, g, h
Huang, Q. and Xiao, Y.: Geographic Situational Awareness: Mining Tweets for Disaster Preparedness, Emergency Response, Impact, and Recovery, ISPRS Int. J. Geo-Info., 4, 1549–1568, https://doi.org/10.3390/ijgi4031549, 2015. a, b, c, d
Hübl, J. and Rimböck, A.: Extreme torrential flooding at Simbach on June 1st, 2016 findings of a detailed event analysis, Symposium Proceedings of the INTERPRAENENT 2018 in the Pacific Rim, https://doi.org/10.3850/978-981-11-2731-1_207-cd, 2018. a, b, c
Kent, J. D. and Capell Jr., H. T.: Spatial patterns and demographic indicators of effective social media content during theHorsethief Canyon fire of 2012, Cartogr. Geogr. Inf. Sci., 40, 78–89, https://doi.org/10.1080/15230406.2013.776727, 2013. a, b
Konya, A. and Nematzadeh, P.: Recent applications of AI to environmental disciplines: A review, Sci. Total Environ., 906, 167705, https://doi.org/10.1016/j.scitotenv.2023.167705, 2024. a
Laskar, M. T. R., Huang, J. X., and Hoque, E.: Contextualized Embeddings based Transformer Encoder for Sentence Similarity Modeling in Answer Selection Task, in: Proceedings of the Twelfth Language Resources and Evaluation Conference, edited by: Calzolari, N., Béchet, F., Blache, P., Choukri, K., Cieri, C., Declerck, T., Goggi, S., Isahara, H., Maegaard, B., Mariani, J., Mazo, H., Moreno, A., Odijk, J., and Piperidis, S., 5505–5514 pp., European Language Resources Association, Marseille, France, ISBN 979-10-95546-34-4, https://aclanthology.org/2020.lrec-1.676 (last access: 21 February 2025), 2020. a
Laudan, J., Rözer, V., Sieg, T., Vogel, K., and Thieken, A. H.: Damage assessment in Braunsbach 2016: data collection and analysis for an improved understanding of damaging processes during flash floods, Nat. Hazards Earth Syst. Sci., 17, 2163–2179, https://doi.org/10.5194/nhess-17-2163-2017, 2017. a
Lin, X., Spence, P. R., Sellnow, T. L., and Lachlan, K. A.: Crisis communication, learning and responding: Best practices in social media, Comput. Hum. Behav., 65, 601–605, https://doi.org/10.1016/j.chb.2016.05.080, 2016. a, b
Löns, H. C.: Hochwasser Januar, Februar 2021 in Hessen, Hessisches Landesamt für Naturschutz, Umwelt und Geologie, Hydrologie in Hessen, 22, 1–4 pp., https://www.hlnug.de/fileadmin/shop/publikationen/wasser/hydrologie/Schriften_Wasser_786_Hochwasserbericht_2021_barrierefrei.pdf (last access: 21 February 2025), 2021. a, b, c
LUBW, L.: Klassifizierung der Hochwasser-Situation am Pegel, Hochwasserzentralen.de/Info, https://www.hochwasserzentralen.de/info (last access: 21 February 2025), 2024. a
McCarthy, S., Tunstall, S., Parker, D., Faulkner, H., and Howe, J.: Risk communication in emergency response to a simulated extreme flood, Environ. Hazard., 7, 179–192, https://doi.org/10.1016/j.envhaz.2007.06.003, 2007. a
McInnes, L., Healy, J., and Astels, S.: hdbscan: Hierarchical density based clustering, J. Open Source Softw., 2, p. 205, https://doi.org/10.21105/joss.00205, 2017. a
McInnes, L., Healy, J., and Melville, J.: Umap: Uniform manifold approximation and projection for dimension reduction, 1–63 pp., https://doi.org/10.48550/arXiv.1802.03426, 2018. a, b
Mileti, D. S.: Factors related to flood warning response, in: US-Italy research workshop on the hydrometeorology, impacts, and management of extreme floods, 1–17 pp., Citeseer, https://citeseerx.ist.psu.edu/document?repid=rep1&type=pdf&doi=4fa7217881768b6e8d79e076001c32b70615abc0 (last access: 21 February 2025), 1995. a
Mohr, S., Ehret, U., Kunz, M., Ludwig, P., Caldas-Alvarez, A., Daniell, J. E., Ehmele, F., Feldmann, H., Franca, M. J., Gattke, C., Hundhausen, M., Knippertz, P., Küpfer, K., Mühr, B., Pinto, J. G., Quinting, J., Schäfer, A. M., Scheibel, M., Seidel, F., and Wisotzky, C.: A multi-disciplinary analysis of the exceptional flood event of July 2021 in central Europe – Part 1: Event description and analysis, Nat. Hazards Earth Syst. Sci., 23, 525–551, https://doi.org/10.5194/nhess-23-525-2023, 2023. a, b
Moulavi, D., Jaskowiak, P. A., Campello, R. J., Zimek, A., and Sander, J.: Density-based clustering validation, in: Proceedings of the 2014 SIAM international conference on data mining, 839–847 pp., SIAM, https://doi.org/10.1137/1.9781611973440.96, 2014. a
MunichRe, N.: Hurricanes, cold waves, tornadoes: Weather disasters in USA dominate natural disaster losses in 2021, Fact sheet natural catastrophies 2021, 1–44 pp., https://www.munichre.com/en/company/media-relations/media-information-and-corporate-news/media-information/2022/natural-disaster-losses-2021.html (last access: 21 February 2025), 2022. a
Paprotny, D., Sebastian, A., Morales-Nápoles, O., and Jonkman, S. N.: Trends in flood losses in Europe over the past 150 years, Nat. Commun., 9, 1985, https://doi.org/10.1038/s41467-018-04253-1, 2018. a
Re, M., Kazimierski, L. D., Garcia, P. E., Ortiz, N. E., and Lagos, M.: Assessment of crowdsourced social media data and numerical modelling as complementary tools for urban flood mitigation, Hydrol. Sci. J., 67, 1295–1308, https://doi.org/10.1080/02626667.2022.2075266, 2022. a
Reimers, N. and Gurevych, I.: Sentence-BERT: Sentence Embeddings using Siamese BERT-Networks, http://arxiv.org/abs/1908.10084 (last access: 21 February 2025), 2019. a, b, c, d
Rözer, V., Peche, A., Berkhahn, S., Feng, Y., Fuchs, L., Graf, T., Haberlandt, U., Kreibich, H., Sämann, R., Sester, M., Shehu, B., Wahl, J., and Neuweiler, I.: Impact-Based Forecasting for Pluvial Floods, Earth's Fut., 9, e2020EF001851, https://doi.org/10.1029/2020ef001851, 2021. a
Sermet, Y. and Demir, I.: An intelligent system on knowledge generation and communication about flooding, Environ. Modell. Softw., 108, 51–60, https://doi.org/10.1016/j.envsoft.2018.06.003, 2018. a, b
Sodoge, J., Kuhlicke, C., Mahecha, M. D., and de Brito, M. M.: Text mining uncovers the unique dynamics of socio-economic impacts of the 2018–2022 multi-year drought in Germany, Nat. Hazards Earth Syst. Sci., 24, 1757–1777, https://doi.org/10.5194/nhess-24-1757-2024, 2024. a
Spence, P. R., Lachlan, K. A., Lin, X., and del Greco, M.: Variability in Twitter Content Across the Stages of a Natural Disaster: Implications for Crisis Communication, Commun. Quarterly, 63, 171–186, https://doi.org/10.1080/01463373.2015.1012219, 2015. a, b, c
Thieken, A. H., Bubeck, P., Heidenreich, A., von Keyserlingk, J., Dillenardt, L., and Otto, A.: Performance of the flood warning system in Germany in July 2021 – insights from affected residents, Nat. Hazards Earth Syst. Sci., 23, 973–990, https://doi.org/10.5194/nhess-23-973-2023, 2023. a
Tounsi, A., Temimi, M., and Lipizzi, C.: Exploring Social and Geographical Disparities During Hurricane Ida Using Geolocated Social Media Content, https://doi.org/10.2139/ssrn.4484915, 2023. a
Wu, Z., Zhang, Y., Chen, Q., and Wang, H.: Attitude of Chinese public towards municipal solid waste sorting policy: A text mining study, Sci. Total Environ., 756, 142674, https://doi.org/10.1016/j.scitotenv.2020.142674, 2021. a
Zhang, C., Fan, C., Yao, W., Hu, X., and Mostafavi, A.: Social media for intelligent public information and warning in disasters: An interdisciplinary review, Int. J. Info. Manage., 49, 190–207, https://doi.org/10.1016/j.ijinfomgt.2019.04.004, 2019. a, b, c
Zhang, X., Malkov, Y., Florez, O., Park, S., McWilliams, B., Han, J., and El-Kishky, A.: Twhin-bert: A socially-enriched pre-trained language model for multilingual tweet representations at twitter, in: Proceedings of the 29th ACM SIGKDD conference on knowledge discovery and data mining, 5597–5607 pp., https://doi.org/10.1145/3580305.3599921, 2023. a