the Creative Commons Attribution 4.0 License.
the Creative Commons Attribution 4.0 License.
 | 25 Feb 2025
Modeling seismic hazard and landslide occurrence probabilities in northwestern Yunnan, China: exploring complex fault systems with multi-segment rupturing in a block rotational tectonic zone
Jia Cheng
Xiwei Xu
Shimin Zhang
Pengyu Zhu
The northwestern Yunnan region, located on the southeastern edge of the Tibetan Plateau, is characterized by a combination of ductile flow of the lower crust with low shear-wave velocity and gravitational collapse, giving rise to a complex network of active faults. This presents significant seismic hazards, particularly due to the potential for multi-segment ruptures and resulting landslides. This article presents a new seismic hazard model for the northwestern Yunnan region, incorporating recent findings on fault geometry and slip rates along with historical seismicity rates to assess multi-segment rupturing risks. Among the four potential multi-segment rupture combination models examined, Model 1, characterized by multi-segment rupture combinations on single faults, particularly fracturing the Zhongdian fault, is proposed as the most suitable for the northwestern Yunnan region, given that the non-mainshock slip ratios on fault segments are all below the 30 %–40 % threshold, as supported by the agreement of modeled seismicity rates with fault slip rates. Our analysis demonstrates that the peak ground acceleration (PGA) for a mean return period of 475 years, which is calculated with the developed probabilistic seismic hazard model, has a strong correlation with the spatial distribution of the faults. On average, these values are higher than the PGA given by the China Seismic Ground Motion Parameters Zonation Map. Furthermore, we utilized PGA values with the Bayesian probability method and a machine learning model to predict landslide occurrence probabilities as a function of our PGA distribution map. Our findings underscore that the observed combinations of multi-segment ruptures and their associated behaviors were in alignment with the small block rotation triggered by the gravitational collapse of the Tibetan Plateau. This result highlights the intricate interplay between multi-segment rupturing hazards and regional geological dynamics while also providing valuable guidance for disaster preparedness efforts.
- Article
(10906 KB) - Full-text XML
-
Supplement
(693 KB) - BibTeX
- EndNote


The collision of the Eurasian plate and the Indian plate has made the Tibetan Plateau, the world's highest plateau, with an altitude of over 4000 m on average. The eastern extrusion of the crust in the Tibetan Plateau, associated with the wedged eastern Himalayan syntaxis, initiated a clockwise rotation of crustal deformation in the southeastern margin of the Tibetan Plateau (Fig. 1) (Zhang et al., 2004; Gan et al., 2007; Wang and Shen, 2020). The northwestern Yunnan region (NWYR), in the western part of the southeastern margin of the Tibetan Plateau, borders the Tibetan Plateau, with the Lijiang–Xiaojiang fault serving as a boundary fault. This fault separates the Tibetan Plateau, boasting an average altitude of over 3000 m, from the Yunnan region, which maintains an average altitude of over 2000 m (Yu et al., 2022; Zhang et al., 2022) (see Fig. 1). Unlike the thrust faults along the plateau boundary, such as the Longmenshan fault ruptured by the 2008 Mw 7.9 Wenchuan earthquake, the Holocene slip type of the Lijiang–Xiaojinhe fault is sinistral, with a strike-slip rate of ∼ 3 mm yr−1 from geological (Xu et al., 2003; Shen et al., 2005; Ding et al., 2018; Gao et al., 2019) and geodetic data (Gan et al., 2007; Cheng et al., 2012).
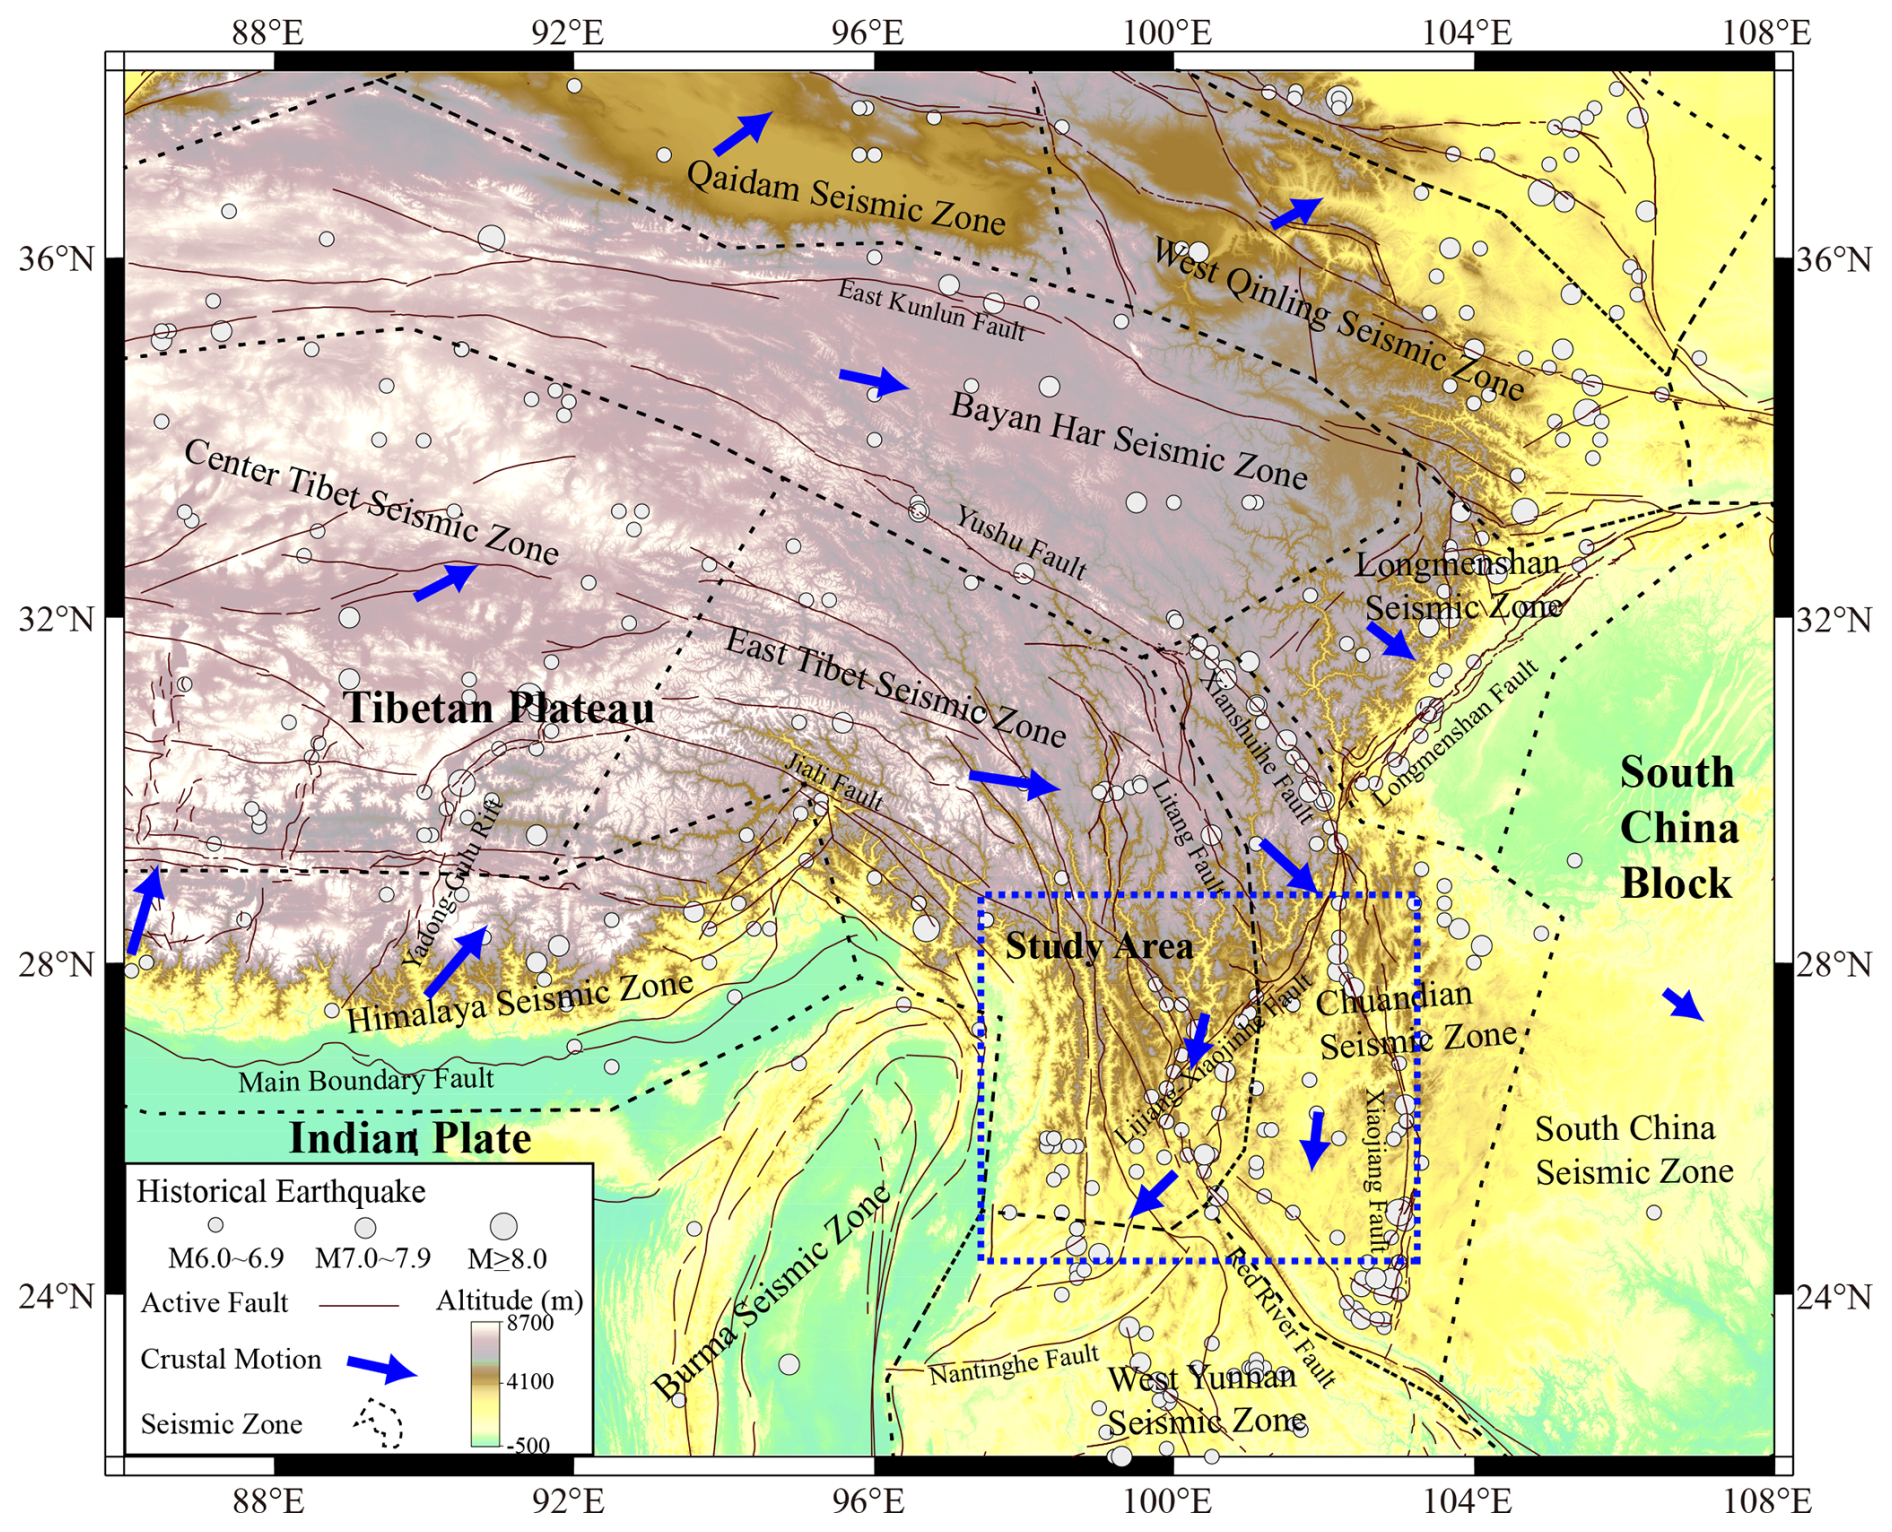
Figure 1Tectonic environment of the eastern Tibetan Plateau and the location of the NWYR. The dashed rectangle delineates the study area, while dashed polygons depict the seismic zones delineated by Rong et al. (2020).
The peculiar slip behavior of the Lijiang–Xiaojinhe fault has garnered considerable attention in studies pertaining to crustal structure, fault activities and earthquake hazards (Xu et al., 2003; Cheng et al., 2012; Zhao et al., 2013; Bao et al., 2015; Zhang et al., 2020; Huang et al., 2022; Zhang et al., 2022; Dai et al., 2023). Zhang et al. (2020) employed a shear-wave velocity model to reveal that three faults – the Longmenshan fault, the Lijiang–Xiaojinhe fault and the Chenghai fault – outline a low-velocity belt in the lower crust. This investigation uncovered the presence of low-crustal flow beneath the NWYR. Similarly, Zhang et al. (2022) utilized magnetotelluric (MT) observations in the southern vicinity of the Lijiang–Xiaojinhe fault, corroborating these findings and highlighting the NWYR as a conduit for ductile low-crustal flow at 10 km depth. Analogously, a GPS study by Cheng et al. (2012) yielded comparable results. Upon removing the rigid rotation component from the regional GPS velocity field, they demonstrated a clockwise rotation driven by ductile crustal flow, particularly accelerated within the NWYR. They posited that this acceleration in clockwise rotation might also be intensified by the tensional drag originating from the Burma plate. The intricate network of crustal deformation encompassing the NWYR introduces complexity to the slip behavior of faults. Within this area, three distinct fault slip behaviors are observed: the northeast-trending Lijiang–Xiaojinhe fault displays left-lateral strike slip, northwest-trending faults exhibit right-lateral strike slip, and north–south trending faults demonstrate normal slip (see Fig. 2). The presence of faults with diverse rupture behaviors contributes to the complexity of earthquake hazards. Historically, these faults have been associated with significant seismic events and numerous casualties. Notably, three earthquakes with M 7+ occurred in the NWYR: the Yongsheng earthquake of 1515 (∼ M 7.5) on the Chenghai fault, the Midu earthquake of 1652 (∼ M 7) on the Red River fault and the Dali earthquake of 1925 (∼ M 7) on the Diancang Shan East fault. Additionally, the 1990 Lijiang earthquake (Ms 7.0/Mw 6.6) occurred on the Yulong East fault, exhibiting dominant normal slip behavior. Historical and paleo-earthquake studies suggest that nearly all of these faults have the potential to generate catastrophic earthquakes (e.g., Ding et al., 2018; Ren et al., 2007; Chang et al., 2014) and induce numerous landslides (Institute of Geology-State Seismological Bureau and Yunnan Seismological Bureau, 1990; Huang et al., 2021). Fieldwork studies and focal mechanisms of recent earthquakes underscore the complexity of fault slip behaviors in this tectonic environment (Fig. 2). Both historical and instrumental earthquakes have affected nearly all faults in the region, emphasizing the seismic risks in the NWYR. For instance, the 2013 Deqin earthquake swarm, reaching a maximum magnitude of Ms 5.9/Mw 5.7 on 31 August (Wu et al., 2015), and the 2021 Yangbi earthquake swarm, reaching a maximum magnitude of Ms 5.9/Mw 6.1 on 21 May (Zhou et al., 2022), are noteworthy seismic events (Fig. 2). The 2013 Mw 5.7 Deqin earthquake swarm, characterized by tensional stress, occurred at the intersection of the Zhongdian fault and the southern part of the Jinshajiang fault, illustrating the susceptibility of the regional stress field to disturbance. Conversely, the 2021 Mw 6.1 Yangbi earthquake swarm occurred at the connection point of the dominant dextral strike-slip faults, namely the Red River fault and the Weixi–Qiaohou fault, representing a different tectonic environment compared to the 2013 Mw 5.7 Deqin earthquake swarm. This distinct setting suggests that either of these two faults could be at risk of seismic activity during the pre-earthquake period of the upcoming earthquakes in this region.
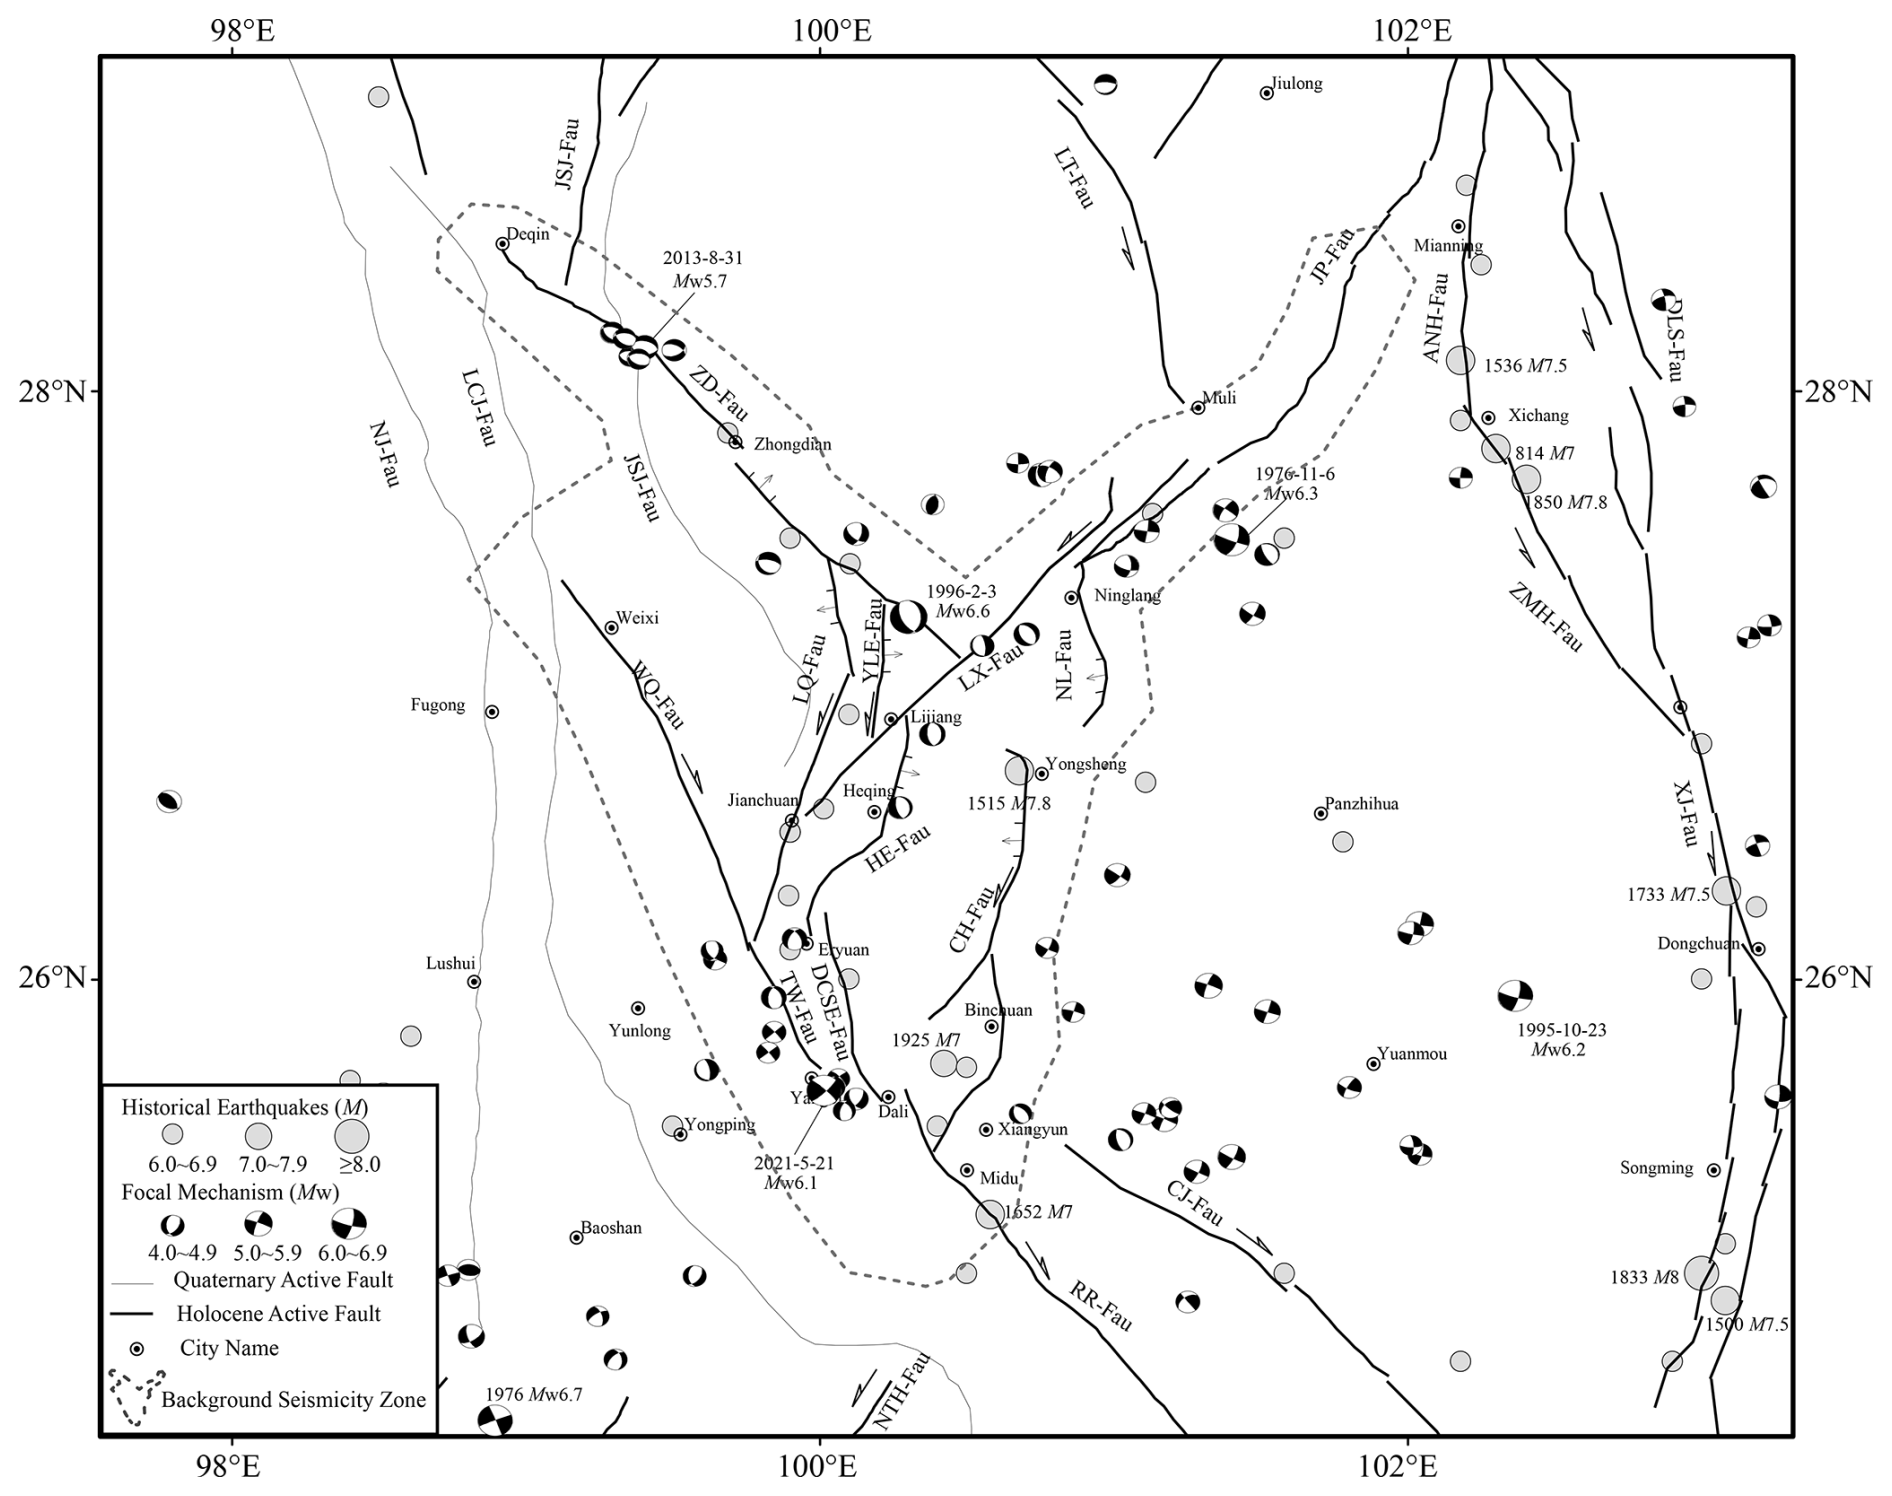
Figure 2Regional active faults and historical earthquake activities in the NWYR. The focal mechanisms of recent earthquakes (1976–2023) are sourced from the Global Centroid Moment Tensor (GCMT) catalog. Earthquakes with M 6+ are sourced from the moment magnitude (Mw) catalog of Cheng et al. (2017). The dashed line represents the division for background seismicity calculation, which extends 20 km from the faults. JP-Fau: Jinping fault; LT-Fau: Litang fault; ANH-Fau: Anninghe fault; ZMH-Fau: Zemuhe fault; XJ-Fau: Xiaojiang fault; CJ-Fau: Chuxiong–Jianshui fault; RR-Fau: Red River fault; NTH-Fau: Nantinghe fault; DYJ-Fau: Dayingjiang fault; NJ-Fau: Nujiang fault; LCJ-Fau: Lancangjiang fault; JSJ-Fau: Jinshajiang fault; ZD-Fau: Zhongdian fault; LX-Fau: Lijiang–Xiaojinhe fault; WQ-Fau: Weixi–Qiaohou fault; YLE-Fau: Yulong East fault; LQ-Fau: Longpan–Qiaohou fault; HE-Fau: Heqing–Eryuan fault; CH-Fau: Chenghai fault; DCSE-Fau: Diancang Shan East fault; TW-Fau: Tongdian–Weishan fault.
The high altitude, dense vegetation and easily weathered conditions make it challenging to obtain accurate fault slip rates, often resulting in significant uncertainties. However, recent studies have provided fresh insights into slip rates and fault behaviors, offering the potential to enhance the precision of seismic hazard models. For instance, Wu et al. (2019) evaluated the Holocene dextral slip rate of the Zhongdian fault to be ∼ 1.5 ± 0.2 mm yr−1 based on displacements of water-ice remains, while Chang et al. (2014) obtained ∼ 2.1 ± 0.2 mm yr−1 based on displacements of river terraces, both utilizing optically stimulated luminescence (OSL) dating. These values notably differ from the right-lateral slip rate of 4–6 mm yr−1 estimated by Shen et al. (2001) based on gully displacements from the last glacial period but are more aligned with the rates derived from GPS velocity data (Cheng et al., 2012). Incorporating these updated fault slip rates into regional seismic hazard models has the potential to greatly improve their accuracy and ensure the reliability of the results.
Given the inherent challenges of fieldwork studies on fault activities, only a limited number of investigations have been conducted regarding seismic hazard analysis in the NWYR. Among these studies, Zhou et al. (2004) conducted a micro-zonation of seismic hazards in the NWYR. They examined regional fault activities through field surveys and estimated the potential maximum magnitude of these faults. Their approach involved outlining polygons around the source faults to divide them into different potential seismic sources and calculating historical seismicity rates within these polygons. This methodology is widely employed in seismic hazard modeling in China, particularly in the national seismic hazard map of the China Seismic Ground Motion Parameters Zonation Map (CSGMPZM) (Gao et al., 2015). The CSGMPZM also utilized this methodology to assess potential maximum magnitudes and compute seismicity rates. However, their studies often did not integrate fault geometry models, especially fault segmentation data. Consequently, the fault geometry, including rupture length and area, may not be accurately linked to the magnitude of large earthquakes. Furthermore, it is crucial to recognize the potential occurrence of multi-segment rupturing, which has not been documented in historical records. Similarly, seismicity rates were typically derived solely from historical earthquakes and were not synchronized with fault slip rates. Relying solely on historical earthquakes for seismicity rate calculations may lead to either overestimation or underestimation of seismic hazards.
In this article, we developed a regional seismic hazard model for the NWYR, accounting for fault slip behaviors and the potential for large earthquakes including the likelihood of multi-segment ruptures. We initially developed fault segmentation models for the primary active faults in the NWYR, drawing on recent geological research on fault segmentation and geological fault slip rates. Subsequently, we employed the SHERIFS code (Chartier et al., 2017, 2019) to simulate seismicity rates across possible multi-segment combination models. We identified the multi-segment combination model that best aligns with the majority of fault slip rates, considering fault segmentation and historical seismicity rates. Ultimately, we calculated the peak ground acceleration (PGA) with a 10 % probability of exceedance within 50 years using the seismicity rates from the selected fault segmentation models and the logic tree model of ground motion prediction equations (GMPEs) determined to be suitable for the Chinese mainland. The exploration of multi-segment rupture combinations, along with the resultant modeled seismicity rates and PGA values, offers valuable insights into the seismic hazard present in the NWYR. By leveraging the modeled PGA values and accounting for the site response of different rock types, we employed a machine learning model to compute the probability distribution of landslides induced by potential seismic hazards. This increasing precision and reliability will be invaluable for guiding disaster preparedness initiatives, land-use planning and infrastructure resilience strategies in the area.
2.1 Fault slip rates and segmentation
In the NWYR, the Lijiang–Xiaojinhe fault, characterized by its left-lateral strike-slip rate, and the northern section of the Red River fault, known for its significant right-lateral strike-slip movement, play pivotal roles in crustal deformation. While the southward crustal extrusion of the Tibetan Plateau enhances the left-lateral strike slip of the northeast-trending faults like the Lijiang–Xiaojinhe fault. These observations underscore the complex interplay of fault dynamics in the NWYR, as elucidated by previous studies (Gan et al., 2007; Cheng et al., 2012; Wang and Shen, 2020). To counterbalance the southwestward crustal extrusion (Wang et al., 1998; Cheng et al., 2012), several other faults in the region, such as the Chenghai fault, the Ninglang fault, the Heqing–Eryuan fault, the Yulong East fault and the Longpan–Qiaohou fault (also known as the Jianchuan fault), also exhibit a component of normal slip rate as well (Institute of Geology-State Seismological Bureau and Yunnan Seismological Bureau, 1990; Han et al., 2004) (see Fig. 2). In contrast, the Zhongdian fault and the northern part of the Red River fault, including the Weixi–Qiaohou fault and the Diancang Shan East fault, exhibit right-lateral strike-slip movement (Zhou et al., 2004; Han et al., 2005). Recent focal mechanisms of intermediate earthquakes indicate a complex regional stress field, featuring both strike-slip and normal faulting regimes (Fig. 2). Table S1 in the Supplement provides an overview of the observed fault slip rates in the NWYR.
The Lijiang–Xiaojinhe fault serves as a boundary fault separating the Tibetan Plateau from the central Yunnan block (Xu et al., 2003; Cheng et al., 2012). We divided the Lijiang–Xiaojinhe fault into 10 segments (the F1–F10 segments in Fig. 3) based on fault geometry and its intersection with other faults. For the F1 segment, known as the Jinpingshan fault, recent fault mapping reveals a Holocene left-lateral slip rate ranging from 1.3 to 2.7 mm yr−1 derived from gully displacement across the segment, while the vertical slip rate is approximately 0.2 mm yr−1 (Rui Ding, personal communication, 2024). Regarding the F5–F10 segments, Gao et al. (2019) demonstrated that the Hongxing–Jianshanying segment (F6 segment in Fig. 3) exhibited a Holocene left-lateral slip rate of 3.32 ± 0.22 mm yr−1 with a normal slip rate component of 0.35 ± 0.02 mm yr−1, whereas the Runan–Nanxi segment (F10 segment in Fig. 3) had a Holocene left-lateral slip rate of 2.37 ± 0.20 mm yr−1. Accordingly, we applied the slip rate of the F6 segment to the F4–F7 segments and the slip rate of the F10 segment to the F8–F10 segments. Notably, we considered the strike-slip motion of the F5–F10 segments to originate from two sources: the strike-slip Jinpingshan fault and the strike slip of the Litang fault, aligning with the observed clockwise rotation of regional crustal deformation around the Litang fault and the Lijiang–Xiaojinhe fault. Consequently, we inferred the left-lateral strike-slip rate of the F4 segment to be ∼ 2.1 mm yr−1, consistent with the southern section of the Litang fault (Zhou et al., 2007). However, the F2 and F3 segments, which link the F1 and F4 segments, lack recorded fault slip rates from fieldwork studies. In this regard, we assigned a conservative estimate, employing half the value of the strike-slip rate of the F1 segment for both the F2 and F3 segments, approximately 1.2 mm yr−1.
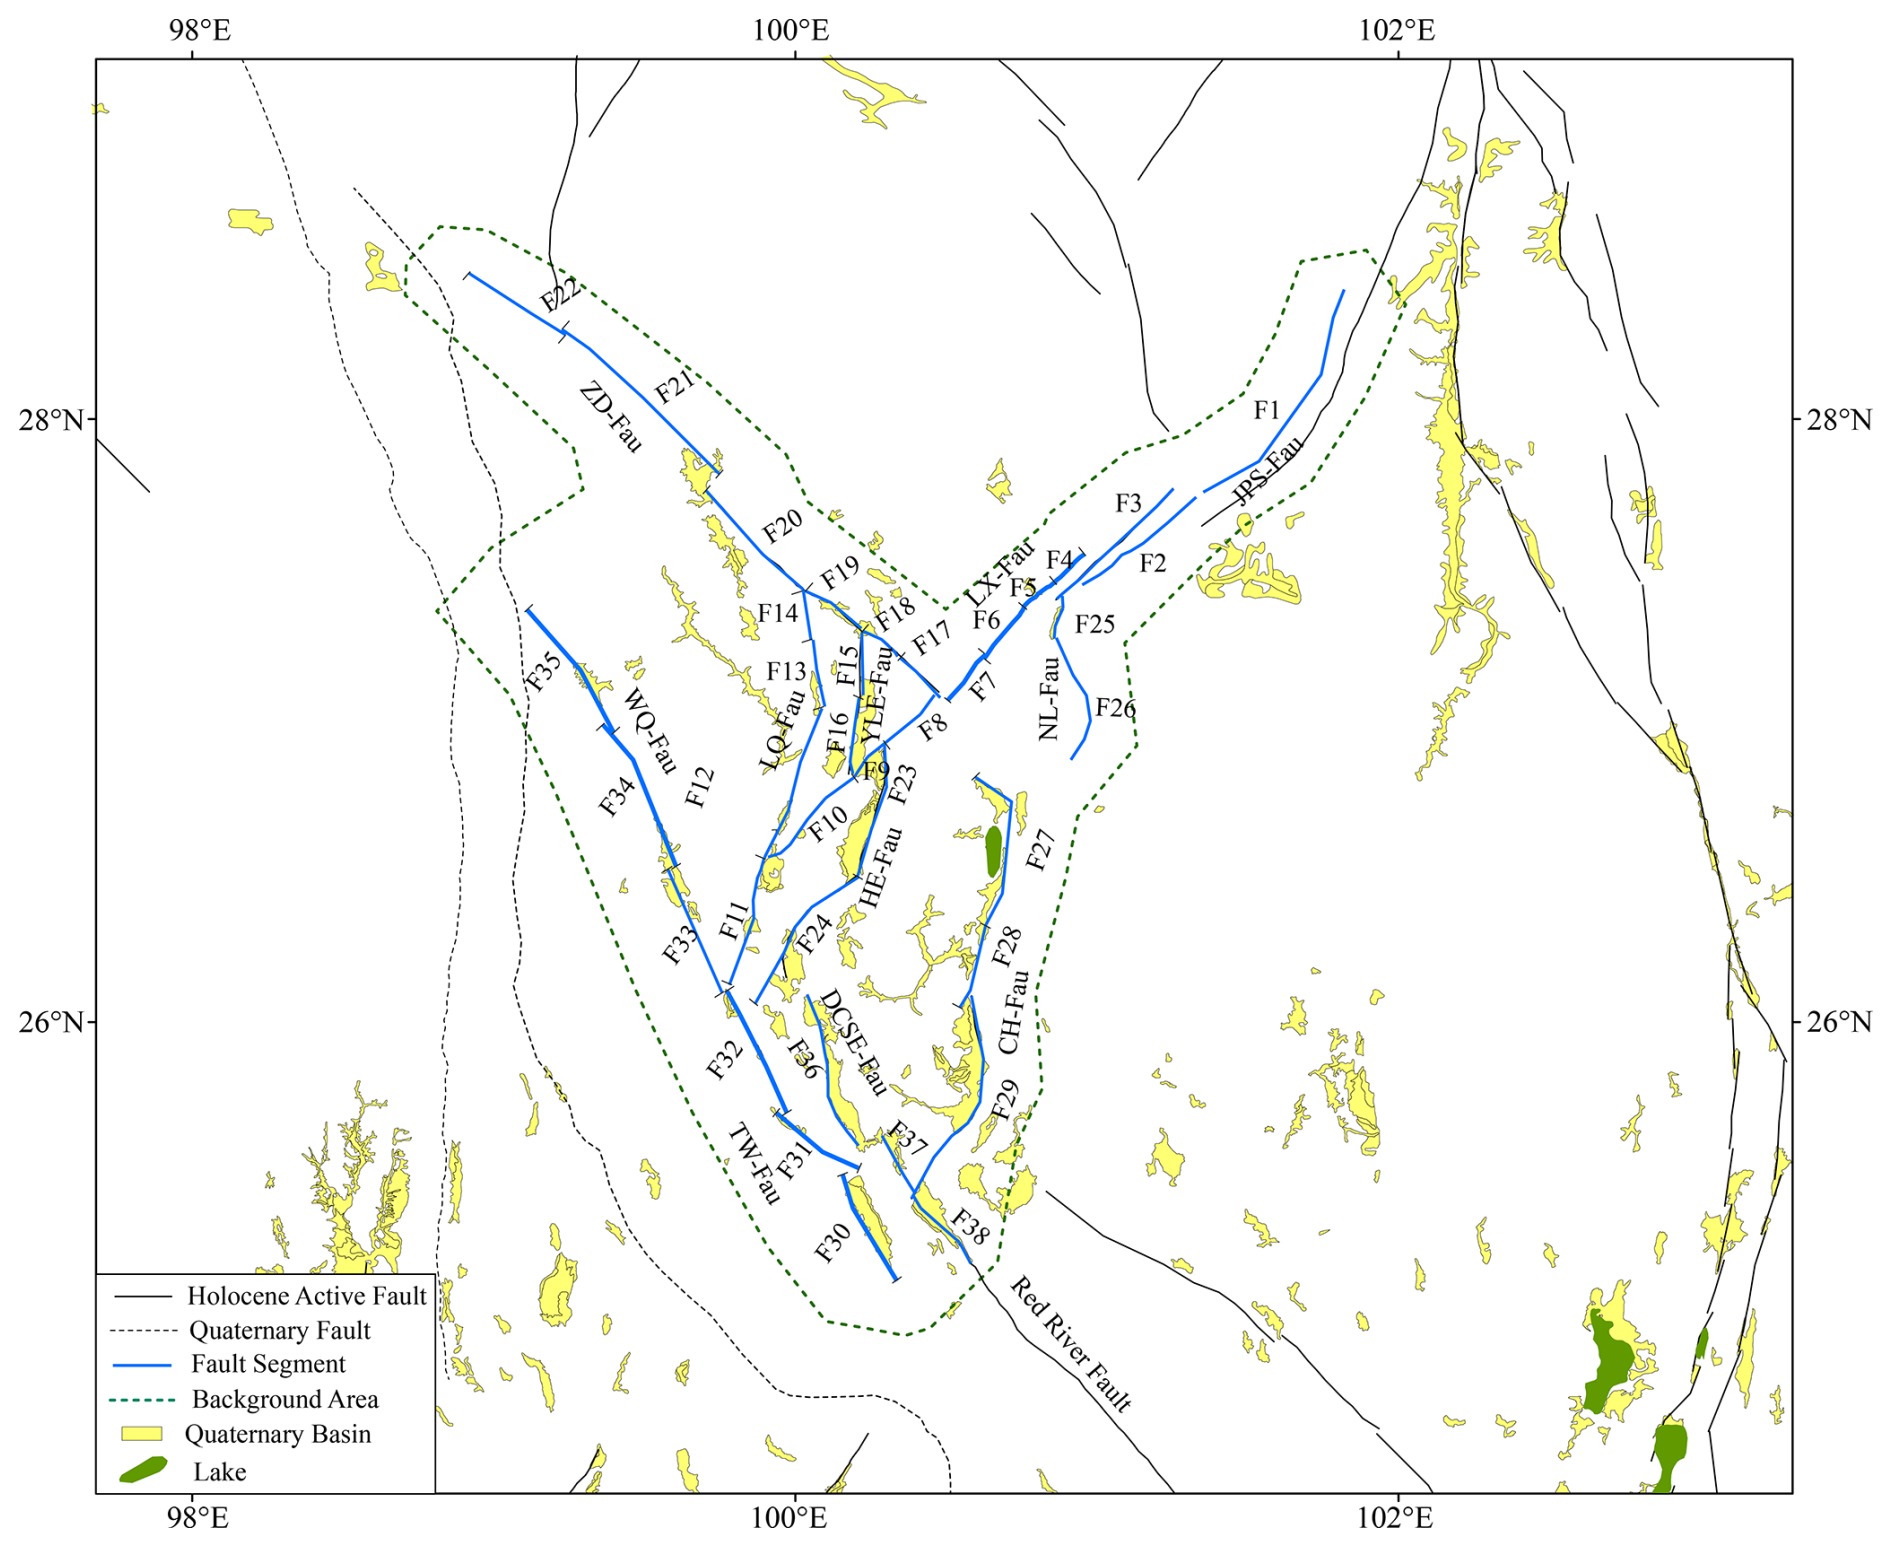
Figure 3Fault segmentation model for the NWYR in which the Quaternary basin distribution is from Deng et al. (2003) and the fault data from Wu et al. (2024).
For the Longpan–Qiaohou fault (comprising the F11–F14 segments), we delineated it into four distinct segments based on the fault mapping data provided by Wu et al. (2024). The sinistral slip rate of the Longpan–Qiaohou fault was estimated at ∼ 2.2 mm yr−1 over the past 3500 years, with a normal slip rate of 0.23 mm yr−1 (Institute of Geology-State Seismological Bureau and Yunnan Seismological Bureau, 1990).
As for the Yulong East fault, we divided it into two segments, namely the F15 and F16 segments, utilizing fault mapping data and Quaternary sedimentary distribution. The slip rate of the Yulong East fault was assessed by Han et al. (2005), who determined that the Quaternary left-lateral and normal slip rates are 0.84 and 0.70 mm yr−1, respectively, derived from the displacement observed in a gully crossing the fault.
Regarding the Zhongdian fault, we partitioned it into six segments, designated as the F17–F22 segments, based on fault mapping data (Wu et al., 2024). The Holocene dextral slip rate of the Zhongdian fault is estimated to be approximately 1.7–2.0 mm yr−1, with a minor normal slip rate of 0.6–0.7 mm yr−1 based on terrace displacement across the fault (Chang et al., 2014).
For the Heqing–Eryuan fault, we segmented it into two sections, labeled as the F23 and F24 segments. The Quaternary dextral slip rate and normal slip rate of the Heqing–Eryuan fault were reported to be around 2 and 0.7–1.0 mm yr−1, respectively, as documented by the Institute of Geology-State Seismological Bureau and Yunnan Seismological Bureau (1990). Additionally, recent research by Sun et al. (2017) yielded similar fault slip rate results, indicating a left-lateral slip rate of 1.80 mm yr−1 and a vertical slip rate of 0.28 mm yr−1 since the Pleistocene.
The Ninglang fault is primarily characterized as a left-lateral strike-slip fault, although it exhibits a minor normal slip component of less than 0.1 mm yr−1 at the basin margin. The strike-slip rate of the Ninglang fault, as determined from fault mapping work conducted by Panxing Yang from the Institute of Earthquake Forecasting, China Earthquake Administration (personal communication, 2024), was estimated to be less than 1 mm yr−1. For our analysis, we opted to utilize a median value of 0.5 ± 0.4 mm yr−1 for the strike-slip rate of the Ninglang fault. Based on the distribution of Quaternary sediments, we divided the Ninglang fault into two distinct segments, designated as the F25 and F26 segments.
The sinistral slip rate of the Chenghai fault has been estimated at 2.5 to 3.0 mm yr−1, determined from the erosion rate of the Jinsha River crossing the fault. Additionally, the normal slip rate is reported to be ∼ 0.7–1.0 mm yr−1, assessed from the lift rate of the fault scarps (Institute of Geology-State Seismological Bureau and Yunnan Seismological Bureau, 1990), consistent with the findings of Tang et al. (2017). We divided the Chenghai fault into three segments, i.e., the Chenghai segment (the F27 segment), the Qina segment (the F28 segment) and the Bingchuan segment (the F29 segment), based on the sedimentary distribution (Huang et al., 2018; Yu et al., 2005).
The southern end of the Longpan–Qiaohou fault separates the Weixi–Qiaohou fault from the Tongdian–Weishan fault. We segmented these two faults into six segments each based on fault mapping data and Quaternary sedimentary distribution. Concerning the slip rate of the Tongdian–Weishan fault, the dextral slip rate in the Late Pleistocene is estimated to be ∼ 1.8–2.4 mm yr−1, with a normal slip rate of 0.17–0.35 mm yr−1, calculated from the displacement of fault scarps (Chang et al., 2016).
In contrast, for the Weixi–Qiaohou fault, the dextral slip rate is ∼ 1.25 mm yr−1, while the normal slip rate has been ∼ 0.91 mm yr−1 since the Late Pleistocene (Ren et al., 2007). Comparing these rates to the dextral slip rate from the middle section of the Red River fault, which is reported to be 1.1 ± 0.4 mm yr−1 (Shi et al., 2018), it is evident that the dextral slip rates decrease from the northwest to the southeast across the Red River fault system, encompassing the Weixi–Qiaohou fault, the Tongdian–Weishan fault and the Red River fault.
The Diancang Shan East fault is the seismogenic fault of the 1925 M 7 Dali earthquake. We deduced that the Diancang Shan East fault is a dominant normal slip fault as the boundary fault of the Dali basin and Erhai Lake. The normal slip rate of this fault is 1–2 mm yr−1 (Guo et al., 1984; Zhou et al., 2004).
Additionally, we incorporated the F37 and F38 segments of the northern part of the Red River fault into our segmentation model. The right-lateral strike-slip rate of these two segments is ∼ 1.1 mm yr−1. Figure 3 illustrates the segmentation model of the faults in the NWYR.
2.2 Multi-segment rupture combination models
Recently, geological and geophysical studies have documented several large earthquakes characterized by multi-segment rupturing. Notable examples include the Mw 7.4 Landers earthquake in 1992 (Campillo and Archuleta, 1993), the Mw 7.9 Wenchuan earthquake in 2008 (Xu et al., 2009), the Mw 7.8 Kaikoura earthquake in 2016 (Xu et al., 2018), and the 2023 doublet events of Mw 7.8 and Mw 7.5 in Türkiye (Petersen et al., 2023). These events exhibited rupturing across different segments, resulting in larger magnitudes than would be expected from single-segment ruptures.
Numerous studies have focused on understanding the fault's geometric and physical parameters to ascertain conditions conducive to multi-segment rupturing. Factors identified include step width (e.g., < 5 km) (Harris and Day, 1999; Lozos et al., 2012); fault structural maturity characterized by initiation age, net slip, length and slip rate (Manighetti et al., 2007, 2021); and geometric irregularities, such as fault branches and bends, which were significantly influenced by the pre-existing stress field (Mignan et al., 2015).
For strike-slip faults, we applied conclusions from dynamic rupture modeling – indicating that a step width of more than 5 km (Harris and Day, 1999) and a strike difference of more than 28°, as observed in field studies of historical rupture events (Biasi and Wesnousky, 2017), could inhibit earthquake rupture – to select the multi-segment rupture combinations.
In our segmentation model of the NWYR, the distance between the F3 segment and the F1–F2 segments is approximately 7 km, and the step width between the F20 and F21 segments is also about 7 km. Similarly, the distance between the F3 segment and the F4 segment is approximately 6.5 km. Based on these distances, we did not consider the rupture continuity of these segments. For multi-fault rupture combinations, the strike difference was also used to assess whether a multi-fault rupture could occur. Consequently, we excluded nearly all the multi-fault rupture combinations except for the combination between the F10 and F11 segments, which have a strike difference of about 20°.
Based on the segmentation model, fault rupture behaviors, the intersections among fault segments and geometric information discussed above, we developed four multi-segment rupture combination models for the fault segments in the NWYR (Fig. 4). The Mw 6.6 Lijiang earthquake on 3 February 1996 represents a significant normal rupture event that occurred on the Yulong East fault. This earthquake stands out as the most substantial seismic event in the NWYR since the 1970s, underscoring the normal slip behavior of the Yulong East fault. This observation suggests a potential effect on the multi-segment rupture behavior of the Zhongdian fault.
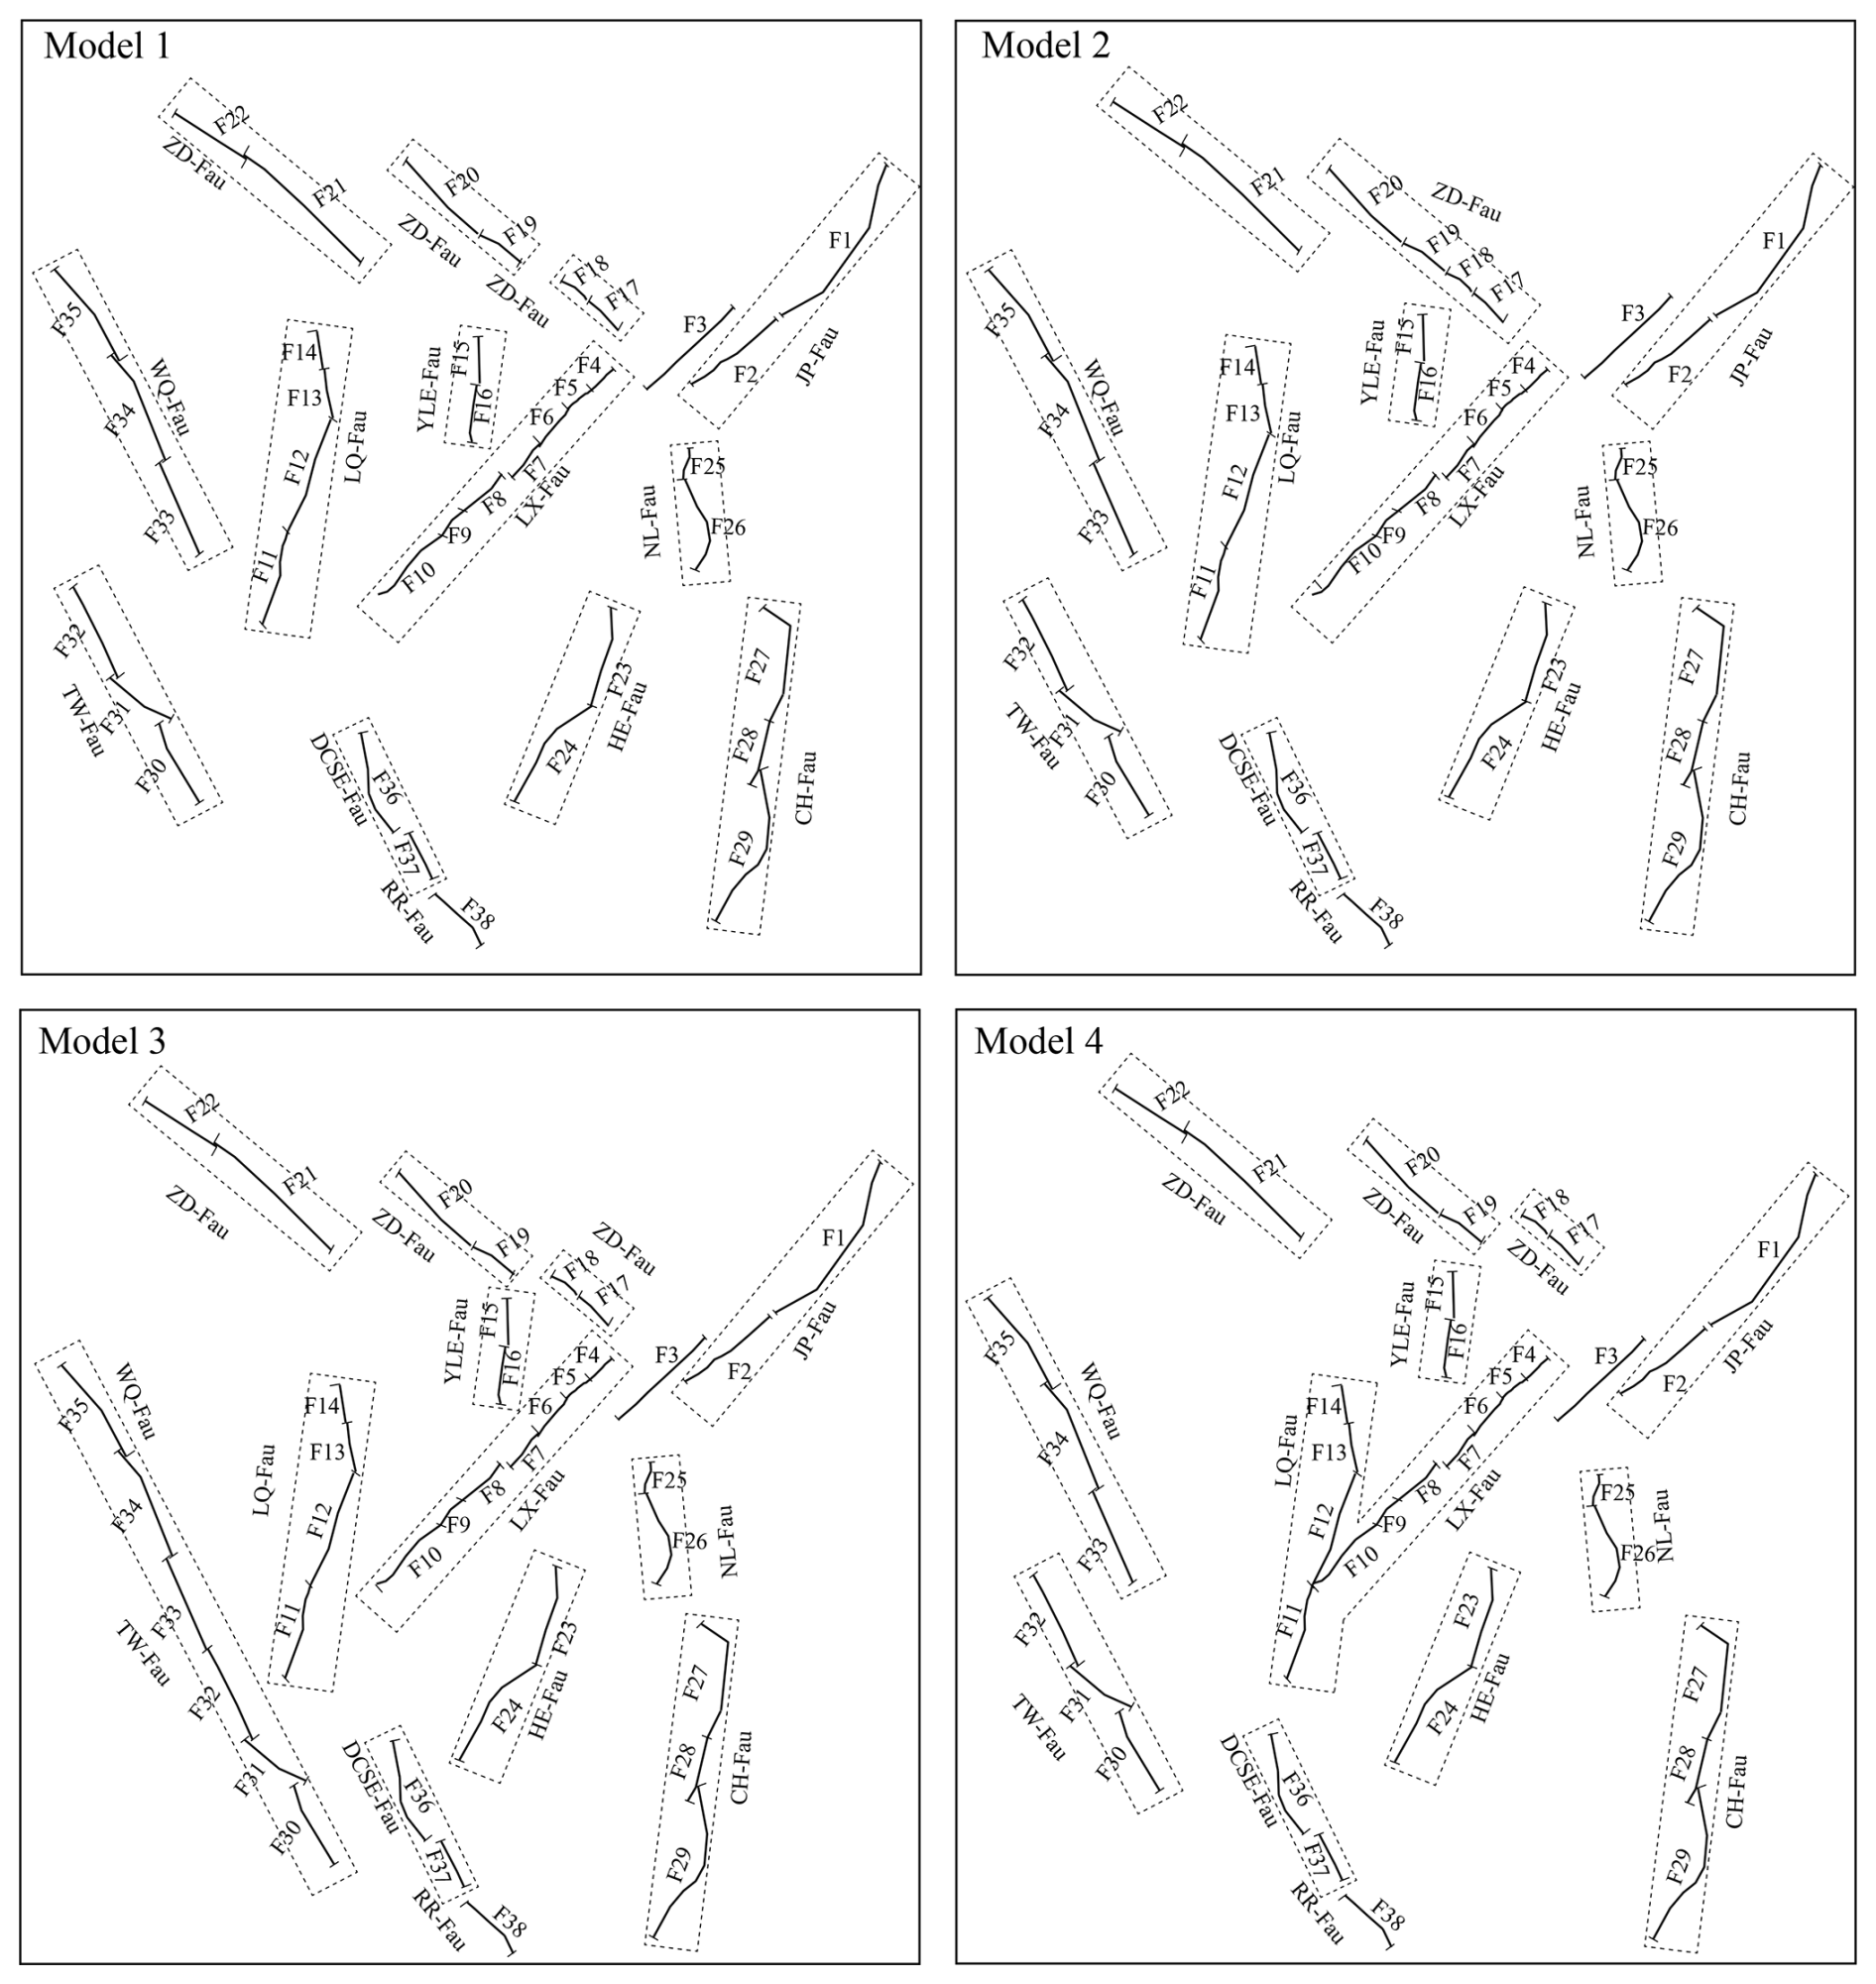
Figure 4Possible rupture combination models for the fault segments in the NWYR. Dashed rectangles show the rupture combinations for each model.
In Model 1, we exclusively examined the multi-segment rupture combinations within the same faults. Specifically, for the Zhongdian fault, we included the multi-segment rupturing of the F17 and F18 segments, as well as the multi-segment rupturing of the F19 and F20 segments. This approach considered the normal slip behavior of the Yulong East fault (F15 and F16 segments) and its potential impact on Quaternary sedimentary distribution between the F18 and F19 segments of the Zhongdian fault. Subsequently, in Model 2, we evaluated the plausibility of multi-segment rupturing occurring across the F17–F20 segments.
In the NWYR, the prevailing fault behavior is sinistral slip along the northeast-trending faults, a trend consistent with the observed clockwise rotation in regional crustal deformation (Cheng et al., 2012) and the presence of ductile low-crust flow (Zhang et al., 2022). The sinistral slip observed along the Longpan–Qiaohou fault may strongly impacted on the dextral slip occurring along the Weixi–Qiaohou fault, which extends from the Tongdian–Weishan fault, contributing to the decrease in dextral slip rates observed from the Weixi–Qiaohou fault to the Tongdian–Weishan fault. In Model 3, we integrated the multi-segment rupture combination of the Weixi–Qiaohou fault (the F33–F35 segments) and the Tongdian–Weishan fault (the F30–F32 segments).
In 2023, two earthquakes of Mw 7.8 and Mw 7.5 successively ruptured the East Anatolia fault region in Türkiye (Xu et al., 2023; Petersen et al., 2023). The rupture of the first earthquake, with Mw 7.8, initiated on the splay Narli fault and propagated bilaterally along the main East Anatolia fault (Liu et al., 2023). Consequently, we took into account the possibility of rupture propagation from one fault to another in our rupture combinations. Using Model 4, we investigated whether the rupture on the Lijiang–Xiaojinhe fault could propagate to the Longpan–Qiaohou fault. This consideration was prompted by similarities in the rupture behavior between the F11 segment of the Longpan–Qiaohou fault and the F10 segment of the Lijiang–Xiaojinhe fault (Table S1), along with a strike difference of ∼ 20°, smaller than the threshold of 28° proposed by Biasi and Wesnousky (2017) to prohibit the rupture process.
Recognizing the importance of these rupture parameters in producing multi-segment rupturing, recent studies, such as those by Chartier et al. (2019), Cheng et al. (2021), Lee et al. (2022), and Chang et al. (2023), included the possibilities and probabilities of multi-segment rupturing in seismic hazard analysis. Additionally, Dutykh et al. (2013) and Rashidi et al. (2020) employed multi-segment rupturing in models of tsunami wave generation. The concept of multi-segment rupturing was also incorporated in the Uniform California Earthquake Rupture Forecast, version 3 (UCERF3), model through their complex “grand inversion” methodology, which integrates data on fault slip rates, historical seismicity and paleo-earthquake records (Page et al., 2014; Field et al., 2014). However, for most other regional studies, collecting all the necessary input parameters remains challenging.
In seismic hazard modeling, fault slip rates can be used instead of historical seismicity data to simulate seismicity rates on faults, as slip rates span multiple seismic cycles of large-magnitude earthquakes and provide estimates of the average earthquake recurrence interval (Youngs and Coppersmith, 1985). We utilize the methodology developed by Chartier et al. (2019) to translate these fault slip rates into seismicity rates, considering both multi-segment and single-segment ruptures.
3.1 Methodology
In our earthquake hazard modeling, the seismicity rates should reflect both the fault slip rate and the regional magnitude–frequency distribution (MFD), e.g., the Gutenberg–Richter (G-R) relationship (Gutenberg and Richter, 1944) and the characteristic earthquake model (Y-C; Schwartz and Coppersmith, 1984). Youngs and Coppersmith (1995) balanced fault slip rates with MFD to determine the seismicity rate on faults. They employed the composite Y-C model or truncated G-R model to convert the fault slip rate into the seismicity rates on the fault. These converted MFDs were widely used in seismic hazard analysis (e.g., Avital et al., 2018; Chartier et al., 2019; Rong et al., 2020). This approach enables a more comprehensive assessment of earthquake hazards by integrating both fault slip rates and the frequency of seismic events. For assessing the possibilities and probabilities of multi-segment rupturing, it is essential to represent the seismicity rate of such combinations within the magnitude–frequency relationship for each segment.
To achieve this, Chartier et al. (2017, 2019, 2021) devised a Python-based code known as SHERIFS. This code employed an iterative process, enabling the balancing of occurrence rates for multi-segment rupturing events alongside intermediate and small earthquakes on each fault segment. Leveraging historical seismicity data, they utilized the slip rate of each fault segment to convert it into the target MFD on the fault, such as the G-R or the Y-C distribution. This method offered a robust framework for assessing seismic hazard, integrating both single- and multi-segment rupture scenarios effectively. Determining the maximum magnitudes of individual fault segments and their combinations could rely on fault length, following rupture scaling laws proposed by researchers (e.g., Wells and Coppersmith, 1994; Leonard, 2010; Cheng et al., 2020). Since most rupture scaling relationships are developed for plate boundary regions (Stirling et al., 2013), we selected a regression scaling relationship based on a dataset of earthquakes from the Chinese mainland (Cheng et al., 2020) and compared the results with those from the widely used rupture scaling relationship by Wells and Coppersmith (1994), which incorporates global data from both interplate and intraplate earthquakes.
In these steps, the b value from historical earthquakes, the rupture scaling law of the faults and the fault slip rates are typically accompanied by significant uncertainties. SHERIFS used the random sampling method to explore the uncertainty bounds. The rates are derived while examining uncertainties related to earthquake magnitudes, the duration of the completeness period and the limited number of observed earthquakes for larger magnitudes using a Monte Carlo approach (Chartier et al., 2021). For each branch of the logic tree in the random sampling, it generates a corresponding number of models that match the total count of random samples. For each model, the slip-rate value is selected uniformly within its uncertainty bounds, scaling law parameters are chosen independently from a Gaussian distribution within their error bounds, and the b value is picked from the user-defined range. All these uncertainties propagate to the final step of calculating seismicity rates with uncertainties.
In the final step, they iterated the seismicity rates across magnitude bins associated with multi-segment rupturing, spanning large magnitudes down to small magnitudes, according to the target MFD for each fault segment. However, in many cases, the fault slip rate or the calculated seismicity rates could not fully account for the entire seismic activity. The remaining portion of the fault slip rate for each segment was attributed to non-mainshock slip (NMS), including processes like post-seismic slip and silent creep. An NMS ratio of ≤ 30 %–40 % is typically considered indicative of a model misfit, potentially arising from factors like creeping and specific conditions, such as boundary fault segments or creeping segments. Here, we adopted a similar approach in simulating seismic hazard modeling for the regional fault system in the NWYR.
3.2 Scaling relationship and modeling parameters
Given the fractured structure of the crust in the NWYR, as documented by Cao et al. (2023), the seismicity distribution in this area was notably complex and significantly different from that observed directly on the fault lines. Therefore, in our analysis of seismicity rates for the regional faults, we opted to utilize the G-R relation (Gutenberg and Richter, 1944) as the magnitude–frequency relationship rather than the Youngs–Coppersmith (Y-C) relation (Youngs and Coppersmith, 1985). For estimating magnitudes based on rupture length, we applied the relationship proposed by Cheng et al. (2020) to determine the maximum magnitude for each individual fault segment as well as their multi-segment combinations. Additionally, we accounted for a portion of earthquakes with M < 6.5 as off-fault seismicity. Specifically, we assigned probabilities of 95 %, 90 %, 85 %, 80 % and 80 % for magnitude bins of 6.0–6.4, 5.5–5.9, 5.0–5.4, 4.5–4.9 and 4.0–4.4, respectively, based on prior studies (Chartier et al., 2019; Cheng et al., 2021).
We calculated the b value for the eastern Tibet seismic zone, which encompasses nearly all of the NWYR, as illustrated in Fig. 1. The earthquake catalog utilized for this analysis was sourced from Cheng et al. (2017), covering the time period from 780 BCE to 2015 CE. Additionally, we incorporated earthquakes from the Global Centroid Moment Tensor (GCMT) catalog spanning the period 2016 to 2023. The regressed b value was approximately 0.96, with completeness times for magnitudes Mw 4.5, Mw 5.0, Mw 5.3, Mw 5.7, Mw 6.1 and Mw 6.4 identified as 1985, 1966, 1928, 1916, 1916 and 1900, respectively. It is noteworthy that the calculated b value is slightly higher than the value of 0.86 reported in Rong et al. (2020), likely due to the inclusion of new earthquakes occurring after 2015. Figure 5 visualizes the Gutenberg–Richter relationship in the eastern Tibet seismic zone, in which the b value is 0.96.
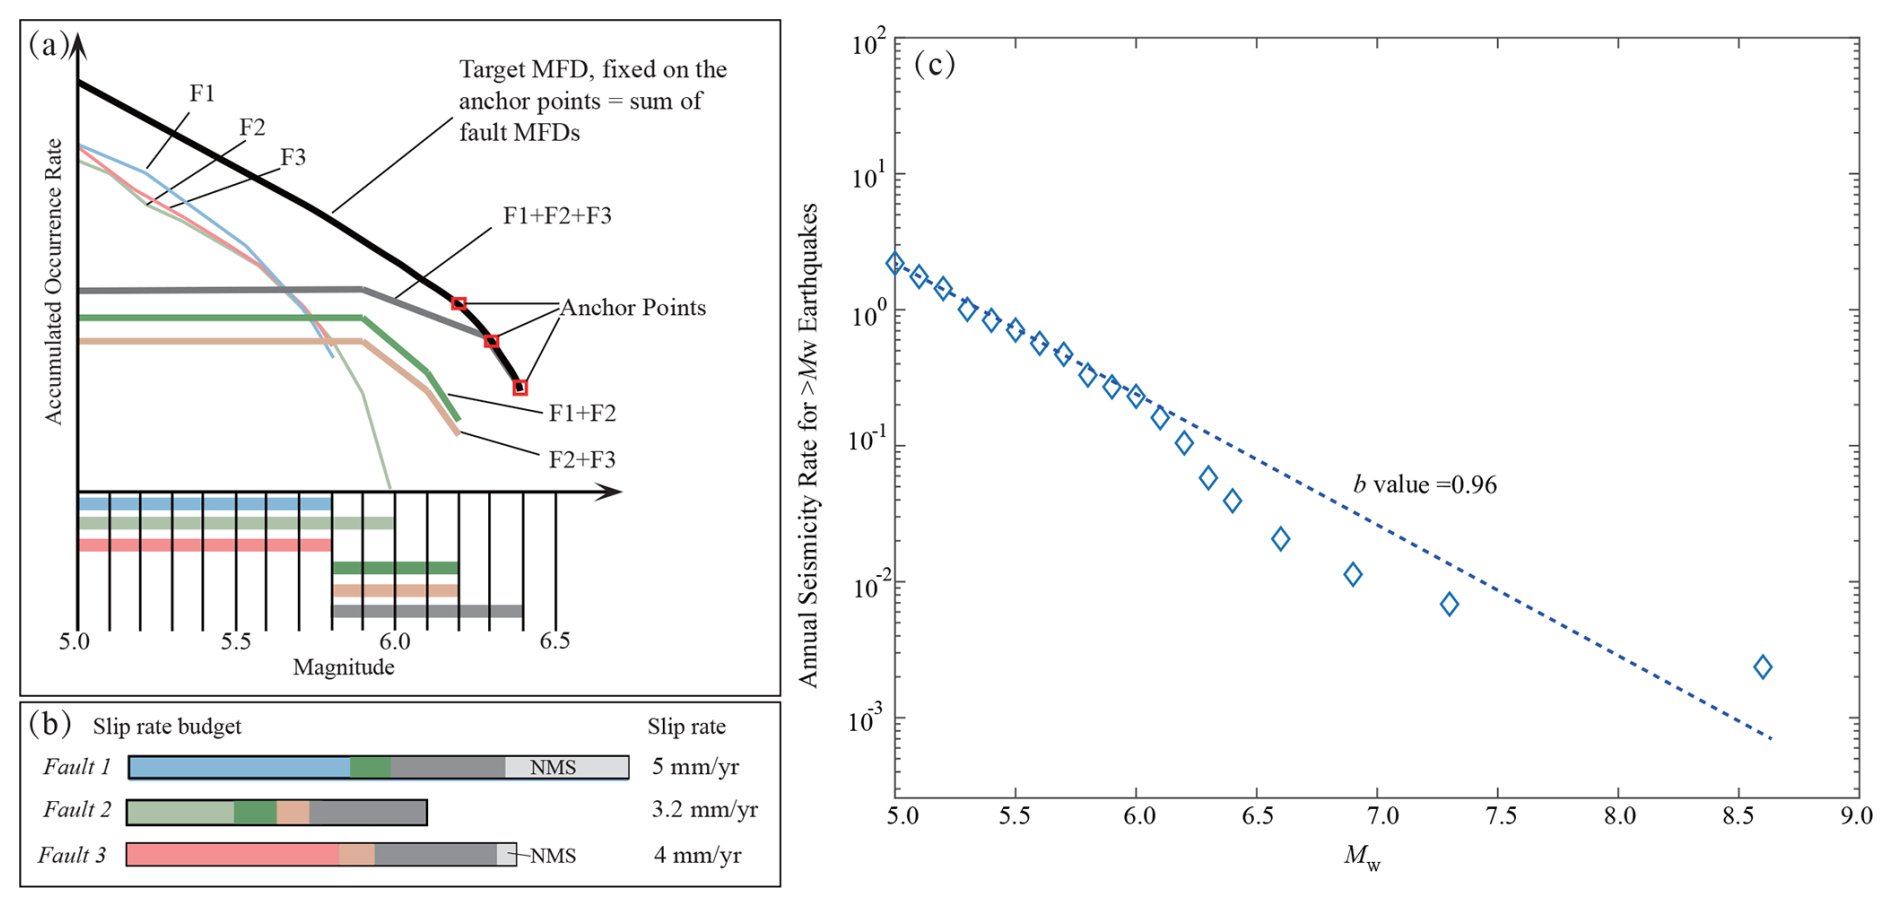
Figure 5Calculated b value for the eastern Tibet seismic zone where the NWYR is located (Fig. 1).
3.3 Comparison and selection of modeled results
We depicted the NMS ratios and modeled seismicity rates in Fig. 6. The right panels showcase the NMS ratios of the segments in Models 1–4. Model 1 exhibited the most balanced results between the modeled seismicity rates and historical ones. In Fig. 6a, all segments in Model 1 demonstrate NMS ratios smaller than 30 %. Chartier et al. (2019) suggested that NMS ratios below 30 %–40 % serve as a benchmark to assess the validity of multi-segment combination models, indicating effective consumption of the slip rate of each segment into seismicity rates. The left panels in Fig. 6b further underscores the alignment between the modeled and observed seismicity rates, showing that the observed historical seismicity rates closely matches the calculated rates, particularly for < M 7 earthquakes.

Figure 6Calculated NMS ratios and comparison results for different models using the G-R relation and the scaling relationships from Cheng et al. (2020). (a) Modeled non-mainshock slip (NMS) ratio. (b) Comparisons between the historical seismicity rates for different models. Dashed green lines are the MFD of each model, the solid green line is the mean MFD, and green patches represent the uncertainty (16–84 percentiles). The dotted black line is the rate from the catalog; the dashed red lines are individual Monte Carlo sampled rates of the catalog exploring the uncertainties on the magnitudes of earthquakes, and gray rectangles show the 1σ uncertainty on the earthquake rates in statistical analysis.
Compared to Model 1, Model 2 treats segments F17–F20 as a single unit rather than separating F17–F18 and F19–F20. The left panel of Fig. 6b indicates that the NMS ratios for segments F11–F14 and F4–F5 exceed 40 %, while the F6–F7 multi-segment combination has an NMS ratio ranging from 30 % to 40 %, showing that the combination of segments F17–F20 has an obvious impact on the seismicity rates of these faults. From the right panel in Fig. 6b, the historical seismicity rates for each fault segment are similar to those in Model 1. However, the calculated seismicity rates for each segment in Model 2 are generally lower than those in Model 1, except for a slightly higher rate in the magnitude range of 6.0–6.5. This result indicates that the fault slip rates are not being adequately accounted for in Model 2, unlike in Model 1 (Fig. 6a).
In Model 3, the rupture combination grouped segments F30–F35 rather than considering them separately as F30–F32 and F33–F35. Most segments exhibit high NMS ratios in the left panel of Fig. 6c. The calculated seismicity rates are generally smaller than the historical ones in the right panel of Fig. 6c. Similarly, Model 4 was utilized to investigate whether the great earthquakes of the Y-shaped rupture, combining segments F4–F10 with F11–F14, could occur. The NMS ratio for each segment and the calculated seismicity rates were comparable to those observed in Model 3 (Fig. 6d).
In addition, we also presented the results using the rupture scaling relationship proposed by Wells and Coppersmith (1994) in Fig. S1. Model 1 exhibited the most consistent outcomes, with the maximum NMS ratio observed on F14 at 39.3 %. The NMS ratios for all other segments were below 30 %. For the calculated seismicity rates from Model 2 to Model 4, using the rupture scaling relationship of Wells and Coppersmith (1994), we observed similar patterns, with segments in all three models exhibiting NMS ratios exceeding 40 %. In summary, these models, utilizing the rupture scaling of Wells and Coppersmith (1994), consistently yielded higher average NMS ratios compared to those obtained from the rupture scaling of Cheng et al. (2020), though the ratios were similar.
Based on the comparison among different multi-segment rupture combination models, Model 1 demonstrated the most consistent results among the multi-segment rupture combinations, fault segment slip rates and the magnitude–frequency relationship. Therefore, we utilized the seismicity rates from Model 1 to calculate the PGA values for the NWYR.
3.4 Comparison with national seismic hazard map results
We utilized OpenQuake Engine v3.10 (Pagani et al., 2014) to calculate the PGA values for the NWYR. In this computation, we employed a logic tree model comprising the Abrahamson et al. (2014), Chiou and Youngs (2014), Campbell and Bozorgnia (2014), and Boore et al. (2014) branches of GMPEs, along with their associated uncertainties. Each branch was assigned an equal weight of 0.25, following the selection criteria established by Dangkua et al. (2018) for the Chinese mainland. These GMPEs are tailored for earthquakes characterized by moment magnitude (Mw) and the distance to the rupture plane (Rrup) or its surface projection (RJB).
Figure 7a illustrates the distribution of PGA values for the site condition of firm to hard rock (Vs30 = 760 m s−1 or NEHRP B – the National Earthquake Hazards Reduction Program B) resulting from the seismicity rates in Model 1, corresponding to a 10 % probability of exceedance in 50 years, equivalent to a return period of 475 years. The analysis revealed concentrations of high PGA values exceeding 0.40 g near fault sources, particularly in areas with multiple fault sources. These areas include the F2–F5 segments of the Lijiang–Xiaojinhe fault, the vicinity of the Yulong East fault (YLE-Fau), the southern part of the Zhongdian fault (ZD-Fau) and the northern extent of the Heqing–Eryuan fault (HE-Fau).
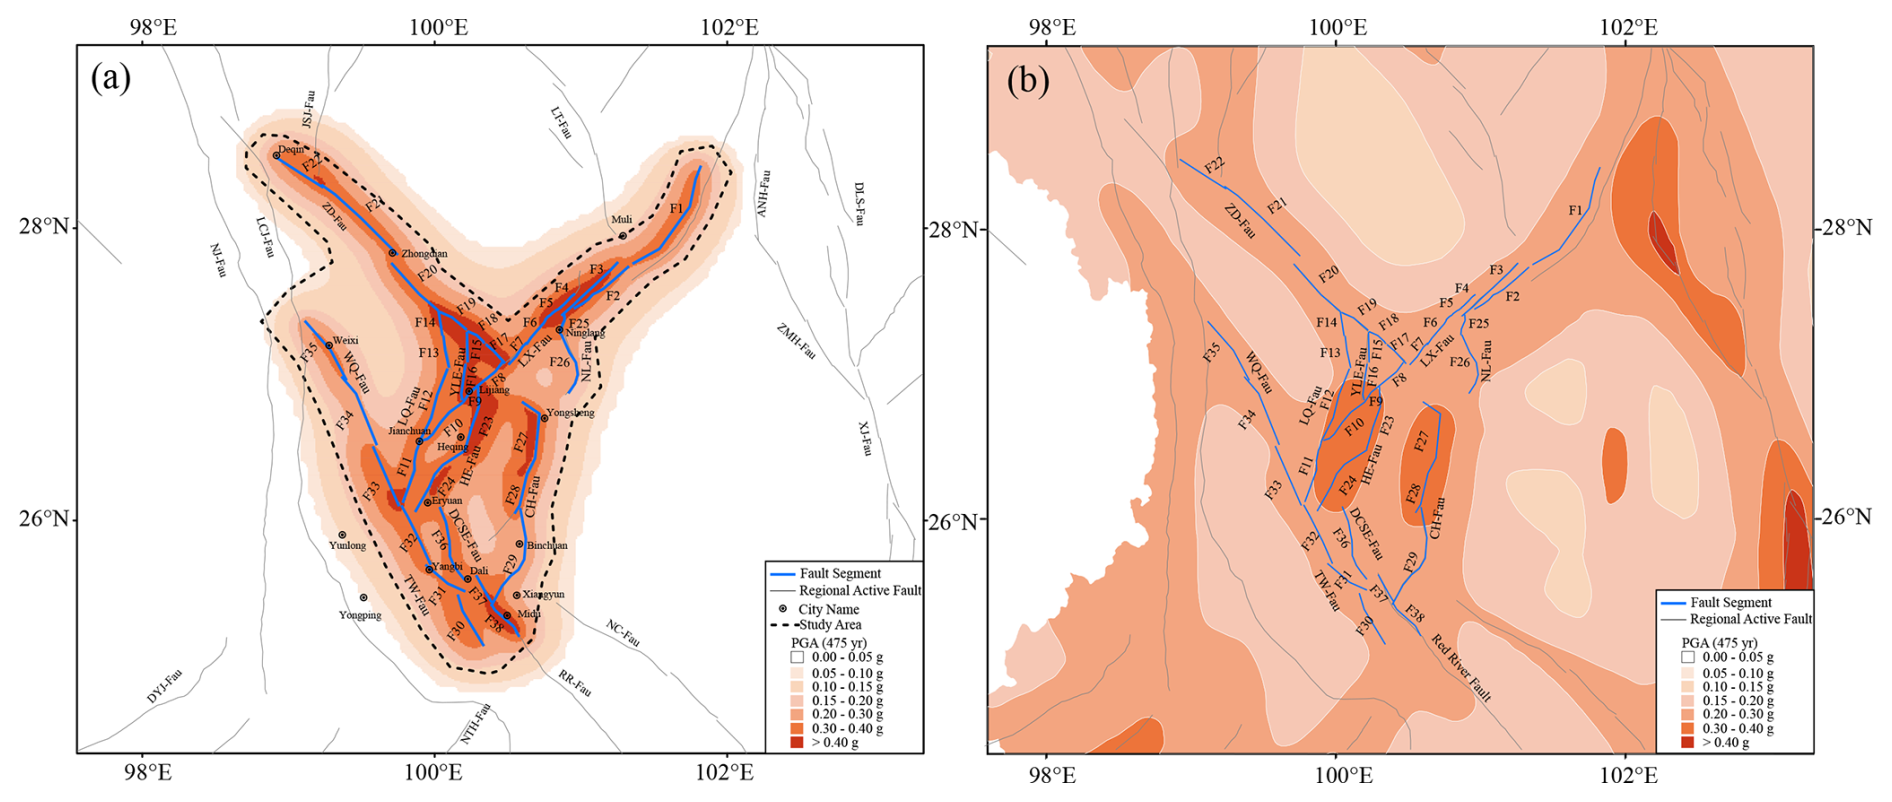
Figure 7Comparison of the modeled PGA distribution of 10 % in the next 50 years. (a) The PGA results in this article. (b) The PGA results in the CSGMPZM.
The area around the F2–F5 segments includes three parallel faults, with the sum of the strike slip of ∼ 3 mm yr−1, makes the PGA values relatively higher. The maximum magnitudes for the combinations of the F17–F18 and F15–F16 segments are both approximately Mw 6.6. These areas exhibit a prevalence of moderate earthquakes with short recurrence intervals and high PGA distributions over a 475-year return period. The modeled seismicity rates for both the F23 and the F24 segments complied with the G-R relationship with sufficient intermediate earthquakes, contributing to the high PGA values in the surrounding areas. Along the Chenghai fault, high PGA values are concentrated around the F27–F28 segments with strike-slip rates of 3.0 mm yr−1 but are lower around the F29 segments with a strike-slip rate of 2.5 mm yr−1. For the Red River fault and its extensions, including the Tongdian–Weishan fault and the Weixi–Qiaohou fault, high PGA values are concentrated around the F37–F38 segments and at the intersection points of the F11, F32 and F32 segments.
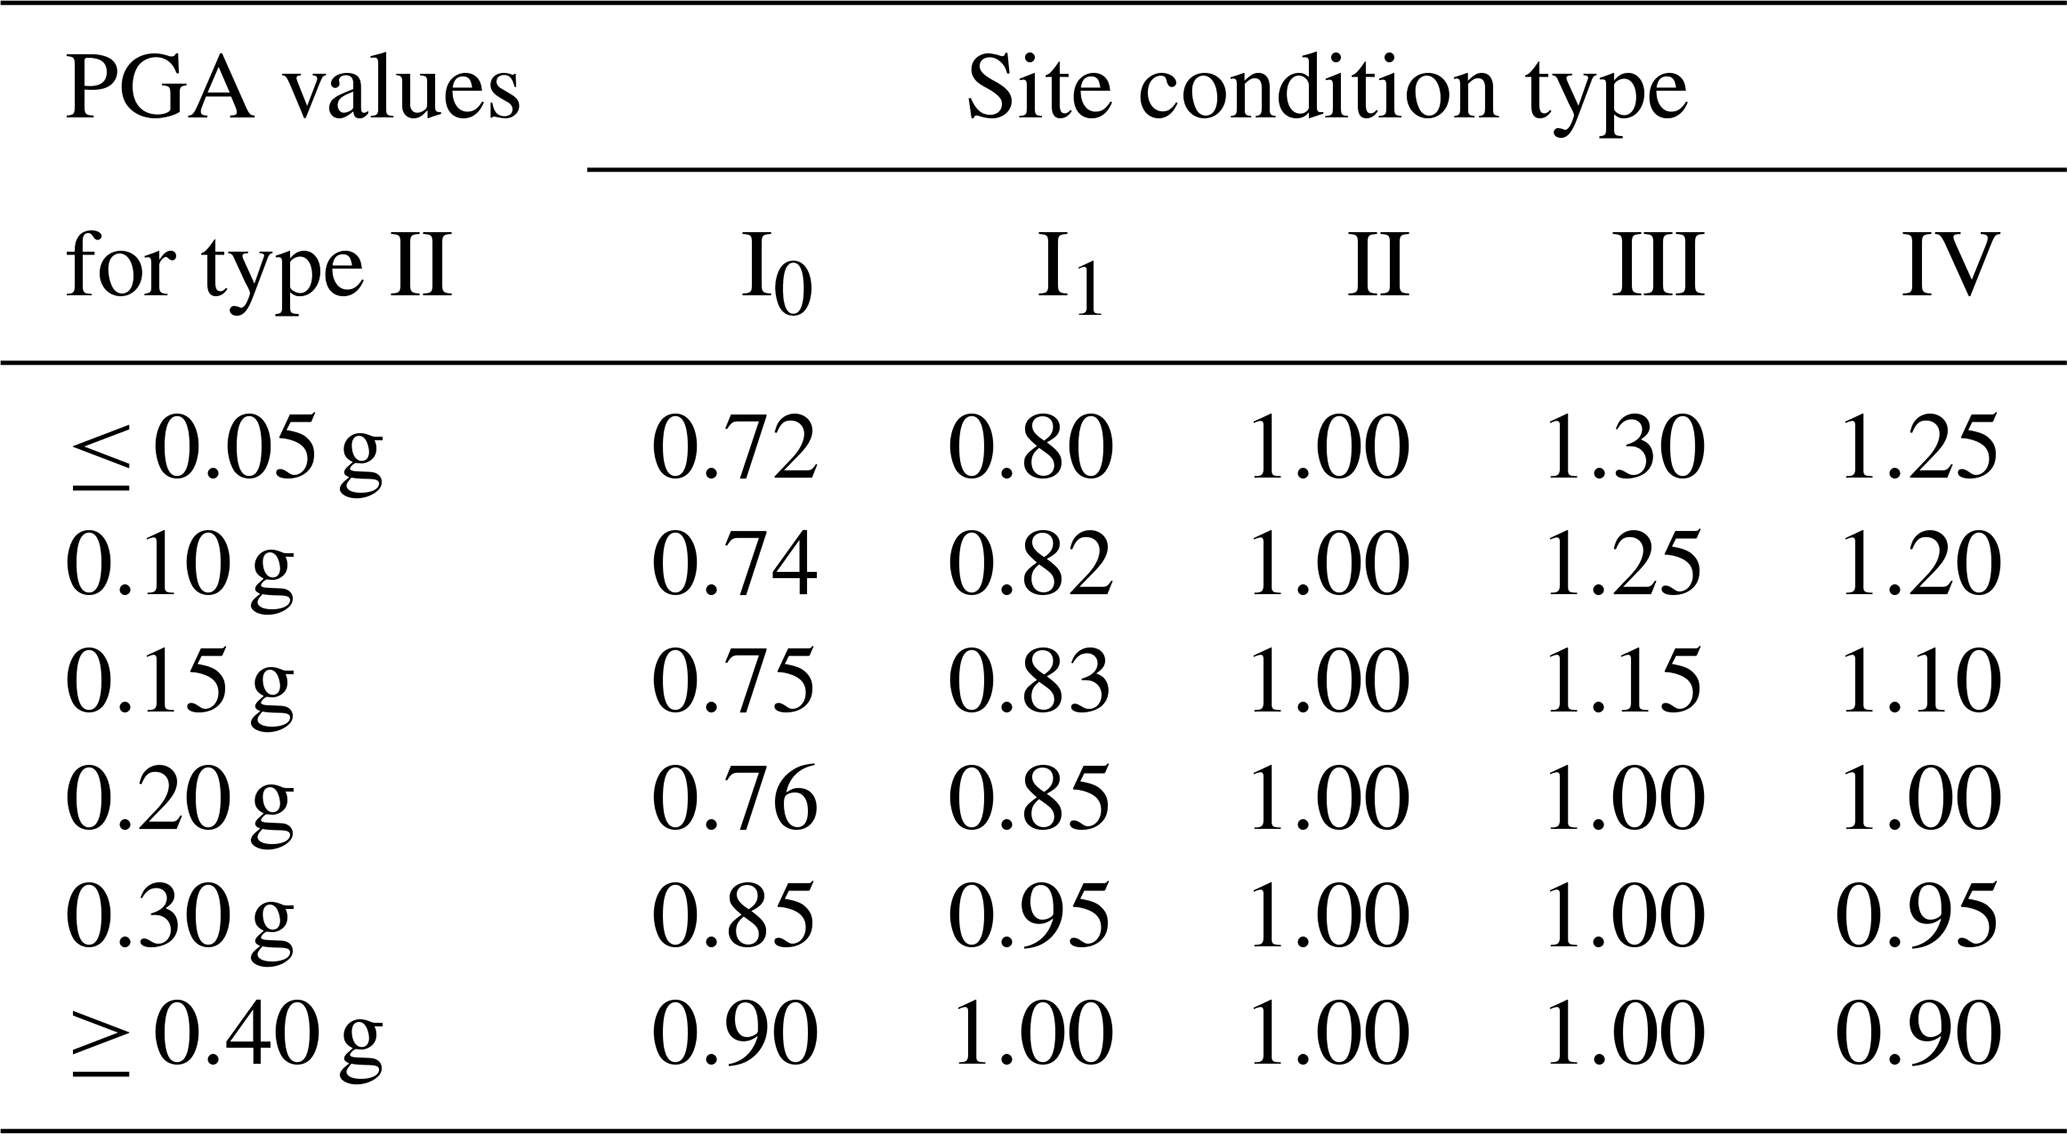
Compared to the national seismic hazard map of the CSGMPZM (Gao et al., 2015) (Fig. 7b) for the site condition of dense soil and soft rock (Vs30 = 500 m s−1 or NEHRP C) (Chen et al., 2021), our PGA values are consistently higher and more detailed. The Vs30 of 500 m s−1 is equivalent to type II in the classification table of the CSGMPZM, while the value of 760 m s−1 belongs to type I1. Table 1 presents the adjustment factors used by the CSGMPZM for site amplification (Gao et al., 2015). Even when we applied these site amplification adjustment factors to convert our PGA values from type I1 to type II, the PGA values would not change obviously as the adjustment are close to 1 for PGA values of 0.30–0.40 g and 1 for PGA values of ≥ 0.40 g. In Fig. 7b, the CSGMPZM indicates two high PGA values ranging from 0.30 to 0.40 g in the NWYR, specifically around the F23–F24 and the F27–F28 segments, respectively. In contrast, the PGA values in other areas surrounding the fault segments in our model range from 0.20 to 0.30 g.
Table 1Adjustment factors for PGA values of different site conditions via type II.
In the development of the CSGMPZM, the region around China was divided into 29 large seismic source zones to calculate the parameters of the MFD. Additionally, over 1000 potential fault sources across China were incorporated in the model. Historical seismicity rates on the MFD were employed to predict future seismic activity. This methodology led to lower anticipated seismicity rates in regions with limited historical earthquake records. The identification of potential fault sources in the CSGMPZM relied on expert opinions gleaned from research on historical surface rupture, fault segmentation and the distribution of past earthquakes. These data sources were subsequently utilized to allocate predicted seismicity rates based on the MFD.
Furthermore, the utilization of different GMPEs in the CSGMPZM compared to our results could also contribute to variations in PGA values. The CSGMPZM utilized GMPEs from Yu et al. (2013) based on surface magnitude (Ms) and epicentral distance (Repi). Their GMPEs result in higher PGA values for distances less than 80 km but lower values for distances ≥ 80 km (Cheng et al., 2021). Consequently, the seismicity rates derived from fault slip rates and multi-segment rupture combinations were key factors that resulted in our modeled PGA values being higher than those from the CSGMPZM.
3.5 Validity of the modeled results
In Fig. 8, we further illustrate seismicity rates for several typical fault segments to elucidate the reasons behind the observed high PGA values. Figure 8a shows that the seismicity rates of the F2 segment exhibit a typical G-R relationship, with a sufficient number of intermediate earthquakes contributing to a high PGA distribution in the surrounding area. We compared the seismicity rates on the F7–F8 segments and the F10 segment with the recurrence intervals from paleo-earthquake studies. In Fig. 8b and c, the gray bars illustrate that our modeled seismicity rates align with the recurrence interval of approximately 3000 years for a Mw 7.5 earthquake, as reported by Ding et al. (2018). We also observed that segments F7 to F8 of the Lijiang–Xiaojinhe fault tend to follow the characteristic earthquake model, based on their seismicity rate distribution. The F10 segment, approximately 44 km in length, ruptured during the 1751 M 6.8 earthquake. Additionally, Tang et al. (2014) identified three paleo-earthquake events with a recurrence interval of ∼ 5300 years for earthquakes of M 6.5+ earthquakes on the F11 segment. They suggested that the two paleo-events prior to the 1751 CE earthquake were considerably stronger, implying multi-segment rupturing involving combinations of segments F11 plus F12, F11–F13 and F11–F14 resulting in magnitudes of Mw 7.4–7.6. Additionally, we illustrate the seismicity rates for segments F15, F27, F29 and F36 in Fig. 8e–f, which closely follow the G-R distribution, leading to high PGA distributions in their vicinity. These results demonstrate that the occurrence rate of intermediate earthquakes plays a significant role in driving the high PGA distributions.
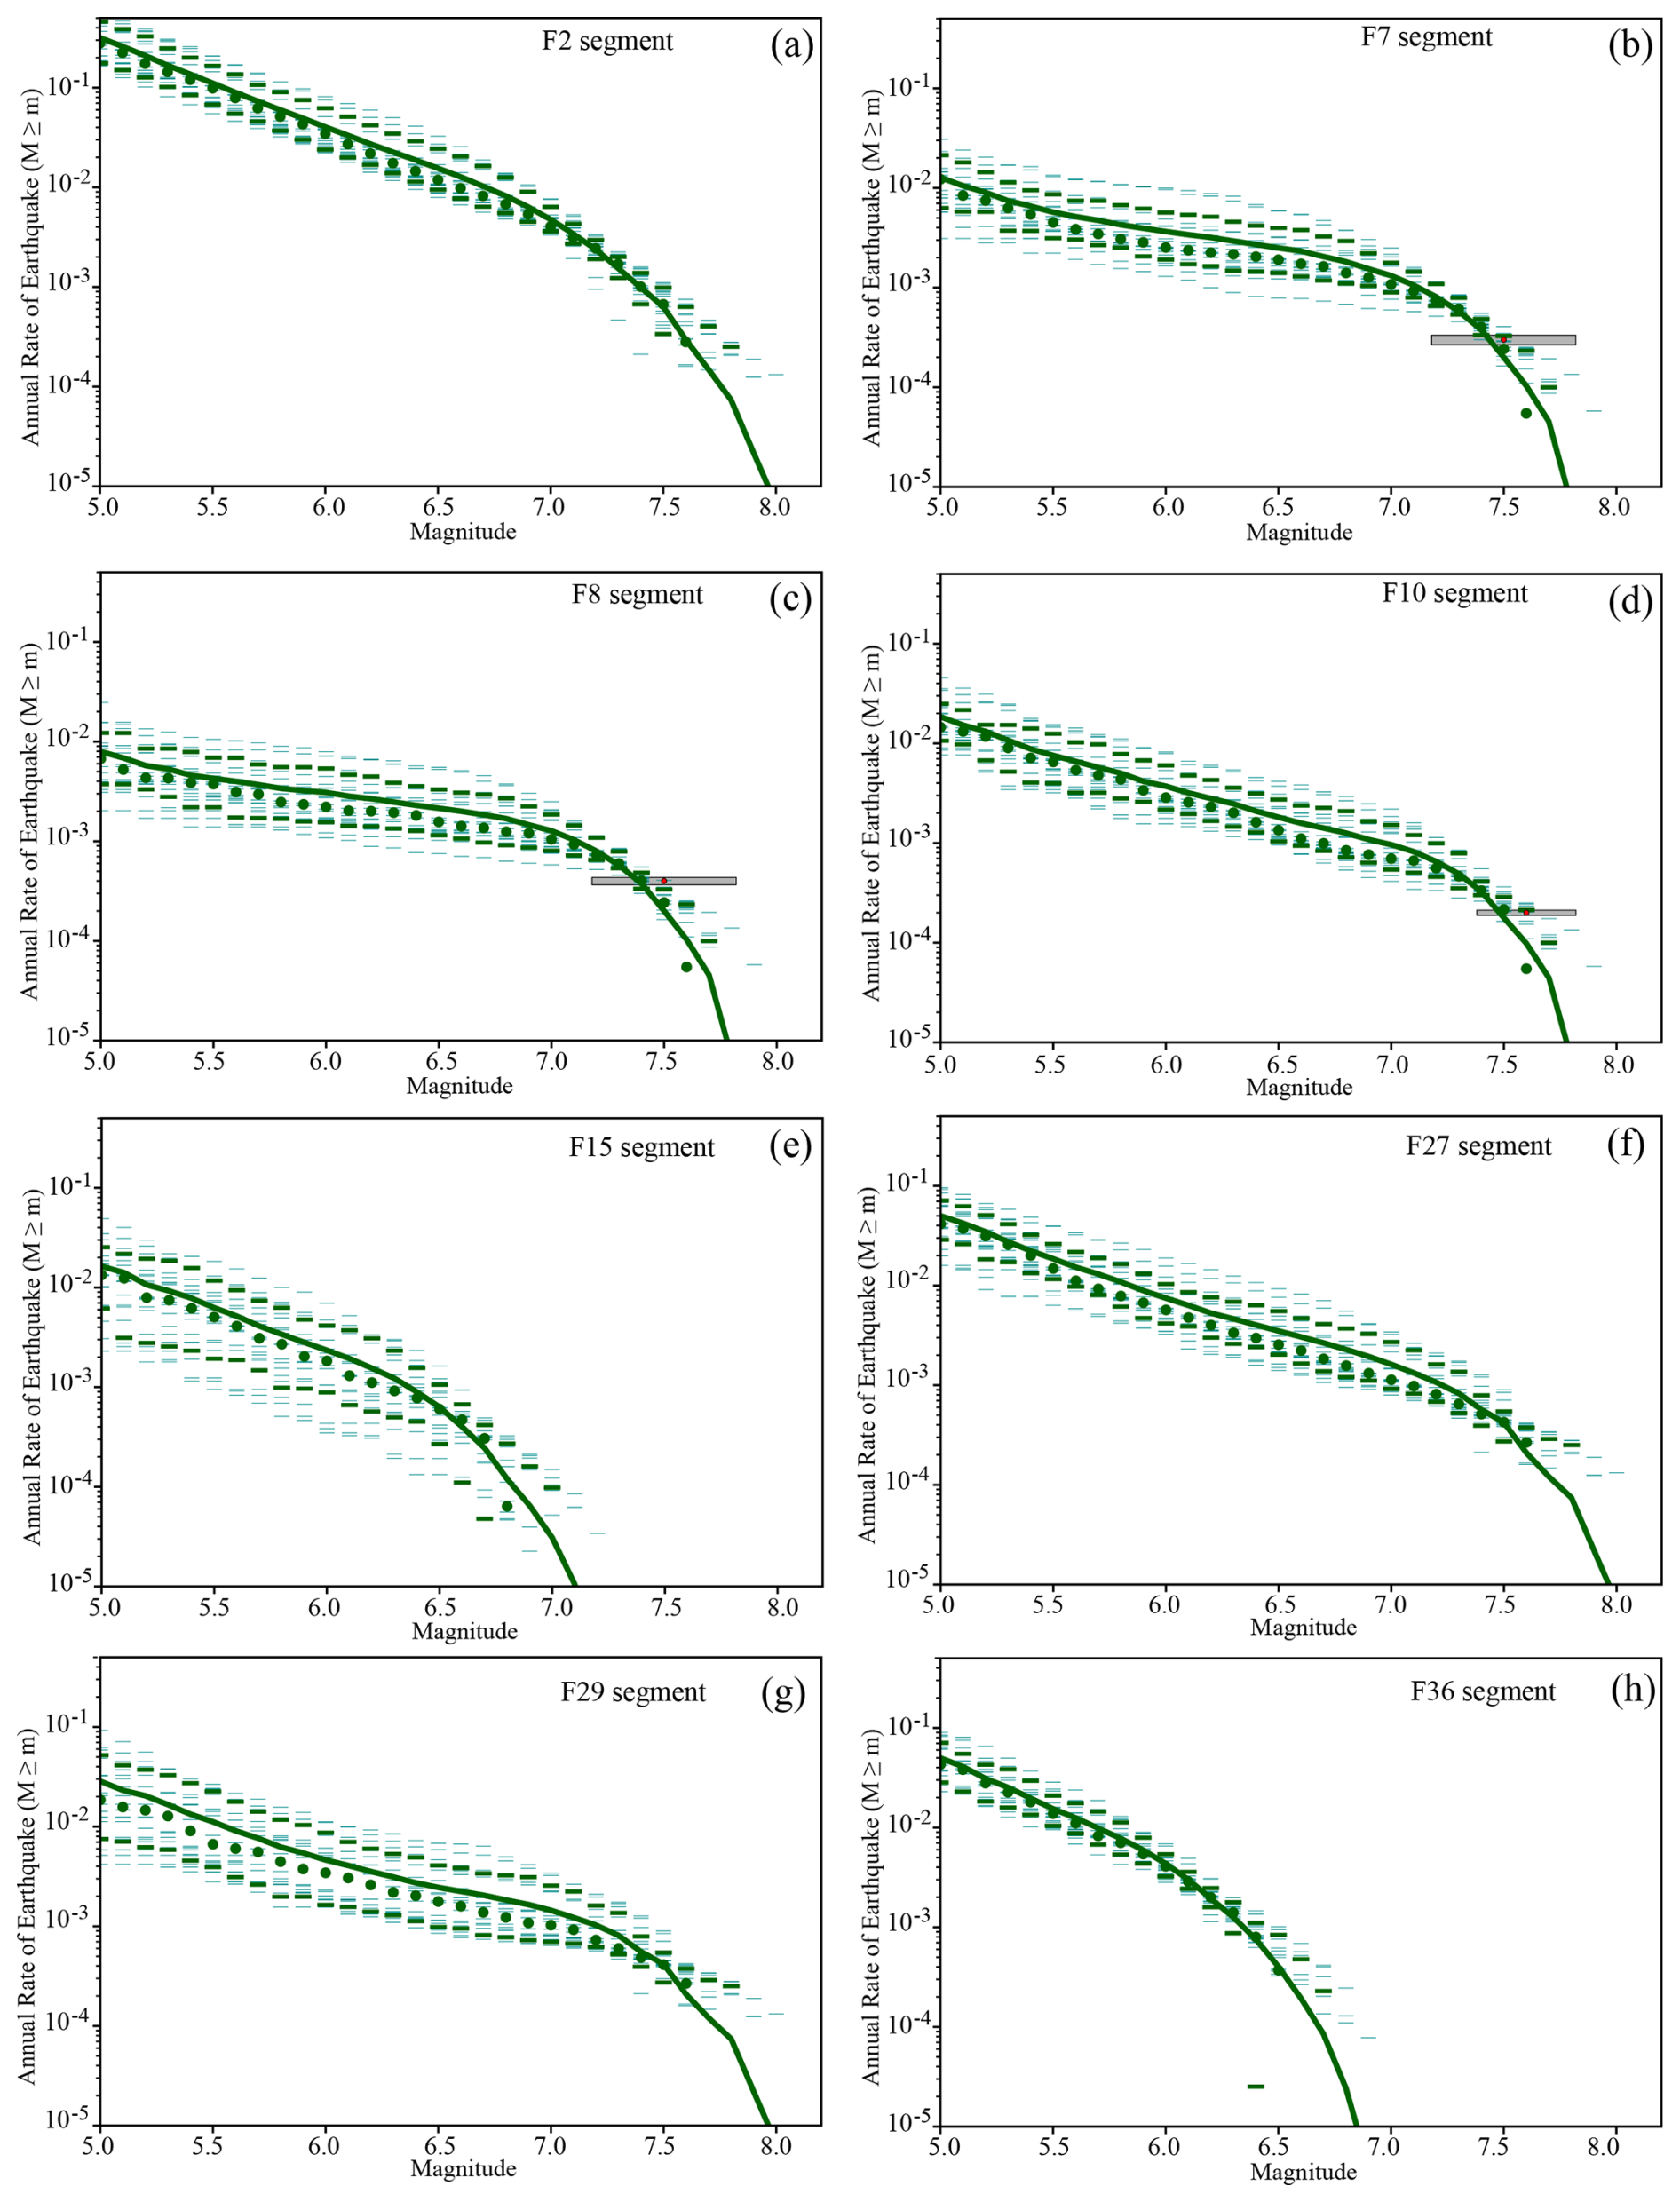
Figure 8Modeled seismicity rates for different magnitudes on the fault segments. The solid line is the mean MFD, and small patches represent the uncertainty (16–84 percentiles). The dotted line is the rate from the catalog with uncertainties. The red circle is the occurrence rate of the repeated large historical earthquake rate, and the gray box is the associated uncertainty.
3.6 Landslide probabilities
3.6.1 PGA site amplification
Utilizing the modeled PGA values for rock site conditions presented in Fig. 7a as a foundation, we enhanced our analysis by incorporating the site amplification effects derived from Chen et al.'s (2021) comprehensive site condition map. Their research, leveraging geological unit data, culminated in a detailed site condition map covering the Chinese mainland. Leveraging this invaluable resource, we integrated their site condition map along with the amplification factors for each geological type compared to type II (referenced in Table 1) to refine the PGA value distribution map (Fig. 9a). Our methodology involved multiplying the PGA values for specific site conditions by the ratio of type II PGA values to those of the specific type. This approach effectively amplified PGA values across different site conditions, enhancing the granularity of our analysis. Figure 9a illustrates the resultant PGA distribution map, now incorporating site amplifications specifically tailored for the NWYR region. Notably, our findings reveal minimal alterations in the PGA distribution, particularly near fault lines, where PGA values remain consistent or exceed 0.4 g (as detailed in Table 1).
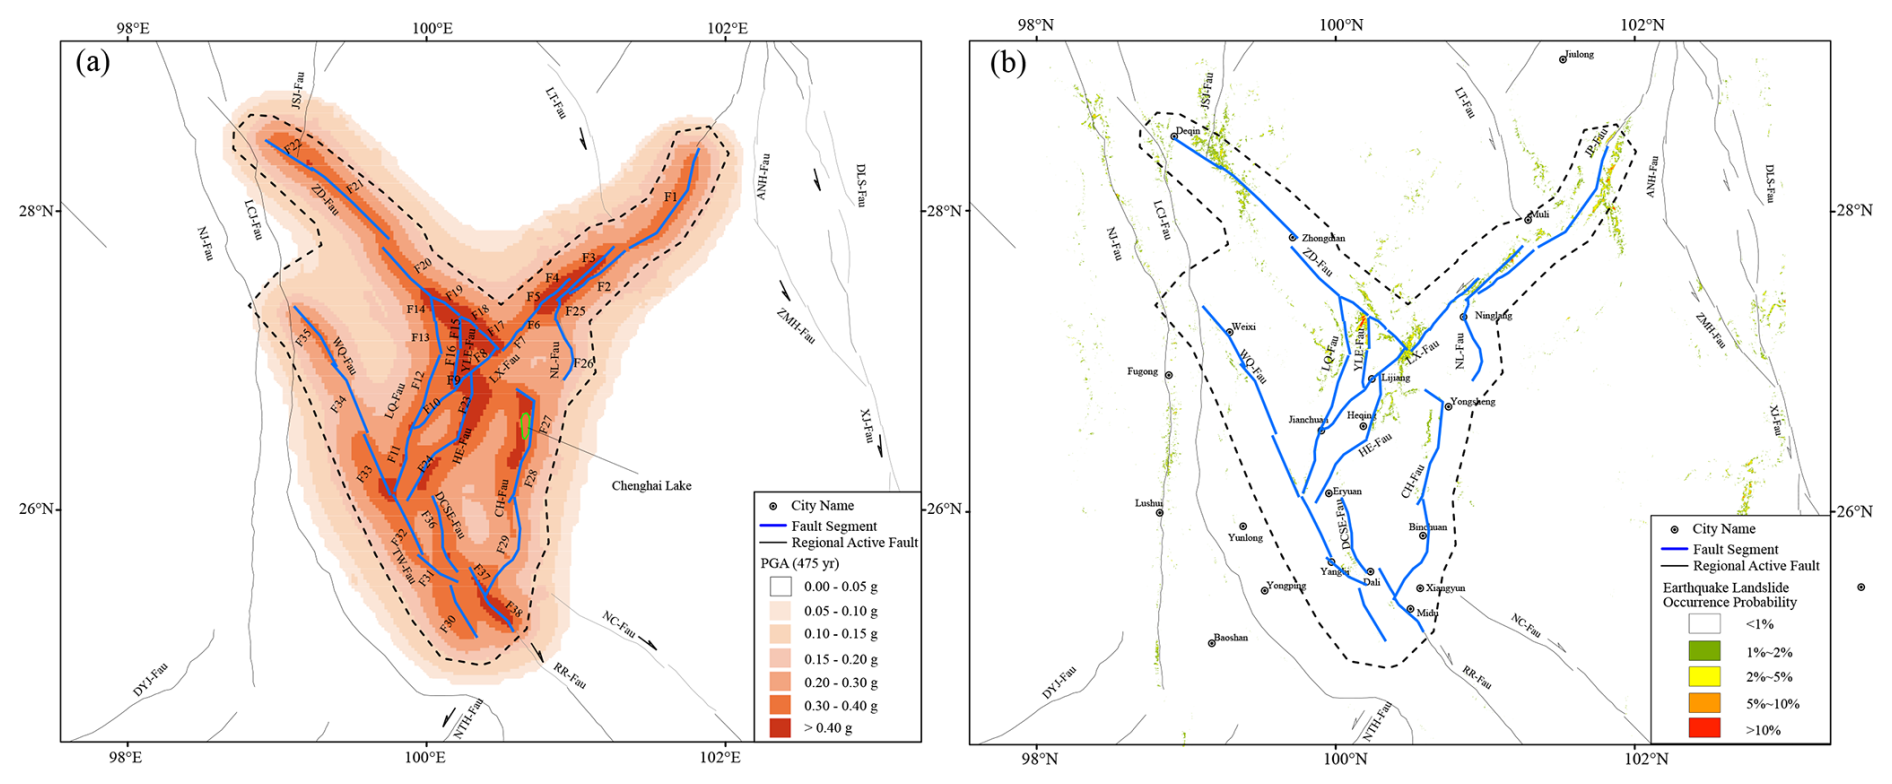
Figure 9(a) PGA distribution map considering different site amplifications. (b) Probabilities of landslide occurrence impacted by the PGA values.
3.6.2 Landslide probabilities derived from modeled PGA values
Using simulated ground motion data from potential earthquake scenarios, we conducted a thorough assessment of landslide susceptibility in the affected regions. Our analysis employed a machine learning framework, following the methodology outlined by Xu et al. (2019), to develop a predictive model for earthquake-induced landslides. This model was trained utilizing data from nine earthquakes, ranging from the 1999 Mw 7.7 Chichi earthquake to the 2017 Mw 6.5 Jiuzhaigou earthquake, both of which occurred within or near China. The training dataset comprised samples of earthquake-induced landslides along with 13 relevant factors. These factors included various parameters such as elevation, slope angle, slope aspect, land cover, proximity to faults, geological characteristics, average annual rainfall and PGA.
Leveraging this comprehensive dataset, we developed a robust predictive model capable of assessing landslide probabilities. We used a logistic regression model, well-regarded for its robust performance in machine learning. Unlike previous models (e.g., Nowicki et al., 2014; Wang and Rathje, 2015; Parker et al., 2017) for calculating earthquake-triggered landslide hazards, our model directly assessed the absolute probability of landslide occurrence. This probability is represented as the percentage of the landslide area within a given region relative to the total area of that region (Shao et al., 2020). As a result, our hazard estimates have a true probabilistic meaning, reflecting the actual probability of landslide occurrence rather than merely serving as a formal expression of probability. We then calculated the probabilistic seismic susceptibility for a specific point in time within the study area, producing a probabilistic PGA distribution map. By using this probabilistic PGA map as input for our model, we can estimate the corresponding probability of earthquake-triggered landslide occurrence. We employed these steps as the basis of our approach to calculating the probability of such landslides.
Figure 9b illustrates the resultant landslide probability map for the NWYR region. Notably, areas with high PGA distribution closely correspond to regions with elevated landslide probabilities. For instance, notable areas include the northern end of the Zhongdian fault, the Jinpingshan fault, the Yulong East fault, the northern end of the Heqing–Eryuan fault, the northern part of the Chenghai fault and the eastern section of the Lijiang–Xiaojinhe fault (the F2–F4 segments). Of particular significance are regions surrounding the Yulong East fault and the convergence zone of the Lijiang–Xiaojinhe fault and the Zhongdian fault. These areas exhibit pronounced differences in elevation, ample rainfall and elevated PGA values, making them particularly susceptible to landslide occurrences.
By integrating multiple geospatial factors and leveraging advanced machine learning techniques, our analysis provides valuable insights into landslide susceptibility in earthquake-prone regions, aiding in effective risk management and mitigation strategies.
In seismic hazard analysis, understanding fault behaviors, such as slip rates and geometries, is crucial for accurately modeling future seismic activity rates. Concurrently, historical earthquake occurrence rates provide a foundational basis for estimating these future rates. Notably, attention must also be given to earthquakes involving multi-segment ruptures which may not be fully documented in historical records. In this article, we introduce a new seismic hazard model for the NWYR, where the Tibetan Plateau boundary intersects with local low-crustal flow.
4.1 Model limitations and mitigation measures
Our seismic hazard modeling for the NWYR represents our current understanding of average earthquake hazards in the region based on available data. The results are affected by various epistemic and aleatory uncertainties inherent in seismic hazard modeling processes, including the MFD, fault geometry, fault type, slip rate and variability in GMPEs. Addressing the impact of these uncertainties is crucial for ensuring accurate seismic hazard assessments.
The MFD relationship, calculated from historical earthquakes, is essential for determining seismicity rate ratios across different magnitude bins. Variations in the MFD directly influence the distribution of the modeled seismicity rates. In this study, we chose the G-R relationship over the Y-C relationship due to the regional fragmented tectonic environment. The calculated b value of 0.96 aligns closely with the expected value of 1 found in seismically active regions (Pacheco et al., 1992).
To estimate earthquake magnitudes on fault segments, we employed rupture scaling relationships based on historical rupture parameters of earthquakes in the Chinese mainland, as proposed by Cheng et al. (2020), ensuring consistency with unique tectonic characteristics. Achieving more precise MFDs and rupture scaling laws necessitates further refinement in methodology and the use of reliable catalogs specific to the study area. Achieving more accurate MFDs and rupture scaling laws will require further methodological refinement and the use of reliable, region-specific earthquake catalogs.
For fault geometry, type and slip rates, we relied exclusively on recent field investigation data. In compiling fault rupture models for the NWYR, we analyzed these geological data under a unified tectonic stress field, ensuring coordinated fault system movements. The variability in GMPEs is complex, influenced by factors such as earthquake rupture characteristics, seismic wave propagation and site conditions. Consequently, we incorporated Quaternary sediment site amplification effects on PGA values. Addressing basin effects on ground motion requires dynamic simulations to achieve more precise results.
4.2 Multi-segment rupturing hazards in the NWYR
The complex fault system results in earthquakes occurring on almost all the faults with various rupture behaviors in the NWYR, while the catalog of historical and paleo-earthquake data only recorded a small portion of these rupturing events. The NWYR serves as the boundary region between China and Myanmar. This area is predominantly inhabited by ethnic minorities in China, and there is limited written documentation of its history, particularly regarding earthquake disasters.
Nevertheless, some significant earthquakes have been documented, particularly those that impacted major cities like Dali; e.g., the 1515 M 7.8 Yongsheng earthquake ruptured two linked segments of the Chenghai fault (Institute of Geology-State Seismological Bureau and Yunnan Seismological Bureau, 1990). The historical earthquake catalog used in our seismic hazard modeling often fails to include all possible rupture scenarios. To address this, we explore reasonable models for potential rupture combinations and calculate their seismicity rates.
These rupture combinations might be constrained by various factors, such as the geometry of fault segments, the width of the step-over between each pair of segments and the maturity of the fault steps (Cunningham and Mann, 2007; Biasi and Wesnousky, 2017). For strike-slip faults, a step-over width of 5 km is often used to assess the plausibility of the rupture combinations (e.g., Biasi and Wesnousky, 2017). However, in the NWYR, where faults are situated within a conduit of ductile low-crust flow, all step-overs are less than 5 km wide, except for the approximately 7 km step-over between the F20 and F21 segments. Hence, we advocate that the intersection relationship between faults is the primary determinant of whether multi-segment rupture events occur among fault segments in this region.
4.3 Implication of the small block rotation in the NWYR
The Holocene strike-slip motion of the Lijiang–Xiaojinhe fault plays a dominant role in this region, intersecting both the Heqing–Eryuan fault and the Yulong East fault. It has been confirmed that in Model 1 the F4–F10 segments of the Lijiang–Xiaojinhe fault are capable of rupturing. Additionally, the Lijiang–Xiaojinhe fault separates the Chenghai fault from the Zhongdian fault, challenging the view of Wang et al. (1998) that the Dali fault – including the Longpan–Qiaohou fault and the Chenghai fault – is the primary fault in this region. The Longpan–Qiaohou fault obstructs the westward continuation of the Lijiang–Xiaojinhe fault, and simultaneously, the F11 segment also resists rupturing in conjunction with the Lijiang–Xiaojinhe fault (Model 4 in Fig. 4). In contrast, the Weixi–Qiaohou fault (WQ-F) and the Tongdian–Weishan fault (TW-F) belong to distinct small blocks and therefore cannot rupture simultaneously, as depicted in Fig. 10a. This indicates that the northern end of the Red River fault is intercepted by the Longpan–Qiaohou fault. In our model, the Zhongdian fault (ZD-F) is separated for rupture (Model 1 in Fig. 4), particularly for the F17–F18 segment combination and the F19–F20 segment combination. We propose that the normal and strike slip of the Yulong East fault pose a greater destructive potential to the Zhongdian fault compared to the strike slip of the Longpan–Qiaohou fault.

Figure 10(a) Kinematic model of the faults in the NWYR. (b) Regional GPS motion after removing the whole movement (Cheng et al., 2012).
Hence, our multi-segment rupture configurations portrayed in Model 1 of Fig. 4 align with the rotational patterns noted in the small block delineated in the NWYR by Wang et al. (1998). We illustrate this clockwise rotation of the small blocks in the NWYR in Fig. 10a. This clockwise rotation is further supported by GPS observations to the west of the Xianshuihe fault, the Anninghe fault and the Xiaojiang fault after the removal of the entire movement (Fig. 10b) (Cheng et al., 2012).
In Fig. 10b, the area where the Nujiang fault intersects with the Dayingjiang fault experiences the strongest extensional forces. Rangin et al. (2013) and Lindsey et al. (2023) proposed that the dynamic source of this extensional tectonic environment was the side effect of the gravitational collapse of the Tibetan Plateau with the westward movement of the upper crust being faster than the lower crust (Rangin et al., 2013; Lindsey et al., 2023). This extensional force significantly affects the faults in our model, driving the rotation of small blocks and the normal slip of the regional faults, e.g., the Diancang Shan fault and the Chenghai fault.
4.4 Conclusions
This study presents a comprehensive seismic hazard model for the NWYR, integrating fault slip rates and historical seismicity data to evaluate the risks of multi-segment ruptures and landslide occurrences. By leveraging fault slip rates and fault geometrical distributions in the NWYR, we employed the simulation method within the SHERIFS code to calculate seismicity rates for both single-segment and multi-segment ruptures. This work highlights the complexity of the fault systems within the region's block rotational tectonic environment. Our study provides valuable insights into the seismic hazards present in the NWYR. Through the development of fault segmentation models based on recent geological research and the application of advanced simulation techniques, we have significantly enhanced our understanding of fault activity and seismicity rates across the region. We also identified multi-segment models that best represent the observed data.
Our calculations of PGA with a 10 % probability of exceedance within 50 years offer essential information for assessing seismic risk in the NWYR. The PGA values, associated with obvious latitude difference and abundant precipitation, increase the likelihood of landslides. Furthermore, our investigation into multi-segment rupture combinations has illuminated potential scenarios for seismic events in the region. By integrating these findings, we have generated a more comprehensive assessment of seismic hazards and landslide probabilities. These factors are intertwined with the regional small block rotation induced by the low-crustal flow and gravitational collapse along the southeastern frontier of the Tibetan Plateau.
Future seismic hazard work can be improved by utilizing geophysical data to understand fault structures where strong earthquakes are developing (Xu et al., 2017), applying geodetic data to assess energy accumulation on fault segments (e.g., Yao and Yang, 2023), using microseismicity relocation data to reveal fault asperities (Lay and Nishenko, 2022), and employing dynamic rupture simulations of single and multiple segments to enhance earthquake motion predictions (e.g., Zhang et al., 2017). These studies on fault behaviors, interactions and multi-segment ruptures are vital for enhancing seismic hazard assessments. Staying vigilant and proactive in seismic risk management will better protect communities and infrastructure in the NWYR and beyond.
In this study, we have used the code related to Chartier et al. (2019), which can be downloaded from https://doi.org/10.1785/0220180332.
The focal mechanism data are from the GCMT catalog (http://www.globalcmt.org, last access: May 2024), and the description of the CMT procedure is available at https://doi.org/10.1016/j.pepi.2012.04.002 (Ekström et al., 2012). Table S1 in the Supplement for this paper includes the fault segments, historical and paleo-earthquakes, and their associated slip parameters.
The supplement related to this article is available online at https://doi.org/10.5194/nhess-25-857-2025-supplement.
JC was responsible for methodology, software and writing the original draft. CX worked on the landslide occurrence probabilities calculation. XX and SZ contributed to the design of the fault rupture combination models. PZ contributed to seismic hazard modeling.
The contact author has declared that none of the authors has any competing interests.
Publisher's note: Copernicus Publications remains neutral with regard to jurisdictional claims made in the text, published maps, institutional affiliations, or any other geographical representation in this paper. While Copernicus Publications makes every effort to include appropriate place names, the final responsibility lies with the authors.
We thank Guangwei Zhang from the National Institute of Natural Hazards and Mingming Jiang from the Institute of Geology and Geophysics, Chinese Academy of Sciences, for discussions on the dynamic source of the crustal deformation. We are also grateful to Rui Ding from the National Institute of Natural Hazards and Panxing Yang from the Institute of Earthquake Forecasting, China Earthquake Administration, for their assistance in delineating fault traces and the fault segmentation work. The authors thank the editor Veronica Pazzi and three anonymous referees for constructive comments.
This research has been supported by the National Natural Science Foundation of China (grant nos. U2039201 and 42074064); the Disciplinary Construction of Active Tectonics and Earthquake hazard Chains, CUGB (grant no. 2023010); and the National Institute of Natural Hazards, Ministry of Emergency Management of China (grant no. ZDJ2020-14).
This paper was edited by Veronica Pazzi and reviewed by three anonymous referees.
Abrahamson, N., Silva, W., and Kamai, R.: Summary of the ASK14 Ground Motion Relation for Active Crustal Regions, Earthq. Spectra, 30, 1025–1055, 2014.
Avital, M., Kamai, R., Davis, M., and Dor, O.: The effect of alternative seismotectonic models on PSHA results – a sensitivity study for two sites in Israel, Nat. Hazards Earth Syst. Sci., 18, 499–514, https://doi.org/10.5194/nhess-18-499-2018, 2018.
Bao, X., Sun, X., Xu, M., Eaton, D., Song, X., Wang, L., Ding, Z., Mi, N., Li, H., Yu, D., Huang, Z., and Wang, P.: Two crustal low-velocity channels beneath SE Tibet revealed by joint inversion of Rayleigh wave dispersion and receiver functions, Earth Planet. Sc. Lett., 415, 16–24, 2015.
Biasi, G. and Wesnousky, S.: Bends and ends of surface rupture, B. Seismol. Soc. Am., 107, 2543–2560, 2017.
Boore, D., Stewart, J., Seyhan, E., and Atkinson, G.: NGA-West2 Equations for Predicting PGA, PGV, and 5 % Damped PSA for Shallow Crustal Earthquakes, Earthq. Spectra, 30, 1057–1085, 2014.
Campbell, K. and Bozorgnia, Y.: NGA-West2 ground motion model for the average horizontal components of PGA, PGV, and 5 % damped linear acceleration response spectra, Earthq. Spectra, 30, 1087–1115, 2014.
Campillo, M. and Archuleta, R.: A rupture model for the 28 June 1992 Landers, California, Earthquake, Geophys. Res. Lett., 20, 647–650, 1993.
Cao, Y., Jin, M., Qian, J., Chen, J., and Anyiam, U.: Crustal structure and seismicity characteristics based on dense array monitoring in northwestern Yunnan, China, Phys. Earth Planet. In., 340, 107047, https://doi.org/10.1016/j.pepi.2023.107047, 2023.
Chang, Z., Zhang, Y., Li, J., and Zang, Y.: The Geological and Geomorphic Characteristic of Late Quaternary Activity of the Deqin-Zhongdian-Daju Fault, Journal of Seismological Research, 37, 46–52, 2014 (in Chinese with English abstract).
Chang, Z., Chang, H., Zang, Y., and Dai, B.: Recent active features of Weixi-Qiaohou fault and its relationship with the Honghe fault, Journal of Geomechanics, 22, 517–530, 2016 (in Chinese with English abstract).
Chang, C., Chang, C., Gao, J., and Chan, C.: Quantifying the probability and uncertainty of multiple-structure rupture for Taiwan, Terr. Atmos. Ocean. Sci., 34, 7, https://doi.org/10.1007/s44195-023-00040-8, 2023.
Chartier, T., Scotti, O., Lyon-Caen, H., and Boiselet, A.: Methodology for earthquake rupture rate estimates of fault networks: example for the western Corinth rift, Greece, Nat. Hazards Earth Syst. Sci., 17, 1857–1869, https://doi.org/10.5194/nhess-17-1857-2017, 2017.
Chartier, T., Scotti, O., and Lyon-Caen, H.: SHERIFS: Open-Source code for computing earthquake rates in fault systems and constructing hazard models, Seismol. Res. Lett., 90, 1678–1688, https://doi.org/10.1785/0220180332, 2019.
Chartier, T., Scotti, O., Lyon-Caen, H., Richard-Dinger, K., Dieterich, J. H., and Shaw, B. E.: Modelling earthquake rates and associated uncertainties in the Marmara Region, Turkey, Nat. Hazards Earth Syst. Sci., 21, 2733–2751, https://doi.org/10.5194/nhess-21-2733-2021, 2021.
Chen, G., Magistrale, H., Rong, Y., Cheng, J., Binselam, A., and Xu, X.: Seismic site condition of Mainland China from Geology, Seismol. Res. Lett., 92, 998–1010, 2021.
Cheng, J., Xu, X., Gan, W., Ma, W., Chen, W., and Zhang, Y.: Block model and dynamic implication from the earthquake activities and crustal motion in the southeastern margin of Tibetan plateau, Chinese J. Geophys., 55, 1198–1212, 2012 (in Chinese with English abstract).
Cheng, J., Rong, Y., Magistrale, H., Chen, G., and Xu, X.: An Mw-based historical earthquake catalog for mainland China, B. Seismol. Soc. Am., 107, 2490–2500, 2017.
Cheng, J., Rong, Y., Magistrale, H., Chen, G., and Xu, X.: Earthquake rupture scaling relations for mainland China, Seismol. Res. Lett., 91, 248–261, 2020.
Cheng, J., Chartier, T., and Xu, X.: Multisegment Rupture Hazard Modeling along the Xianshuihe Fault Zone, Southeastern Tibetan Plateau, Seismol. Res. Lett., 92, 951–964, https://doi.org/10.1785/0220200117, 2021.
Chiou, B. and Youngs, R.: Update of the Chiou and Youngs NGA Model for the Average Horizontal Component of Peak Ground Motion and Response Spectra, Earthq. Spectra, 30, 1117–1153, 2014.
Cunningham, W. and Mann, P.: Tectonics of Strike-Slip Restraining and Releasing Bends, Geological Society, London, Special Publications, 290, 1–12, https://doi.org/10.1144/SP290.1, 2007.
Dai, C., Gan, W., Li, Z., Liang, S., Xiao, G., Zhang, K., and Zhang, L.: Characteristics of Regional GPS Crustal Deformation before the 2021 Yunnan Yangbi Ms 6.4 Earthquake and Its Implications for Determining Potential Areas of Future Strong Earthquakes, Remote Sens., 15, 3195, https://doi.org/10.3390/rs15123195, 2023.
Dangkua, D., Rong, Y., and Magistrale, H.: Evaluation of NGA-West2 and Chinese Ground-Motion Prediction Equations for Developing Seismic Hazard Maps of Mainland China, B. Seismol. Soc. Am., 108, 2422–2443, 2018.
Deng, Q., Zhang, P., Ran, Y., Yang, X., Min, W., and Chu, Q.: Basic characteristics of active tectonics of China, Sci. China Earth Sci., 46, 356–372, 2003.
Ding, R., Ren, J., Zhang, S., Lu, Y., and Liu, H.: Late Quaternary Paleoearthquakes on the Middle segment of the Lijiang-Xiaojinhe fault, Southeastern Tibet, Seismology and Geology, 40, 622–640, 2018 (in Chinese with English abstract).
Dutykh, D., Mitsotakis, D., Gardeil, X., and Dias, F.: On the use of the finite fault solution for tsunami generation problems, Theor. Comp. Fluid Dyn., 27, 177–199, 2013.
Ekström, G., Nettles, M., and Dziewonski, A. M.: The global CMT project 2004-2010: Centroid-moment tensors for 13,017 earthquakes, Phys. Earth Planet. In., 200–201, 1–9, https://doi.org/10.1016/j.pepi.2012.04.002, 2012.
Field, E., Arrowsmith, R., Biasi, G., Bird, P., Dawson, T., Felzer, K., Jackson, D., Johnson, K., Jordan, T., Madden, C., Michael, A., Milner, K., Page, M., Parsons, T., Powers, P., Shaw, B., Thatcher, W., Weldon, R., and Zeng, Y.: Uniform California Earthquake Rupture Forecast, version 3 (UCERF3)–The time-independent model, B. Seismol. Soc. Am., 104, 1122–1180, 2014.
Gan, W., Zhang, P., Shen, Z., Niu, Z., Wang, M., Wan, Y., Zhou, D., and Cheng, J.: Present-day crustal motion within the Tibetan Plateau inferred from GPS measurements, J. Geophys. Res.-Sol. Ea., 112, B08416, https://doi.org/10.1029/2005JB004120, 2007.
Gao, M., Li, X., Xu, X., Wei, K., Yu, Y., Zhou, B., Zhao, F., Pan, H., Lv, Y., and Zhou, Q.: GB18306-2015: Introduction to the Seismic Hazard Map of China, Standards Press of China, Beijing, 1–133, ISBN: 9787506678889, 2015 (in Chinese).
Gao, Y., Ding, R., Zhang, S., and Ren, J.: Slip rate of Lijiang-Xiaojinhe fault in the Holocene, Technology for Earthquake Disaster Prevention, 14, 617–627, 2019 (in Chinese with English abstract).
Guo, S., Zhang, J., Li, X., Xiang, H., Chen, T., and Zhang, G.: Fault displacement and recurrence intervals of earthquakes at the northern segment of the Honghe fault zone, Yunnan Province, Seismology and Geology, 6, 1–12, 1984 (in Chinese with English abstract).
Gutenberg, B. and Richter, C.: Frequency of earthquakes in California, B. Seismol. Soc. Am., 34, 185–188, 1944.
Han, Z., Guo, S., Xiang, H., Zhang, J., and Ran, Y.: Seismotectonic Environment of occurring the February 3, 1996 Lijiang M = 7.0 earthquake, Yunnan Province, Acta Seismologica Sinica, 26, 410–418, 2004 (in Chinese with English abstract).
Han, Z., Xiang, H., and Guo, S.: Sinistral shear and extension of the northern section of Lijiang Basin in northwest Yunnan in Quaternary, Chinese Sci. Bull., 50, 452–459, 2005.
Harris, R. and Day, S.: Dynamic 3D simulations of earthquakes on En Echelon Faults, Geophys. Res. Lett., 26, 2089–2092, 1999.
Huang, X., Wu, Z., Huang, X., and Luo, R.: Tectonic Geomorphology constrains on Quaternary Activity and Segmentation along Chenghai-Binchuan Fault zone in Northwest Yunnan, China, Earth Sci., 43, 4651–4670, 2018 (in Chinese with English abstract).
Huang, X., Wu, Z., Liu, F., Tian, T., Huang, X., and Zhang, Y.: Tectonic interpretation of the main paleoseismic landslides and their distribution characteristics in the Chenghai fault zone, Northwest Yunnan, Earth Science Frontiers, 28, 125–139, 2021 (in Chinese with English abstract).
Huang, P., Gao, Y., and Xue, B.: Advances in the deep tectonics and seismic anisotropy of the Lijiang-Xiaojinhe fault zone in the Sichuan-Yunnan Block, Southwestern China, Earthquake Research Advances, 2, 100116, https://doi.org/10.1016/j.eqrea.2022.100116, 2022.
Institute of Geology-State Seismological Bureau and Yunnan Seismological Bureau: Active faults in Northwestern Yunnan Region, Seismological Press, Beijing, China, 1–304, ISBN: 7502804323, 1990 (in Chinese with English abstract).
Lay, T. and Nishenko, S.: Updated concepts of seismic gaps and asperities to assess great earthquake hazard along South America, P. Natl. Acad. Sci. USA, 119, e2216843119, https://doi.org/10.1073/pnas.2216843119, 2022.
Lee, Y., Hui, Z., Daneshvaran, S., Sedaghati, F., and Graf, W.: Impacts on catastrophe risk assessments from multi-segment and multi-fault ruptures in the UCERF3 model, Earthq. Spectra, 38, 128–151, 2022.
Leonard, M.: Earthquake Fault Scaling: Self-Consistent Relating of Rupture Length, Width, Average Displacement, and Moment Release, B. Seismol. Soc. Am., 100, 1971–1988, 2010.
Lindsey, E., Wang, Y., Aung, L., Chong, J., Qiu, Q., Mallick, R., Feng, L., Aung, P., Tin, T., Min, S., Bradley, K., Than, O., Oo, K., Thant, M., Masson, F., Bürgmann, R., and Hill, E.: Active subduction and strain partitioning in western Myanmar revealed by a dense survey GNSS network, Earth Planet. Sc. Lett., 622, 118384, https://doi.org/10.1016/j.epsl.2023.118384, 2023.
Liu, C., Lay, T., Wang, R., Taymaz, T., Xie, Z., Xiong, X., Irmak, T., Kahraman, M., and Erman, C.: Complex multi-fault rupture and triggering during the 2023 earthquake doublet in southeastern Türkiye, Nat. Commun., 14, 5564, https://doi.org/10.1038/s41467-023-41404-5, 2023.
Lozos, J., Oglesby, D., Brune, J., and Olsen, K.: Small intermediate fault segments can either aid or hinder rupture propagation at stepovers, Geophys. Res. Lett., 39, L18305, https://doi.org/10.1029/2012GL053005, 2012.
Manighetti, I., Campillo, M., Bouley, S., and Cotton, F.: Earthquake scaling, fault segmentation, and structural maturity, Earth Planet. Sc. Lett., 253, 429–438, 2007.
Manighetti, I., Mercier, A., and De Barros, L.: Fault trace corrugation and segmentation as a measure of fault structural maturity, Geophys. Res. Lett., 48, e2021GL095372, https://doi.org/10.1029/2021GL095372, 2021.
Mignan, A., Danciu, L., and Giardini, D.: Reassessment of the Maximum Fault Rupture Length of Strike-Slip Earthquakes and Inference on Mmax in the Anatolian Peninsula, Turkey, Seismol. Res. Lett., 86, 890–900, 2015.
Nowicki, M., Wald, D., Hamburger, M., Hearne, M., and Thompson, E.: Development of a globally applicable model for near real-time prediction of seismically induced landslides, Eng. Geol., 173, 54–65, 2014.
Pacheco, J., Scholz, C., and Sykes, L.: Changes in frequency-size relationship from small to large earthquakes, Nature, 355, 71–73, 1992.
Pagani, M., Monelli, D., Weatherill, G., Danciu, L., Crowley, H., Silva, V., Henshaw, P., Butler, L., Nastasi, M., Panzeri, L., Simionato, M., and Vigano, D.: OpenQuake Engine: An Open Hazard (and Risk) Software for the Global Earthquake Model, Seismol. Res. Lett., 85, 692–702, 2014.
Page, M., Field, E., Milner, K., and Powers, P.: The UCERF3 Grand Inversion: Solving for the Long-term rate of ruptures in a fault system, B. Seismol. Soc. Am., 104, 1181–1204, 2014.
Parker, R. N., Rosser, N. J., and Hales, T. C.: Spatial prediction of earthquake-induced landslide probability, Nat. Hazards Earth Syst. Sci. Discuss. [preprint], https://doi.org/10.5194/nhess-2017-193, in review, 2017.
Petersen, G. M., Büyükakpinar, P., Sanhueza, P., Metz, M., Cesca, S., Akbayram, K., Saul, J., and Dahm, T.: The 2023 Southeast Türkiye Seismic Sequence: Rupture of a Complex Fault Network, The Seismic Record, 3, 134–143, 2023.
Rangin, C., Maurin, T., and Masson, F.: Combined effects of Eurasia/Sunda oblique convergence and East-Tibetan crustal flow on the active tectonics of Burma, J. Asian Earth Sci., 76, 185–194, 2013.
Rashidi, A., Shomali, Z. H., Dutykh, D., and Keshavarz Farajkhah, N.: Tsunami hazard assessment in the Makran subduction zone, Nat. Hazards, 100, 861–875, https://doi.org/10.1007/s11069-019-03848-1, 2020.
Ren, J., Zhang, S., Hou, Z., and Liu, X.: Study of Late Quaternary slip rate in the Mid-Segment of the Tongdian-Weishan fault, Seismology and Geology, 29, 756–764, 2007 (in Chinese with English abstract).
Rong, Y., Xu, X., Cheng, J., Chen, G., Magistrale, H., and Shen, Z.: A probabilistic seismic hazard model for mainland China, Earthq. Spectra, 36, 181–209, https://doi.org/10.1177/8755293020910754, 2020.
Schwartz, D. and Coppersmith, K.: Fault behavior and characteristic earthquakes: Examples from the Wasatch and San Andreas Fault Zones, J. Geophys. Res., 89, 5681–5698, 1984.
Shao, X., Ma, S., Xu, C., and Zhou, Q.: Effects of sampling intensity and non-slide/slide sample ratio on the occurrence probability of coseismic landslides, Geomorphology, 363, 107222, https://doi.org/10.1016/j.geomorph.2020.107222, 2020.
Shen, J., Wang, Y., and Ren, J.: Quaternary dextral strike slip motion of the Deqin-Daju-Daju fault zone, Yunnan, China, in: Study on the recent deformation and dynamic of the Lithosphere of Qinghai-Xizang Plateau, edited by: Ma, Z., Wang, Y., and Zhang, Y., Seismological Press, Beijing, China, 106–122, ISBN: 7-5028-1938-X, 2001 (in Chinese with English abstract).
Shen, Z., Lu, J., Wang, M., and Burgmann, R.: Contemporary crustal deformation around the southeast borderland of the Tibetan Plateau, J. Geophys. Res., 110, B11409, https://doi.org/10.1029/2004JB003421, 2005.
Shi, X., Sieh, K., Weldon, R., Zhu, C., Han, Y., Yang, J., and Robinson, S.: Slip rate and rare large prehistoric earthquakes of the Red River fault, southwestern China, Geochem. Geophy. Geosy., 19, 2014–2031, https://doi.org/10.1029/2017GC007420, 2018.
Stirling, M., Goded, T., Berryman, K., and Litchfield, N.: Selection of Earthquake Scaling Relationships for Seismic-Hazard Analysis, B. Seismol. Soc. Am., 103, 2993–3011, 2013.
Sun, C., Li, D., Shen, X., Kang, Y., Liu, R., and Zhang, Y.: Holocene activity evidence on the southeast boundary fault of Heqing basin, middle segment of Heqing-Eryuan fault zone, West Yunnan Province, China, J. Mt. Sci., 14, 1445–1453, 2017.
Tang, F., Ma, H., and Song, J.: Study on the Late Quaternary activity of Chenghai fault zone, in: Proceeding of the 16th World conference on earthquake engineering, Santiago, Chile, 9–13 January 2017, Paper No. 1378, 1–9, https://www.wcee.nicee.org/wcee/article/16WCEE/WCEE2017-1378.pdf (last access: 19 February 2025), 2017.
Tang, Y., Hu, C., Tian, Q., Wang, L., Yang, P., and Xiong, R.: A Preliminary Study of Paleo-earthquakes in the Jianchuan Section of Longpan-Qiaohou Fault Zone, Yunnan Province, Earthquake, 34, 117–124, 2014 (in Chinese with English abstract).
Wang, E., Burchfiel, C., Royden, L., Chen, L., Chen, L., Li, W., and Chen, Z.: Late Cenozoic Xianshuihe-Xiaojiang, Red River, and Dali Fault Systems of Southwestern Sichuan and Central Yunnan, China, Geological Society of America Special Paper, 327, 1–108, ISBN: 9780813723273, 1998.
Wang, M. and Shen, Z.: Present-Day Crustal Deformation of Continental China Derived from GPS and Its Tectonic Implications, J. Geophys. Res.-Sol. Ea., 125, e2019JB018774, https://doi.org/10.1029/2019JB018774, 2020.
Wang, Y. and Rathje, E.: Probabilistic seismic landslide hazard maps including epistemic uncertainty, Eng. Geol., 196, 313–324, 2015.
Wells, D. and Coppersmith, K.: New empirical relationships among magnitude, rupture length, rupture width, rupture area, and surface displacement, B. Seismol. Soc. Am., 84, 974–1002, 1994.
Wu, F., Jiang, L., Zhang, G., and Song, Z.: The fault activity and seismic hazard assessment of central north segmentof the Deqin-Zhongdian fault, southeastern Qinghai-Tibet plateau, Acta Geol. Sin., 93, 2657–2665, 2019 (in Chinese with English abstract).
Wu, W., Long, F., Yang, J., Liang, M., Su, J., Wei, Y., Wu, P., and Lu, T.: Relocation, focal mechanisms and seismogenic structure of the 2013 Shangrila-Dêrong earthquake swarm sequence in the Yunnan-Sichuan border region, Chinese J. Geophys., 58, 1584–1596, 2015 (in Chinese with English abstract).
Wu, X., Xu, X., Yu, G., Ren, J., Yang, X., Chen, G., Xu, C., Du, K., Huang, X., Yang, H., Li, K., and Hao, H.: The China Active Faults Database (CAFD) and its web system, Earth Syst. Sci. Data, 16, 3391–3417, https://doi.org/10.5194/essd-16-3391-2024, 2024.
Xu, C., Xu, X., Zhou, B., and Shen, L.: Probability of coseismic landslides: A new generation of earthquake-triggered landslide hazard model, Journal of Engineering Geology, 27, 1122–1130, 2019 (in Chinese with English abstract).
Xu, L., Mohanna, S., Meng, L., Ji, C., Ampuero, J., Zhang, Y., Hasnain, M., Chu, R., and Liang, C.: The overall-subshear and multi-segment rupture of the 2023 Mw 7.8 Kahramanmaras, Turkey earthquake in millennia supercycle, Commun. Earth Environ., 4, 379, https://doi.org/10.1038/s43247-023-01030-x, 2023.
Xu, W., Feng, G., Meng, L., Zhang, A., Ampuero, J., and Burgmann, R.: Transpressional rupture cascade of the 2016 Mw 7.8 Kaikoura earthquake, New Zealand, J. Geophys. Res.- Sol. Ea., 123, 2396–2409, 2018.
Xu, X., Wen, X., Zheng, R., Ma, W., Song, F., and Yu, G.: Pattern of latest tectonic motion and its dynamics for active blocks in Sichuan–Yunnan region, China, Sci. China Earth Sci., 46, 210–226, 2003.
Xu, X., Wen, X., Yu, G., Chen, G., Klinger, Y., Hubbard, Y., and Shaw, J.: Coseismic reverse- and oblique-slip surface faulting generated by the 2008 Mw 7.9 Wenchuan earthquake, China, Geology, 37, 515–518, 2009.
Xu, X., Wu, X., Yu, G., Tan, X., and Li, K.: Seismo-geological signatures for identifying M ≥ 7.0 earthquake risk areas and their premilimary application in mainland China, Seismology and Geology, 39, 219–275, 2017 (in Chinese with English abstract).
Yao, S. and Yang, H.: Towards ground motion prediction for potential large earthquakes from interseismic locking models, Earth Planet. Sc. Lett., 601, 117905, https://doi.org/10.1016/j.epsl.2022.117905, 2023.
Youngs, R. and Coppersmith, K.: Implications of fault slip rates and earthquake recurrence models to Probabilistic Seismic Hazard estimates, B. Seismol. Soc. Am., 75, 939–964, 1985.
Yu, L., Dong, Y., Zhou, W., Zhang, D., Wang, D., Yu, H., Ren, Y., and Li, J.: Evaluation of the rock uplift pattern in the Central Yunnan Subblock, SE Tibetan Plateau: Based on the Bedrock Channel Profile, Front. Earth Sci., 10, 821367, https://doi.org/10.3389/feart.2022.821367, 2022.
Yu, W., Zhang, J., Zhou, G., Wang, J., and Zeng, X.: Surface Rupture of the 2001 Yongsheng M 6 Earthquake and Chenghai Fault, Journal of Seismological Research, 28, 125–128, 2005 (in Chinese with English abstract).
Yu, Y., Li, S., and Xiao, L.: Development of ground motion attenuation relations for the new seismic hazard map of China, Technology for Earthquake Disaster Prevention, 8, 24–33, 2013 (in Chinese with English abstract).
Zhang, J., Chen, X., Cai, J., Liu, Z., Dong, Z., Guo, C., Han, B., Jiang, F., and Cui, T.: Magnetotelluric evidence for the crustal deformation beneath the region around the Lijiang-Xiaojinhe fault, SE margin of the Tibetan Plateau, J. Asian Earth Sci., 235, 105308, https://doi.org/10.1016/j.jseaes.2022.105308, 2022.
Zhang, P., Shen, Z., Wang, M., Gan, W., Burgmann, R., Molnar, P., Wang, Q., Niu, Z., Sun, J., Wu, J., Sun, H., and You, X.: Continuous deformation of the Tibetan Plateau from global positioning system data, Geology, 32, 809–812, 2004.
Zhang, Z., Zhang, W., Chen, X., Li, P., and Fu, C.: Rupture dynamics and ground motion from potential earthquakes around Taiyuan, China, B. Seismol. Soc. Am., 107, 1201–1212, 2017.
Zhang, Z., Yao, H., and Yang, Y.: Shear wave velocity structure of the crust and upper mantle in Southeastern Tibet and its geodynamic implications, Sci. China Earth Sci., 63, 1278–1293, 2020.
Zhao, L., Xie, X., He, J., Tian, X., and Yao, Z.: Crustal flow pattern beneath the Tibetan Plateau constrained by regional Lg-wave Q tomography, Earth Planet. Sc. Lett., 383, 113–122, 2013.
Zhou, Q., Guo, S., and Xiang, H.: Principle and method of delineation of potential seismic sources in northeastern Yunnan Province, Seismology and Geology, 26, 761–771, 2004 (in Chinese with English abstract).
Zhou, R., Ye, Y., Li, Y., Li, X., He, Y., and Ge, T.: Late Quaternary activity of the Shawan segment of the Litang faults, Quaternary Sciences, 27, 45–53, 2007 (in Chinese with English abstract).
Zhou, Y., Ren, C., Ghosh, A., Meng, H., Fang, L., Yue, H., Zhou, S., and Su, Y.: Seismological Characterization of the 2021 Yangbi Foreshock-Mainshock Sequence, Yunnan, China: More than a Triggered Cascade, J. Geophys. Res., 127, e2022JB024534, https://doi.org/10.1029/2022JB024534, 2022.
- Abstract
- Introduction
- Fault slip rates, segmentation and multi-segment rupture combination models
- Multi-segment rupture hazard modeling
- Discussion and conclusion
- Code availability
- Data availability
- Author contributions
- Competing interests
- Disclaimer
- Acknowledgements
- Financial support
- Review statement
- References
- Supplement