the Creative Commons Attribution 4.0 License.
the Creative Commons Attribution 4.0 License.
 | 18 Feb 2025
An integrated method for assessing vulnerability of buildings caused by debris flows in mountainous areas
Chenchen Qiu
Xueyu Geng
The vulnerability assessment of buildings in future scenarios is critical to decreasing potential losses caused by debris flows in mountainous areas due to complex topographical conditions that could increase environmental vulnerability to climate change. However, a lack of reliable methods limits the accurate estimation of a physical damage and the associated economic loss. Therefore, an integrated method of physical vulnerability matrix and machine learning model was developed to benefit the estimation of damage degree for buildings caused by a future debris-flow event. By considering the building structures (reinforced-concrete (RC) frame and non-RC frame), spatial positions between buildings and the debris-flow channels (horizontal distance (HD) and vertical distance (VD)), and impact pressure (Pt) on buildings, a physical vulnerability matrix was proposed that links physical damage with the four factors. In order to overcome the difficulty in estimating the possible impact pressure on buildings, an ensemble machine learning (ML) model (XGBoost) was developed with the involvement of geological factors. Additionally, HD and VD were decided based on satellite images. The Longxihe Basin, Sichuan, China, was selected as a case study. The results show that the ML model can achieve a reliable impact pressure prediction because the mean absolute percentage error (MAPE), root mean square error (RMSE), and mean absolute error (MAE) values are 9.53 %, 3.78 kPa, and 2.47 kPa, respectively. Furthermore, 13.9 % of buildings in the Longxihe Basin may suffer severe damage caused by a future debris-flow event, and the highest economic loss is found for a residential building, reaching EUR 5.1×10⁵. Overall, our work can provide scientific support for the site selection of future constructions.
- Article
(21648 KB) - Full-text XML
- BibTeX
- EndNote


Debris flows are among the most frequent and costly natural hazards due to climate change and difficulty in issuing timely warnings (Santi et al., 2011). These events can devastate entire settlements in their path and pose a significant threat to natural environments (Immerzeel et al., 2020), causing destruction of aquatic biodiversity along with damage to properties and finally leading to considerable economic losses worldwide each year (Qiu et al., 2022; Alene et al., 2024; Sridharan et al., 2024). In the European Alps, this disaster type caused an economic loss of at least EUR 5 billion from 1988 to 2012 (Fuchs, 2009; Guzzetti et al., 2005). Moreover, a similar average annual loss has also been found in China: approximately EUR 0.17 billion of annual loss was recorded during the time period of 2005–2015 (Miao and Liu, 2020). A reliable estimation of the potential economic loss caused by debris flows is essential since it can provide guidance for decision-makers about where to place infrastructures and buildings. Buildings are the element most susceptible to debris flows, and they are responsible for most of the associated economic loss (Fuchs, 2009; Wei et al., 2018). Therefore, in order to calculate the potential economic loss, it is critical to estimate the damage degree for the buildings since economic loss is linked to the physical vulnerability of a property and its economic value.
Physical vulnerability quantifies the damage degree for a property, and the methods that are used to decide the physical vulnerability include mechanical methods (Ruggieri et al., 2023, 2022), vulnerability matrices, vulnerability curves, and vulnerability indicators (Papathoma-Köhle et al., 2017). The mechanical methods derive the vulnerability functions of buildings based on numerical models, which may achieve relatively high evaluation accuracy but are highly reliant on controlled laboratory experiments to obtain input data. As a result, this method itself is time-consuming and costly for regional application (Paudel et al., 2021; Qiu et al., 2022). Three vulnerability curves were derived using numerical modelling to relate the vulnerability to debris-flow intensity, including flow height, flow velocity, and kinematic viscosity (Quan Luna et al., 2011). Although these three curves can suggest the physical vulnerability of a building at risk, they fail to consider the impacts of building structures on the damage degree. Therefore, a brick structure and a reinforced-concrete frame were included in the development of vulnerability curves by Zhang et al. (2018). However, the involvement of limited building types restricts the application of the curves when the determination of physical vulnerabilities for different building types is required. Therefore, considering the limitations of vulnerability curves, different vulnerability matrices of buildings have also been developed by many studies due to their advantages in understanding interactions between the debris-flow process and elements at risk and in being easily readable by non-experts (Bründl et al., 2009; Kang and Kim, 2016; Zanchetta et al., 2004). However, these developed matrices have ignored the spatial position (horizontal distance and vertical distance) between the buildings and the debris-flow channels, which could lead to misestimation of the damage degree for a building caused by a debris-flow event. As for the vulnerability indicators, this method considers the characteristics of buildings without considering the debris-flow process when evaluating the damage degrees (Fuchs et al., 2019). Therefore, it is crucial to establish a comprehensive assessment matrix that takes into account the structural types, spatial positions between buildings and the debris-flow channels, and debris-flow intensities to estimate the potential damage to the buildings. Additionally, the possible damage degree for the buildings in future scenarios has not been considered by past studies (Papathoma-Köhle et al., 2017). Therefore, this study focuses on conducting an assessment of the potential physical damage to a building due to a future debris-flow event.
Among the four factors in deciding the physical damage to buildings (building structure, spatial locations (horizontal distance (HD) and vertical distance (VD)), and impact pressure (Pt)), impact pressure remains an unsolved problem since HD and VD can be determined based on satellite images. In this case, a machine learning model was developed to predict the impact pressure on a building because this method can uncover intricate and concealed relationships between various input variables and an output result (Khosravi et al., 2021; Jiang et al., 2024). To leverage the benefits of rapid processing and handling large-scale data, we employ an ensemble model, specifically extreme gradient boosting (XGBoost). This choice is made due to XGBoost's ability to partition data into smaller components, facilitating parallel computation and multithreading to enhance processing speed (Chen and Guestrin, 2016).
In this paper, we propose an integrated method of a physical vulnerability matrix and machine learning model to estimate the physical damage to a building caused by a future debris-flow event, finally estimating the economic loss associated with this property. The buildings in the Longxihe Basin, Sichuan, China, were extracted to conduct a case study to test the efficiency and reliability of this method in physical damage estimation and corresponding economic loss. The formation of terrain in this area is affected by severe tectonic activities, such as earthquakes (Chang et al., 2014, 2015), which can produce abundant loose materials for potential debris flows.
To estimate the economic loss of buildings caused by a future debris-flow event, several steps are included in this study (see Fig. 1):

-
The historical debris-flow events in Gyirong, the Tibet Autonomous Region, and the Sichuan Basin (Fig. 2) from the past 10 years were investigated based on satellite images and field investigations to collect information regarding the debris-flow volumes and damaged buildings.
-
We categorized the collected historical debris flows into two datasets (dataset I and dataset II) for the development of a physical vulnerability matrix and a prediction model, respectively.
-
Dataset I includes the debris-flow events that caused damage to the buildings. In detail, Vp is the physical vulnerability of buildings, and Pt represents the impact pressure of a debris-flow event on buildings. HD and VD are the horizontal and vertical distance of buildings to their nearest debris-flow channel. Therefore, this dataset is employed for the development of a physical vulnerability matrix. This dataset mainly includes the debris-flow events that occurred in the Sichuan Basin, China, and also several events in the Gyirong area.
-
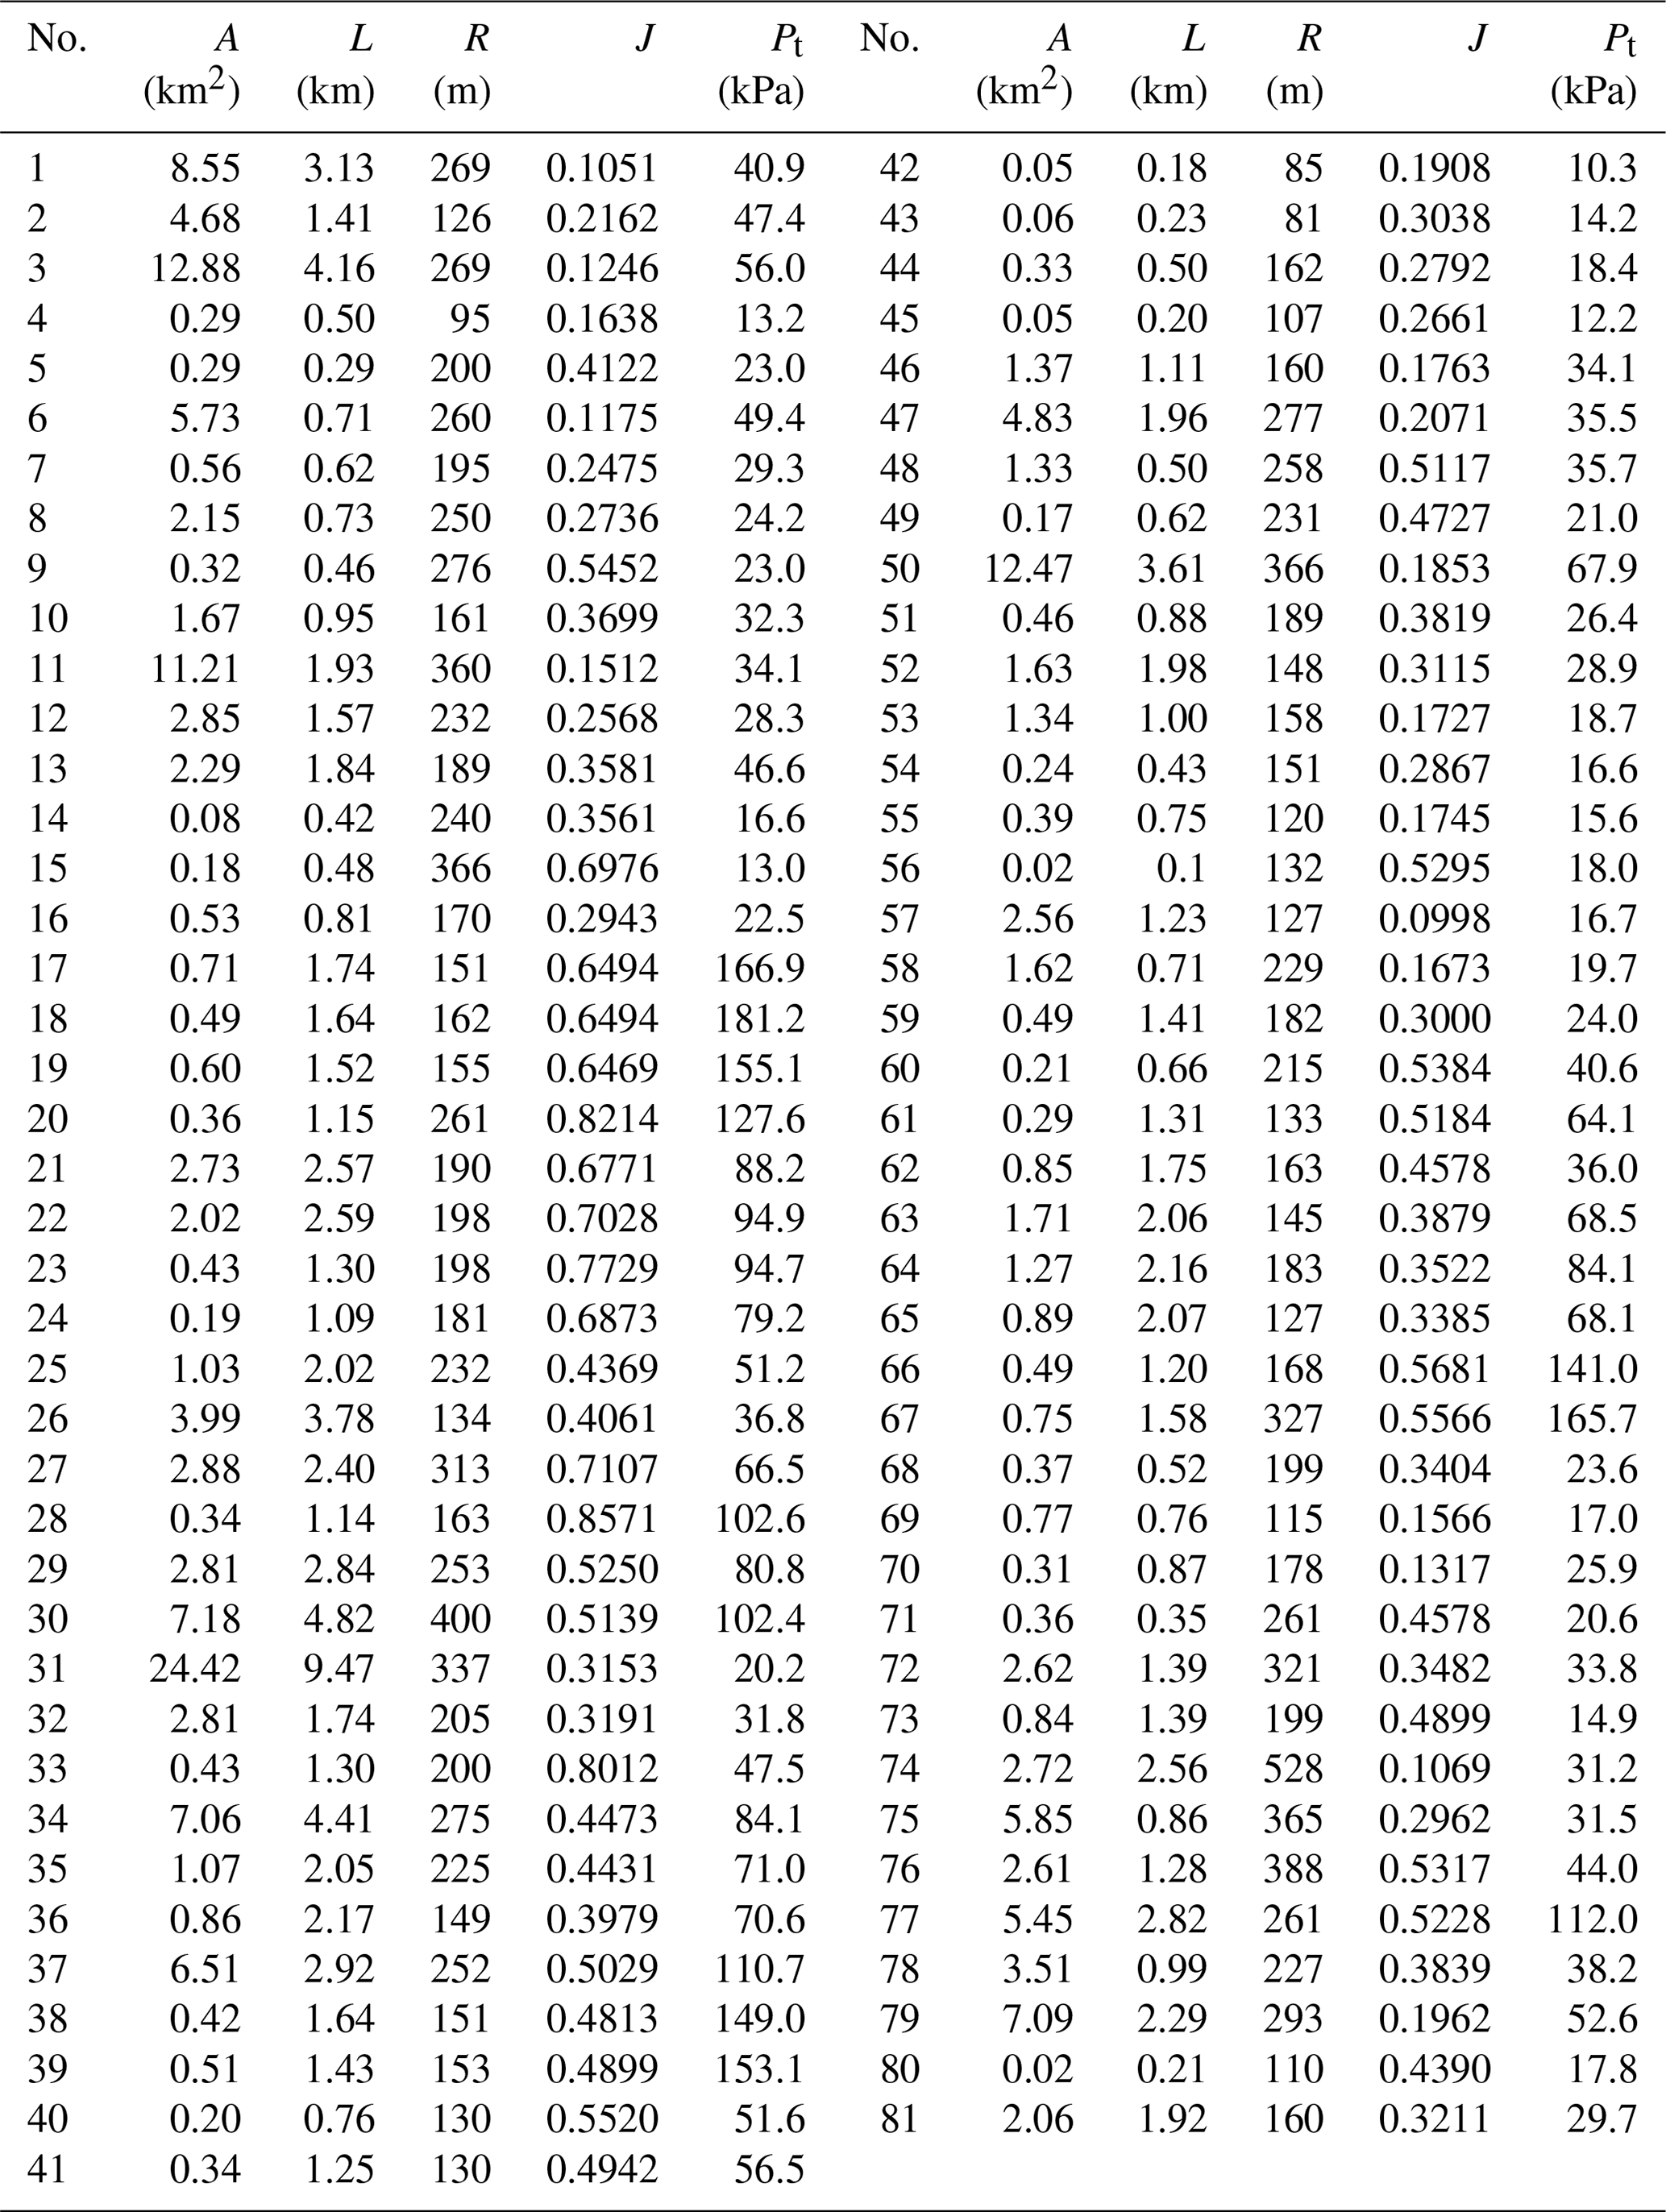
Dataset II is composed of the debris-flow events that occurred in areas without the distribution of buildings, and, therefore, no property loss is caused by these events. For the purpose of establishing an estimation model, a series of factors, such as the depositional volume of a debris-flow event (U), area of a debris-flow catchment (A), length of the main channel for a catchment (L), average topographic relief (R), and average gradient of main channel (J), are considered. ρdf is the mean density of the material. Therefore, this dataset was used for model training and utilizing this model to estimate the debris-flow intensity in future scenarios, such as the debris-flow impact pressure on buildings. This dataset is shown in Table B1 of Appendix B.
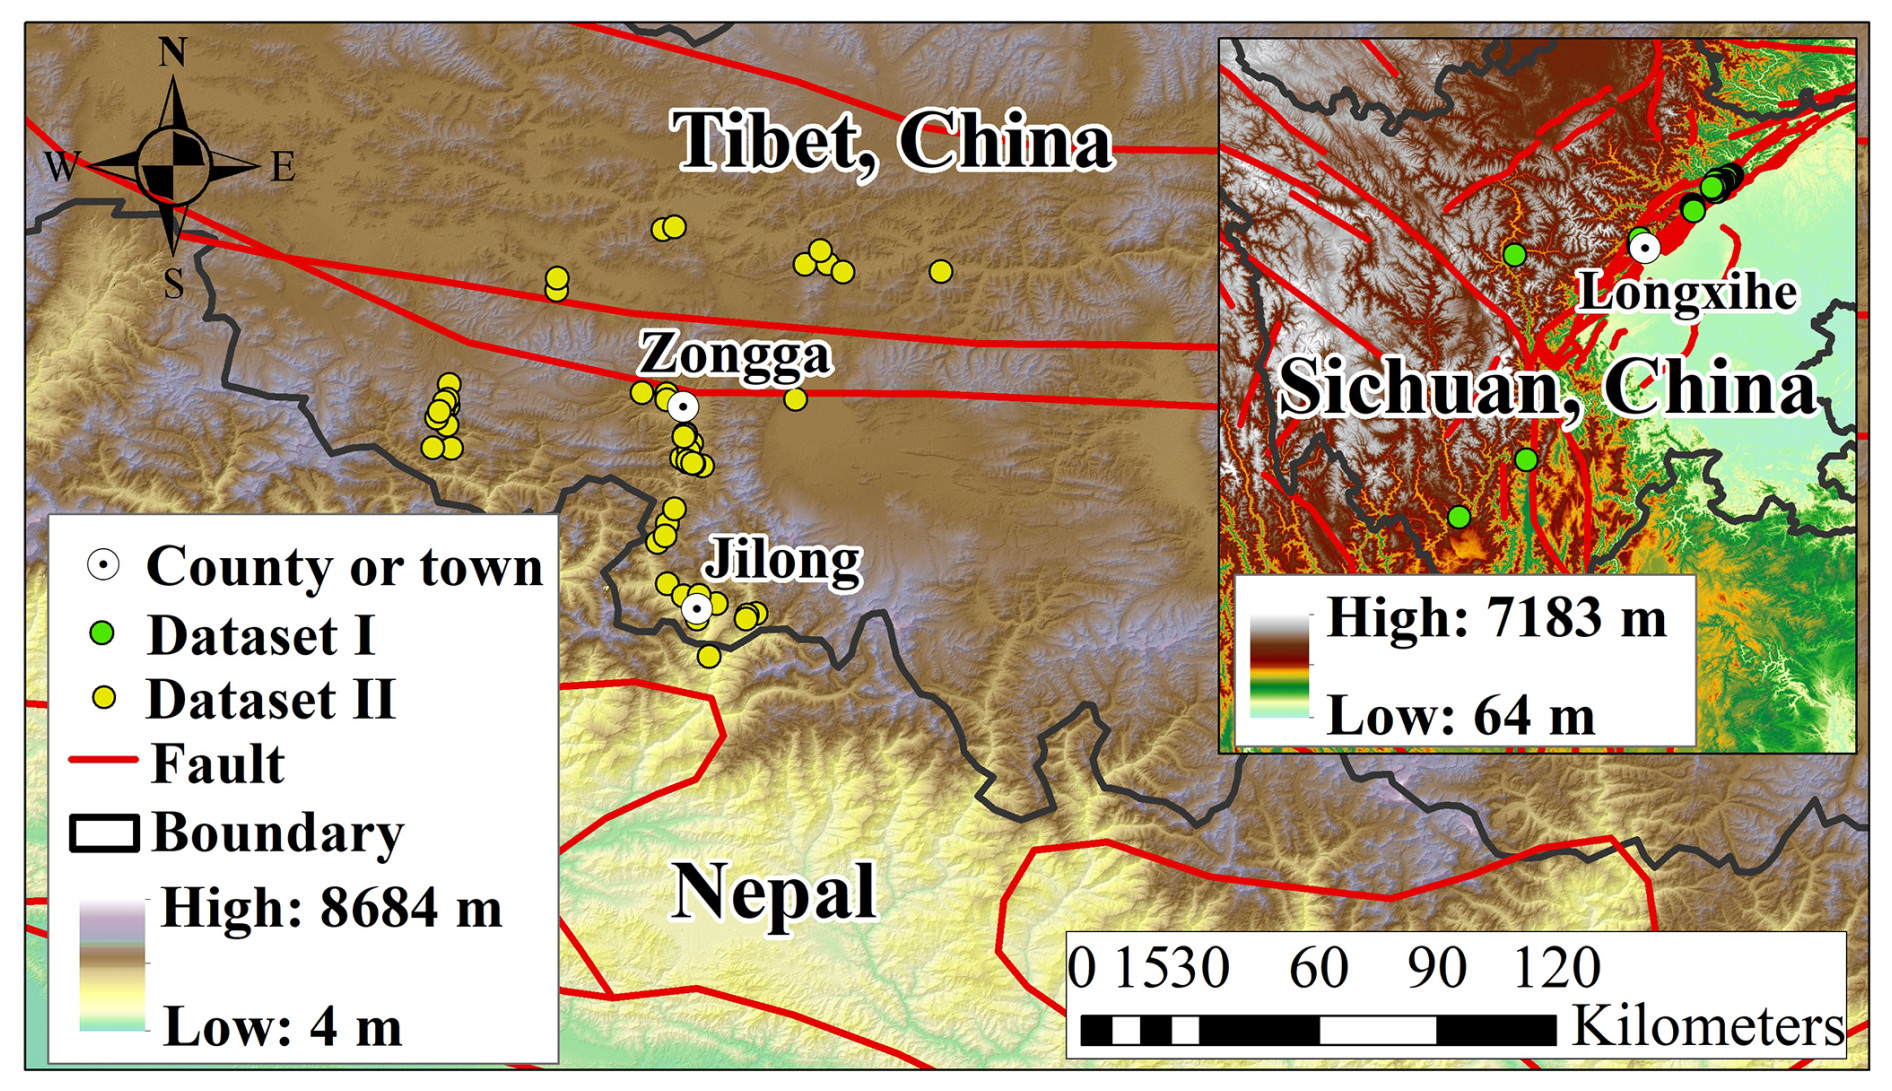
Figure 2The historical debris flows collected in the Qinghai–Tibet Plateau and the Sichuan Basin.
2.1 Physical vulnerability matrix
Vulnerability, usually referring to physical vulnerability, denotes the extent of damage a property may suffer when subjected to a hazard event, such as a landside and a debris-flow event (Fell, 1994), ranging from no damage (vulnerability is assigned 0) to completely destroyed (vulnerability is assigned 1). To obtain the future economic loss of a building at risk, a physical vulnerability matrix of the buildings was proposed. The determination of physical vulnerability (Vp) relied on the impact pressure (Pt) on buildings and the horizontal distance (HD) and the vertical distance (VD) between the building and the nearest debris-flow channel, as indicated by Eq. (1). The determining details of the three parameters in Eq. (1) are demonstrated in the following sections.
2.1.1 Calculation of impact pressure
In order to propose a physical vulnerability matrix, the first step is to link the impact pressure to the damage degree. As suggested by Jakob et al. (2012) and Kang and Kim (2016), Pt can effectively reflect the energy of debris flows and possible damage degree for buildings. However, past studies have usually utilized the debris-flow magnitude to determine the physical vulnerability since a greater magnitude may indicate a more significant impact force (Dai et al., 2002). This impact force cannot represent the actual damage to a building during a debris-flow event because the catchment with a potential large-scale debris-flow event may not cause severe damage to the buildings. The reason behind this uncertainty could be due to the moderate gradient of the debris-flow channel and its frictional resistance, which could decrease the kinetic energy of the travelling mass (Qiu et al., 2024). Consequently, only slight or moderate damage to buildings could be caused. Therefore, impact pressure can better reflect the damage degree for buildings when subjected to different debris-flow magnitudes, which can be calculated through considering the dynamic overpressure and hydrostatic pressure (Eq. 2) (Zanchetta et al., 2004):
where Pt (kPa) represents the impact pressure on buildings and g is the gravitational acceleration. v (m s−1) represents the flow velocity at the maximum discharge, and ρdf is the mean density of materials for a debris-flow event. h (m) is the flow depth that describes the deposit depth on buildings. As for the debris-flow velocity (v) at peak discharge (Qp), it can be calculated using the equation proposed by Rickenmann (1999). This equation (Eq. 3) considers debris-flow datasets in different regions, such as Italy, China, Japan, the USA, and Colombia, which enables its feasibility to be used in wider and different areas.
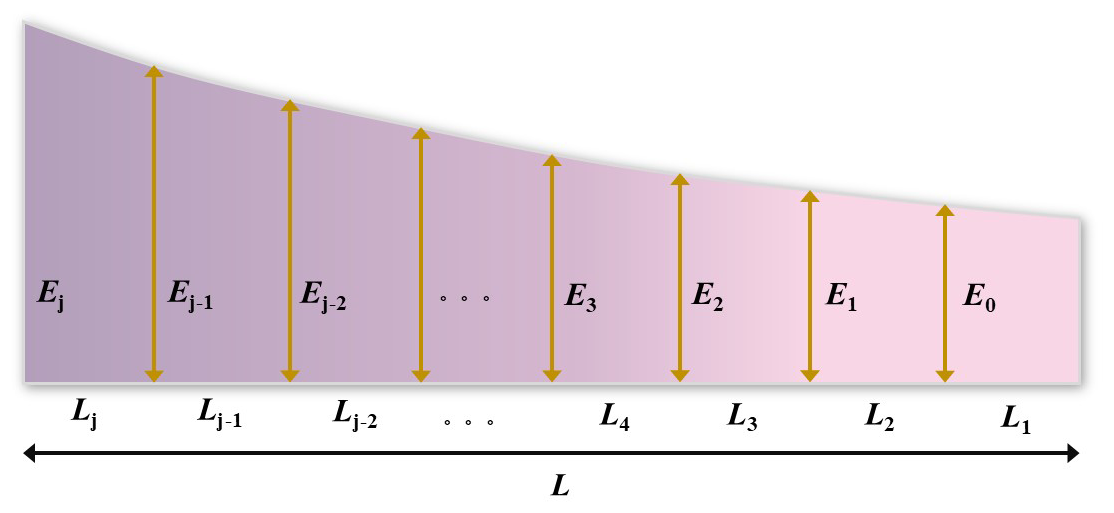
This equation illustrates that the velocity can be decided by Qp (m3 s−1) and channel gradient (J) (Cui et al., 2013). It is worth noting that J changes along the channel. In our study, we focused on the mean gradient of the main channel within a debris-flow catchment, and it is calculated using the equation proposed by IMHE (1994):
where J is the mean path gradient (‰). Ej (, j−1) represents the elevation of each break point in the movement path (m). Elevation was downloaded from the Alaska Satellite Facility (ASF) website (https://search.asf.alaska.edu/#/, last access: 23 February 2024), where a DEM with a spatial resolution of 12.5 m is available. Lj is length of each section within the movement path (m). m is the number of sections. E0 represents the elevation at the endpoint of the mass movement (m), while L denotes the length of the travel path (m). The divided sections are presented in Fig. 3.
The calculation of Qp can be determined based on the following equation (Eq. 5):
Therefore, Qp can be calculated based on the estimated volume (U (m3)) of historical debris flows. However, the absence of flow depth (h) also hampers the calculation of impact pressure. Therefore, an equation is used to calculate the flow depth (Koch, 1998). This formula has been proven to perform well in the numerical simulation of viscous debris flows (Eq. 6):
where C1 represents the dimensional empirical coefficient. The value of this parameter is indicated by a semi-theoretical relationship (Eq. 7) (Rickenmann, 1999):
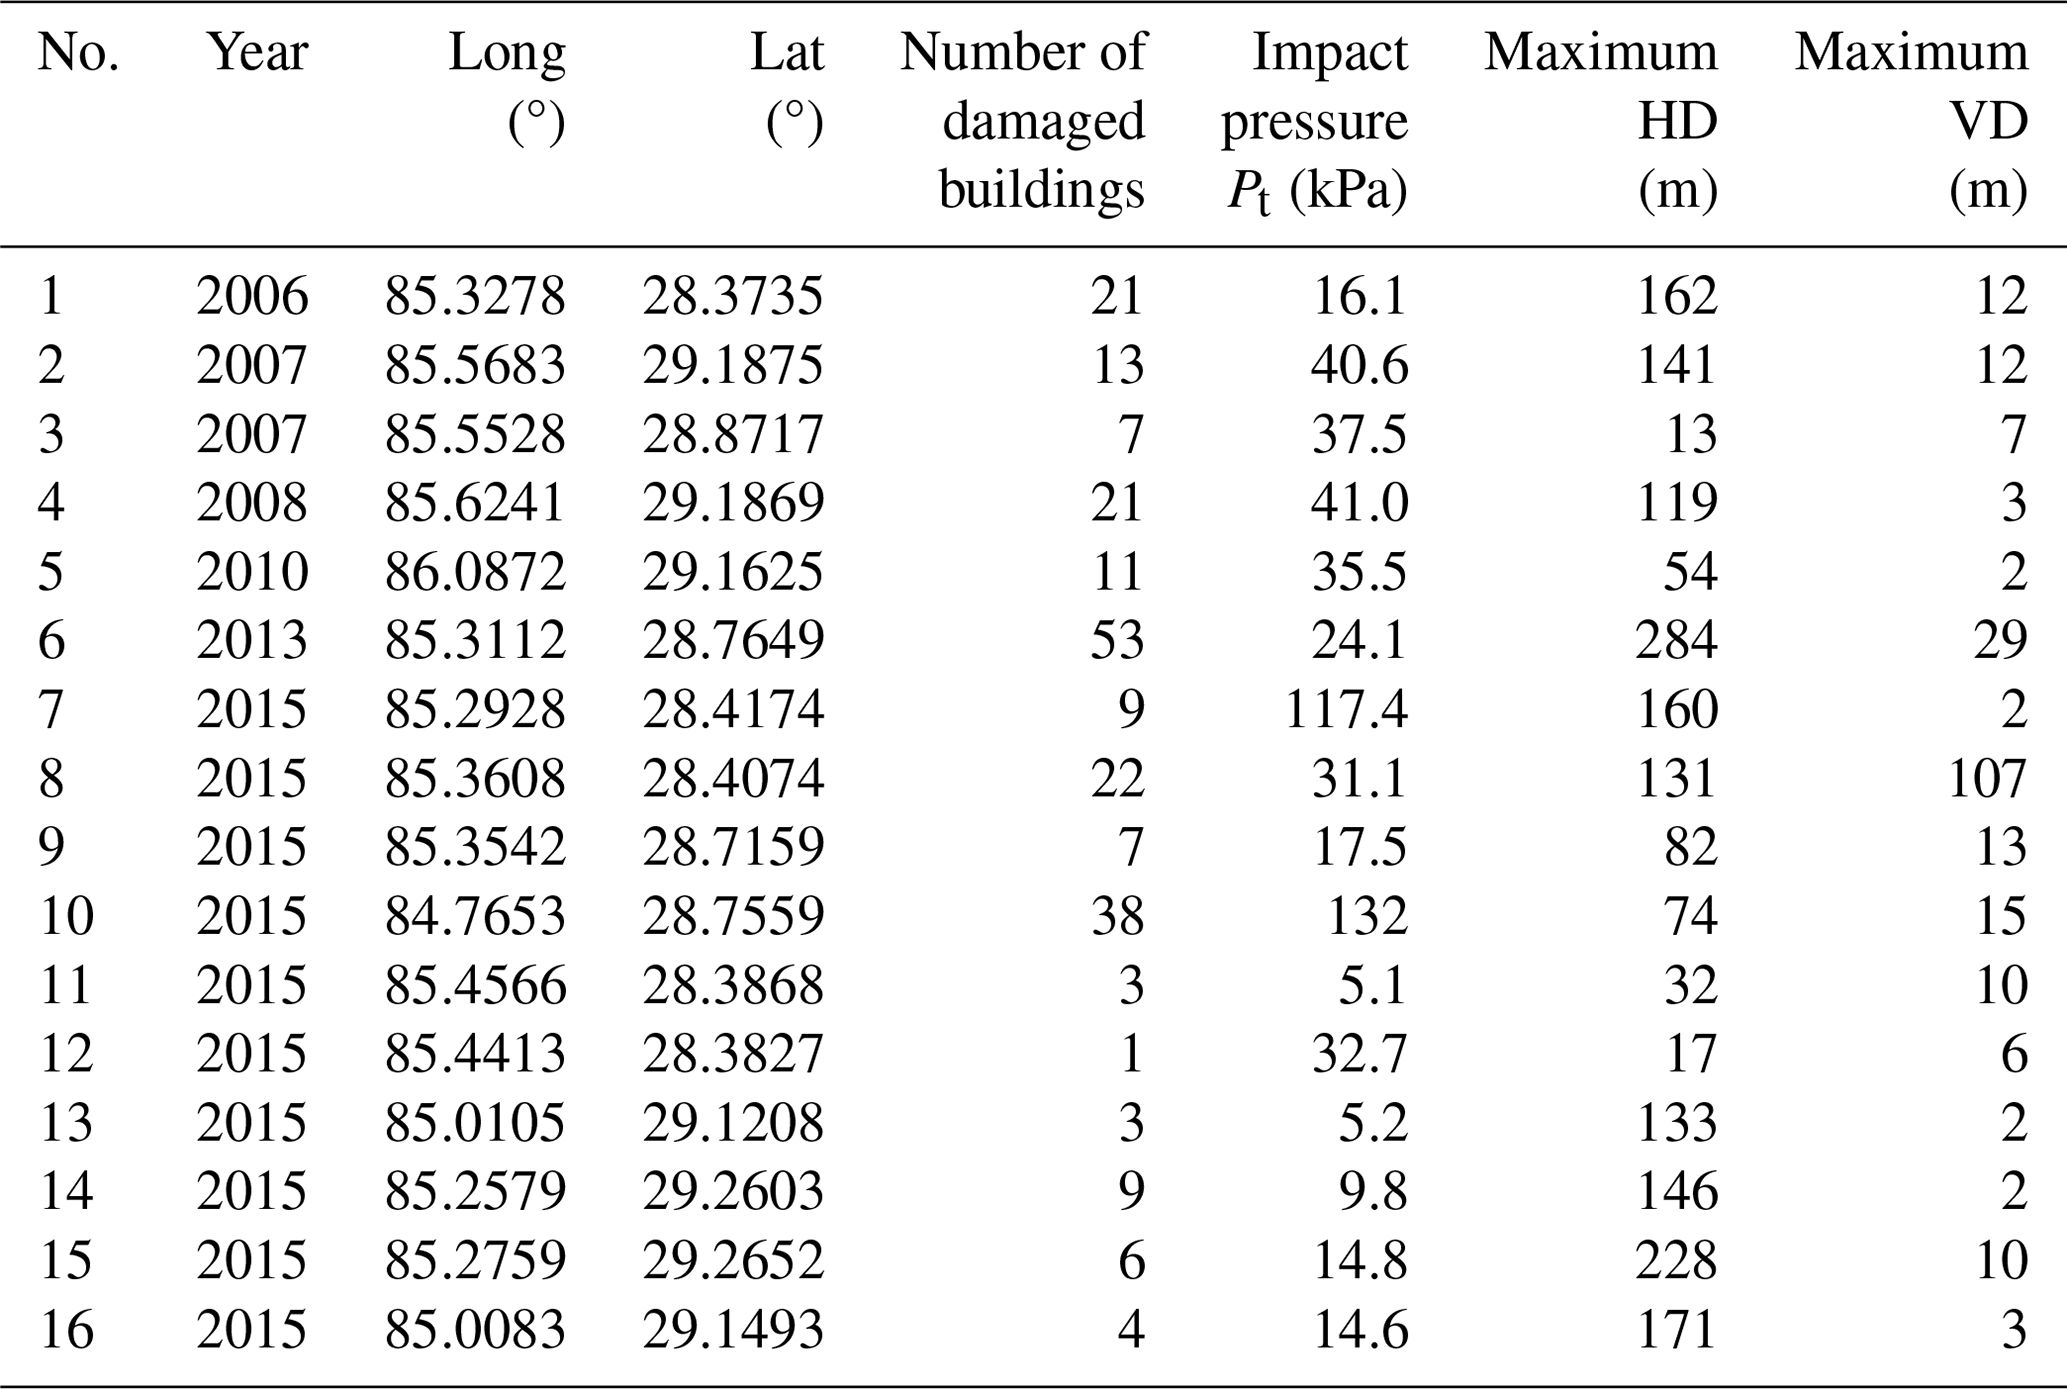
Therefore, the impact pressure can be described as a function of the debris-flow volume and channel gradient, and the impact pressures of dataset I are calculated based on Eqs. (2)–(7) (see Table 1).
Determination of HD and VD values
HD and VD values were also introduced here since the actual damage will be significant if a building stands close to the debris-flow channel (Sturm et al., 2018). They can be estimated through high-resolution satellite images, such as Gaofen, Ziyuan, Worldview, and GeoEye. In this study, Gaofen-2 satellite images are employed for determining the HD and VD values. This satellite can capture panchromatic (black and white) images with a spatial resolution reaching 0.8 m and multispectral (colour) images with a spatial resolution up to 3.2 m. Therefore, the resolution of satellite images used for the determination of HD values is 0.8 m. However, there is no elevation information provided by satellite images. Therefore, a DEM was used to extract the VD information between a building and its nearest debris-flow channel. As for the building clusters that are hard to be separated into individual buildings manually, a “fishnet” tool in a GIS was used to automatically divide these clusters into building segments. Furthermore, the rectangular segments were converted into points so that each point represents a building. As a result, the HD and VD values of a building can be decided. The damaged buildings are mainly distributed on the accumulation fans. Therefore, even though a large HD is observed, VD is small due to the mild slope and smooth topography of the alluvial fans (Marcato et al., 2012). By considering the impact pressure, HD, and VD values, a physical vulnerability matrix can be established to evaluate the physical damage of a building caused by a debris-flow event.
2.2 Economic loss of a building at risk
The economic loss of a building caused by a debris-flow event can be estimated based on multiplication of its physical vulnerability and economic value.
where Ve and M represent the economic loss and the economic value of a building, respectively. P is the unit price of a building, and A represents the area of a building. Therefore, estimating Vp holds paramount importance in estimating economic loss. However, Vp (H(Pt, HD, VD)) is represented by the proposed physical vulnerability matrix. In this context, determining Pt plays a critical role in economic loss estimation. Therefore, to forecast the possible economic loss caused by a future debris-flow event, we need to estimate the impact pressure on buildings caused by a future debris-flow event.
2.3 Prediction model development
To predict the future impact pressure on buildings when a debris-flow event occurs, determining factors is essential. Therefore, we further developed Eq. (6) by integrating Eqs. (5) and (7) into this equation:
Additionally, Eq. (3) can be rewritten as
Therefore, the determination of impact pressure relies on U and J:
However, the debris-flow volume is closely related to a set of geomorphic factors, as suggested by Huang et al. (2020). They are catchment area (A), channel length (L), topographic relief (R), and mean slope of the main channel (J). The catchment area can reflect the debris availability and capacity of generating and containing the volume of loose materials for a debris-flow catchment. As for the channel length, it is related to the entrained and transported sediment volume (Marchi et al., 2019). Therefore, this parameter can also impact the final volume of a debris-flow event. R is defined as the terrain fluctuation and roughness of a catchment. To calculate this value, we need to first decide the optimal statistical unit in this area using the change-point model. Then, the subtraction value between the maximum value and minimum values of an optimal statistical unit is calculated. Finally, we utilized the maximum subtraction value to represent the R value of a catchment. J is defined as the ratio of the elevation difference in the main channel to channel length. A longer distance could be achieved for a debris-flow event if a steep channel exists in a catchment (de Haas and Densmore, 2019). In this case, U can be described as a function of A, L, R, and J:
Furthermore, substituting Eq. (12) into (11) gives
Therefore, Pt can be described as a complex function of geomorphology-related factors, including A, L, R, and J. To find the complicated correlations among them, an ensemble machine learning model (extreme gradient boosting (XGBoost)) was employed here to establish the relationship and then utilize this relationship to estimate the potential impact pressure on buildings when a future debris-flow event occurs. The basic mechanism of XGBoost is to constantly develop a new decision tree which acts as a weak learner and fits the residual error of the last prediction. After the training of a total of k trees, the final prediction result is the sum of the score of each leaf node in each developed tree. In this study, a grid search algorithm was employed to decide the optimal hyper-parameters of XGBoost. As a result, the hyper-parameters of n_estimators, learning_rate, max_depth, min_child_weight, and gamma were determined as 500, 0.1, 5, 1, and 0.01, respectively. The target function of regression overall is in Appendix A. Additionally, dataset II, which is used for impact pressure prediction, is presented in Table B1 of Appendix B.
2.4 Model assessment
After the impact pressure prediction, three assessment indexes were used to evaluate the prediction performance, i.e. MAPE (mean absolute percentage error), RMSE (root mean square error), and MAE (mean absolute error):
where yi is the actual value and yipre represents the prediction value. m is the number of prediction values.
3.1 The relationship between the damage degree and Pt
Figure 3 shows the different damage degrees for buildings in dataset I. The buildings were classified into two types: reinforced-concrete (RC) frame and non-RC frame (masonry, wooden structure, and light steel frame). As indicated in Fig. 4e and f, the masonry buildings suffered severe damage, and the light-steel-frame buildings and wooden-structure buildings were destroyed (Fig. 4g, h) even though the impact pressure on buildings was estimated to be less than 30 kPa. However, the main structure of reinforced-concrete buildings can remain undamaged (Fig. 4b) when severe damage is found in the masonry structure during the same debris-flow event. This resistance ability difference indicates the difference in physical vulnerabilities between the RC and the non-RC frames, which can also be seen in Fig. 4a. Moreover, moderate damage to the RC frame with unreinforced masonry infill walls when a small-scale debris-flow event occurs is depicted in Fig. 4c. Additionally, the RC frame suffers extensive damage when the impact pressure exceeds 100 kPa based on the estimated debris-flow volume. Overall, the identification of different damage degrees for buildings helps in proposing classification standards for the physical vulnerability of buildings.
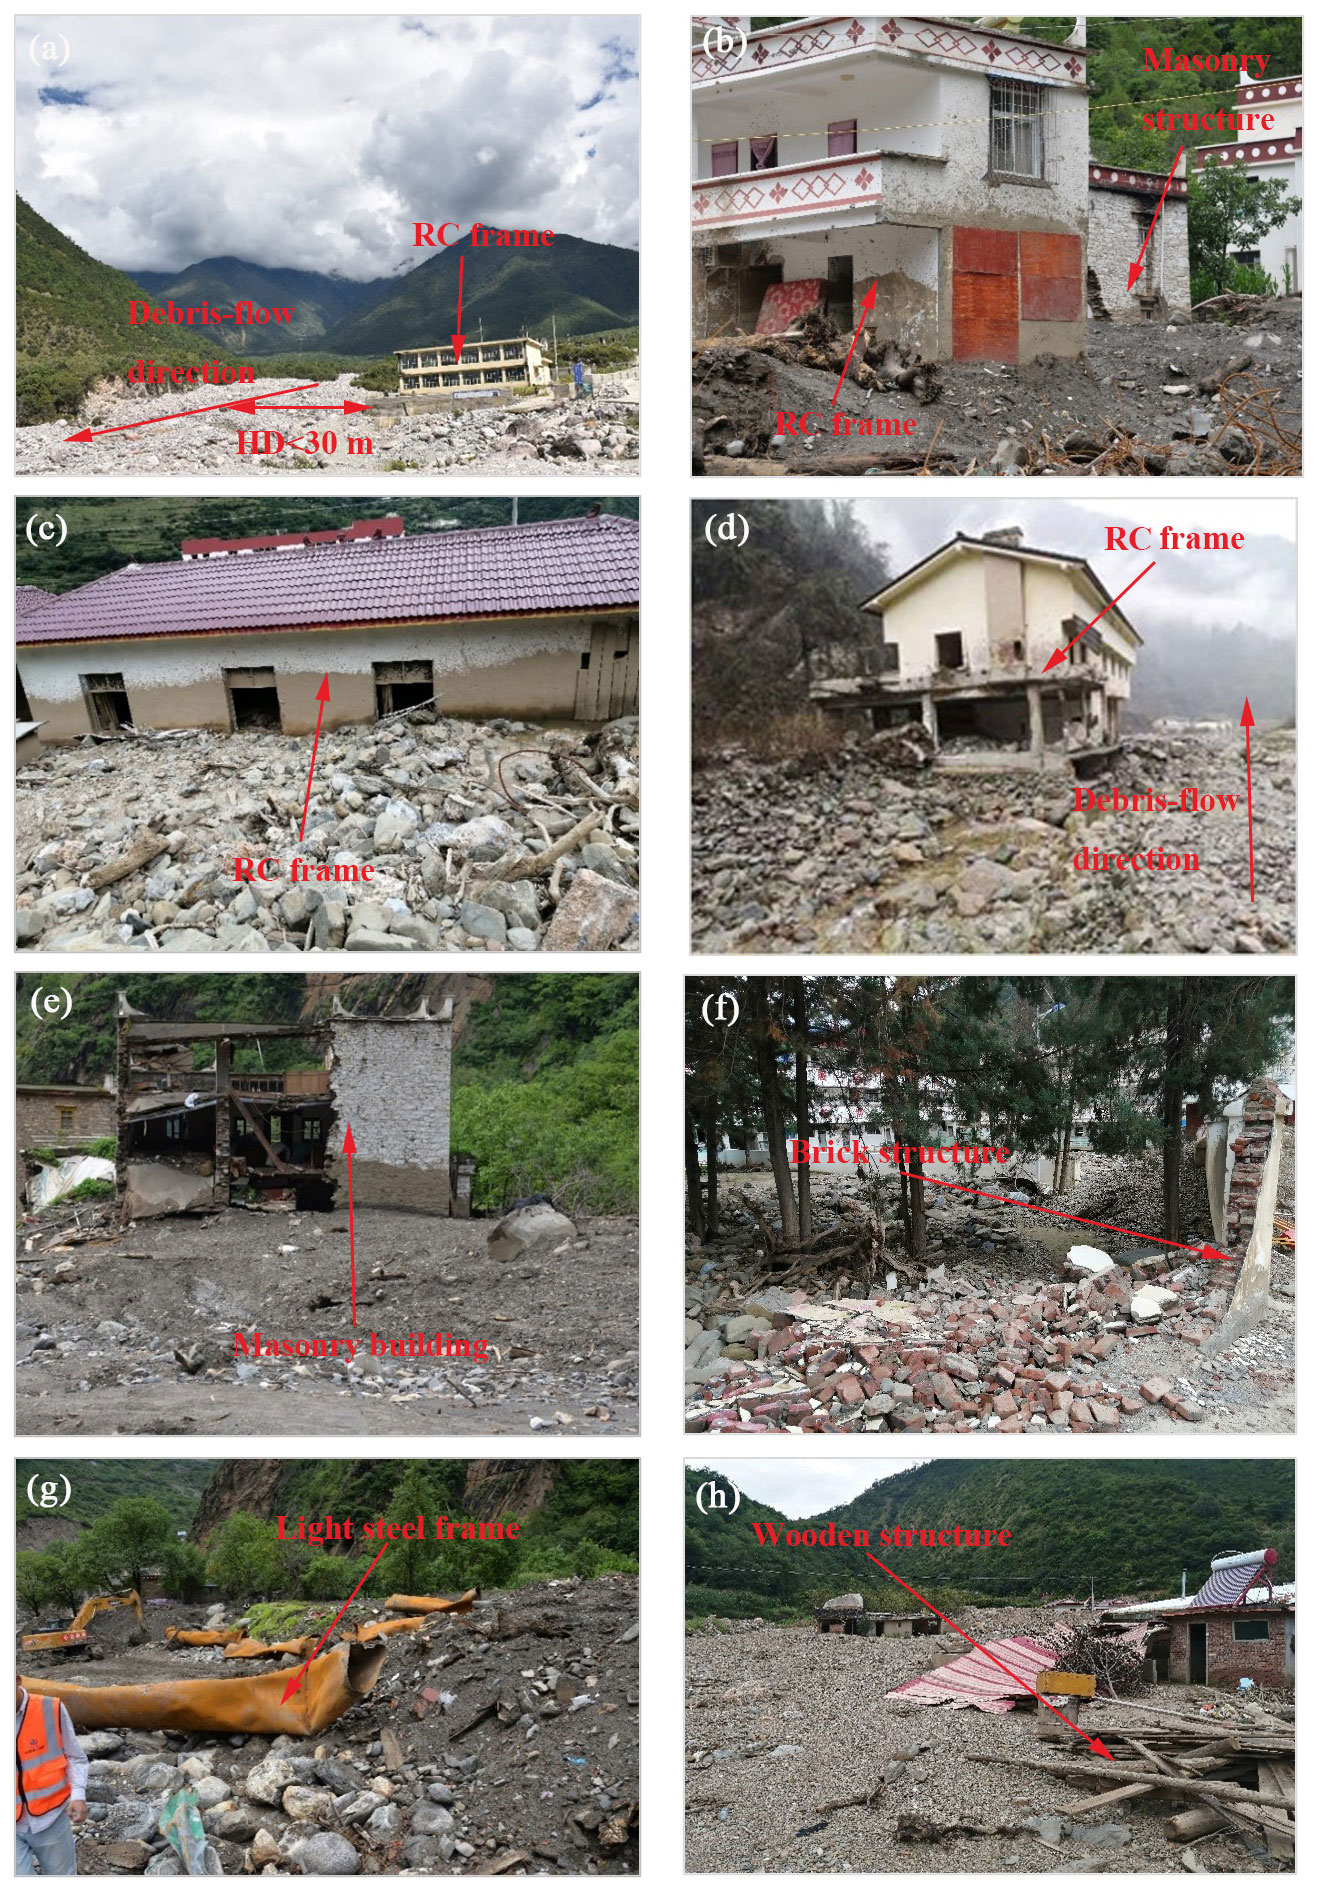
Figure 4Photographs of the damaged residential buildings caused by debris flows during field investigations on the Qinghai–Tibet Plateau.
3.2 Determination of HD and VD thresholds
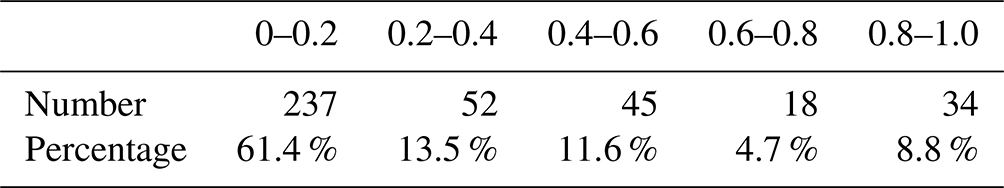
Field investigations and statistical results show that the non-RC frame buildings are destroyed or suffer structural damage when HD is less than 30 m (Fig. 5a). The damaged buildings cannot be repaired, and reconstruction is required. Consistently with the conclusions of a past study (Wei et al., 2022), residential buildings, such as brick structures (Fig. 5b) and the RC frame buildings (Fig. 5c), are partially buried by the debris-flow sediments without structural damage when HD is greater than 100 m but less than 160 m. Therefore, 160 m is another HD threshold with which to classify the inundated and slightly affected areas. The upper limit of the HD value for the historical debris flows during the field investigations is 230 m because almost 94 % of HD values are less than 230 m (see Table 1).

In order to support the threshold determination of HD, we further analysed the frequencies of HD values for the damaged buildings, as depicted in Table 1, through dividing the HD values into several intervals. The frequency and cumulative frequency results are shown in Fig. 6.
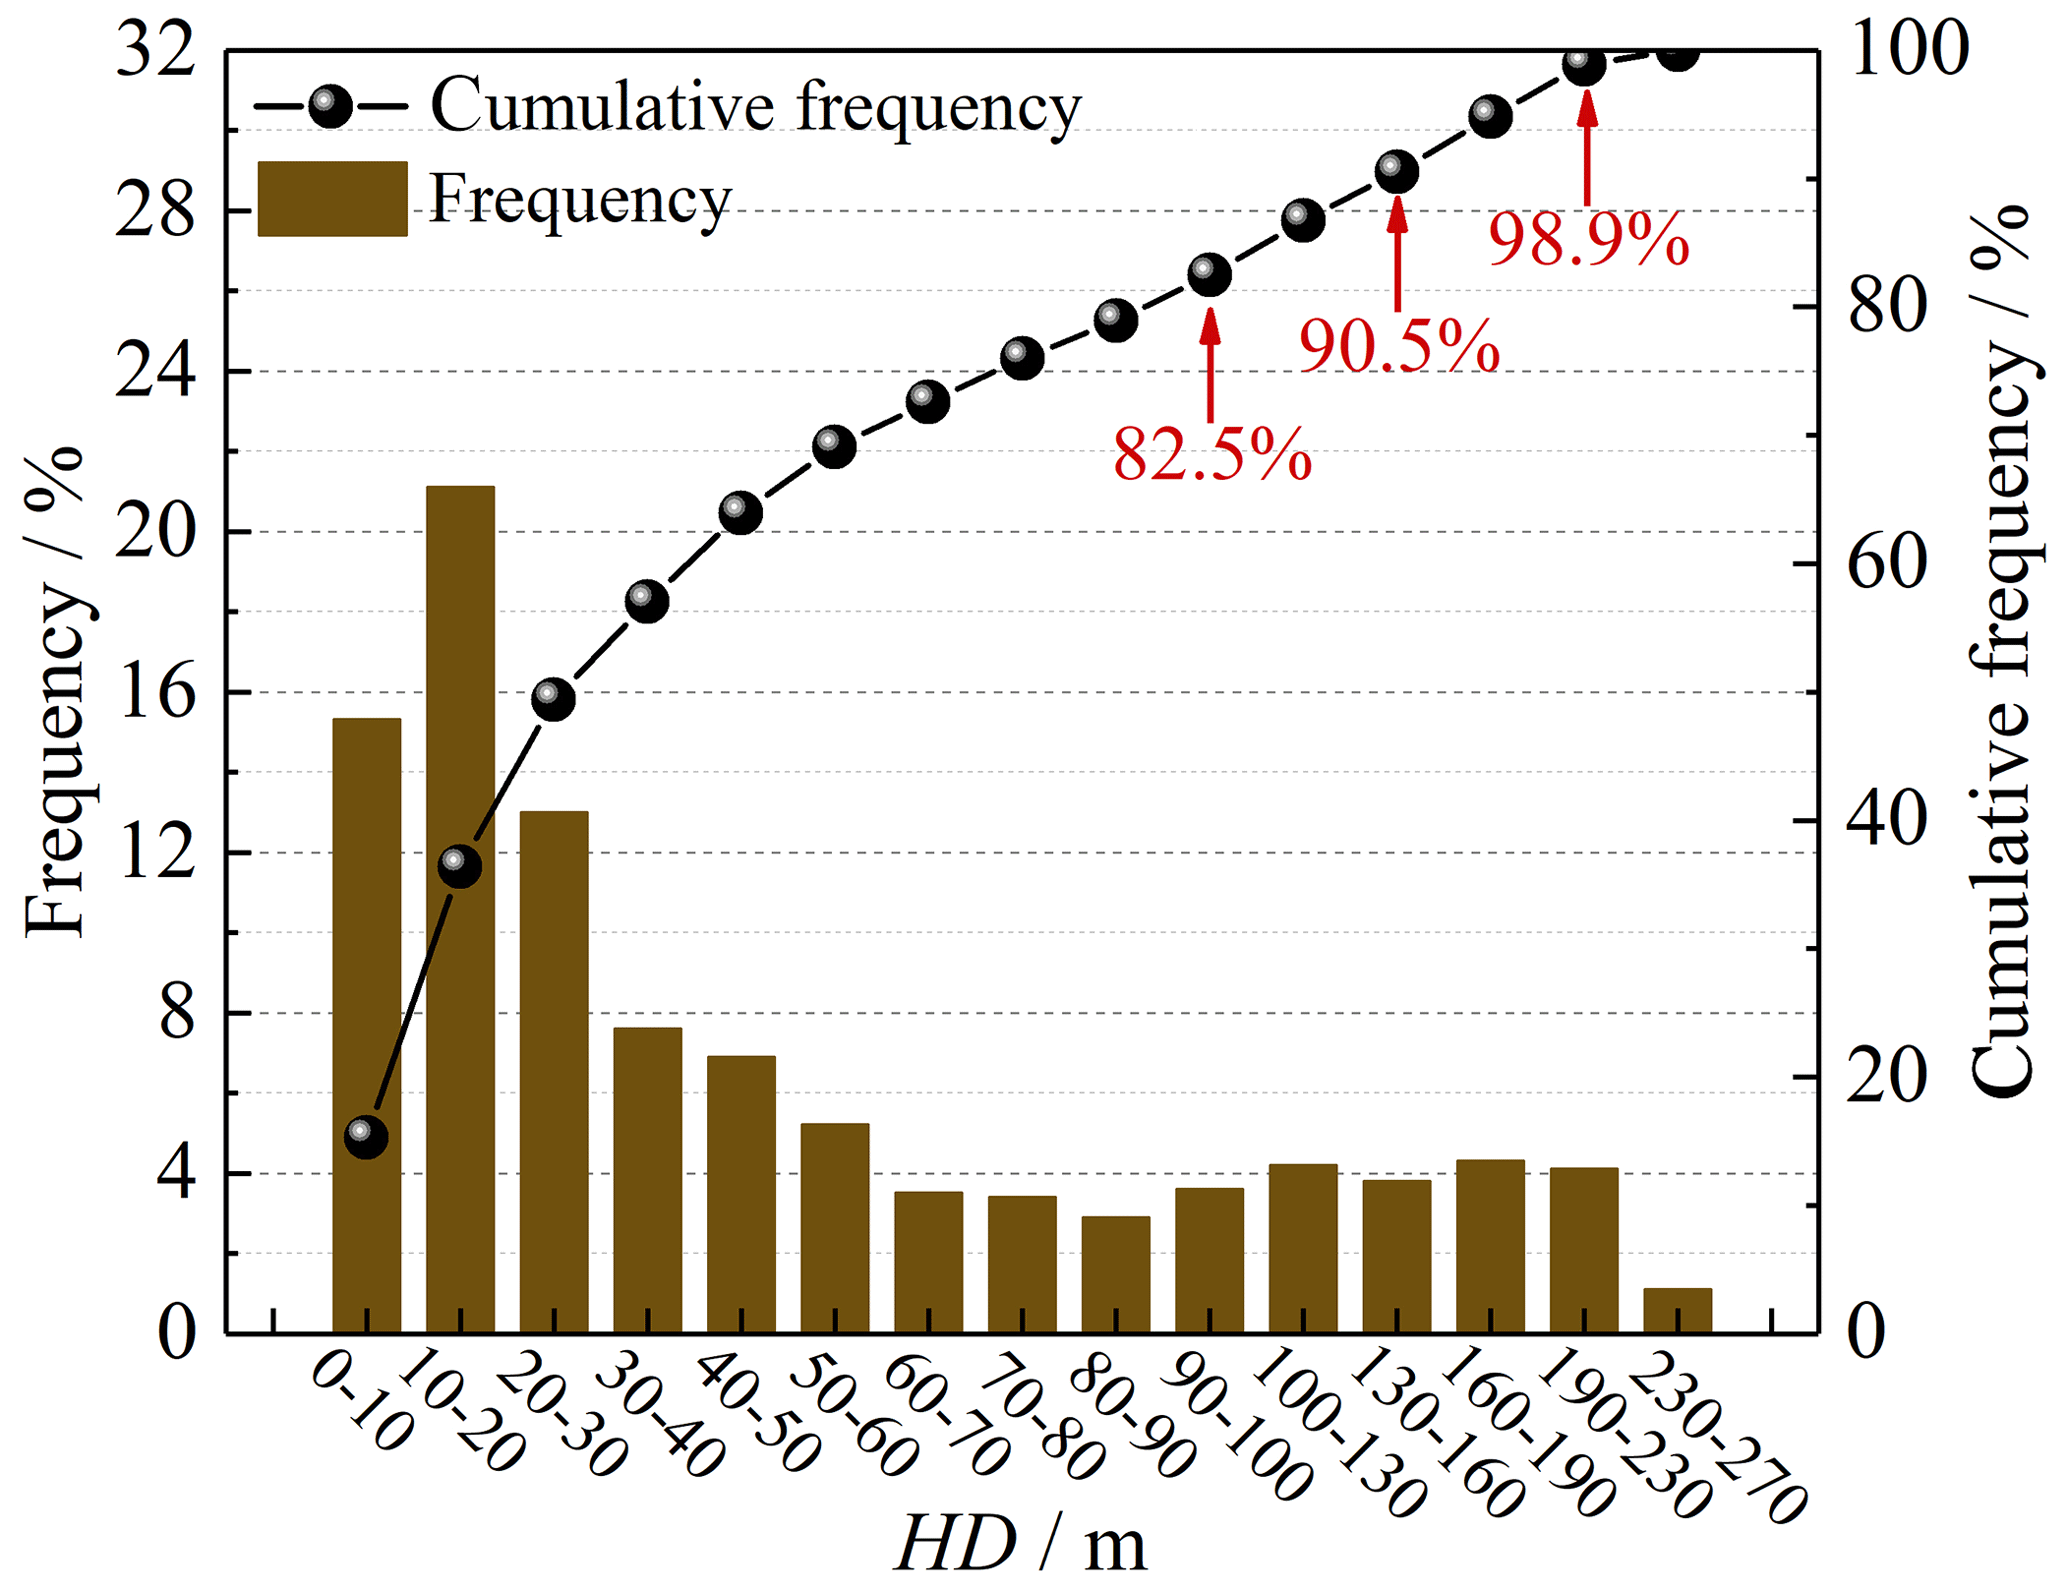
As depicted in Fig. 6, the highest proportion of damaged buildings occurs in the range of 10 to 20 m, accounting for 20.1 %, followed by a 15 % percentage of HD values falling between 20 to 30 m. Therefore, the proportion falling within the range of 0 to 30 m is 49.4 %, and approximately 82.5 % of the HD values are measured at under 100 m. Following the suggestion of Liu et al. (2020), a probability of 50 % is considered a threshold for debris-flow warning, which implies that 30 m in this study can serve as a threshold. Moreover, the cumulative frequency of 80 % is selected as another threshold based on Wei et al. (2018), corresponding to the HD value of 100 m. Furthermore, 90.5 % of the damaged buildings have HD values of less than 160 m, and nearly 98.9 % of the damaged buildings fall within the HD range of 0 to 230 m. As a result, 160 and 230 m are selected as two additional thresholds. In addition to the determination of HD threshold values, the maximum flow depth (hmax) in the debris-flow channel is used as a reference to determine the VD thresholds since the buildings are mostly situated along the channels (Figs. 5a and 7).
Therefore, calculating the elevation difference between the buildings and the nearest debris-flow channel is critical to evaluating the safety of the buildings. It is worth noting that the height of a building was not considered when estimating the VD values. For example, the masonry buildings in Figs. 5a and 7 are close to the debris-flow channel, but no severe damage is observed for the building in Fig. 7 because it is at a considerable vertical distance from the main channel. To determine the VD thresholds, the h values of the historical debris flows, presented in Table B1 of Appendix B, are used. The average depth of the debris flows is 2.6 m, and nearly all the VD values are less than 4 m. Therefore, 4 m serves as the first threshold, suggesting that the most severe damage to the buildings may be caused when VD is less than 4 m. A debris-flow depth value as high as 10 m, which can be found in curved channels, has also been suggested as a threshold (Xie et al., 2013). Consequently, we utilize 10 m to indicate the moderate damage of buildings when VD is less than 10 m but greater than 4 m. Moreover, a vertical distance of 14 m above the river level is considered to record the river gauging on the Iowa River using a digital video camera (Creutin et al., 2003), which indicates a safe VD value to avoid damage caused by the river discharge. Therefore, 15 m is used as the upper limit of the VD values in this paper.
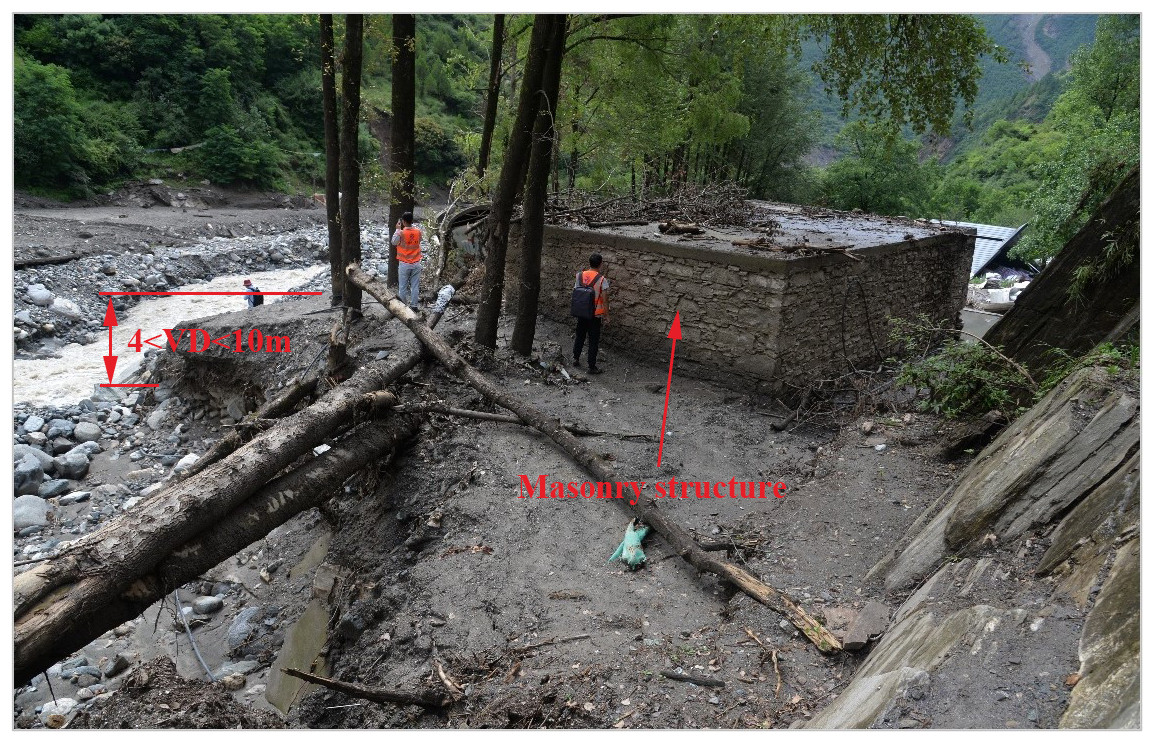
Figure 7Example informing the determination of the VD threshold. VD in this figure indicates the height difference between the river table and the masonry structure without considering the height of this building.
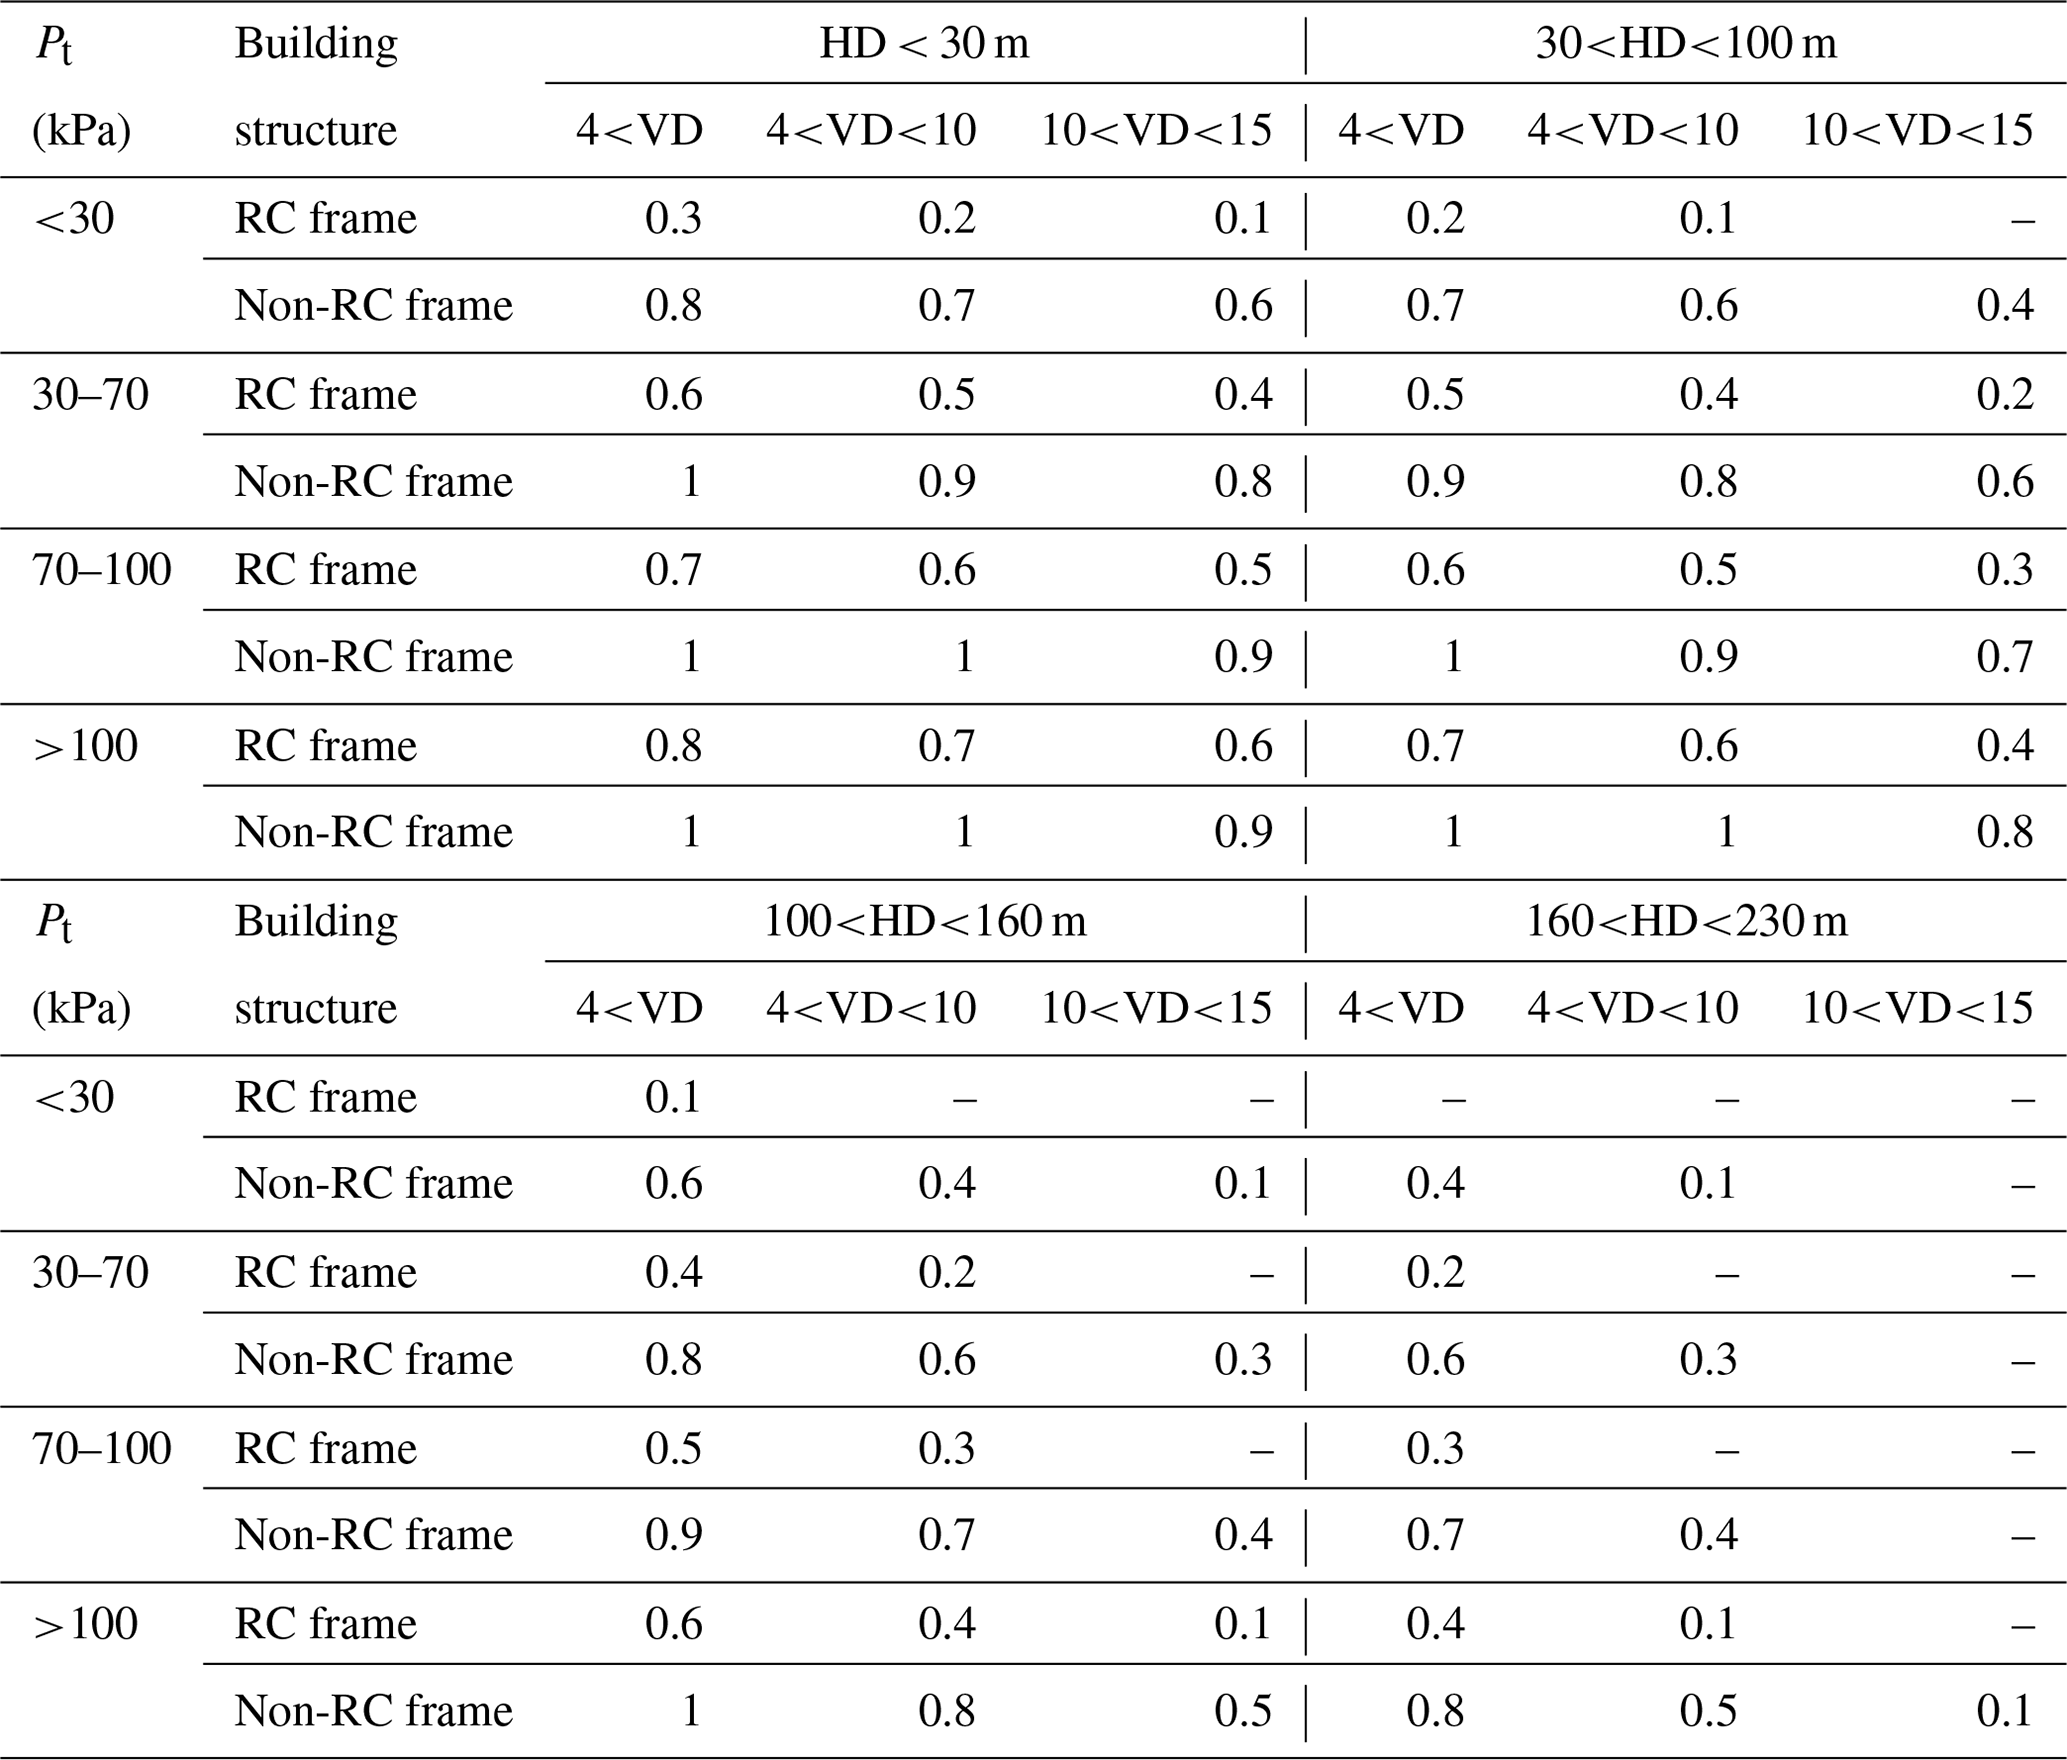
3.3 Physical vulnerability matrix (h(Pt, HD, VD))
The proposed physical vulnerabilities of residential buildings are listed in Table 2. Extensive damage or even complete damage may occur when a non-RC building is located near the debris-flow channel with an HD value of less than 30 m and VD less than 4 m. However, a significant improvement in resistance ability can be observed when the non-RC frame is replaced by the RC frame considering the same impact pressure, HD, and VD values. In general, the buildings hardly suffer damage when VD is greater than 10 m. Therefore, the economic loss associated with a building can be calculated based on the proposed physical vulnerabilities and economic values.
3.4 Prediction model development and assessment
The debris flows in Table B1 (see Appendix B) were divided into a training set and a validation set with a ratio of 7:3, and the training set is used to train the prediction model. The validation results are plotted in Fig. 8. Additionally, the performance of the developed model is assessed using the three indexes (Eqs. 14–16). As indicated in Fig. 8, the prediction results show minor errors compared to the actual values, and the MAPE, RMSE, and MAE values are 9.70 %, 3.98 kPa, and 2.74 kPa, respectively. The RMSE value can reflect the extreme errors, and the calculated RMSE value can indicate that there are no extreme values observed in the prediction results. MAPE reflects the error percentage between the measured and predicted values, and the model is more reliable if the MAPE is closer to 0. Therefore, it can be concluded that this model performed well in predicting the volume of a future debris-flow event.
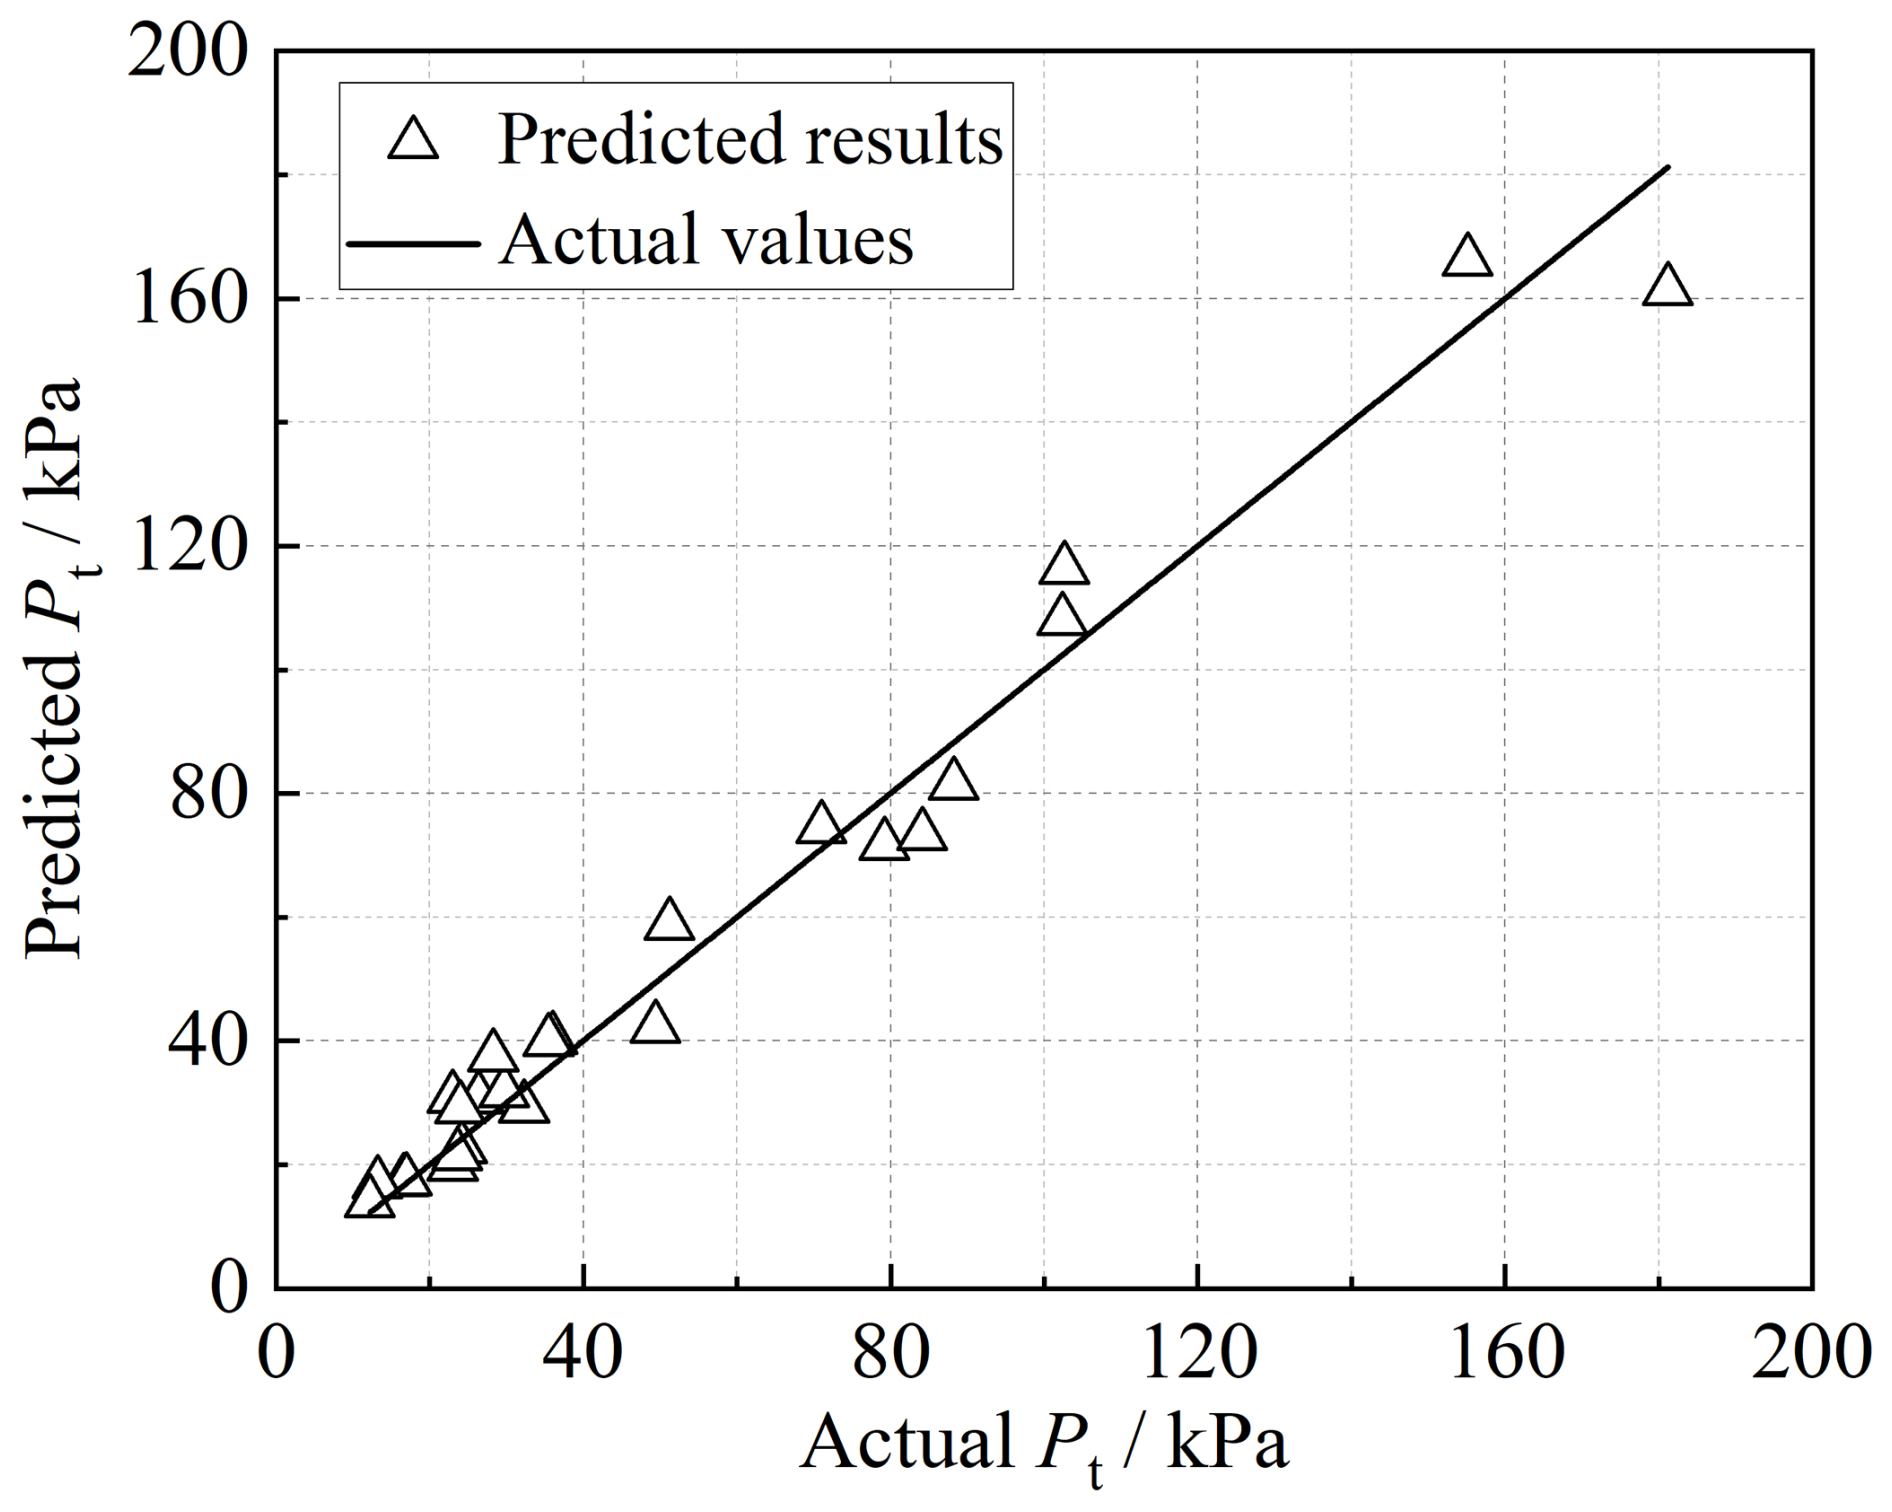
Figure 8Deviations between the prediction results (hollow triangles) estimated by the machine learning model and actual values (straight line).
4.1 Geological setting
We selected the Longxihe Basin (Fig. 9) in Dujiangyan, Sichuan Province, to conduct a case study (see Fig. 1 for the geographic location of this area), 15 km away from the epicentre of the 2008 Wenchuan earthquake (also called the Sichuan earthquake). There are three faults crossing this area, namely the southern branch of the Yingxiu–Beichuan Fault, the northern branch of the Yingxiu–Beichuan Fault, and the Feilaifeng Structure. They cause incised valleys and uplifting of the land surface, resulting in large areas of exposed rocks. Additionally, this study area belongs to a subtropical monsoon climate, with annual precipitation reaching 1134.8 mm. Over 80 % of the annual rainfall occurs from May to September. Consequently, the abundant rainfall and complex geological structure give birth to frequent debris flows. It was reported that 13 debris-flow events occurred in this basin on 12 May, 24 June, and 25 September 2008 and 17 July 2009. In particular, 45 debris-flow events were recorded on 13 August 2010 due to a high-intensity rainfall event, causing severe damage to 233 buildings and resulting in a total economic loss of EUR 7.2×10⁷ (Yu et al., 2011). One town and two villages are distributed in this basin. The impacts of the Wenchuan earthquake still pose threats to the local people because it is expected that debris flows following the earthquake will occur for at least 20 years (Yu et al., 2014).
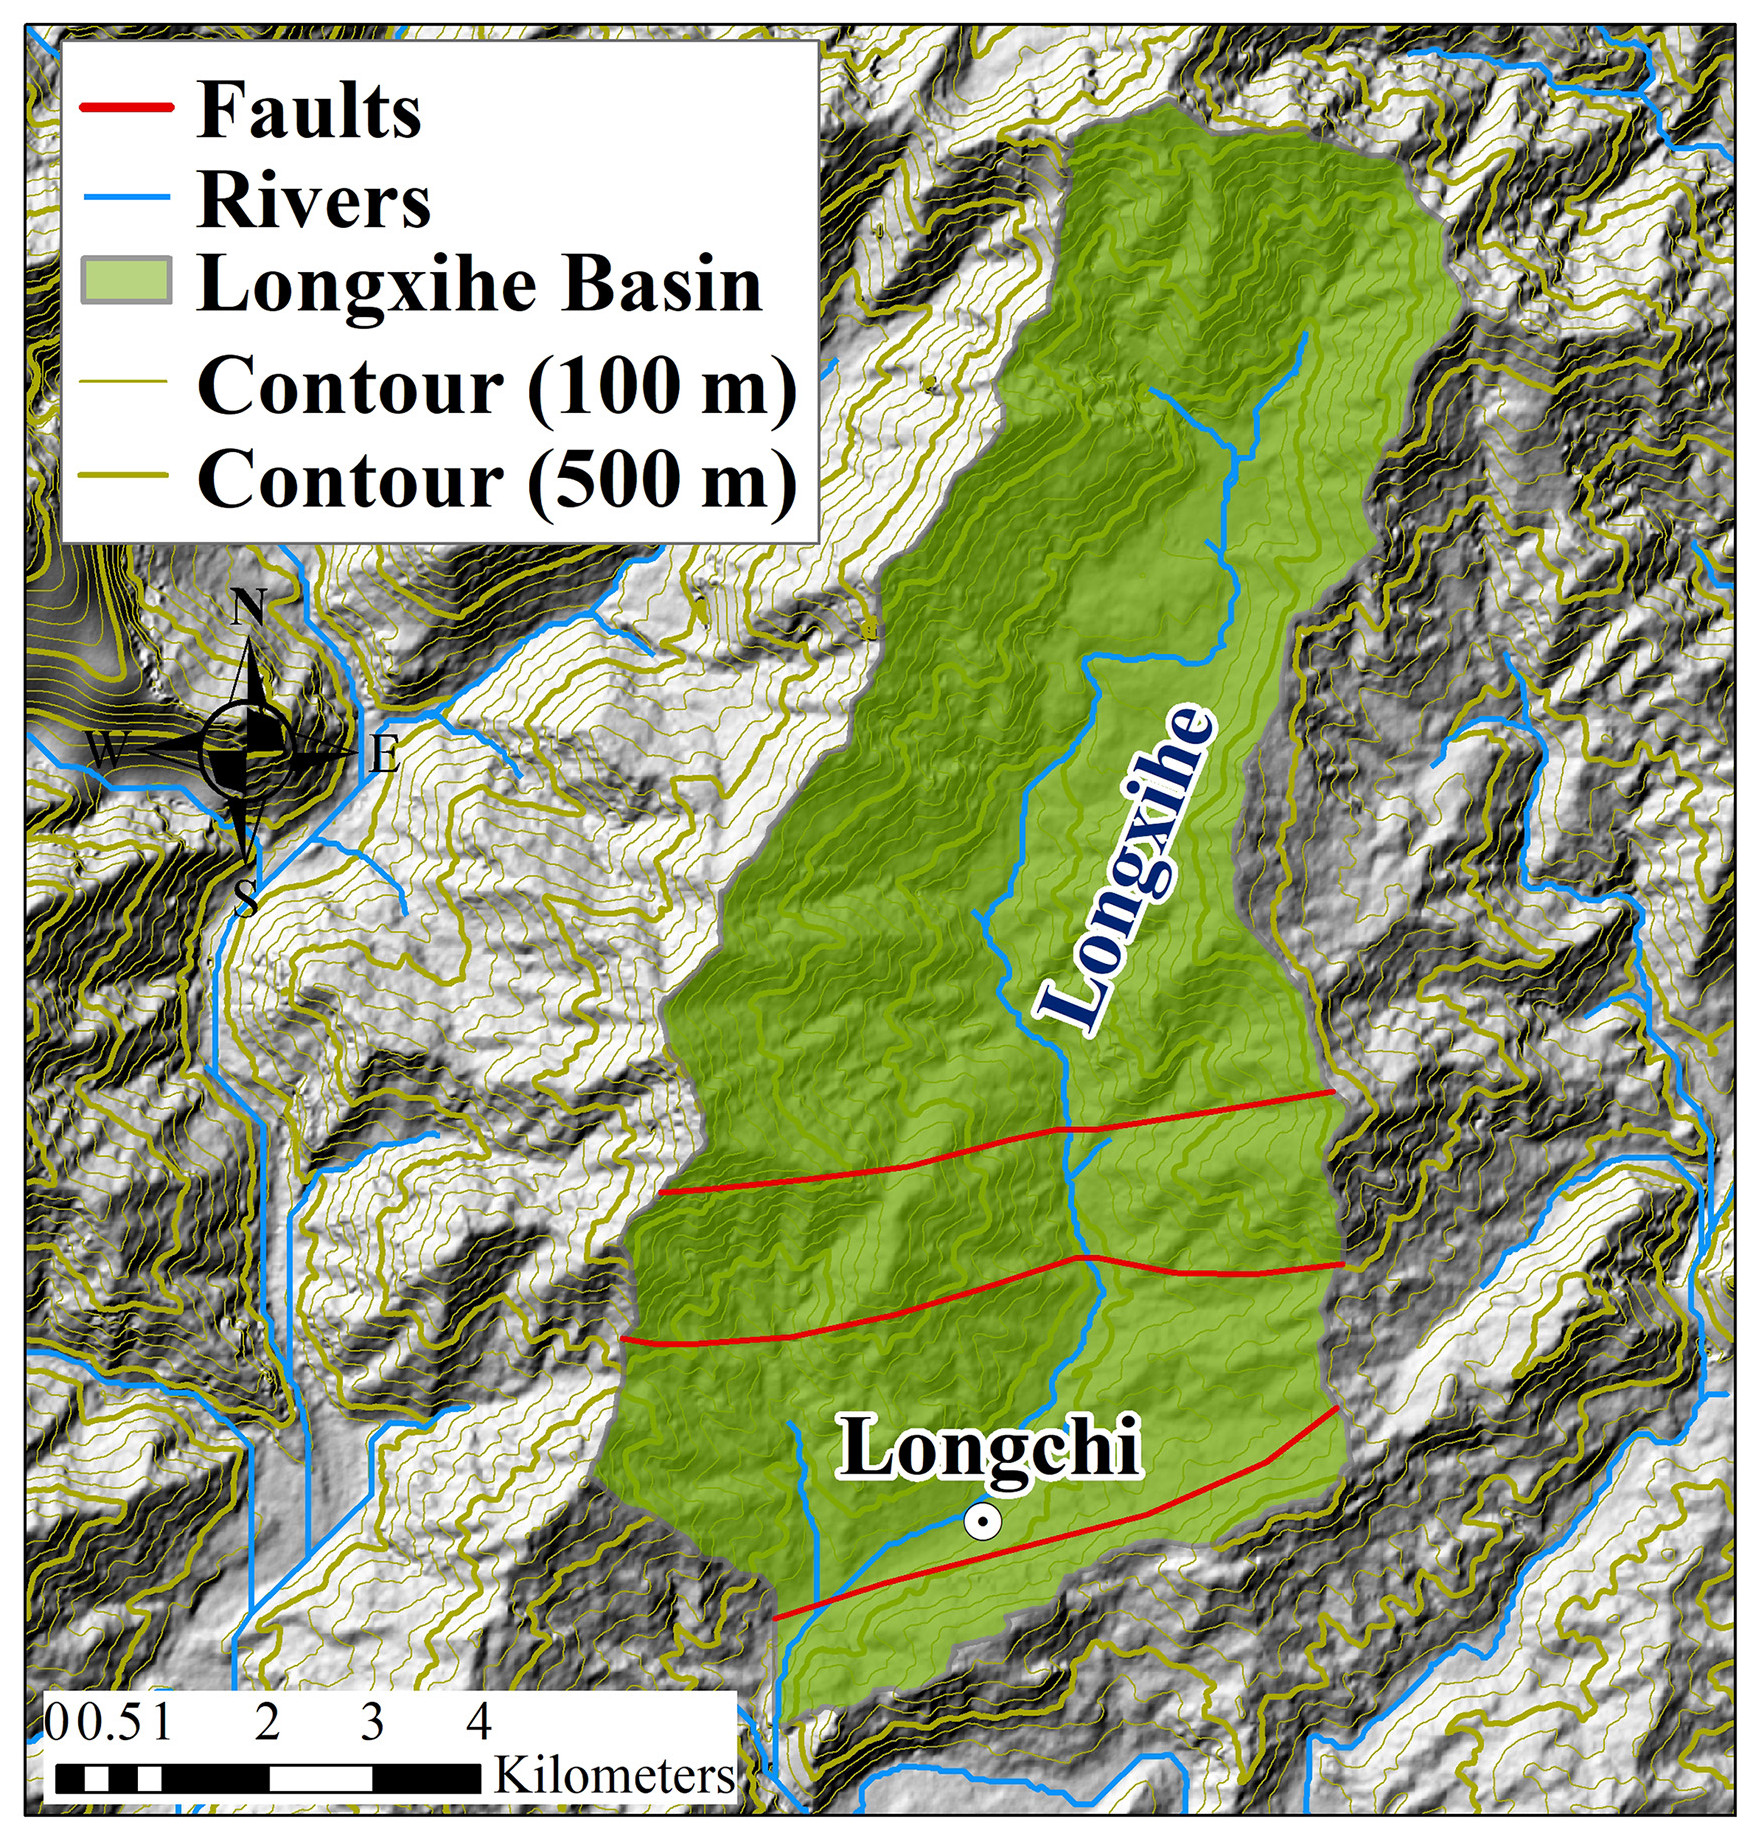
Figure 9The Longxihe Basin located in the north-western part of Dujiangyan, China, with a total area of 70.56 km2 and elevation ranging from 794 m to 3245 m.
4.2 Estimation of economic loss associated with buildings
4.2.1 Determination of physical vulnerability
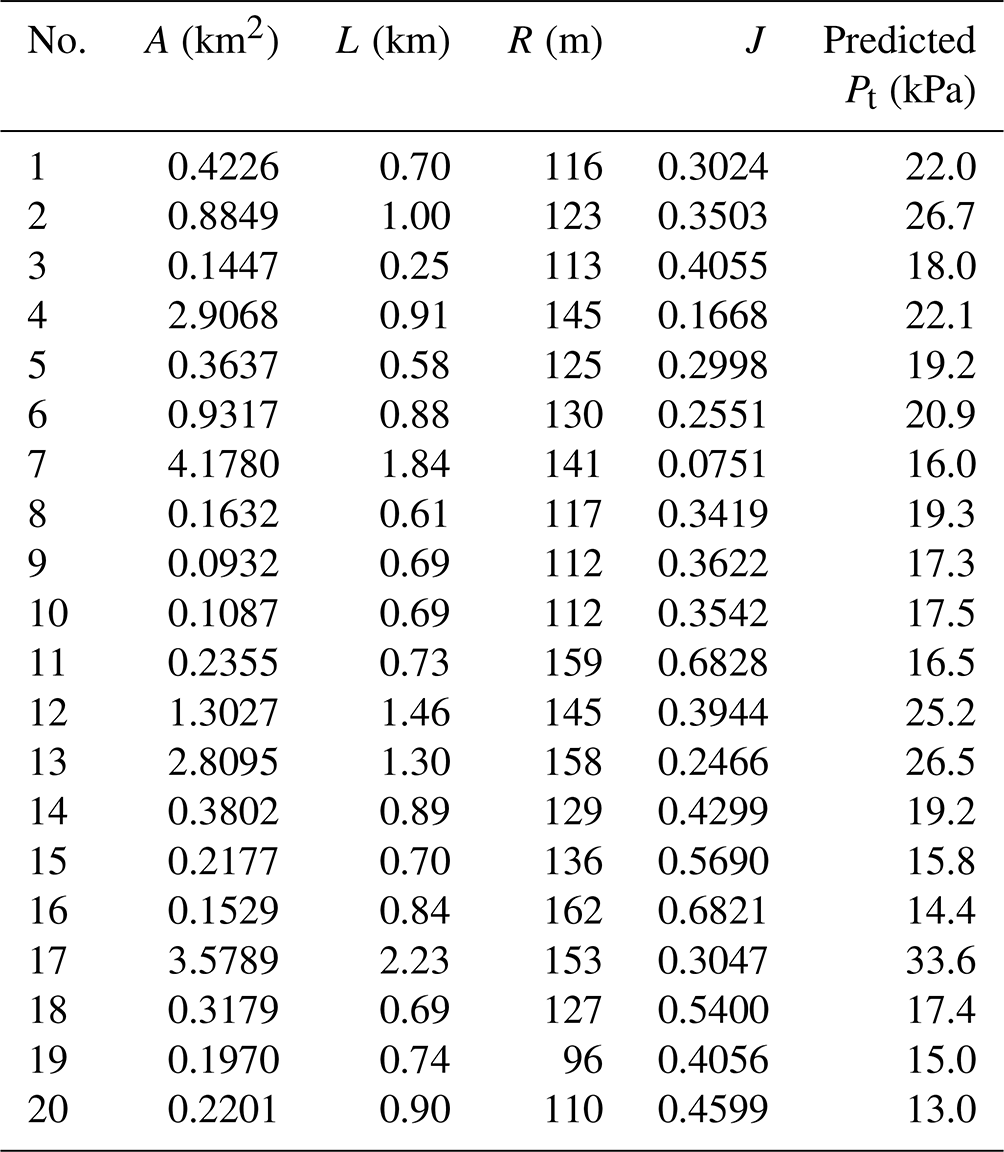
To estimate the potential physical damage of the buildings in the Longxihe Basin, the developed prediction model was applied to predict the potential impact pressure on buildings. As illustrated in Fig. 10c, the debris-flow catchments within this basin were generated. We mainly focus on the regions with buildings and estimate the possible economic loss associated with the buildings when debris flows occur. Therefore, we extracted a total of 386 buildings in three regions based on the Gaofen-2 satellite images (Fig. 10a, b, d, and e). After that, we selected the catchments that are the nearest to the buildings to conduct analysis (see catchments marked with red lines in Fig. 10c). The input information for these catchments for impact pressure prediction and the predicted results are all listed in Table 3.
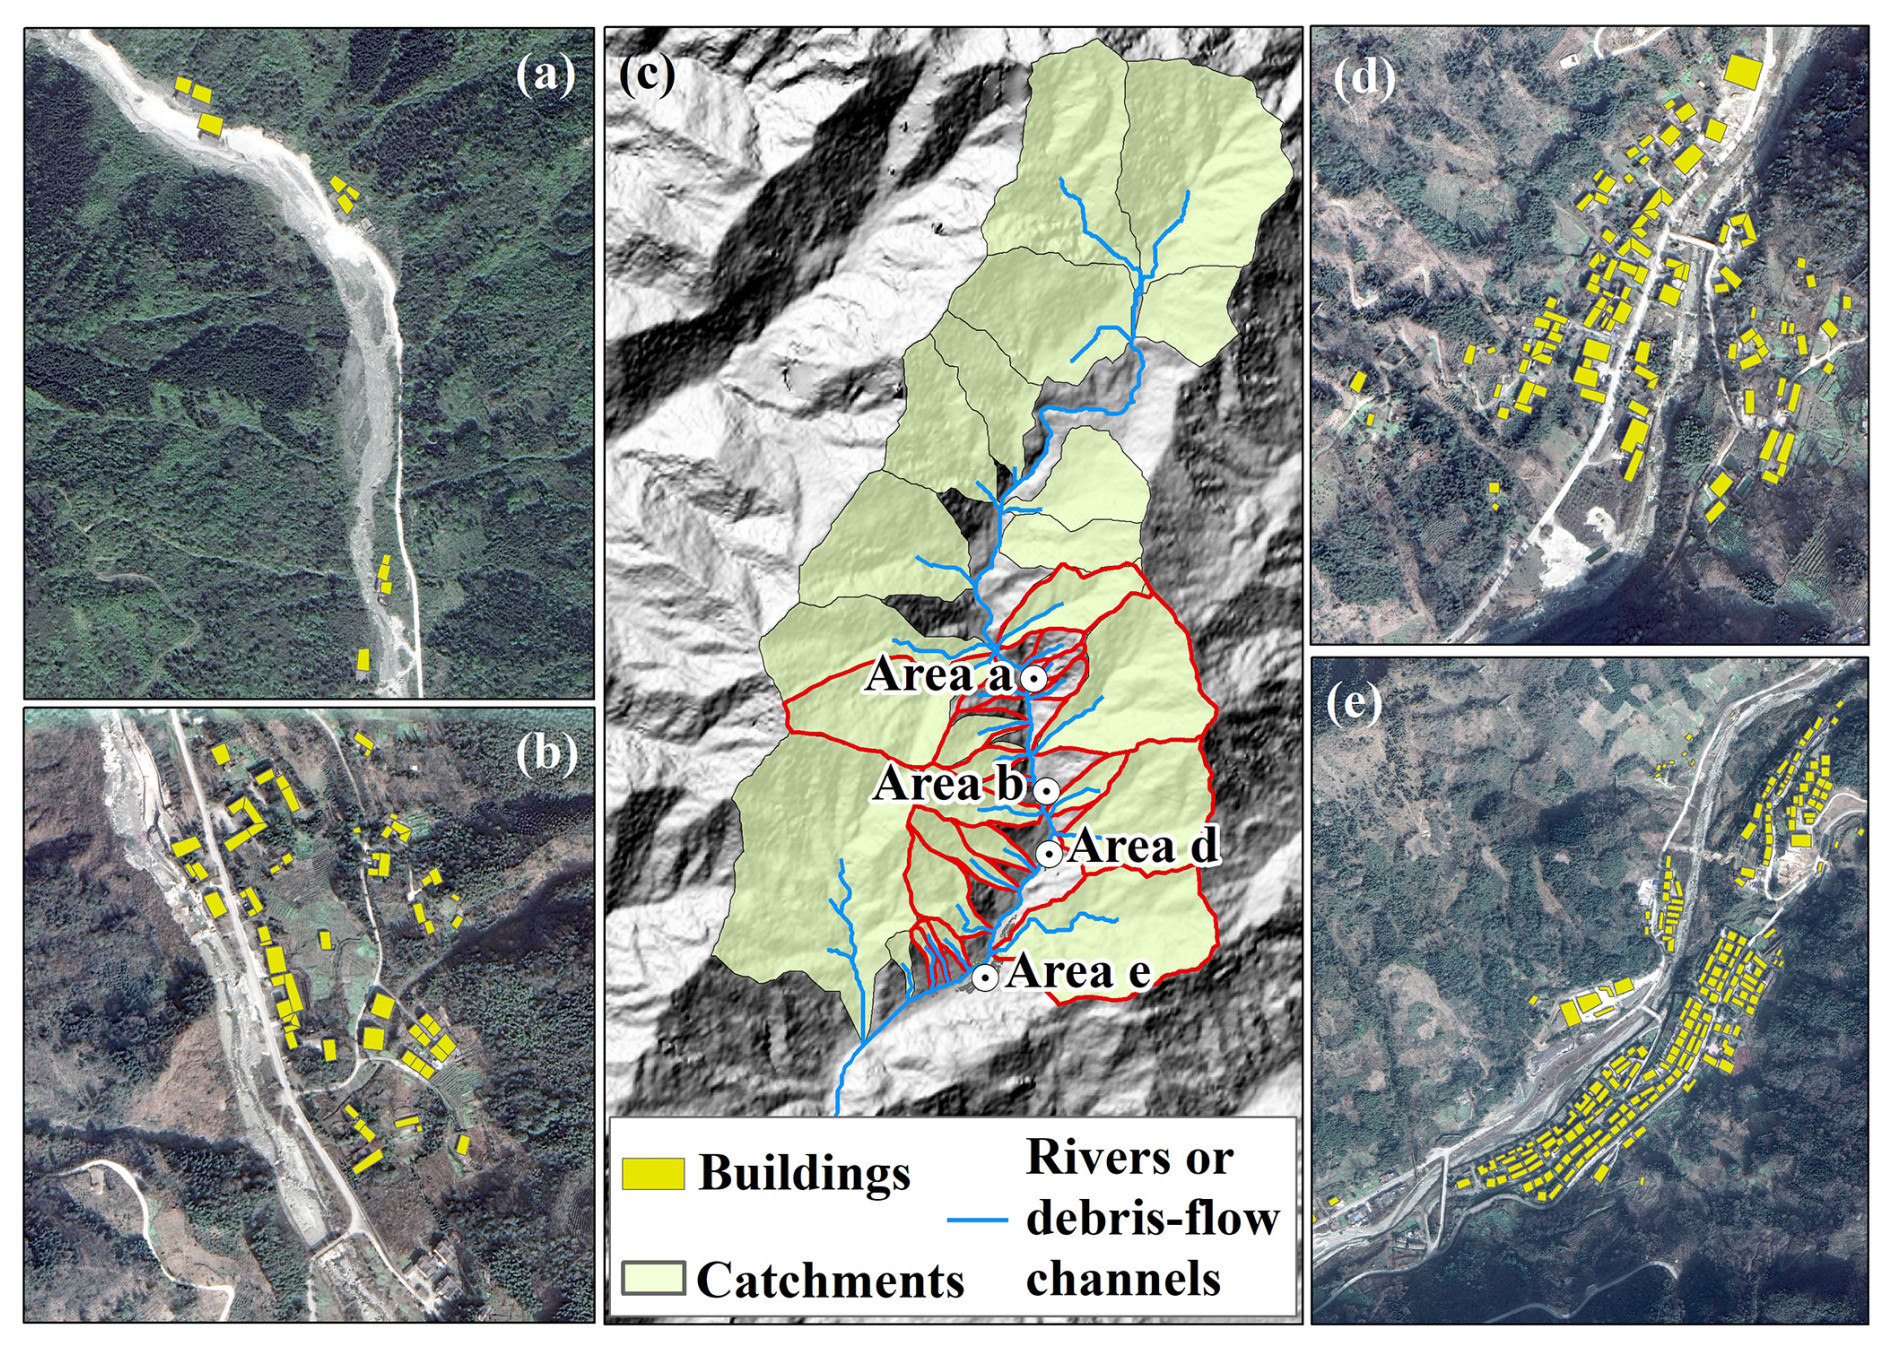
Figure 10(a, b, d, e) Residential areas in the Longxihe Basin with highlighted buildings and (c) the debris-flow catchments that were prepared for the establishment of the impact pressure estimation model for future debris flows.
In addition to the predicted impact pressures to the buildings by the potential debris flows, the horizontal and vertical distances between each building and the nearest debris-flow channel were measured using a GIS. As a result, the physical vulnerabilities of the buildings in Longxihe Basin can be decided based on the proposed physical vulnerability matrix, and the results are shown in Fig. 11a–d.
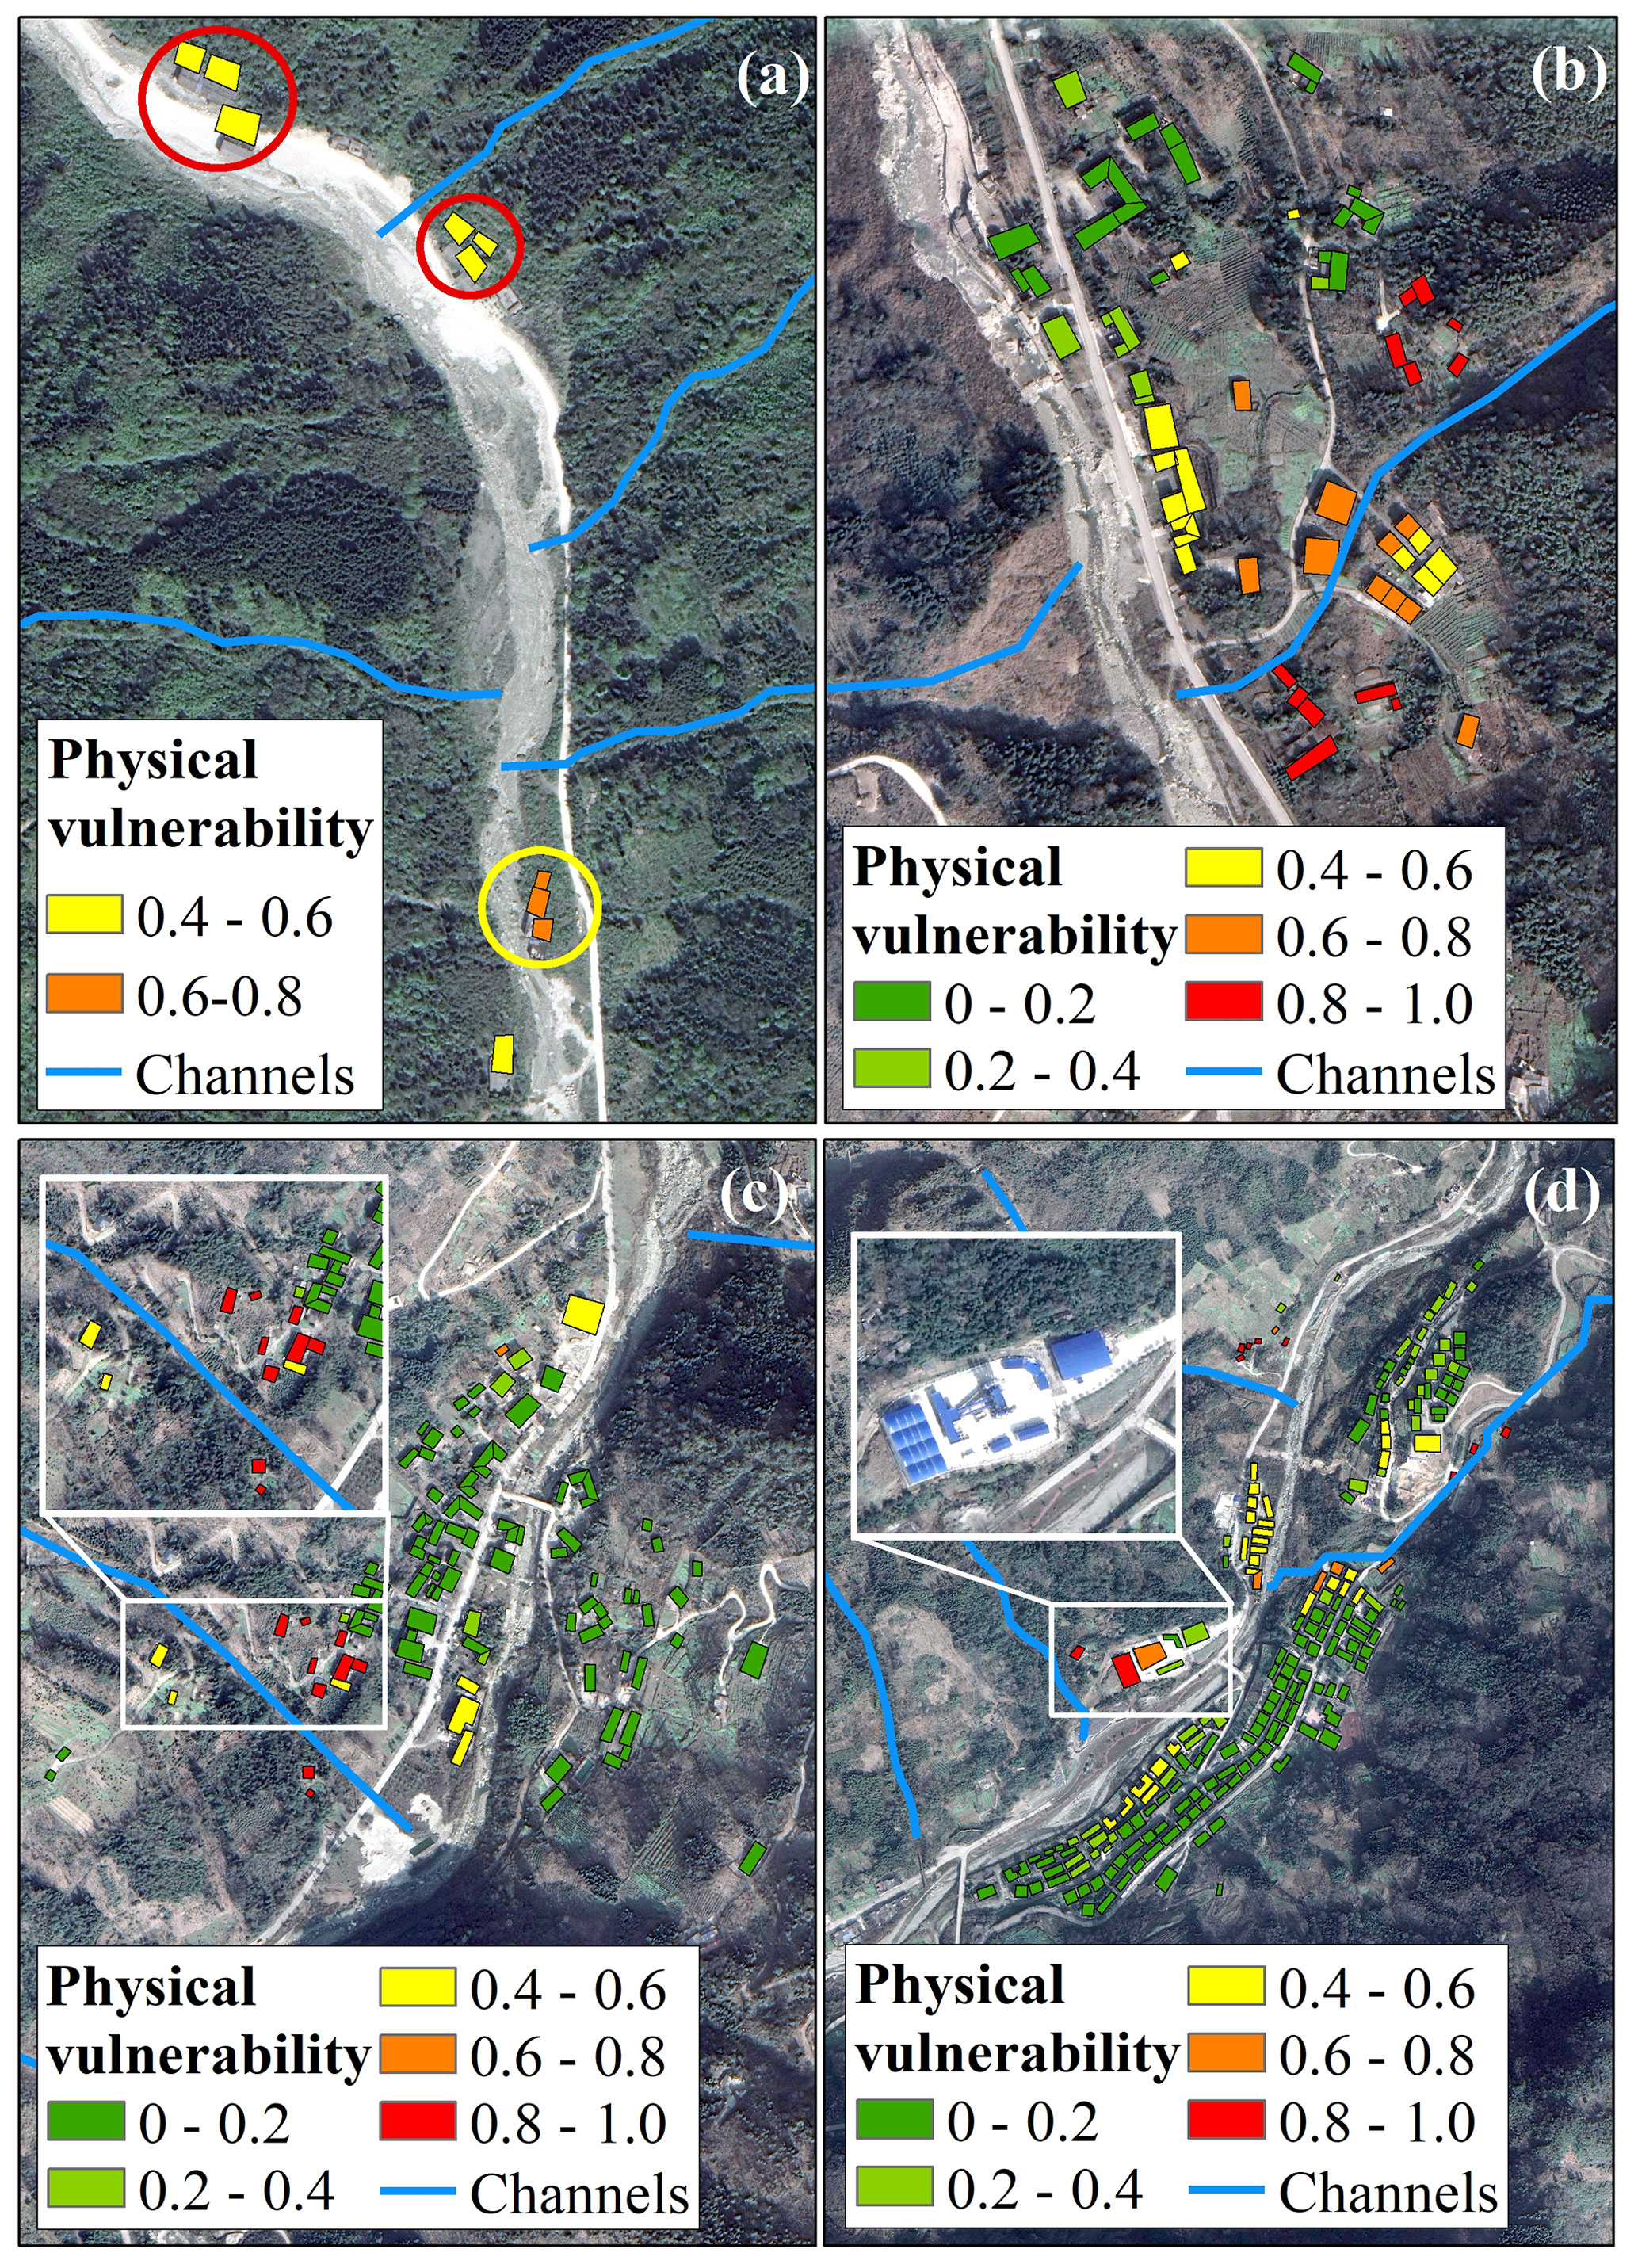
Figure 11(a–d) Physical vulnerabilities of the buildings for residential areas of the Longxihe Basin corresponding to Fig. 10a, b, d, and e.
Table 4Statistical results of the buildings with different physical vulnerabilities.
The statistical results in Table 4 illustrate that most buildings suffer nearly no damage when a debris-flow event occurs. This is because these buildings are RC frame structures, which allow them to remain undamaged or only suffer slight damage even though they are close to the debris-flow channels. However, non-RC frame buildings may always suffer severe damage during a debris-flow event if their locations are near the channels. As indicated in Fig. 11a–d, the buildings with high and very high physical vulnerabilities are mainly brick and light steel structures. The difference in resistance ability allows a greater possibility for RC frame buildings to remain undamaged during the same debris-flow event when compared to a non-RC building, which is consistent with the field investigation results illustrated in Fig. 4b. Moreover, a non-RC frame building can also avoid damage even though it is close to the debris-flow channel. This is because a higher vertical distance to the debris-flow channel can allow this non-RC building to suffer no damage or light damage. Therefore, a comprehensive analysis that considers the structure type, spatial distances to the debris-flow channel, and potential impact pressure is significant in establishing a reliable physical vulnerability matrix to benefit the determination of the potential damage degree for buildings.
In order to validate the efficiency and accuracy of our method in estimating the physical damage to buildings, the damaged buildings caused by debris flows on 13 August 2010 are employed here. As depicted in Fig. 12a, the RC frame buildings suffer moderate damage (see red circles in Fig. 11a) because there was no obvious damage of external or internal walls observed during the field investigations based on the HAZUS building classification scheme (Rojahn, 1988). However, the debris-flow event caused extensive damage (see yellow circle in Fig. 11a) to the brick structures due to the partly destroyed external or internal walls (Fig. 12b). As a result, evacuation of people was necessary and reconstruction was required. Overall, our proposed method can provide a reliable evaluation of the physical vulnerability of buildings caused by a debris-flow event and therefore benefit the estimation of economic loss.
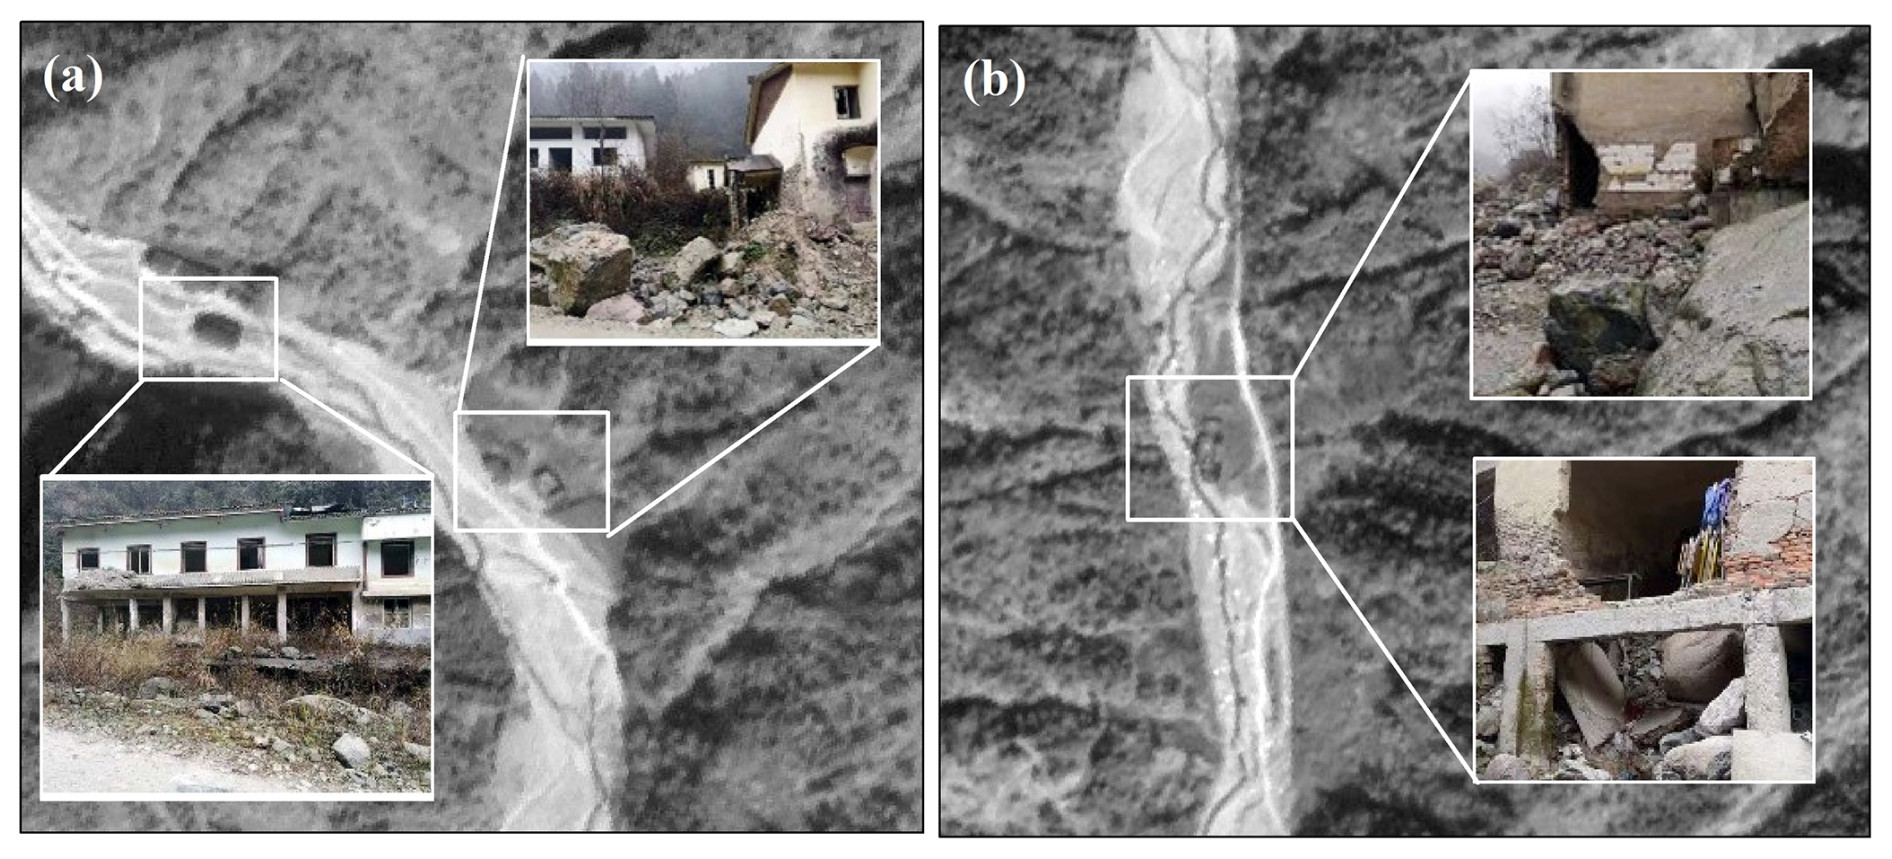
Figure 12(a) The RC frame buildings which suffered moderate damage with no obvious damage of external and internal walls caused by a debris-flow event on 13 August 2010 and (b) extensive damage to brick buildings (non-RC frame structure) observed during the same debris-flow event.
4.2.2 Economic loss
Based on the estimated physical damage, we can further provide a reliable estimation of the economic loss. Six categories of buildings were identified in this study area based on the field investigations. They are residential buildings (divided into RC frame and brick structure), business buildings, factory buildings, office buildings, and livestock houses.
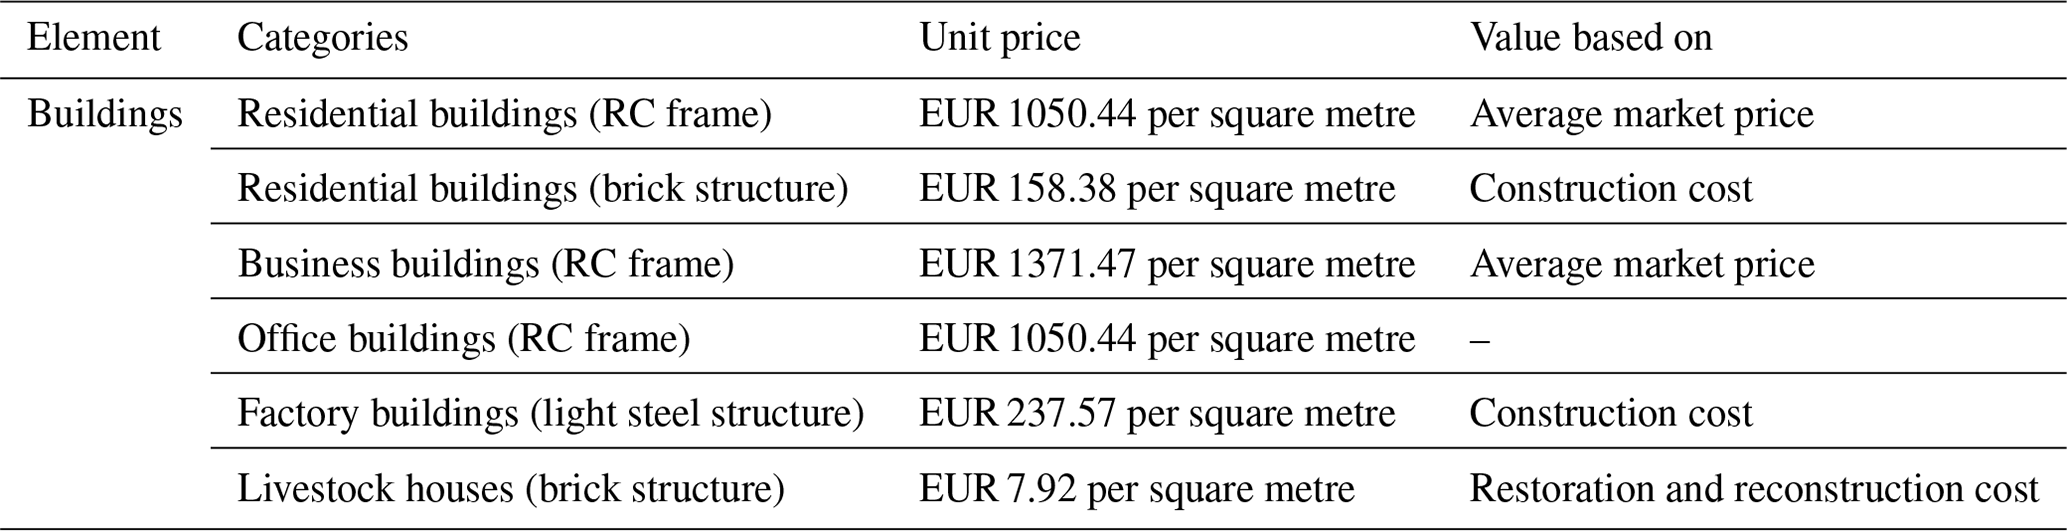
The economic value of a residential building in this area is based on the market price, which is provided by the Housing and Urban-rural Construction Agency. As for the unit price of a business building, we refer to the price ratio of a residential building and a business building in the city centre of Dujiangyan. The unit price of a business building is normally 30 % higher than that of a residential building. An office building belongs to national assets, which cannot be rented or sold. However, possible damage still cannot be avoided if a debris-flow event occurs, and restoration or reconstruction might be required. Therefore, we refer to the unit price of a residential building to estimate the economic loss of an office building. Unlike the high construction cost and business value of a residential building and a business building, the construction cost of a factory building is low because of its light steel structure. Meanwhile, this kind of building is normally situated at a distance from the city centre and residential areas, primarily to mitigate effects of noise and environmental pollution. Most importantly, a factory building invariably occupies a large area, potentially raising the construction cost when situated in the city centre due to exorbitant land prices. Considering the average market price of a factory building, we set the unit price as EUR 237.57 per square metre. Finally, livestock houses are considered here since two villages are included in the analysis where livestock houses have been built for sheep and cattle. The unit price of a livestock building is low (see Table 5). The economic loss associated with the buildings in the Longxihe Basin is presented in Fig. 13.
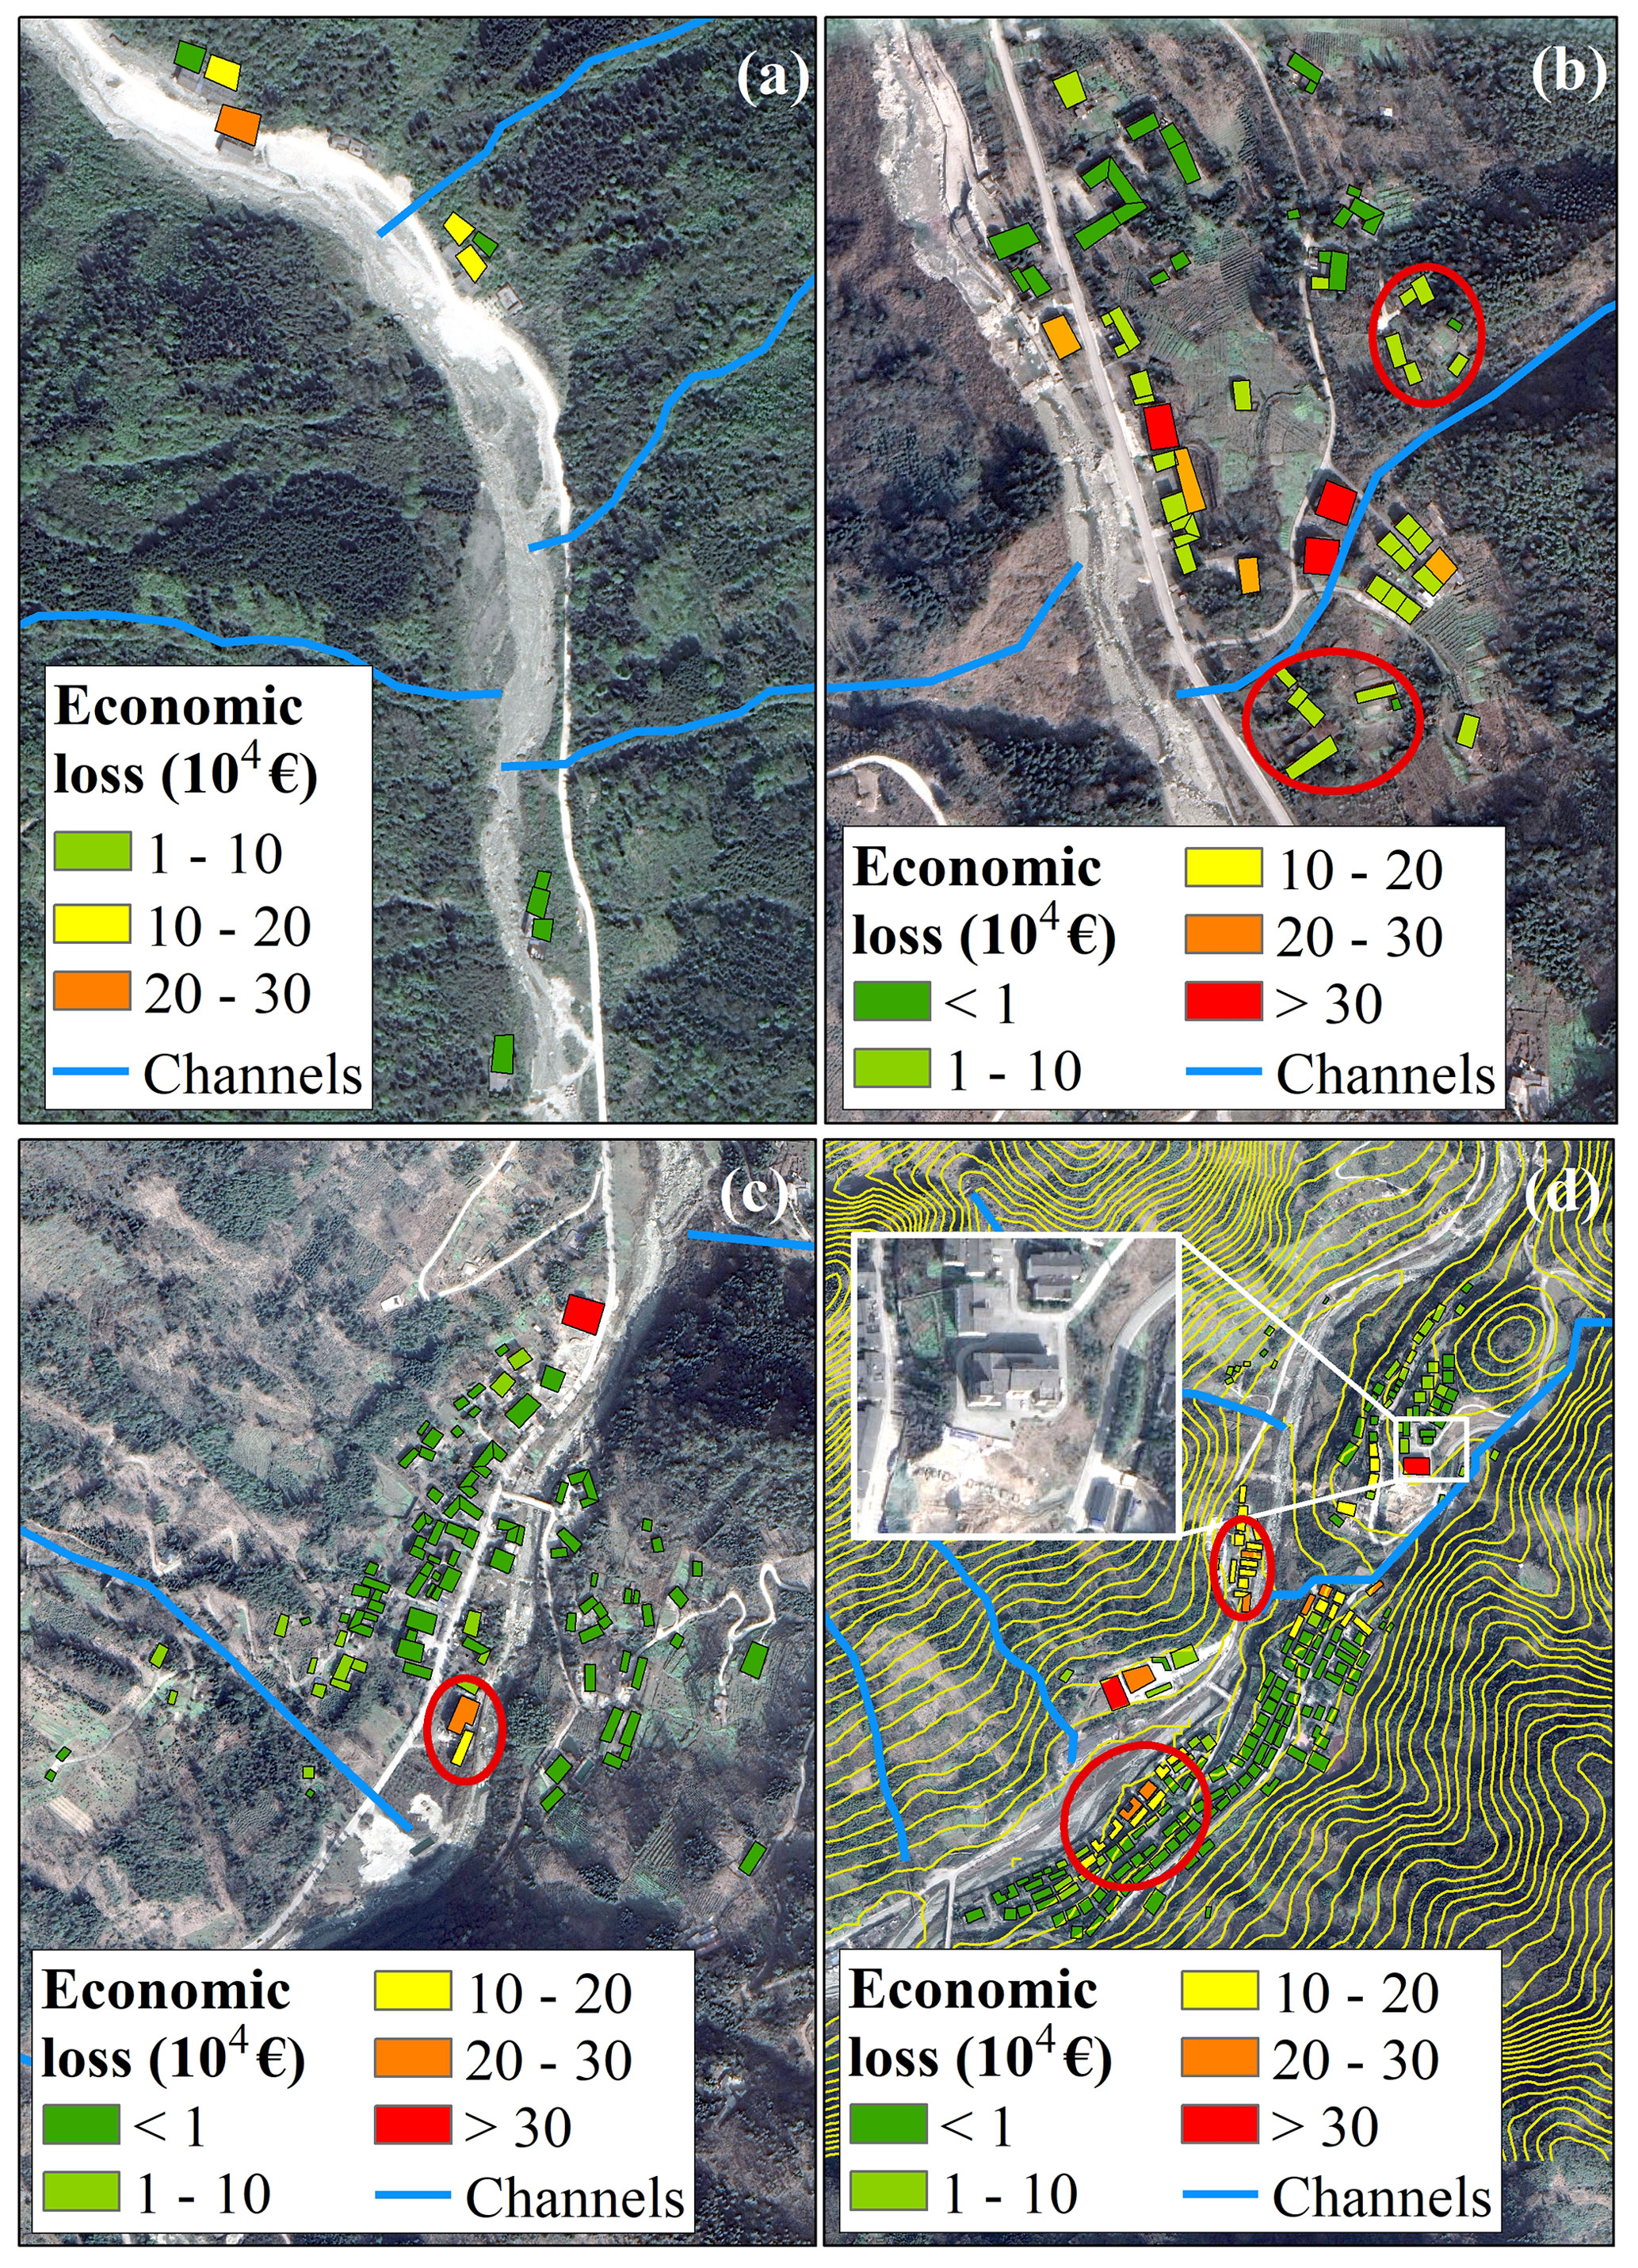
Figure 13(a–d) Estimated economic loss of the buildings for residential areas of the Longxihe Basin corresponding to Fig. 10a, b, d, and e.
The distribution characteristics of economic loss are different from physical vulnerability. For example, Fig. 11a illustrates that the buildings are more likely to suffer severe damage if they are close to the debris-flow channel, especially the non-RC frame structures. However, these non-RC frame buildings require lower reconstruction or restoration costs when compared to the RC frame buildings (see Fig. 13a). In this case, the economic loss is low since it relies on the multiplication of physical vulnerability and economic value of a building (see red circles in Fig. 13b). As indicated in Fig. 13d, the factory buildings (see Figs. 11d and 13d) may suffer an economic loss of EUR 3.2×10⁵. As for the reason why a low unit price of a factory building (see Table 5) results in a high economic loss may be due to the large area of this factory building. Therefore, the site selection of a factory building is significant. Although the location of the factory buildings in mountainous areas can avoid noise pollution in urban development and decrease construction costs, the possible economic loss caused by natural hazards cannot be neglected. Additionally, the residential building should not be built on the outlet of the debris-flow catchment directly opposite (see red circles in Fig. 13d), especially when the foundation of the residential buildings is only slightly higher than the riverway (see yellow contours in Fig. 13d). For example, the highest economic loss is found for a residential building (see Fig. 13d), reaching EUR 5.1×10⁵. Therefore, residential building (RC frame) foundations of at least 4 m depth are essential if the buildings are close to the debris-flow channel (based on Table 2). Overall, the analysis of economic loss for buildings in mountainous areas can provide decision-makers with guidance about urban planning.
The proposed integrated method has been applied for the determination of the damage degree for buildings in the Longxihe Basin, Sichuan, China. The involvement of debris-flow intensities, building attributes, and spatial position between the buildings and debris-flow channel can help to suggest a more reasonable damage degree value caused by debris flows. Specifically, the debris-flow intensity is expressed in impact pressure here, which can indicate the possible consequence of a building if the flowing materials strike the building directly. However, an overestimation of the damage degree may be caused since the spatial positions between the building and debris-flow channel do not constitute a one-dimensional problem. In general, the elevation of a building is greater than that of the debris-flow channel in the horizontal direction. This is because the long-term water flow and historical debris flows move the soils and rocks, causing erosion of the channel bottom and therefore decreasing its elevation. As a result, the elevation difference between the buildings and the debris-flow channel could cause a loss of impact pressure. Therefore, simply utilizing impact pressure is not enough to reflect the actual damage to a building. In contrast, the introduction of HD and VD is an effective supplement to improve the estimation of physical damage that the buildings may suffer. Furthermore, the damage degree may vary when subjected to different building structures. In this case, two major types of buildings are considered in this study to distinguish the impact resistance capacities of different building types. Overall, this developed matrix comprehensively describes the factors impacting the damage degree for buildings caused by debris flows.
By utilizing the proposed matrix, we can estimate the damage degree for a building. However, the possible damage in future scenarios is still unclear due to the change in debris-flow magnitude. Therefore, an ensemble machine learning (ML) model is used to predict the volume of a future debris-flow event so that the debris-flow intensities can be calculated based on empirical relationships. This ML method can effectively avoid over-fitting when training prediction models due to the existence of a regular term. Most importantly, the strong ability to establish a reliable relationship between a group of independent variables and a dependent variable enables a wider application of ML methods when compared to empirical and regression methods. Therefore, a precise prediction can be expected based on the established relationship using the ML method to indicate the potential damage to buildings caused by a future debris-flow event. However, we are also aware that the current sample size may not support robust performance in estimating impact pressure on buildings. For broader applications, continuous input of debris-flow data globally is essential, which may be beyond the scope of this study. However, further improvement can also be achieved if the floors of buildings are considered when developing the physical vulnerability matrix. This is because the degree of loss presents a negative correlation with the number of floors (Fuchs et al., 2019). Nevertheless, the limitation cannot alter the fact that our work can benefit the subdivision of buildings into different vulnerability levels and provide suggestions about the site selection of future residential areas.
In this paper, an integrated method for vulnerability assessment of buildings caused by future debris flows was proposed. This method includes a physical matrix and a machine learning model, in which this matrix was developed by considering the debris-flow process, building structure, and spatial positions between the buildings and debris-flow channels. To be more specific, the debris-flow process is represented by impact pressure (Pt), which can be estimated based on the debris-flow volume through field investigations. As for the definition of spatial positions, HD and VD are used to describe the position relation between the buildings and the debris-flow channel. By combining the three parameters, the actual impact pressure on the buildings can be decided. However, the damage degree may vary for different building structures. Therefore, the building structure is further considered to provide a precise estimation of the buildings, including the RC frame and non-RC frame (brick structure, light steel structure, and masonry structure). Therefore, a total of six types of buildings are included in this study. They are residential buildings (divided into RC frame and brick structure), business buildings (RC frame), office buildings (RC frame), factory buildings (light steel structure), and livestock houses (brick structure). At the same time, an ML model (XGBoost) was developed to predict the impact pressure on buildings caused by future debris flows. On the basis of the proposed physical vulnerability matrix and machine learning model, we selected the Longxihe Basin, Sichuan, China, to conduct a case study. The results show that the non-RC buildings may be more likely to suffer severe damage if they are close to the debris-flow channels. The buildings with high and very high physical vulnerabilities are mainly brick and light steel structures. The factory buildings bear the highest economic loss, reaching EUR 2.41×10⁵ due to their large area. In addition, severe economic loss may occur if the buildings are located directly opposite the outlet of the debris-flow catchment. Overall, our studies can achieve a reliable assessment of the physical damage and corresponding economic loss of buildings and therefore provide suggestions and scientific support for the future construction planning of buildings.
The mechanism of XGBoost is to constantly develop a new decision tree which acts as a weak learner and fits the residual error of the last prediction. After the training of a total of k trees, the final prediction result is the sum of the score of each leaf node in each developed tree. The target function of regression in XGBoost is
where represents the loss function and is the regularization term. and yi are prediction value and true value, respectively. m is the number of samples. fk is the kth tree model. As mentioned above, the newly generated tree needs to fit the residual error of the last prediction, and therefore the prediction result can be presented as
Equation (A3) is substituted into Eq. (A2) to rewrite the objective function as
Furthermore, Taylor's second-order expansion is introduced to find fk to minimize the objective function:
where gi is the first derivation and hi represents the second derivation.
Table B1Dataset II for developing the impact pressure prediction model.
All raw data will be provided on request.
CQ: methodology, software, data curation, writing (original draft preparation). XG: conceptualization, visualization, validation, supervision, writing (review and editing).
The contact author has declared that neither of the authors has any competing interests.
Publisher's note: Copernicus Publications remains neutral with regard to jurisdictional claims made in the text, published maps, institutional affiliations, or any other geographical representation in this paper. While Copernicus Publications makes every effort to include appropriate place names, the final responsibility lies with the authors.
We appreciate the support from the Institute of Mountain Hazards and Environment, CAS, China, for the data collection.
This research has been supported by EU Horizon 2020 (grant no. 778360).
This paper was edited by Oded Katz and reviewed by three anonymous referees.
Alene, G. H., Irshad, S., Moraru, A., Depina, I., Bruland, O., Perkis, A., and Thakur, V.: Virtual reality visualization of geophysical flows: A framework, Environ. Modell. Softw., 177, 106063, https://doi.org/10.1016/j.envsoft.2024.106063, 2024.
Bründl, M., Romang, H. E., Bischof, N., and Rheinberger, C. M.: The risk concept and its application in natural hazard risk management in Switzerland, Nat. Hazards Earth Syst. Sci., 9, 801–813, https://doi.org/10.5194/nhess-9-801-2009, 2009.
Chang, M., Tang, C., Zhang, D. D., and Ma, G. C.: Debris flow susceptibility assessment using a probabilistic approach: A case study in the Longchi area, Sichuan province, China, J. Mt. Sci., 11, 1001–1014, https://doi.org/10.1007/s11629-013-2747-9, 2014.
Chang, M., Tang, C., Ni, H., and Qu, Y.: Evolution process of sediment supply for debris flow occurrence in the Longchi area of Dujiangyan City after the Wenchuan earthquake, Landslides, 12, 611–623, https://doi.org/10.1007/s10346-015-0571-8, 2015.
Chen, T. and Guestrin, C.: XGBoost: A scalable tree boosting system, Proc. ACM SIGKDD Int. Conf. Knowl. Discov. Data Min., 13–17 August, 785–794, https://doi.org/10.1145/2939672.2939785, 2016.
Creutin, J. D., Muste, M., Bradley, A. A., Kim, S. C., and Kruger, A.: River gauging using PIV techniques: A proof of concept experiment on the Iowa River, J. Hydrol., 277, 182–194, https://doi.org/10.1016/S0022-1694(03)00081-7, 2003.
Cui, P., Xiang, L. Z., and Zou, Q.: Risk assessment of highways affected by debris flows in Wenchuan earthquake area, J. Mt. Sci., 10, 173–189, https://doi.org/10.1007/s11629-013-2575-y, 2013.
Dai, F. C., Lee, C. F., and Ngai, Y. Y.: Landslide risk assessment and management: An overview, Eng. Geol., 64, 65–87, https://doi.org/10.1016/S0013-7952(01)00093-X, 2002.
de Haas, T. and Densmore, A. L.: Debris-flow volume quantile prediction from catchment morphometry, Geology, 47, 791–794, https://doi.org/10.1130/G45950.1, 2019.
Fell, R.: Landslide risk assessment and acceptable risk, Can. Geotech. J., 31, 261–272, https://doi.org/10.1139/t94-031, 1994.
Fuchs, S.: Susceptibility versus resilience to mountain hazards in Austria – paradigms of vulnerability revisited, Nat. Hazards Earth Syst. Sci., 9, 337–352, https://doi.org/10.5194/nhess-9-337-2009, 2009.
Fuchs, S., Keiler, M., Ortlepp, R., Schinke, R., and Papathoma-Köhle, M.: Recent advances in vulnerability assessment for the built environment exposed to torrential hazards: Challenges and the way forward, J. Hydrol., 575, 587–595, https://doi.org/10.1016/j.jhydrol.2019.05.067, 2019.
Guzzetti, F., Stark, C. P., and Salvati, P.: Evaluation of flood and landslide risk to the population of Italy, Environ. Manage., 36, 15–36, https://doi.org/10.1007/s00267-003-0257-1, 2005.
Huang, J., Hales, T. C., Huang, R., Ju, N., Li, Q., and Huang, Y.: A hybrid machine-learning model to estimate potential debris-flow volumes, Geomorphology, 367, 107333, https://doi.org/10.1016/j.geomorph.2020.107333, 2020.
Immerzeel, W. W., Lutz, A. F., Andrade, M., Bahl, A., Biemans, H., Bolch, T., Hyde, S., Brumby, S., Davies, B. J., Elmore, A. C., and Emmer, A.: Importance and vulnerability of the world's water towers, Nature, 577, 364–369, https://doi.org/10.1038/s41586-019-1822-y, 2020.
Institute of Mountian Hazards and Environment (IMHE): Flood, Debris flow, landslide hazard and control, Science Publications, ISBN 7030045157, 1994 (in Chinese).
Jakob, M., Stein, D., and Ulmi, M.: Vulnerability of buildings to debris flow impact, Nat. Hazards, 60, 241–261, https://doi.org/10.1007/s11069-011-0007-2, 2012.
Jiang, H., Zou, Q., Zhu, Y., Li, Y., Zhou, B., Zhou, W., Yao, S., Dai, X., Yao, H., and Chen, S.: Deep Learning Prediction of Rainfall-driven Debris Flows Considering the Similar Critical Thresholds within Comparable Background Conditions, Environ. Modell. Softw., 179, 106130, https://doi.org/10.1016/j.envsoft.2024.106130, 2024.
Kang, H. and Kim, Y.: The physical vulnerability of different types of building structure to debris flow events, Nat. Hazards, 80, 1475–1493, https://doi.org/10.1007/s11069-015-2032-z, 2016.
Khosravi, K., Khozani, Z. S., and Mao, L.: A comparison between advanced hybrid machine learning algorithms and empirical equations applied to abutment scour depth prediction, J. Hydrol., 596, 126100, https://doi.org/10.1016/j.jhydrol.2021.126100, 2021.
Koch, T.: Testing various constitutive equations for debris flow modelling, IAHS-AISH Publ., 249–257, ISBN 1-901502-45-7, 1998.
Liu, S., Wei, L., and Hu, K.: Topographical and geological variation of effective rainfall for debris-flow occurrence from a large-scale perspective, Geomorphology, 358, 107134, https://doi.org/10.1016/j.geomorph.2020.107134, 2020.
Marcato, G., Bossi, G., Rivelli, F., and Borgatti, L.: Debris flood hazard documentation and mitigation on the Tilcara alluvial fan (Quebrada de Humahuaca, Jujuy province, North-West Argentina), Nat. Hazards Earth Syst. Sci., 12, 1873–1882, https://doi.org/10.5194/nhess-12-1873-2012, 2012.
Marchi, L., Comiti, F., Crema, S., and Cavalli, M.: Channel control works and sediment connectivity in the European Alps, Sci. Total Environ., 668, 389–399, https://doi.org/10.1016/j.scitotenv.2019.02.416, 2019.
Miao, C. and Liu, X.: Characterization of acceptable risk for debris flows in China: Comparison in debris-flow prone areas and nonprone areas, Int. J. Disast. Risk Re., 42, 101405, https://doi.org/10.1016/j.ijdrr.2019.101405, 2020.
Papathoma-Köhle, M., Gems, B., Sturm, M., and Fuchs, S.: Matrices, curves and indicators: A review of approaches to assess physical vulnerability to debris flows, Earth-Sci. Rev., 171, 272–288, https://doi.org/10.1016/j.earscirev.2017.06.007, 2017.
Paudel, B., Fall, M., and Daneshfar, B.: Gis-Based Assessment of Debris Flow Runout in Kulekhani Watershed, Nepal, Geotech Geol. Eng., 39, 2755–2775, https://doi.org/10.1007/s10706-020-01655-1, 2021.
Qiu, C., Su, L., Zou, Q., and Geng, X.: A hybrid machine-learning model to map glacier-related debris flow susceptibility along Gyirong Zangbo watershed under the changing climate, Sci. Total Environ., 818, 151752, https://doi.org/10.1016/j.scitotenv.2021.151752, 2022.
Qiu, C., Su, L., Bian, C., Zhao, B., and Geng, X.: An AI-based method for estimating the potential runout distance of post-seismic debris flows, Int. J. Disast. Risk. Sc., 15, 608–621, https://doi.org/10.1007/s13753-024-00575-5, 2024.
Quan Luna, B., Blahut, J., van Westen, C. J., Sterlacchini, S., van Asch, T. W. J., and Akbas, S. O.: The application of numerical debris flow modelling for the generation of physical vulnerability curves, Nat. Hazards Earth Syst. Sci., 11, 2047–2060, https://doi.org/10.5194/nhess-11-2047-2011, 2011.
Rickenmann, D.: Empirical relationships for debris flows, Nat. Hazards, 19, 47–77, https://doi.org/10.1023/A:1008064220727, 1999.
Rojahn, C.: Rapid visual screening of buildings for potential seismic hazards: A handbook, Federal Emergency Management Agency, ISBN 978-0160926747, 1988.
Ruggieri, S., Calò, M., Cardellicchio, A., and Uva, G.: Analytical-mechanical based framework for seismic overall fragility analysis of existing RC buildings in town compartments, Bull. Earthq. Eng., 20, 8179–8216, https://doi.org/10.1007/s10518-022-01516-7, 2022.
Ruggieri, S., Liguori, F. S., Leggieri, V., Bilotta, A., Madeo, A., Casolo, S., and Uva, G.: An archetype-based automated procedure to derive global-local seismic fragility of masonry building aggregates: META-FORMA-XL, Int. J. Disast. Risk Re., 95, 103903, https://doi.org/10.1016/j.ijdrr.2023.103903, 2023.
Santi, P. M., Hewitt, K., VanDine, D. F., and Barillas Cruz, E.: Debris-flow impact, vulnerability, and response, Nat. hazards, 56, 371–402, https://doi.org/10.1007/s11069-010-9576-8, 2011.
Sridharan, A., Gutjahr, G., and Gopalan, S.: Markov–Switching Spatio–Temporal Generalized Additive Model for Landslide Susceptibility, Environ. Modell. Softw., 173, 105892, https://doi.org/10.1016/j.envsoft.2023.105892, 2024.
Sturm, M., Gems, B., Keller, F., Mazzorana, B., Fuchs, S., Papathoma-Köhle, M., and Aufleger, M.: Understanding impact dynamics on buildings caused by fluviatile sediment transport, Geomorphology, 321, 45–59, https://doi.org/10.1016/j.geomorph.2018.08.016, 2018.
Wei, L., Hu, K., and Hu, X.: Rainfall occurrence and its relation to flood damage in China from 2000 to 2015, J. Mt. Sci., 15, 2492–2504, https://doi.org/10.1007/s11629-018-4931-4, 2018.
Wei, L., Hu, K., and Liu, J., Automatic identification of buildings vulnerable to debris flows in Sichuan Province, China, by GIS analysis and Deep Encoding Network methods, J. Flood Risk Manag., 15, 1–18, https://doi.org/10.1111/jfr3.12830, 2022.
Xie, H., Liu, W., Zhao, J., and Hu, K.: Characteristics of Tangjiagou debris flow in Shimian of Sichuan in July 14, 2012, J. Earth Sci. Environ., 35, 90–97, 2013.
Yu, B., Ma, Y., Zhang, J. N., Wu, Y. F., Zhang, H. H., Li, L., Chu, S. M., and Qi, X.: The group debris flow hazards after the Wenchuan earthquake in Longchi, Dujiangyan, Sichuan Province, J. Mt. Sci., 29, 738–746, 2011.
Yu, B., Wu, Y., and Chu, S.: Preliminary study of the effect of earthquakes on the rainfall threshold of debris flows, Eng. Geol., 182, 130–135, https://doi.org/10.1016/j.enggeo.2014.04.007, 2014.
Zanchetta, G., Sulpizio, R., Pareschi, M. T., Leoni, F. M., and Santacroce, R.: Characteristics of May 5–6, 1998 volcaniclastic debris flows in the Sarno area (Campania, southern Italy): relationships to structural damage and hazard zonation, J. Volcanol. Geotherm. Res., 133, 377–393, https://doi.org/10.1016/S0377-0273(03)00409-8, 2004.
Zhang, S., Zhang, L., Li, X., and Xu, Q.: Physical vulnerability models for assessing building damage by debris flows, Eng. Geol., 247, 145–158, https://doi.org/10.1016/j.enggeo.2018.10.017, 2018.
- Abstract
- Introduction
- Methodology
- Result analysis
- Case study
- Discussion
- Conclusions
- Appendix A: Mechanism of XGBoost
- Appendix B: Calculation results of impact pressure Pt
- Data availability
- Author contributions
- Competing interests
- Disclaimer
- Acknowledgements
- Financial support
- Review statement
- References