the Creative Commons Attribution 4.0 License.
the Creative Commons Attribution 4.0 License.
 | 20 Oct 2025
An updated, homogeneous, and declustered earthquake catalog for South Korea and neighboring regions
Soumya Kanti Maiti
The fundamental components for evaluating seismic hazards and forecasting earthquake events in a region include a complete and homogeneous earthquake catalog. Previously, a few studies were performed to combine earthquake databases from various sources to produce a unified earthquake catalog for the Korean Peninsula. To conduct seismic hazard assessments across these regions, this study proposes creating a comprehensive, up-to-date, and unified earthquake catalog for South Korea and its neighboring regions using data from multiple sources. We collected data from the Korea Meteorological Administration (KMA), the International Seismological Centre (ISC), and the Japan Meteorological Agency (JMA). The earthquake database covers the time period from 1905 to 2023, and the geographical area spans 31–43° N and 122–132.5° E. As creating a new earthquake catalog entails combining information from many earthquake record sources, we avoided duplication of occurrences that may arise during the integration process by carefully analyzing the timing and location criteria for each earthquake event. To unify the magnitude scale and produce a homogeneous earthquake catalog, both global and regional empirical equations were used to convert the moment magnitude (Mw) and other reported magnitude scales. The resulting homogeneous catalog comprises 63 298 earthquake events, with Mw ranging from 2.0 to 7.9. Declustering of the homogeneous catalog was then conducted to remove dependent events, such as foreshocks and aftershocks, and to identify the mainshocks. Four declustering methods were used to compare and examine their individual influences on mainshock identification in the catalog. The resulting unified and declustered earthquake catalog provides a useful and dependable database for seismicity analysis, seismotectonic studies, and seismic hazard assessments in and around South Korea.
- Article
(15408 KB) - Full-text XML
-
Supplement
(11823 KB) - BibTeX
- EndNote


In the present study, significant research has been conducted to prepare a complete and unified earthquake catalog for South Korea and its neighboring regions. Although the Korean Peninsula is not located directly on a tectonic boundary, earthquakes have occurred in the region since historic times. To gain a thorough understanding of earthquake occurrences in a specific area, a comprehensive and cohesive earthquake catalog is essential for seismologists, geologists, policymakers, engineers, and communities because it forms the foundation for risk assessment, hazard mitigation, and resilient infrastructure development. Every year, numerous organizations publish earthquake records in the form of bulletins, including the United States Geological Survey (USGS), the International Seismological Centre (ISC), the Korea Meteorological Administration (KMA), the Japan Meteorological Agency (JMA), and the European-Mediterranean Seismological Centre (EMSC). Building on these bulletins, various researchers worldwide (e.g., Das and Meneses, 2021; Di Giacomo et al., 2018; Makropoulos et al., 2012; Rovida et al., 2022; Tan, 2021) systematically develop earthquake catalogs, which integrate diverse datasets and serve as essential inputs for probabilistic seismic hazard assessment (e.g., Anbazhagan et al., 2009; Du and Pan, 2020; Tselentis and Danciu, 2010; Simeonova et al., 2006; Mahmood et al., 2020; Danciu et al., 2024). Studies on earthquake catalogs in South Korea have been conducted over several decades, with significant contributions from Li (1986), Kim and Gao (1995), and Lee (1999). Since the Korea Meteorological Administration (KMA) has strengthened its national seismological observation network, recent efforts have focused primarily on estimating historical earthquakes (Lee and Yang, 2006; Seo et al., 2010). Seismic hazard studies in South Korea typically use earthquake data from the KMA database (Han and Choi, 2008; Kyung et al., 2016). Ideally, a comprehensive earthquake catalog should be compiled by integrating earthquake data from all available sources, not just regional ones. Recent seismic hazard research by Park et al. (2021) identified this issue and incorporated instrumental earthquake catalogs from the KMA, the JMA, and the China Earthquake Administration (CEA) for their analysis. However, their database was limited to South Korea, and their primary focus was on seismic hazard studies rather than catalog details. By contrast, our study aimed to prepare a homogeneous catalog encompassing the entire Korean Peninsula. In addition, detailed descriptions and an updated catalog are provided in the Supplement, intended to aid in understanding seismic activity in the region and to enhance earthquake-related research and preparedness efforts. Seismic catalogs typically incorporate various magnitude scales, including measures, such as local magnitude (ML), body wave magnitude (Mb), surface wave magnitude (Ms), duration magnitude (MD), velocity magnitude (MV), and moment magnitude (Mw). Therefore, converting the various magnitude scales into a unified magnitude scale was necessary. The ML, Ms, Mb, MD, and MV magnitude scales exhibit saturation effects at certain levels for significant earthquakes. In addition, these scales display non-uniform behavior across various magnitude ranges. To overcome this limitation, the Mw scale was considered the most reliable, as it directly links the seismic moment to earthquake magnitude, ensuring consistent behavior across all magnitude ranges. Thus, the main objective of this study is to compile a homogeneous moment magnitude (Mw)-based earthquake catalog for an area comprising South Korea and its neighboring regions. The earthquake database covers the time period from 1905 to 2023, and the geographical area spans 31 to 42° N and 122 to 132.5° E, with a magnitude range of Mw from 2.0 to 7.9.
Earthquakes are regarded as a complex phenomenon, forming clusters in both space and time, which introduces a bias in seismic catalogs. Consequently, declustering is deemed essential in seismic studies, particularly in probabilistic seismic hazard and regional seismicity analyses (Anbazhagan et al., 2019; Joshi et al., 2024; Taroni and Akinci, 2021). The declustering process in an earthquake catalog involves identifying independent earthquakes (mainshocks) and dependent events (aftershocks and foreshocks) in a dataset. The purpose is not only to eliminate bias but also to disentangle mainshocks from dependent events. Numerous declustering approaches have been proposed, as outlined by van Stiphout et al. (2012). These methods include deterministic strategies, such as the window-based method (Gardner and Knopoff, 1974; Uhrhammer, 1986); the cluster method, linked to spatial interaction zones (Reasenberg, 1985; Savage, 1972); probabilistic approaches, including the stochastic model (Kagan and Jackson, 1991; Zhuang et al., 2002); and the independent stochastic declustering model (Marsan and Lengliné, 2010). The resulting declustered catalogs often exhibit notable differences depending on the chosen method. This discrepancy raises concerns, prompting questions about the selection of the optimal declustering algorithm and its impact on seismic hazard assessment. Consequently, this study aimed to quantify and compare the results of various declustering techniques. In this study, we assess four widely used declustering methods: Gardner and Knopoff (1974), Uhrhammer (1986), Reasenberg (1985), and an independent stochastic declustering method (Marsan and Lengliné, 2010).
Therefore, the primary contributions of the current study are listed as follows:
-
A comprehensive process for building a unified earthquake catalog for South Korea and its neighboring regions is described.
-
A newly compiled unified earthquake catalog for the Korean Peninsula and its neighboring regions has been developed. A supplement, including a homogeneous earthquake catalog and a declustered earthquake catalog, is also provided.
-
A comparison and evaluation of the effects of various declustering algorithms on a homogeneous earthquake catalog are described.
-
Completeness analysis of all declustered earthquake catalogs is performed, which is essential for the seismicity analysis of a region.
Thus, by critically examining the methodologies employed in earthquake catalog compilation, we sought to enhance the reliability and accuracy of seismic information, ultimately contributing to more robust seismic hazard assessments.
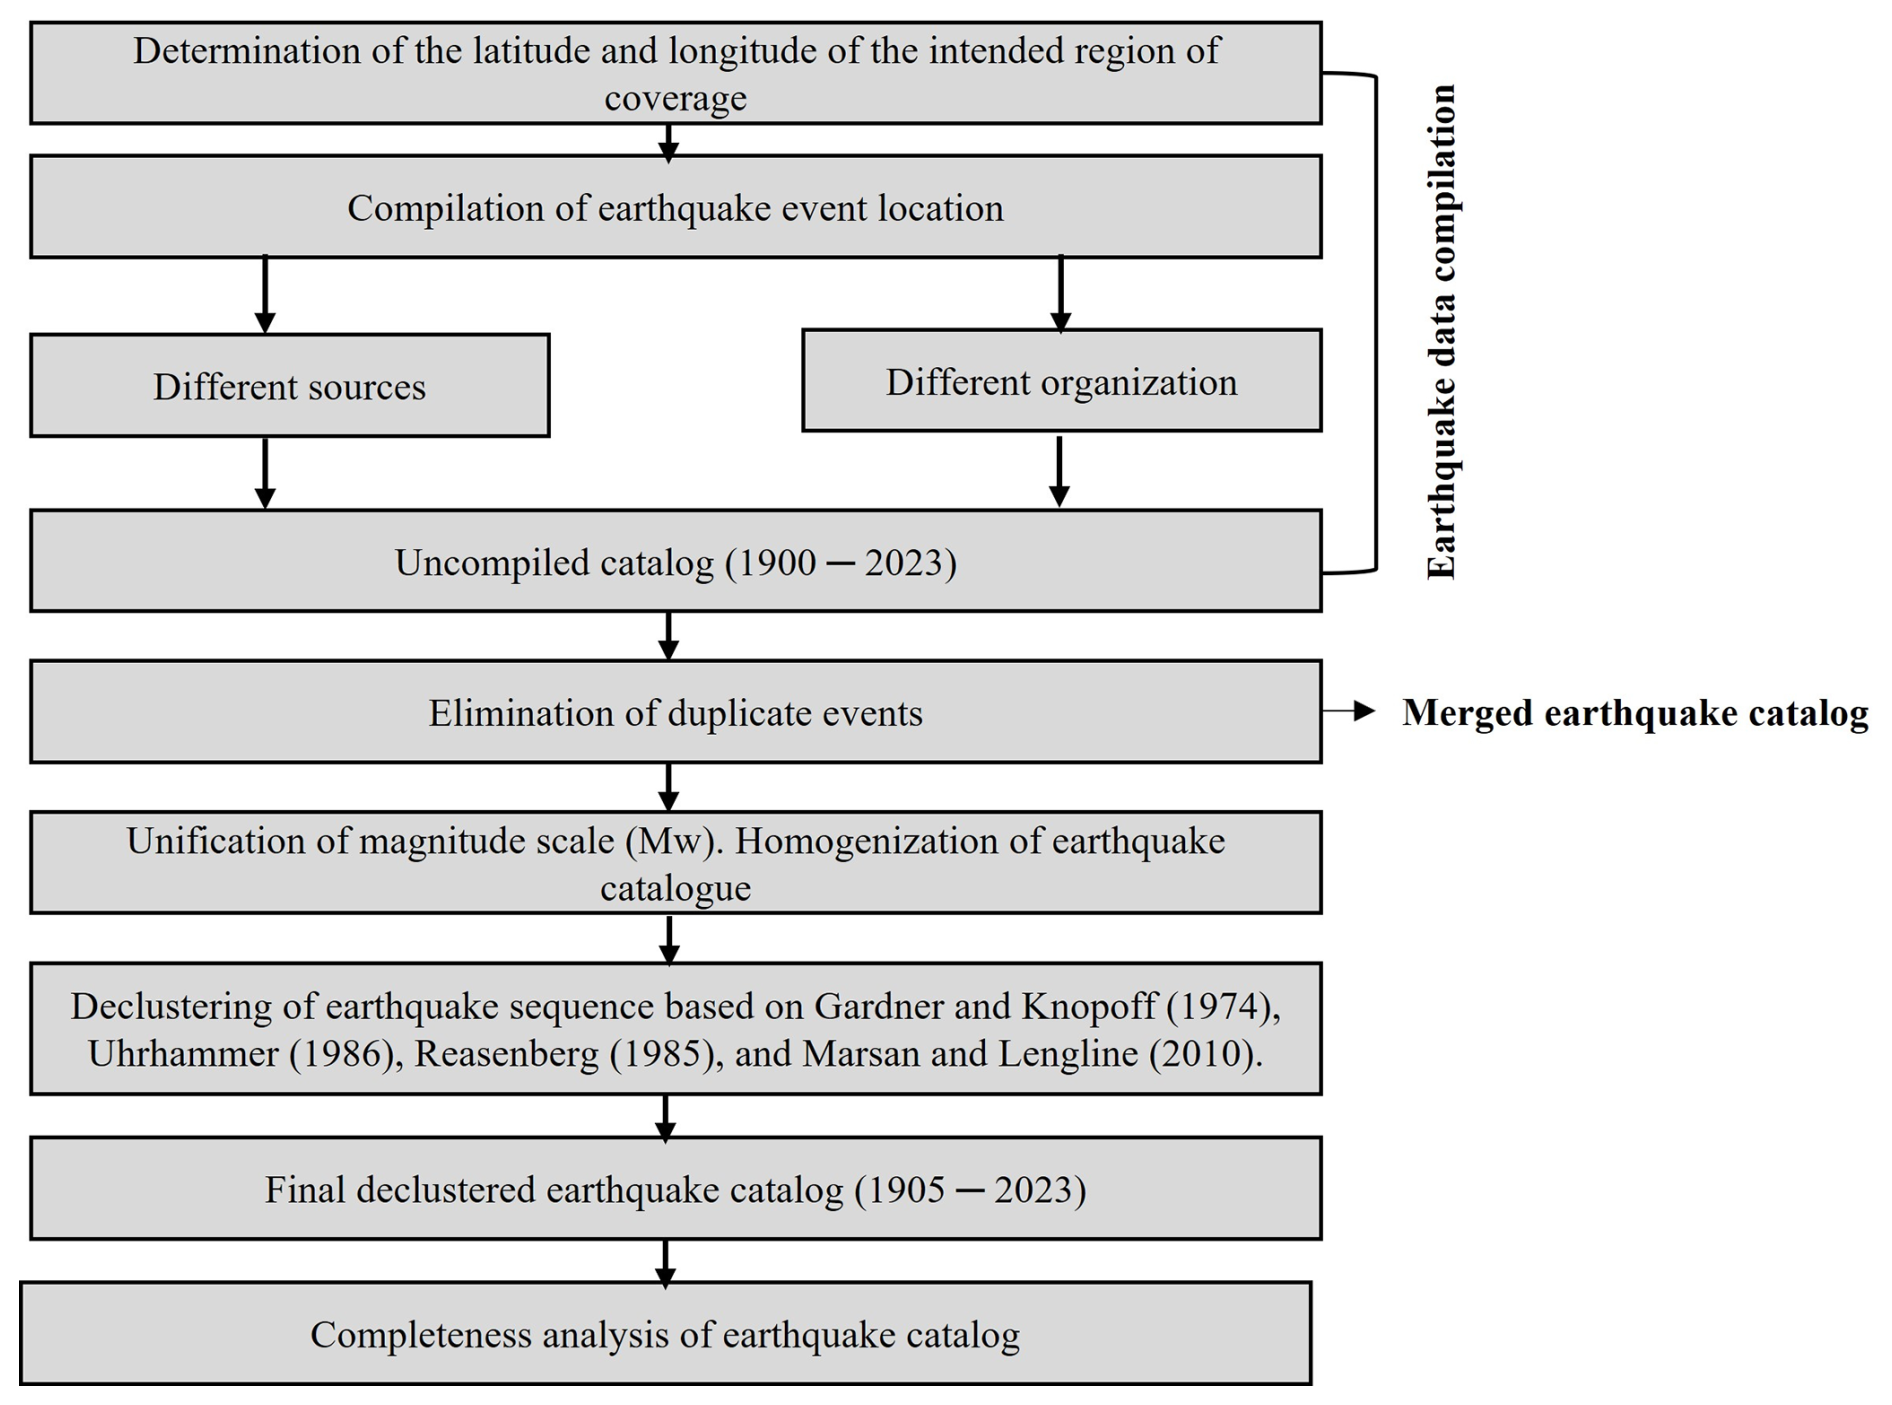
This section provides an in-depth overview of the methodology used in this study. The work emphasizes the collection of reliable and relevant data with the goal of enhancing the overall quality of the earthquake catalog. This improvement aims to minimize uncertainties and provide a more robust earthquake dataset by incorporating both regional and global databases, ensuring detailed coverage that encompasses the entire Korean Peninsula. Figure 1 depicts a flowchart outlining the methodology adopted in the present study, accompanied by concise descriptions of each step.
-
Earthquake data compilation. Initially, historical and instrumental earthquake data were gathered from various agencies, organizations, and global research studies. Raw earthquake data were collected from three global agencies: the Korea Meteorological Administration (KMA), the International Seismological Centre (ISC), and the Japan Meteorological Agency (JMA).
-
Merged earthquake catalog. In this step, earthquake data collected from various sources were integrated into a single combined dataset. This integration involved a careful examination to identify duplicate events that may exist in the compiled data. Once identified, duplicate events were systematically removed to ensure the integrity and accuracy of the earthquake catalog. The goal was to create a consolidated dataset that avoids redundancy and provides a reliable foundation for subsequent analyses and interpretations in seismic studies.
-
Homogenization of the earthquake catalog. The standard practice in earthquake catalog studies involves the unification of the magnitude scale by converting commonly reported magnitudes (ML, Mb, and Ms) into Mw. Therefore, in this step, events of all magnitudes were converted into Mw.
-
Declustering analysis. Declustering analysis is the process of removing dependent earthquake events from a homogenized catalog, which is a crucial step in seismicity analysis. In the present study, four declustering algorithms were used to identify mainshocks and aftershocks, which are discussed in detail in subsequent sections.
-
Completeness analysis. The seismicity of a region varies spatially and temporally. Therefore, statistical analyses using incomplete data may yield unacceptable results. Ensuring the completeness of an earthquake catalog is crucial for seismicity and hazard analyses. In the present study, we employed the methods outlined by Tinti and Mulargia (1985) and Stepp (1972) to conduct the completeness analysis.
2.1 Earthquake data source and compilation
The earthquake data collected for each event in the database included information, such as the date, epicentral coordinates, depth, and earthquake magnitude measured at various scales. To assemble earthquake data for a new earthquake catalog of the Korean Peninsula, we incorporated available data from both national and international seismological databases.
2.1.1 Korea Meteorological Administration (KMA) database
The Korea Meteorological Administration (KMA), the governmental meteorological body of South Korea, is responsible for disseminating information regarding earthquakes and tsunamis. In 1997, the KMA initiated a project to enhance the national seismological observation network and tsunami warning system. Prior to this, there was a lack of adequate earthquake data, necessitating the amalgamation of records from other international agencies. A total of 2114 events spanning 1978 to 2023, with magnitudes ranging from 2.0 to 5.8, were collected from the KMA database. All the data included local- or regional-scale magnitude ML. The seismicity distribution of earthquake locations in the KMA database is shown in Fig. 2.
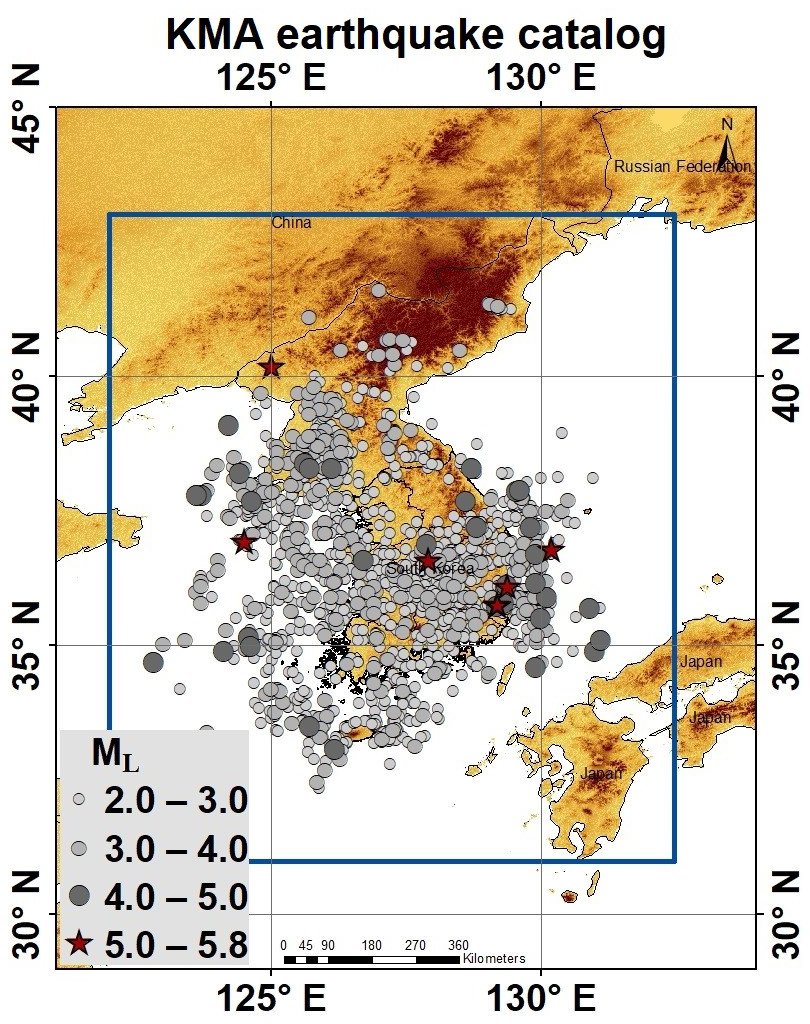
Figure 2Seismicity distribution of earthquake locations from the Korea Meteorological Administration (KMA) source. Terrain basemap generated from the SRTM GL1 digital elevation model (NASA Shuttle Radar Topography Mission, 2013).
2.1.2 The ISC bulletin event database
To produce a new global reference for the earthquake catalog, the International Seismological Centre (ISC) bulletin compiled reports on all earthquake data in digital format starting from 1900. Serving as a comprehensive and refined seismic bulletin, it stands out internationally when compared with other sources. The bulletin incorporates both raw and revised earthquake data gathered from approximately 130 local and national networks. The ISC bulletin expends significant efforts to relocate earthquakes and recalculate their magnitudes, thereby contributing to the overall reliability of seismic data. For this study, data on 51 894 earthquakes with a magnitude greater than 2.0, covering the time span from 1905 to 2023, were gathered from the ISC bulletin and documented using various magnitude scales (Mb, Ms, Mw, MJMA, ML, MV, and MD). The seismicity distribution of earthquake locations in the ISC database is depicted in Fig. 3, where all magnitude scales are represented using distinct colors.
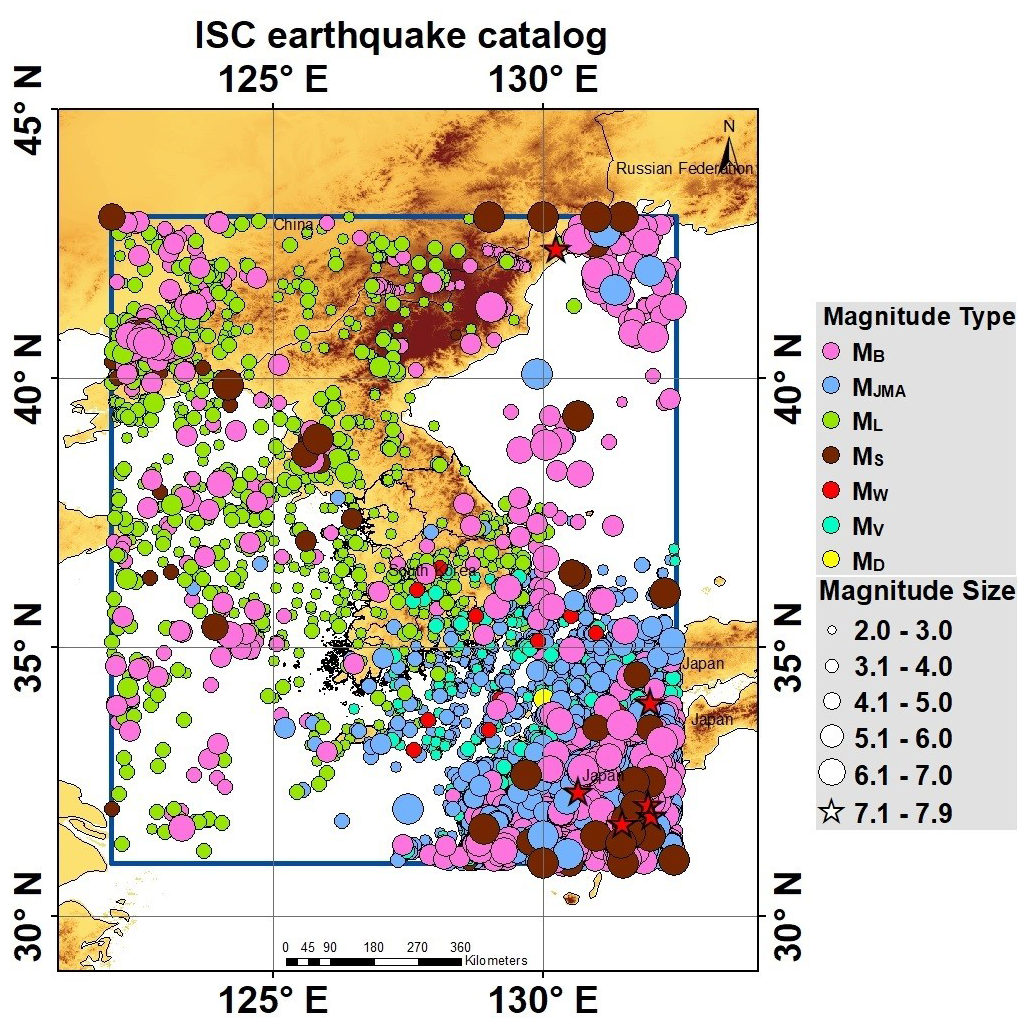
Figure 3Seismicity distribution of earthquake locations from the International Seismological Centre (ISC) bulletin. In this figure, different magnitude scales, including Mb, MJMA, Ms, Mw, ML, MD, and MV, are represented using distinct colors. Terrain basemap generated from the SRTM GL1 digital elevation model (NASA Shuttle Radar Topography Mission, 2013).
2.1.3 Japan Meteorological Agency (JMA) database
The Japan Meteorological Agency (JMA) was the first to make substantial advances in earthquake instrumental measurements and to digitize seismic station bulletin data within and around the Japanese region. This information is regularly updated to create a JMA-unified earthquake catalog in a collaborative effort with the Ministry of Education, Culture, Sports, Science, and Technology (MEXT). Utilizing seismic waveforms from stations affiliated with the JMA, the National Research Institute for Earth Science and Disaster Resilience (NIED), the Japan Agency for Marine Earth Science and Technology (JAMSTEC), universities, and various institutes have contributed to the catalog's comprehensive data. The observed number of seismic events has increased since 2000, primarily due to the implementation of the Hi-net NIED network (Okada et al., 2004). The JMA earthquake catalog includes 48 571 earthquakes consisting of various magnitude scales (Mb, MJMA, MD, and MV) spanning 1919 to 2023, primarily covering the Japanese islands, southeastern South Korea, and surrounding regions. The magnitudes of the earthquakes in this catalog range from 2.0 to 7.3, as illustrated in Fig. 4.
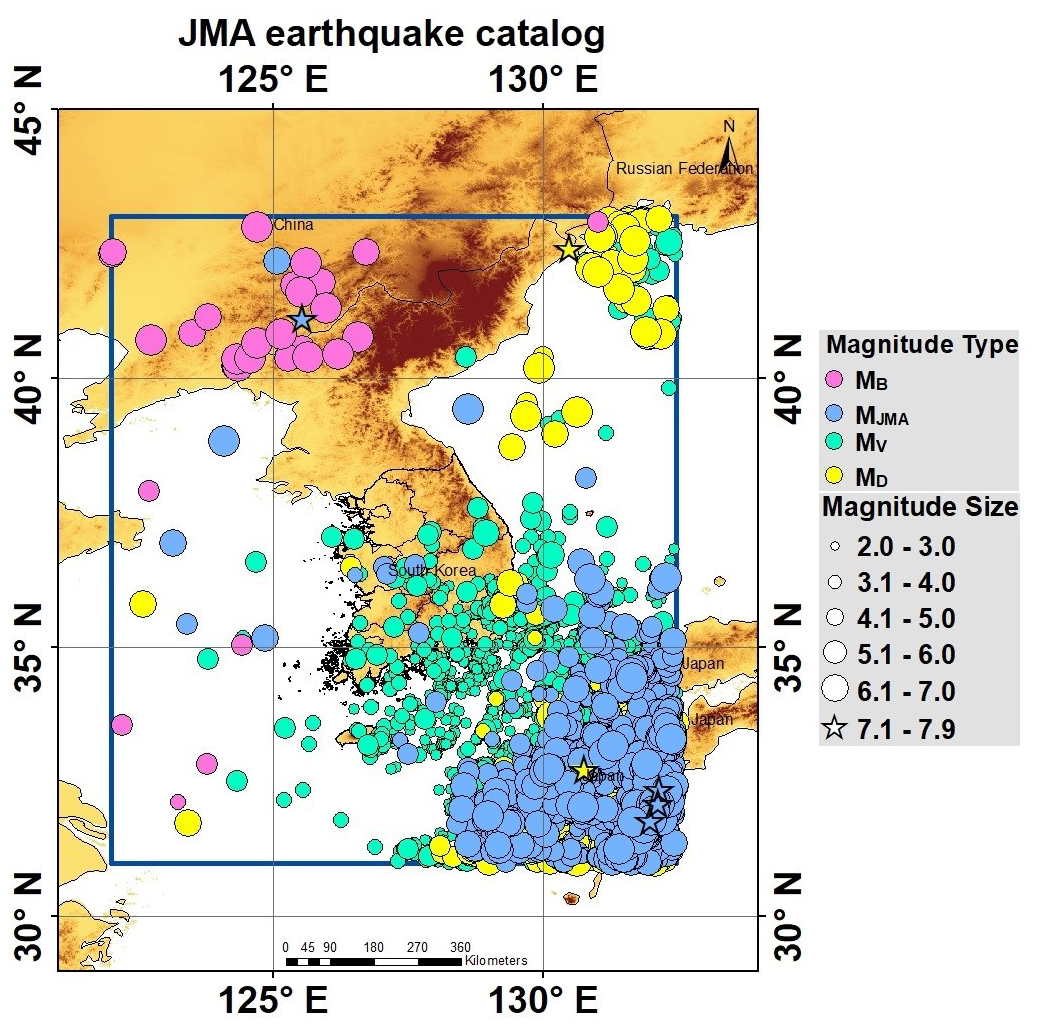
Figure 4Seismicity distribution of earthquake locations from the Japan Meteorological Agency (JMA) source. In this figure, different magnitude scales, including Mb, MJMA, MD, and MV, are represented using distinct colors. Terrain basemap generated from the SRTM GL1 digital elevation model (NASA Shuttle Radar Topography Mission, 2013).
2.2 Merging of earthquake data from all sources
Data cleaning was required prior to merging earthquake catalogs from the KMA, JMA, and ISC data sources. Unnecessary information, such as the names of source agencies, author names, time zones, region names, and ID numbers, was systematically removed to streamline the datasets. The essential parameters common to all datasets, such as date, time, latitude, longitude, depth, and magnitude, were retained to ensure the structural integrity of the three data sources. In the subsequent phase, each dataset event was consistently adjusted to Korean Standard Time (KST) to maintain temporal coherence. This step established a unified data structure across all datasets, facilitating seamless merging and manipulation. To provide a comparative overview of the earthquake reporting patterns from the three catalogs, the annual number of events reported by KMA, JMA, and ISC is plotted as shown in Fig. 5. This highlights key differences in the temporal reporting patterns across the three catalogs. Finally, a multi-window search technique was applied to remove duplicate events from the catalog. In this multi-window search criteria, the differences in source parameters, such as the origin time and location of the earthquakes, were used to detect duplicate events. This approach has been used in several studies that combine earthquake catalogs. For example, Mueller (2019) and Petersen et al. (2014) merged multiple regional catalogs of the USGS National Seismic Hazard Model. They used time-window criteria ranging from 10 to 60 s and distance criteria ranging from 20 to 250 km to identify duplicate events. In the South Korean region, Park et al. (2021) used origin time differences of 20 s and distances of 100 km to identify duplicate events across different catalogs. The criteria for these studies were selected based on careful inspection and manual checking of records that correspond to the same event in the compiled catalog. This ensures that the time and distance inputs accurately reflect the characteristics of duplicate events. The window criteria were determined through iterative testing and a manual review of duplicate events, after which the search window criteria were fine-tuned. A time window of 30 s and a location-distance difference of 70 km were applied to effectively identify and filter duplicate events. In addition to these criteria, we also incorporated a magnitude consistency filter, where events were considered potential duplicates only if their reported magnitudes differed by less than ±0.1 units. All events that deviated from magnitude difference and satisfied the temporal and spatial initial criteria were then manually reviewed on a case-by-case basis to ensure accuracy and consistency in the final catalog. This thorough inspection allowed us to resolve ambiguities and select the most reliable entries. This combined approach of using time-distance criteria and manual checking has also been followed in other studies, such as Sawires et al. (2019), Grünthal and Wahlström (2012), and Wang et al. (2009). When duplicate events were identified, the final decision on which record to retain was based on the priority given to regional bulletins – with preference assigned first to the KMA, followed by the JMA, and then the ISC. Following this cleaning and merging process, the resulting (inhomogeneous) catalog consisted of 63 298 events with magnitudes ranging from 2.0 to 7.9. This meticulous data cleaning and merging process ensured the creation of a consolidated and reliable earthquake catalog for the comprehensive analysis of the homogeneous earthquake catalog.
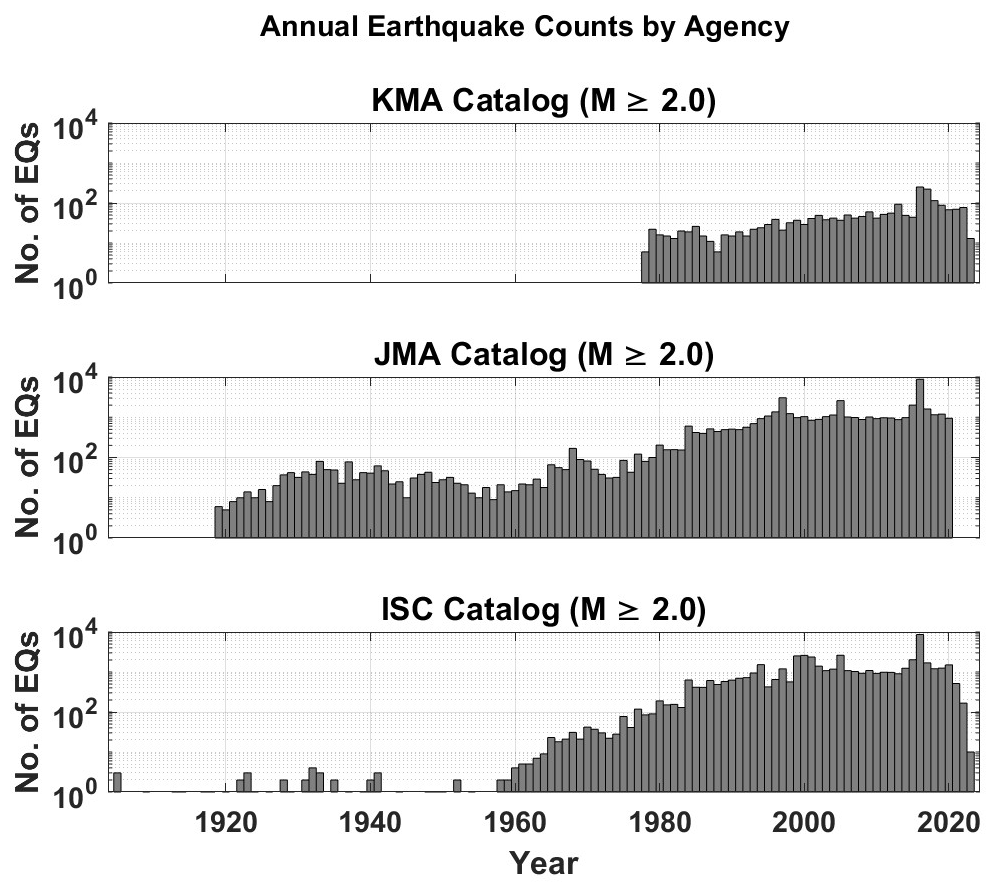
Figure 5Annual earthquake counts reported by KMA, JMA, and ISC in the Korean Peninsula. The plot allows comparison of temporal variations in seismic reporting among the three agencies.
Numerous researchers worldwide (e.g., Bormann et al., 2007; Bormann and Saul, 2008; Das et al., 2011; Grünthal et al., 2009; Scordilis, 2006; Sheen et al., 2018; Utsu, 2002) have undertaken the compilation and validation of magnitude-scale relations, contributing to the understanding and standardization of seismic measurements. The present study adopted the most globally recognized relations developed by Scordilis (2006) for the conversion of surface wave magnitude (Ms) and body wave magnitude (Mb) to moment magnitude (Mw). The choice of these relations was rooted in the comprehensiveness and reliability of Scordilis's dataset, which encompasses 20 407 earthquakes sourced from diverse international seismological databases, reflecting seismic events worldwide. The robustness and well-defined nature of the Scordilis (2006) relations make them particularly suitable for accurate magnitude conversions. In the merged earthquake catalog comprising 63 298 seismic events, the Ms and Mb magnitudes were systematically extracted and subsequently transformed into Mw using the established relations depicted in Eqs. (1) and (3). This methodology ensures the consistency and validity of the moment magnitude estimates across a broad spectrum of seismic activities considered in this study.
The seismic magnitudes recorded by the JMA seismic network are denoted as MJMA and represent the local magnitude scale, as outlined by Katsumata (2004) and Funasaki and Earthquake Prediction Information Division (2004). Both the JMA and the ISC earthquake catalogs reported events using the MJMA magnitude. Scordilis (2005) provided a calibrated relation to convert MJMA to moment magnitude (Mw) for both strong (MJMA ≥ 5.6) and weaker (MJMA ≤ 5.5) seismic events, as expressed in Eq. (3). However, Uchide and Imanishi (2018) identified discrepancies in the magnitude estimations, especially for micro- and small-scale earthquakes. Consequently, they introduced a nonlinear quadratic function, represented by Eq. (4), to enhance the accuracy of MJMA to Mw conversion for these events. In the present study, both relations developed by Scordilis (2005) and Uchide and Imanishi (2018) were used to convert MJMA to Mw. The final Mw value was estimated by averaging the results obtained from the two equations, providing a more nuanced and comprehensive approach to the magnitude conversion from MJMA. The standard deviation between the two estimates is calculated to reflect the uncertainty in the final magnitude conversion and is included in the homogeneous catalog. In addition, Uchide and Imanishi (2018) highlighted a noteworthy observation regarding the JMA earthquake magnitude scale. Specifically, they noted that the catalog employs displacement amplitude for larger earthquakes and velocity amplitude for smaller earthquakes to estimate the MJMA magnitude. Consequently, the nonlinear quadratic function presented in Eq. (4) by Uchide and Imanishi (2018) was extended to convert the displacement magnitude (MD) and velocity magnitude (MV) scales to Mw. Thus, Eq. (4) was incorporated to convert the MD and MV magnitudes into Mw.
In the KMA earthquake catalog dataset, the recorded magnitudes were predominantly on the ML scale. For a consistent and accurate analysis, a regional relation between the moment magnitude (Mw) and local magnitude (ML) was used, based on the work of Sheen et al. (2018). Sheen et al. (2018) conducted a comprehensive study in which they estimated ML by analyzing both the horizontal and the vertical components of seismic events separately. The study utilized 6327 horizontal and vertical peak amplitudes from 269 earthquakes in the magnitude range of 2.0 to 5.8 that occurred in and around the Korean Peninsula from 2001 to 2016. The vertical peaks and geometrical means of the horizontal peaks were utilized separately to estimate the empirical attenuation curve, station corrections, and earthquake magnitudes accurately. Thereafter, an orthogonal linear regression analysis was performed using the event magnitudes (ML) determined from the horizontal and vertical components along with the Mw values obtained from the S-wave source spectra. It is worth noting that their ML magnitudes deviated slightly from those derived by the KMA. To match the data, an initial conversion was performed using the relations presented in Eqs. (5) and (6), transforming ML into . Afterward, the dataset underwent an additional conversion to obtain the moment magnitude (Mw) using the relations outlined in Eqs. (7) and (8). The resulting Mw values of these two components were averaged to obtain a consolidated and refined Mw magnitude estimate. This multistep process ensures a unified and standardized magnitude scale for a more accurate and comprehensive seismic analysis. The associated standard deviation of the magnitude is also estimated and incorporated in the catalog.
Finally, all events were unified using the magnitude conversion equations. The homogenized Mw-based earthquake catalog is presented in Fig. 6, encompassing 63 298 events ranging from 1905 to 2023. A database containing homogenized earthquake events with associated standard deviation is provided as a supplement (Table S1). This additional resource allows researchers and other organizations to access and explore detailed information, enhance transparency, and facilitate further in-depth seismic hazard analyses.
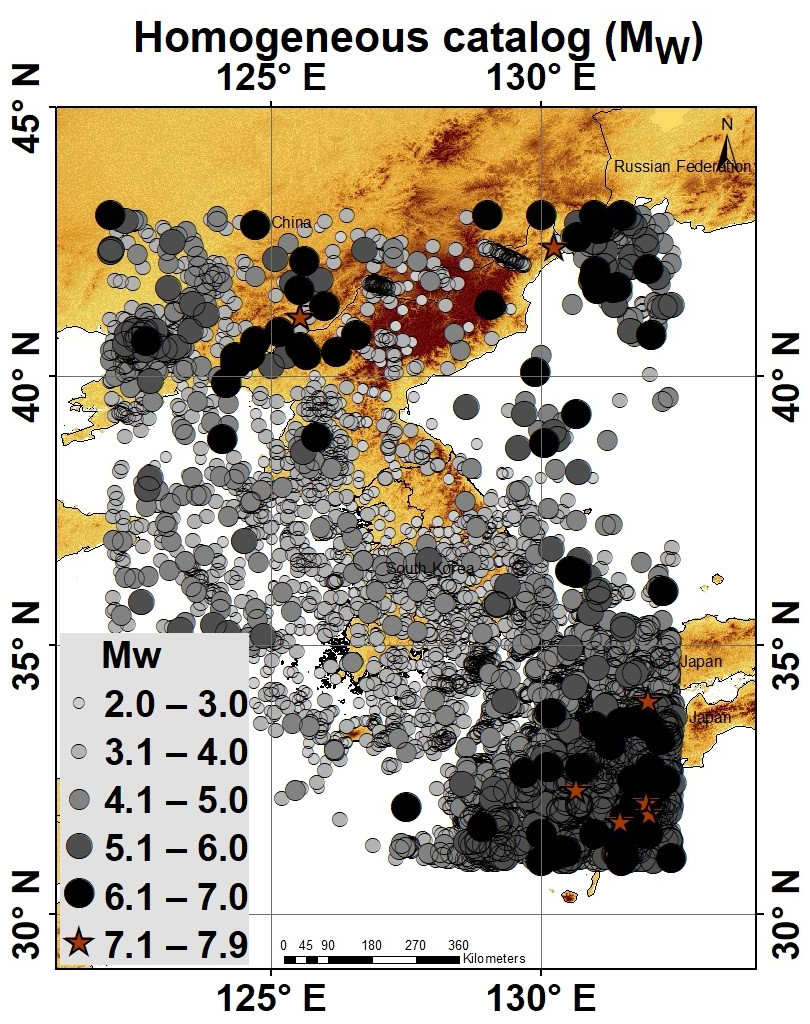
Figure 6Homogeneous earthquake catalog for South Korea and neighboring regions covering the period from 1905 to 2023. Terrain basemap generated from the SRTM GL1 digital elevation model (NASA Shuttle Radar Topography Mission, 2013).
The declustering of earthquake catalogs plays a pivotal role in seismic hazard analysis, particularly concerning the fundamental assumptions in probabilistic seismic hazard assessment (PSHA), in which the earthquake occurrence process adheres to a Poisson distribution. This assumption implies a uniform and random distribution of seismic events, which may be compromised when considering clustered (dependent) events. The presence of clustered events deviates the seismicity from a Poisson distribution by introducing non-random patterns. Moreover, the inclusion of aftershock (dependent event) sequences can lead to an overestimation of the earthquake occurrence rate, potentially resulting in an inaccurate prediction of seismic activity in a region. This necessitates a thorough examination of the declustering process to ensure the reliability of earthquake catalogs and, consequently, to enable more accurate seismic hazard assessments. In this section, we analyzed different declustering algorithms by examining the impact of the adopted processes on a homogeneous earthquake catalog. Various methods have been explored to gauge their effectiveness and their implications for earthquake data analysis. Identifying aftershocks that are dependent on mainshocks poses a challenge because they lack distinct features in their waveforms. Their selection relies on their spatial and temporal proximity to preceding earthquakes or occurrence rates exceeding the average long-term seismicity. Associating an aftershock with a mainshock necessitates defining a measure for their space–time distance and establishing criteria based on event occurrence. In this study, four types of declustering techniques were employed: window methods, including Gardner and Knopoff (1974) and Uhrhammer (1986); a cluster method utilizing the Reasenberg algorithm (1985); and stochastic declustering implemented through the Marsan and Lengliné approach (2010).
4.1 Window-based methods
Windowing techniques offer a straightforward approach to differentiating between mainshocks and dependent events (aftershocks and foreshocks). Each earthquake in the catalog with a magnitude Mw was initially designated as a mainshock. Subsequent shocks were identified as aftershocks if they occurred within a specified time interval T(M) or distance interval L(M). Conversely, foreshocks were handled in a manner comparable to aftershocks. Specifically, if the most significant earthquake occurred later, preceding foreshocks were reclassified as dependent events. This process involves resetting the time–space windows based on the magnitude of the largest shock in the sequence. Based on the aforementioned assertion, Gardner and Knopoff (1974) provided a mathematical formula for the two determining factors, time and distance, as shown in Eq. (9). Similarly, the time and distance identification criteria provided by Uhrhammer (1986) were estimated using Eq. (10). Table 1 lists the lengths and durations of these windows. The Gardner and Knopoff approach has inspired numerous researchers across generations, with the common goal of distinguishing between background and dependent earthquakes and quantifying the extent of non-randomness in estimated background events.
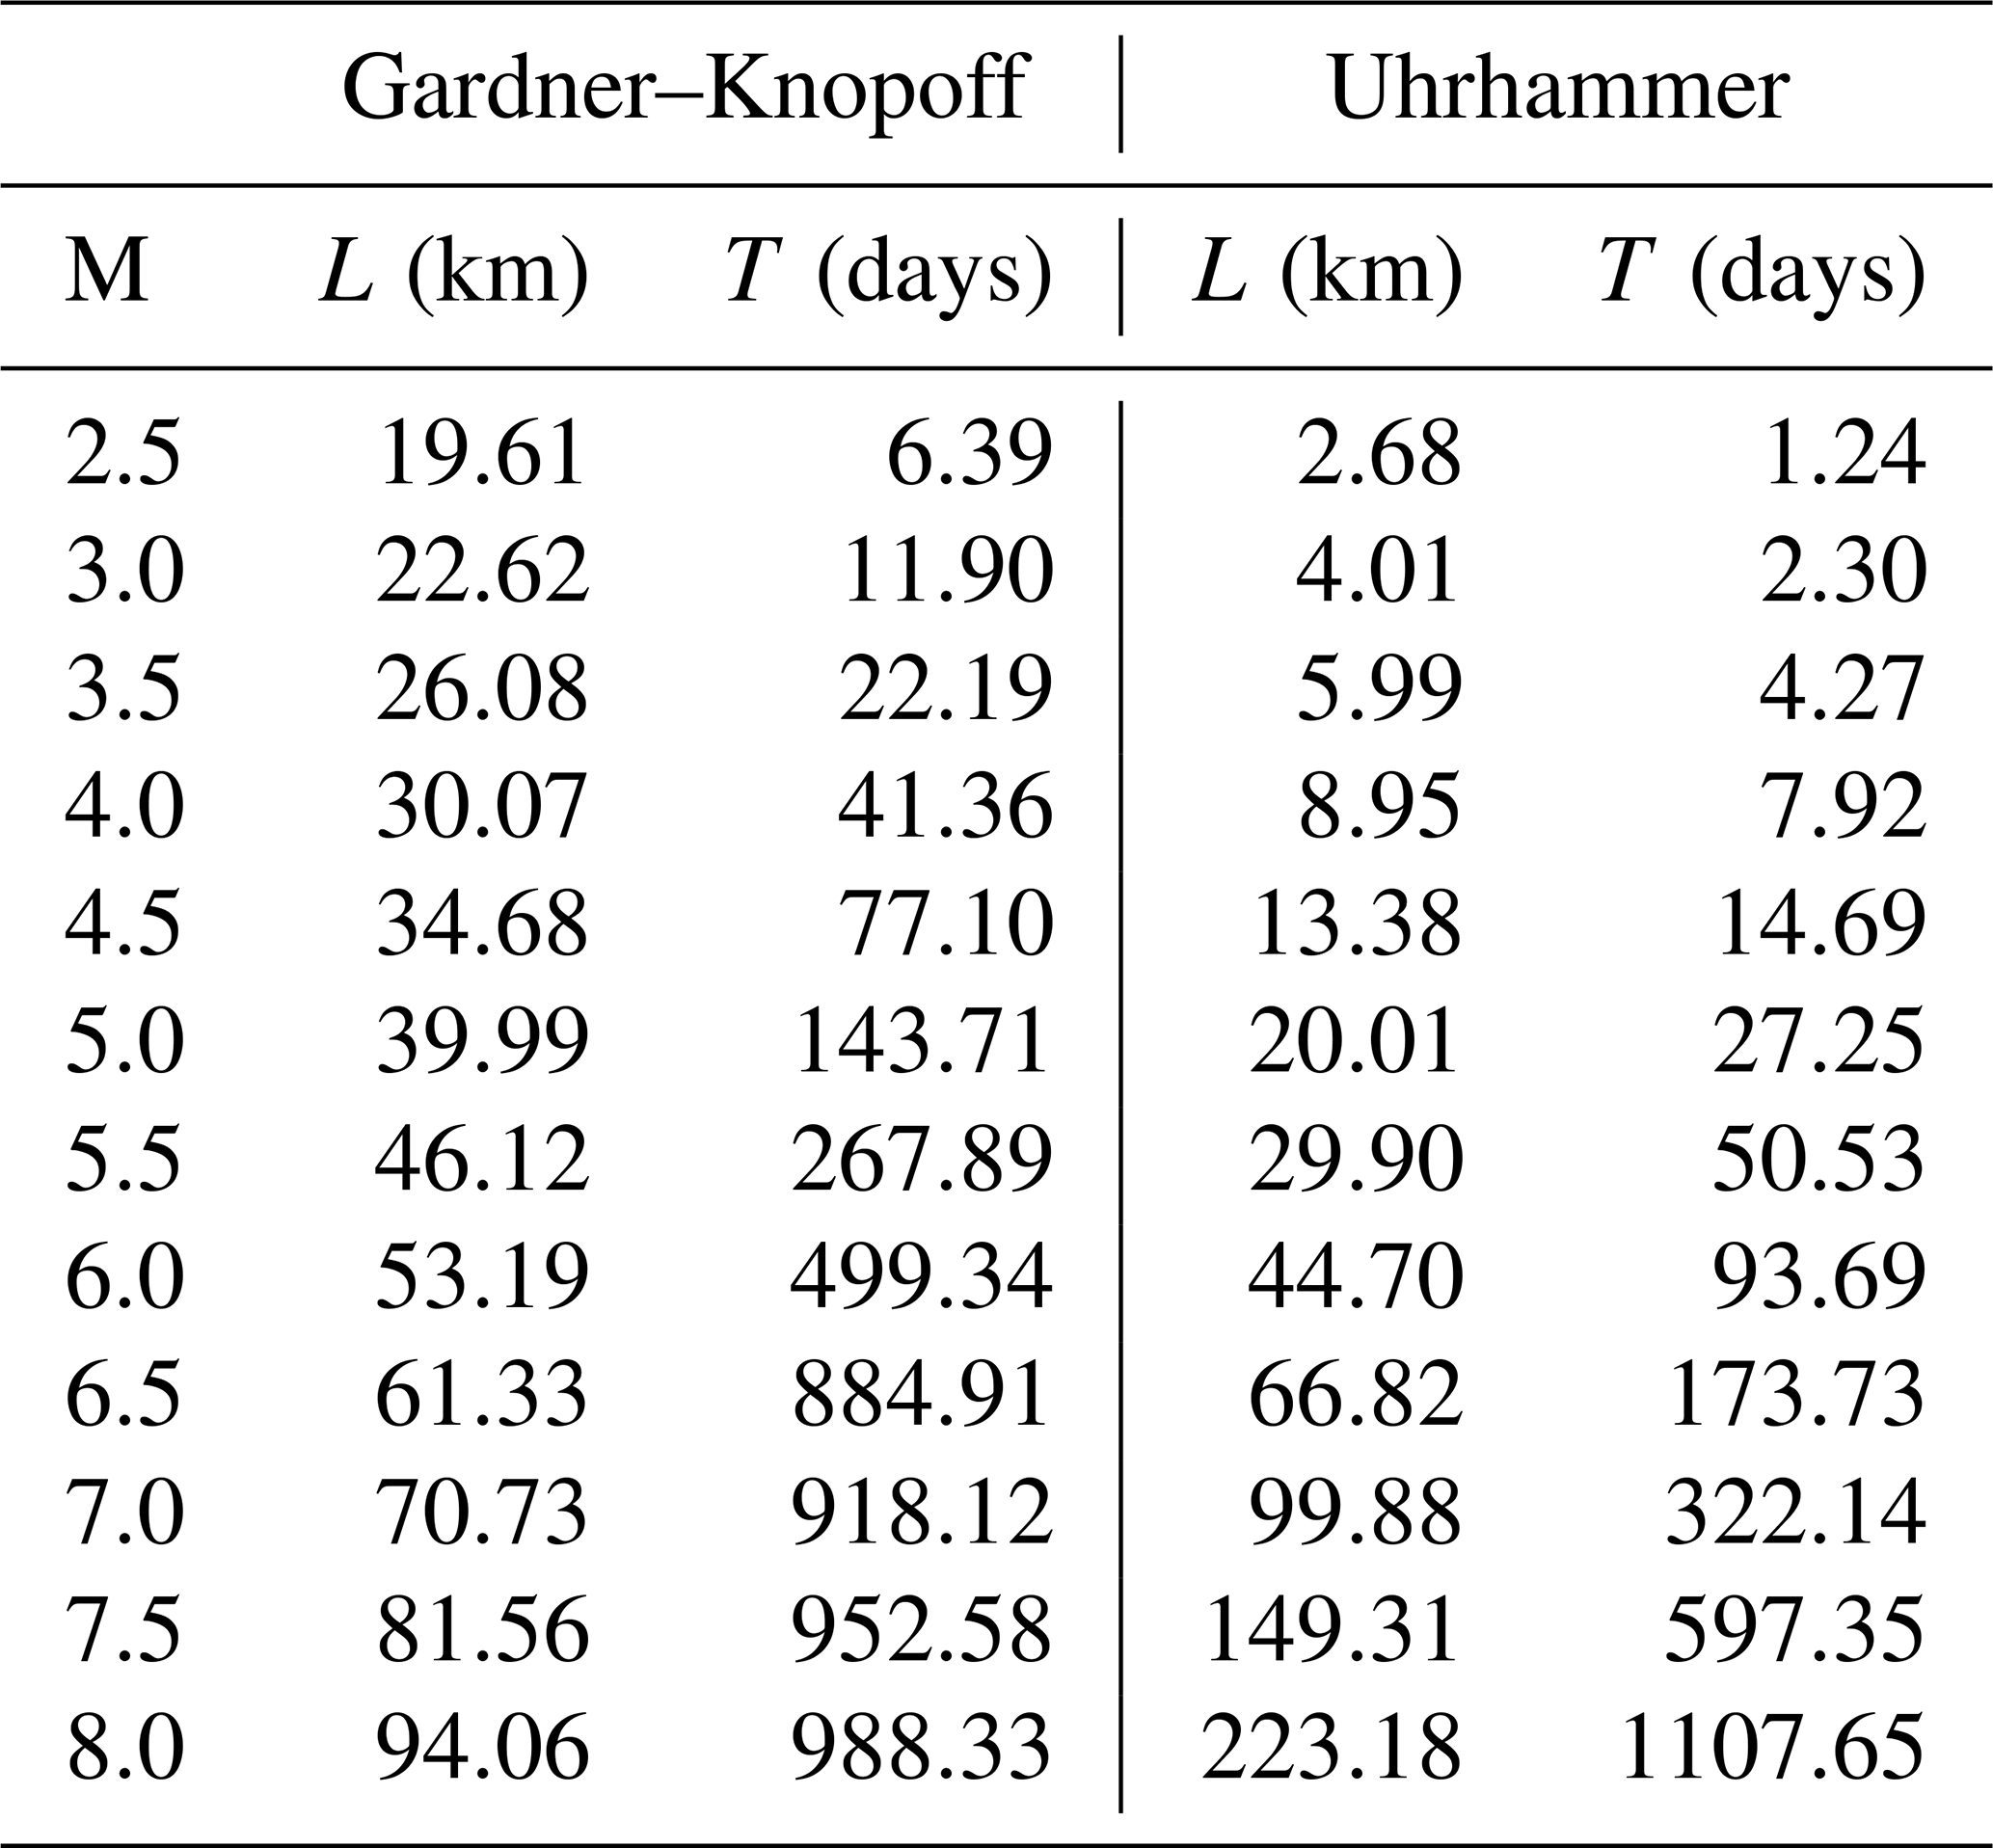
In this study, we utilized a homogeneous earthquake database to implement a declustering method using Eqs. (9) and (10): the Gardner and Knopoff algorithm identified 30 912 independent events and 32 386 dependent events, whereas the Uhrhammer algorithm identified 38 572 independent events and 24 726 dependent events.
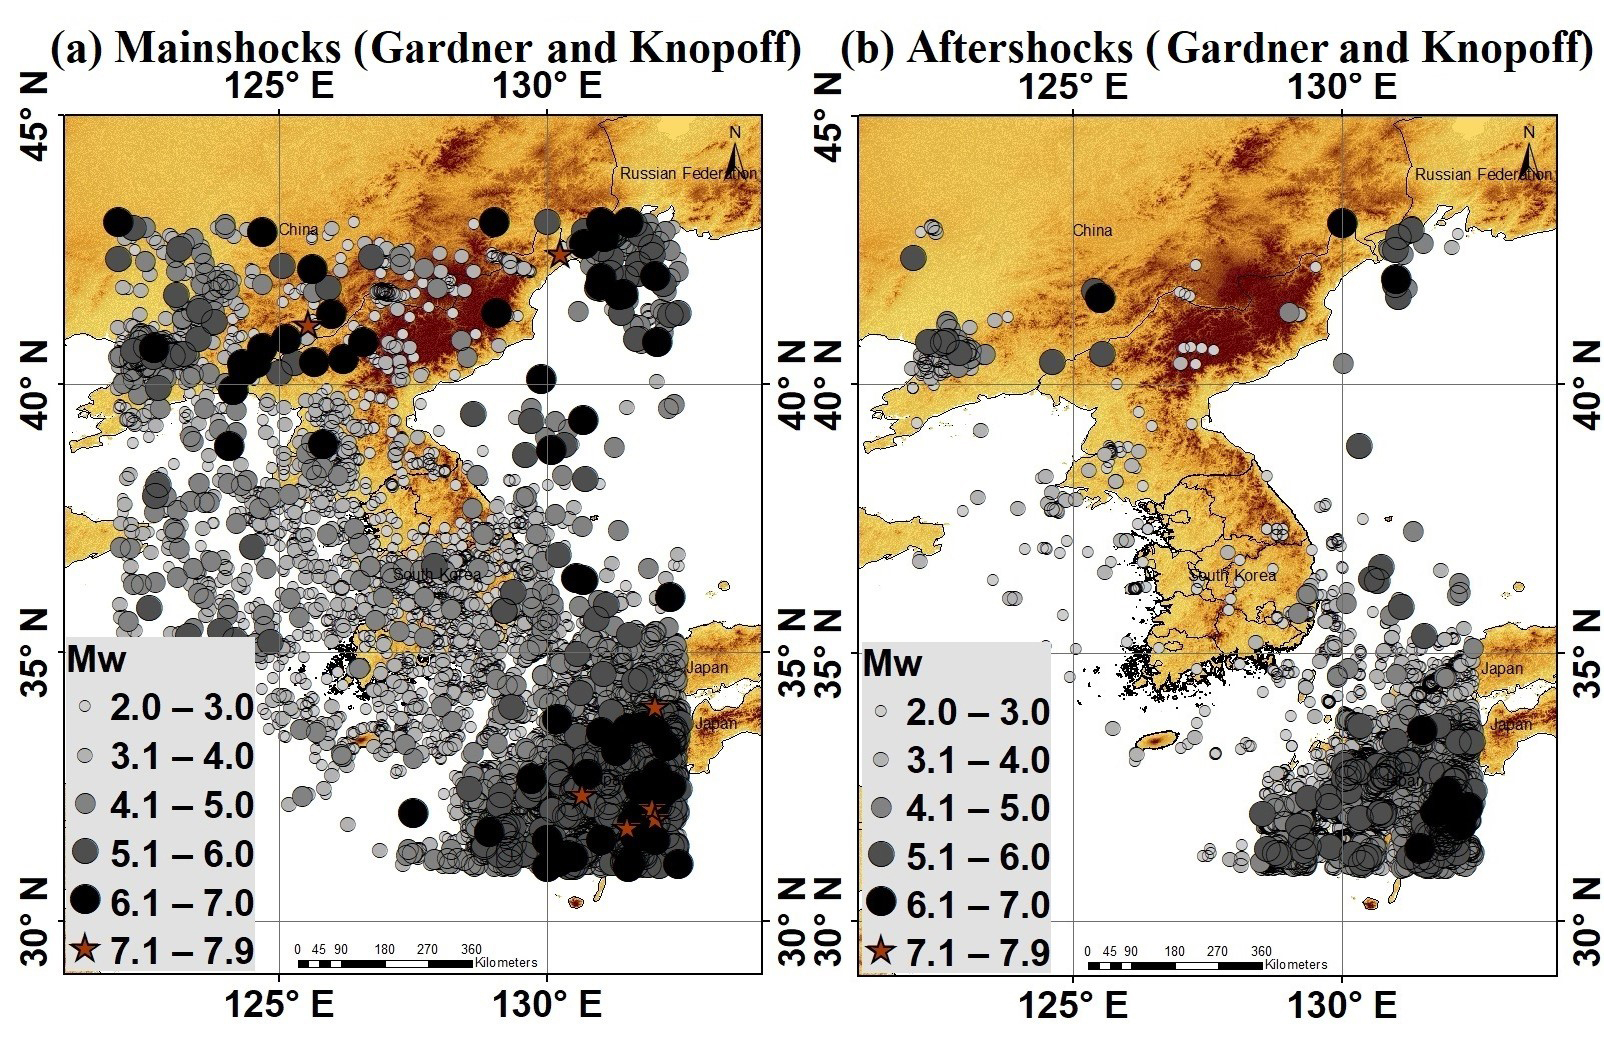
Figure 7Declustered seismicity distribution map using the Gardner and Knopoff method depicting (a) mainshocks and (b) aftershocks, covering the period from 1905 to 2023. Terrain basemap generated from the SRTM GL1 digital elevation model (NASA Shuttle Radar Topography Mission, 2013).
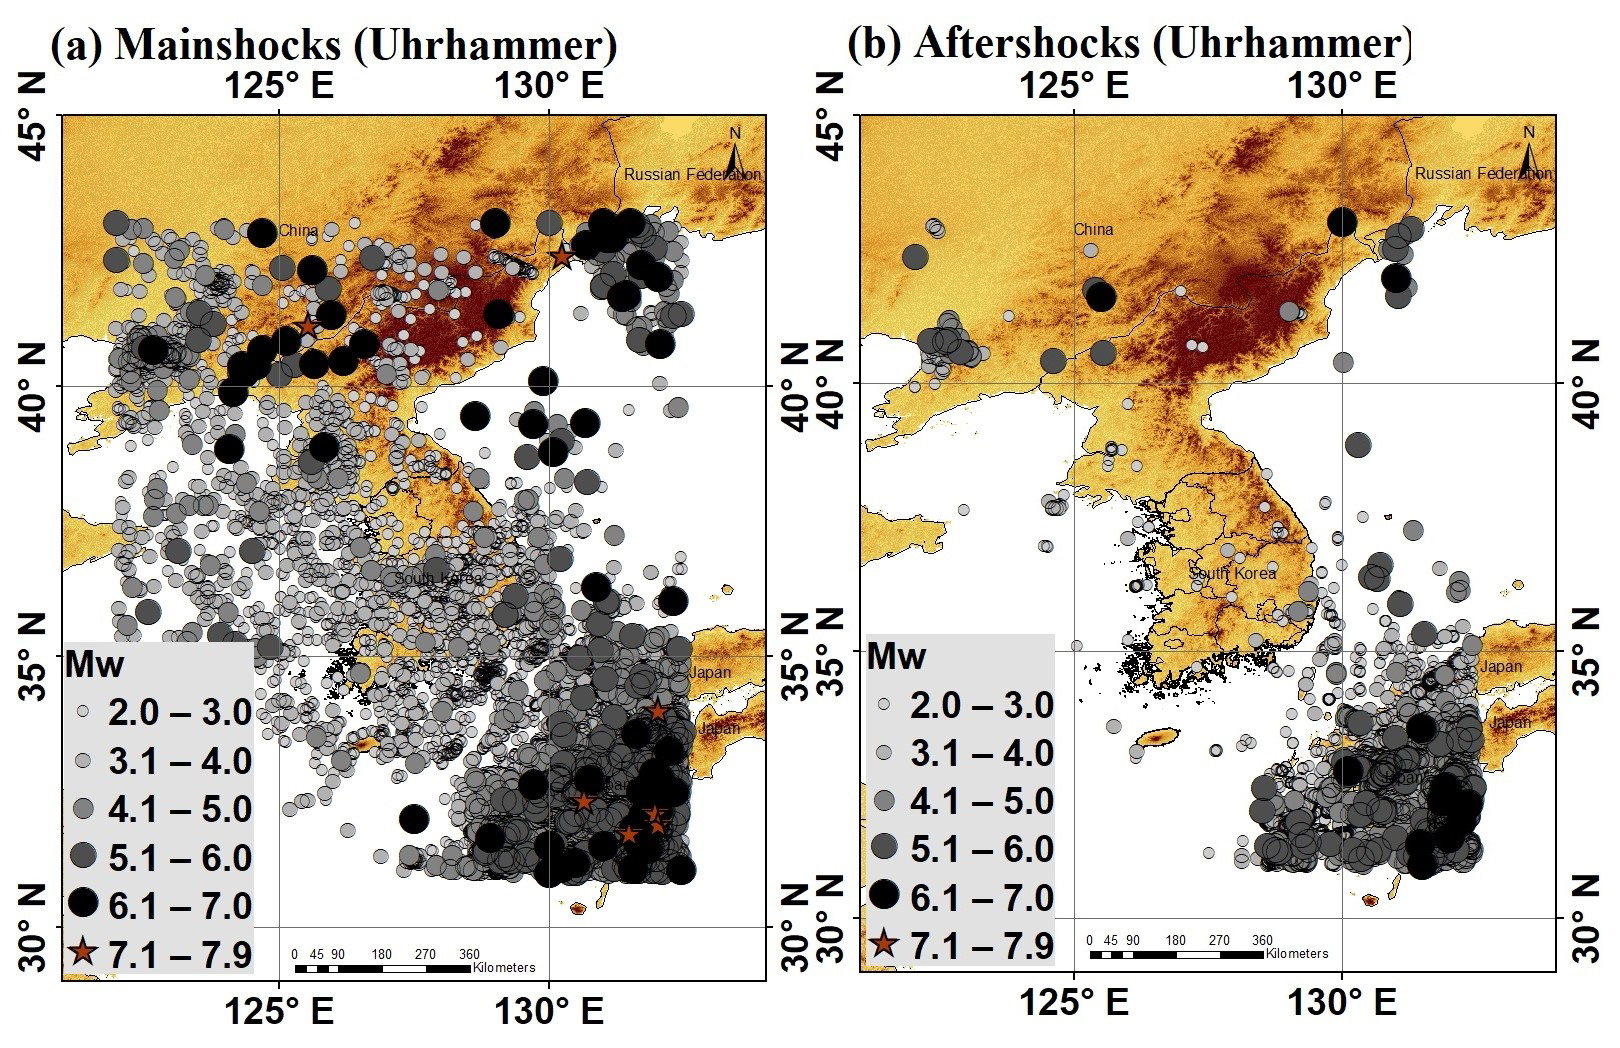
Figure 8Declustered seismicity distribution map using the Uhrhammer method depicting (a) mainshocks and (b) aftershocks, covering the period from 1905 to 2023. Terrain basemap generated from the SRTM GL1 digital elevation model (NASA Shuttle Radar Topography Mission, 2013).
The declustered seismicity map distribution of the Korean Peninsula, encompassing the time span from 1905 to 2023, with the application of the Gardner–Knopoff and Uhrhammer algorithms, is shown in Figs. 7 and 8, respectively. The maps provide distinct visualizations of both the mainshocks and the aftershocks, which are portrayed separately.
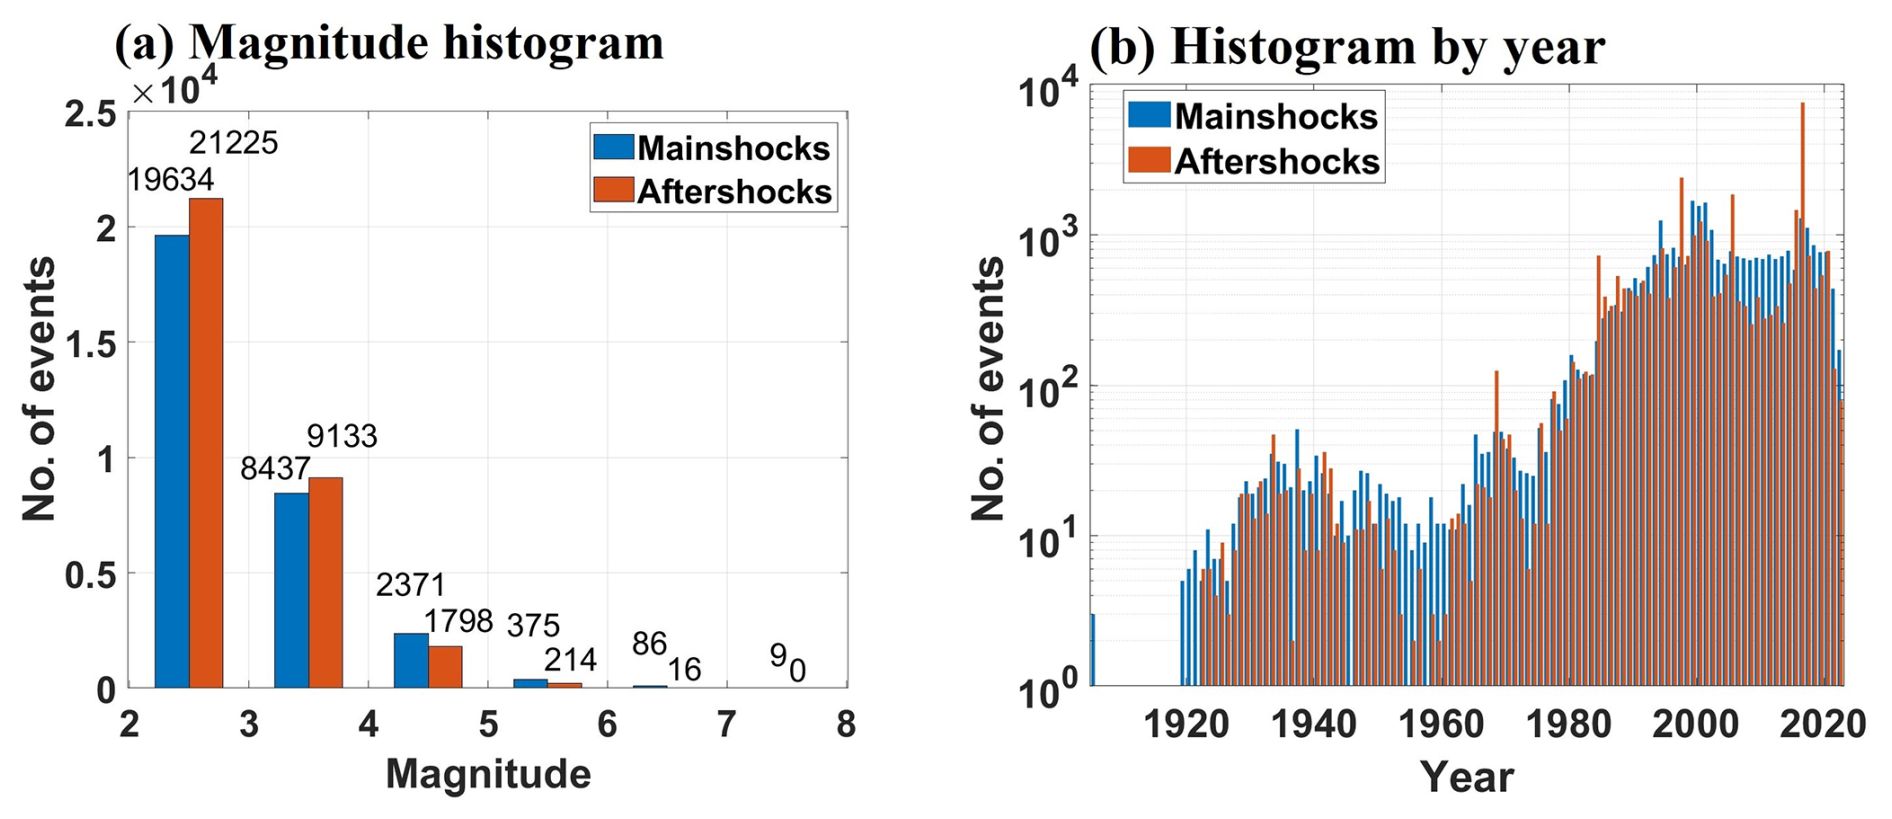
Figure 9Histogram plots for (a) number of events by magnitude and (b) temporal distribution of events for mainshocks and aftershocks using the Gardner and Knopoff method.
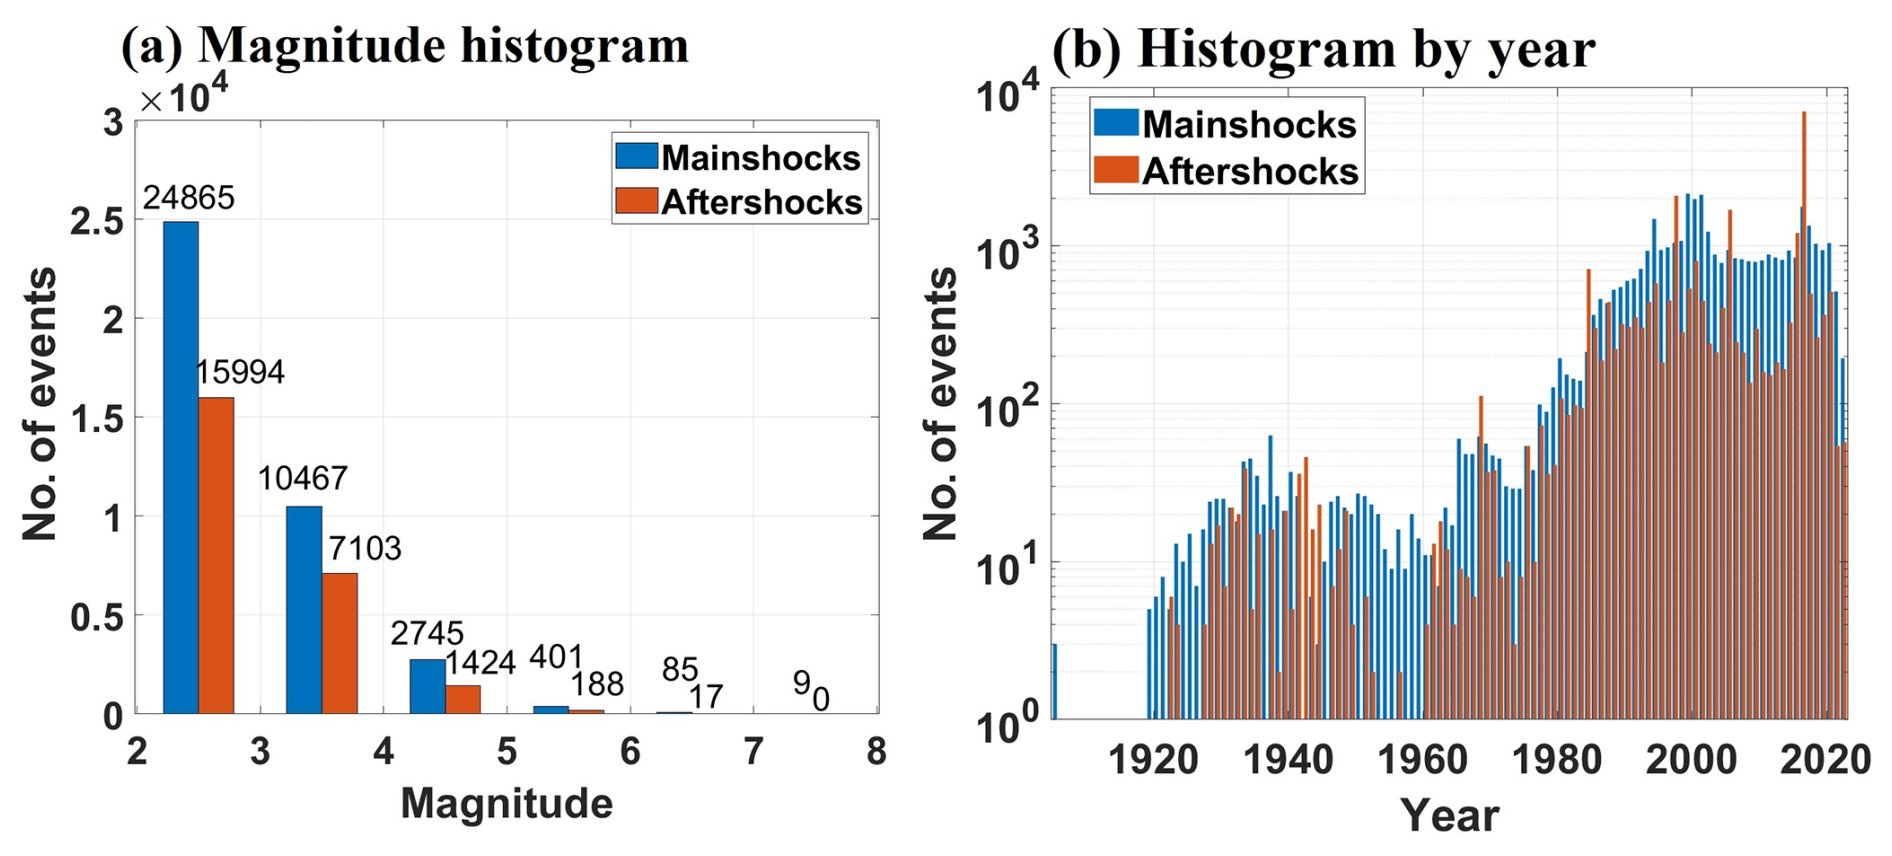
Figure 10Histogram plots for (a) number of events by magnitude and (b) temporal distribution of events for mainshocks and aftershocks using the Uhrhammer method.
Magnitude and time histograms were generated to visualize the distribution of mainshocks and aftershocks, as identified by the Gardner–Knopoff and Uhrhammer algorithms, and are shown in Figs. 9 and 10, respectively.
4.2 Cluster-based method
Reasenberg (1985) introduced a methodology to identify aftershocks associated with earthquakes by linking events to clusters based on their spatial and temporal interaction zones. Consequently, earthquake clusters tend to expand in size as more earthquakes are included in the analysis. Reasenberg's algorithm establishes a spatial interaction relation defined by the threshold (Molchan and Dmitrieva, 1992), where k is 1 for the distance to the largest earthquake and 0 for the distance to the last earthquake. The temporal extension of the interaction zone was determined using Omori's law. All linked events collectively form a cluster, where the largest earthquake is designated as the mainshock, and smaller earthquakes are classified as foreshocks and aftershocks (van Stiphout et al., 2012). Originally, Reasenberg (1985) focused on identifying foreshocks and aftershocks in central California from 1969 to 1982. Over time, this algorithm has gained popularity in the seismological community. The adoption of standard parameter values from Table 2 has become common practice (Wiemer, 2001; Helmstetter et al., 2006; Mizrahi et al., 2021; Del Gaudio et al., 2009; Peng et al., 2021; Teng and Baker, 2019). In the algorithm, τmin represents the minimum look-ahead time for constructing clusters when the initial event is not clustered, whereas τmax denotes the maximum look-ahead time for cluster formation. The parameter p1 signifies the probability of detecting the next clustered event, used in computing the look-ahead time, τ. In addition, xk represents the increment in the lower cutoff magnitude during clusters: , where M is the magnitude of the largest event in the cluster. xmeff represents the effective lower cutoff magnitude for the catalog, and rfact signifies the number of crack radii surrounding each earthquake within new events considered to be part of the cluster (van Stiphout et al., 2012). For a detailed understanding of these parameters, refer to the original publication by Reasenberg (1985).
Table 2Input parameters for the declustering algorithm by Reasenberg.
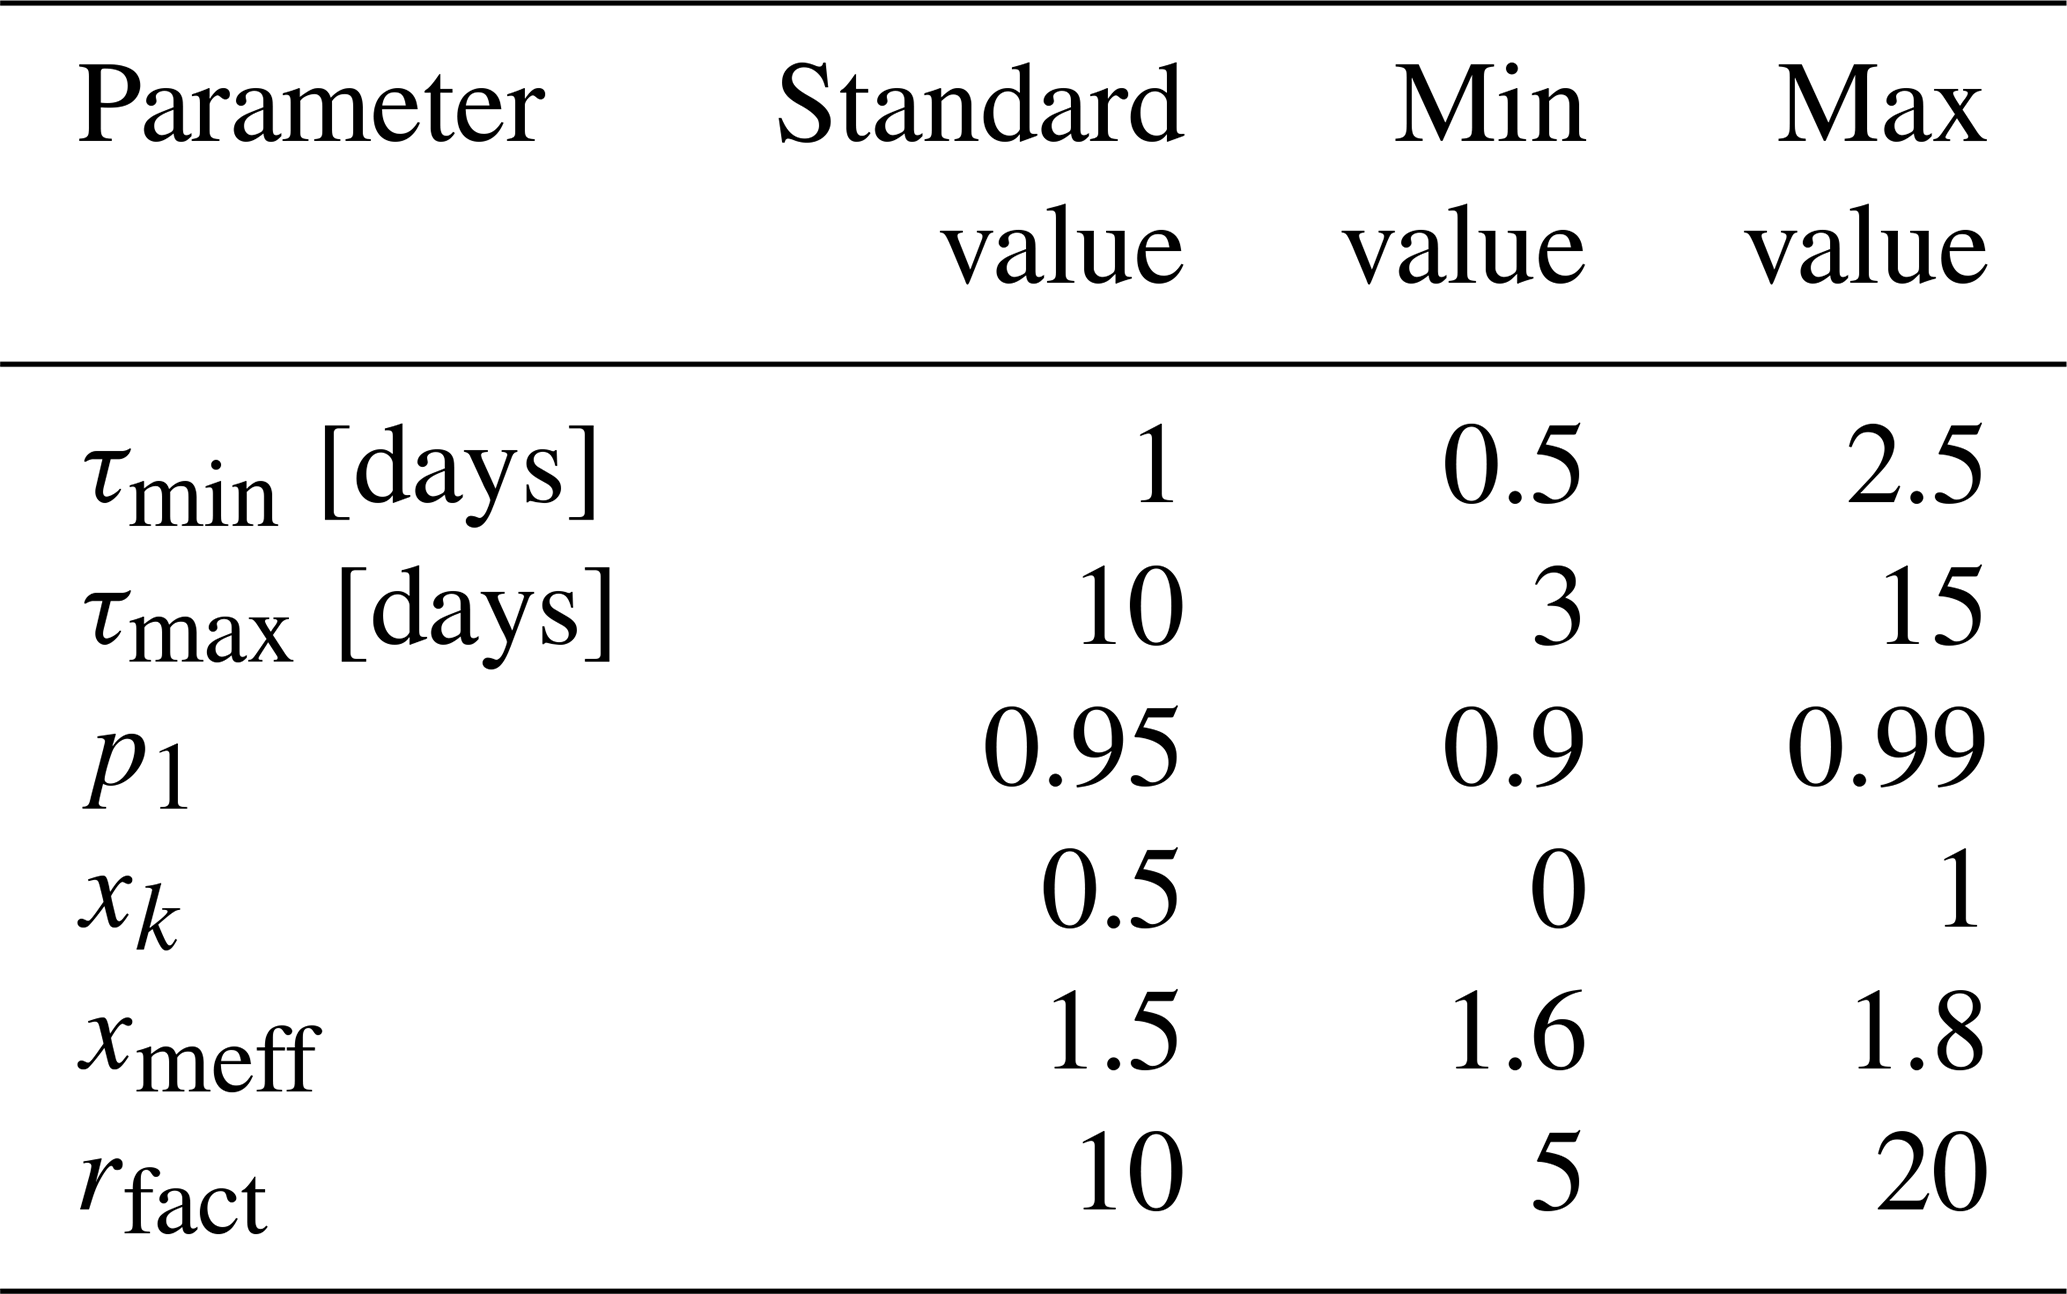
In this study, we utilized a homogeneous earthquake database to implement a declustering method using the Reasenberg algorithm. The default parameters listed in Table 2 were implemented to ensure consistency and reliability of the analysis. By applying the Reasenberg algorithm, 39 978 events were identified as mainshocks and characterized as independent events. In addition, 23 320 events were recognized as aftershocks and foreshocks, representing dependent events in the seismic sequence.
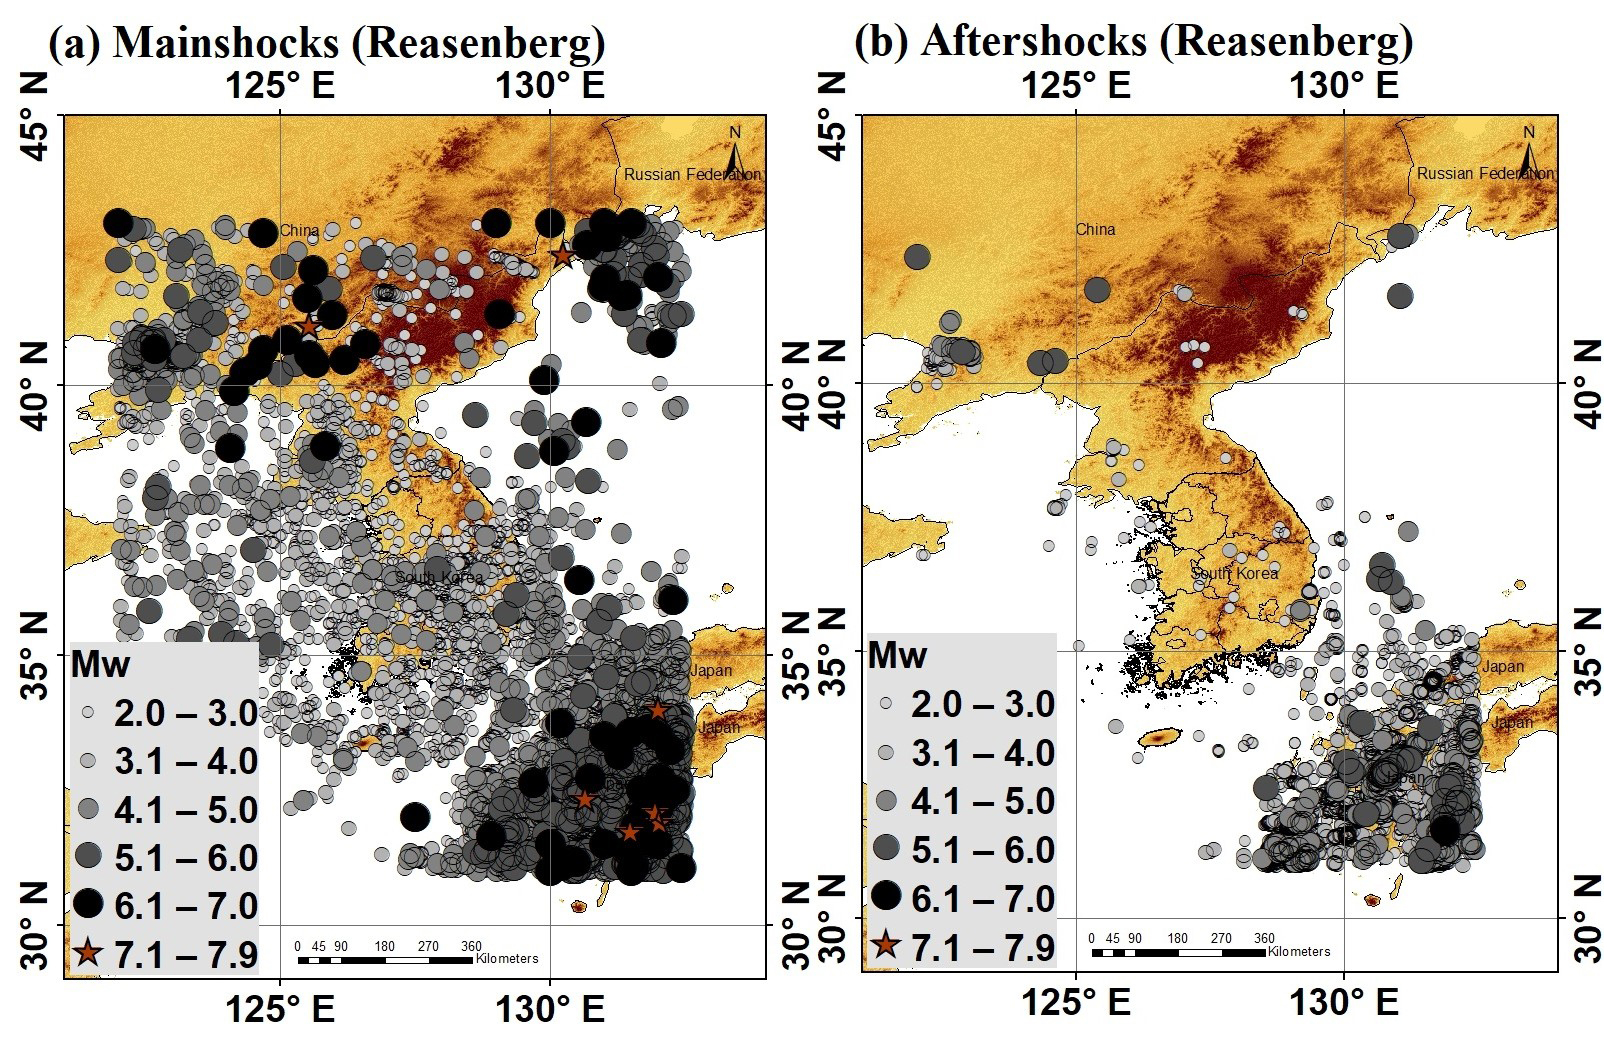
Figure 11Declustered seismicity map using the Reasenberg algorithm depicting (a) mainshocks and (b) aftershocks, covering the period from 1905 to 2023. Terrain basemap generated from the SRTM GL1 digital elevation model (NASA Shuttle Radar Topography Mission, 2013).
A comprehensive declustered seismicity map encompassing the time span from 1905 to 2023, with the application of the Reasenberg algorithm, is presented in Fig. 11. The map provides distinct visualizations for both mainshocks and aftershocks, portrayed separately in Fig. 11a and b, respectively. These detailed seismicity maps contribute to a spatial understanding of earthquake distribution, highlighting regions with heightened seismic activity and illustrating the prevalence of aftershocks in the aftermath of mainshock events. The cluster linkage criteria showed a higher density in the active regions of Japan and the southeastern part of South Korea, suggesting a concentration of dependent seismic events in these areas. Conversely, the density was diffused in other regions, indicating a comparatively lower frequency of clustered events. Such graphical representations enhance the interpretation of seismic patterns and aid researchers and seismologists in discerning the geographical dynamics of earthquake occurrences over a specified period. Magnitude and time histograms were generated to visualize the distribution of the mainshocks and aftershocks identified by the Reasenberg algorithm, as shown in Fig. 12. These plots offer a detailed exploration of seismic activity, portraying the frequency and temporal occurrence patterns of both mainshocks and their associated aftershocks. Analysis of these histograms provides a comprehensive overview of the seismic behavior in the studied regions, aiding in the characterization of earthquake sequences and their temporal evolution.
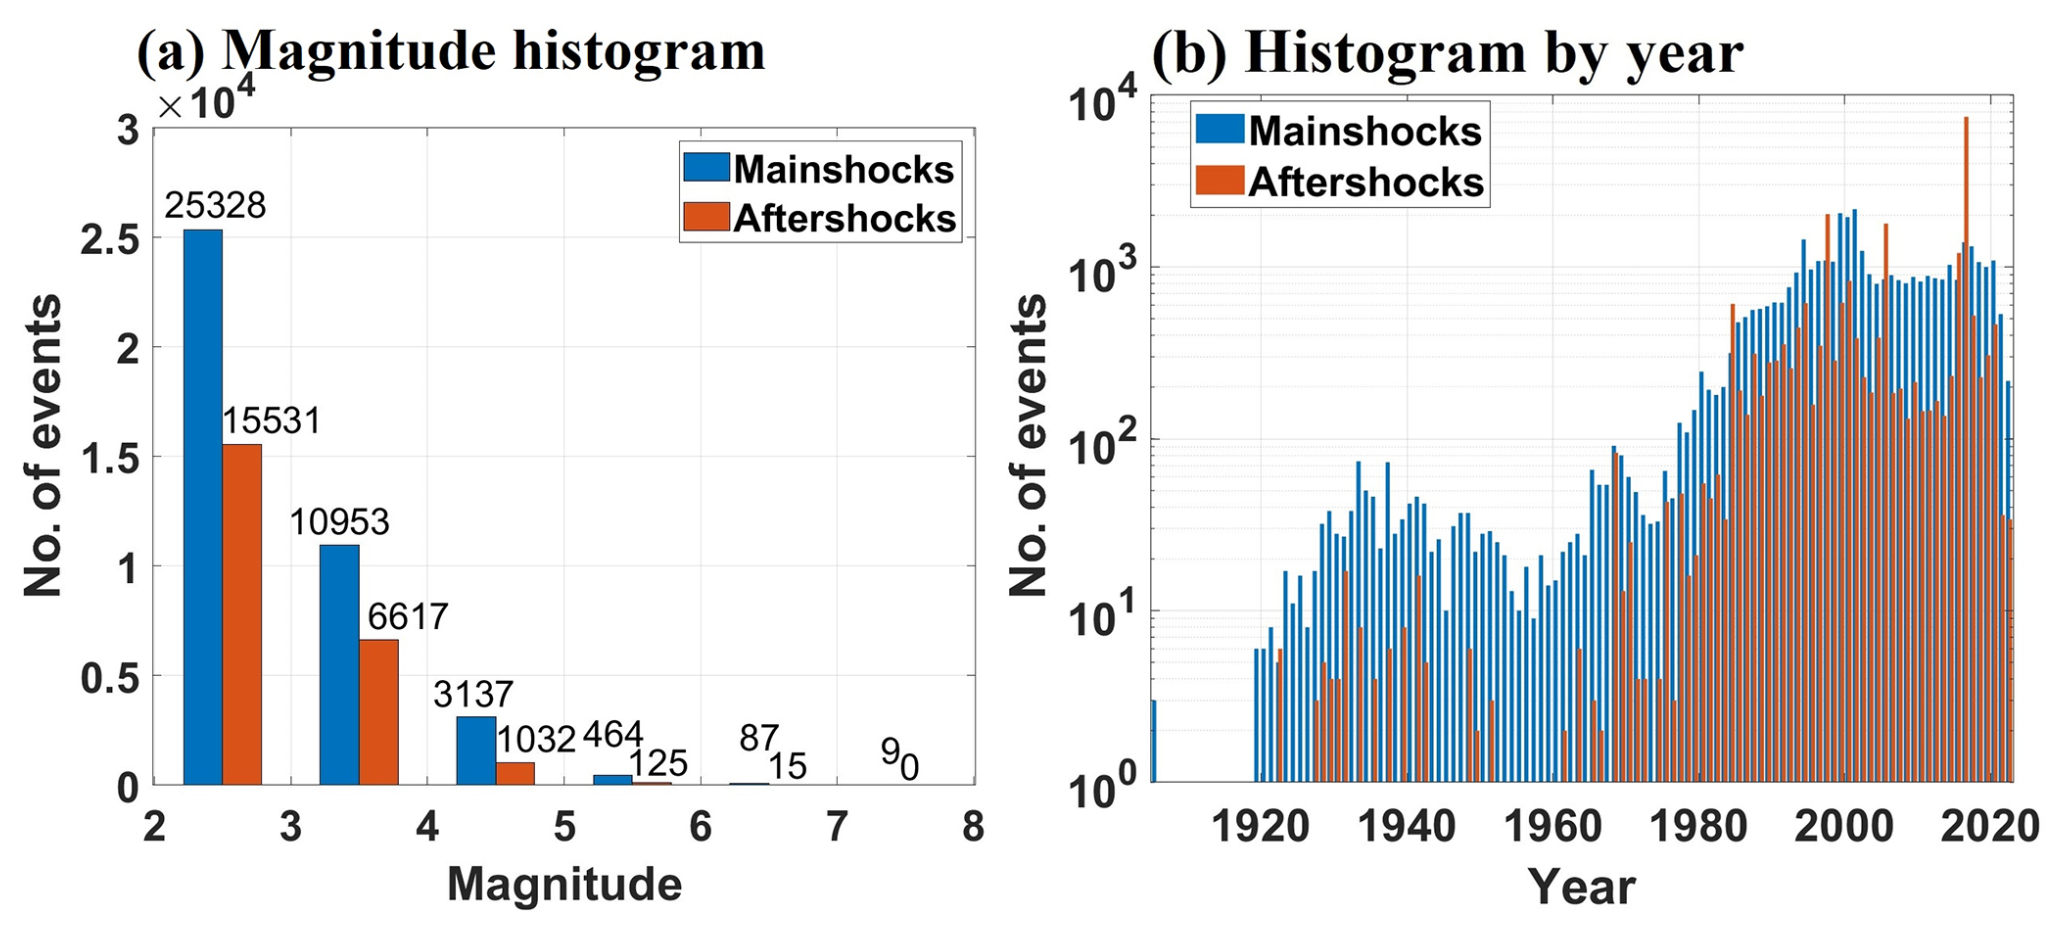
Figure 12Histogram plots for (a) number of events by magnitude and (b) temporal distribution of events for mainshocks and aftershocks using the Reasenberg algorithm.
4.3 Stochastic decluster method
The decluster algorithm, which uses window- and cluster-link-based approaches, involves the use of subjectively chosen parameters, such as the size of windows and the distance between linked nodes. Variations in parameter values lead to variations in declustered catalogs and the assessment of background seismicity estimates. Typically, researchers determine these parameters based on prior expertise, using specific datasets. Depending on the declustering results, a trial-and-error process is often used, with particular attention to how different parameter choices influence the separation between background and clustered events, which may vary across studies and introduce inconsistencies. In contrast to deterministic declustering methods and integrating probabilistic treatments into the clustering model, Marsan and Lengliné (2010) proposed the model-independent stochastic declustering (MISD) approach. This method does not depend on a specific model or parameterization. Essentially, it relies on the fact that seismicity dynamics are a linear cascade of earthquake triggers, which helps to distinguish aftershocks directly triggered by earthquakes from those indirectly triggered (Hainzl and Marsan, 2008). In this method, mainshocks that were sufficiently isolated from other significant seismic events were initially selected to avoid confusion with unrelated earthquakes. Thereafter, the shortest distances from the mainshock to subsequent earthquakes were calculated, providing a more accurate representation of the aftershock. The core of the method involves estimating the probability “ωAB” that an earthquake “B” is an aftershock of earthquake “A”, allowing for a continuous range of probabilities, unlike traditional declustering methods where “ωAB” can only be 0 (not an aftershock) or 1 (aftershock). This probability is derived using stochastic and inversion techniques. The background seismicity was accounted for by comparing the observed aftershock distribution with the expected distribution from normal seismic activity. Parameter optimization, which is achieved by solving nonlinear equations using an expectation–maximization algorithm, ensures accurate and reliable results. This comprehensive approach, which includes modeling both direct and indirect aftershocks and employing the Monte Carlo method for probability estimation, provides a detailed and refined understanding of aftershock patterns and their spatial decay relative to the mainshock. Ideally, this model should be less sensitive to arbitrary parameterization than other declustering methods, thereby enhancing its reliability.
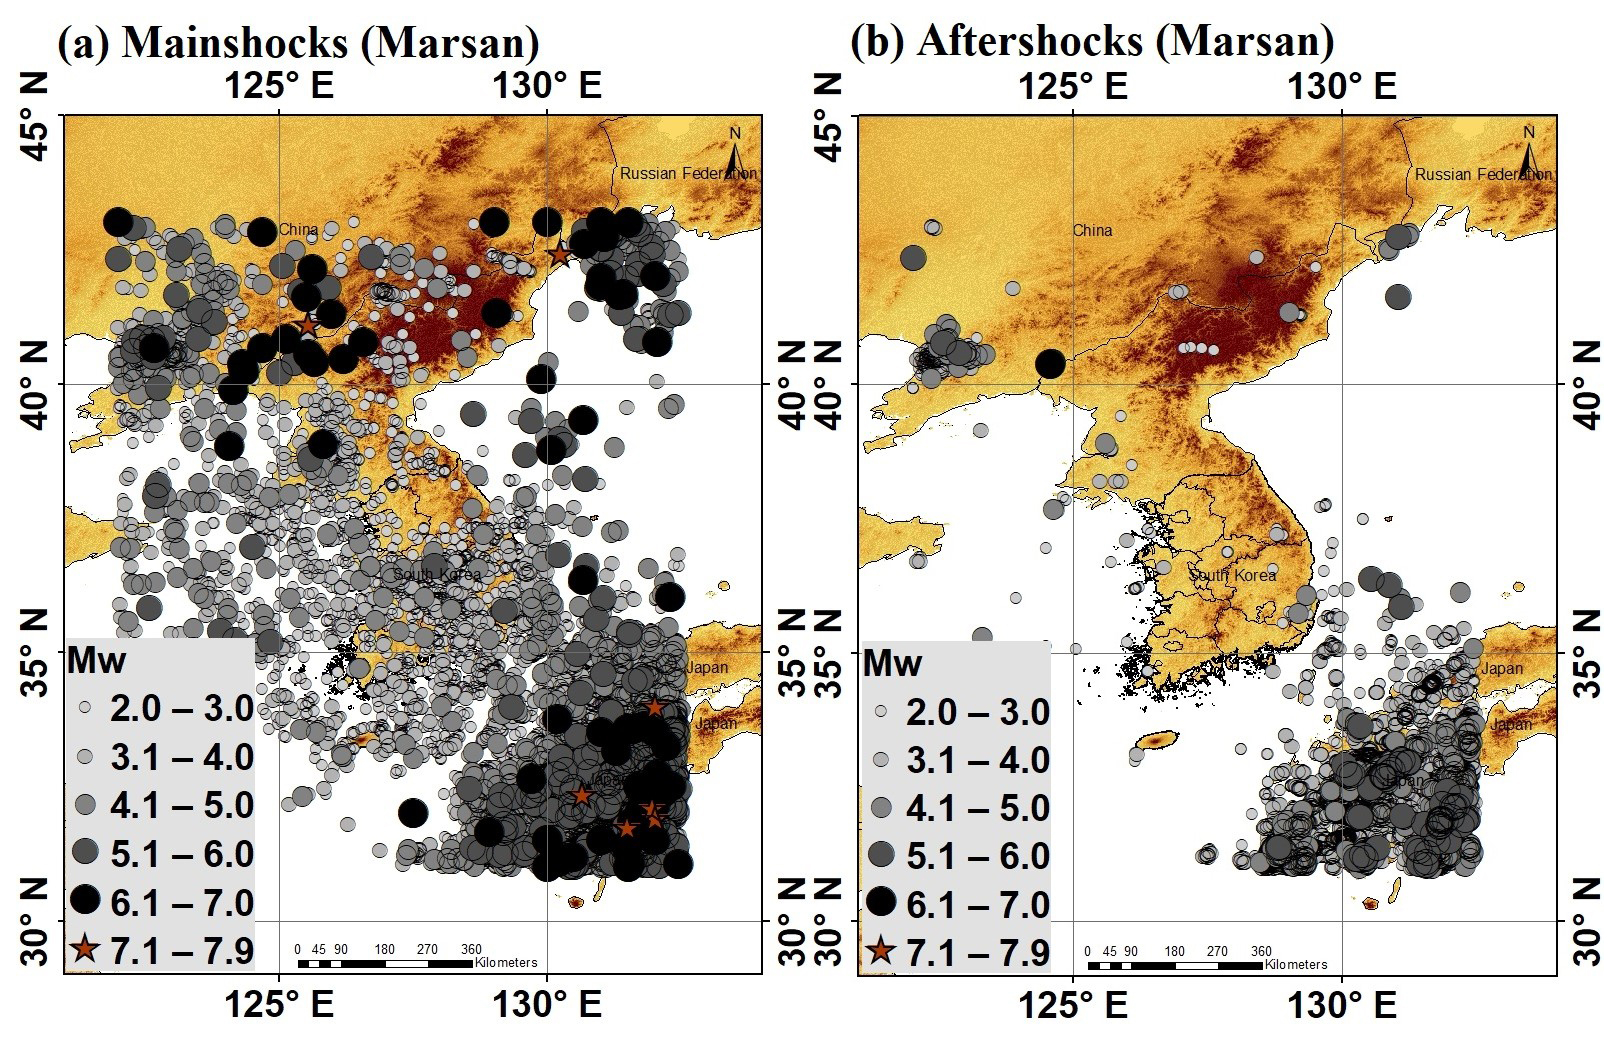
Figure 13Declustered seismicity map using the Marsan algorithm depicting (a) mainshocks and (b) aftershocks, covering the period from 1905 to 2023. Terrain basemap generated from the SRTM GL1 digital elevation model (NASA Shuttle Radar Topography Mission, 2013).
Model-independent stochastic declustering (MISD) analysis was performed using C-based programming code developed by David Marsan (Marsan and Lengliné, 2008). The ISTerre website provides this code, which facilitated the identification of the mainshocks and aftershocks in our study (Marsan, 2007). The utilization of Marsan's code provides a reliable and efficient means for conducting MISD analysis, contributing to the accuracy of our seismic event categorization. From a homogeneous dataset of 63 298 events, the MISD algorithm identified 25 229 mainshock events and 38 069 aftershocks . Notably, this method is more sensitive to seismic patterns than the Reasenberg algorithm and produces a larger number of aftershocks. Figure 13 depicts the declustered seismicity map, spanning 1905–2023, employing the MISD algorithm to categorize the event distribution of the (a) mainshocks and (b) aftershocks. Furthermore, Fig. 14 enriches our analysis by showing the magnitude and time histogram plots, providing insights into the distribution and temporal occurrence patterns of both mainshocks and aftershocks in terms of both magnitude and time.
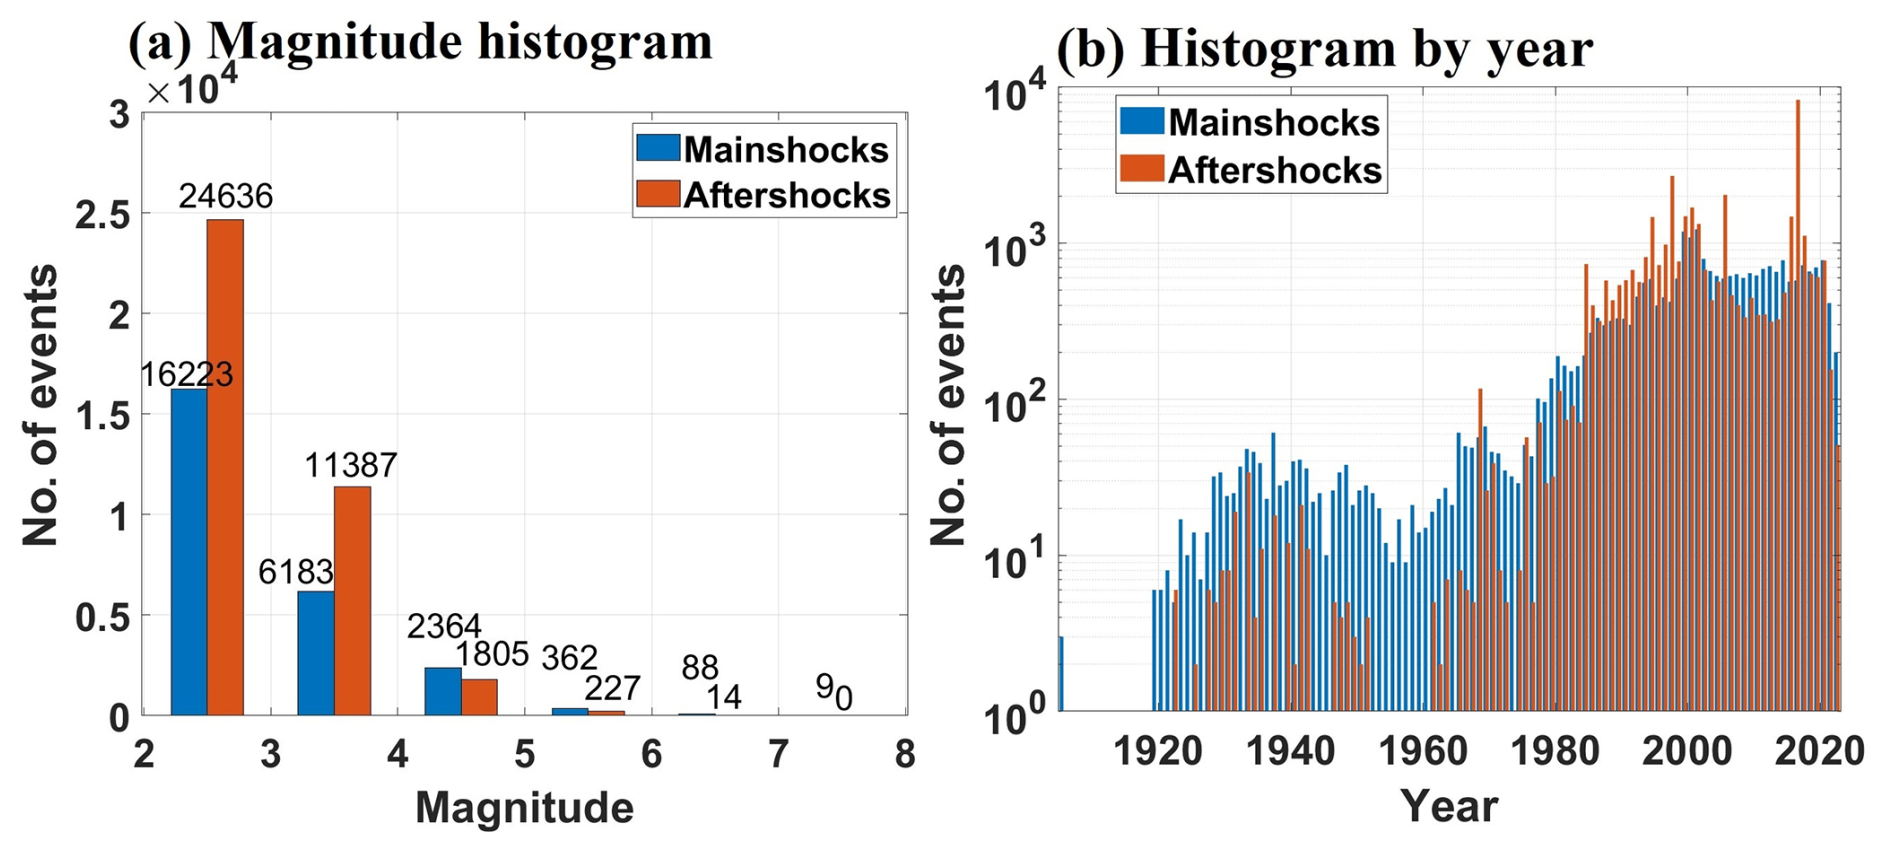
Figure 14Histogram plots for (a) number of events by magnitude and (b) temporal distribution of events for mainshocks and aftershocks using the Marsan algorithm.
The earthquake catalogs exhibit spatial and temporal irregularities. These inconsistencies arise from variations in spatial coverage, changes in network configuration over time, and advancements in the constituent instruments. Hence, an earthquake catalog must be complete with respect to the relative frequency of earthquake occurrences over time. As earthquake catalogs are inherently incomplete across the magnitude range covered, a thorough completeness analysis was conducted. This analysis established the magnitude threshold (Mc) above which all events were reliably recorded. The estimation of Mc is essential for various seismological statistical analyses and plays a critical role in estimating the parameters of the Gutenberg–Richter (GR) law, namely, the a and b values. The seismicity recurrence parameters may exhibit bias without accurate completeness analysis, leading to inappropriate estimations in seismicity analysis and probabilistic seismic hazard assessments (Bayliss and Burton, 2007; Popandopoulos et al., 2016; Sawires et al., 2019). In general, earthquake catalogs become sparser and more uncertain when observed backward in time, indicating that completeness periods fluctuate over time. For large earthquakes, the completeness period extends to pre-instrumental or historical times. Conversely, for small-magnitude earthquakes, completeness was achieved only in the most recent decades of the instrumental epoch because instrumental recording was not available in the past, resulting in the non-recording of many smaller-magnitude events in the region.
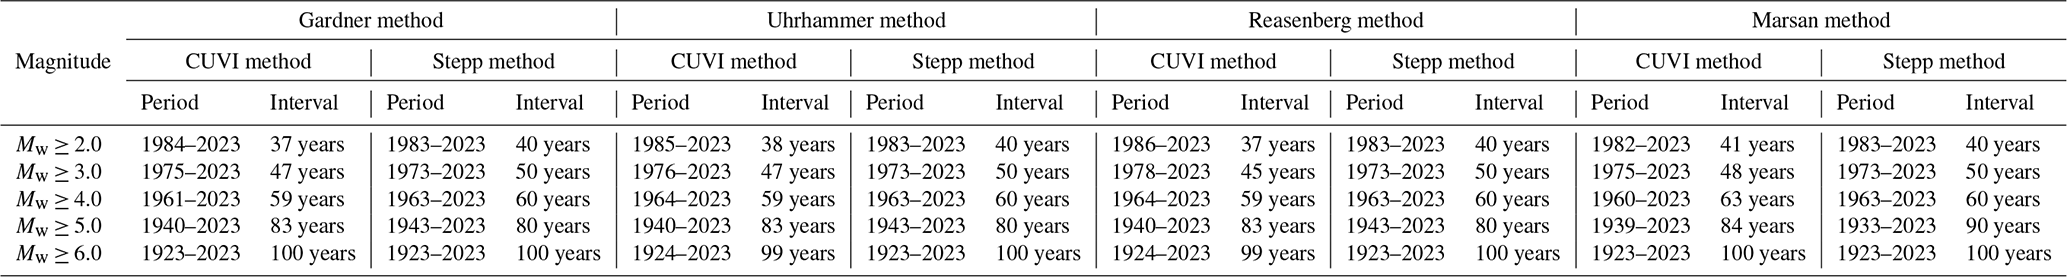
The completeness periods and threshold magnitudes were estimated individually for the four sets of declustered catalogs. In this study, we focused on determining completeness analysis using two methods. The first is the cumulative visual inspection (CUVI) method proposed by Tinti and Mulargia (1985), and the second is based on statistical analysis by Stepp (1972). In the CUVI method, a graph plotting the cumulative number of earthquakes against time duration was generated. The catalog was deemed complete during periods when the earthquake occurrence rate remained constant. It is conventionally assumed that the latest change in slope signifies when the data are complete, and the interval with the highest slope is chosen.
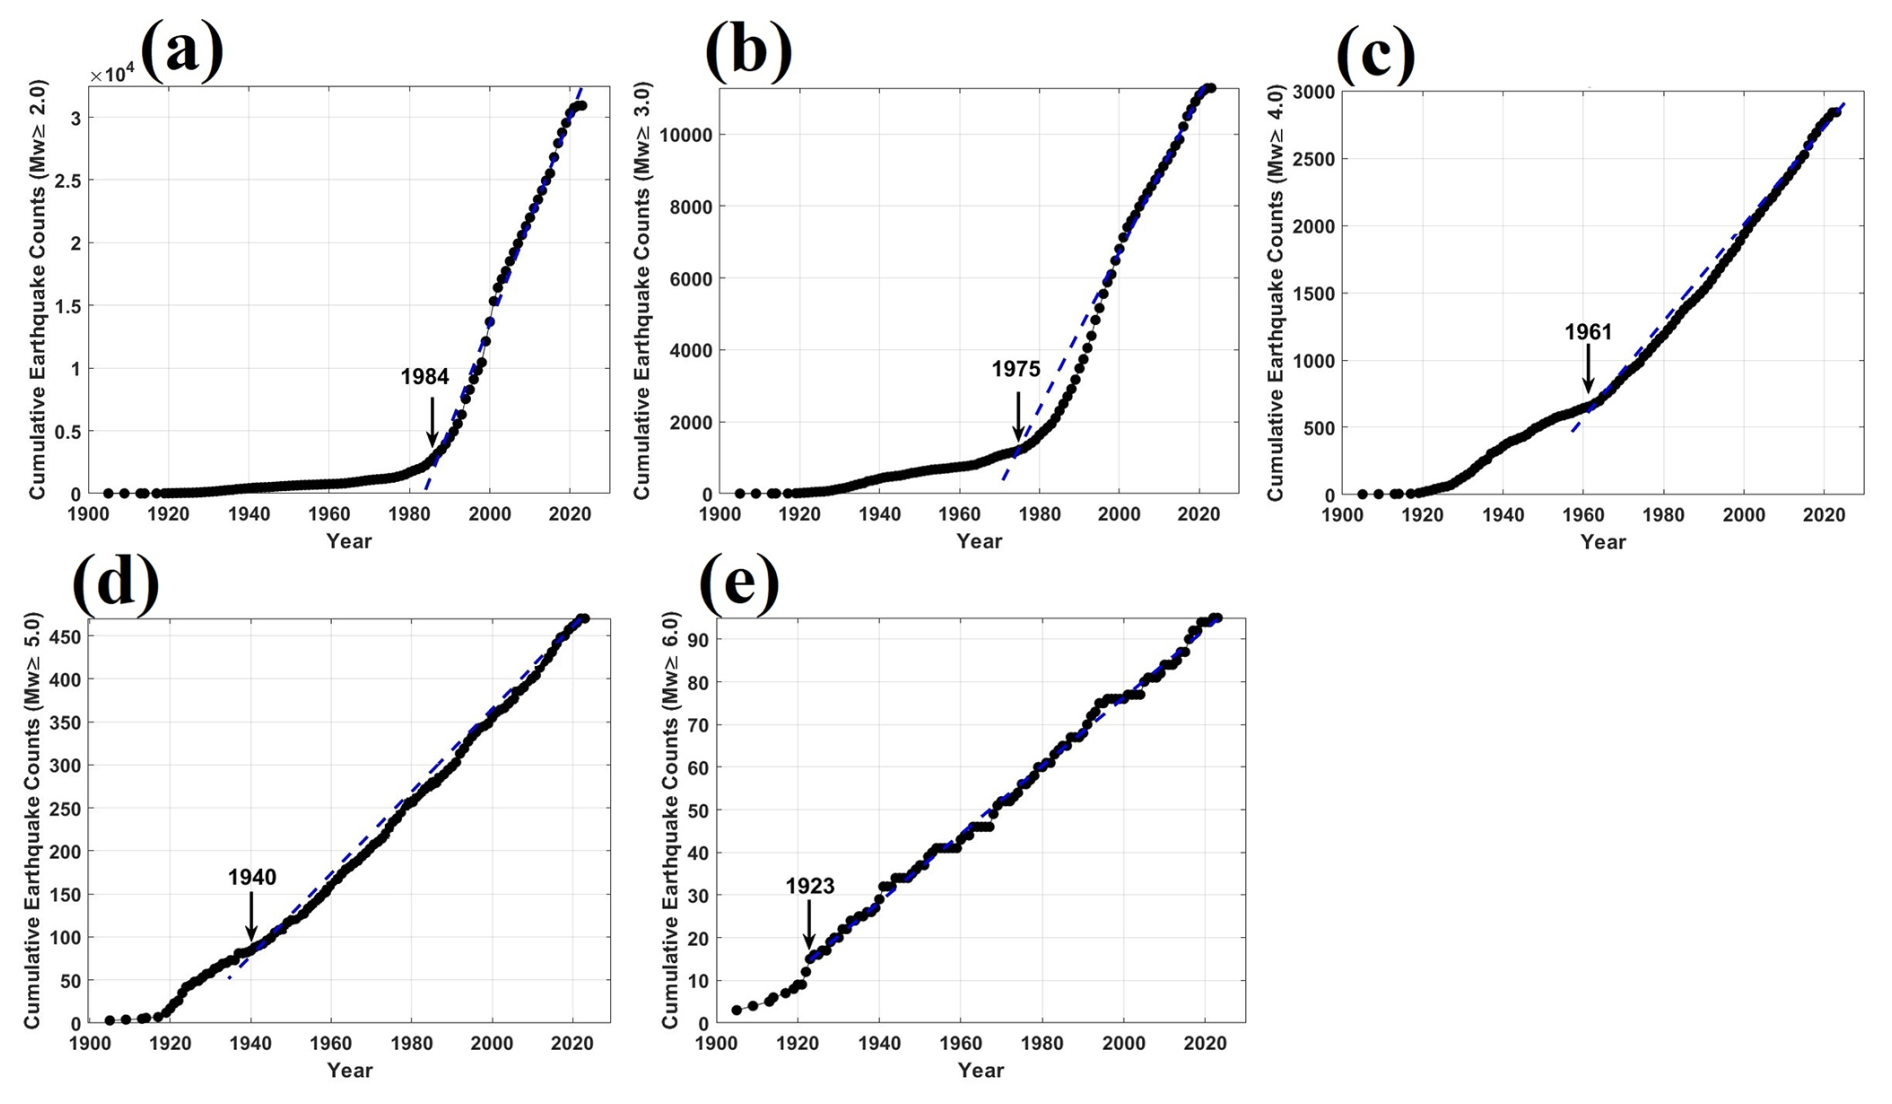
Figure 15Completeness analysis for the Gardner and Knopoff declustered catalog using the CUVI method for each magnitude range: (a) Mw ≥ 2.0, (b) Mw ≥ 3.0, (c) Mw ≥ 4.0, (d) Mw ≥ 5.0, and (e) Mw ≥ 6.0. Arrows indicate the completeness year.
In this section, analysis conducted using the Gardner and Knopoff declustered earthquake catalog is presented. The results stemming from this particular catalog are discussed subsequently. For a comprehensive view, the results obtained from the utilization of alternative declustered catalogs are provided in the Supplement (Figs. S1–S6). This separation ensures clarity and allows readers to explore the outcomes of the various declustered datasets without complicating the primary analysis presented in the main text. In this study, a completeness analysis was conducted by dividing the declustered earthquake catalog into magnitude intervals, starting from a magnitude of 2.0 with an increment of 1. The cumulative number of events for each magnitude bin was calculated and plotted against the time period, as shown in Fig. 15. A graph depicting the cumulative number versus the time period was visually inspected to identify the point at which the curve becomes a straight line. This point was considered the period of completeness for the magnitude bins, and the calculated completeness period for each magnitude is tabulated in Table 3.
Table 3Completeness periods for different magnitude classes using the CUVI and Stepp methods.
The second method, proposed by Stepp (1972), relies on the assumption that earthquake occurrences within each magnitude subclass adhere to a Poisson distribution when represented as a point process over time. In this regard, the catalog was segmented into five magnitude bins: 2 ≤ Mw < 3, 3 ≤ Mw < 4, 4 ≤ Mw < 5, 5 ≤ Mw < 6, and Mw ≥ 6. Subsequently, the average number of earthquakes per decade was estimated for each magnitude bin. Let the number of events per unit time interval be defined as x1, x2, …, xn for each magnitude bin; the unbiased estimate of the mean rate per unit time interval is given by Eq. (11):
where n denotes the unit time interval. The variance is inversely proportional to the length of the sample period and is defined as , where T is the duration of the sample. The standard deviation of the mean occurrence is defined as . A plot of Stepp's method for the five magnitude bins is shown in Fig. 16, where the standard deviation of the mean rate for the different magnitude bins versus time interval is plotted. The time interval used in the present study is 10 years, starting from the present year (2023) and extending backward into the past. Thereafter, tangent lines with a slope of for each magnitude bin are plotted. The completeness period of that magnitude class is identified during the period when the data followed a trend parallel to the tangent line. The point at which this downward trend deviates indicates the beginning of an incomplete period of catalog reporting for a specific magnitude interval.
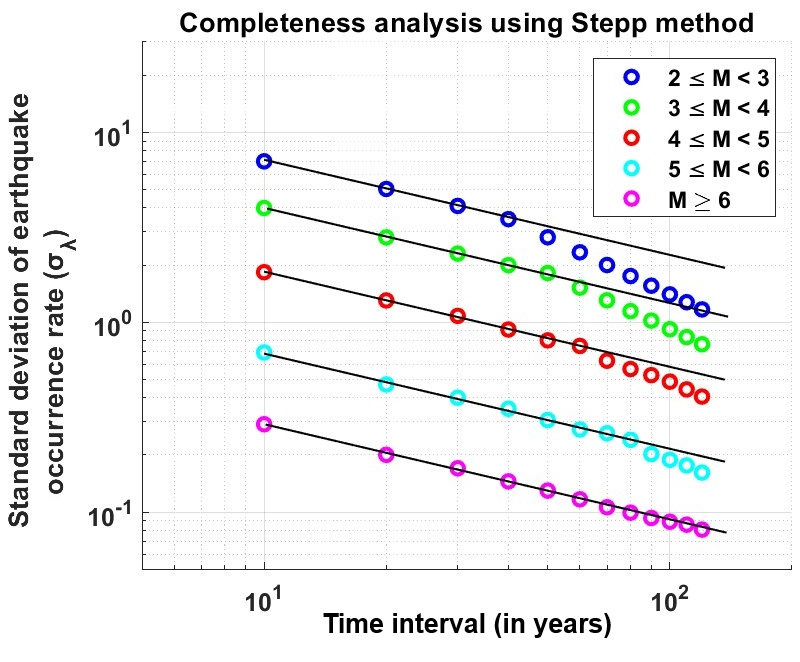
Figure 16Completeness analysis of the Gardner and Knopoff declustered catalog using Stepp's method for different magnitude ranges with a 10-year time interval.
A summary of the completeness analysis using the two methods (CUVI and Stepp) for all four declustered catalogs is presented in Table 3 for comparison. In the past, only significantly large earthquake events were recorded or reported. However, smaller earthquakes began to be recorded as the seismograph network expanded and became more sensitive over time. The completeness results based on both methods indicate the completeness level of small- to moderate-magnitude earthquakes has been achieved over the last 40 years with advancements in seismic monitoring. Interestingly, the completeness period tended to increase for higher-magnitude earthquakes, showcasing the limited capabilities of the seismograph network to capture moderate to large seismic events across a broader range over time. The completeness analysis results for both methods yielded consistent ranges of completeness periods (Table 3). The similarities between the findings of the two methods suggest a degree of validation and mutual support, reinforcing the accuracy of the identified completeness periods for seismic events. The Supplement includes detailed information on the periods of magnitude completeness obtained through other declustered catalogs (Figs. S1–S6). The completeness analysis results for the multiple declustering catalogs enhanced the comprehensiveness of the study, allowing for a thorough comparison of their findings. Notably, the completeness period for the magnitudes across these declustered catalogs demonstrated similar results, reflecting a consistent trend in earthquake recordings over time. Despite variations in the mainshocks identified by each declustered catalog, the coherence in the completeness periods suggests a shared understanding of seismicity patterns within the studied region.
The results of the earthquake declustering analysis conducted for the Korean Peninsula using four discrete methods – Gardner and Knopoff, Uhrhammer, Reasenberg, and Marsan and Lengliné – reveal variations in the categorization of aftershocks and dependent events, as presented in Table 4. Different methods have distinct criteria for identifying dependent events. Consequently, these procedures yield different numbers of independent and dependent events. In particular, the Gardner and Knopoff algorithm exhibited a notable tendency to classify a significant proportion (51 %) of events with stronger shaking as dependent events, characterizing them as aftershocks. Notably, a key contributing factor to the higher count of dependent events observed with the Gardner and Knopoff algorithm was the large spatial window employed, which was originally developed based on the seismic characteristics observed in earthquakes in California. By contrast, the Uhrhammer method, while identifying dependent events, uses a more conservative approach, resulting in a lower percentage of aftershocks. The Reasenberg algorithm demonstrated the most conservative stance, removing the minimal number of stronger dependent events and accounting for approximately 37 % of the datasets as aftershocks. Importantly, the Marsan and Lengliné method introduces a new perspective on the stochastic approach and classifies fewer mainshocks, accounting for only 40 % of the dataset. This method displays a distinctive tendency to identify a higher proportion of aftershocks, contributing to a more restrained count of mainshocks. This observation adds a layer of complexity to the overall findings, suggesting that the algorithm tends to overestimate aftershocks compared to other traditional methods. In addition to the results obtained for the Korean Peninsula, Table 4 presents a comparative summary of findings from selected studies conducted in other regions worldwide. These studies report the proportion of dependent events removed and mainshocks retained using various declustering algorithms. While the tectonic settings differ, the consistent application of comparable methodologies allows for meaningful contextualization of our findings. For example, similar to our results, previous studies have shown that the Gardner and Knopoff method tends to eliminate a larger percentage of events due to its conservative space–time windowing, whereas clustering methods like Reasenberg retain more mainshocks.
Table 4Declustering results for the Korean Peninsula and summary of findings from selected studies in other regions.
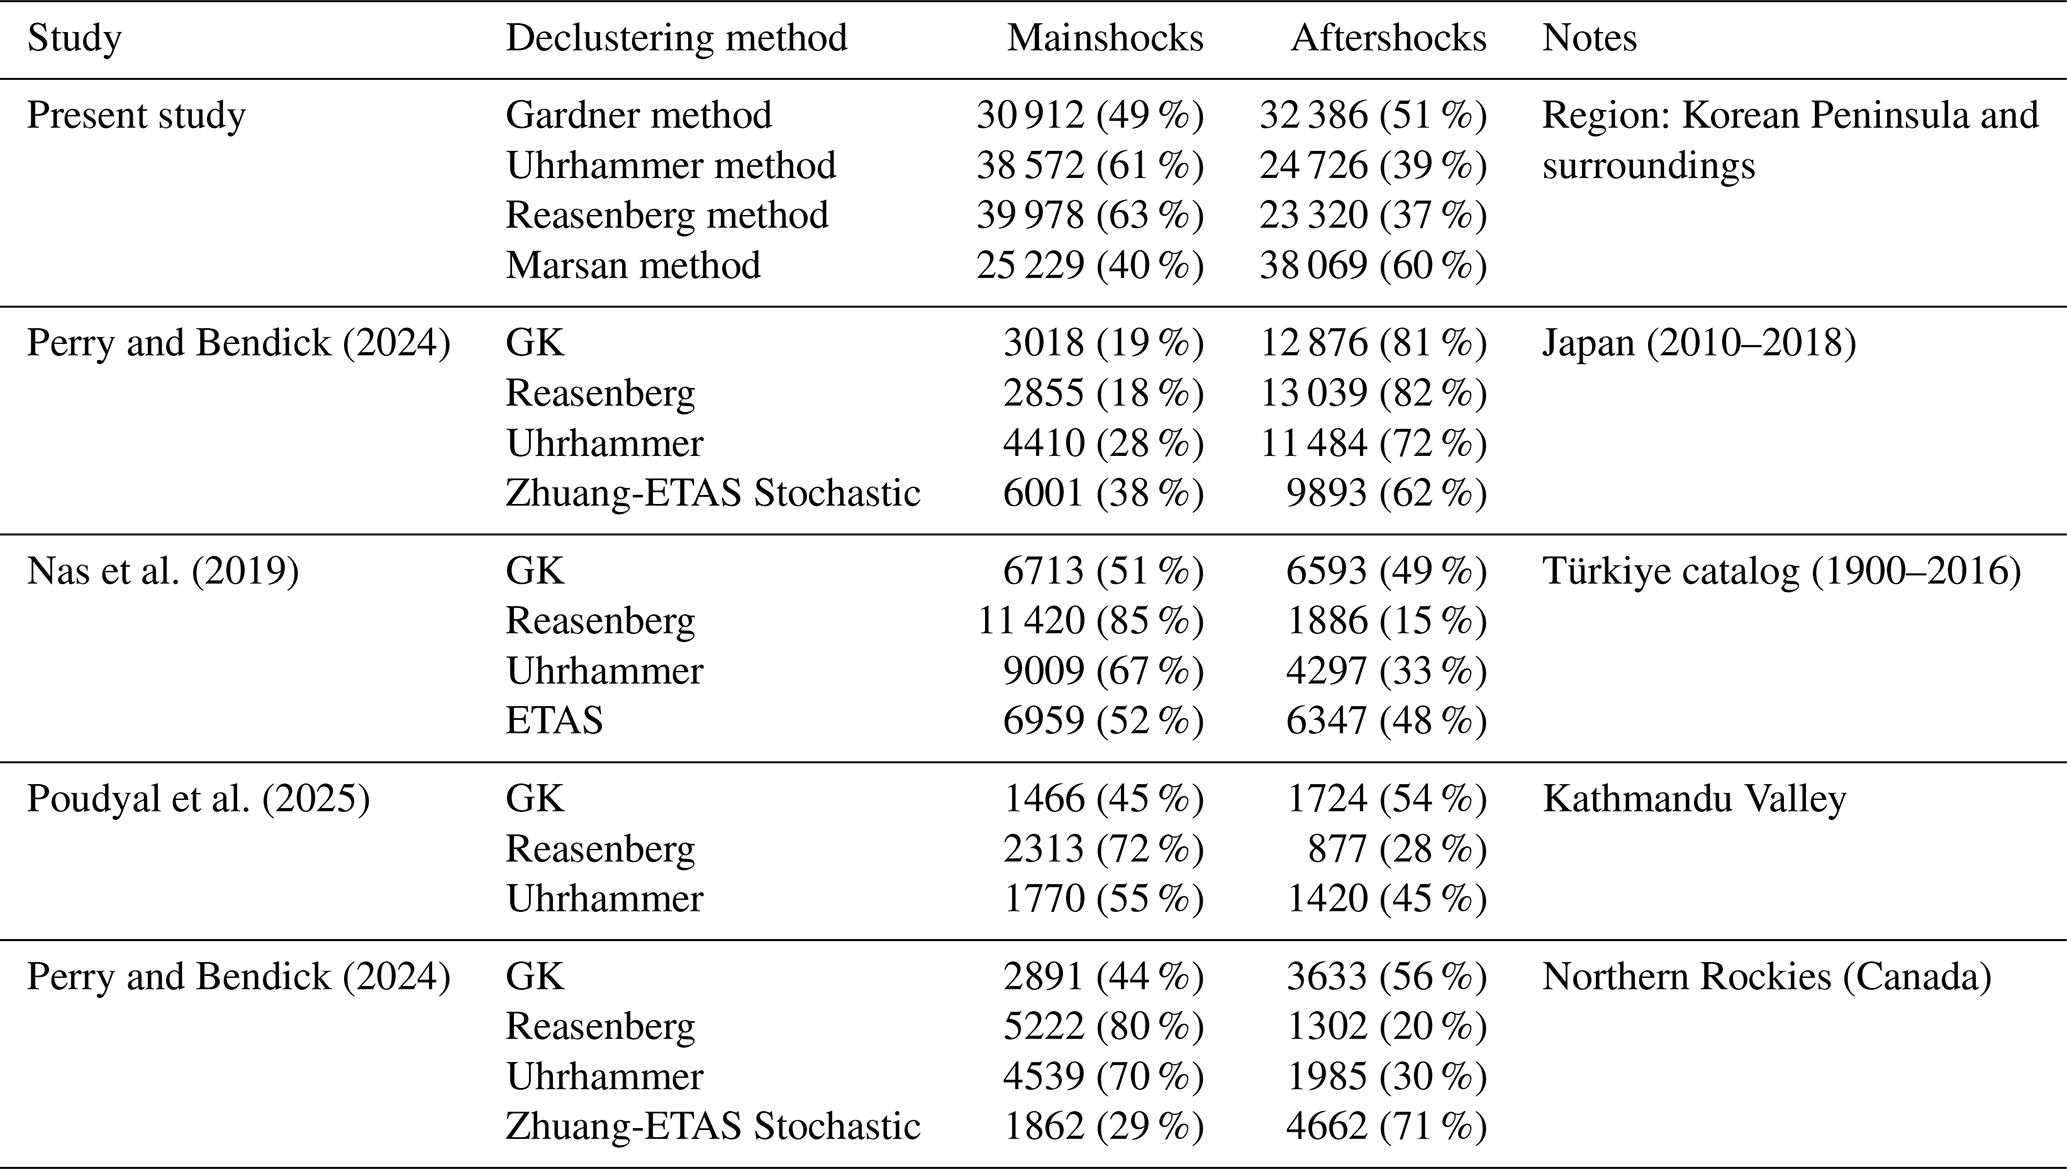
GK – Gardner and Knopoff (1974). ETAS – Zhuang et al. (2002).
In addition to the declustering analysis, we evaluate the impact of each declustering method on the frequency–magnitude distribution by comparing the Gutenberg–Richter (GR) parameters of the homogeneous and declustered catalogs. The GR relationship (Gutenberg and Richter, 1944) expresses the logarithmic frequency of earthquakes exceeding a given magnitude M and is defined as (Eq. 12)
where N is the cumulative number of events with magnitude ≥ m, the a value characterizes the overall seismicity rate, and the b value (the slope parameter) describes the relative proportion of small earthquakes to large earthquakes. To assess the consistency of this distribution across different catalogs, we estimate the b value using the maximum likelihood method proposed by Aki (1965) and Utsu (1965), given by Eq. (13):
where Mmean is the mean magnitude, Mmin is the minimum magnitude above which the catalog is complete, and Δm is the magnitude bin size (= 0.1 in the present study). Once the b value is estimated, the corresponding a value is computed by fitting the GR (Eq. 12).
Table 5Summary of results, including Gutenberg–Richter a and b values for all declustered catalogs, along with the changes in a and b (Δa, Δb) relative to the homogeneous catalog.
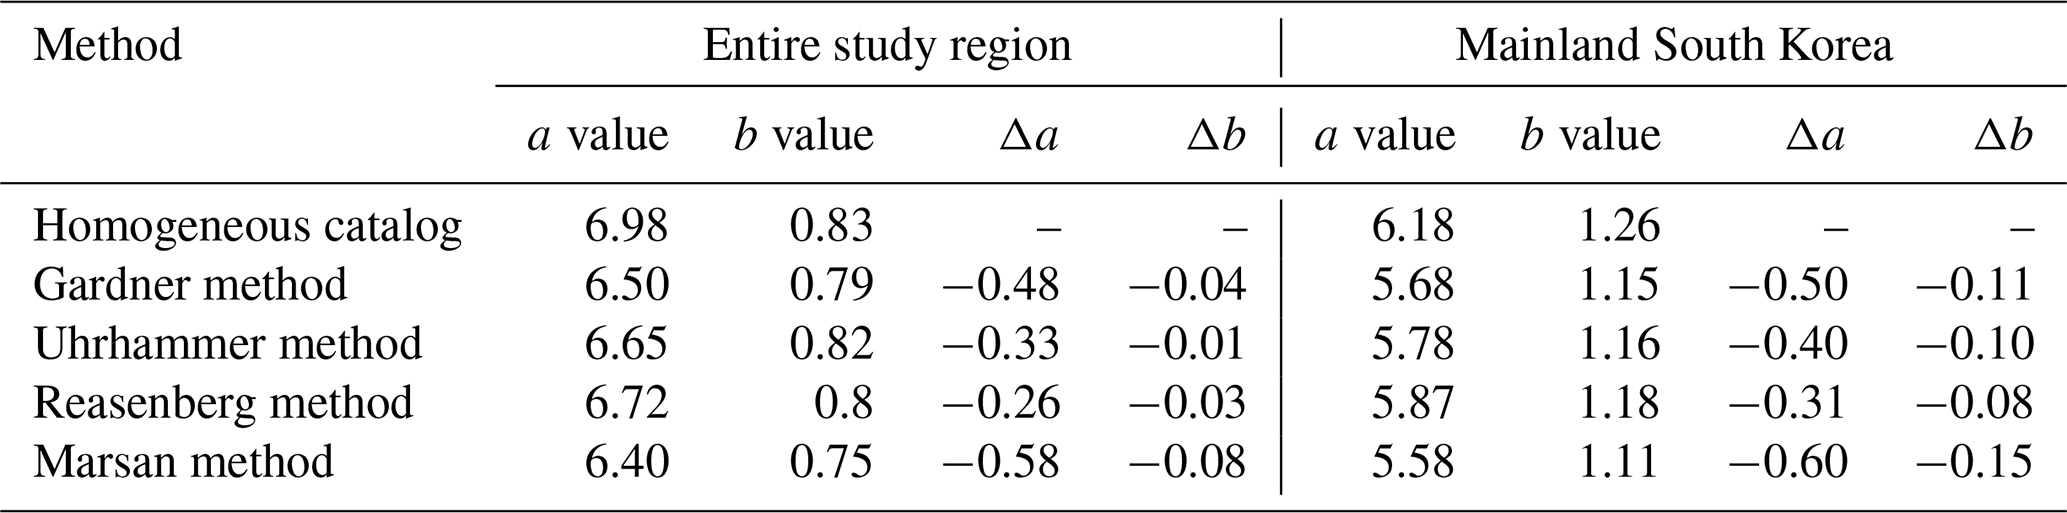
The results of this analysis are summarized in Table 5. The parameters were estimated separately for the entire study area and the South Korean mainland, allowing for the assessment of regional variations. The comparison of magnitude–frequency distributions shows that b values remain relatively consistent across different declustering methods. However, notable variations were observed in the a values, which reflect the overall rate of seismicity. These variations reflect differences in the total number of events retained in each catalog and thus in the estimated seismicity rates. In general, all declustering methods reduce the a value relative to the homogeneous catalog, reflecting a lower total number of earthquakes retained in the catalogs after dependent events are removed. The b value, which characterizes the relative proportion of small to large earthquakes, also shows some variation across methods. For the entire study region, the b value ranges from 0.75 (Marsan method) to 0.82 (Uhrhammer method) compared to 0.83 in the raw catalog. The Marsan method, which retains 40 % of mainshocks, results in the largest drop in both a value () and b value (), suggesting a significant reduction in both overall seismicity rate and the proportion of smaller earthquakes. The Gardner method, which retains 49 % of mainshocks, also shows a notable reduction (, ), followed by more moderate decreases using the Uhrhammer and Reasenberg algorithms. On the South Korean mainland, similar trends are observed. The b value declines from 1.26 in the raw catalog to as low as 1.11 under the Marsan method (), with corresponding reductions in the a value from 6.18 to 5.58 (). This implies that the Marsan method preferentially removes smaller-magnitude clustered events, leaving a catalog weighted more toward larger events. Overall, the Marsan method shows the strongest influence on both the frequency and the magnitude distribution of seismicity, while Uhrhammer and Reasenberg preserve a b value closest to that of the homogeneous catalog. A decrease in the b value is often interpreted as an indication of higher regional stress and a catalog dominated by relatively larger events. On the other hand, the a value represents the overall rate of seismicity, and a reduction implies fewer expected earthquakes, which can significantly affect seismic hazard calculations. Thus, the catalog declustering algorithm directly impacts both the estimated occurrence rates of earthquakes and the inferred tectonic behavior of the region. Although the present analysis provides a first-order assessment based on spatially aggregated regions, a more robust evaluation of declustering impacts on hazard would require incorporating detailed source-based models. These would involve polygonal or tectonic source zones, enabling improved source characterization and more accurate regional seismicity modeling. Therefore, careful evaluation of the declustering approach is essential for producing robust seismic source models, particularly in regions with frequent clustered seismicity.
The time-series analysis of the cumulative seismicity for each algorithm is visually depicted in Fig. 17 for the mainshocks and Fig. 18 for the aftershocks. These plots provide a comprehensive representation of the cumulative number of seismic events over time. In Fig. 16, which focuses on the mainshocks, the trends observed across the algorithms provide valuable insights into the temporal distribution of significant seismic events in the region. Each algorithm's distinctive declustering approach becomes apparent and influences the accumulation of mainshocks over time. Notably, the Reasenberg algorithm, with its tendency to classify a higher proportion of events as mainshocks, may exhibit a steeper upward trajectory in the cumulative seismicity plot compared with the more conservative approaches of the others. By contrast, in Fig. 17, the Marsan and Lengliné method, with its tendency to identify more aftershocks, may show a steeper pattern in the cumulative plot. Time-series plots serve as tools to assess the performance of declustering algorithms over time, allowing researchers and seismic hazard practitioners to identify patterns, anomalies, and potential areas of improvement. In addition, the plots for mainshocks and aftershocks provide valuable information for refining declustering methodologies and enhancing our understanding of seismic activity in the Korean Peninsula. For a visual representation, the time of occurrence vs. a latitude–longitude comparison plot of the mainshocks obtained from the four declustering algorithms is depicted in Fig. 19. The seismic activity pattern in the region reveals that no large (Mw ≥ 6) earthquakes have occurred in the Korean Peninsula over the past 40 years, with earthquakes occurring predominantly in the Mw 2–5 range. This implies that the region predominantly experienced low to moderate seismic activity. The earthquake cluster indicates a relatively stable seismic environment for the Korean Peninsula, with occasional moderately high tremors. While this might suggest a relatively low level of seismic hazard based on recent activity alone, historical records and paleoseismic studies indicate that larger, potentially damaging earthquakes have occurred in the region. Thus, the absence of large earthquakes in recent decades should not be interpreted as an assurance of long-term stability. Therefore, although recent data indicate a reduced likelihood of significant seismic events, the limitations of earlier data introduce a degree of uncertainty into long-term seismic hazard assessments. This highlights the importance of considering both instrumental and historical information when evaluating regional seismic hazard and risk analysis.
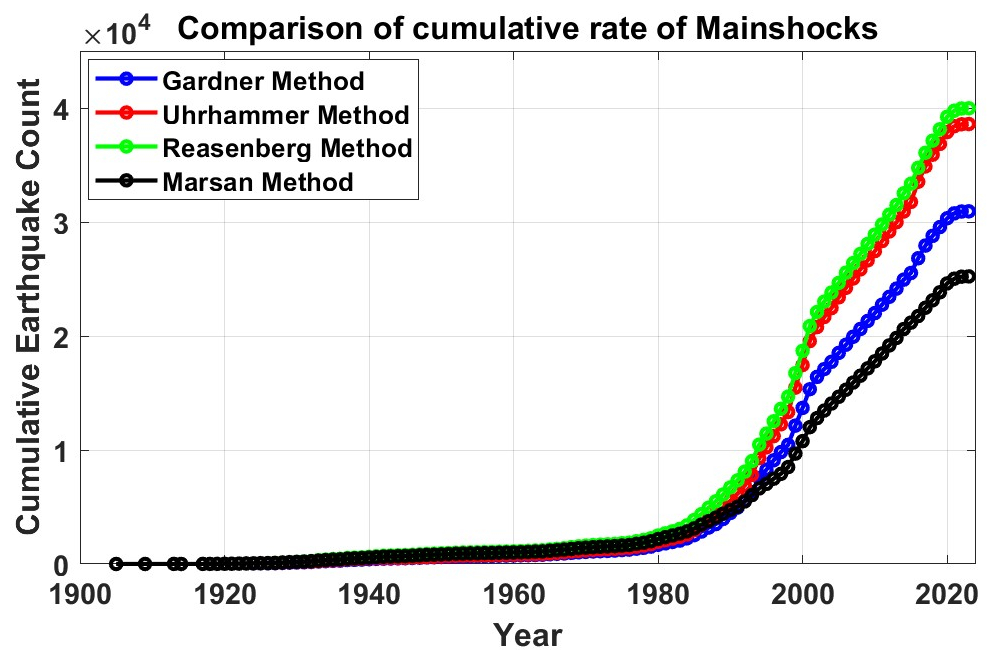
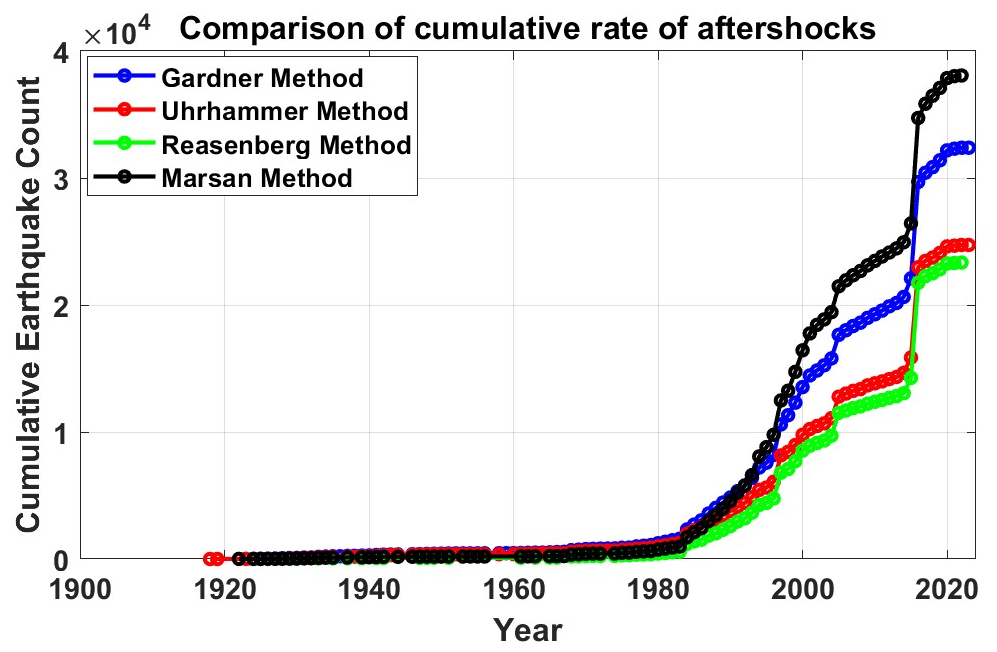
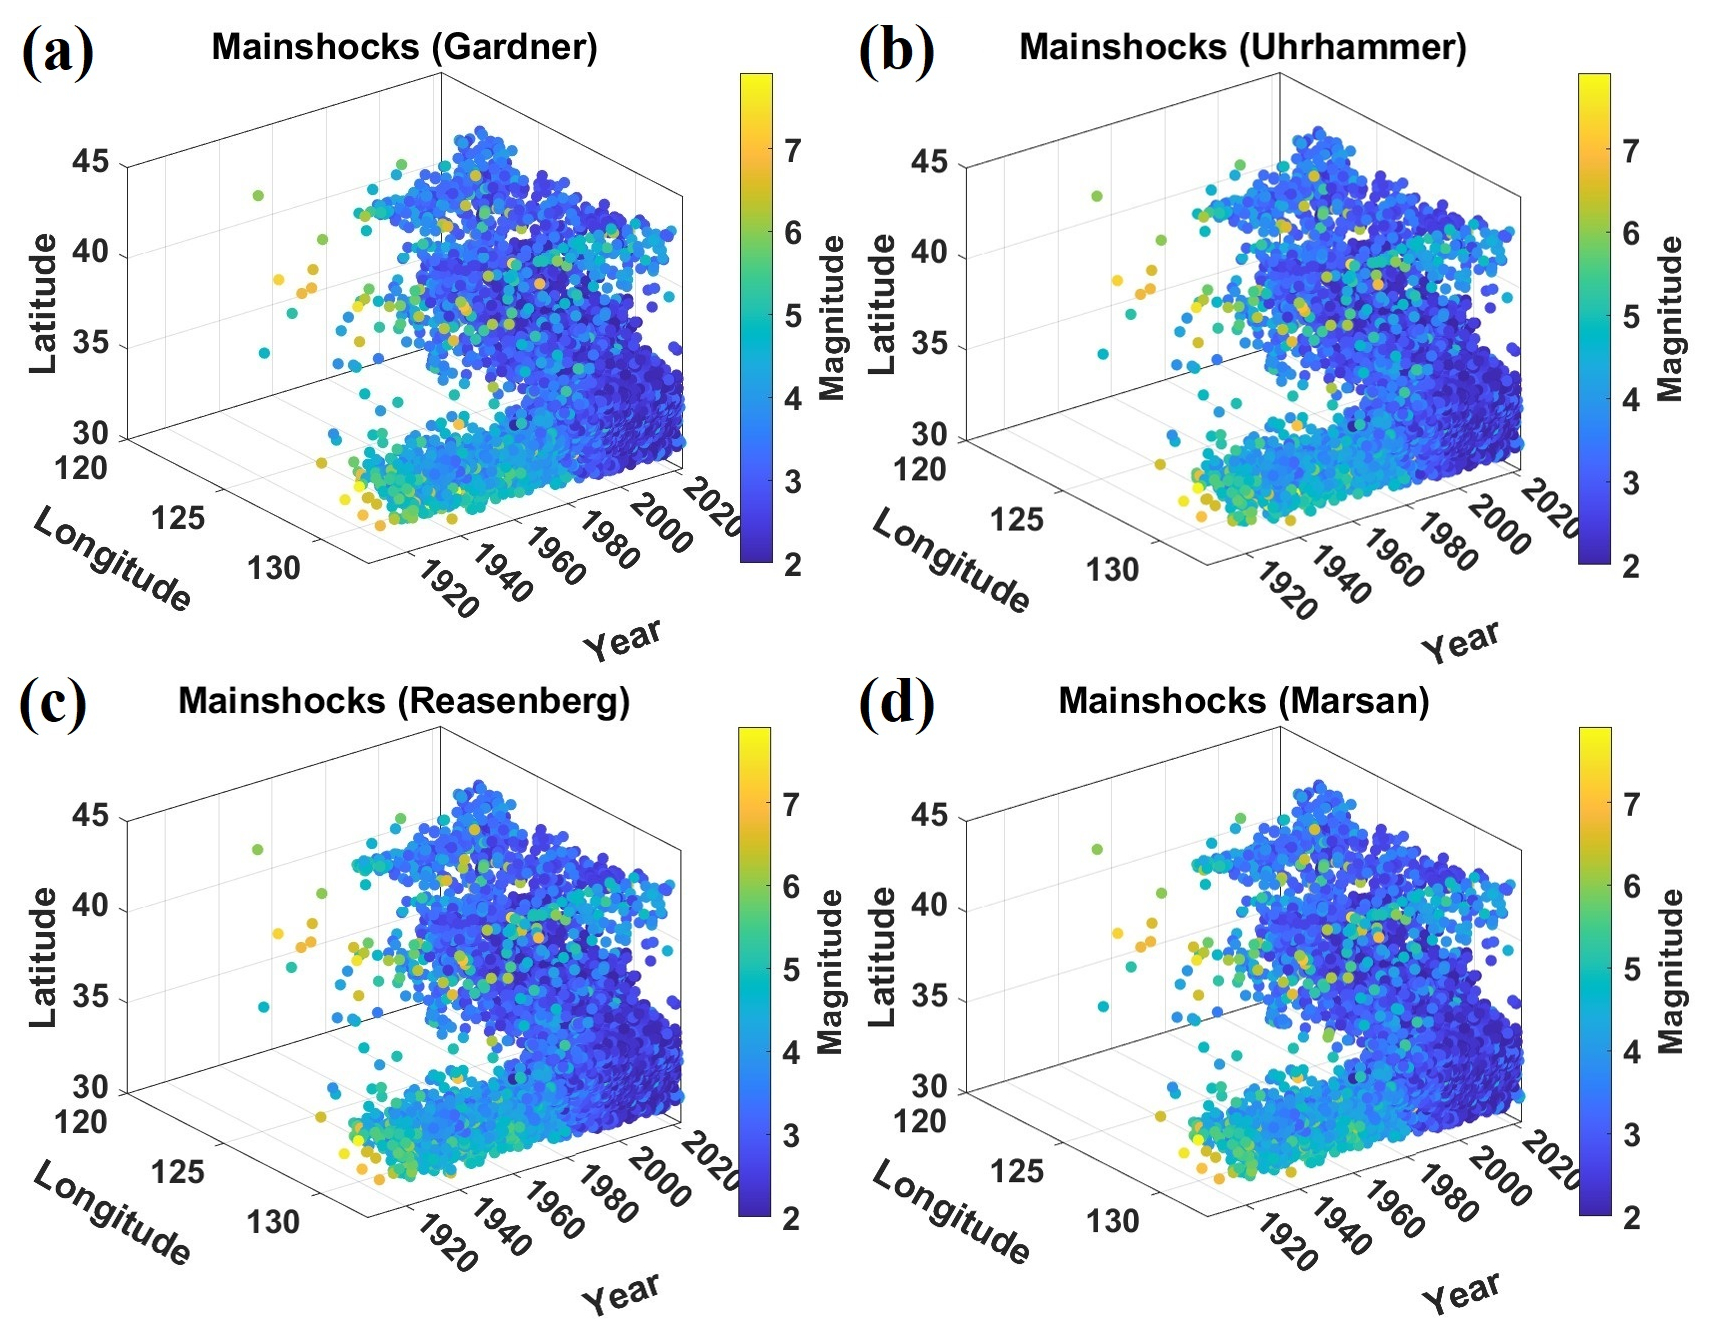
Figure 19Time of occurrence vs. latitude–longitude comparison plot of mainshock earthquakes using the (a) Gardner method, (b) Uhrhammer method, (c) Reasenberg approach, and (d) Marsan method.
In this study, we prepared a homogeneous and complete earthquake catalog for the Korean Peninsula and observed disparities in the declustering results. In South Korea, there is a high probability of seismic events in Gyeongsangnam-do Province (southeastern region), highlighting the importance of seismic hazard evaluation for the region. The present study emphasizes the importance of evaluating the effectiveness of declustering techniques in seismic catalogs, focusing not only on the temporal properties of events but also on their spatial features through clustering techniques. Additional supplementary material is available, including a homogenized earthquake catalog, a declustered earthquake catalog, and the results of the completeness analysis. Researchers can access these resources in the Supplement. A particular approach may not be suitable for different tectonic settings, emphasizing the need for continued refinement and adaptation of declustering algorithms to enhance their accuracy in seismic hazard assessments. This study provides valuable insights into seismic activities in the South Korean region and serves as a foundation for further research to optimize declustering methodologies for enhanced seismic risk evaluation and mitigation strategies. Nonetheless, identifying the most effective method for removing dependent earthquakes is challenging because there is no inherently unique approach, and the elimination results are not absolute. A future extension of this work involves estimating seismic hazards with a specific focus on discerning the distinct effects associated with each declustered catalog. A detailed PSHA is necessary to confirm the possible influence on the uniform hazard spectra and disaggregation analysis. This is important because different methods of studying earthquakes may yield different results. By comparing these results, we can improve our understanding of earthquake risks associated with the declustering method and develop better plans to keep people and structures safe. This homogeneous and declustered earthquake catalog will serve as a reliable source for evaluating seismicity parameters and seismic hazards in South Korea and its surrounding regions.
The earthquake data were downloaded from the following websites: Korea Meteorological Administration (KMA, 2023; https://necis.kma.go.kr/necis-dbf/user/earthquake/selectEarthquakeList.do, last access: December 2023), International Seismological Centre (ISC, 2023; https://doi.org/10.31905/D808B830) and Japan Meteorological Agency (JMA, 2023; https://www.data.jma.go.jp/svd/eqev/data/bulletin/index_e.html, last access: December 2023). The Shuttle Radar Topography Mission (SRTM) 30 m resolution digital elevation data are available from the OpenTopography portal at https://doi.org/10.5069/G9445JDF (NASA Shuttle Radar Topography Mission, 2013). The homogeneous earthquake catalog and all the declustered earthquake catalogs are provided in the Supplement (.xlsx files). Refer to the resources provided and the Supplement for further details.
The supplementary documents include the following: the homogeneous earthquake catalog (Table S1), the declustered earthquake catalog based on four methods (Tables S2–S5), and the completeness analysis results (Figs. S1–S6). The supplement related to this article is available online at https://doi.org/10.5194/nhess-25-4021-2025-supplement.
SKM carried out the conceptualization, methodology, software, investigation, data curation, formal analysis, validation, visualization, and writing (original draft preparation and review and editing). BK contributed to the supervision, conceptualization, project administration, methodology, validation, resources, and writing (original draft preparation and review and editing). All authors revised and approved the final version of the paper.
The contact author has declared that neither of the authors has any competing interests.
Publisher's note: Copernicus Publications remains neutral with regard to jurisdictional claims made in the text, published maps, institutional affiliations, or any other geographical representation in this paper. While Copernicus Publications makes every effort to include appropriate place names, the final responsibility lies with the authors.
The authors are grateful to the National Research Foundation of Korea (NRF) and the Brain Pool Fellowship, as well as the Korea Meteorological Administration, for their support. The authors sincerely thank the editor for carefully handling our manuscript and the esteemed reviewers for their valuable comments and suggestions, which greatly improved the quality of the paper.
This research has been supported by the National Research Foundation of Korea (NRF) grant for Brain Pool projects (grant no. 2022H1D3A2A02093553) and the KMA Research Development Program (grant no. RS-2022-KM220610).
This paper was edited by Filippos Vallianatos and reviewed by Mirela-Adriana Anghelache, Ronnie Kamai, and one anonymous referee.
Aki, K.: Maximum likelihood estimate of b in the formula and its confidence limits, Bull. Earthquake Res. Inst., 43, 237–239, 1965.
Anbazhagan, P., Vinod, J. S., and Sitharam, T. G.: Probabilistic seismic hazard analysis for Bangalore, Nat. Hazards, 48, 145–166, https://doi.org/10.1007/s11069-008-9253-3, 2009.
Anbazhagan, P., Bajaj, K., Matharu, K., Moustafa, S. S. R., and Al-Arifi, N. S. N.: Probabilistic seismic hazard analysis using the logic tree approach – Patna district (India), Nat. Hazards Earth Syst. Sci., 19, 2097–2115, https://doi.org/10.5194/nhess-19-2097-2019, 2019.
Bayliss, T. J. and Burton, P. W.: A new earthquake catalogue for Bulgaria and the conterminous Balkan high hazard region, Nat. Hazards Earth Syst. Sci., 7, 345–359, https://doi.org/10.5194/nhess-7-345-2007, 2007.
Bormann, P. and Saul, J.: The new IASPEI standard broadband magnitude mB, Seismol. Res. Lett., 79, 698–705, https://doi.org/10.1785/gssrl.79.5.698, 2008.
Bormann, P., Liu, R., Ren, X., Gutdeutsch, R., Kaiser, D., and Castellaro, S.: Chinese national network magnitudes, their relation to NEIC magnitudes, and recommendations for new IASPEI magnitude standards, B. Seismol. Soc. Am., 97, 114–127, https://doi.org/10.1785/0120060078, 2007.
Danciu, L., Giardini, D., Weatherill, G., Basili, R., Nandan, S., Rovida, A., Beauval, C., Bard, P.-Y., Pagani, M., Reyes, C. G., Sesetyan, K., Vilanova, S., Cotton, F., and Wiemer, S.: The 2020 European Seismic Hazard Model: overview and results, Nat. Hazards Earth Syst. Sci., 24, 3049–3073, https://doi.org/10.5194/nhess-24-3049-2024, 2024.
Das, R. and Meneses, C.: A unified moment magnitude earthquake catalog for Northeast India, Geomatics, Natural Hazards and Risk, 12, 167–180, https://doi.org/10.1080/19475705.2020.1863269, 2021.
Das, R., Wason, H. R., and Sharma, M. L.: Global regression relations for conversion of surface wave and body wave magnitudes to moment magnitude, Nat. Hazards, 59, 801–810, https://doi.org/10.1007/s11069-011-9796-6, 2011.
Del Gaudio, V., Pierri, P., and Calcagnile, G.: Seismogenic zonation and seismic hazard estimates in a Southern Italy area (Northern Apulia) characterised by moderate seismicity rates, Nat. Hazards Earth Syst. Sci., 9, 161–174, https://doi.org/10.5194/nhess-9-161-2009, 2009.
Di Giacomo, D., Engdahl, E. R., and Storchak, D. A.: The ISC-GEM Earthquake Catalogue (1904–2014): status after the Extension Project, Earth Syst. Sci. Data, 10, 1877–1899, https://doi.org/10.5194/essd-10-1877-2018, 2018.
Du, W. and Pan, T. C.: Probabilistic seismic hazard assessment for Singapore, Nat. Hazards, 103, 2883–2903, https://doi.org/10.1007/s11069-020-04107-4, 2020.
Funasaki, J. and Earthquake Prediction Information Division: Revision of the JMA velocity magnitude, Quart. J. Seismol., 67, 11–20, 2004.
Gardner, J. K. and Knopoff, L.: Is the sequence of earthquakes in Southern California, with aftershocks removed, Poissonian?, B. Seismol. Soc. Am., 64, 1363–1367, 1974.
Grünthal, G. and Wahlström, R.: The European-Mediterranean earthquake catalogue (EMEC) for the last millennium, J. Seismol., 16, 535–570, 2012.
Grünthal, G., Wahlström, R., and Stromeyer, D.: The unified catalogue of earthquakes in central, northern, and northwestern Europe (CENEC) – Updated and expanded to the last millennium, J. Seismol., 13, 517–541, https://doi.org/10.1007/s10950-008-9144-9, 2009.
Gutenberg, B. and Richter, C. F.: Frequency of earthquakes in California, B. Seismol. Soc. Am., 34, 185–188, 1944.
Hainzl, S. and Marsan, D.: Dependence of the Omori-Utsu law parameters on main shock magnitude: Observations and modeling, J. Geophys. Res.-Sol. Ea., 113, B10309, https://doi.org/10.1029/2007JB005492, 2008.
Han, S. W. and Choi, Y. S.: Seismic hazard analysis in low and moderate seismic region-Korean peninsula, Struct. Saf., 30, 543–558, https://doi.org/10.1016/j.strusafe.2007.10.004, 2008.
Helmstetter, A., Kagan, Y. Y., and Jackson, D. D.: Comparison of short-term and time-dependent earthquake forecast models for southern California, B. Seismol. Soc. Am., 96, 90–106, https://doi.org/10.1785/0120050067, 2006.
International Seismological Centre (ISC): On-line Bulletin, https://doi.org/10.31905/D808B830, 2023.
Japan Meteorological Agency (JMA): The Seismological Bulletin of Japan, http://www.data.jma.go.jp/svd/eqev/data/bulletin/index_e.html (last access: December 2023), 2023.
Joshi, N., Lund, B., and Roberts, R.: Probabilistic seismic hazard assessment of Sweden, Nat. Hazards Earth Syst. Sci., 24, 4199–4223, https://doi.org/10.5194/nhess-24-4199-2024, 2024.
Kagan, Y. Y. and Jackson, D. D.: Long-term earthquake clustering, Geophys. J. Int., 104, 117–133, 1991.
Katsumata, A.: Revision of the JMA displacement magnitude, Q. J. Seismol., 67, 1–10, 2004.
Kim, S. G. and Gao, F. C.: Korean Earthquake Catalogue, Seismological Institute, Hanyang University, Seoul, Korea, 120 pp., 1995.
Korea Meteorological Administration (KMA): Earthquake data, https://necis.kma.go.kr/necis-dbf/user/earthquake/selectEarthquakeList.do (last access: December 2023), 2023.
Kyung, J.-B., Kim, M.-J., Lee, S.-J., and Kim, J.-K.: An Analysis of Probabilistic Seismic Hazard in the Korean Peninsula-Probabilistic Peak Ground Acceleration (PGA), J. Korean Earth Sci. Soc., 37, 52–61, https://doi.org/10.5467/JKESS.2016.37.1.52, 2016.
Lee, K.: Historical earthquake data of Korea, J. Korean Geophys. Soc., 1, 3–22, 1999 (in Korean with English abstract).
Lee, K. and Yang, W. S.: Historical seismicity of Korea, B. Seismol. Soc. Am., 96, 846–855, https://doi.org/10.1785/0120050050, 2006.
Li, Y. C.: Korean Earthquake Catalogue (2 AD–1983), Seismological Press, Beijing, China, 69 pp., 1986.
Mahmood, K., Ahmad, N., Khan, U., and Iqbal, Q.: Seismic hazard maps of Peshawar District for various return periods, Nat. Hazards Earth Syst. Sci., 20, 1639–1661, https://doi.org/10.5194/nhess-20-1639-2020, 2020.
Makropoulos, K., Kaviris, G., and Kouskouna, V.: An updated and extended earthquake catalogue for Greece and adjacent areas since 1900, Nat. Hazards Earth Syst. Sci., 12, 1425–1430, https://doi.org/10.5194/nhess-12-1425-2012, 2012.
Marsan, D.: Model-Independent Stochastic Declustering (MISD) code, C implementation, https://www.isterre.fr/annuaire/pages-web-du-personnel/david-marsan/article/model-independent-stochastic-declustering.html (last access: March 2024), 2007.
Marsan, D. and Lengliné, O.: Extending earthquakes' reach through cascading, Science, 319, 1076–1079, https://doi.org/10.1126/science.1148783, 2008.
Marsan, D. and Lengliné, O.: A new estimation of the decay of aftershock density with distance to the mainshock, J. Geophys. Res.-Sol. Ea., 115, B09302, https://doi.org/10.1029/2009JB007119, 2010.
Mizrahi, L., Nandan, S., and Wiemer, S.: The effect of declustering on the size distribution of mainshocks, Seismol. Res. Lett., 92, 2333–2342, https://doi.org/10.1785/0220200231, 2021.
Molchan, G. M. and Dmitrieva, O. E.: Aftershock identification: methods and new approaches, Geophys. J. Int., 109, 501–516, 1992.
Mueller, C. S.: Earthquake catalogs for the USGS national seismic hazard maps, Seismol. Res. Lett., 90, 251–261, https://doi.org/10.1785/0220170108, 2019.
Nas, M., Jalilian, A., and Bayrak, Y.: Spatiotemporal comparison of declustered catalogs of earthquakes in Turkey, Pure Appl. Geophys., 176, 2215–2233, 2019.
NASA Shuttle Radar Topography Mission (SRTM): Shuttle Radar Topography Mission (SRTM) Global, OpenTopography [data set], https://doi.org/10.5069/G9445JDF, 2013.
Okada, Y., Kasahara, K., Hori, S., Obara, K., Sekiguchi, S., Fujiwara, H., and Yamamoto, A.: Recent progress of seismic observation networks in Japan – Hi-net, F-net, K-NET and KiK-net, Earth Planets Space, 56, xv–xxviii, https://doi.org/10.1186/BF03353076, 2004.
Park, S., Hong, T. K., and Rah, G.: Seismic hazard assessment for the korean peninsula, B. Seismol. Soc. Am., 111, 2696–2719, https://doi.org/10.1785/0120200261, 2021.
Peng, W., Marsan, D., Chen, K. H., and Pathier, E.: Earthquake swarms in Taiwan: A composite declustering method for detection and their spatial characteristics, Earth Planet. Sci. Lett., 574, 117160, https://doi.org/10.1016/j.epsl.2021.117160, 2021.
Perry, M. and Bendick, R.: A comparative analysis of five commonly implemented declustering algorithms, J. Seismol., 28, 829–842, 2024.
Petersen, M. D., Moschetti, M. P., Powers, P. M., Mueller, C. S., Haller, K. M., Frankel, A. D., Zeng, Y., Rezaeian, S., Harmsen, S. C., Boyd, O. S., Field, N., Chen, R., Rukstales, K. S., Luco, N., Wheeler, R. L., Williams, R. A., and Olsen, A. H.: Documentation for the 2014 Update of the United States National Seismic Hazard Maps, U.S. Geological Survey Open-File Report 2014–1091, 243, https://doi.org/10.3133/ofr20141091, 2014.
Popandopoulos, G. A., Baskoutas, I., and Chatziioannou, E.: The spatiotemporal analysis of the minimum magnitude of completeness Mc and the Gutenberg–Richter law b-value parameter using the earthquake catalog of Greece, Izv.-Phys. Solid Eart.+, 52, 195–209, https://doi.org/10.1134/S1069351316010079, 2016.
Poudyal, D., Nordin, N., and Roslan, S. N. A.: Comparative Declustering Approaches for Seismic Data: Insights from Gardner-Knopoff, Gruenthal, Reasenberg, and Uhrhammer in the Kathmandu Valley, Ann. Geophys.-Italy, 68, NH215, https://doi.org/10.4401/ag-9178, 2025.
Reasenberg, P.: Second-order moment of central California seismicity, 1969–1982, J. Geophys. Res.-Sol. Ea., 90, 5479–5495, 1985.
Rovida, A., Antonucci, A., and Locati, M.: The European Preinstrumental Earthquake Catalogue EPICA, the 1000–1899 catalogue for the European Seismic Hazard Model 2020, Earth Syst. Sci. Data, 14, 5213–5231, https://doi.org/10.5194/essd-14-5213-2022, 2022.
Savage, W. U.: Microearthquake clustering near Fairview Peak, Nevada, and in the Nevada seismic zone, J. Geophys. Res., 77, 7049–7056, 1972.
Sawires, R., Santoyo, M. A., Peláez, J. A., and Corona Fernández, R. D.: An updated and unified earthquake catalog from 1787 to 2018 for seismic hazard assessment studies in Mexico, Sci. Data, 6, 241, https://doi.org/10.1038/s41597-019-0234-z, 2019.
Scordilis, E. M.: Globally valid relations converting Ms, mb and MJMA to Mw, in: NATO Advanced Research Workshop on Earthquake Monitoring and Seismic Hazard Mitigation in Balkan Countries, Rila Mountains–Resort Village Borovetz, Bulgaria, 11–17, 2005.
Scordilis, E. M.: Empirical global relations converting MS and mb to moment magnitude, J. Seismol., 10, 225–236, 2006.
Seo, J.-M., Choi, I.-K., and Rhee, H.-M.: A study of the historical earthquake catalog and Gutenberg-Richter parameter values of the Korean Peninsula, Nucl. Eng. Technol., 42, 55–64, 2010.
Sheen, D.-H., Kang, T.-S., and Rhie, J.: A local magnitude scale for South Korea, B. Seismol. Soc. Am., 108, 2748–2755, 2018.
Simeonova, S. D., Solakov, D. E., Leydecker, G., Busche, H., Schmitt, T., and Kaiser, D.: Probabilistic seismic hazard map for Bulgaria as a basis for a new building code, Nat. Hazards Earth Syst. Sci., 6, 881–887, https://doi.org/10.5194/nhess-6-881-2006, 2006.
Stepp, J. C.: Analysis of completeness of the earthquake sample in the Puget Sound area and its effect on statistical estimates of earthquake hazard, in: Proc. of the 1st Int. Conf. on Microzonation, Seattle, USA, 30 October–3 November, 2, 897–910, 1972.
Tan, O.: A homogeneous earthquake catalogue for Turkey, Nat. Hazards Earth Syst. Sci., 21, 2059–2073, https://doi.org/10.5194/nhess-21-2059-2021, 2021.
Taroni, M. and Akinci, A.: Good practices in PSHA: Declustering, b-value estimation, foreshocks and aftershocks inclusion; A case study in Italy, Geophys. J. Int., 224, 1174–1187, https://doi.org/10.1093/gji/ggaa462, 2021.
Teng, B. G. and Baker, J. W.: Seismicity declustering and hazard analysis of the Oklahoma–Kansas Region, B. Seismol. Soc. Am., 109, 2356–2366, https://doi.org/10.1785/0120190111, 2019.
Tinti, S. and Mulargia, F.: Effects of magnitude uncertainties on estimating the parameters in the Gutenberg-Richter frequency-magnitude law, B. Seismol. Soc. Am., 75, 1681–1697, 1985.
Tselentis, G.-A. and Danciu, L.: Probabilistic seismic hazard assessment in Greece – Part 1: Engineering ground motion parameters, Nat. Hazards Earth Syst. Sci., 10, 25–39, https://doi.org/10.5194/nhess-10-25-2010, 2010.
Uchide, T. and Imanishi, K.: Underestimation of Microearthquake Size by the Magnitude Scale of the Japan Meteorological Agency: Influence on Earthquake Statistics, J. Geophys. Res.-Sol. Ea., 123, 606–620, https://doi.org/10.1002/2017JB014697, 2018.
Uhrhammer, R. A.: Characteristics of Northern and Central California seismicity, Earthq. Notes, 57, 21–37, 1986.
Utsu, T.: A method for determining the value of b in a formula showing the magnitude frequency relation for earthquakes, Geophys. Bull. Hokkaido Univ., 13, 99–103, 1965.
Utsu, T.: 44 – Relationships between Magnitude Scales, in: International Handbook of Earthquake and Engineering Seismology, Part A, vol. 81, edited by: Lee, W. H. K., Kanamori, H., Jennings, P. C., and Kisslinger, C., Academic Press, 733–746, https://doi.org/10.1016/S0074-6142(02)80247-9, 2002.
van Stiphout, T., Zhuang, J., and Marsan, D.: Community Online Resource for Statistical Seismicity Analysis, 10, 1–25, https://doi.org/10.5078/corssa-52382934, 2012.
Wang, Q., Jackson, D. D., and Kagan, Y. Y.: California earthquakes, 1800–2007: A unified catalog with moment magnitudes, uncertainties, and focal mechanisms, Seismol. Res. Lett., 80, 446–457, 2009.
Wiemer, S.: A software package to analyze seismicity: Zmap, Seismol. Res. Lett., 72, 373–382, 2001.
Zhuang, J., Ogata, Y., and Vere-Jones, D.: Stochastic declustering of space-time earthquake occurrences, J. Am. Stat. Assoc., 97, 369–380, 2002.
- Abstract
- Introduction
- Methodologies for catalog compilation
- Magnitude homogenization of the earthquake catalog
- Declustering of earthquake catalog
- Completeness analysis
- Results and discussion
- Conclusions
- Data availability
- Author contributions
- Competing interests
- Disclaimer
- Acknowledgements
- Financial support
- Review statement
- References
- Supplement