the Creative Commons Attribution 4.0 License.
the Creative Commons Attribution 4.0 License.
 | 06 Oct 2025
Predictive understanding of socioeconomic flood impact in data-scarce regions based on channel properties and storm characteristics: application in High Mountain Asia (HMA)
Mariam Khanam
Wilmalis Rodriguez
Efthymios I. Nikolopoulos
Binghao Lu
Dongjin Song
Emmanouil N. Anagnostou
High Mountain Asia (HMA) faces heightened vulnerability to natural disasters due to its extreme conditions and the escalating impacts of climate change. Understanding the long-term response of this landscape to hydroclimatic fluctuations is imperative, given the profound effects these changes have on millions of people annually. Heavy rain and the monsoon season bring forth floods and debris flows, resulting in significant damage to crops, infrastructure, and communities and having widespread human impacts. Despite efforts to estimate flood risk locally, traditional techniques often fall short due to the scarcity of high-quality, consistent data, especially in ungauged basins. To overcome this challenge, we propose a novel approach: a geomorphologically guided machine learning (ML) method for mapping flood effects across HMA. Central to our methodology is the life year index (LYI), a systematic measure that quantifies both the financial and the human losses incurred by disasters, specifically for this study fluvial and pluvial flooding. Our model was trained using a dataset comprising over 6000 flood events spanning 1980 to 2020, along with their corresponding 5- and 10-year LYI. Key predictors included (1) 5-year rainfall concentrations derived from ERA5 daily data, (2) a geomorphic classifier based on hydraulic scaling functions derived from high-resolution digital elevation models (DEM), and (3) population density. Results demonstrate the model's effectiveness in identifying flood susceptibility hotspots at a national scale and delineating their evolution from 1980 to 2020. Moreover, the study underscores the severity of hydroclimatic extremes across the entire HMA region. Importantly, the proposed framework is versatile and can be adapted to generate various pluvial and fluvial flood vulnerability and risk maps in ungauged regions.
- Article
(7641 KB) - Full-text XML
- BibTeX
- EndNote


High Mountain Asia (HMA) presents complex terrain characterized by dynamic hydrologic and geomorphological processes. Over recent years, the region has been significantly affected by climate change, notably witnessing accelerated glacial melts (Shrestha and Aryal, 2011; Byers et al., 2022) and shifts in precipitation patterns and intensity (Haag et al., 2019; Kirschbaum et al., 2020). These environmental changes, compounded by anthropogenic influences such as landscape alterations, have escalated the region's susceptibility to flooding (Byers et al., 2022; Pervin et al., 2020; Shrestha et al., 2010; Zheng et al., 2021), with consequent increasing threats to lives, agriculture, and critical infrastructure (Fischer et al., 2022; Pervin et al., 2020; Rentschler et al., 2022; Sharma et al., 2019; Torti, 2012). The direct impacts caused by the flood are only part of the picture; the enduring socioeconomic repercussions further compound the crisis. These include losses of livelihood, the urgent need for rehabilitation efforts, and the psychological toll exacted on affected communities.
Flood disasters are generally associated with hydroclimatic extremes. The variability in precipitation patterns regarding time, space, and intensity is indeed crucial to their occurrence, but changes in catchment characteristics can also alter flood magnitude and frequency. The complex geomorphology and orographic characteristics in the HMA region cause significant spatiotemporal heterogeneity of precipitation patterns and extremes (Haag et al., 2019). Furthermore, the geomorphic structure of basins in HMA can influence the flood characteristics more than land cover does (Marston et al., 1996). Many floods in HMA carry huge amounts of sediment and water that adversely affect the downstream areas where most people reside and can remain in the landscape for years afterward (Kafle et al., 2017; Simonovic et al., 2022).
Changes in river morphology and channel shifting resulting from sediment variability are recognized causes of flood risk (Blench, 1969; Criss and Shock, 2001; Lane et al., 2007; Neuhold et al., 2009; Pinter et al., 2008; Slater et al., 2015; Stover and Montgomery, 2001; Sofia and Nikolopoulos, 2020). Several researchers have highlighted how the morphometric characteristics of watersheds provide useful insights into these watersheds' hydrologic response to rainfall (Borga et al., 2008) since their morphometric characteristics are a crucial influence on flash flood intensity. In HMA, however, these control mechanisms are difficult to model at a large scale.
Accurate evaluation of the socioeconomic impacts of natural disasters is paramount to mitigate the sufferings of the affected people and to rehabilitation (Cavallo and Noy, 2011; Meyer et al., 2013; Noy, 2015, 2016a). To date, available studies (Diehl et al., 2021; Mohanty and Simonovic, 2022; Pangali Sharma et al., 2019; Pervin et al., 2020; Piacentini et al., 2020; Yang and Tsai, 2000) have primarily concentrated on vulnerability mapping and risk analysis, employing case studies and descriptive event-based methodologies at a local level. Scaling up the analysis over the entire HMA region is indeed a difficult task, as it requires collecting data from several countries and multiple sources, and this poses challenges due to the scarcity of ground observations covering consistent time frames homogeneously (Dollan et al., 2024; Miles et al., 2021). Especially in the context of the impact of floods using socioeconomic data, the analysis involves examining the number of fatalities, the number of people injured and otherwise affected, and the financial damage that natural disasters cause, and this information is generally collected at the local scale based on reported events. Significant disasters are documented in global databases like The International Disaster Database (EMDAT, http://www.emdat.be, last access: 22 September 2025) or, as an example for HMA and this study, the Nepal Disaster Risk Reduction Portal (http://drrportal.gov.np/, last access: 22 September 2025). However, these databases typically operate at a global or national level resolution, potentially overlooking minor disasters. For example, EMDAT only considers events that meet at least one of the following criteria: (1) 10 fatalities, (2) 100 affected people, (3) a declaration of a state of emergency, and (4) a call for international assistance. Additionally, those databases utilized to support insurance may prioritize countries with existing or potential insurance coverage (World Bank, 2012).
The integration of geomorphic properties, population data, and rainfall characteristics for assessing socioeconomic flood impact has only recently begun to be explored comprehensively on a large scale (e.g., Janizadeh et al., 2024). For HMA, this is primarily due to the inherent challenges associated with conducting on-site surveys in rugged and often inaccessible terrain. However, leveraging remote sensing data has emerged as a valuable approach for delving deeper into these dynamics and effectively quantifying flood impacts. Modern global datasets, featuring improved resolution and coverage, further enhance the utility of remote sensing in this regard (Diehl et al., 2021; Jongejan and Maaskant, 2015; Mosavi et al., 2018; Bentivoglio et al., 2022; Mazzoleni et al., 2022; Hawker et al., 2018; Kirschbaum et al., 2020; Mohanty and Simonovic, 2022; Pangali Sharma et al., 2019; Sanyal and Lu, 2004; Yang and Tsai, 2000; Zheng et al., 2018).
Furthermore, machine learning (ML) techniques have emerged as increasingly popular tools in advanced prediction systems over the past 2 decades. They offer more cost-effective solutions with performance that can be aggregated, surpassing the complexity and time demands associated with simulating the complex development of flood processes. Recent research (Bentivoglio et al., 2022; Deroliya et al., 2022; Mosavi et al., 2018) has showcased encouraging advancements by integrating machine learning (ML) techniques with global datasets. This contemporary approach to mapping flood vulnerability notably streamlines the computational processes associated with data-intensive simulations, enhancing flood risk management strategies. However, ML systems rely on existing data for learning. Insufficient or incomplete data coverage can hinder effective learning, leading to suboptimal performance when deployed in real-world scenarios. Therefore, ensuring robust data enrichment, encompassing both quantity and quality, is imperative.
In this study, we introduce a streamlined methodology for preliminary flood vulnerability assessment on a large scale, leveraging available global datasets. Specifically, we introduce a flood risk assessment model designed to quantify spatially distributed socioeconomic susceptibility in flood-prone regions. We utilize this model to augment disaster understanding by integrating remotely sensed data, including climate variables and high-resolution terrain information.
Finally, we apply this model in the High Mountain Asia (HMA) region to analyze changes in socioeconomic flood impacts spanning 1980 to 2020.
2.1 Study area
HMA, otherwise known as the Hindu Kush–Himalayan region, comprises Nepal, Pakistan, Bangladesh, Bhutan, India, Afghanistan, Kazakhstan, Kyrgyzstan, Tajikistan, Uzbekistan, Mongolia, China, and parts of many other countries in Asia. HMA is home to some of the world's highest mountain systems, including the Himalayas and the Hindu Kush. This rugged terrain has a highly variable climate, ranging from tropical to subpolar, which is essentially controlled by altitude. Around 1.5 billion people (https://nsidc.org/data/highmountainasia, last access: 22 September 2025) dwelling in the region are at risk of natural disasters (such as heavy rainfall, flooding (pluvial/fluvial/flash), earthquakes, avalanches, and landslides) due to topographic characteristics, changing climate patterns, and high population density. Some of the world's largest rivers and deltas, such as the Indus and the Ganges, are located in this region. In the summertime (June to September), monsoon rains bring a vast amount of water (Kayastha and Kayastha, 2019) to the rivers and valleys in the southern part of HMA (Northern India, Nepal, Bangladesh, and Pakistan). Kirschbaum et al. (2020) have projected that the greatest increase in very high intensities of precipitation (> 20 mm d−1) will occur during the monsoon season, with the enormous amount of rain causing all types of devastating floods (Talchabhadel et al., 2018). Referring to the data reported, for example, in EMDAT, of all hydroclimatic disasters in HMA from 1980 to 2020, floods affected the most people (53 % of all hydroclimatic disasters) and caused the highest total damage (56 % among all other hydroclimatic disasters). Bangladesh, Nepal, Pakistan, and parts of India were hotspots with the highest numbers of casualties (source: EMDAT, http://www.emdat.be, last access: 22 September 2025).
This study designates approximately 6000 watersheds across HMA as the main target area (Fig. 1): the watersheds were selected to be consistent with the HMA domain and all the datasets produced throughout the different phases of the NASA-funded HiMAT project (https://himat.org/, last access: 22 September 2025). The analysis initially centered on training and testing a machine learning model specifically for Nepal. To achieve this, we collected fine-resolution topographic data along with district-scale socioeconomic information on population characteristics and documented flood impacts for this region. Subsequently, leveraging the insights gained from this initial phase, we extended the application of the trained model to predict socioeconomic impacts across all watersheds in HMA.
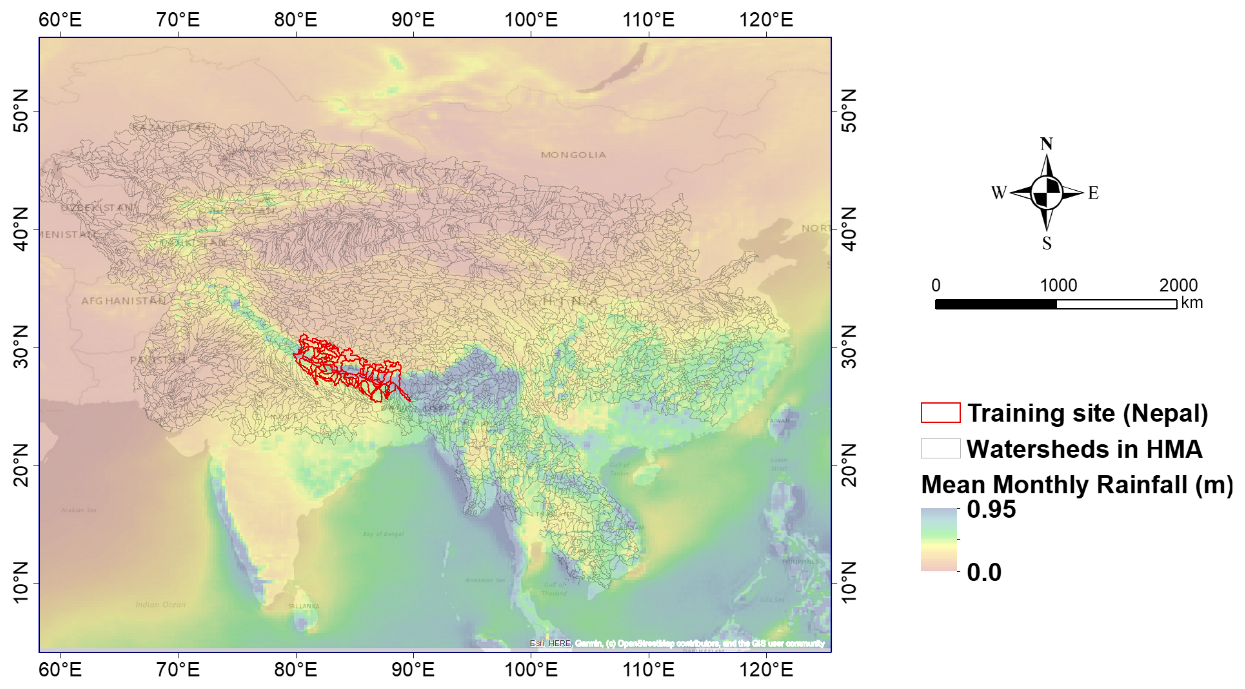
Figure 1Study area watersheds across High Mountain Asia (HMA), with the training domain (Nepal) highlighted and the overall rainfall variability across the region. The watershed displayed in black represents the 6000 watersheds that were used in the study. The watersheds were selected to be consistent with the HMA domain and all the datasets produced throughout the different phases of the NASA-funded HiMAT project (https://himat.org/, last access: 22 September 2025).
2.2 Methods
Figure 2 illustrates the conceptual framework guiding this study. We employed machine learning (ML) analysis, utilizing climatic and geomorphologic variables, to forecast the socioeconomic impact of extreme fluvial and pluvial flood events spanning 1980 to 2020 across High Mountain Asia (HMA). To capture the link between flooding and climatic and geomorphologic processes, the model regards as predictors a climatic index derived from ERA5 rainfall and a geomorphological index and the flood geomorphic potential (FGP), which characterizes the flood-proneness of the landscape, together with population data. A notable advantage of the proposed approach lies in its reliance on automatic techniques leveraging globally available datasets, thereby facilitating its applicability across diverse geographical regions to forecast socioeconomic flood impacts. The framework also benefits from leveraging geomorphologically driven information to have an improved characterization of the different aspects of the underlying physical processes shaping the landscape and possibly impacting flood characteristics. By incorporating such domain knowledge into the ML model, the framework can better generalize across different regions and conditions, improving robustness and reliability for risk mapping in diverse environments and facilitating informed decision-making for flood management and mitigation strategies.
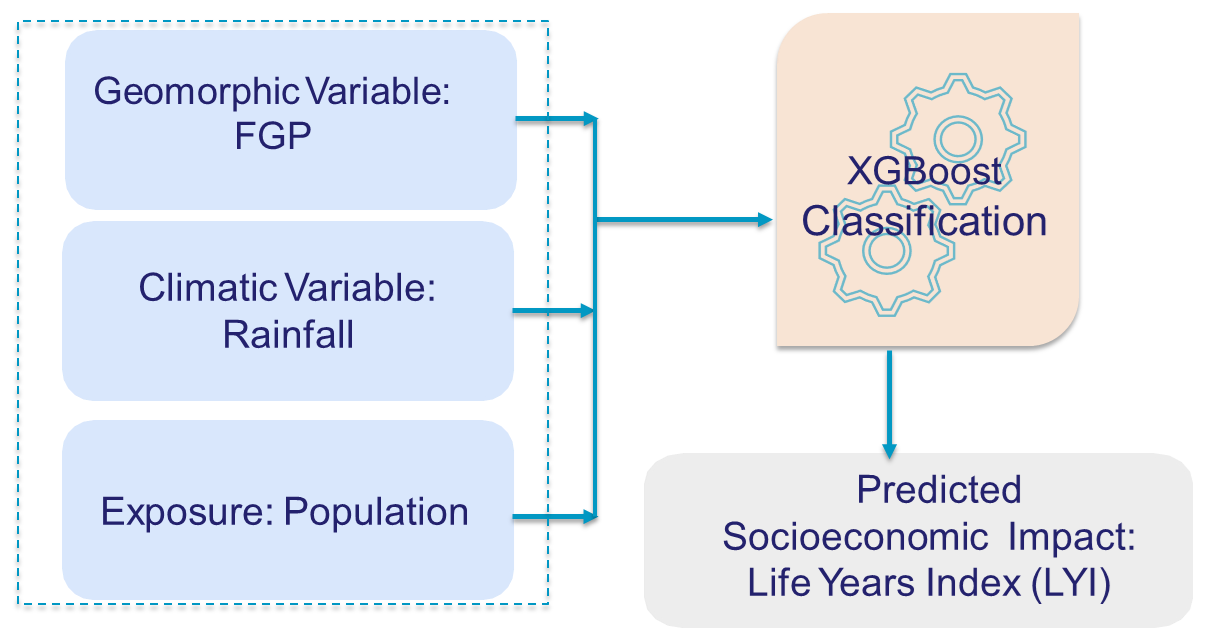
Figure 2Conceptual framework. Considered predictors are flood geomorphic potential (FGP), rainfall, and population. The predicted value is the socioeconomic impact, characterized as the life year index (LYI) (Noy, 2016a, 2015). Readers should refer to the main text for an explanation of the predictors and predicted values.
To represent exposure and socioeconomic impacts, we introduced a variable for population and for the “life year index” (LYI) (Noy, 2014, 2016a, b), a unit of measurement used to describe a disaster's impact in terms of the total years of life lost (see Sect. 2.3.1 for details). To predict the LYI, we applied XGBoost (eXtreme Gradient Boosting) (Chen et al., 2018; Chen and Guestrin, 2016). The predictor and response variables of the ML framework are described in the subsections below.
The analysis follows a multistep approach, beginning with data at both watershed and district scales. Initially, the focus was on the district scale, as socioeconomic data for Nepal, selected as the primary training ground, were readily available at this level through the Nepal Disaster Risk Reduction Portal (http://drrportal.gov.np/, last access: 22 September 2025). For this region, furthermore, there is comprehensive coverage of high-resolution (8 m) digital elevation models (DEMs) from prior High Mountain Asia (HMA) work (High Mountain Asia 8 m DEMs derived from along-track optical imagery, https://doi.org/10.5067/0MCWJJH5ABYO, Shean, 2017). Subsequently, all the information is aggregated at the watershed scale, as phenomena such as fluvial and pluvial flooding occur at this level, necessitating a dataset tailored to this scale.
To transfer the demographic information from the district to the watershed scale, we performed a weighted spatial join between the watersheds and districts. For each watershed, we attributed the statistical characteristics of the intersecting districts, with weights based on the overlapping areas. The aggregation from district to watershed is performed by a weighted average, considering the extent of the district area within the watershed to be a weight. Generally, the districts in Nepal are smaller in extent compared to the various watersheds.
2.3 Datasets
2.3.1 Socioeconomic flood impacts
The research focused on predicting the socioeconomic impact of floods. Measured economic loss and tangible damage were analyzed by considering the life year index (LYI) (Noy, 2014, 2016a, b). This index is presented by Noy (2016a) as “life years lost”, and it is a variant of the WHO Disability Adjusted Life Years (DALYs) lost due to diseases and injuries (WHO, 2014). We calculated LYI for Nepal using damage statistics and demographic information collected from different data portals in Nepal.
The index is described by Eq. (1), and the parameters used in the equation are described in Table 1:
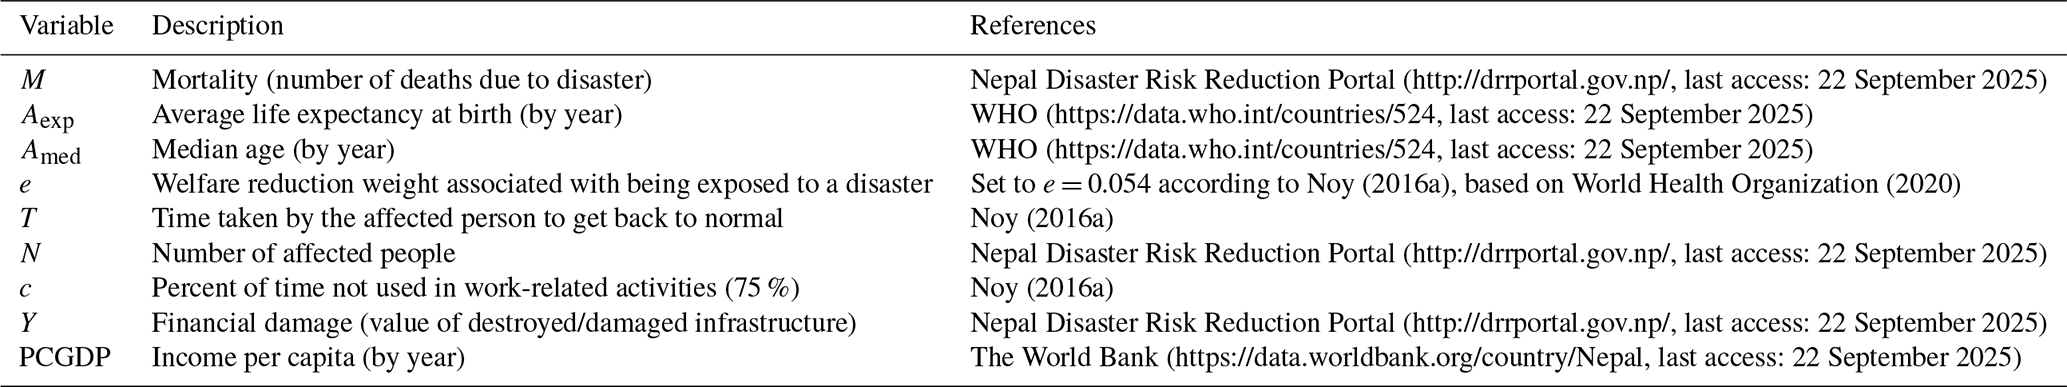
In this study, we classified life year index (LYI) values into three distinct categories: low for cases where log(LYI) < 2, medium for values falling between 2 and 3, and high for log(LYI) > 3. This classification scheme indicates that a watershed or district is deemed to be at high risk if the average LYI exceeds 1000 years, while medium risk spans LYI values ranging from 100 to 1000 years and low risk encompasses LYI values of less than 100 years. For instance, if the calculated LYI is 100 years, it implies that the estimated impact of the given disaster equates to a potential loss of 100 years of life per 100 000 people.
The cumulative LYI for Nepal (Fig. 3) can provide an idea of how the cumulated flood impact has been increasing in a country with time. It also highlights how the index itself captures major disasters, such as those that occurred in 1981 (ICIMOD, 2011; Kiran et al., 2008), 1993 (Nepal: Floods and Landslides, 1993), 1996 (Nepal: Floods Situation Report No. 1, 1996), and the monsoon seasons in 2003 and 2014 (Nepal: Appeal No. 01.55/2003 Annual Report, 2003; Nepal: Landslides and Floods, 2014). Most changes can be noticed in the LYI for the years 1981, 1993, and 2014; the cumulative step changes for these years from the respective previous years are 9999, 82 865, and 976 238 years.
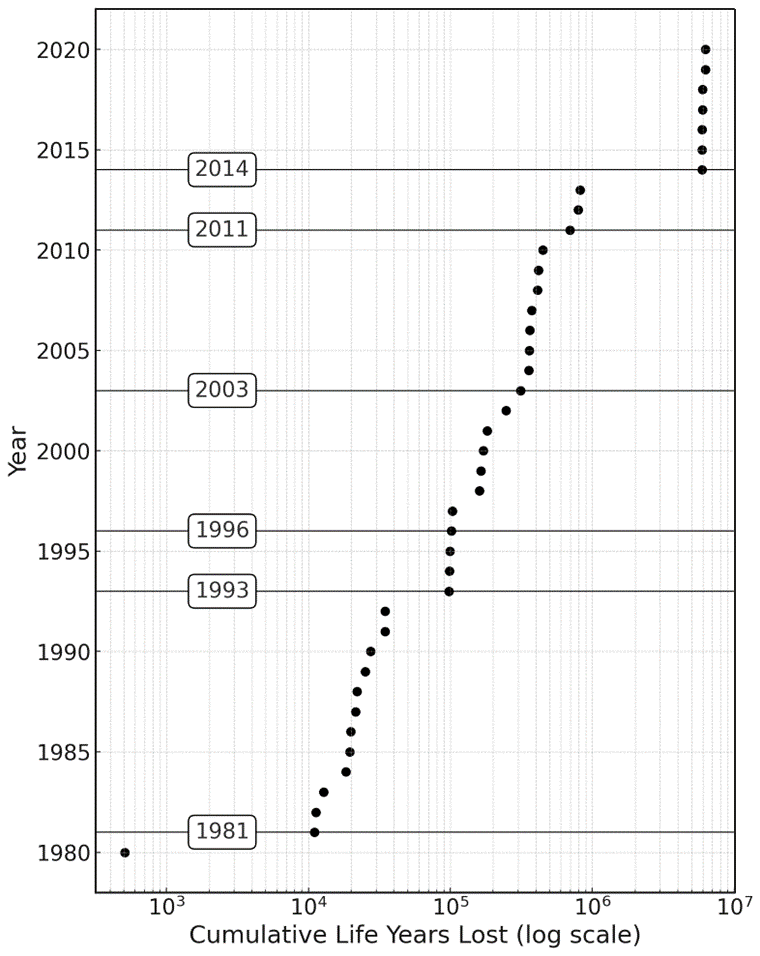
Figure 3Cumulative life years lost plotted against year in Nepal. Highlighted years represent jumps in the cumulative value (mostly related to well-known disasters): 1981 (ICIMOD, 2011; Kiran et al., 2008), 1993 (Nepal: Floods and Landslides, 1993), 1996 (Nepal: Floods Situation Report No. 1, 1996), and in the monsoon seasons in 2003 and 2014 (Nepal: Appeal No. 01.55/2003 Annual Report, 2003; Nepal: Landslides and Floods, 2014).
2.3.2 Floodplain mapping
The identification of areas with the potential to be inundated is fundamental to preserving and protecting human lives and property while safely supporting economic activities. Hence, we applied a large-scale floodplain delineation algorithm to identify such areas at the basin scale across the HMA. Many researchers (e.g., Dingle et al., 2020; Lindersson et al., 2021; Piacentini et al., 2020; Sofia, 2020) have used DEM-derived geomorphic indices as a high-resolution flood mapping tool. We opted for considering a variation of the geomorphic flood index (GFI) by Samela et al. (2017), proposing the flood geomorphic potential (FGP).
The index is calculated as the logarithm function of the bankfull elevations, H (estimated using a hydraulic scaling function, or HSF (w=αAβ), based on bankfull width (w) and contributing area (A)), in the element of the river network closest to the point under examination and the elevation difference between these two points, hr (Fig. 4, Eq. 2). The index was improved regarding one main aspect: the automatic identification of the HSF directly from terrain data, applying the technique of Sofia et al. (2017, 2015) to retrieve the bankfull location automatically through the landscape. This has the advantage of allowing for full automation of the mapping starting purely from terrain data.
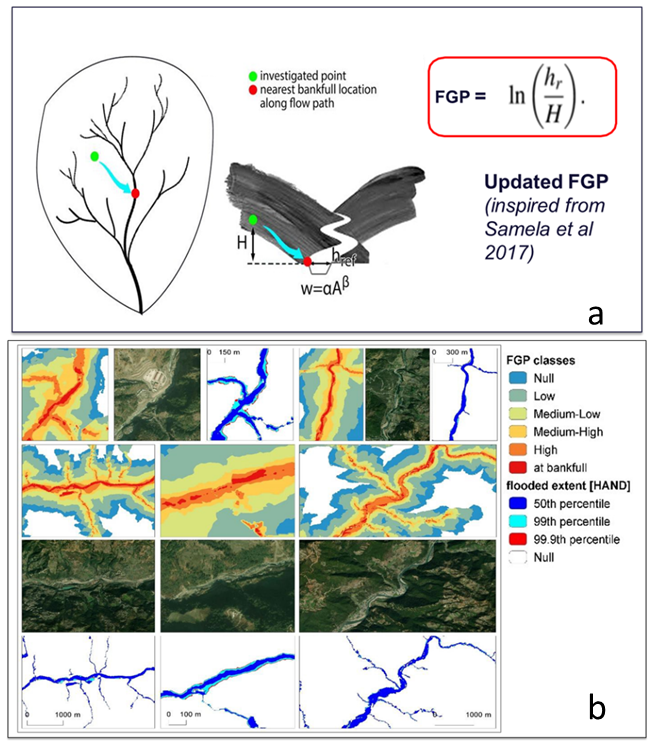
Figure 4(a) Flood geomorphic potential (FGP) (modified from Samela et al., 2017); (b) FGP automatic classes compared to baseline inundation depth (HAND) scenarios and orthophotos of selected areas (aerial imagery © Google Earth, 2015).
For this analysis, we trained the model considering FGP derived from the unique 8 m digital elevation models (DEMs) for Nepal that are available at the NASA National Snow and Ice Data Center Distributed Active Archive Center (NSIDC DAAC) (Shean, 2017). While Nepal is entirely covered by the 8 m DEM, extending the model to the whole HMA region is complicated by the gaps in the input satellite strip resulting from limited coverage, clouds, or failed stereo correlation. For this reason, we also considered the 30 m DEM by Copernicus (European Space Agency, 2021), a digital surface model (DSM) that represents the surface of the Earth, including buildings, infrastructure, and vegetation. Importantly, this DSM is derived from World DEM, an edited DSM in which the flattening of waterbodies and the consistent flow of rivers have been included. Shores and coastlines, special features such as airports, and implausible terrain structures have also been edited.
We identified flood-prone areas by grouping them into six classes by their FGP index. For each watershed, we then considered the areas covered by the classes with FGP greater than 4, which, when compared to published data, proved to correspond realistically to areas subject to floods of about 100-year depth. Figure 4b compares the flood geomorphic potential (FGP) automatic classes derived for select rivers in Nepal, with baseline inundation scenarios evaluated using standard inundation depths associated with critical flood events and their return periods provided in the work of Delalay et al. (2018). This visual comparison serves to highlight the efficacy of flood inundation mapping facilitated by the FGP. HAND (height above nearest drainage) in Delalay et al. (2018) is a widely used approach for estimating flood inundation extents and water depths. It operates on the principle of deriving relative elevations from a DEM, similarly to our approach, which also relies on DEM-based analysis. While having assumptions may introduce some limitations on accurately capturing complex flood dynamics, HAND remains a useful and practical method for large-scale flood assessment due to its computational efficiency and compatibility with readily available topographic data. Given these similarities, we find it reasonable to include HAND as a comparative reference in our study but acknowledge its limitations.
It is worth noting that the DEM-derived geomorphic index has been previously published and applied in various contexts (Samela et al., 2017). While testing the quality of the DEM-derived geomorphic index lies beyond the scope of this work, its effectiveness in flood mapping has been well established in previous studies (e.g., Manfreda and Samela, 2019), which have demonstrated the utility of the methodology, particularly in ungauged conditions, for the preliminary identification of flooded areas in regions where conducting expensive and time-consuming hydrologic–hydraulic simulations may not be feasible.
2.3.3 Rainfall characteristic
The climatology in HMA is highly variable (Dollan et al., 2024). Summer monsoons drive precipitation in the Ganges–Brahmaputra basins and on the Tibetan Plateau (Bookhagen and Burbank, 2010; Shamsudduha and Panda, 2019); synoptic storms dominate winter precipitation, impacting areas in the northwestern Karakorum mountains (Winiger et al., 2005; Barlow et al., 2005). Overall, variations in elevation gradients also contribute to diverse microclimates, exemplified by Nepal's swift transition from high mountains to lowlands (Kansakar et al., 2004; Karki et al., 2016). Winter precipitation in the area is primarily influenced by the westerly weather system, with western disturbances originating in the Mid-Atlantic or Mediterranean Sea and traversing northwest India to western Nepal after passing over Afghanistan and Pakistan (Kansakar et al., 2004; Hamal et al., 2020). In Nepal, which was used as the training site for the model, regional climate variations exist, mostly driven by changes in elevation, with overall homogeneity in trends (aside from a few hotspots) and regional statistics of precipitation, in line with the variability of HMA, as highlighted in a recent study by Khanal et al. (2023).
For this work, for the main rainfall driver of the model, we focused on daily climate concentration. As climate concentration values are mostly related to the temporal variability of the rainfall, not to its total amount or to the average yearly and seasonal statistics, using this index allows us to capture various climates globally (Monjo and Martin-Vide, 2016). The variability in climate concentration, furthermore, has been proven to be highly linked to pluvial/fluvial flooding impacts in various regions of the world, including for example Italy (both in mountainous landscapes and on floodplains (Sofia et al., 2019), the USA (Saki et al., 2023) (over a variety of physiographic regions), or China (Du et al., 2023). Different authors have adopted different methods to determine the temporal concentration of precipitation, and the concentration index (CI) (Eq. 2) is one of the most used parameters (Caloiero et al., 2019; Martin-Vide, 2004; Monjo, 2016; Sangüesa et al., 2018; Serrano-Notivoli et al., 2018).
This index was proposed by Martin-Vide (2004) originally to explore the contribution of the days with major rainfall to the total amount within a certain time range. The benefit of this index is that it can describe the temporal variability in rainfall at daily, annual, and seasonal scales using a single metric, as well as spatial variability at the pixel or watershed scale. In the present study, we computed CI (Martin-Vide, 2004) using the ERA5 hourly rainfall data from 1980 to 2019. The source of rainfall data was selected because various studies on HMA have highlighted its effectiveness in capturing extreme events quite accurately compared to other products (Maggioni and Massari, 2018; Maina et al., 2023; Dollan et al., 2024). The CI was calculated considering a 5-year window. The choice of this length was made to have sufficient data to calculate the index, as well as be able to capture variability over the 49 years of this analysis.
We identified storm events from this dataset primarily based on the criterion of rainfall of more than 0.5 mm, and we separated events when rainfall was below this threshold for more than 12 h. Furthermore, we calculated CI using the cumulative amount of rainfall and the cumulative frequency of the event duration (Fig. 5) for the selected events. The method (similar to the methods of Cortesi et al., 2012, and Monjo and Martin-Vide, 2016) eventually aggregates the amount of precipitation that falls during each event into increasing categories and determines the relative contribution (as a percentage) of the progressively accumulated precipitation as a function of the accumulated percentage of the durations of the events. The concentration index is then calculated as the ratio of the area between the line of equality (y=x) and the fitted curve (S) to the total area under the line of equality (A+S) (Fig. 5, Eq. 2). The index is defined by the relationship between the accumulated percentage of time and the accumulated rainfall.
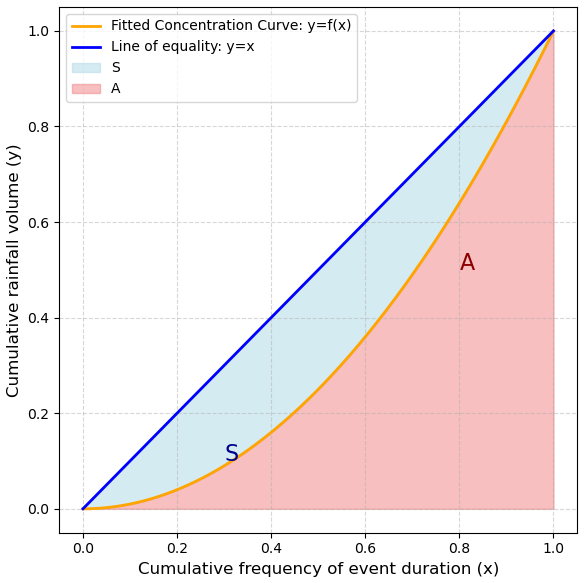
Figure 5Example of the line of equality and empirical curve for the rainfall concentration calculation. The concentration index is equal to the area between the line of equality and the fitted curve (S) divided by the total area below the line of equality (S+A).
2.3.4 Exposure (population)
As all the parameters of the LYI are not always readily available at the watershed scale (as highlighted by most of the published literature, which considers LYI at the country scale), we added population counts as one of the predictors to train the model. For Nepal, we selected the data from the country's national census (https://censusnepal.cbs.gov.np/Home/Index/EN, last access: 22 September 2025) and aggregated them at the watershed scale using the previously mentioned weighted join. To extend the model to the whole HMA, we computed the population for each watershed across the region from the Gridded Population of the World (GPW), v4 | SEDAC (2024). This dataset provides spatially explicit estimates of population density for the years 2000, 2005, 2010, 2015, and 2020, based on counts consistent with national censuses and population registers, as raster data to facilitate data integration. We used a simple linear regression to retrieve data for the missing years.
2.4 Machine learning model
XGBoost is primarily used to solve classification problems. To generate the results, the XGBoost algorithm uses an ensemble of boosted trees. An ensemble is a collection of predictors that together can give a final prediction while reducing errors significantly. In this case, the predictors were climatic variables, geomorphologic variables, and exposure. Boosted algorithms are those in which each successive model attempts to correct the errors of its predecessor (similarly to adaptive learning). The basic XGBoost algorithm can be understood as an ensemble of boosted trees. The idea behind such an ensemble is that multiple trees are built in sequence, with each tree built on the previous one's prediction. And each successive tree built considers the errors of the previous trees. This means that when we take an average of all the trees at the end, we get a final tree that is better than any individual tree within the model. We applied the XGBoost model to the geomorphologic, climatic, and exposure variables to predict classes of LYI in different basins in Nepal and HMA.
2.4.1 Validation of the system at the HMA scale
We conducted thorough testing and validation of our model for Nepal, comparing the predicted value of LYI to the calculated life year index (LYI) data from tabular values specific to the region. We trained the model and validated it only using the data for Nepal, at the district scale and then at the watershed scale. Overall, we opted for a 90–10 approach, meaning 90 % of the Nepal data were used for training and 10 % for validation. Upon extending the model's applicability to the entire High Mountain Asia (HMA) region, we rigorously assessed the quality of our results by comparing the predicted social impact with that reported in established flood databases covering the region. We performed hyperparameter tuning using weighted accuracy (1–3–9 weighting scheme) for subsequent classes (low, medium, and high), prioritizing the category “high”. Initially, when XGBoost was trained, it achieved a 63 % test accuracy, but its confusion matrix revealed that it struggled to correctly classify the most destructive category (category 3). Since this category was of primary interest, the model was refined using weighted accuracy, emphasizing its importance. A 5-fold cross-validation procedure with 1000 iterations was conducted, and for each cross-validation, oversampling was applied to balance the dataset.
To verify our findings, we compared the predictions at the HMA level with flood events reported in the Dartmouth Flood Observatory (DFO) Global Active Archive of Large Flood Events, 1985–Present (Brakenridge, 2023). This comprehensive database compiles information on major floods, with this information sourced from diverse channels such as news reports, governmental records, ground observations, and remote sensing data. Notably, the DFO dataset encompasses various flood types, including lowland floods and mountainous river floods characterized as fluvial and pluvial floods. The dataset provides point locations, representing the centroids of affected areas during floods. While acknowledging that flood centroids may oversimplify the complexities driving flood events, we utilized this dataset to showcase our model's capability to target high-risk locations historically impacted by floods within the specified time frame. Identifying high-risk areas with recorded flood occurrences centered around these locations underscores the robustness of the model beyond the confines of its training and validation site in Nepal.
Meteorological and climatological severity reported in the DFO database does not directly reflect the social impact of floods, and the events listed often span multiple watersheds. To address these limitations, we compared our model's predictions to the DFO data using a proxy for social severity – specifically, the reported number of people affected, including “deaths” and “displaced.” Instead of relying on meteorological classifications, we grouped the DFO events by social-severity classes defined as 10n, where n corresponds to the severity level indicated in the DFO database. We then evaluated the marginal probability that events with varying DFO severity occurred in watersheds with different predicted LYI (life year index) levels. Additionally, we computed the conditional probability – that is, the likelihood of a DFO-classified event occurring within watersheds predicted by our model of having a certain LYI classification. This conditional probability helps to assess how well our system identifies high-impact regions across different time frames. For example, if only 10 % of watersheds are classified as high impact by our model but most of the DFO's most severe events (e.g., those with > 1000 people affected) occurred within these watersheds, this would indicate that our model effectively captures regions of elevated social risk. A more detailed discussion of model performance and validation is provided in Sect. 3.3.
3.1 Variability of the predictors
The topographical characteristics of an area can influence the local climate and population distribution. Figure 6 shows an example of how climate concentration and population vary in Nepal, as compared to watersheds that have areas of high FGP to a greater or lesser extent. The figure reports the average for the time frame 1980–2020 for CI and population, while the FGP is a static value for the time frame (since it is based on a unique DEM dataset), and it represents the overall geomorphic characteristics of Nepal.
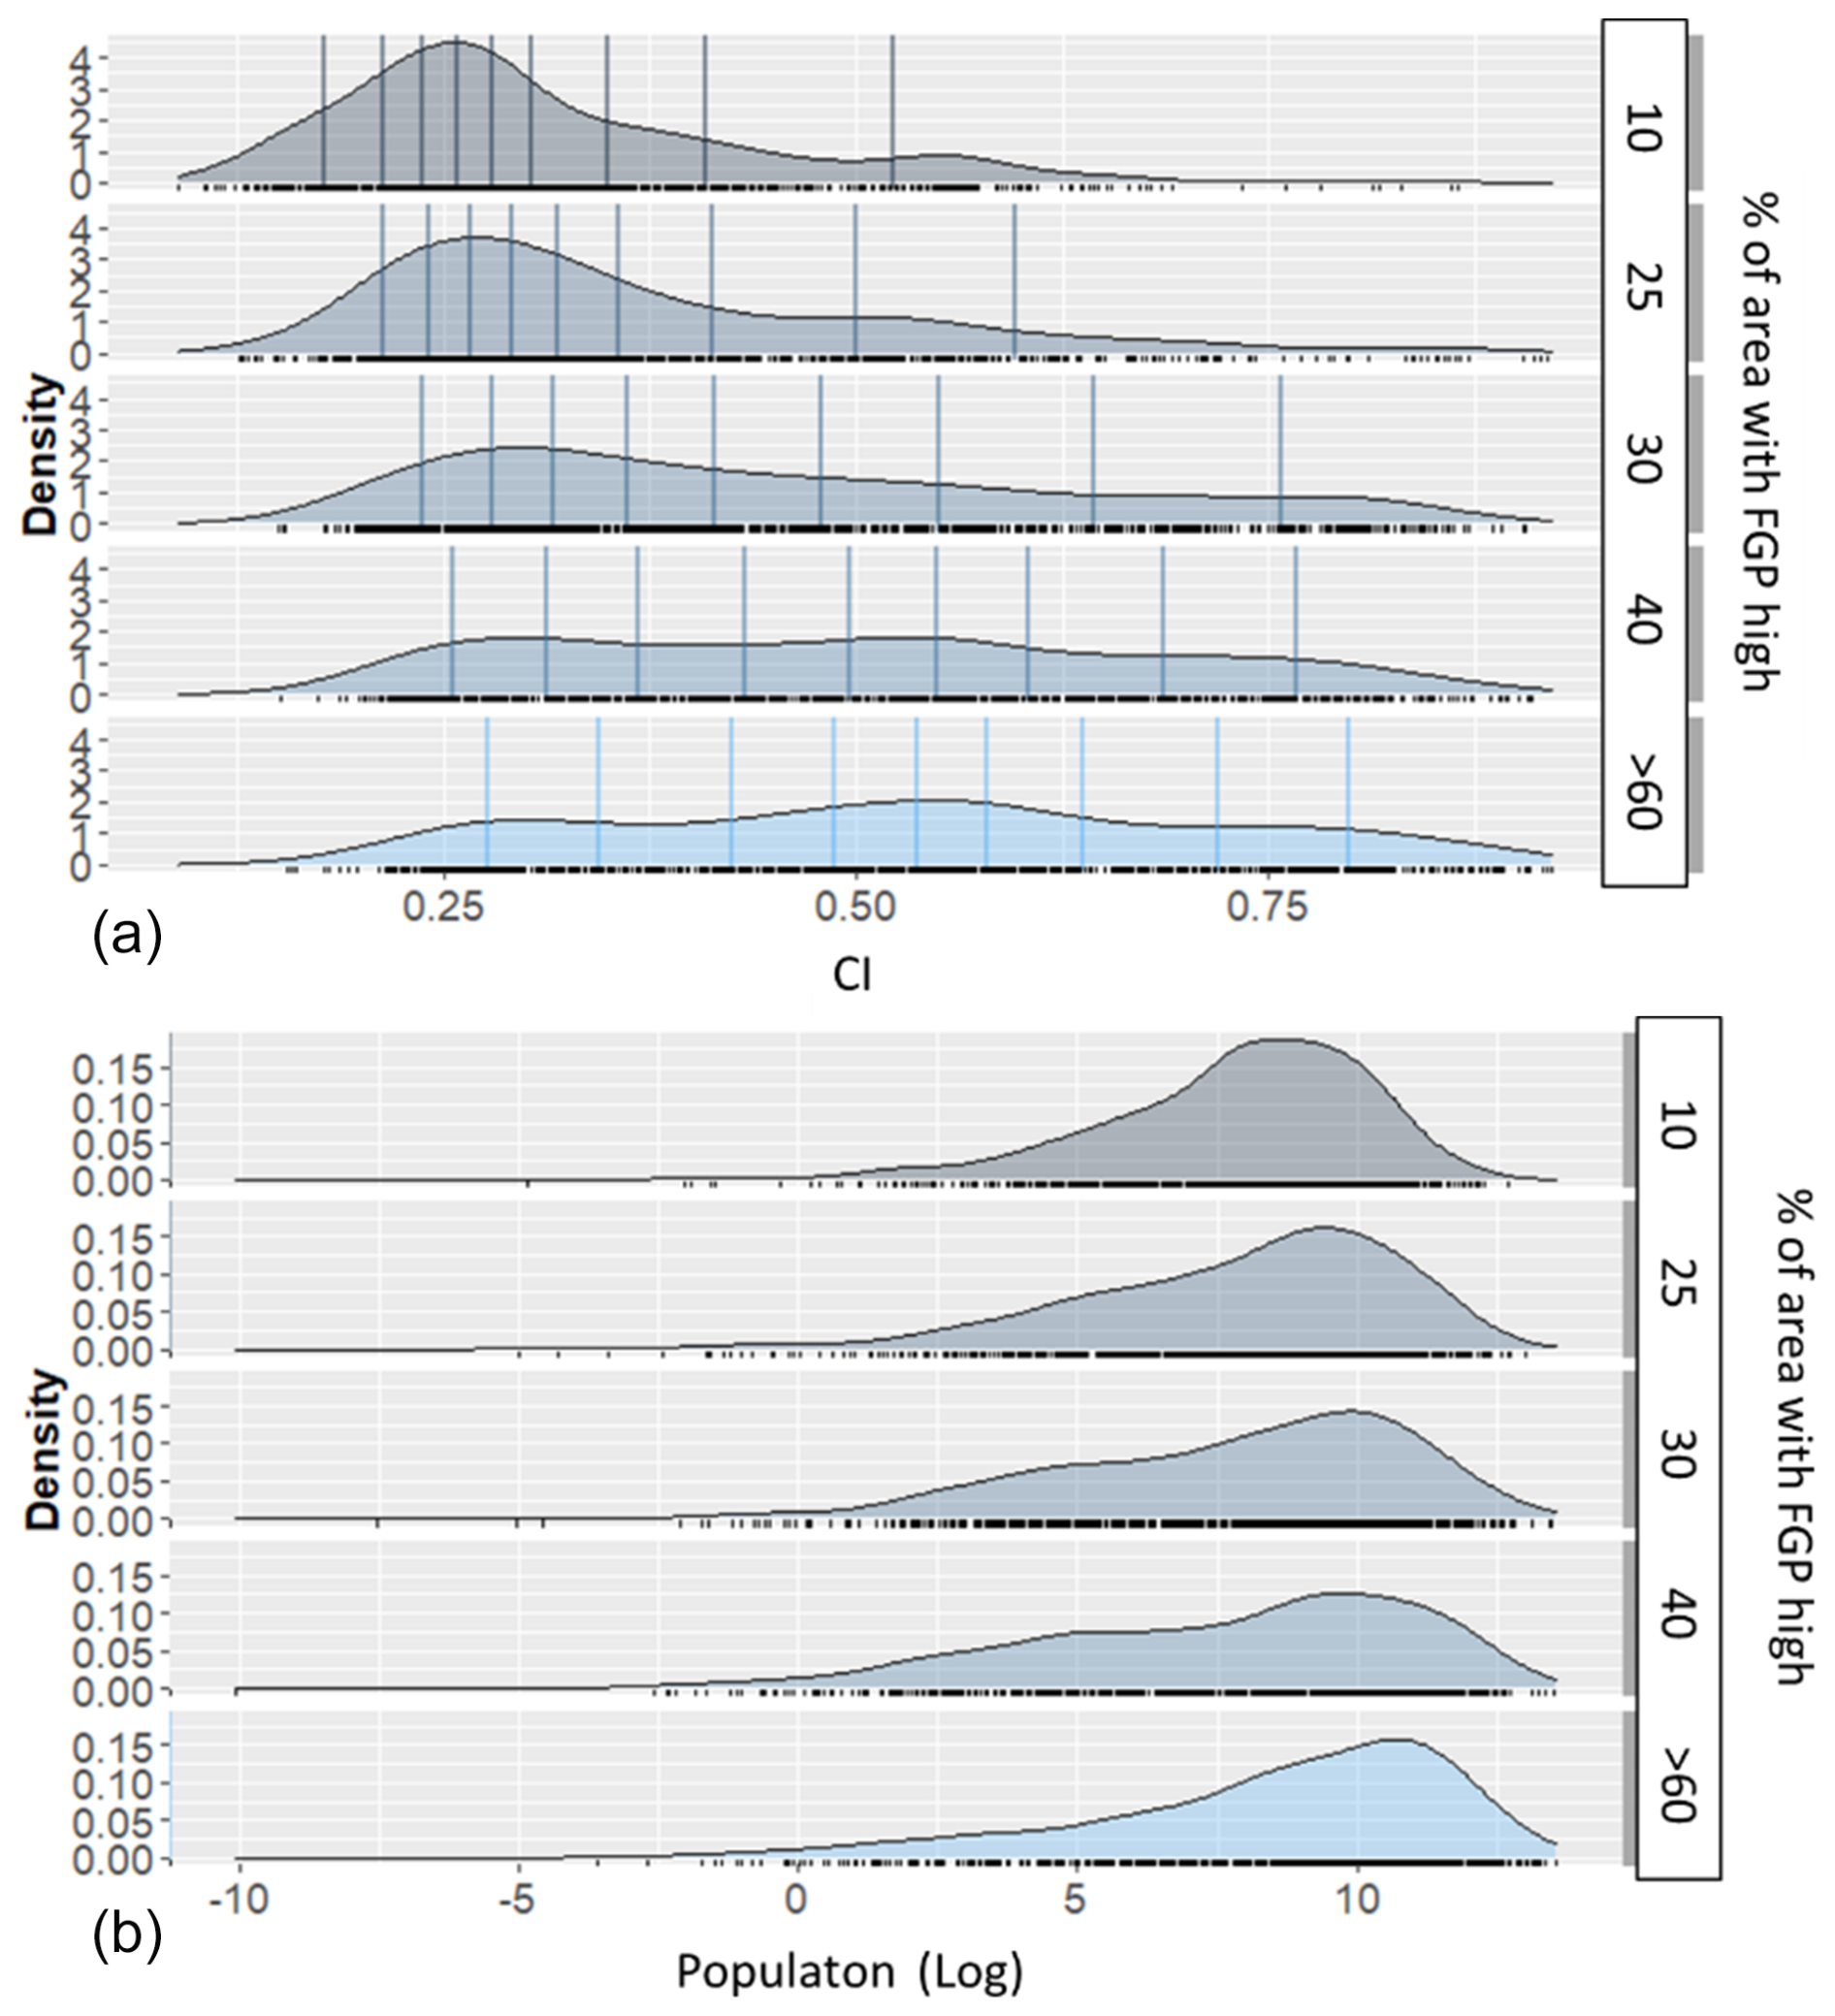
Figure 6Average variability in the CI (a) and population (b) compared to FGP from 1980–2020.
From this analysis, we can see how the variability in CI is complex. As expected, the variability in the index is related to atmospheric characteristics (Sangüesa et al., 2018), but the index also varies due to geographical factors influencing climate (Tuladhar et al., 2020). In their study based on Nepal, Karki et al. (2017) highlighted the difference in the spatial pattern of high-intensity storm events from that of annual and monsoon events. The rapid rate at which physical processes (e.g., convection) take place regulates the high temporal concentration of precipitation in the regions where the sea surface and ground are highly affected by warmer temperatures (Monjo and Martin-Vide, 2016). On the other hand, the low temporal concentration of rainfall is characterized as a normal pattern caused by cyclical weather events (Monjo and Martin-Vide, 2016). Watersheds with lesser floodplain extents (that is, smaller areas with high FGP) are related to higher and steeper mountains with complex orography. Research has shown that low areas in Nepal are susceptible to receiving high-intensity storm events even though they experience fewer wet days (Karki et al., 2017). Karki et al. (2017) also observed that the low-intensity events (annual and monsoonal precipitation) were mostly predominant over Nepal's western middle mountains and central high mountains. In another study, however, Subba et al. (2019) stated that the frequency of extreme events had decreased significantly over the past 2 decades in the eastern part of Nepal. For our case, areas having the larger physical potential to flood (high FGP) appear to be areas showing the largest variation in CI, with values ranging from low (0.2) to very high (0.75), indicating a potential compound effect of highly torrential rains (CI = 0.7) in locations where much of the landscape is potentially floodable (FGP high) and most of the population resides. Readers should consider that higher FGP values do not imply locations having wider channels but rather indicate how the landscape is potentially more flood-prone, as highlighted by Samela et al. (2017) and Manfreda and Samela (2019).
Much of the population of Nepal tends to be concentrated in areas with higher FGP, as is typical of mountainous areas, where populations and economic activities are mostly located in the river valleys. Globally, the floodplains of rivers are preferred living spaces for the population and provide favorable locations for economic development. These areas are commonly exposed to floods; however, an increasing population, together with the changes in storminess, means that the risks from flooding are expected to be higher. On average, the population increased significantly in watersheds that transitioned from low to medium (LtoM), medium to high (MtoH), or low to high (LtoH) flood risk categories (Fig. 7: example variability from 1985 to 2020). This suggests that growing population density in certain watersheds may be contributing to increasing flood susceptibility. The CI (concentration index) slightly decreased over this period for some watersheds. However, watersheds experiencing population growth were more likely to influence the transition to a higher flood risk category. Although CI has not significantly increased, the interaction between land use change, urban expansion, and demographic shifts may be playing a role in driving these transitions. Transitioning watersheds have a higher average FGP compared to the overall average FGP and tend to have a larger average watershed area compared to all watersheds. This indicates that larger watersheds are more prone to experiencing shifts in FGP and flood risk categories, possibly due to their ability to accumulate and distribute larger volumes of runoff and sediment. This supports the idea that intrinsic watershed characteristics (such as geomorphology and size) play a role in flood susceptibility alongside external factors like population growth and the rainfall concentration index (CI). Areas successfully predicted as at high risk (high LYI) in the most recent years are those showing high social vulnerability in terms of social conditions (lack of communication, lack of access to electricity and infrastructures, lower education, small children under 5), a high percentage of migrant communities, and a high risk of poverty and poor infrastructures (Aksha et al., 2019).
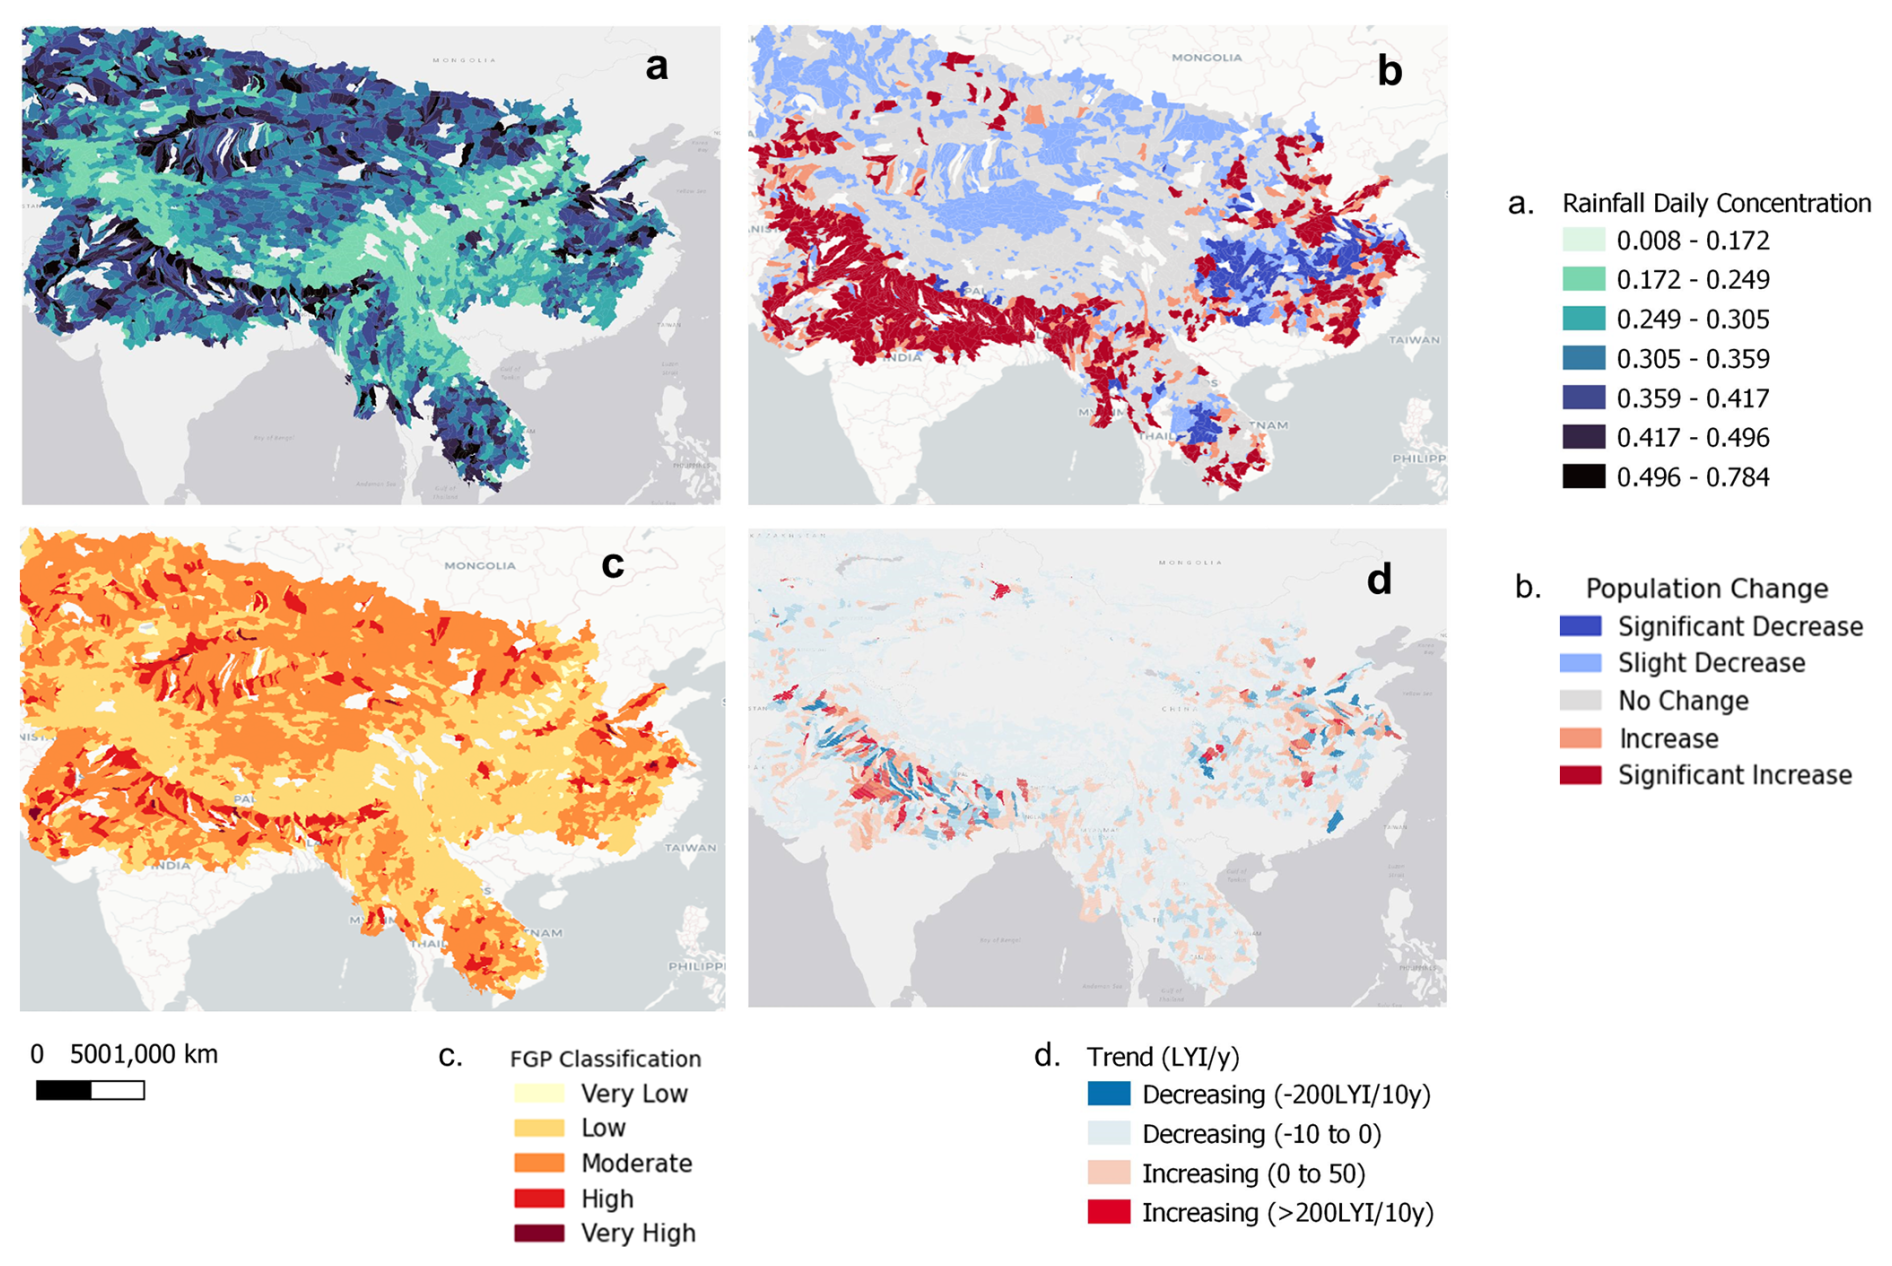
Figure 7Average variability in the rainfall CI (a) and population change (b) compared to FGP (c) and the LYI trend (d) from 1980–2020 (background image sources: Esri, DeLorme, HERE, MapmyIndia).
3.2 Variable importance and model performance
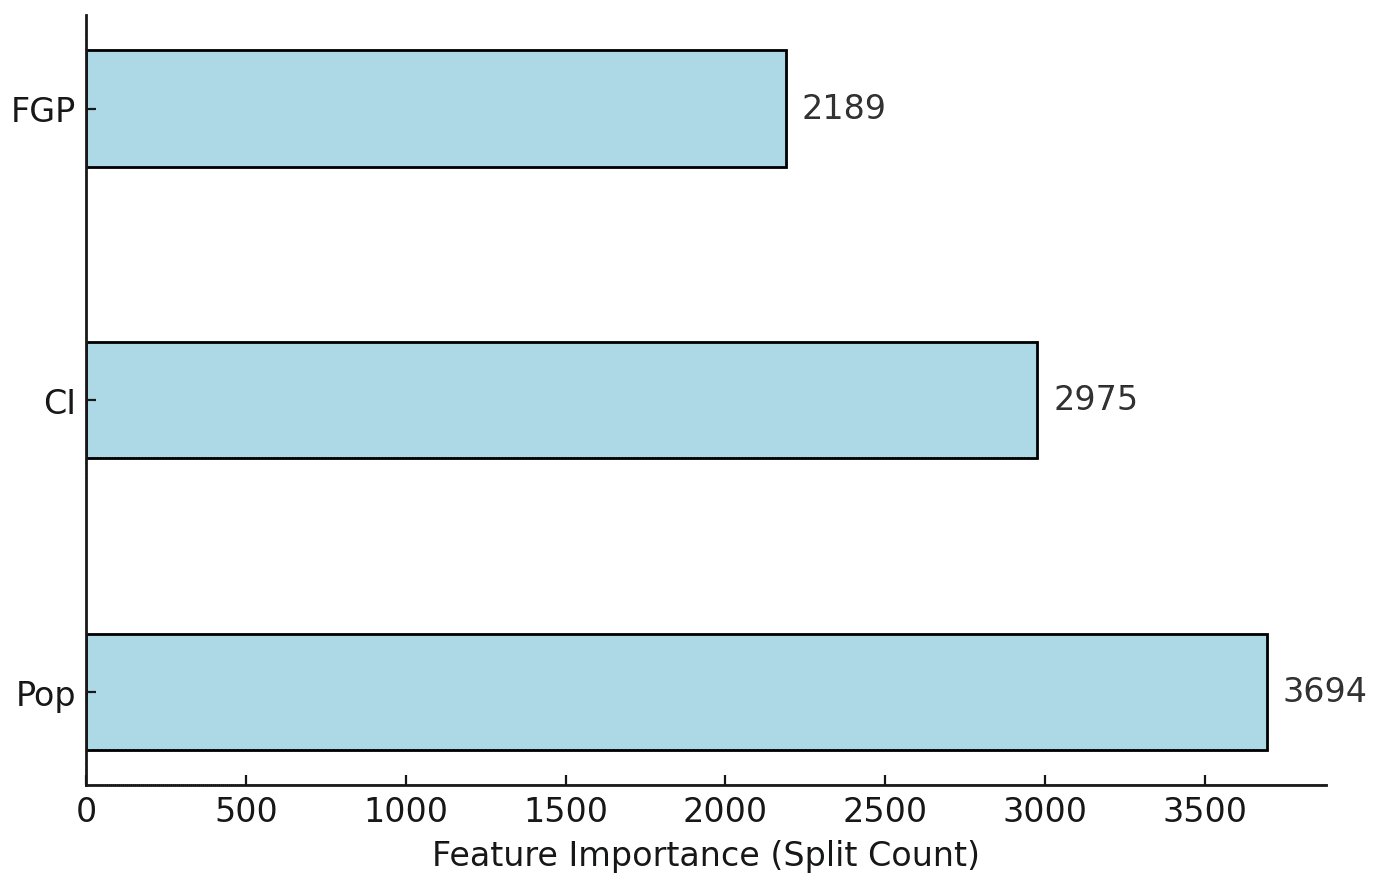
In this section, we present a variable importance comparison (Fig. 8) based on the feature importance score (F score) in XGBoost. XGBoost provides an F score based on how frequently a feature is used in splitting the data across all decision trees. This is the number of times a feature appears in a split across all trees in the model. A higher value indicates that the feature is used more frequently in decision-making, suggesting it has a stronger influence on model predictions. The F score indicated that population (Pop) was the most important variable, which was consistent with our expectation in the sense that the socioeconomic impact depends largely on exposure. The climate variable (CI) was the next most important variable, showing the significance of the region's climate to the socioeconomic impact of flood occurrences.
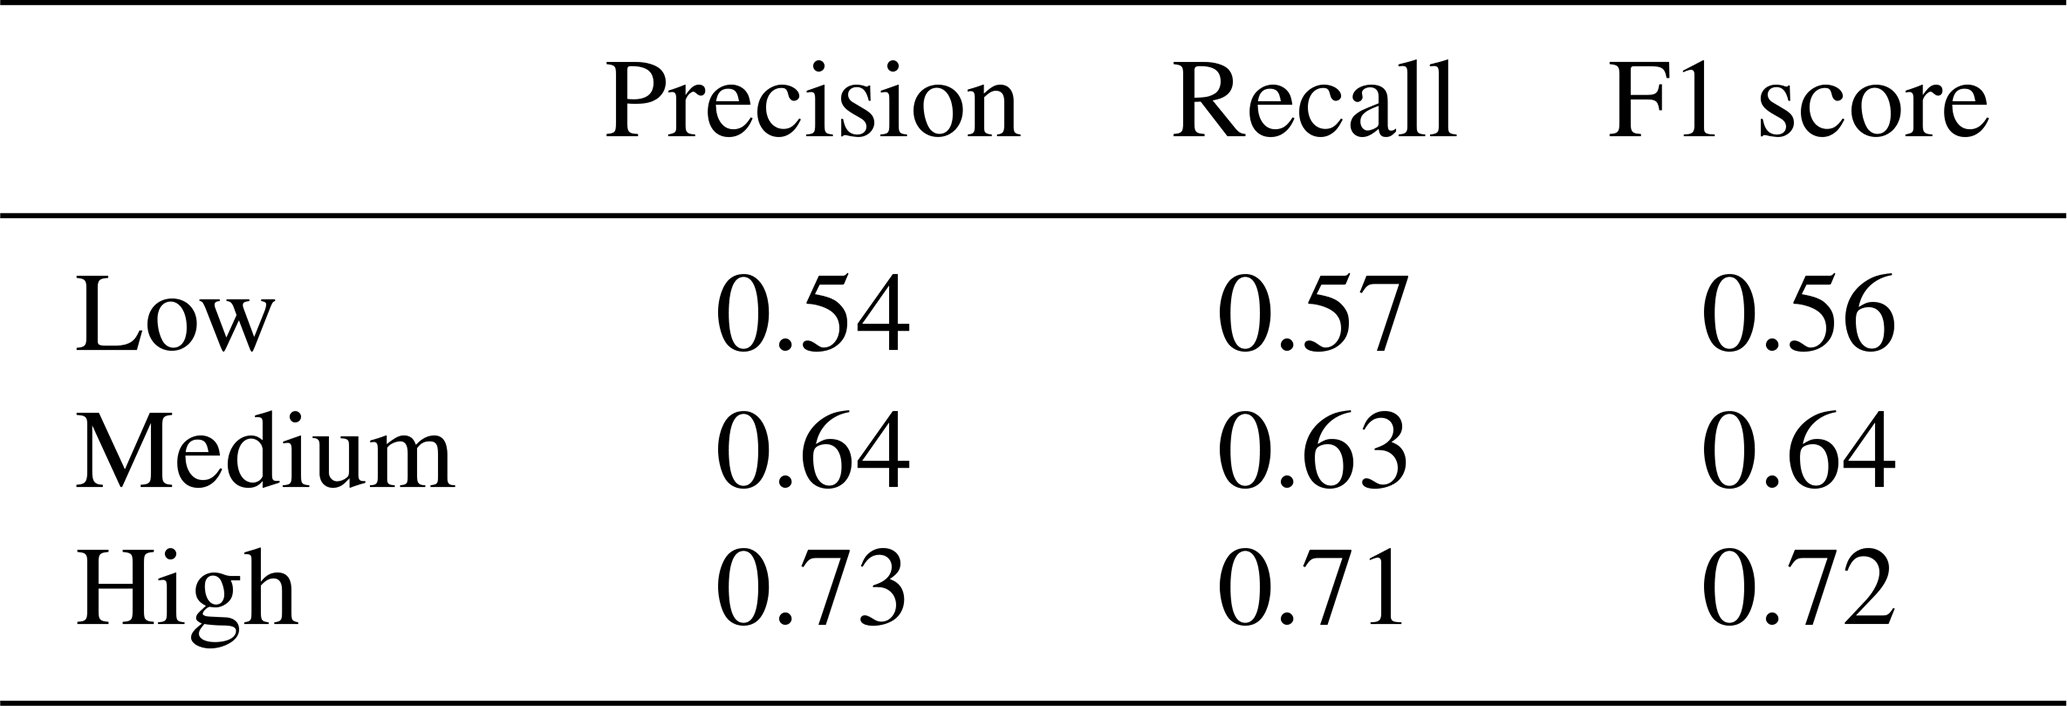
The precision, recall, and F1 score are metrics used to evaluate the performance of a classification model. Precision is the fraction of true positives among the predicted positives. Recall is the fraction of true positives among the actual positives. The F1 score is the harmonic mean of precision and recall.
The evaluation metrics, shown in Table 2, reveal that the model performs best in the high class, with the highest precision, recall, and F1 score. The final tuned models achieved weighted accuracies of between 52 % and 58 % but significantly improved recall (71 %), precision (73 %), and the F1 score (72 %) for the category “high”. This means that out of 34 actual instances of the highest category, 24 were correctly predicted, and out of 33 predicted cases, 24 were accurate, confirming that the model effectively focused on the most critical category. This suggests that while the overall accuracy slightly decreased due to the re-weighting, the model's performance in identifying the most critical cases significantly improved. The medium class also demonstrates relatively high performance across these metrics. However, the low class exhibits the lowest performance, suggesting that the model may face challenges in accurately distinguishing between the low and medium classes or may demonstrate a bias toward predicting the medium and high classes. These findings provide valuable insights into the strengths and limitations of the classification model and can guide future efforts to improve its performance. Overall, considering that the model aims to target substantial risk areas, a higher rate of predicting impacts is acceptable compared to an underestimation of the risk.
3.3 Predicted versus observed flood impact in Nepal
Comparing predicted life year index (LYI) flood impacts with observed data showed good correspondence between high-risk areas identified by the ML method and historical flood locations in Nepal. This suggests that the proposed approach effectively delineates flood risk on a national scale. Figure 9 illustrates this comparison, showcasing observed (empirically evaluated) and ML-predicted LYI values at both watershed (upper row) and district (lower row) levels.
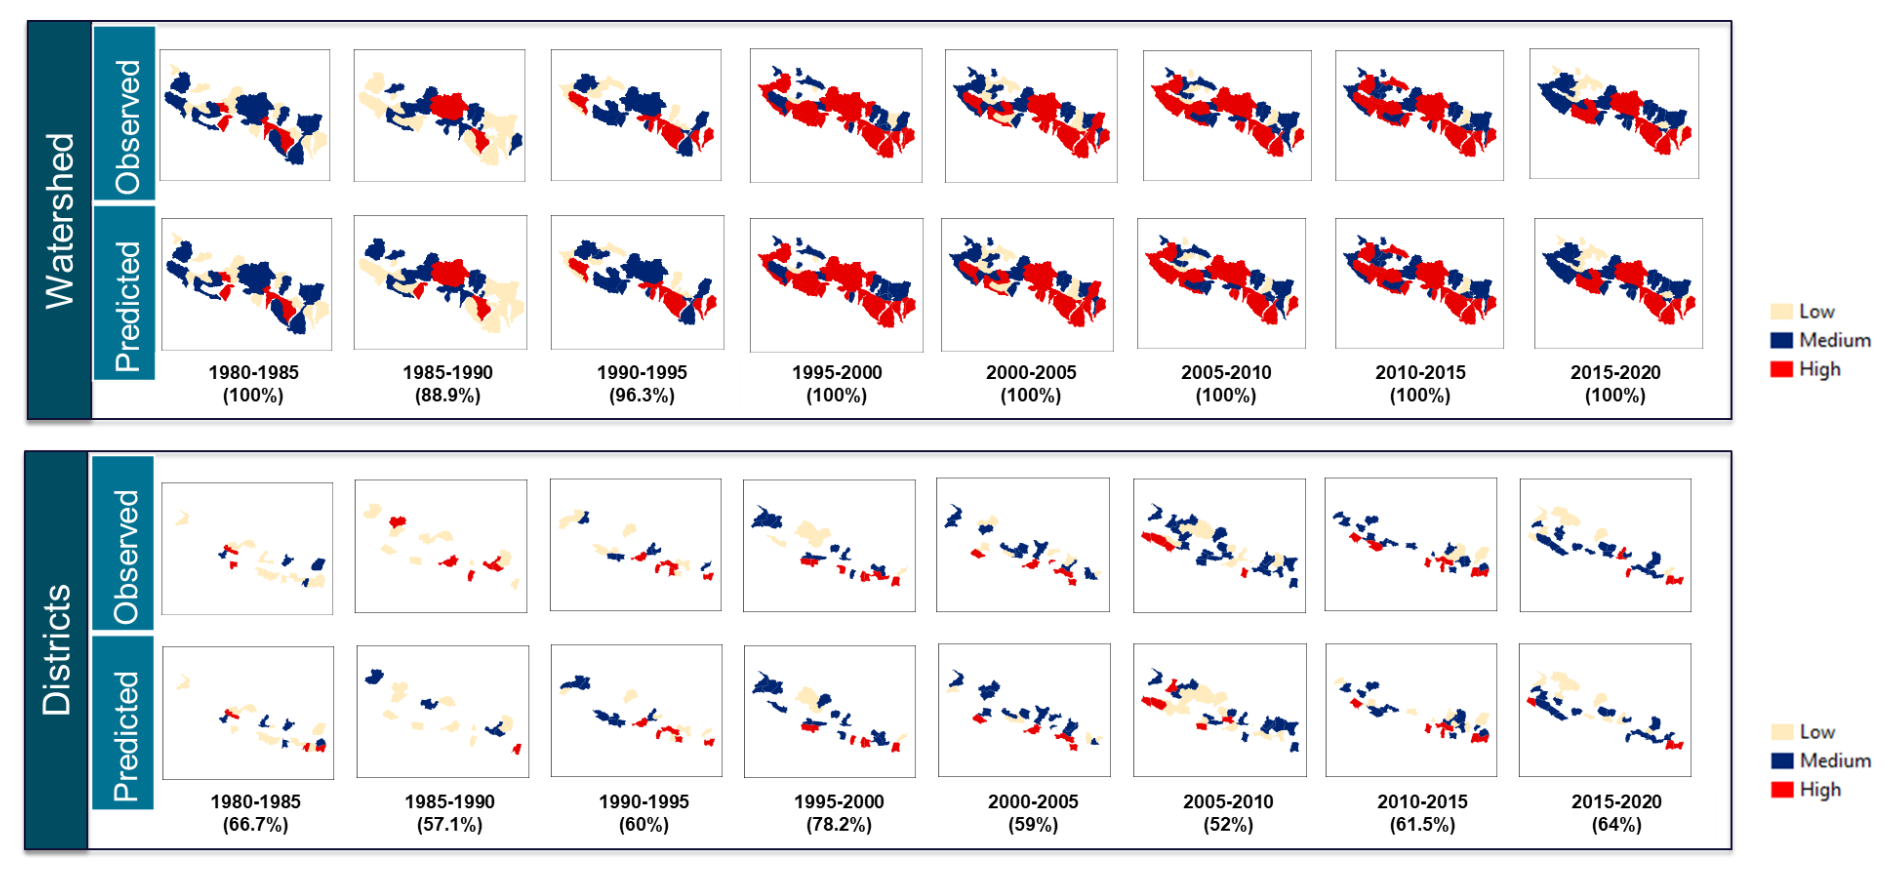
Figure 9Comparison of prediction with actual socioeconomic impact for watersheds and districts in Nepal. Basins/districts are marked “high” for LYI values of over 1000 years. Medium is for values between 100 and 1000, and low is for values of less than 10. Numbers in parentheses represent accuracy.
The “observed” LYI values were empirically calculated from observational data (Table 1) and categorized into three groups – “low”, “medium”, or “high” – with basins/districts labeled “high” for LYI values exceeding 1000 years, “medium” for those between 100 and 1000 years, and “low” for those below 10 years. The “predicted” values represent the outputs from the machine learning model. In Nepal, we achieved an overall training accuracy of 97 % and a test accuracy of 63 %. Notably, training the model at the watershed level yielded higher accuracy compared to the district level. This is attributed to watersheds being hydrologic units that integrate geomorphological and climatic properties, thus providing a more accurate representation of flood dynamics compared to administrative district boundaries.
At the watershed level, nearly all year ranges exhibited a 100 % match with observed impacts. In instances where the model's accuracy fell below 100 % (e.g., 1985–1990 and 1990–1995), the LYI values in the affected watersheds were low, indicating that the predictors considered were more indicative of major flooding events. The superior accuracy achieved at the watershed level underscores the value of implementing the model at this scale when scaling up the system.
3.4 Prediction of the socioeconomic impact of heavy rainfall over HMA
We applied the trained model for the watersheds in HMA to 5-year intervals from 1980 to 2020. As an example, Fig. 10c and d show the predicted basin-averaged LYIs (low–medium–high) for the watersheds in HMA for two different timelines. The yellow circles highlight the changes in flood impact over the decades. One must consider that most of HMA has low population density (blue color in Fig. 10b), and as expected, the proposed model predicts low socioeconomic flood impacts for these regions. Hotspots of high impacts (red colors in Fig. 10c and d) are present, where population exposure is higher.
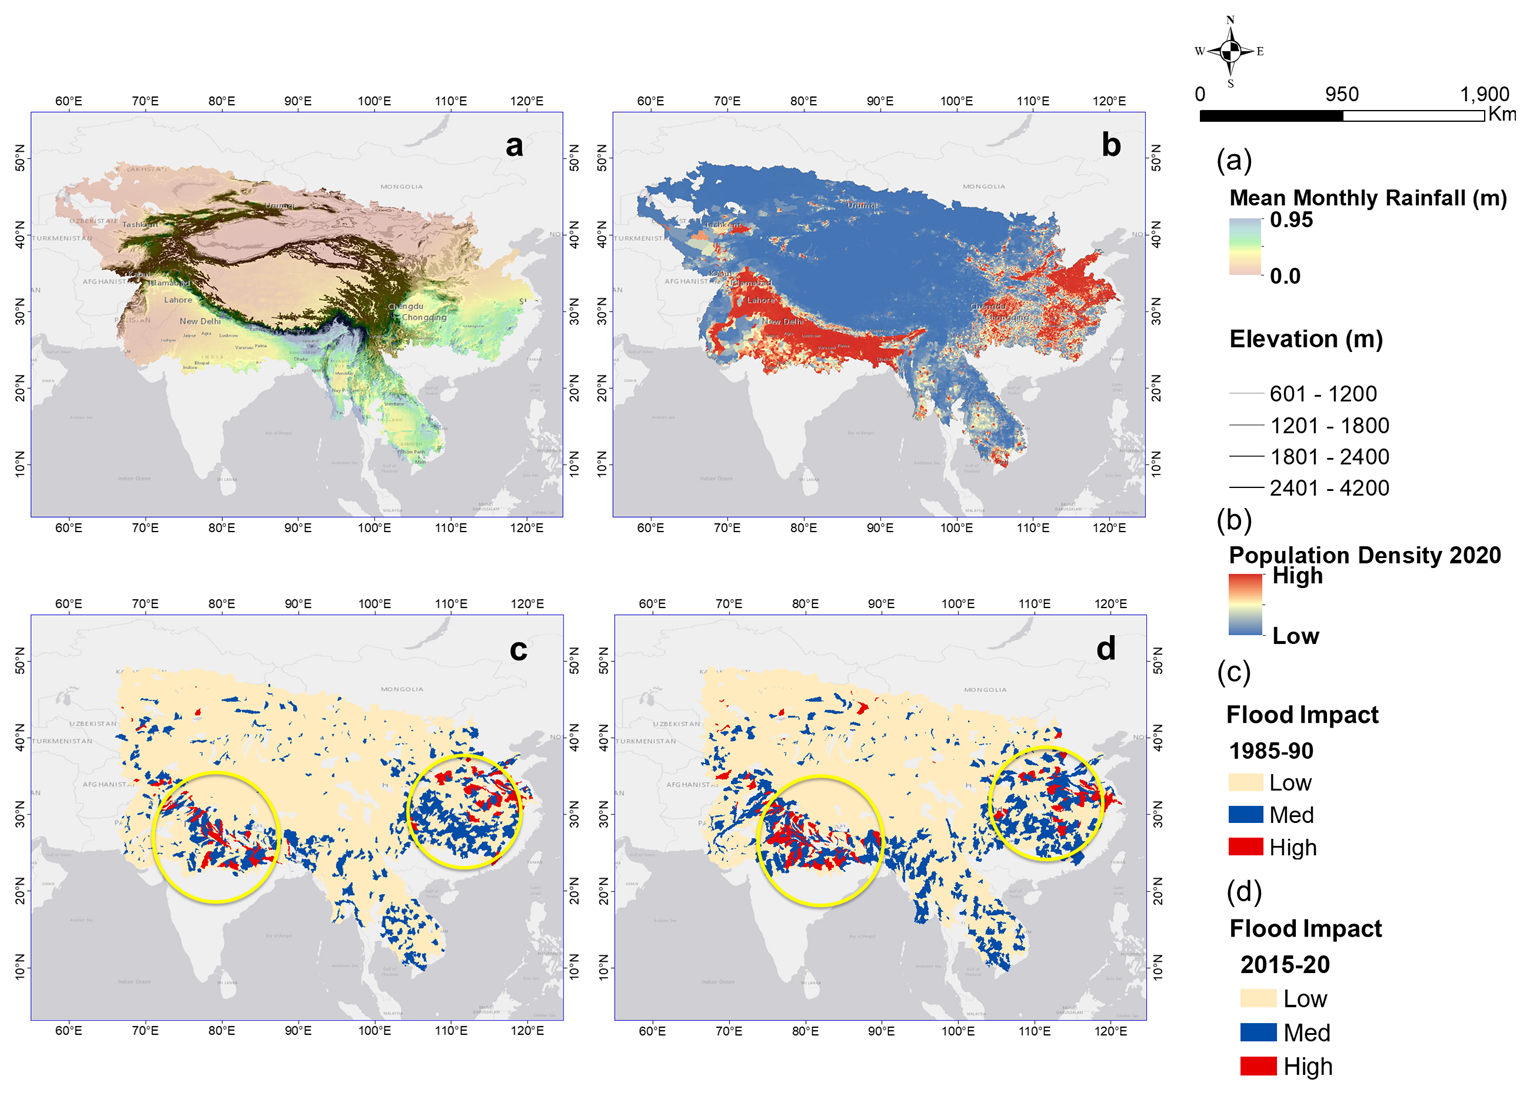
Figure 10(a) Mean monthly rainfall overlaid on elevation (contours); (b) population density 2020; (c, d) example of predicted basin-averaged flood impact for HMA (c, 1985–1990; d, 2015–2020). Yellow circles denote the changes in flood impact between the two timelines (background image sources: Esri, DeLorme, HERE, MapmyIndia).
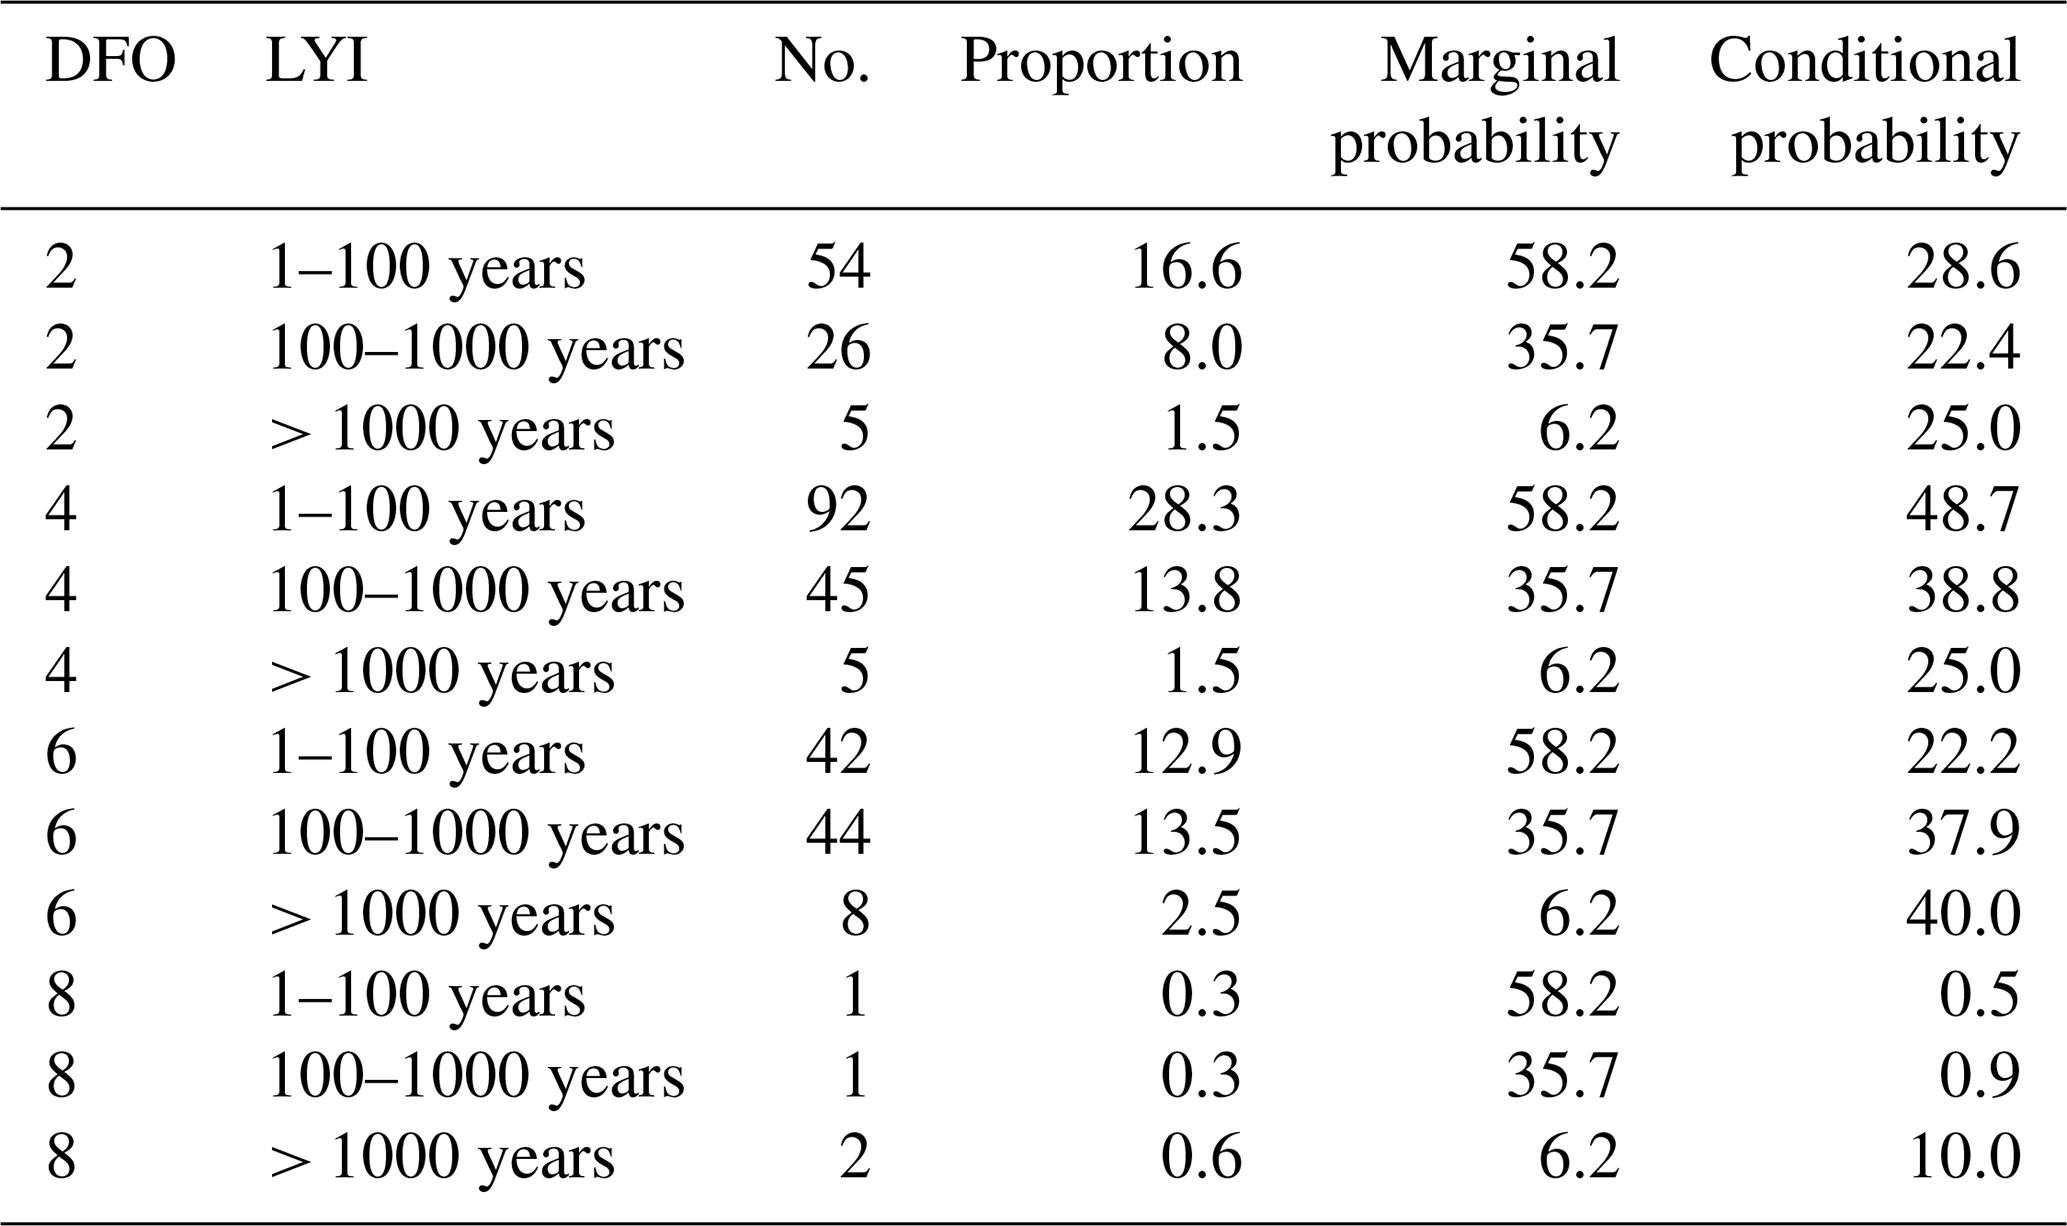
Summarizing the results presented in Table 3, we can say that, for the years shown, we predicted almost 57 % of watersheds (marginal) having LYIs between 1 and 100 years (low), 35.9 % having LYIs between 100 and 1000 years (medium), and only 6 % having LYIs greater than 1000 years (high). For the entire period, most of the time we predicted LYIs of 1 to 100 years, for which we captured events of DFO severity of around 2 (102 deaths + displaced) (conditional = 28.6 %). This suggests that most “low”-class DFO events did happen in the watersheds within the lowest predicted LYI range. Readers must consider that “low” in this case means the flood impact can range from 1 to 100 years lost, and a DFO value of 2 means total deaths and displaced are on the order of 102 people. The events with a DFO value of 4 happened mostly in watersheds with predicted LYIs ranging between 1 and 100 years and between 100 and 1000 years. The events with DFO values of 6 and 8 happened mostly in ranges greater than 1000 years and between 100 and 1000 years.
We further investigated how our predicted LYI behaved when it was related to the total population (Table 4), evaluating, as suggested by Noy (2014), the LYI per capita (that is, the number of life years lost per 100 000 people). As Table 4 shows, we correctly predicted over the years almost 64 % of watersheds (marginal) have LYI per 100 000 people of less than 1 year (100), 24.3 % have 10 years per 100 000 people (101), 11 % have 100 years per 100 000 people, and 0.6 % have 1000 years per 100 000 people. We noticed that LYI per 100 000 people reached, at most, 6000 for Nepal (at the country scale), and the study by Noy (2016a) also reported similar values for Nepal in 1987. Noy (2016a) reported actual LYI data in the range of LYI > 1000 years per 100 000 people in South Asia and stated that the higher amount of damage in East and South Asia is likely due to widescale flooding. This gave assurance about the consistency of our prediction with the actual data available. When looking at LYI per 100 000 people, we found that, for the whole time frame, most of the floods that registered in the DFO with low severity (DFO = 102 deaths + displaced) happened in watersheds for which the predicted LYIs were between 1 and 100 years (conditional = 29.8 %). This confirmed once again that, in most cases, “low”-risk events did happen in the watersheds having the lowest predicted range (similar to the findings presented in Table 3). As before, while the probability of a watershed being labeled as high risk (LYI > 1000 years per 100 000 people) by our system was only 6 %, the probability of these watersheds having experienced events recorded by the DFO as having a great impact (DFO severity > 6, meaning over 1 million people) rose to a conditional probability of 40 % and 10 %.
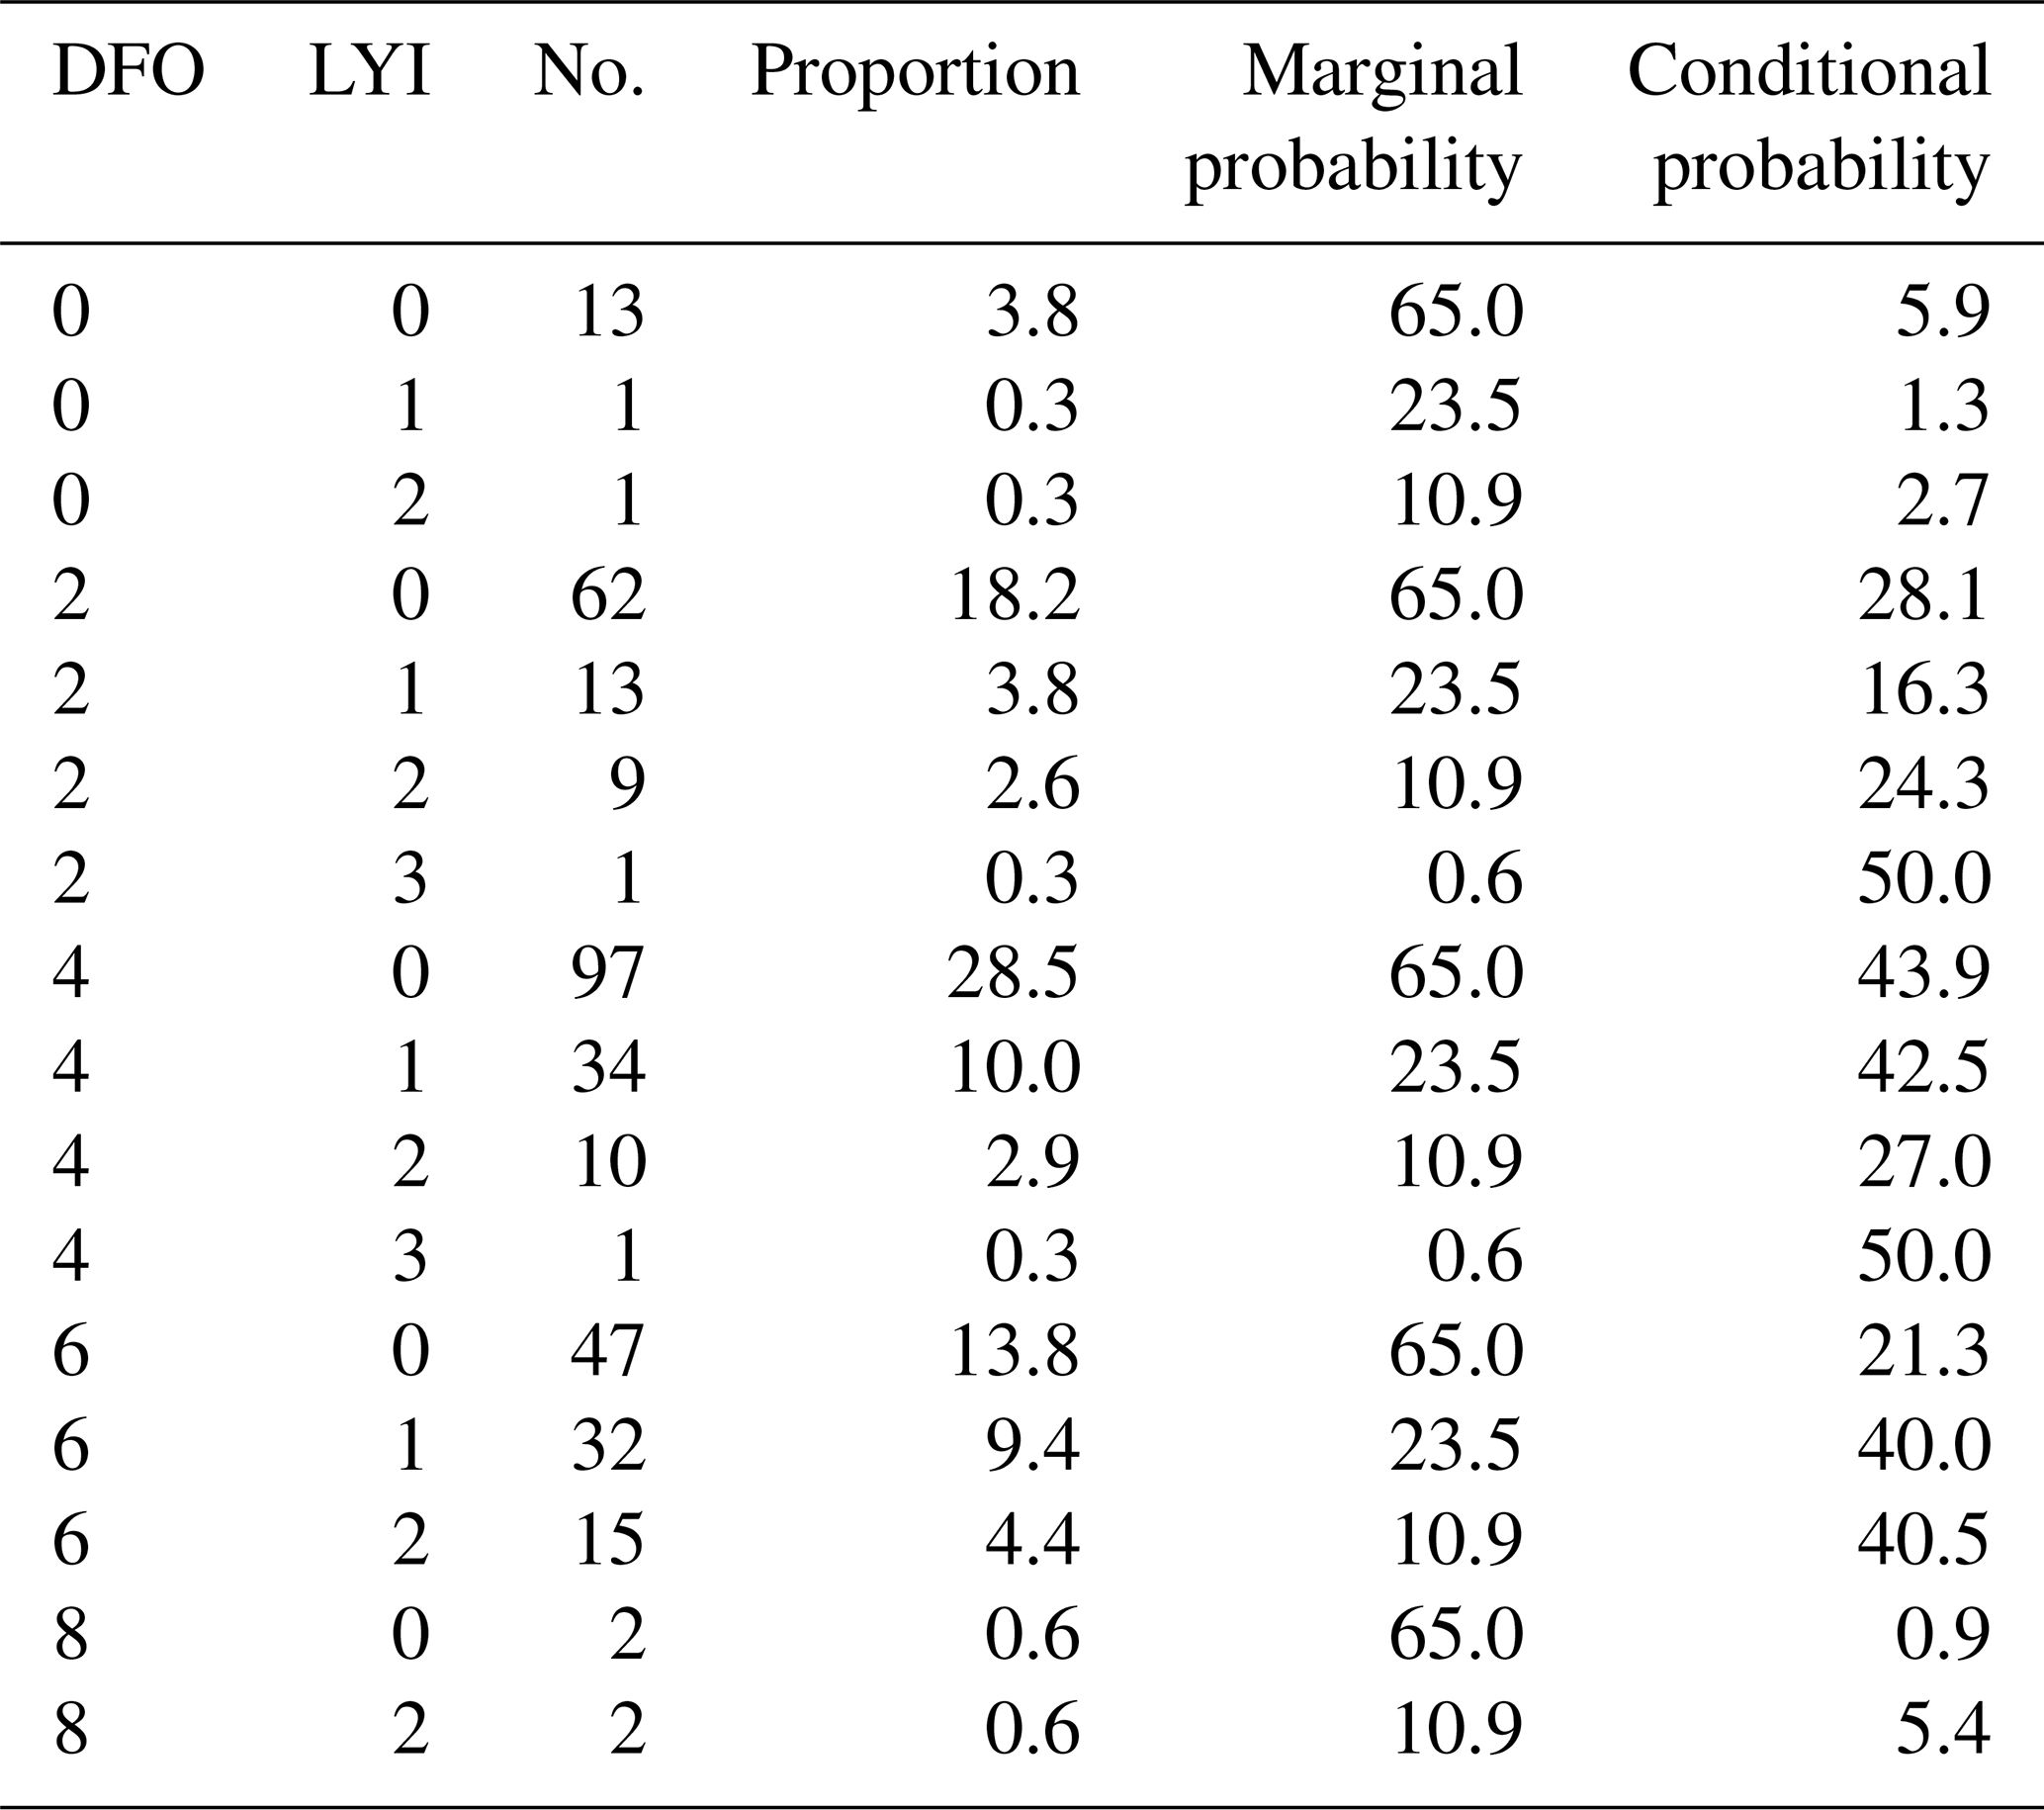
Figure 11 shows the LYI per 100 000 people (LYI per 100 000) evaluated for different time frames for all the locations reported in the DFO database to compare the DFO severity with our predictions. Overall, the DFO and predicted results were quite consistent with some minor variability in some scattered areas. When we compared the changes over time, we noticed an increase in vulnerability. As the plot makes evident, the largest changes took place in 1990–1995 and 2010–2015; the two concentrated areas were Nepal and China. As Fig. 3 shows, two big jumps occurred during these timelines for Nepal because of extreme storm-induced flood events. In Fig. 3, we show the predominant events that occurred in these timelines. Regarding China, as of June 2010, more than 29 million people had been affected by flooding, with up to 2.37 million evacuated and 195 000 homes destroyed (International Federation of Red Cross and Red Crescent Societies, 2010).
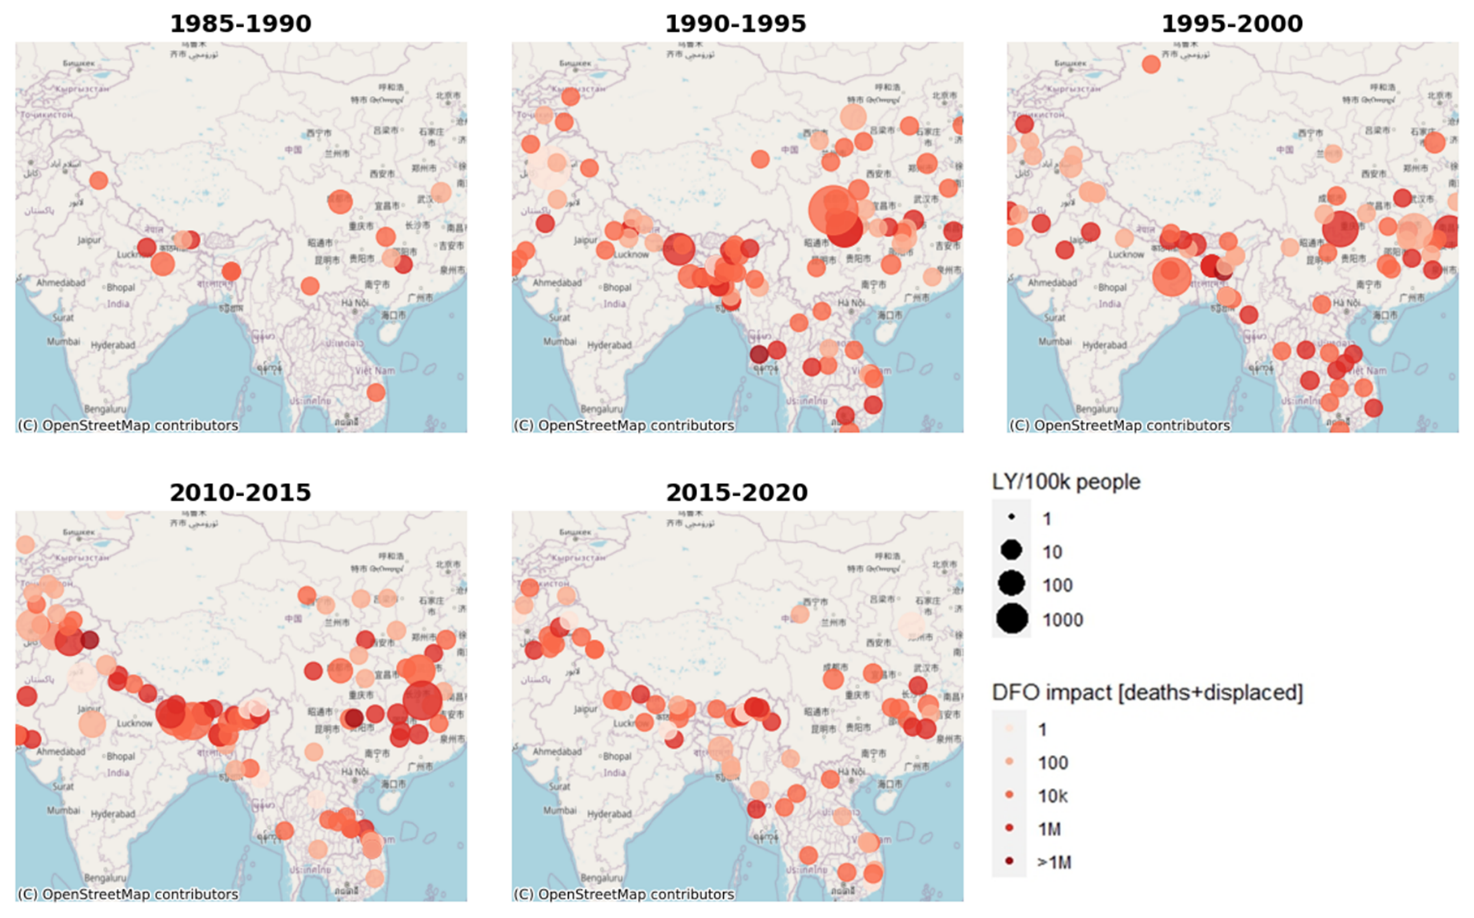
Figure 11Comparison of DFO and LYI per 100 000 people for all the timelines. © OpenStreetMap contributors 2023. Distributed under the Open Data Commons Open Database License (ODbL) v1.0.
3.5 Change in socioeconomic impact over time
Figure 12 (top) presents our maps of the watersheds where flood impacts increased over time. Furthermore, Fig. 12 (bottom) shows our evaluation of the percentage changes in the number of watersheds between timelines, focusing on three different changes: low to medium (LtoM), medium to high (MtoH), and low to high (LtoH). Some watersheds have not changed, and some show a decreased impact. For the sake of highlighting potential increases in flood impacts, we focused on those locations where risk increased over time, from low to medium or from medium to high. The largest changes were from LtoM for all the timelines and represented a notable change in vulnerability. Several watersheds showed higher flood impacts (from low to medium, medium to high, and low to high) in recent years as compared to 1985–1990. Again, we observed the largest changes for 1990–1995 and 2010–2015, which is consistent with Fig. 12. The exposure changed significantly, along with the intensity of the events; hence, the risk of flooding was heightened in these areas.
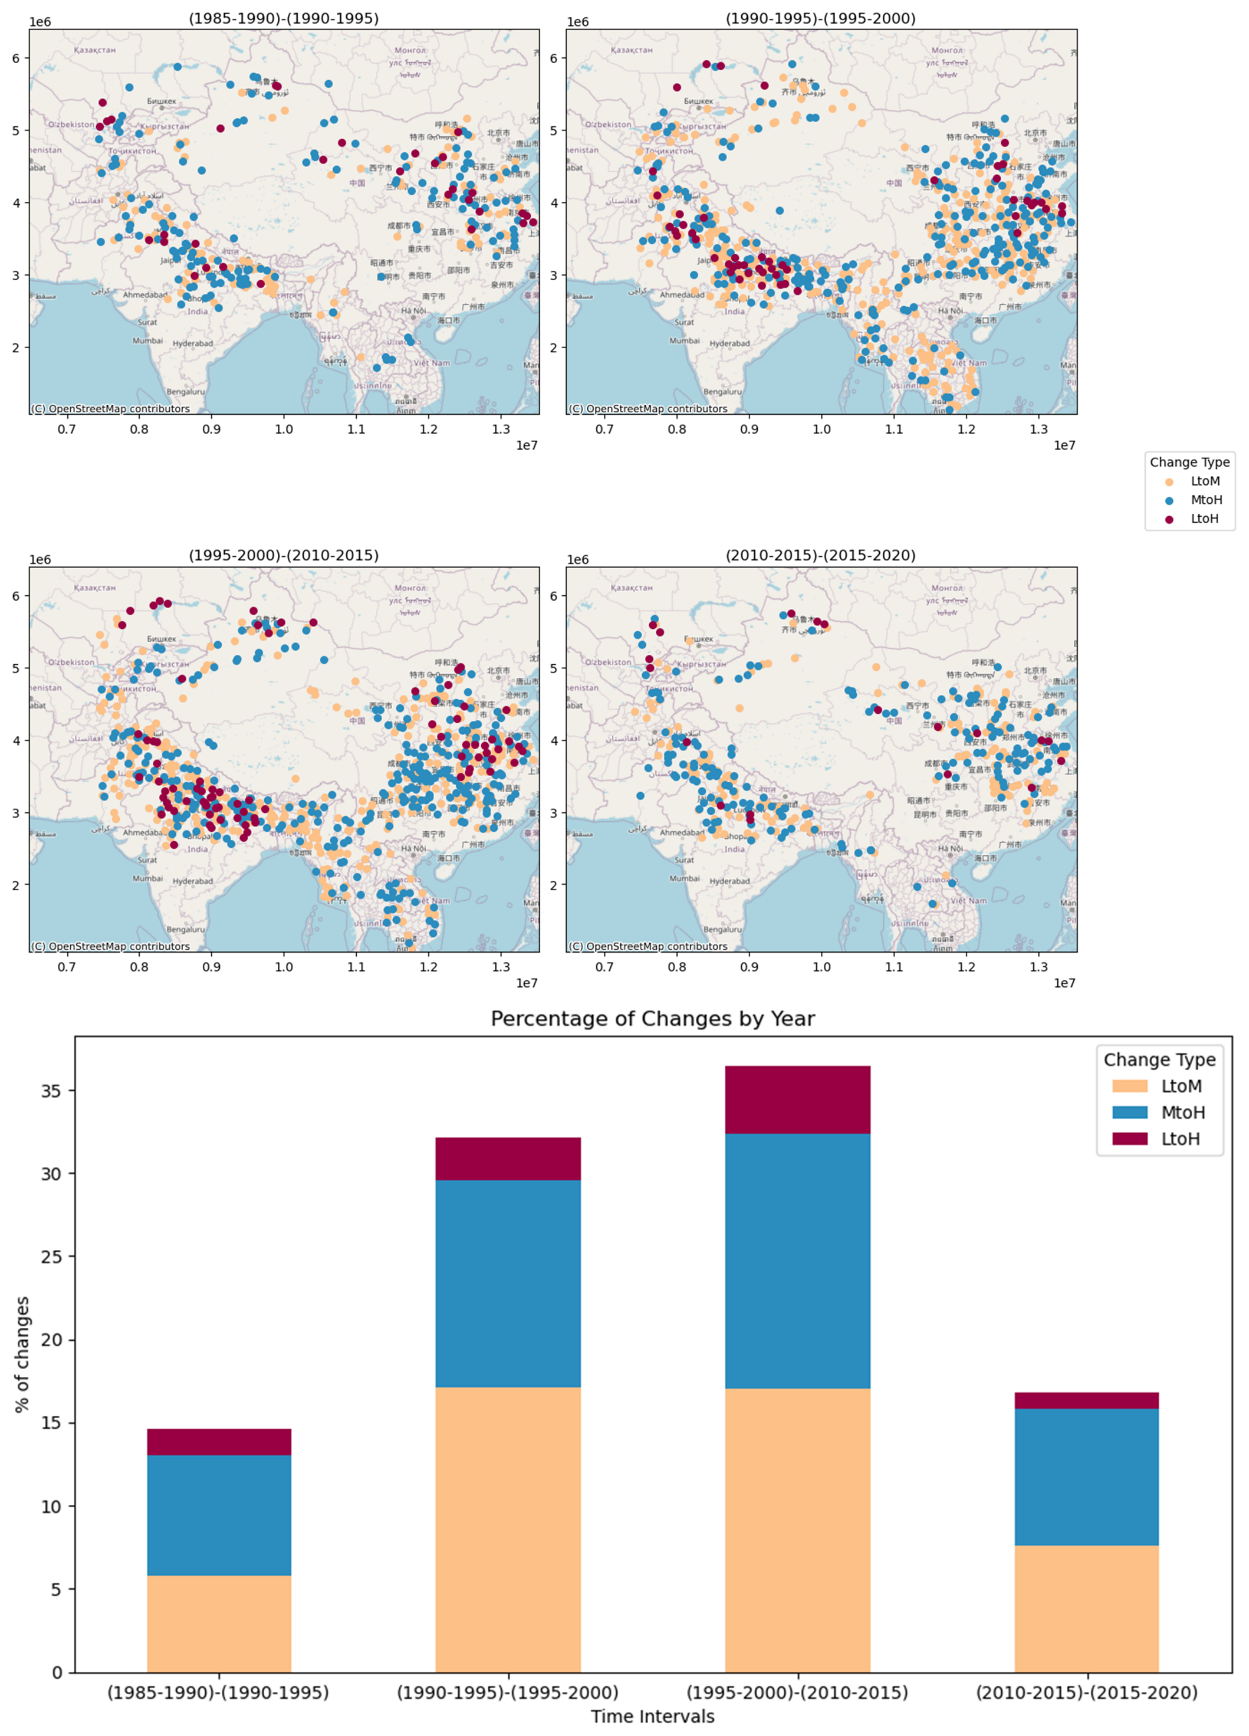
Figure 12Flood impact change in HMA over time. © OpenStreetMap contributors 2023. Distributed under the Open Data Commons Open Database License (ODbL) v1.0.
Impact changes from low to high were next, according to the number of watersheds changed for all the timelines. It was obvious that more changes would happen overall, but the comparison of the 1990–1995 and 1995–2000 timelines demonstrated that heightened flood impact occurred in a considerable number of watersheds within a brief period. For many watersheds, the risk was heightened by a population boom during the overall period.
3.6 Model constraints and limits
While this study demonstrates the promise of accurate flood impact prediction, the use of static flood geomorphic potential (FGP) maps presents limitations. Flooding alters channel morphology and downstream topography, impacting future flood dynamics (Khanam et al., 2024). Therefore, dynamic flood topographies are essential for robust hazard assessment. Although high-resolution data after extreme events can enhance prediction accuracy, the availability of such data is constrained by acquisition frequency. Hence, efforts to improve data availability post-disaster are crucial for enhancing the reliability of predictive models. Researchers could also derive FGPs from enhanced high-resolution terrain data, such as those derived from lidar sources if available. In such cases, however, it is advisable to retrain the model and reassess the significance of this parameter in the updated model, as terrain resolution and survey techniques might determine the variability of the data, especially when dealing with hydrologic parameters (Sofia, 2020).
The climate index considered in this study might vary depending on the input dataset (reanalysis vs. measurements), as well as on the timescale of the analysis. When comparing results to this study, researchers should make careful consideration of the length of the time window used for this evaluation (5 years). If daily data are considered over shorter time windows (e.g., 1 year), the index itself might result in higher values, capturing only short-term variability due to specific isolated storms. Seasonal analyses, on the other hand, would capture more of the concentration due to monsoon periods or dry vs. wet months. The proposed multi-year analysis is in line with literature studies on climate change and on the effect of flooding (Sofia et al., 2019; Saki et al., 2023; Du et al., 2023).
Population data for this work rely on standard available datasets. When considering the method to predict future changes, outside the time range covered by the proposed model, head counts alone cannot offer a full picture. It is also crucial to consider additional elements that could determine population shifts over time.
High Mountain Asia (HMA) presents a multifaceted landscape characterized by rugged terrain, diverse climates, rich vegetation, and substantial population exposure to natural disasters. Given its susceptibility to natural disasters, effective management is imperative for the region's long-term sustainability. Addressing the considerable threat posed by flooding demands a comprehensive strategy involving disaster risk reduction, sustainable land use practices, and climate change mitigation.
In this study, we introduced a simplified approach to identify vulnerability hotspots within the HMA region, focusing on intense rainfall events. To map the socioeconomic flood vulnerability, we employed a remotely sensed data-driven model integrating geomorphological and climate variability factors. This adaptable framework can be tailored to various regions provided that similar terrain and climate datasets are available, accommodating adjustments to flood drivers such as climate and geomorphology, as well as population dynamics. The resulting predictions offer valuable insights into vulnerabilities across HMA watersheds, facilitating proactive flood management planning.
The novelty of our study lies in the efficiency and versatility of the proposed predictive model. Requiring only a small number of variables, our model accurately forecasts the socioeconomic impact of pluvial and fluvial flooding events. In densely populated, possibly ungauged regions with rapidly changing climates, such a model serves as a valuable decision-making tool for stakeholders. The efficacy of the framework, as demonstrated in Nepal, underscores its potential applicability across regions with similar climatic and morphological characteristics. Our goal is to provide a reasonable assessment of vulnerability through life years lost, rather than to definitively classify flood-prone areas by societal factors. Despite certain limitations, our findings offer valuable insights into regional flood risk and its key drivers.
With advancing technology, we can now predict the drivers of impending extreme events, enabling proactive measures to mitigate their impact. Stakeholders could leverage our model to forecast vulnerability to future flood events with precision, enhancing hazard assessment, decision-making, planning, and mitigation efforts.
The FGP products are available at the NASA National Snow and Ice Data Center (NSIDC) (https://doi.org/10.5067/WS83XMWHGEM9) (Sofia et al., 2024).
MK, GS, EN, and EA provided the overall conceptualization and methodology. MK carried out the formal analysis. MK and GS developed the flood geomorphic potential calculation and carried out its validation. EN was responsible for funding acquisition. WR collected and analyzed the datasets to calculate LYI from census data. BL and DJ developed the machine learning code. EA was in charge of conceptualization, writing (review and editing), and supervision. MK prepared the manuscript and worked on the preparation, creation, and presentation of the published work, with contributions from all co-authors.
Emmanouil Anagnostou declares that he holds stock in FloodInov LLC. Giulia Sofia holds financial interest in FloodInov LLC.
Publisher's note: Copernicus Publications remains neutral with regard to jurisdictional claims made in the text, published maps, institutional affiliations, or any other geographical representation in this paper. While Copernicus Publications makes every effort to include appropriate place names, the final responsibility lies with the authors.
This article is part of the special issue “Hydro-meteorological extremes and hazards: vulnerability, risk, impacts, and mitigation”. It is a result of the European Geosciences Union General Assembly 2022, Vienna, Austria, 23–27 May 2022.
This work was supported by the NASA High Mountain Asia program (grant no. 80NSSC20K1300).
This research has been supported by the National Aeronautics and Space Administration (grant no. 80NSSC20K1300).
This paper was edited by Elena Cristiano and reviewed by Jakob F. Steiner, Dongkyun Kim, and three anonymous referees.
Aksha, S. K., Juran, L., Resler, L. M., and Zhang, Y.: An Analysis of Social Vulnerability to Natural Hazards in Nepal Using a Modified Social Vulnerability Index, Int J. Disast. Risk Sc., 10, 103–116, https://doi.org/10.1007/s13753-018-0192-7, 2019.
Barlow, M., Wheeler, M., Lyon, B., and Cullen, H.: Modulation of daily precipitation over Southwest Asia by the Madden-Julian oscillation, Mon. Weather Rev., 133, 3579–3594, https://doi.org/10.1175/MWR3026.1, 2005.
Bentivoglio, R., Isufi, E., Jonkman, S. N., and Taormina, R.: Deep learning methods for flood mapping: a review of existing applications and future research directions, Hydrol. Earth Syst. Sci., 26, 4345–4378, https://doi.org/10.5194/hess-26-4345-2022, 2022.
Blench, T.: Mobile-bed fluviology: a regime theory treatment of rivers for engineers and hydrologists, University of Alberta Press, Edmonton, Ca., https://ualbertapress.ca/9781772121322/mobile-bed-fluviology/, 1969.
Bookhagen, B. and Burbank, D. W.: Toward a complete Himalayan hydrological budget: Spatiotemporal distribution of snowmelt and rainfall and their impact on river discharge, J. Geophys. Res.-Earth, 115, F03019, https://doi.org/10.1029/2009JF001426, 2010.
Borga, M., Gaume, E., Creutin, J. D., and Marchi, L.: Surveying flash floods: Gauging the ungauged extremes, Hydrol. Process., 22, 3883–3885, https://doi.org/10.1002/HYP.7111, 2008.
Brakenridge, G. R.: Global Active Archive of Large Flood Events, Dartmouth Flood Observatory, University of Colorado, USA, https://floodobservatory.colorado.edu/Archives/index.html, last access: 20 March 2023.
Byers, A. C., Shugar, D. H., Chand, M. B., Portocarrero, C., Shrestha, M., Rounce, D. R., and Watanabe, T.: Three Recent and Lesser-Known Glacier-Related Flood Mechanisms in High Mountain Environments, Mt. Res. Dev., 42, A12–A22, https://doi.org/10.1659/MRD-JOURNAL-D-21-00045.1, 2022.
Caloiero, T., Coscarelli, R., and Gaudio, R.: patial and temporal variability of daily precipitation concentration in the Sardinia region (Italy), Int. J. Climatol., 39, 5006–5021, https://doi.org/10.1002/JOC.6123, 2019.
Cavallo, E. A., & Noy, I.: The Economics of Natural Disasters: A Survey. https://doi.org/10.18235/0010924, 2011.
Chen, T. and Guestrin, C.: XGBoost: A Scalable Tree Boosting System, in: Proceedings of the ACM SIGKDD International Conference on Knowledge Discovery and Data Mining, San Francisco, California, USA, 13–17 August 2016, https://doi.org/10.1145/2939672.2939785, 785–794, 2016.
Chen, T., He, T., and Benesty, M.: XGBoost: eXtreme Gradient Boosting, R package version 0.71-2, https://cran.r-project.org/web/packages/xgboost/index.html, 1–4, 2018.
Cortesi, N., Gonzalez-Hidalgo, J. C., Brunetti, M., and Martin-Vide, J.: Daily precipitation concentration across Europe 1971–2010, Nat. Hazards Earth Syst. Sci., 12, 2799–2810, https://doi.org/10.5194/nhess-12-2799-2012, 2012.
Criss, R. E. and Shock, E. L.: Flood enhancement through flood control, Geology, 29, 875, https://doi.org/10.1130/0091-7613(2001)029<0875:FETFC>2.0.CO;2, 2001.
Delalay, M., Ziegler, A. D., Shrestha, M. S., Wasson, R. J., Sudmeier-Rieux, K., McAdoo, B. G., and Kochhar, I.: Towards improved flood disaster governance in Nepal: A case study in Sindhupalchok District, Int. J. Disast. Risk Re., 31, 354–366, https://doi.org/10.1016/j.ijdrr.2018.05.025, 2018.
Deroliya, P., Ghosh, M., Mohanty, M. P., Ghosh, S., Rao, K. H. V. D., and Karmakar, S.: A novel flood risk mapping approach with machine learning considering geomorphic and socio-economic vulnerability dimensions, Sci. Total Environ., 851, 158002, https://doi.org/10.1016/j.scitotenv.2022.158002, 2022.
Diehl, R. M., Gourevitch, J. D., Drago, S., and Wemple, B. C.: Improving flood hazard datasets using a low-complexity, probabilistic floodplain mapping approach, PLOS ONE, 16, e0248683, https://doi.org/10.1371/journal.pone.0248683, 2021.
Dingle, E. H., Creed, M. J., Sinclair, H. D., Gautam, D., Gourmelen, N., Borthwick, A. G. L., and Attal, M.: Dynamic flood topographies in the Terai region of Nepal, Earth Surf. Proc. Land., 45, 3092–3102, https://doi.org/10.1002/esp.4953, 2020.
Dollan, I. J., Maina, F. Z., Kumar, S. v., Nikolopoulos, E. I., and Maggioni, V.: An assessment of gridded precipitation products over High Mountain Asia, Journal of Hydrology: Regional Studies, 52, 101675, https://doi.org/10.1016/J.EJRH.2024.101675, 2024.
Du, M., Huang, S., Leng, G., Huang, Q., Guo, Y., and Jiang, J.: Multi-timescale-based precipitation concentration dynamics and their asymmetric impacts on dry and wet conditions in a changing environment, Atmos. Res., 291, 106821, https://doi.org/10.1016/J.ATMOSRES.2023.106821, 2023.
European Space Agency: Sinergise: Copernicus Global Digital Elevation Model, https://doi.org/10.5069/G9028PQB, last access: 20 March 2023.
Fischer, M., Brettin, J., Roessner, S., Walz, A., Fort, M., and Korup, O.: Rare flood scenarios for a rapidly growing high-mountain city: Pokhara, Nepal, Nat. Hazards Earth Syst. Sci., 22, 3105–3123, https://doi.org/10.5194/nhess-22-3105-2022, 2022.
Gridded Population of the World (GPW), v4 | SEDAC: https://www.earthdata.nasa.gov/data/projects/gpw, last access: 30 April 2024.
Haag, I., Jones, P. D., and Samimi, C.: Central Asia's Changing Climate: How Temperature and Precipitation Have Changed across Time, Space, and Altitude, Climate, 7, 123, https://doi.org/10.3390/CLI7100123, 2019.
Hamal, K., Sharma, S., Baniya, B., Khadka, N., and Zhou, X.: Inter-Annual Variability of Winter Precipitation Over Nepal Coupled With Ocean-Atmospheric Patterns During 1987–2015, Front. Earth Sci. (Lausanne), 8, 161, https://doi.org/10.3389/FEART.2020.00161, 2020.
Hawker, L., Rougier, J., Neal, J., Bates, P., Archer, L., and Yamazaki, D.: Implications of Simulating Global Digital Elevation Models for Flood Inundation Studies, Water Resour. Res., 54, 7910–7928, https://doi.org/10.1029/2018WR023279, 2018.
ICIMOD.: Glacial Lakes and Glacial Lake Outburst Floods in Nepal, International Centre for Integrated Mountain Development (ICIMOD), https://lib.icimod.org/records/2kqn5-yrm13 (last access: 22 September 2025), 2011.
International Federation of Red Cross and Red Crescent Societies (IFRC): China: Floods Information bulletin no. 1 GLIDE no., FL-2007-000077-CHN, https://reliefweb.int/report/china/china-floods-information-bulletin-n-1-7 (last access: 5 May 2025), 2010.
Janizadeh, S., Kim, D., Jun, C., Bateni, S. M., Pandey, M., and Mishra, V. N.: Impact of climate change on future flood susceptibility projections under shared socioeconomic pathway scenarios in South Asia using artificial intelligence algorithms, J. Environ. Manage., 366, 121764, https://doi.org/10.1016/J.JENVMAN.2024.121764, 2024.
Jongejan, R. B. and Maaskant, B.: Quantifying flood risks in the Netherlands, Risk Anal., 35, 252–264, https://doi.org/10.1111/risa.12285, 2015.
Kafle, K. R., Khanal, S. N., and Dahal, R. K.: Consequences of Koshi flood 2008 in terms of sedimentation characteristics and agricultural practices, Geoenvironmental Disasters, 4, 1–13, https://doi.org/10.1186/S40677-017-0069-X, 2017.
Kansakar, S. R., Hannah, D. M., Gerrard, J., and Rees, G.: Spatial pattern in the precipitation regime in Nepal, Int. J. Climatol., 24, 1645–1659, https://doi.org/10.1002/JOC.1098, 2004.
Karki, R., Talchabhadel, R., Aalto, J., and Baidya, S. K.: New climatic classification of Nepal, Theor. Appl. Climatol., 125, 799–808, https://doi.org/10.1007/S00704-015-1549-0, 2016.
Karki, R., ul Hasson, S., Schickhoff, U., Scholten, T., and Böhner, J.: Rising Precipitation Extremes across Nepal, Climate, 5, 4, https://doi.org/10.3390/CLI5010004, 2017.
Kayastha, R. B. and Kayastha, R.: Glacio-Hydrological Degree-Day Model (GDM) Useful for the Himalayan River Basins, Himalayan Weather and Climate and their Impact on the Environment, 379–398, https://doi.org/10.1007/978-3-030-29684-1_19, 2019.
Khanal, S., Tiwari, S., Lutz, A. F., Hurk, B. V. D., and Immerzeel, W. W.: Historical Climate Trends over High Mountain Asia Derived from ERA5 Reanalysis Data, J. Appl. Meteorol. Clim., 62, 263–288, https://doi.org/10.1175/JAMC-D-21-0045.1, 2023.
Khanam, M., Sofia, G., and Anagnostou, E. N.: To what extent do flood-inducing storm events change future flood hazards?, Hydrol. Earth Syst. Sci., 28, 3161–3190, https://doi.org/10.5194/hess-28-3161-2024, 2024.
Kiran, S., Yogacharya, and Gautam, D. K.: Floods in Nepal: Genesis, Magnitude, Frequencyand Consequences, in: Proc. of the International Conference on Hydrology and Climate Change in Mountainous Areas, Kathmandu, Nepal, https://doi.org/10.13140/RG.2.1.2376.8489, 2008.
Kirschbaum, D., Kapnick, S. B., Stanley, T., and Pascale, S.: Changes in Extreme Precipitation and Landslides Over High Mountain Asia, Geophys. Res. Lett., 47, e2019GL085347, https://doi.org/10.1029/2019GL085347, 2020.
Lane, S. N., Tayefi, V., Reid, S. C., Yu, D., and Hardy, R. J.: Interactions between sediment delivery, channel change, climate change and flood risk in a temperate upland environment, Earth Surf. Proc. Land., 32, 429–446, https://doi.org/10.1002/esp.1404, 2007.
Lindersson, S., Brandimarte, L., Mård, J., and Di Baldassarre, G.: Global riverine flood risk – how do hydrogeomorphic floodplain maps compare to flood hazard maps?, Nat. Hazards Earth Syst. Sci., 21, 2921–2948, https://doi.org/10.5194/nhess-21-2921-2021, 2021.
Maggioni, V. and Massari, C.: On the performance of satellite precipitation products in riverine flood modeling: A review, Journal of Hydrology, 558, 214–224, https://doi.org/10.1016/J.JHYDROL.2018.01.039, 2018.
Maina, F. Z., Kumar, S. v., Getirana, A., Forman, B., Zaitchik, B. F., Loomis, B., Maggioni, V., Xue, Y., McLarty, S., and Zhou, Y.: Development of a Multidecadal Land Reanalysis over High Mountain Asia, in: AMS, Denver, https://ams.confex.com/ams/103ANNUAL/meetingapp.cgi/Paper/415850 (last access: 22 september 2025), 2023.
Marston, R., Kleinman, J., and Miller, M.: Geomorphic and forest cover controls on monsoon flooding, central Nepal Himalaya, Mt. Res. Dev., 16, 257–264, https://doi.org/10.2307/3673948, 1996.
Martin-Vide, J.: Spatial distribution of a daily precipitation concentration index in peninsular Spain, Int. J. Climatol., 24, 959–971, https://doi.org/10.1002/JOC.1030, 2004.
World Health Organization: WHO methods and data sources for country-level causes of death 2000-2019, https://cdn.who.int/media/docs/default-source/gho-documents/global-health-estimates/ghe2019_cod_methods.pdf?sfvrsn=37bcfacc_5&ua=1, 2020.
Manfreda, S. and Samela, C.: A digital elevation model based method for a rapid estimation of flood inundation depth, J. Flood Risk Manag., 2, e12541., https://doi.org/10.1111/jfr3.12541, 2019.
Mazzoleni, M., Dottori, F., Cloke, H. L., and Di Baldassarre, G.: Deciphering human influence on annual maximum flood extent at the global level, Commun. Earth Environ., 3, 262, https://doi.org/10.1038/s43247-022-00598-0, 2022.
Meyer, V., Becker, N., Markantonis, V., Schwarze, R., van den Bergh, J. C. J. M., Bouwer, L. M., Bubeck, P., Ciavola, P., Genovese, E., Green, C., Hallegatte, S., Kreibich, H., Lequeux, Q., Logar, I., Papyrakis, E., Pfurtscheller, C., Poussin, J., Przyluski, V., Thieken, A. H., and Viavattene, C.: Review article: Assessing the costs of natural hazards – state of the art and knowledge gaps, Nat. Hazards Earth Syst. Sci., 13, 1351–1373, https://doi.org/10.5194/nhess-13-1351-2013, 2013.
Miles, E., McCarthy, M., Dehecq, A., Kneib, M., Fugger, S., and Pellicciotti, F.: Health and sustainability of glaciers in High Mountain Asia, Nat. Commun., 12, 1–10, https://doi.org/10.1038/s41467-021-23073-4, 2021.
Mohanty, M. P. and Simonovic, S. P.: A Comprehensive Approach for Floodplain Mapping through Identification of Hazard Using Publicly Available Data Sets over Canada, Water (Switzerland), 14, 2280, https://doi.org/10.3390/w14142280, 2022.
Monjo, R.: Measure of rainfall time structure using the dimensionless n-index, Clim. Res., 67, 71–86, https://doi.org/10.3354/cr01359, 2016.
Monjo, R. and Martin-Vide, J.: Daily precipitation concentration around the world according to several indices, Int. J. Climatol., 36, 3828–3838, https://doi.org/10.1002/JOC.4596, 2016.
Mosavi, A., Ozturk, P., and Chau, K. W.: Flood prediction using machine learning models: Literature review, 10, 1536, https://doi.org/10.3390/w10111536, 2018.
National Snow and Ice Data Center: High Mountain Asia 8-meter DEM Mosaics Derived from Optical Imagery, Version 1, National Snow and Ice Data Center, https://nsidc.org/data/hma_dem8m_mos/versions/1 (last access: 20 March 2023).
Nepal: Floods and Landslides Jul 1993 UN DHA Situation Reports 1–8, ReliefWeb, https://reliefweb.int/report/nepal/nepal- floods-and-landslides-jul-1993-un-dha-situation-reports-1-8 (last access: 6 February 2023), 2023a.
Nepal: Floods Situation Report No. 1, 26 July 1996, ReliefWeb, https://reliefweb.int/report/nepal/nepal-floods-situation -report-no-1-26-july-1996 (last access: 6 February 2023), 2023b.
Nepal: Appeal No. 01.55/2003 Annual Report, ReliefWeb, https://reliefweb.int/report/nepal/nepal-appeal-no-01552003- annual-report (last access: 6 February 2023), 2023c.
Nepal: Landslides and Floods – Aug 2014, ReliefWeb, https://reliefweb.int/disaster/ls-2014-000103-npl (last access: 6 February 2023), 2023d.
Neuhold, C., Stanzel, P., and Nachtnebel, H. P.: Incorporating river morphological changes to flood risk assessment: uncertainties, methodology and application, Nat. Hazards Earth Syst. Sci., 9, 789–799, https://doi.org/10.5194/nhess-9-789-2009, 2009.
Noy, I.: A New Non‐Monetary Global Measure of the Direct Impact of Natural Disasters, Prepared for the 2015 Global Assessment Report on Disaster Risk Reduction A Non-Monetary Global Measure Of the Direct Impact of Natural Disasters, Geneva, Switzerland: UNISDR, 2014.
Noy, I.: Comparing the direct human impact of natural disasters for two cases in 2011: The Christchurch earthquake and the Bangkok flood, Int. J. Disast. Risk Re., 13, 61–65, https://doi.org/10.1016/j.ijdrr.2015.03.009, 2015.
Noy, I.: A Global Comprehensive Measure of the Impact of Natural Hazards and Disasters, Glob. Policy, 7, 56–65, https://doi.org/10.1111/1758-5899.12272, 2016a.
Noy, I.: Natural disasters in the Pacific Island Countries: new measurements of impacts, Nat. Hazards, 84, 7–18, https://doi.org/10.1007/s11069-015-1957-6, 2016b.
Pangali Sharma, T. P., Zhang, J., Koju, U. A., Zhang, S., Bai, Y., and Suwal, M. K.: Review of flood disaster studies in Nepal: A remote sensing perspective, Int. J. Disast. Risk Re., 34, 18–27, https://doi.org/10.1016/j.ijdrr.2018.11.022, 2019.
Pervin, I. A., Rahman, S. M. M., Nepal, M., Haque, A. K. E., Karim, H., and Dhakal, G.: Adapting to urban flooding: A case of two cities in South Asia, Water Policy, 22, 162–188, https://doi.org/10.2166/wp.2019.174, 2020.
Piacentini, T., Carabella, C., Boccabella, F., Ferrante, S., Gregori, C., Mancinelli, V., Pacione, A., Pagliani, T., and Miccadei, E.: Geomorphology-Based analysis of flood critical areas in small hilly catchments for civil protection purposes and earlywarning systems: The case of the feltrino stream and the Lanciano Urban Area (Abruzzo, Central Italy), Water (Switzerland), 12, 2228, https://doi.org/10.3390/w12082228, 2020.
Pinter, N., Jemberie, A. A., Remo, J. W. F., Heine, R. A., and Ickes, B. S.: Flood trends and river engineering on the Mississippi River system, Geophys. Res. Lett., 35, 23404, https://doi.org/10.1029/2008GL035987, 2008.
Rentschler, J., Salhab, M., and Jafino, B. A.: Flood exposure and poverty in 188 countries, Nat. Commun., 13, 3527, https://doi.org/10.1038/s41467-022-30727-4, 2022.
Saki, S. A., Sofia, G., and Anagnostou, E. N.: Characterizing CONUS-wide spatio-temporal changes in daily precipitation, flow, and variability of extremes, J. Hydrol. (Amst), 626, 130336, https://doi.org/10.1016/J.JHYDROL.2023.130336, 2023.
Samela, C., Troy, T. J., and Manfreda, S.: Geomorphic classifiers for flood-prone areas delineation for data-scarce environments, Adv. Water Resour., 102, 13–28, https://doi.org/10.1016/j.advwatres.2017.01.007, 2017.
Sangüesa, C., Pizarro, R., Ibañez, A., Pino, J., Rivera, D., García-Chevesich, P., and Ingram, B.: Spatial and temporal analysis of rainfall concentration using the Gini Index and PCI, Water (Switzerland), 10, 112, https://doi.org/10.3390/w10020112, 2018.
Sanyal, J. and Lu, X. X.: Application of Remote Sensing in Flood Management with Special Reference to Monsoon Asia: A Review, Nat. Hazards, 33, 283–301, 2004.
Serrano-Notivoli, R., Martín-Vide, J., Saz, M. A., Longares, L. A., Beguería, S., Sarricolea, P., Meseguer-Ruiz, O., and de Luis, M.: Spatio-temporal variability of daily precipitation concentration in Spain based on a high-resolution gridded data set, Int. J. Climatol., 38, e518–e530, https://doi.org/10.1002/JOC.5387, 2018.
Shamsudduha, M. and Panda, D. K.: Spatio-temporal changes in terrestrial water storage in the Himalayan river basins and risks to water security in the region: A review, Int. J. Disast. Risk Re., 35, 101068, https://doi.org/10.1016/J.IJDRR.2019.101068, 2019.
Sharma, P. p. T., Zhang, J., Koju, A. U., Zhang, S., Bai, Y., and Suwal, K. M.: International Journal of Disaster Risk Reduction Review of fl ood disaster studies in Nepal: A remote sensing perspective Til Prasad Pangali Sharma, Int. J. Disast. Risk Re., 34, 18–27, 2019.
Shean, D.: High Mountain Asia 8-meter DEMs Derived from Cross-track Optical Imagery, HMA_DEM8m_CT, Version 1, Boulder, Colorado USA. NASA National Snow and Ice Data Center Distributed Active Archive Center [data set], https://doi.org/10.5067/0MCWJJH5ABYO, 2017.
Shrestha, A. B. and Aryal, R.: Climate change in Nepal and its impact on Himalayan glaciers, Reg. Environ. Change, 11, 65–77, https://doi.org/10.1007/s10113-010-0174-9, 2011.
Shrestha, A. B., Eriksson, M., Mool, P., Ghimire, P., Mishra, B., and Khanal, N. R.: Glacial lake outburst flood risk assessment of Sun Koshi basin, Nepal, Geomat. Nat. Haz. Risk, 1, 157–169, https://doi.org/10.1080/19475701003668968, 2010.
Simonovic, S. P., Karmakar, S., Cheng, Z., Kansal, M. L., and Singh, S.: Flood Management Issues in Hilly Regions of Uttarakhand (India) under Changing Climatic Conditions, Water, 14, 1879, https://doi.org/10.3390/W14121879, 2022.
Slater, L. J., Singer, M. B., and Kirchner, J. W.: Hydrologic versus geomorphic drivers of trends in flood hazard, Geophys. Res. Lett., 42, 370–376, https://doi.org/10.1002/2014GL062482, 2015.
Sofia, G.: Combining geomorphometry, feature extraction techniques and Earth-surface processes research: The way forward, Geomorphology, 355, 107055, https://doi.org/10.1016/j.geomorph.2020.107055, 2020.
Sofia, G. and Nikolopoulos, E. I.: Floods and rivers: a circular causality perspective, Sci. Rep.-UK, 10, 5175, https://doi.org/10.1038/s41598-020-61533-x, 2020.
Sofia, G., Tarolli, P., Cazorzi, F., and Dalla Fontana, G.: Downstream hydraulic geometry relationships: Gathering reference reach-scale width values from LiDAR, Geomorphology, 250, 236–248, https://doi.org/10.1016/j.geomorph.2015.09.002, 2015.
Sofia, G., Di Stefano, C., Ferro, V., and Tarolli, P.: Morphological Similarity of Channels: From Linear Erosional Features (Rill, Gully) to Alpine Rivers, Land. Degrad. Dev., 28, 1717–1728, https://doi.org/10.1002/ldr.2703, 2017.
Sofia, G., Ragazzi, F., Giandon, P., Dalla Fontana, G., and Tarolli, P.: On the linkage between runoff generation, land drainage, soil properties, and temporal patterns of precipitation in agricultural floodplains, Adv. Water Resour., 124, 120–138, https://doi.org/10.1016/j.advwatres.2018.12.003, 2019.
Sofia, G., Khanam, M., Nikolopoulos, E., and Anagnostou, E. N: High Mountain Asia 30m and 8m Flood Geomorphic Potential (HMA2_FGP, Version 1) [data set], Boulder, Colorado USA, NASA National Snow and Ice Data Center Distributed Active Archive Center, https://doi.org/10.5067/WS83XMWHGEM9, 2024.
Stover, S. C. and Montgomery, D. R.: Channel change and flooding, Skokomish River, Washington, J. Hydrol. (Amst), 243, 272–286, https://doi.org/10.1016/S0022-1694(00)00421-2, 2001.
Subba, S., Ma, Y., and Ma, W.: Spatial and Temporal Analysis of Precipitation Extremities of Eastern Nepal in the Last Two Decades (1997–2016), J. Geophys. Res.-Atmos., 124, 7523–7539, https://doi.org/10.1029/2019JD030639, 2019.
Talchabhadel, R., Karki, R., Thapa, B. R., Maharjan, M., and Parajuli, B.: Spatio-temporal variability of extreme precipitation in Nepal, Int. J. Climatol., 38, 4296–4313, https://doi.org/10.1002/JOC.5669, 2018.
Torti, J. M. I.: Floods in Southeast Asia: A health priority, J. Glob. Health, 2, 020304, https://doi.org/10.7189/jogh.02.020304, 2012.
Tuladhar, D., Dewan, A., Kuhn, M., and Corner, R. J.: Spatio-temporal rainfall variability in the Himalayan mountain catchment of the Bagmati River in Nepal., Theor. Appl. Climatol., 139, 599–615, https://doi.org/10.1007/S00704-019-02985-8, 2020.
Winiger, M., Gumpert, M., and Yamout, H.: Karakorum-Hindukush-western Himalaya: Assessing high-altitude water resources, Hydrol. Process., 19, 2329–2338, https://doi.org/10.1002/HYP.5887, 2005.
World Bank: Weather and Climate Services in Europe and Central Asia: A Regional Review, https://doi.org/10.1596/978-0-8213-7585-3, 2012.
Yang, C. R. and Tsai, C. T.: Development of a GIS-based flood information system for floodplain modeling and damage calculation, J. Am. Water Resour. As., 36, 567–577, https://doi.org/10.1111/j.1752-1688.2000.tb04287.x, 2000.
Zheng, G., Allen, S. K., Bao, A., Ballesteros-Cánovas, J. A., Huss, M., Zhang, G., Li, J., Yuan, Y., Jiang, L., Yu, T., Chen, W., and Stoffel, M.: Increasing risk of glacial lake outburst floods from future Third Pole deglaciation, Nat. Clim. Change, 11, 411–417, https://doi.org/10.1038/s41558-021-01028-3, 2021.
Zheng, X., Maidment, D. R., Tarboton, D. G., Liu, Y. Y., and Passalacqua, P.: GeoFlood: Large-Scale Flood Inundation Mapping Based on High-Resolution Terrain Analysis, Water Resour. Res., 54, 10013–10033, https://doi.org/10.1029/2018WR023457, 2018.