the Creative Commons Attribution 4.0 License.
the Creative Commons Attribution 4.0 License.
 | 02 Oct 2025
Modelling vegetation-induced wave attenuation: the impact of seagrass seasonal variability and biomechanical flexibility
Seimur Shirinov
Ivan Federico
Simone Bonamano
Salvatore Causio
Nicolás Biocca
Viviana Piermattei
Daniele Piazzolla
Jacopo Alessandri
Lorenzo Mentaschi
Giovanni Coppini
Marco Marcelli
Nadia Pinardi
This study investigates wave attenuation induced by the non-linear interactions between wave dynamics and marine vegetation, focusing on Posidonia oceanica meadows along the Civitavecchia coastal zone (north-eastern Tyrrhenian Sea, Italy). To overcome the limitations of conventional models, which often oversimplify canopy–wave dynamics and lack the integration with observational data, this research employs a digital twin approach that enhances model fidelity by coupling numerical simulations with long-term in situ measurements. We refine the seagrass parameterization in a spectral wave model by incorporating an enhanced representation into the bottom dissipation source term, explicitly accounting for the effects of plant flexibility, seasonal growth patterns, and phenotypic traits, all informed by site-specific observations. Application to the Civitavecchia site demonstrates that the seasonal variability of the meadows drives significant temporal fluctuations in wave damping capacity, with a monthly variation of up to 10 %. Spatial analysis revealed wave height reductions of 10 %–40 %, averaging 18 % across Sites of Community Importance and 24 % over rocky substrates colonized by seagrass. These results highlight the necessity of resolving seasonal cycles and the biomechanical flexibility of aquatic vegetation.
- Article
(10562 KB) - Full-text XML
- BibTeX
- EndNote


It is widely acknowledged that vegetation meadows help to mitigate wave activity. This phenomenon is observed across various marine habitats, including seagrass beds (Infantes et al., 2012; Paul et al., 2012; Sánchez-González et al., 2011), wetlands (Zhang et al., 2020), and seaweed communities (Dubi and Tørum, 1994; Løvås and Tørum, 2001). Wave–vegetation interactions result in the dissipation of wave energy through mechanical work on stems, determined by vegetation traits such as shoot density, canopy height, stiffness, and bending, as well as wave characteristics. The process known as wave damping, as described by Dalrymple et al. (1984), effectively reduces wave height. Consequently, the reduction in wave height leads to a localized drop in sea surface elevation in the lee of the vegetation patch, as demonstrated by Beudin et al. (2017). Additionally, the mean wavelength increases over the seagrass canopy due to the attenuation of shorter waves from the spectrum. This effect, combined with the reduction in wave height, leads to a decrease in wave steepness.
Numerous numerical studies have investigated wave attenuation by submerged coastal vegetation, with early models frequently simplifying flexible plants as rigid cylinders with varying drag coefficients. Mendez and Losada (2004) formulated an empirical model incorporating wave damping and breaking across vegetation fields of various depths. Suzuki and Dijkstra (2007) employed a volume of fluid (VOF) model to simulate wave attenuation over different beds and vegetation fields, underlining the necessity for further validation concerning the intricate interplay between storm waves and seagrass-induced wave attenuation. Recently, Pillai et al. (2022) evaluated the role of seagrass as a nature-based solution (NBS) by incorporating the wave damping sink term induced by vegetation into the wave action density spectrum equation within the WaveWatch III (WW3) wind wave model, following the approach of Beudin et al. (2017). This development was tested in a coastal region of the northern Adriatic Sea, where the study identified limitations associated with modelling seagrass as rigid stems, resulting in excessive wave damping. The authors hypothesized that accounting for plant flexibility would yield more realistic outcomes and a reduced damping capacity compared to rigid formulation. Similarly, Abdolali et al. (2022), through the implementation of the vegetation term in WW3, concluded that excluding the vegetation sink term in marsh environments leads to significant discrepancies between model outputs and observations. Jacob et al. (2023) reached analogous conclusions regarding the application of the SCHISM-WWM modelling framework in conjunction with a rigid vegetation module for the coastal waters of the German Wadden Sea. Luhar and Nepf (2016) sought to develop a physics-based model to predict wave decay in a submerged meadow, accounting for the adaptive responses of flexible plants to wave orbital excursion.
To investigate how flexibility can enhance model performance and, consequently, increase the model's ability to replicate the behaviour of seagrass meadows in wave attenuation, specific in situ measurements in submerged vegetation are essential. The lack of detailed observational data on vegetation characteristics, such as morphology and mechanical properties, poses a challenge (Luhar and Nepf, 2016). Instead, existing models often rely on generalized literature data, which may not fully capture the nuances of different plant species. Moreover, these models tend to overlook seasonal variations in vegetation properties, despite growing evidence of their importance in coastal processes (Jacob et al., 2023). So far, wave attenuation by seagrass canopies has been primarily measured during experiments in flumes using canopy mimics (Sánchez-González et al., 2011; Manca et al., 2012; Stratigaki et al., 2011; Lei and Nepf, 2019; Vettori et al., 2024). Limited field measurements have been conducted in meadows due to challenges in deploying and maintaining instruments and platforms in underwater environments that can withstand intense weather events (Fonseca and Cahalan, 1992; Bradley and Houser, 2009; Infantes et al., 2012). A recent study by Contti Neto et al. (2025), using extensive high-resolution flow measurements, concluded that accounting for flow-induced deflection of seagrass blades, which alters effective canopy height, significantly improves wave dissipation predictions.
In this study, we combine numerical simulations with observational data to emphasize the need for continuous monitoring and the effective integration of empirical measurements into numerical models. This holistic approach not only enhances the precision of the simulations but also represents a pivotal aspect of the coastal digital twin methodologies, necessitating interaction between real-world data and numerical models (Jeong and Lee, 2023). Ultimately, such synergy seeks to facilitate informed decision-making in dynamic marine environments, supporting the forecasts of environmental extremes to aid in risk assessment and management, while also advancing our understanding of the resilience of NBS systems.
The seagrass species considered in this work is Posidonia oceanica (P. oceanica), which stands out as the most common seagrass species in the Mediterranean Sea, typically found in shallow subtidal waters up to a depth of 50 m under clear conditions (Borum et al., 2004). Submerged plants increase bottom roughness, reducing near-bed velocities and altering sediment transport (Madsen et al., 2001), while also enhancing wave attenuation (Mendez and Losada, 2004). On a long timescale, the numerical simulations of waves over marine seagrasses have so far been conducted using vegetation parameters that remain constant in space and time (Pillai et al., 2022). Given that P. oceanica meadows along the coastal areas exhibit varying characteristics depending on the type of substrate they inhabit (e.g. rock, sand, and degraded matte), it is necessary to consider the spatial and temporal variability of vegetation parameters (shoot density and leaf length) to accurately estimate the wave damping effect. P. oceanica meadows grow on an inter-annual scale by branching rhizomes horizontally to colonize vacant substrates (when environmental conditions are favourable) and vertically to prevent siltation. On a seasonal (intra-annual) scale, above-ground biomass production occurs through leaf growth, reaching maximum length in summer and minimum length in winter. Over the years, many models of varying complexity have attempted to reproduce the growth of marine seagrasses by developing growth curves for leaves during different seasonal periods (Ott, 1980), utilizing the concept of architecture in terrestrial plants for rhizome branching (Molenaar et al., 2000), using temperature to stimulate only above-ground biomass growth (Zupo et al., 1997) or considering growth in other plant compartments (leaves, rhizomes, and epiphytes) by incorporating light and nutrient availability (Elkalay et al., 2003). In this context, the RENOVATE project (Marcelli et al., 2023) adopts an ecosystem-based approach to compensate for and mitigate anthropogenic impacts in the Sites of Community Importance (SCIs) near Civitavecchia port in the north-eastern Tyrrhenian Sea. Using a model-based approach, it focuses on restoring ecosystem services provided by marine benthic habitats, such as P. oceanica and coralligenous substrates, to enhance coastal resilience against extreme wave events. The lack of specific management plans for SCIs, such as eco-friendly buoys to prevent the anchoring of recreational boats on P. oceanica meadows, anti-trawling barriers to deter fishing boats from using nets within SCIs, and an early warning system for dredging and accidental hydrocarbon spills, renders P. oceanica vulnerable to various anthropogenic stressors present in the area. Urban and industrial discharges from aquaculture and power plants, the presence of an oil platform, trawling activities, and harbour activities connected to the Civitavecchia port have significantly impacted the health of the meadows.
This research employs a numerical modelling framework to quantify the effects of flexibility and seasonal dynamics of P. oceanica on wave attenuation, with the aim of enhancing the accuracy of coastal zone simulations. Through targeted data collection, we enrich our modelling framework with (i) a detailed characterization of the phenotypic traits based on the substrate types in which the seagrass thrives and (ii) the incorporation of seasonal variability in canopy height by estimating and imposing the annual growth and fall of P. oceanica leaves. We attempt to validate a numerical model's response using high-resolution local vegetation data, addressing the need to incorporate temporal variability in seagrass biomechanics. As shown by Vettori et al. (2021), seasonal changes and nutrient availability over the year influence blade size, rigidity, and buoyancy, affecting seagrass interactions with hydrodynamic forces. Integrating this information into a wave model could enhance the accuracy of simulations in wave-dominated environments, although such data are frequently limited or lacking.
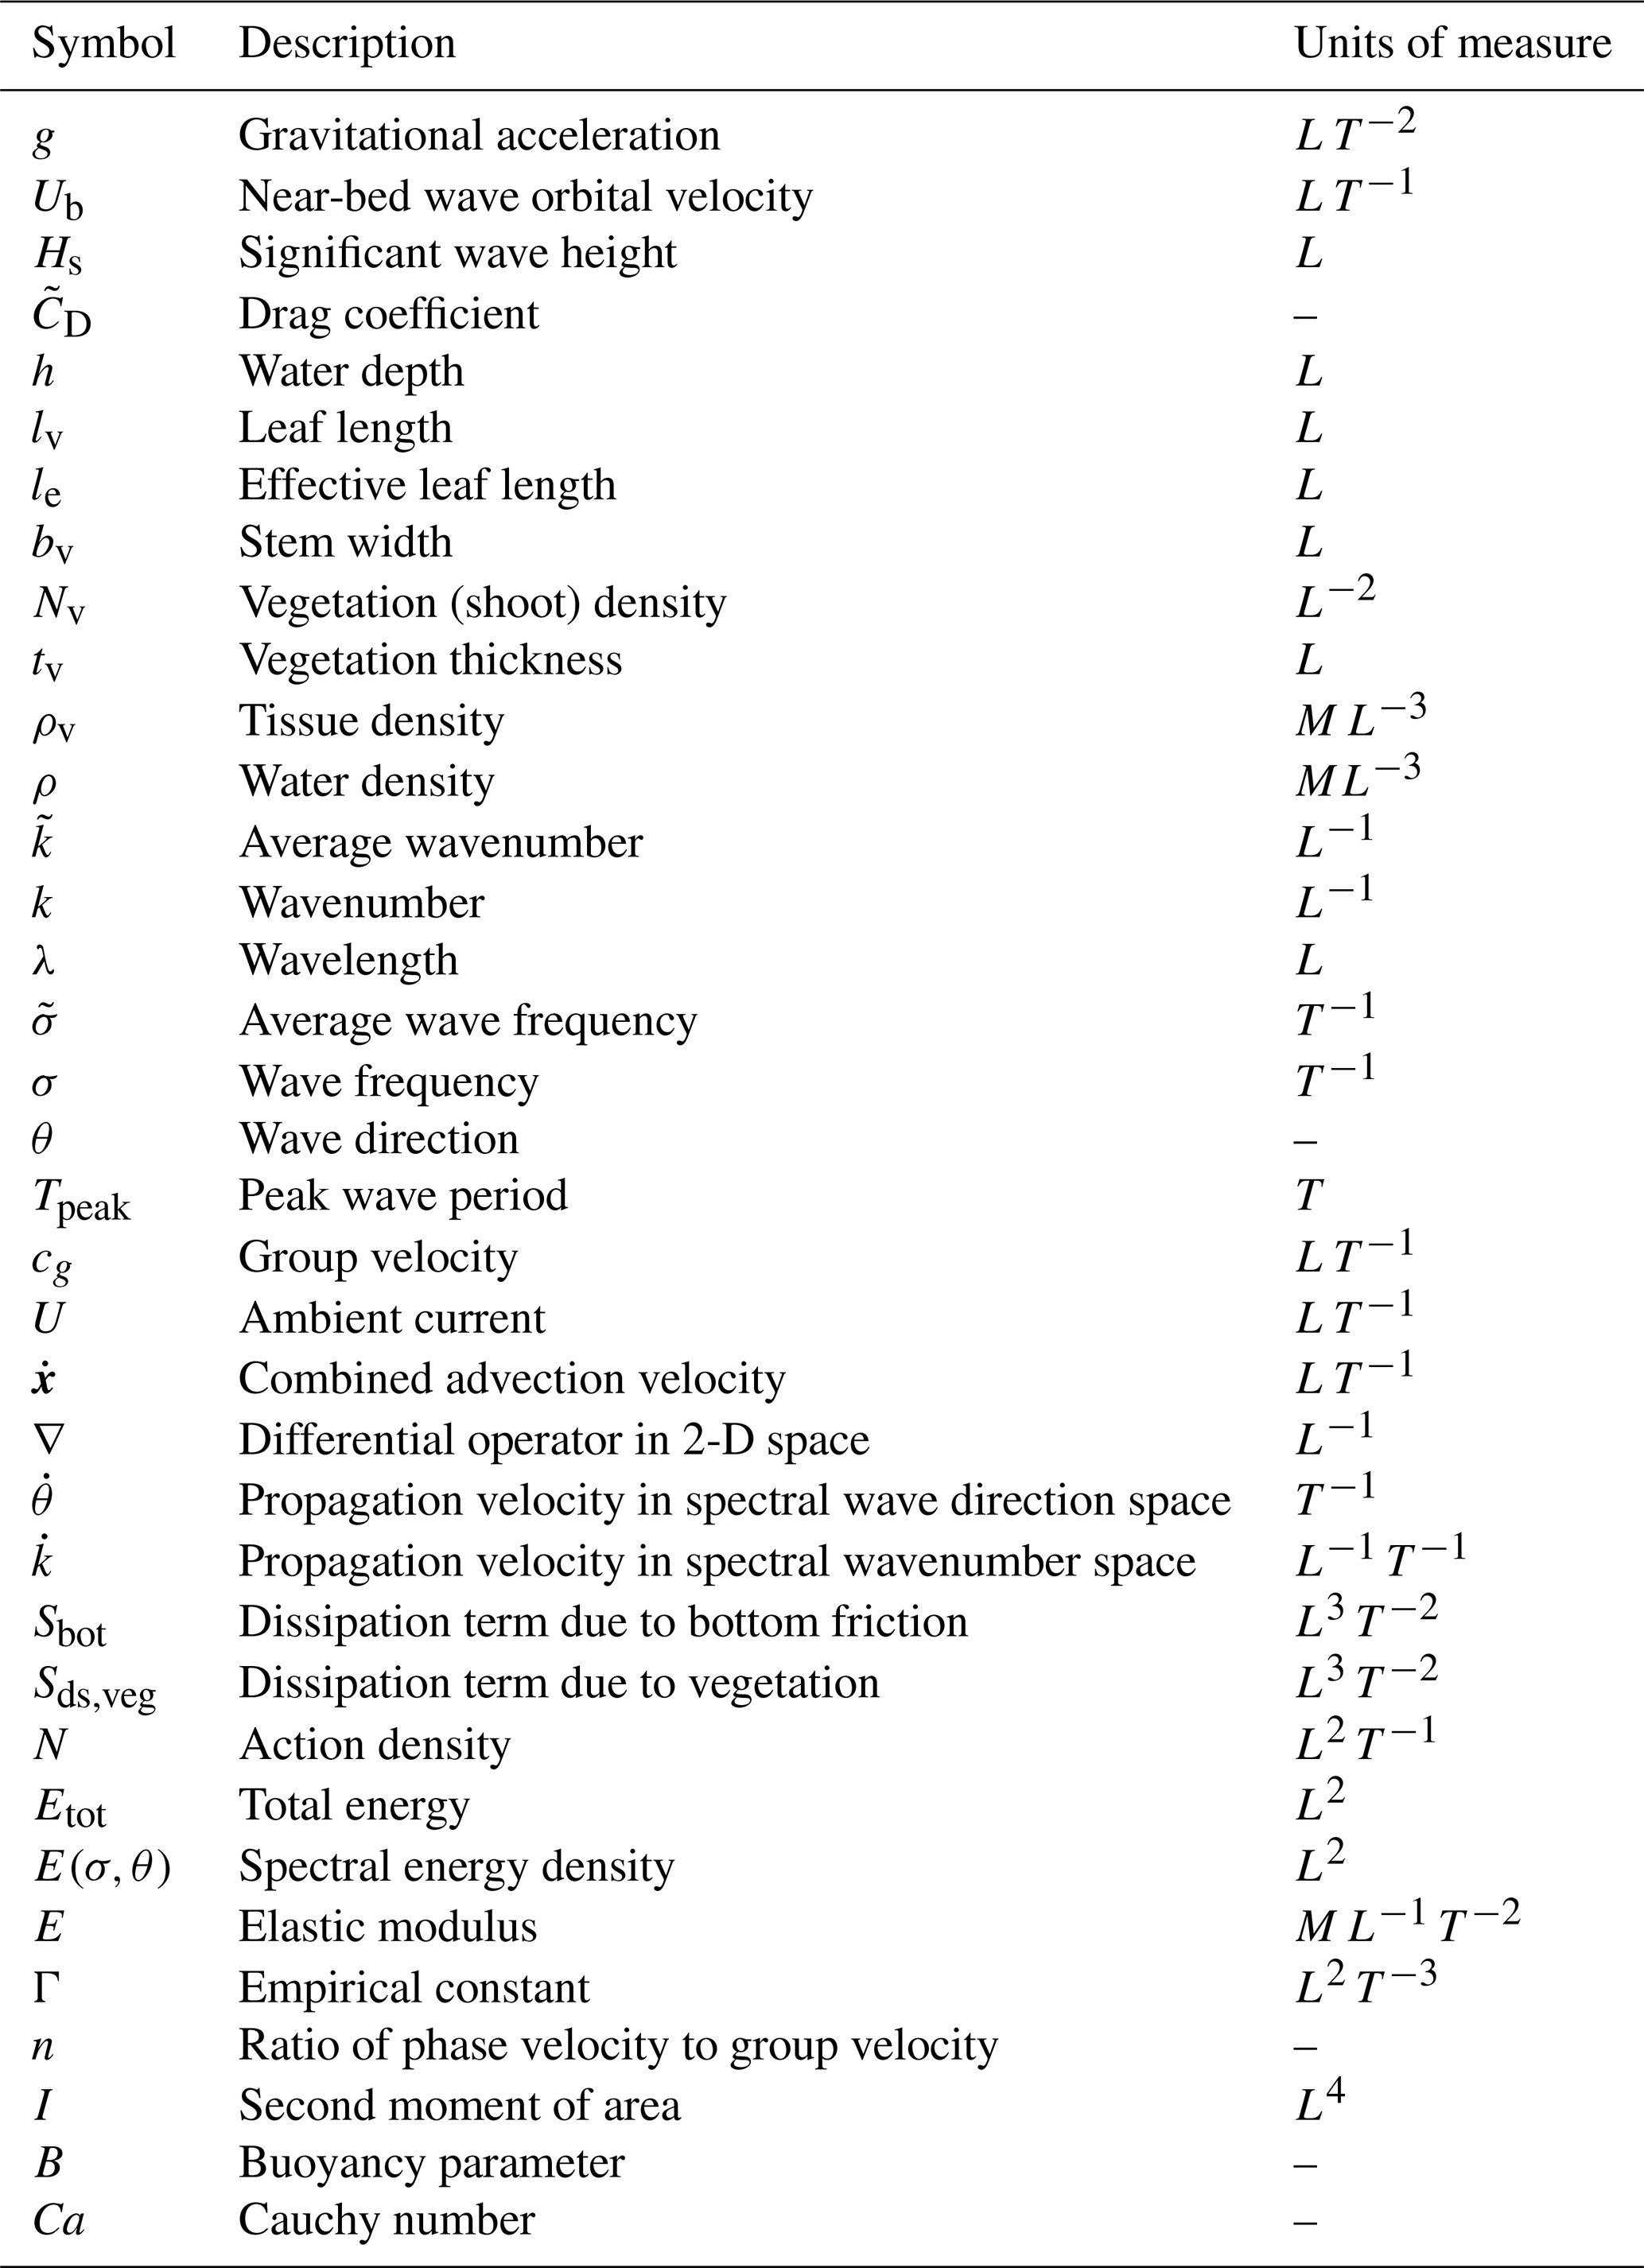
The remainder of this paper is structured as follows. Section 2 outlines the modelling framework and its implementation, followed by the model validation using a case study from Cala Millor. The symbols and their corresponding units of measurement used in this study are provided in Table 1. Section 3 presents a case study in the Civitavecchia coastal strip, where advancements in modelling plant flexibility and seasonal effects are tested throughout the seasonal cycle using a high-resolution domain of up to 20 m over the vegetated canopies. The main results of these advancements are then presented in Sect. 4, including the wave model performance analysis using wave buoy data and the investigation of wave attenuation induced by seagrass meadows over the SCIs. The overall discussion (Sect. 5) and conclusions (Sect. 6) are then reported in the final sections of the paper. Further possible improvements and limitations of the model are also discussed.
The core model utilized in this study is WaveWatch III (WW3) (WW3DG, 2019), a wind wave model that solves the action density balance equation for the direction and wave number spectrum (Eq. 1).
The wave action is a function of the energy spectrum and intrinsic frequency σ. x is a two-dimensional space, either in Cartesian or spherical coordinates, over which the wave action is advected at group velocity relative to the mean current , with the rate of change in spectral space and .
WW3 has been used worldwide from global (Sharmar et al., 2021; Mentaschi et al., 2020) to regional (Causio et al., 2021, 2024) and coastal applications in both standalone, as in the present work, and coupled modes (Clementi et al., 2017; Causio et al., 2025). The modified version of WW3 implemented by Pillai et al. (2022), who incorporated the dissipation source term due to rigid vegetation, served as the foundation for the further advancements in this work. To better model the intricate dynamics of the coastal region at finer resolutions and complex geometry, an unstructured grid configuration was employed.
The vegetation term is incorporated into the model by augmenting the bottom dissipation source term Sbot, given by a simple empirical linear JONSWAP parametrization (Hasselmann et al., 1973), as defined in Eq. (2).
The simplest approach to account for the vegetation wave damping effect in a wave model is the equation proposed by Dalrymple et al. (1984) and Mendez and Losada (2004) and adapted in a spectral form by Suzuki et al. (2012) (Eq. 3).
This formulation models vegetation as rigid leaves and has been utilized in a number of studies (Gupta et al., 2020; Pillai et al., 2022, Abdolali et al., 2022; Jacob et al., 2023). Several alternative formulations have been proposed to address the overestimation of wave damping, some of which incorporate the Reynolds number or Keulegan–Carpenter number, as recently described by Abdolali et al. (2022), while others are based on plant bending. Our study adopts the latter, specifically by implementing the formulation proposed by Luhar and Nepf (2011) (Eq. 4) and further refined by Luhar and Nepf (2016) and Lei and Nepf (2019), in which the effective leaf length le scales with the blade length to the wave excursion (Aw) ratio, L (Eqs. 5 6). In this approach, the effect of blade flexibility is incorporated into the source term computation by replacing the actual leaf length lv with le. While the original formulation was developed for unidirectional flow conditions, we formulate the Cauchy number Ca as a function of the wave bottom orbital velocity Ub to account for the wave-induced oscillatory flows. These modifications were proposed by Luhar and Nepf (2016) using the oscillatory velocity scale as a function of the wave orbital excursion, later adopted by Beth Schaefer and Nepf (2022) and Vettori et al. (2024).
where , , , .
2.1 Model validation
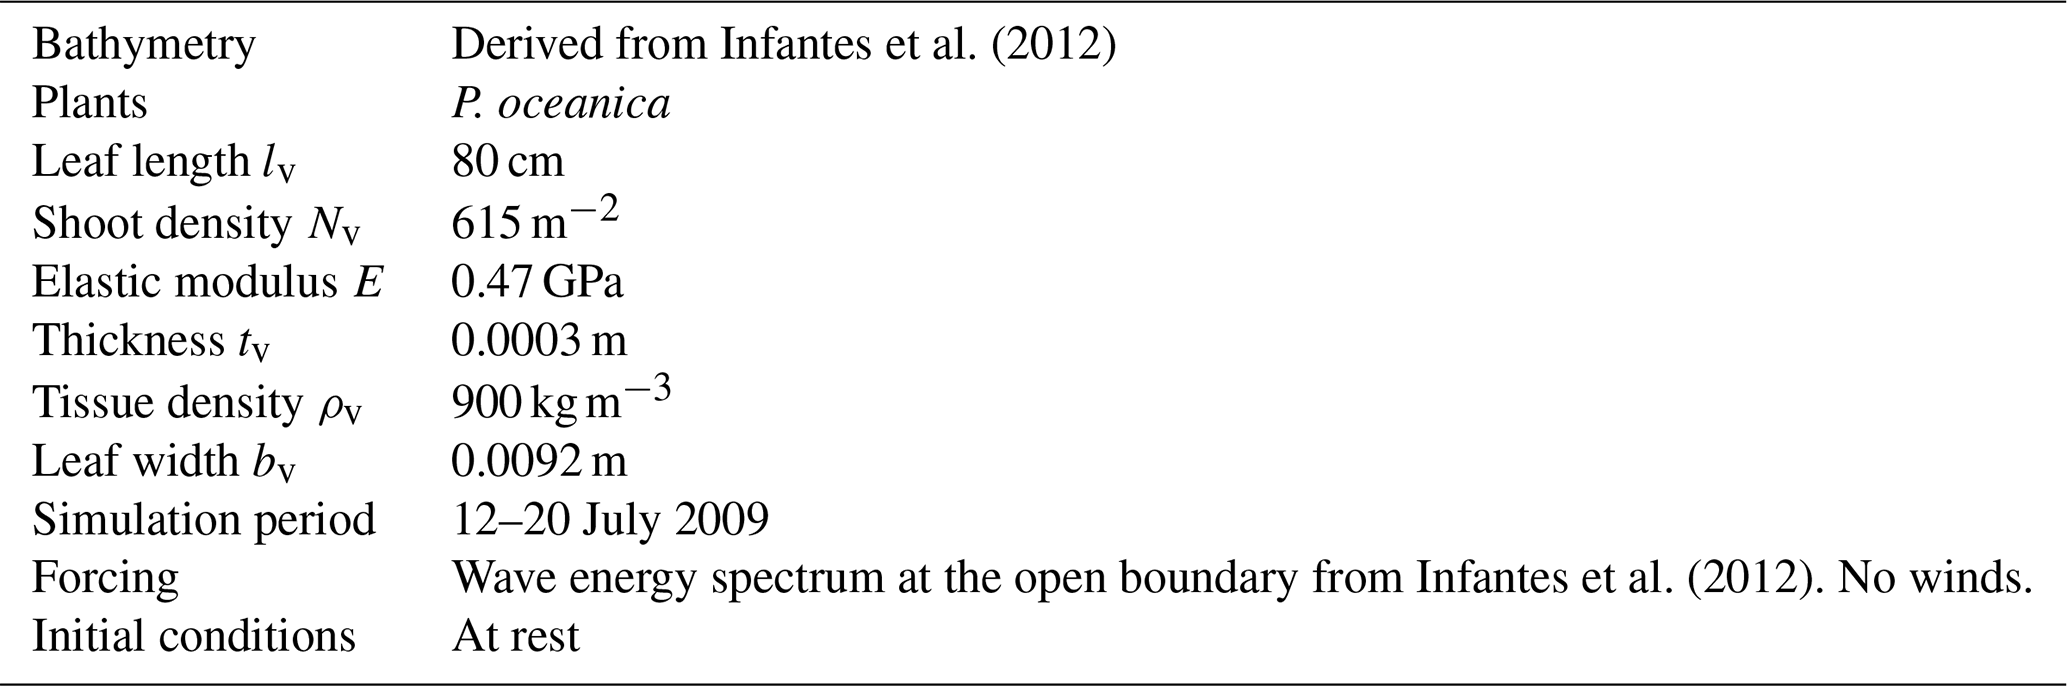
To validate the bottom vegetation effects described in Eq. (3), we developed a model validation case based on the study by Infantes et al. (2012). This study represents a crucial benchmark as it involved a measurement campaign of wave heights over P. oceanica meadows in the Balearic Islands. Additionally, the authors provided fundamental data on beach depth profiles, P. oceanica parameters (i.e. shoot density, leaf length, meadow extensions), and wave height attenuation along a transect. Our validation methodology aimed to replicate the conditions described in Infantes et al. (2012) in our numerical model implementation. The numerical setup is summarized in Table 2.
Infantes et al. (2012)Infantes et al. (2012)Table 2Numerical model parameters used for the Infantes et al. (2012) case study.
The domain of Cala Millor (Fig. 1) was reconstructed using an unstructured mesh with a horizontal resolution of approximately 20 m, extending 1.2 km radially from the shore and 0.7 km along the coastline. The extent and coverage of the vegetation meadows were chosen to reflect the real domain investigated in Infantes et al. (2012), preserving the locations of the moorings, distances from the coast, and distances between moorings. The depth profile and simulation time window were derived from the original work. To minimize uncertainty from external forcing and to investigate vegetation-induced wave dissipation more accurately, we excluded wind forcing from the simulation. Only the measured wave height time series at the offshore mooring location was imposed at the open lateral boundary (indicated in red in Fig. 1) of the domain. This boundary forcing represented the only input for our validation case study. The wave direction was assumed to be perpendicular to the coastline.
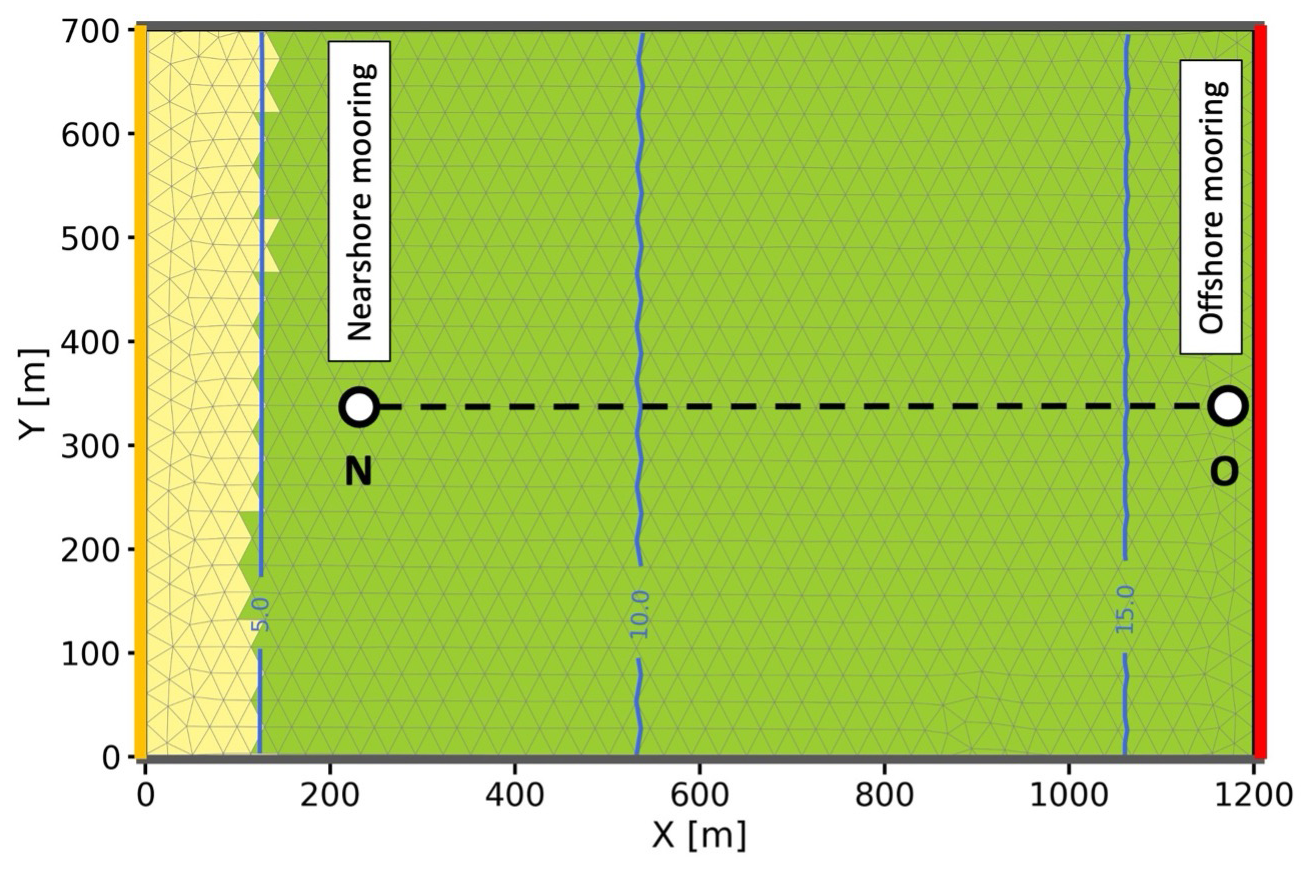
Figure 1The Cala Millor case study domain and bathymetry, customized from Infantes et al. (2012) with the location of mooring data. O denotes offshore moorings, while N denotes nearshore moorings. Green mesh elements indicate elements with vegetation, while yellow elements do not include vegetation at the bottom. The dashed line represents the transect N–O analysed later.
We conducted three numerical experiments with the following configurations: (i) no vegetation (no_veg), using the default code of WW3; (ii) rigid vegetation (veg_rigid), including the implementation used in Pillai et al. (2022); and (iii) flexible vegetation (veg_flex), including the formulation proposed in this study. The assessment of wave attenuation was carried out by comparing the simulation results with wave measurements taken by Infantes et al. (2012) at a nearshore buoy after the waves travelled approximately 1 km over the vegetation.
Figure 2 presents the results of the test case validation for the period investigated by Infantes et al. (2012). According to the observations, the reduction in significant wave height Hs (SWH), considering the combined effects of vegetation and depth-induced damping, is approximately 50 %–60 % over a distance of ∼1 km.
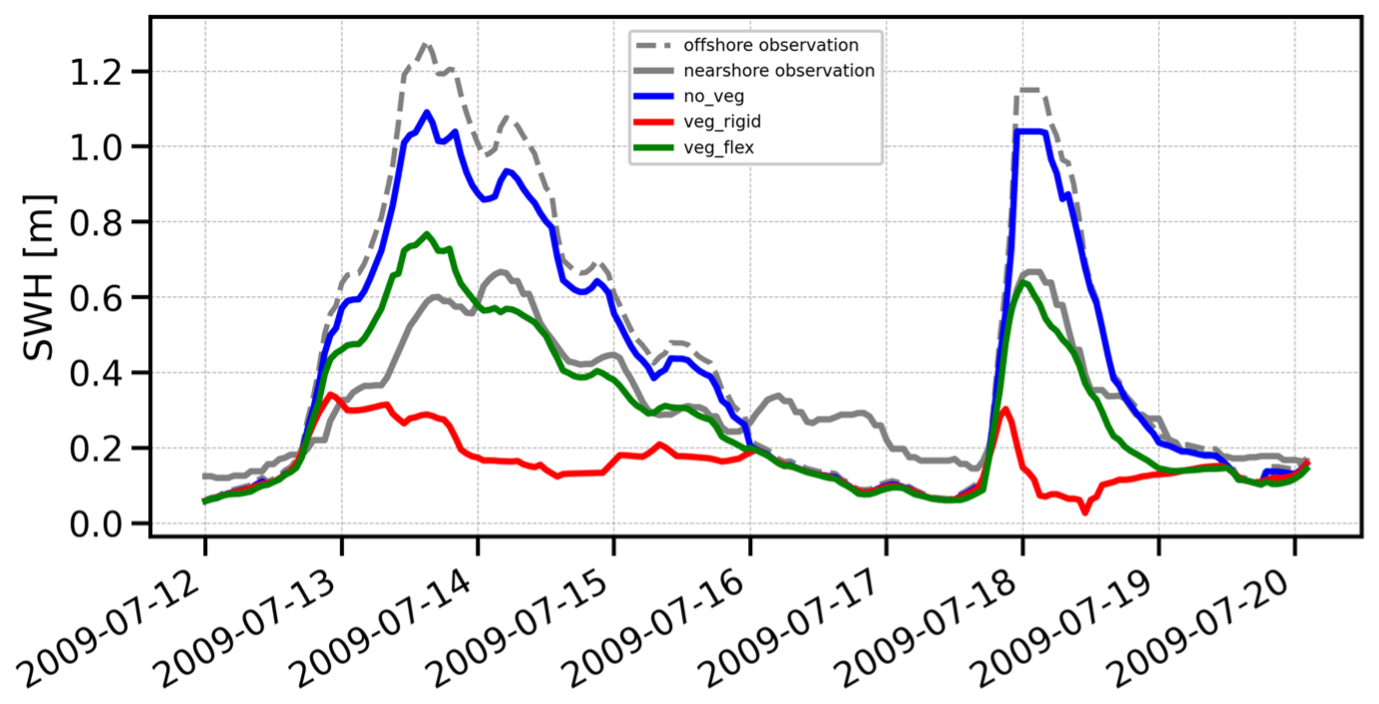
Figure 2Significant wave height (SWH) time series comparison for no_veg (no vegetation), veg_rigid (rigid vegetation), and veg_flex (flexible vegetation) experiments against nearshore and offshore moorings in Fig. 1.
The three coloured lines represent our numerical experiments. As expected, the no_veg experiment (blue line) closely mirrors the offshore wave height, as it only accounts for depth-induced dissipation. This low dissipation from offshore to nearshore can be approximately quantified as 10 %–20 % under the simulation conditions. In contrast, the veg_rigid experiment (red line) demonstrated the most significant wave damping, showing minimal variability in wave height throughout the simulation period. It exhibited a substantial wave reduction of ∼80 %, with a computed bias of −0.18 m and an RMSE of 0.178 m. The veg_flex experiment (green line) achieved the highest accuracy, with a dissipation of ∼40 %–50 %, closely matching the observations and aligning well with the data, yielding a bias of −0.04 m and an RMSE of 0.126 m.
Figure 3 presents a map (a) and transect profile (b) of SWH, illustrating wave attenuation during the peak event on 17 July at 23:00 CET. The offshore observation recorded a wave of 1.2 m, which decreased to 0.65 m at the nearshore station, indicating 50 % wave dissipation due to the presence of vegetation and shoaling. This pattern is also captured by the veg_flex simulation. The investigation suggests that the attenuation effect is amplified with increased wave height, consistent with Eqs. (3) and (4).
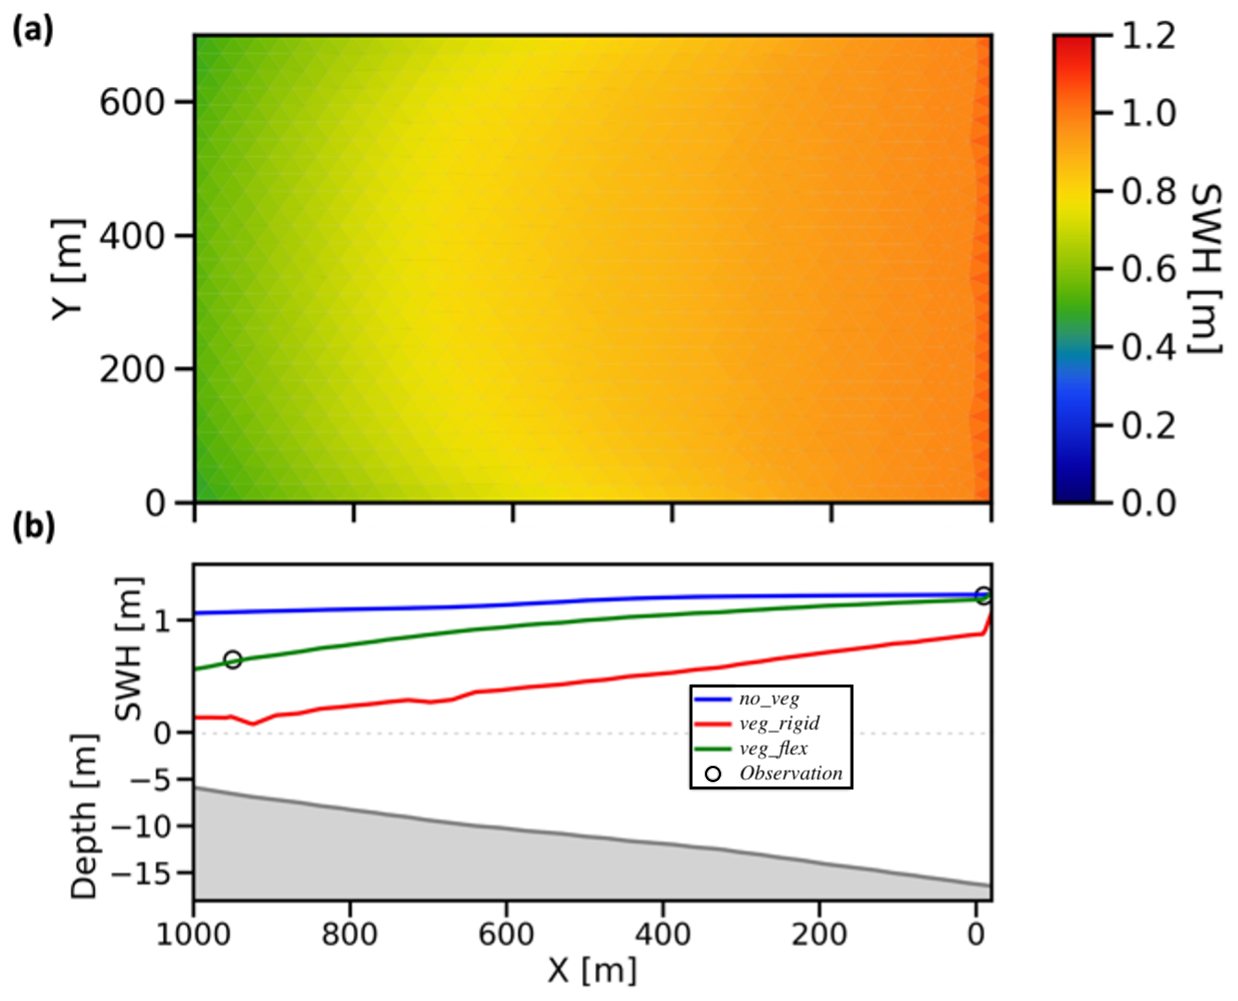
Figure 3(a) Map of SWH for veg_flex configuration and (b) SWH profiles for the three configurations (no_veg, veg_rigid, and veg_flex) along the transect N–O (as indicated in Fig. 1) at the event peak on 17 July 2009 at 23:00 CET.
It is noteworthy that the SWH slopes in the N–O transect of Fig. 3b exhibits varying degrees of reduction in the different cases. The no_veg simulation showed an almost SWH linear decrease with a very low slope, leading to a significant overestimation of SWH. The rigid vegetation simulation (veg_rigid) curve shows a linear and rapid drop in SWH as the wave propagates from the boundary over the seagrass meadows. In contrast, the veg_flex implementation displays non-linearity as waves approach the shore, attributed to the variation in effective vegetation length in response to different wave energies. All these considerations converge in determining a greater difference between no_veg and veg_flex simulations as the SWH increases.
Given the high accuracy demonstrated by the flexible vegetation simulation setup, this model structure is further used in the coastal area of Civitavecchia along the Latium coast of the Tyrrhenian Sea.
To assess the impact of P. oceanica meadows on wave attenuation throughout the seasonal cycle, the model was implemented in the coastal area of the north-eastern Tyrrhenian Sea, Italy, extending from Tarquinia in the north to Santa Severa in the south, with Civitavecchia in the central zone of the domain (Fig. 4).
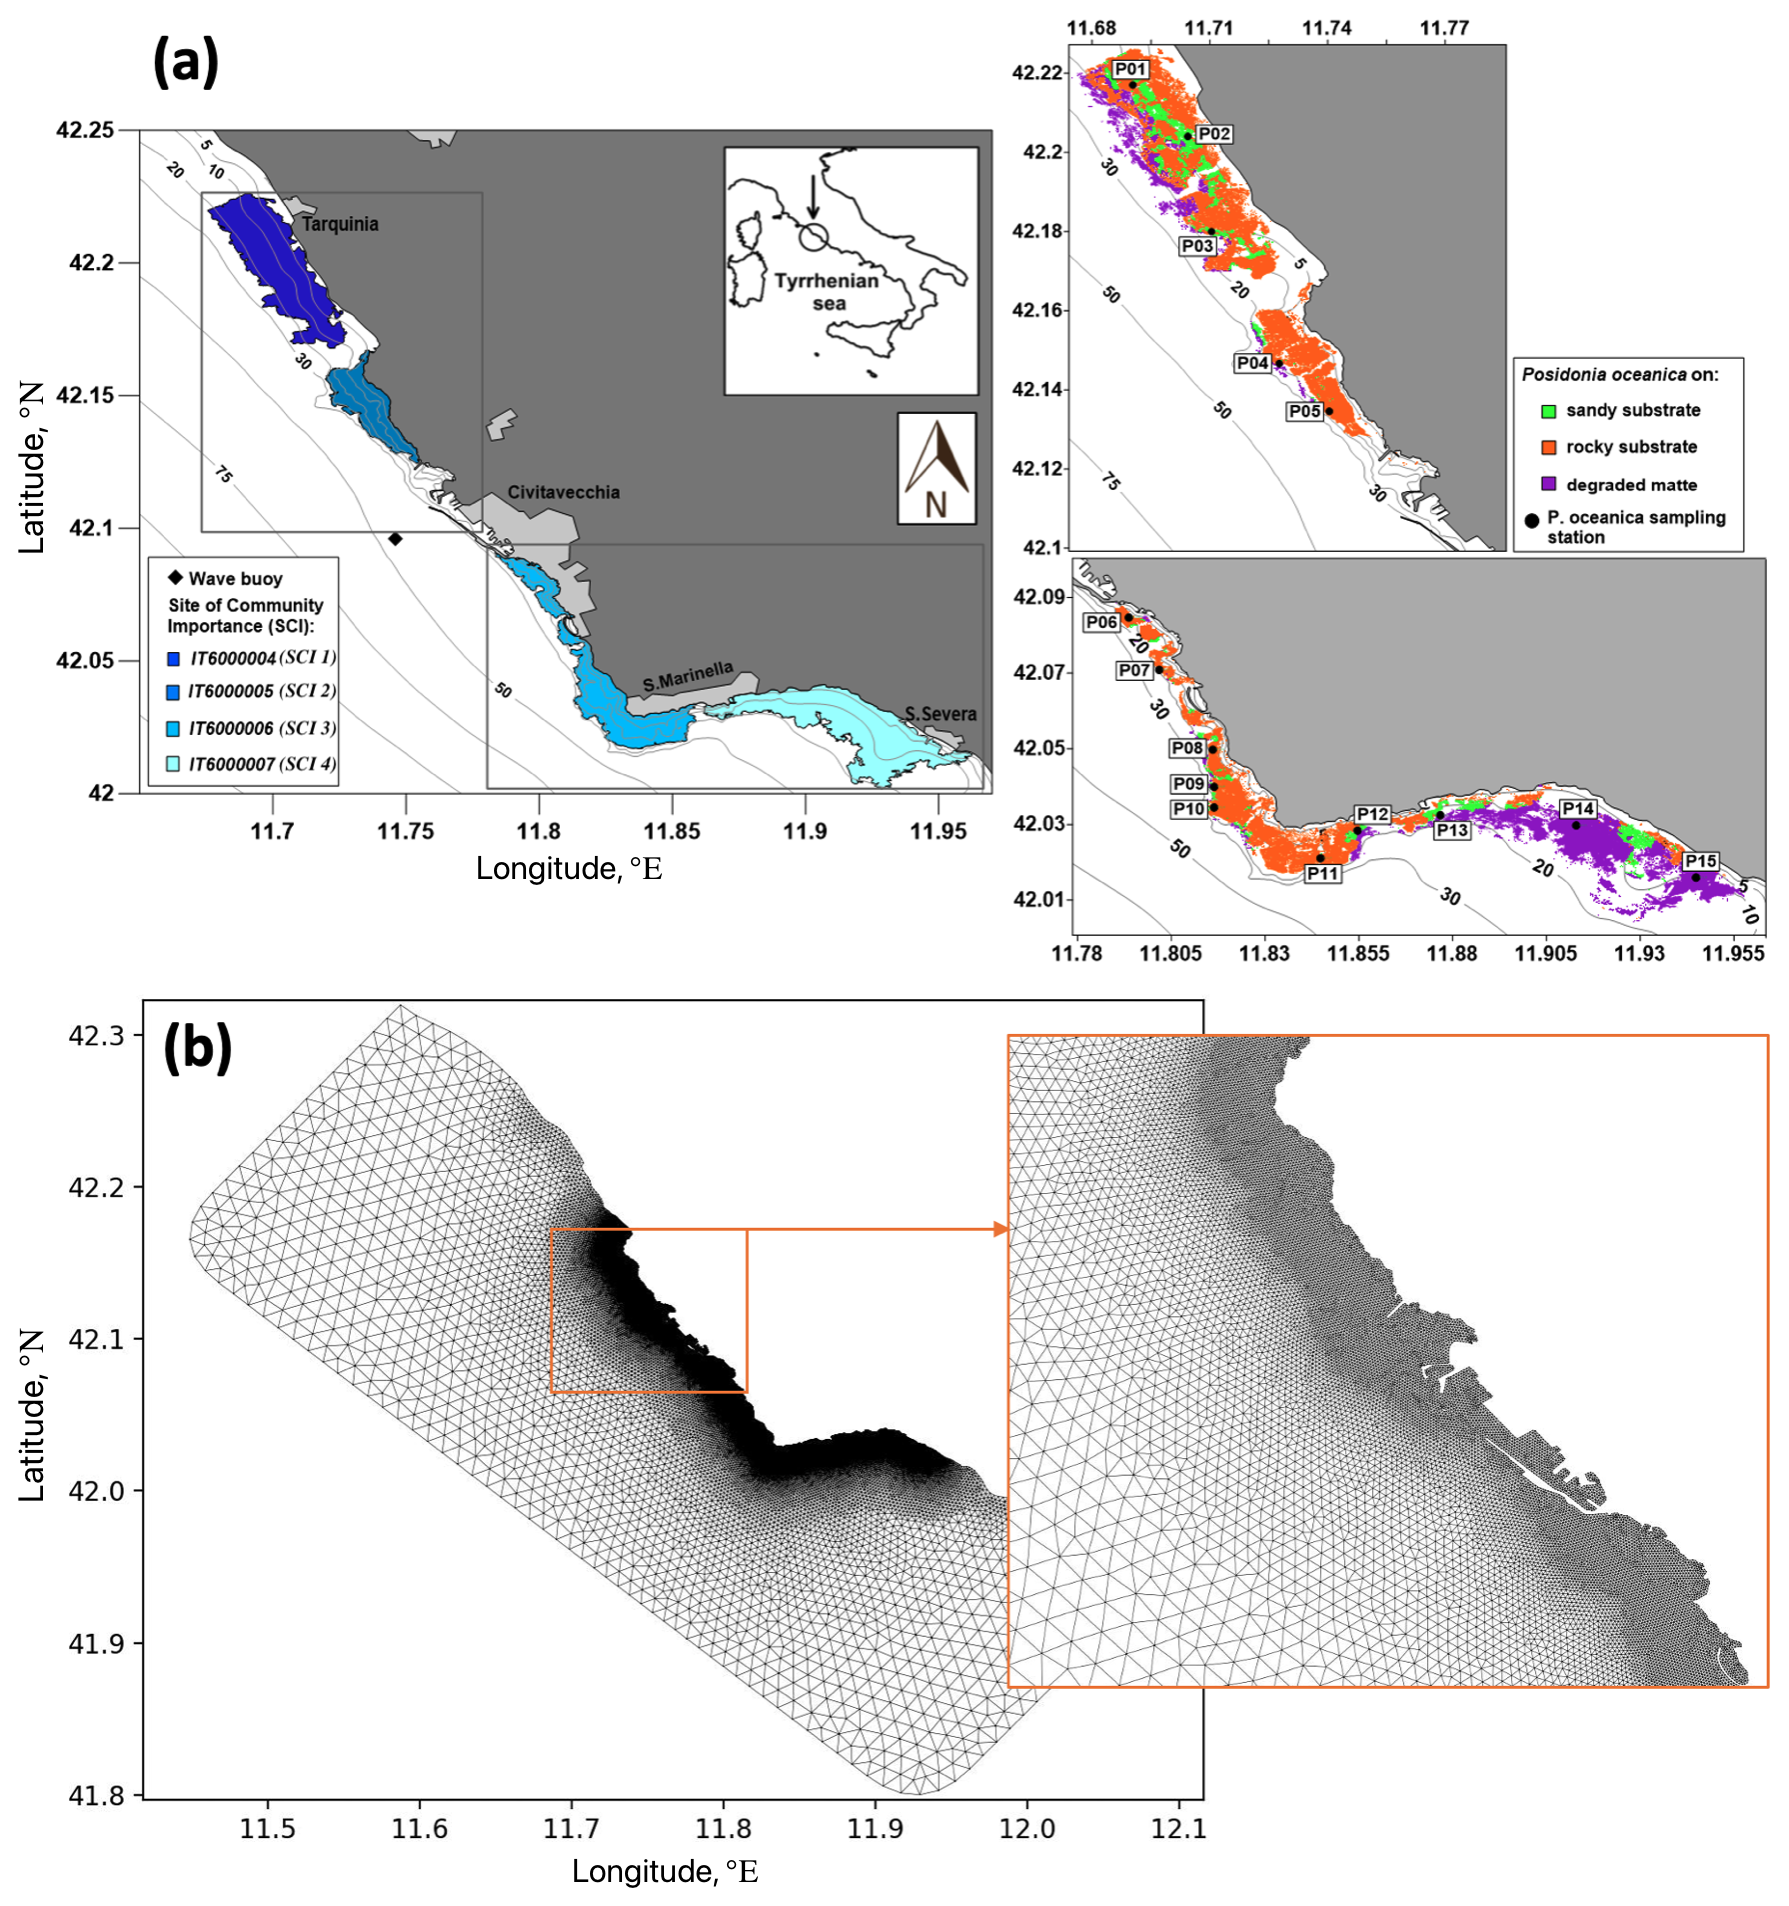
Figure 4(a) Map of the area of Civitavecchia with bathymetry; Sites of Community Importance (SCIs); observations used in the study; and distribution of P. oceanica over the different substrate types (P. oceanica on rock, P. oceanica on sand and matte, and degraded matte with P. oceanica). (b) Mesh of the computational domain with enlarged views in the vicinity of the Civitavecchia harbour.
The study area contains four SCIs established by the European Union's Habitat Directive (92/43/CEE) under Annex 1. Moving from north to south, the SCI 6000004 (“Seabeds between Marina di Tarquinia and Punta delle Quaglie”), SCI 6000005 (“Seabeds between Punta S. Agostino and Punta Mattonara”), SCI 6000006 (“Seabeds between Punta del Pecoraro and Capo Linaro”), and SCI 6000007 (“Seabeds off Santa Marinella”) are present, hereinafter referenced as SCI 1, SCI 2, SCI 3, and SCI 4, respectively (Fig. 4a).
In this area, the P. oceanica meadows exhibit a discontinuous distribution and high variability in structural and functional descriptors (Fig. 4a), reflecting the heterogeneity of the local environments and the presence of various socio-economic activities (Gnisci et al., 2020; Bonamano et al., 2021). The upper depth limit of P. oceanica meadows was determined using high-resolution remote sensing imagery (Borfecchia et al., 2019), while in the shallower depths acoustic surveys (Ardizzone et al., 2018) have been used. P. oceanica occurs at depths ranging from 0.5 to 25 m and is situated on rocky substrates (depicted by the red area in Fig. 4a on the right), degraded matte (indicating sediment-rich areas with reduced plant cover and dead matte with isolated patches of P. oceanica) (the violet area in Fig. 4a on the right), and sandy bottoms (the green area in Fig. 4a on the right). These meadows exhibit high fragmentation and display significant variability in coverage, ranging from 6 % to 98 %, with a coefficient of variation of 72.4 % (Gnisci et al., 2020). Moreover, the density is influenced by the meadows' architecture, with an average of 141.7±62.9 shoots m−2 (Bonamano et al., 2015; Gnisci et al., 2020).
3.1 Model setup
Spanning approximately 90 km along the north-eastern Tyrrhenian Sea coast, the model domain (Fig. 4b) is centred around the port of Civitavecchia. Coastline reconstruction involved integrating data from recent high-resolution satellite images with the OpenStreetMap dataset (Haklay and Weber, 2008). Advanced customized meshing tools were employed to achieve a high grid resolution of around 20 m near the shore and a coarser resolution of approximately 2 km offshore. GMSH (Geuzaine and Remacle, 2009) was utilized for mesh generation, while BLENDER (Blender Community, 1994) facilitated optimization and quality checks of the triangles (Bonamano et al., 2024). The meshing algorithm, based on a frontal Delaunay approach (Remacle et al., 2013), defines the nominal grid size as the maximum edge length of the triangles.
Bathymetric data were obtained from the EMODNET product (EMODnet Bathymetry Consortium, 2016) at a resolution of (approximately 230 m×230 m) for the open sea. These data were augmented with high-resolution multi-beam data collected in specific coastal areas, including near the harbour area and within the SCIs, provided by the Autorità di Sistema Portuale del Mar Tirreno Centro Settentrionale. At the open lateral boundaries, the domain is forced with the downscaled Copernicus regional model (Korres et al., 2023) mean wave parameters (Hs, θ, Tpeak) of 1 h frequency for the period of simulation of 1 year (1 October 2016–30 September 2017). ECMWF operational analyses (Owens and Hewson, 2018) were used for wind data at 6 h frequency. The specific parametrizations for the WW3 model setup are summarized in Appendix A.
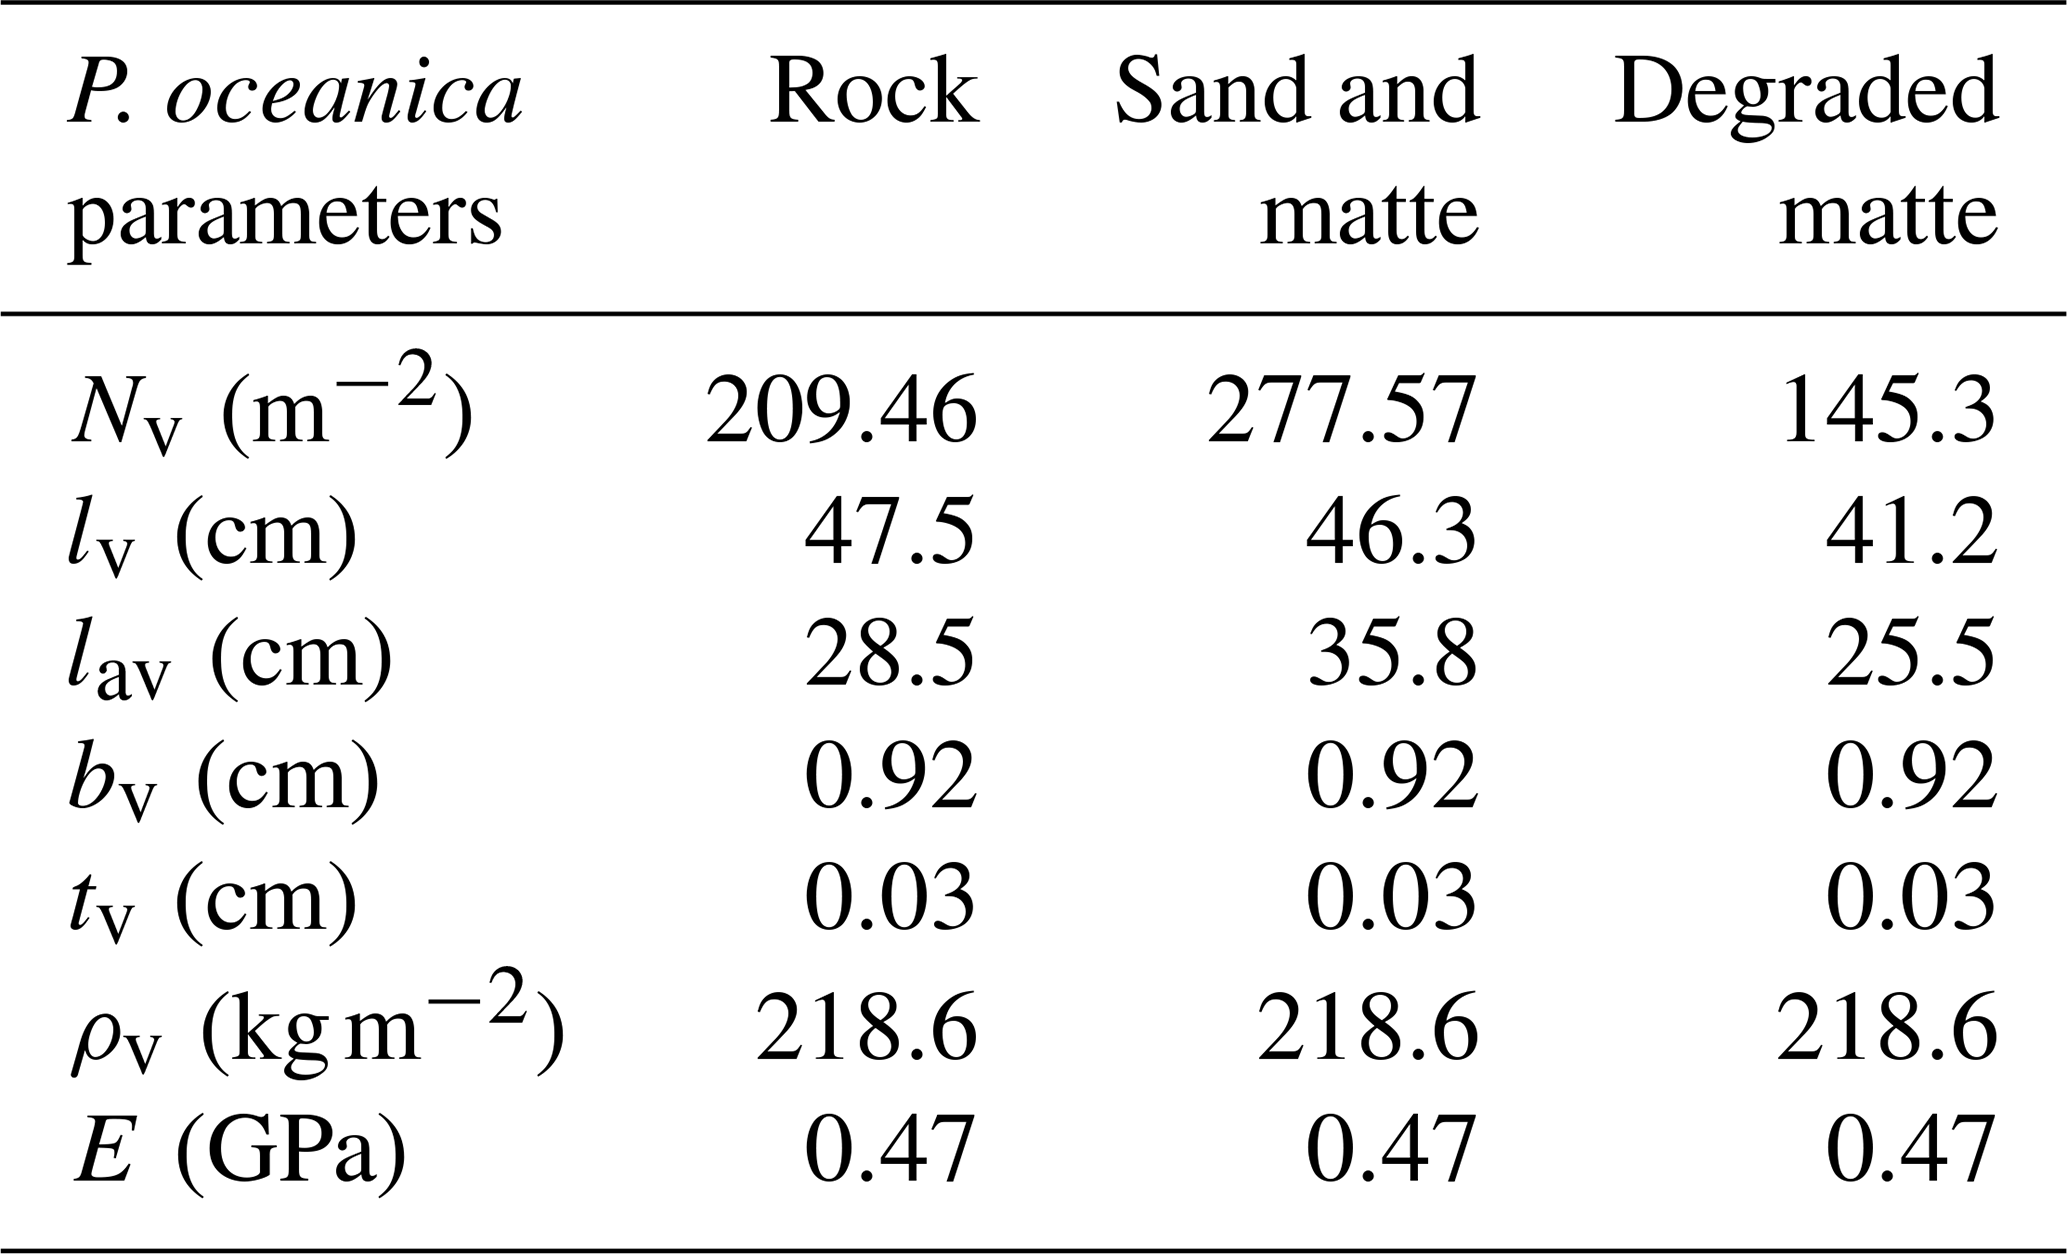
To assess the wave attenuation in the study area, we conduct three experiments with different parametrizations in the vegetation module (Table 3). In the first configuration, we simulated the absence of the meadows in the study area by excluding the source term Sds,veg. In the second configuration, VF, all the parameters of the vegetation module remain constant over time, while leaf length and shoot density vary according to different substrate types given in Table 4. The values for leaf length and shoot density represent the annual averages derived from inter-annual sampling (see Sect. 3.2). The elastic modulus value is set at 0.47 GPa and was determined by Folkard (2005), who measured the angle of deflection of a small cantilevered strip of the sheeting when loaded with small weights. In the third configuration, VFS, the model mimics the seasonal variations in canopy height, defined as the maximum length of a leaf within a shoot. This is achieved by fitting a fifth-degree polynomial curve to canopy height data collected in P. oceanica meadows in the study area. The growth curves obtained for the three substrate types in Fig. 5 exhibit a trend similar to those described by Ott (1980) in the Gulf of Naples, an area in the Tyrrhenian Sea close to the current study area with a similar wave climate. A similar approach has already been employed in previous studies to analyse the annual growth dynamics of P. oceanica (Duarte, 1989; Alcoverro et al., 1995) and to estimate the carbon dioxide fixed by the plants (Vassallo et al., 2013).
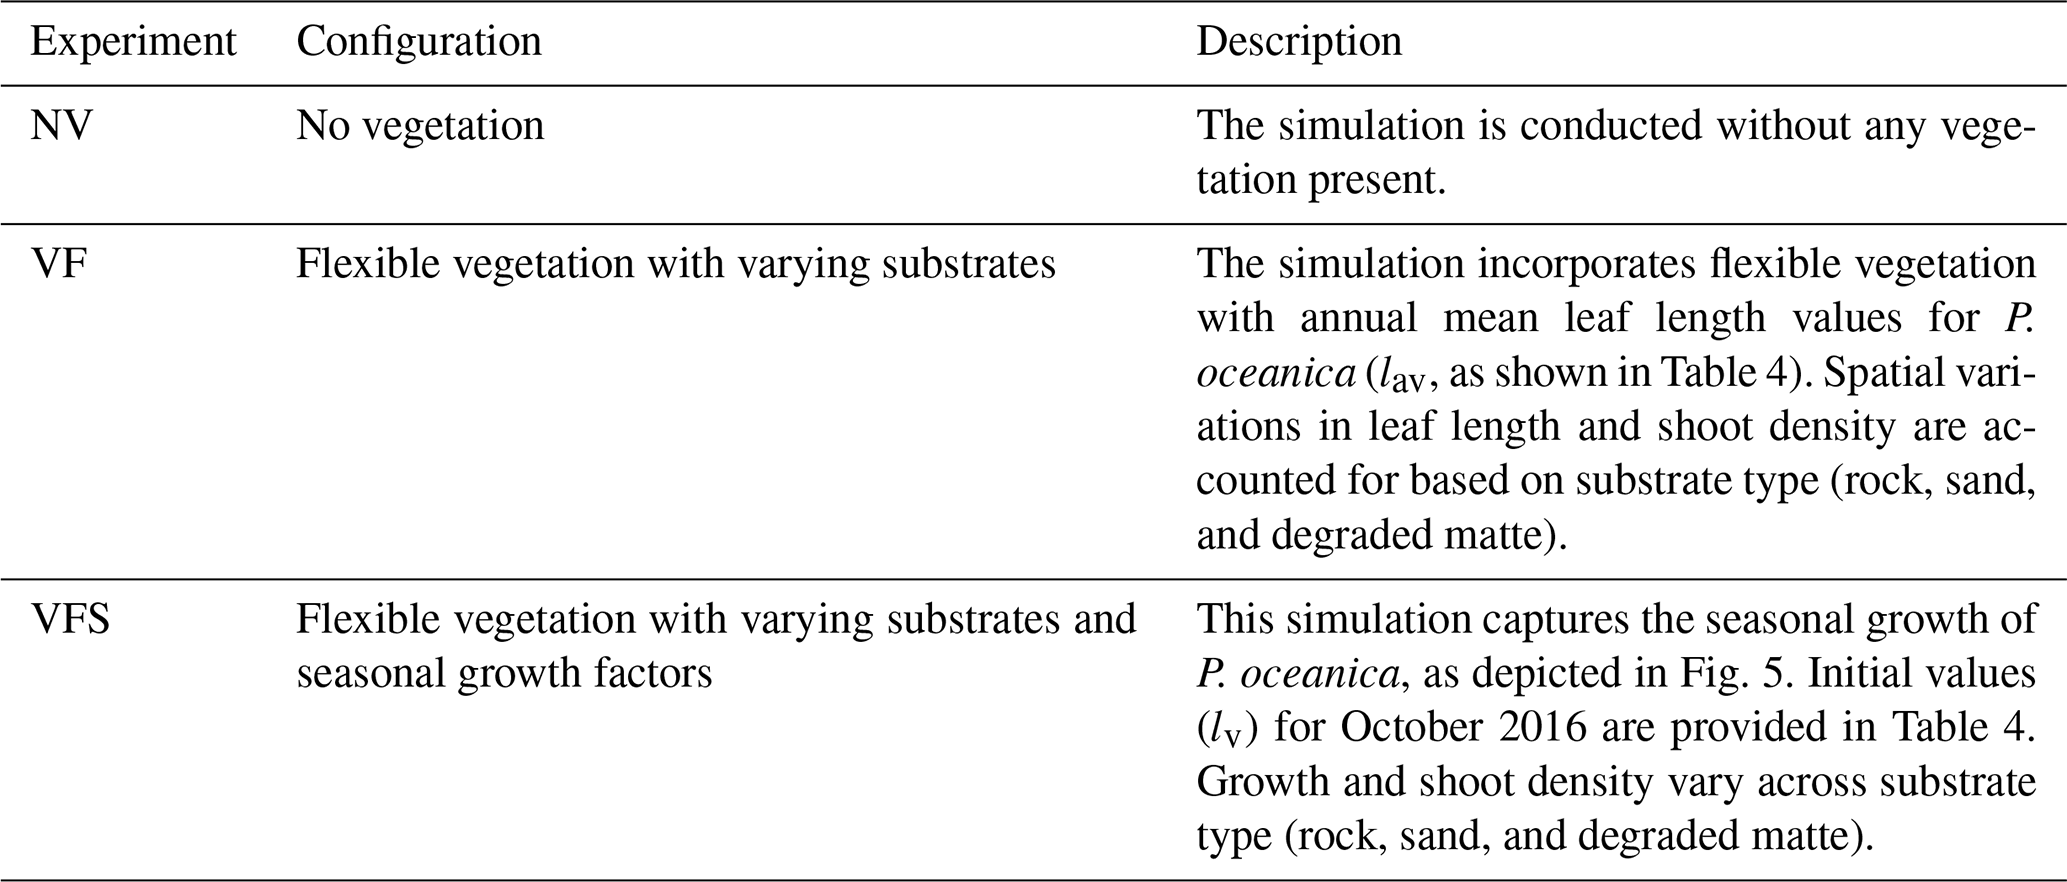
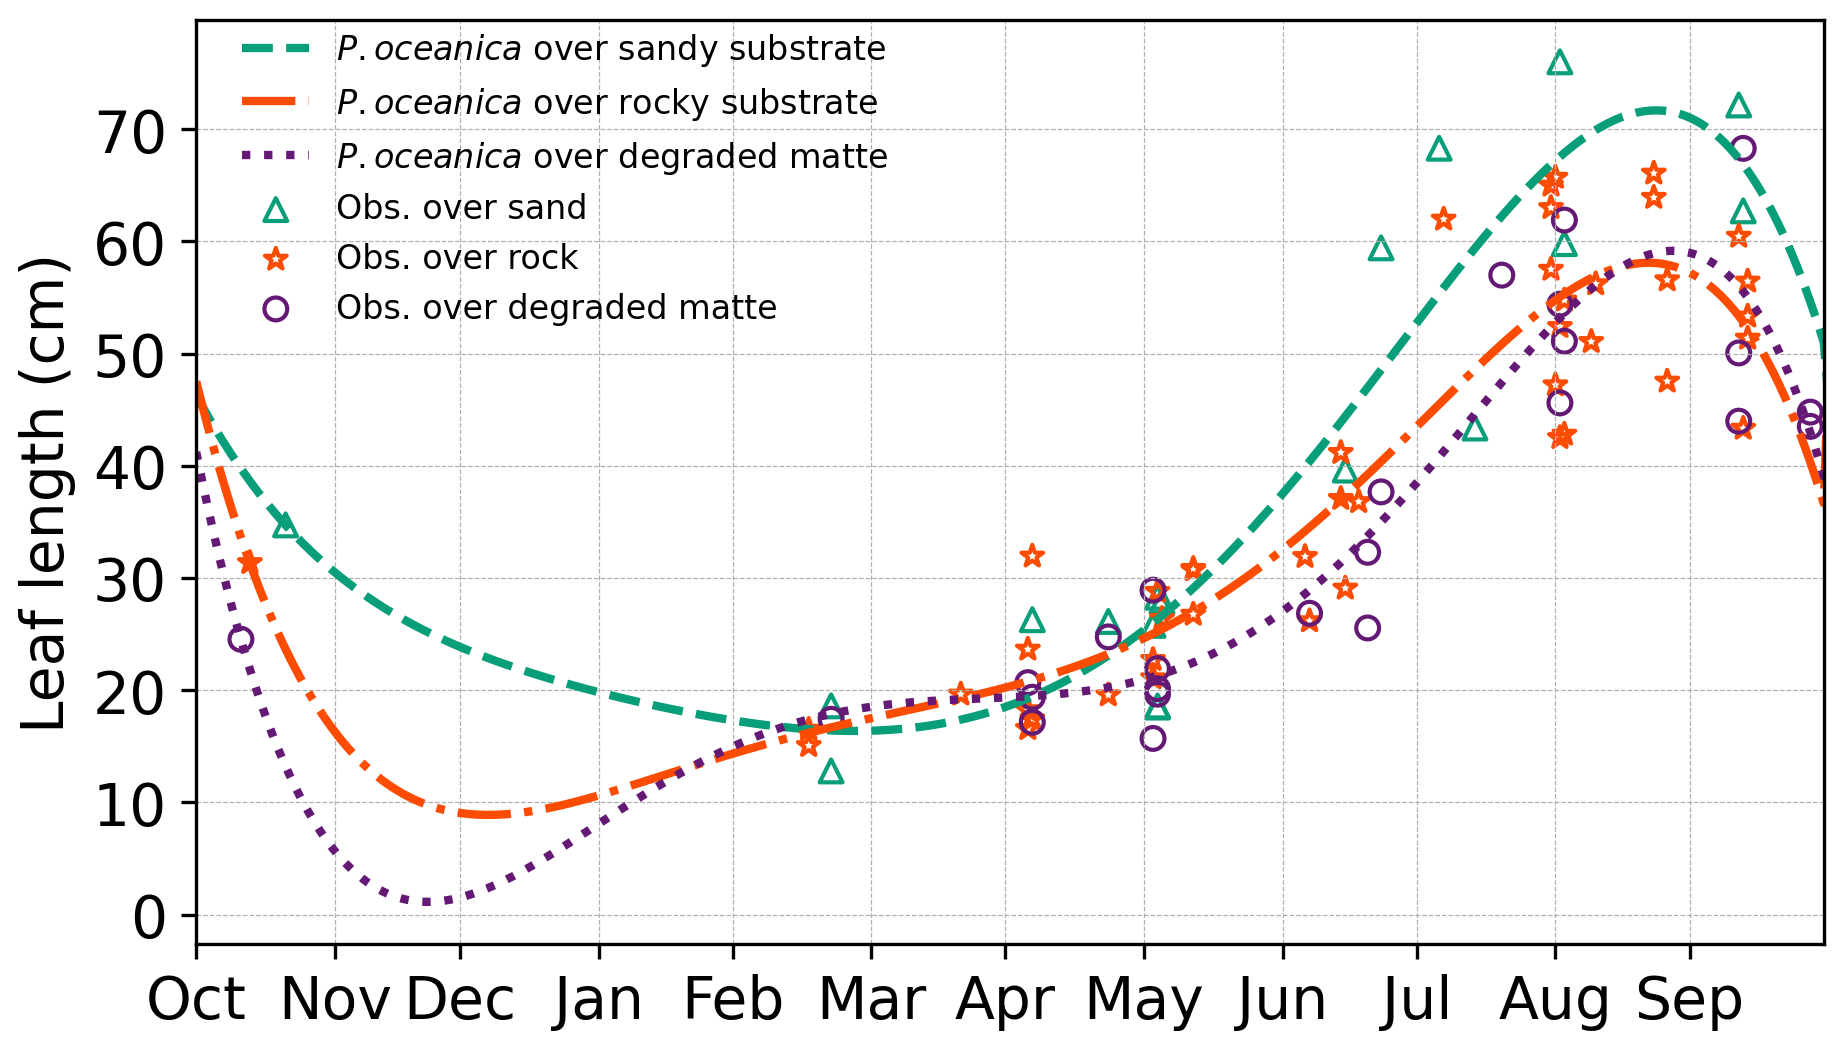
Figure 5P. oceanica leaf length variation throughout the year, showing seasonal observations alongside fitted growth curves. The corresponding coefficients used for the fitted curves are provided in Appendix A2.
According to the growth patterns, maximum leaf development in P. oceanica occurs towards the end of the summer season. This is followed by the onset of intense autumnal storms, which induce the detachment of senescent leaves, leading to a marked decline in canopy height during winter. At this stage, only juvenile shoots persist, characterized by their minimum annual leaf length. Notably, the timing of minimum canopy height varies with substrate type, a pattern that may reflect both biological variability and senescence cycles, as well as observational uncertainty during winter months when adverse weather conditions hindered data collection due to the infeasibility of scuba diving.
Specifically, in the study area, P. oceanica growing on sandy and matte substrates exhibits faster growth and greater leaf elongation during summer months. On a sandy substrate, which facilitates root penetration (Di Maida et al., 2013), meadows demonstrate greater resilience by postponing the onset of senescence and maintaining a higher minimum canopy height during winter. In contrast, a rocky substrate imposes mechanical limitations on root penetration, restricting P. oceanica to establishing in crevices (Hemminga and Duarte, 2000), reflecting a greater demand for anchorage and reduced nutrient availability (Giovannetti et al., 2008). Given that sediment-based nutrient uptake through the roots is a primary pathway for this species (Touchette and Burkholder, 2000), these constraints likely contribute to diminished growth performance in winter months. Similarly, canopy height is lower for P. oceanica growing on degraded matte, as the reduced shoot density offers limited protection against intense storms, which tend to uproot nearly all leaves, leaving only those a few millimetres long. Thus, the values shown in Table 4 for initial leaf length reflect the initial conditions of P. oceanica meadows in October and are subject to change over the simulation according to Fig. 5 for the VFS experiment.
Table 4Vegetation parameters for different substrates of P. oceanica meadows with initial (annual mean) leaf length values and values averaged over the simulation period.
The growth factor is inherently site specific, influenced by physical and environmental variables such as wave action, turbidity, temperature, proximity to river mouths, and nutrient availability, requiring localized data collection. Unlike biogeochemical models, the proposed formulation, based on in situ observations, does not rely on abiotic parameters, which are often limited by poor temporal coverage (e.g. cloud-obstructed satellite data) or insufficient spatial resolution in coastal zones (e.g. the 4 km grid used by Copernicus Marine Services regional models).
3.2 Observational data
To model the P. oceanica meadows in the four SCIs, structural, morphological, and dynamic parameters of the seagrass were collected at 15 stations (POS1-POS15) in 2017, as illustrated in Fig. 4a on the right. The sampling of plants followed a hierarchical design in accordance with the standard protocol reported in Buia et al. (2004). By scuba diving, shoot density Nv was determined as shoots m−2 by counting the number of shoots in nine randomly selected squares (40 cm×40 cm). A total of 18 orthotropic rhizomes were randomly collected from each station (six rhizomes for three replicates per station) for phenological analysis (Giraud et al., 1979). In the laboratory, leaves of P. oceanica were scraped to remove epiphytes and then washed in distilled water. Subsequently, biometric variables such as the number, length (lv), width (bv), and thickness (tv) of juvenile, intermediate, and adult leaves per shoot were measured at each station, following Giraud's classification (Giraud, 1977). According to Pergent-Martini et al. (2021), the longest leaf in a shoot is most often the third-ranked leaf, which has therefore been adopted as the representative value for canopy height. To calculate the tissue density of the leaves (ρv), the oldest leaf with an intact apex was dried in an oven at 60 °C for 48 h and then weighed. Leaf density was then estimated by dividing the dry weight of the leaf by its volume, calculated from the previously defined biometric data.
To validate the WW3 model, wave data were gathered from the wave buoy of the Civitavecchia Coastal Environment Monitoring System (C-CEMS), developed by the Laboratory of Experimental Oceanology and Marine Ecology and operational since 2005 in the coastal marine area of Civitavecchia (Bonamano et al., 2016, 2021, 2023). The Datawell wave buoy is equipped with a wave motion sensor mounted on a stabilized platform, along with accelerometers and a magnetic compass. It has enabled the measurement of wave height (with an accuracy of 0.5 % of the measured value), wave direction, and wave period at a depth of approximately 50 m. The simulations were validated using SWH measurements recorded from October 2016 to November 2017.
In this section, we first analyse the wave fields over the Civitavecchia region (Sect. 4.1) based on VFS configuration results and discuss the overarching wave patterns. Subsequently, in Sect. 4.2, we validate the VFS experiment output against observational data, evaluating the performance metrics such as correlation coefficient and bias. In Sect. 4.3, we intercompare the VF and VFS experiments against the NV.
4.1 Wave field analysis
The area of Civitavecchia is influenced by the waves approaching predominantly from the south-west, as shown on an annual mean SWH in Fig. 6a and b. In the VFS configuration, the waves are impacted by the vegetated zones producing irregular SWH patterns along the coast. The deep-blue colour depicts the harbour zone, which is shielded by the breakwater. The patches of light-blue regions in Fig. 6a show the annual mean wave height reduction due to the presence of vegetation down to 0.2 m from 0.4 m in the NV configuration (Fig. 6b). The seasonal SWH maps (Fig. 6c–f) illustrate that waves are greater during the autumn to winter period (OND, JFM), with offshore waves averaging 0.8 m and diminishing to 0.4 m at the coast of Civitavecchia. During this period, the predominant wave direction is northward, highlighting the exposure of site SCI 3 to substantial wave activity at the Santa Marinella coastal edge. Conversely, during the warmer spring to summer period (AMJ, JAS), wave energies decrease by ∼40 %, with offshore waves averaging 0.5 m and reducing to 0.3 m at the coast. During this period, the waves approach the coast more perpendicularly, and SCI 4 benefits from the partial protection provided by the Santa Marinella headland, resulting in wave divergence.
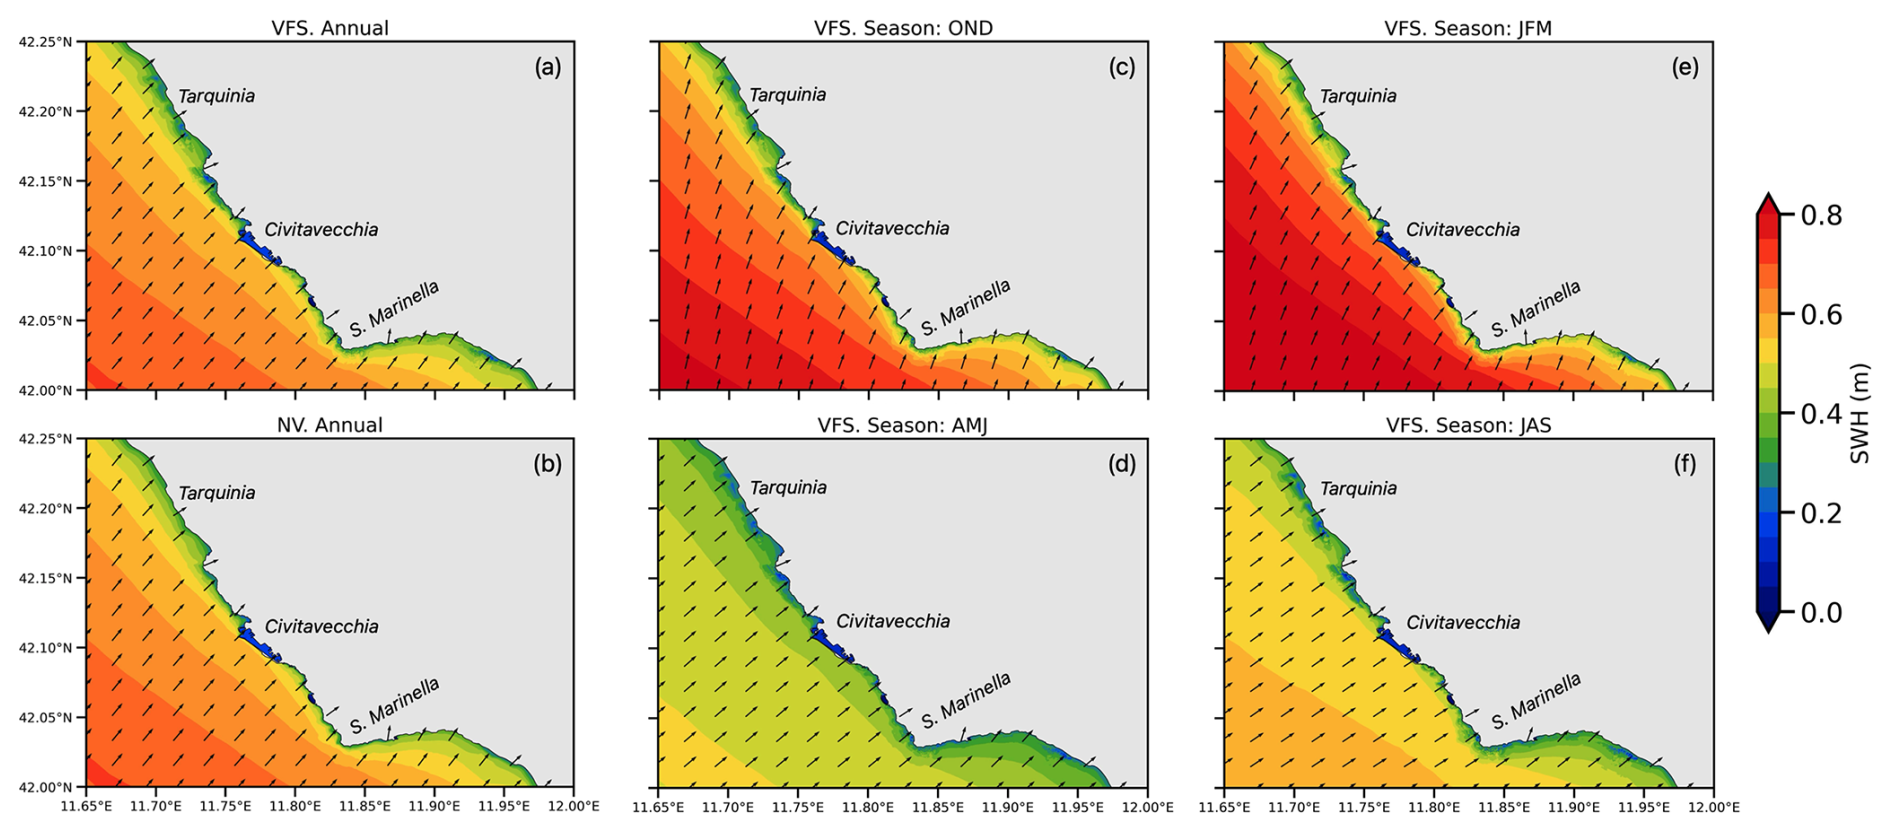
Figure 6Maps (zoomed over the coastal area) of annual mean (a) and seasonal (OND, JFM, AMJ, JAS) mean (b–e) SWH (1 October 2016–30 September 2017) including flexible vegetation and seasonality effect (VFS).
4.2 Model performance analysis
We assess the wave model's performance using offshore buoy data described in Sect. 3.2. However, since the buoy is located outside the vegetated area and beyond its influence, the validation does not account for the effects of seasonal variability or flexibility in the model implementation. Nevertheless, the SWH time series in Fig. 7a at the wave buoy location (see Fig. 4a) provides valuable insight into high-amplitude waves over the simulated period, with wave heights reaching 4 m, peaking in March. These strong wave events occur more frequently during colder seasons. As previously noted, we anticipate that high-amplitude waves in autumn will impact the coastline and significantly damage the vegetation canopies, starting over the seasonal cycle in October, as observed in Fig. 7a. The figure compares the VFS experiment results with wave observations collected during the same period, represented in red. To minimize the impact of localized point-wise variations, the average values from the five nodes closest to the buoy were used. The model generally overestimates wave heights during autumn and winter, while slightly underestimating peak wave events in spring and summer. When wave heights are below 0.5 m, the model tends to provide lower estimates than observed. Overall, the model demonstrates strong performance, accurately capturing peak events with a high correlation coefficient of 0.95 and a bias of −0.14 m (Fig. 7b).
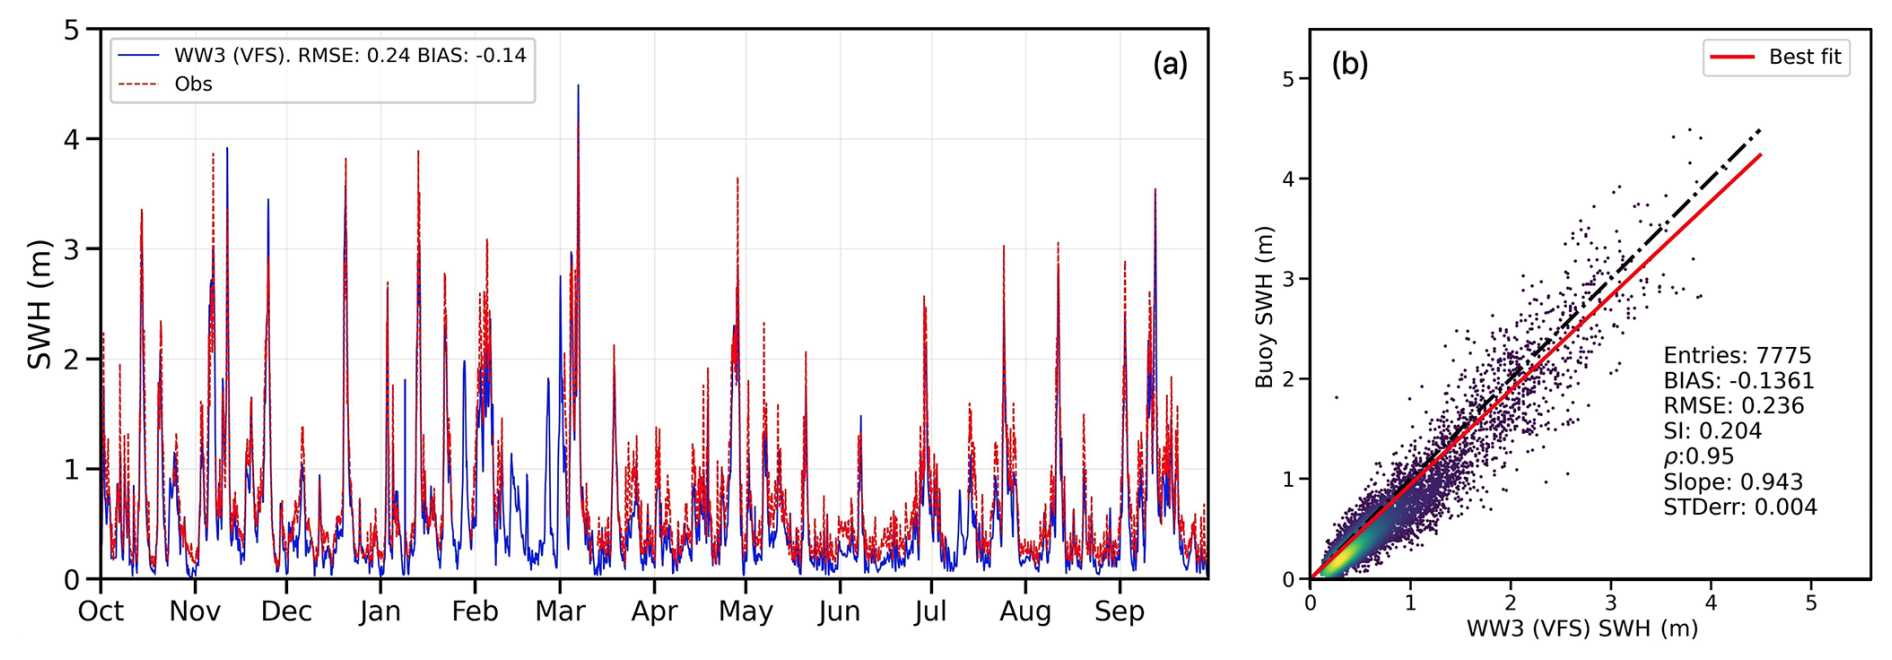
Figure 7Comparison of the wave model results with the buoy data (Fig. 4a) in terms of time series (a) and a scatter plot (b). In plot (b), the dash-dot black line represents the perfect correlation for the reference, while the solid red line shows the model fitting. A statistical summary is also provided.
We further analyse the model performance, calculating the dimensionless relative bias in SWH associated with the incoming wave direction (Fig. 8). Consistent with the quiver map in Fig. 6a, the mean incoming wave direction is south-west, ranging between 210 and 240° N. We observe a 0.2 increase in SWH relative bias with rising wave height for waves ranging from 3 to 4.5 m. However, for smaller southern waves at 180° N, of 1–2 m, the model predominantly underestimates SWH, showing a negative bias of 0.3. The highest positive bias, 0.3, is most frequently observed for the western waves (270–300° N) of 2–3.5 m magnitude. Expectedly, the lower-amplitude waves, due to their higher frequency, produce a negative bias across all directions, reaching 0.4. This effect is also evident in Fig. 7a, where the model consistently underestimates SWH.
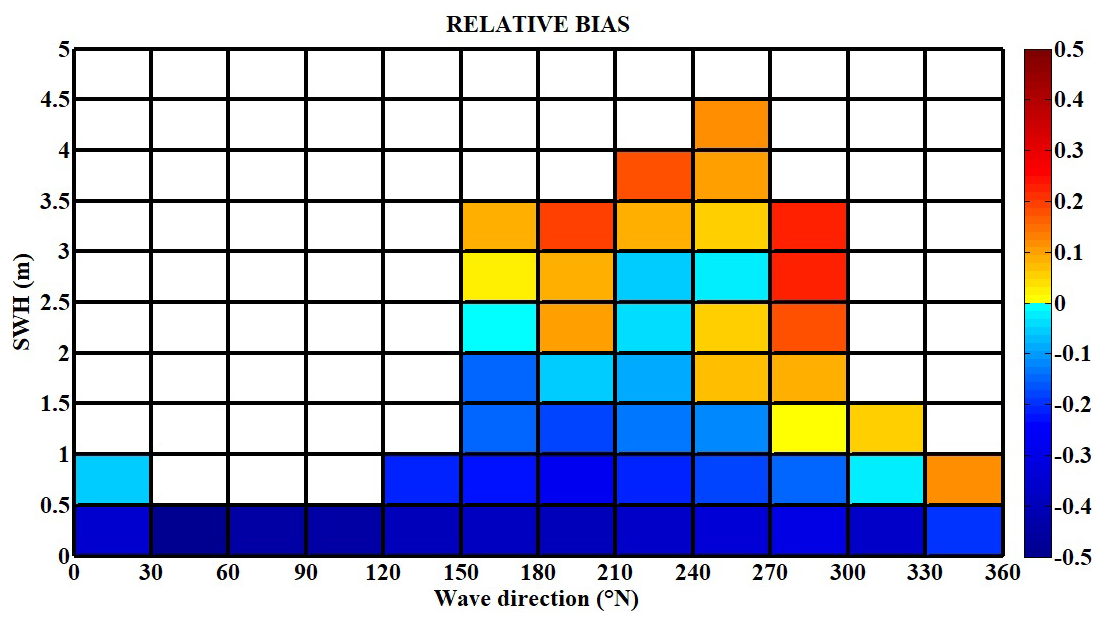
Figure 8Heat map of SWH and wave direction relative bias (dimensionless), with the relative bias formulation described in Roelvink et al. (2009).
The variability in bias is likely associated with the absence of coupling effects with currents in the region. Studies identify the Bonifacio Strait as a principal driving force of cyclonic and anticyclonic gyres (Astraldi and Gasparini, 1994), forming the Bonifacio cyclone, where the winter convection is particularly strong, reaching the north-eastern coasts (Iacono et al., 2021). From autumn to early spring, the northward principal stream entering the Tyrrhenian Sea from the Sardinia Channel and Sicily Strait follows along the eastern coast and splits into an outflowing stream via the Corsica Channel and a cyclonic southward flow entrained by the Bonifacio Gyre (Vetrano et al., 2010). These circulation patterns may influence wave dynamics, potentially affecting the model's performance, although the extent of this impact remains unclear and requires further investigation.
4.3 Seagrass-induced wave attenuation
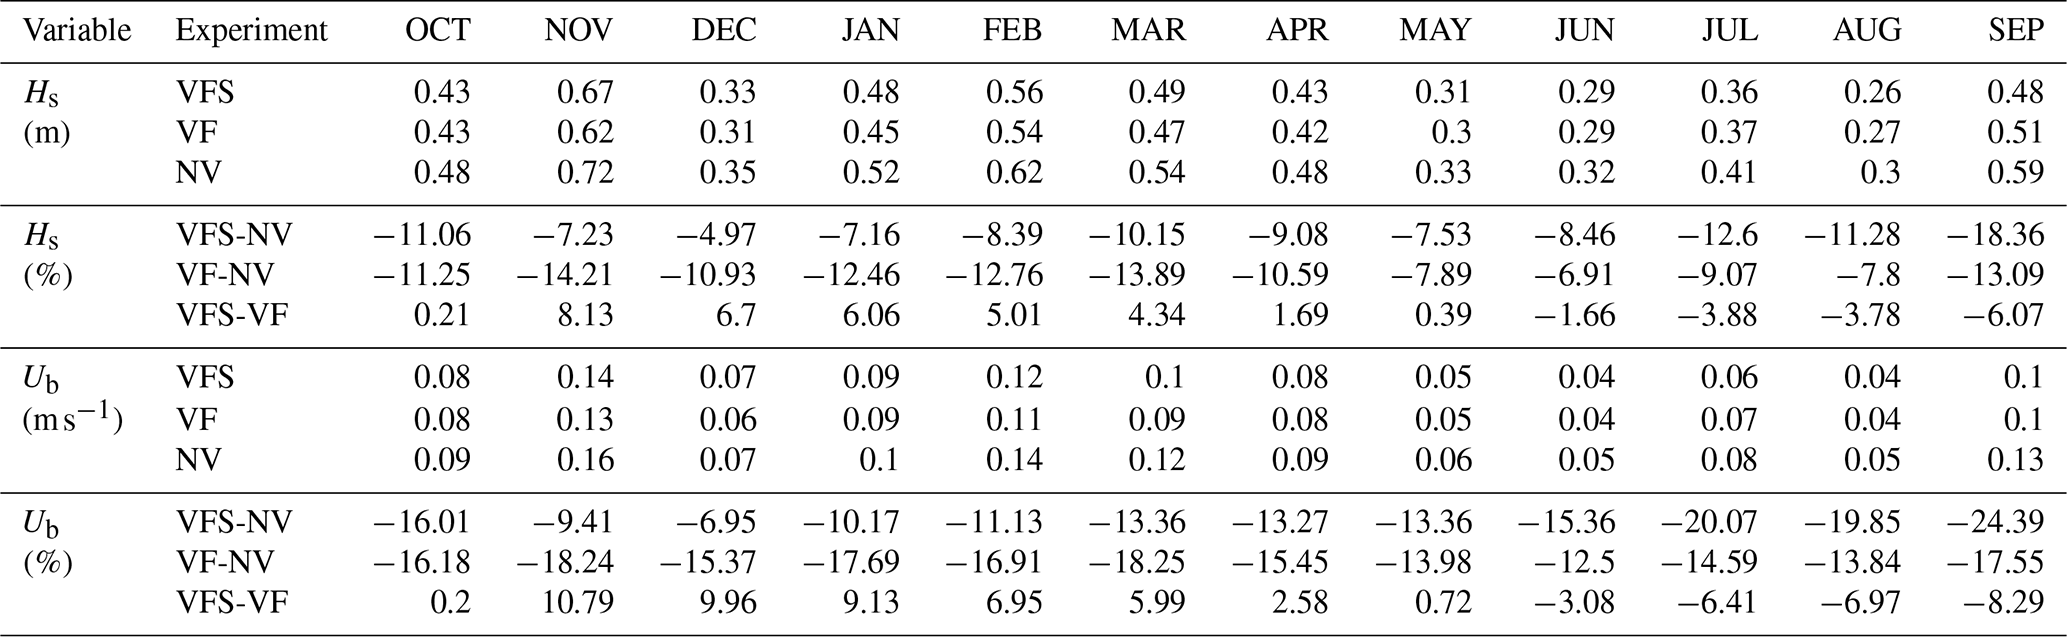
We compare the three experiments described in Table 3 to evaluate the contributions of flexible vegetation and seasonal effects to wave attenuation. Table 5 presents the monthly mean values of Hs and Ub, averaged across all vegetated nodes for the three experiments, along with their corresponding percentage differences. When modulated by seasonal growth patterns (VFS), the mean monthly Hs ranges from 0.2 m (JUN) to 0.6 m (NOV), with wave dissipation rates varying from a minimum of 4 % in December to a maximum of 19 % in September, accounting for the standard deviation of 4 %. A similar seasonal variability is observed for Ub, although dissipation rates are slightly higher, ranging from 6 % to 25 %. In comparison, the VF experiment exhibits lower annual variability of 2 % in wave attenuation, with values ranging from 7 % to 14 % for Hs and from 12 % to 18 % for Ub. Seasonality accounts for an additional 5 % variability in Hs and 7 % in Ub (VFS−VF), with maximum observed differences of 8 % and 10 %, respectively. Wave damping efficiency varies seasonally, with reduced attenuation during the early stages of leaf development (NOV–DEC), when the positive difference between VFS and VF is most pronounced. Conversely, a negative difference, indicating greater attenuation under seasonal conditions, occurs between June and October, when leaf length exceeds the annual average set in the VF simulation.
Table 5Monthly mean Hs and Ub over vegetation area and their differences for the three experiments in Table 3.
The observed seasonal variability in attenuation is further influenced by the dimensionless blade length to wave orbital excursion ratio L (according to Eqs. (5) and (6)), which modulates effective leaf length response to wave forcing conditions. A detailed analysis of the spatial and temporal patterns of L ratio and its implications for wave dissipation is presented in Appendix C.
However, this comparison does not fully capture the impact of P. oceanica meadows across different substrates on wave dissipation and their temporal patterns. Therefore, we further investigate the substrate-specific and spatial (node-wise) effects of the canopy on wave behaviour, with particular emphasis on seasonal variability.
4.3.1 VFS vs. NV: wave attenuation by P. oceanica over different substrate types and SCIs
Figure 9 illustrates the cyclic monthly mean reduction in Hs and Ub throughout the year (October 2016–November 2017), averaged across P. oceanica over different substrates and SCIs, attributable to the presence of flexible vegetation canopies with seasonal effect and given by the difference between VFS and NV configurations. During the summer months, the leaves undergo rapid growth due to calm seas, optimal weather, and nutrient availability, reaching peak maturity in late summer, followed by the arrival of high waves, which damage the canopies. In winter, wave height attenuation is at its lowest, ranging from 2 %–9 % over all SCIs and 1 %–11 % across various substrate types, with the strong variation between P. oceanica over degraded matte and rocks; similarly for the bottom orbital velocities marking 3 %–8 % and 1 %–14 % of reduction, respectively. From spring to summer, the pattern remains consistent, with an average wave reduction of around 7 %–9 % for both Hs and Ub. This seasonal trend reflects high wave energy and shorter leaf lengths in spring, followed by lower wave energy and developing leaves in summer. When leaf maturity peaks and high waves arrive in September, both factors contribute to maximum wave damping, with reductions of 10 %–18 % in Hs over SCIs and 9 %–24 % across substrates, and 13 %–20 % and 11 %–29 % in Ub, respectively. P. oceanica growing on sandy and rocky substrates demonstrates a more pronounced impact on wave attenuation compared to degraded matte, which is characterized by the lower shoot density and leaf length of P. oceanica. Notably, the trends associated with different substrate types do not follow the expected seasonal patterns in Fig. 5, suggesting that P. oceanica meadows on rocky substrates exhibit greater wave dissipation capacity than those on sandy substrates during summer, despite the observed variations in leaf length and shoot density. This discrepancy can be attributed to the spatial distribution of the meadows, as illustrated in Fig. 4a, where P. oceanica over sand is located farther from the shore compared to those on rocks. Given that wave dissipation (Eq. 3) is a function of the ratio of leaf length to water depth, this spatial arrangement influences dissipation efficiency, as also demonstrated in great detail by the laboratory experiments of Anderson and Smith (2014).
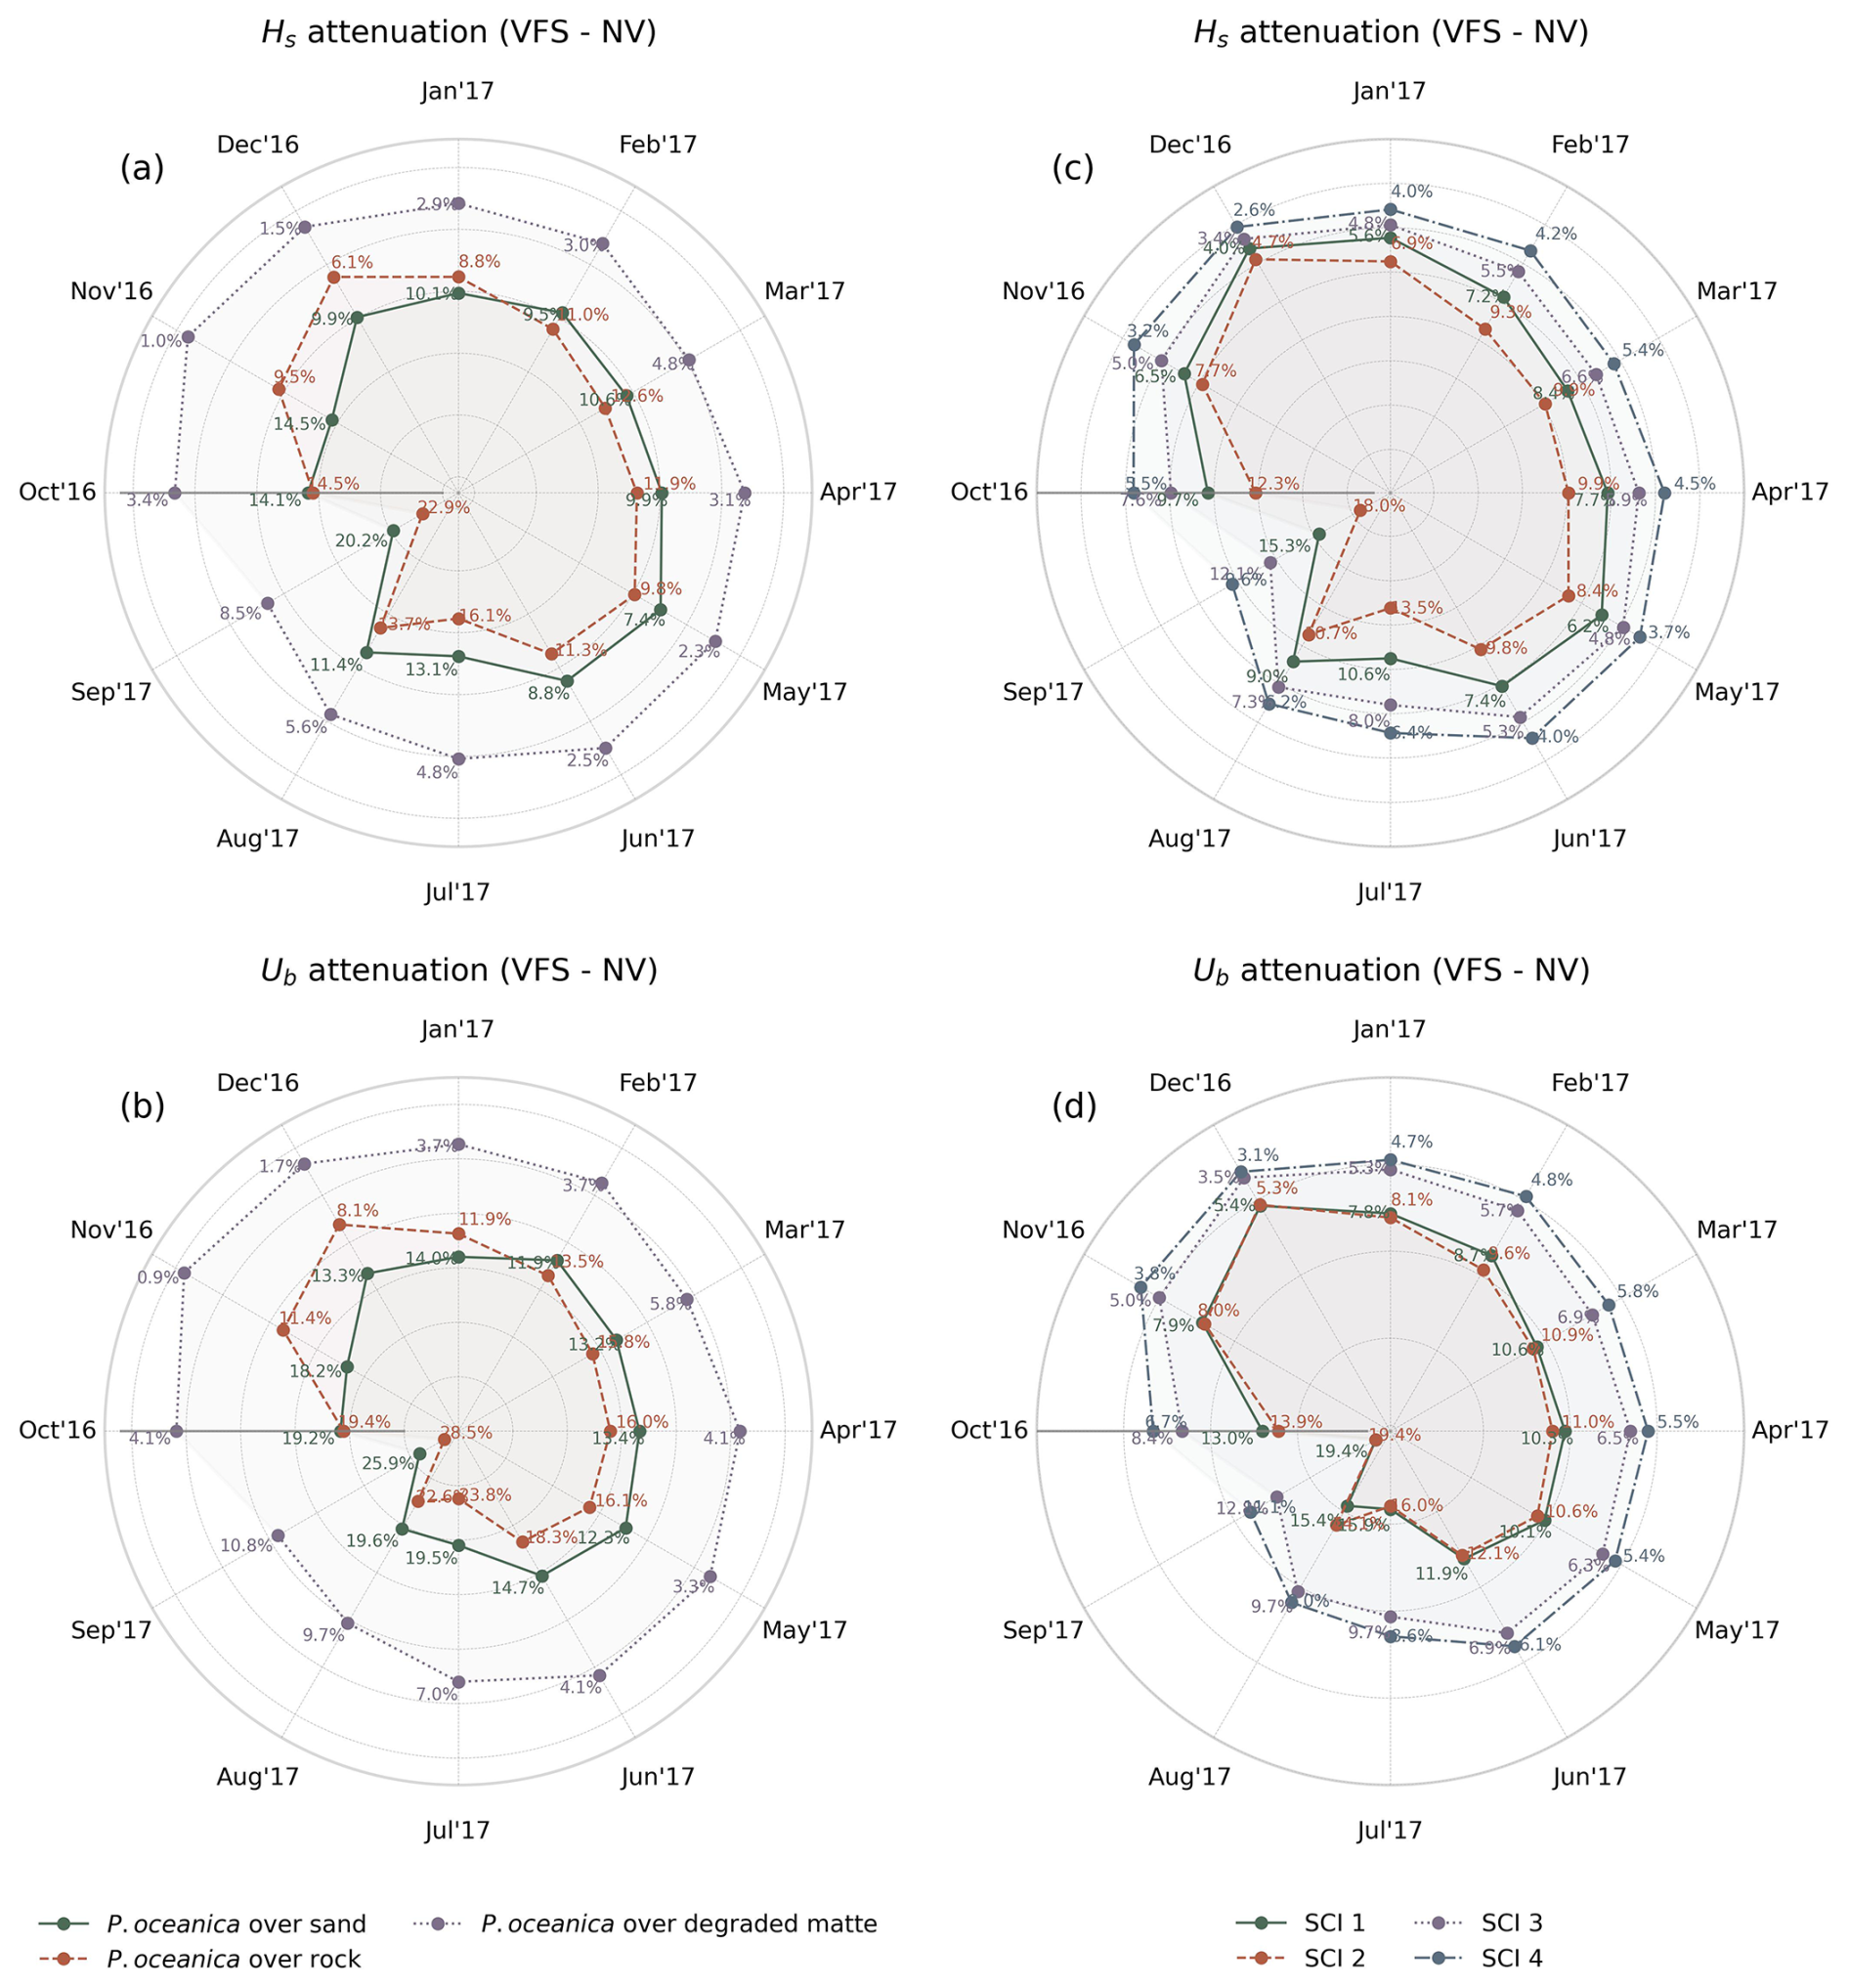
Figure 9Mean monthly Hs and Ub percentage reduction (VFS experiment) for P. oceanica over different substrates (a, b) and four SCIs (c, d), averaged across vegetated points in the mask.
4.3.2 VFS vs. VF: the contribution of seasonal variability of seagrass leaf length
To isolate the seasonal impact of the vegetation model on wave damping, we compare the VFS and VF experiments across different substrates. Figure 10's bar chart illustrates the percentage differences between the two simulations considering the phenotypic traits of P. oceanica. Seasonal variations in seagrass growth lead to a positive difference during late autumn, winter, and spring, reflecting reduced wave attenuation capacity, followed by a shift to a negative difference in summer and early autumn, indicating enhanced wave damping efficiency. The maximum monthly difference is observed over rocks, reaching 10 % and 13 % for Hs and Ub, respectively. The standard deviation across all substrates over the seasonal cycle is 5 % and 7 % (depicted by a solid line), as seen earlier in Sect. 4.3. Overall, the seasonal patterns conform to the growth curves in Fig. 5.
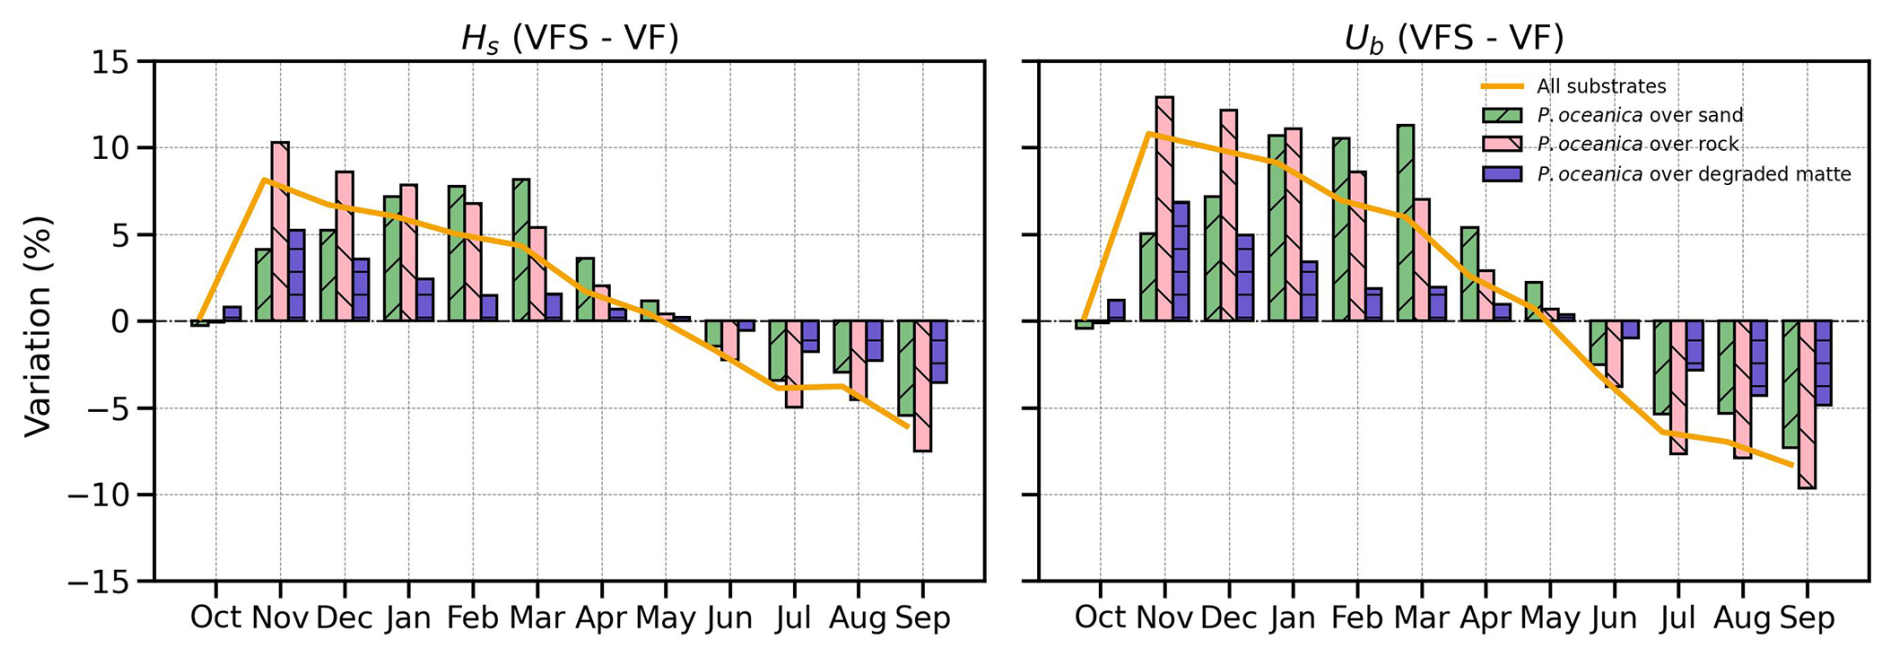
Figure 10Time series of mean monthly Hs and Ub percentage differences between VFS and VF simulations across substrate types . Bars indicate the average differences over vegetated points for each substrate, while the solid orange line represents the weighted average across all vegetated areas in the domain.
4.3.3 Seasonal wave attenuation maps
Figure 11 illustrates the node-wise Hs attenuation capacity of vegetated areas along the Civitavecchia coast by quantifying the wave height reduction, attributable to flexible canopies and their seasonal growth patterns. The wave height reduction ranges from 20 % to 40 % in the SCI 1 and 2 regions (north of Civitavecchia port) and from 10 % to 30 % in SCI 3 and 4. This discrepancy can be attributed to several factors, such as partial sheltering by the Santa Marinella headland (Sect. 4.1), seagrass distribution (Fig. 4a), and the lower wave damping capacity of P. oceanica over degraded matte (Sect. 4.3.1). SCI 2 exhibits the highest wave attenuation capacity, attributed to its predominantly rocky substrate and direct wave exposure. Seasonally, peak wave attenuation occurs during the JAS period (d), driven by intense storm events and the canopy reaching its maximum height. Lower values are observed in winter and spring (a–c) due to the presence of predominately juvenile leaves.
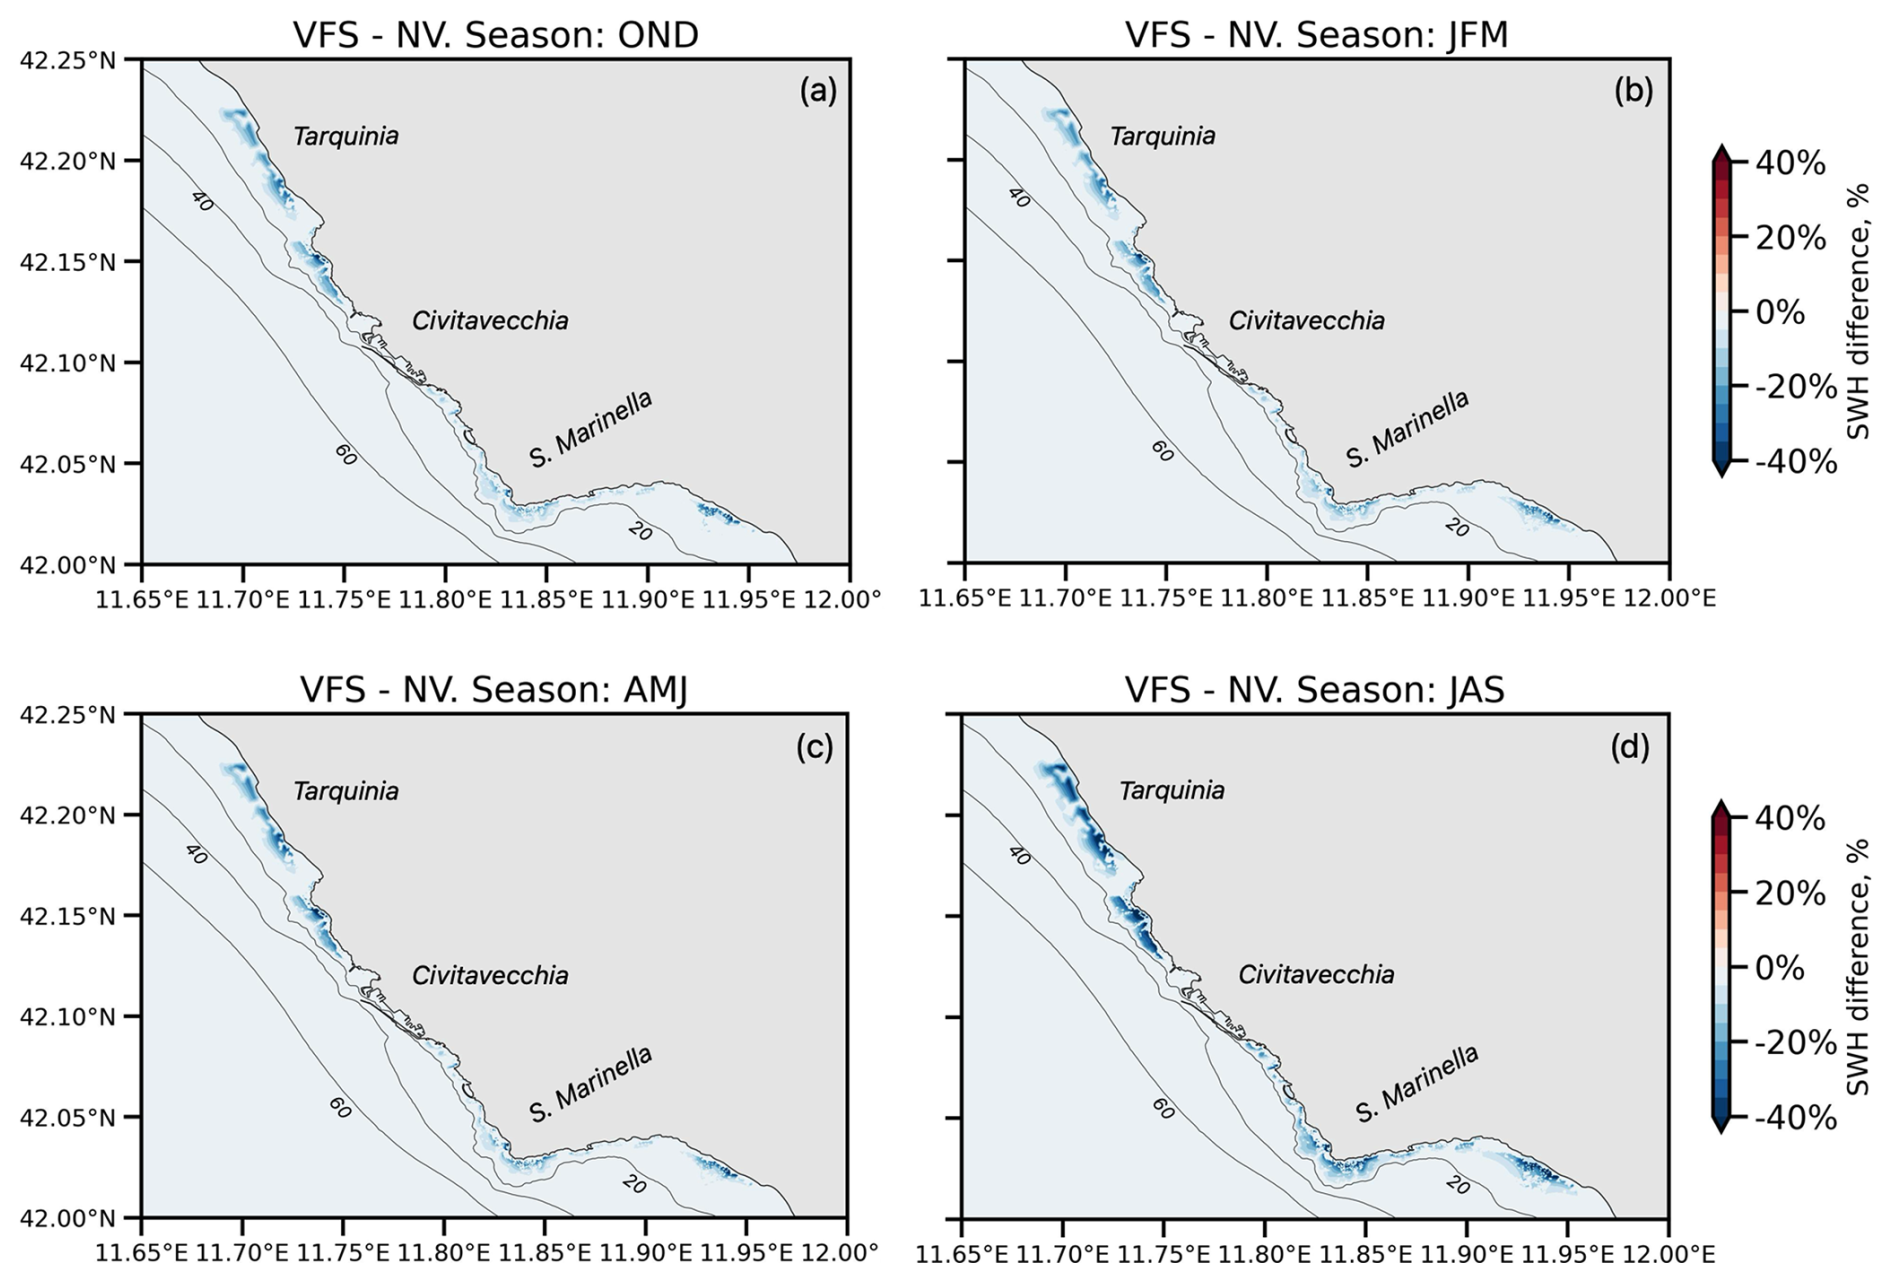
Figure 11Maps (zoomed over the coastal area) of seasonal (OND, JFM, AMJ, JAS) mean SWH attenuation (VFS−NV).
As proposed by Luhar and Nepf (2011), and further refined in Luhar and Nepf (2016), the flexibility effect was incorporated into the source term of WW3 by replacing the vegetation leaf length with an effective length as a function of the bottom orbital velocity. Due to the plant's partial passive movement with the wave, this new configuration results in a reduced wave height attenuation compared to that for a fully rigid blade of the same geometry (Lei and Nepf, 2019). Similar to the findings of Beudin et al. (2017), we observed the impact of submerged seagrass on wave characteristics in terms of reduced wave steepness and a localized increase in mean wavelength, with an example demonstrated over the vegetated area in Appendix B.
To explore how incorporating flexibility can improve model performance and better simulate the effects of seagrass meadows on wave attenuation, a test case was designed to replicate the experiment of Infantes et al. (2012) in the Balearic Islands, where wave parameters were measured for over a month in a P. oceanica meadow with known shoot density and leaf length. The model results demonstrated a markedly improved agreement with observed data, achieving wave damping of up to 40 %–50 % for peak energies, compared to the rigid vegetation experiment, which substantially overestimated it at around 80 %. Additionally, the model produced a cross-shore variation of wave height that more accurately mimics the non-linear characteristics inherent in the complex interaction between waves and a flexible canopy.
In application to the Civitavecchia case study, at the seasonal scale, we observed an additional monthly wave damping variability of up to 10 %, averaged across P. oceanica over different substrate types and attributed to the seasonality effect in contrast to the flexible vegetation model alone. Reduced wave dissipation rates were observed until June, when leaf lengths surpassed the annual averages established for each phenotypic trait in the non-seasonal experiment, VF, after which wave damping increased towards the end of the seasonal cycle in September. Thus, the lack of seasonal variability in the model leads to a misrepresentation of seagrass wave damping efficacy, overestimating its impact in winter and spring and underestimating it in summer and autumn.
From a spatial point of view, in terms of SCI sites, the model showed a wave damping of approximately 10 % during peak waves in March for SCI 2 on average. As both SCI 1 and SCI 2 are predominantly composed of rocky substrates and are exposed to direct waves from the south-west, they experience a greater impact and, consequently, more significant wave reduction compared to SCI 3 and SCI 4. The maximum wave damping reached 16 %–18 % on average in September over SCI 1 and SCI 2 and 10 %–12 % over SCI 3 and SCI 4. The seasonal effect did not show a linear correlation with the monthly average wave reduction across SCIs when compared to the non-vegetated simulation. This aligns with the vegetation model, where wave dissipation is closely related to both wave energy levels and leaf length. Similarly, we observed consistent results in the analysis of wave damping across various substrate types, with peak SWH reductions of 24 %, 22 %, and 9 % for P. oceanica traits over rock, sand, and degraded matte, respectively. It is noteworthy that SCI 4, characterized by a higher concentration of degraded matte, exhibited a lower wave attenuation capacity of a maximum of 10 %.
It is important to note that the seasonality effect is applied to the Civitavecchia site with coefficients empirically derived from site measurements. Consequently, this approach relies on fitted growth curves known for the site of interest, although it can be adapted for use in other areas, provided that the observational data are available. Here, however, the development was specifically tailored to accurately estimate the dynamics of the Civitavecchia coastal region. Seasonal variation was primarily tracked by monitoring the extension of leaf length over time, without considering the decline in size, coverage, and shoot density in recent decades (Marbà et al., 2014; Telesca et al., 2015) due to a combination of anthropogenic impacts (i.e. boat anchoring, siltation, etc.) and climate change (i.e. introduction of exotic species, the rise of sea surface temperature, and the intensification of wave energy along the coastal zone). The measurements used to reproduce the behaviour of P. oceanica were obtained through point-based scuba diving observations, which are inherently non-synoptic and spatially heterogeneous. High-resolution spatial and temporal studies typically require extensive in situ data collection, which is both costly and time consuming. Therefore, the adoption of innovative monitoring techniques, such as autonomous vehicles (e.g. uncrewed surface vehicles – USVs) equipped with acoustic sensors, could significantly enhance both data coverage and synopticity. These systems are capable of measuring seagrass height and coverage in shallow coastal areas that are inaccessible to traditional hydrographic platforms, while also detecting canopy variations induced by extreme events (Piazzolla et al., 2024). Such events can damage vegetation canopies, leading to the temporary absence of seagrass meadows (Oprandi et al., 2020), thereby reducing the wave attenuation effect. This feedback loop from the wave model to the vegetation dynamics was not incorporated into our model. Another important consideration is that relying solely on a wave model, without incorporating circulation dynamics of the region discussed in Sect. 4.2, overlooks the current-induced turbulence that develops above the seagrass canopy, as investigated by Vettori et al. (2025). Beth Schaefer and Nepf (2022) showed that currents can either amplify or diminish vegetation-induced wave damping depending on wave conditions, and the inclusion of this interaction would represent a valuable enhancement to the present study.
This research presents a comprehensive analysis of the impact of submerged vegetation on wave attenuation in the nearshore zone. Focusing on the Civitavecchia coastline, it explores the effectiveness of seagrass meadows as a natural coastal defence system, as evidenced in several studies (Jacob et al., 2023; Unguendoli et al., 2023). The abundance of observational data from in situ campaigns allowed us to incorporate the measurements into a numerical wave model and characterize the varying attenuation induced by the natural seasonal cycle of P. oceanica meadows.
Among marine phanerogams, P. oceanica has a high capacity for wave attenuation as it forms extensive and dense meadows in coastal areas, with leaves that frequently exceed 1 m in length (Koftis et al., 2013). Due to changing wave energies, P. oceanica meadows bend and straighten, causing varying shear stresses depending on wave orbital velocities, reducing shear stresses and leading to a lower wave damping effect, which was accurately replicated in this work with the flexible vegetation model adapted from Luhar and Nepf (2011, 2016).
The study considered the seasonal variation of plant characteristics for three different groups of P. oceanica, identified according to their phenotypic traits, which are induced by the underlying substrate type. Importantly, the wave damping effects analysed here were based solely on these varying traits and not on the dissipation properties of the different substrates. Thus, our findings provide initial insight into the potential variability of vegetation-induced wave attenuation in a given area, based on meadow-specific characteristics.
Despite these advancements, extending the applicability of the P. oceanica growth model beyond the present case study will require further investigation into seasonal variations of seagrass, with a focus on incorporating abiotic factors that influence plant population dynamics, such as temperature and irradiance (Zupo et al., 1997), as well as nutrient availability (Elkalay et al., 2003). Alternatively, statistical approaches (Catucci and Scardi, 2020) could be employed to adapt the model to varying marine conditions, site-specific characteristics, and the availability of observational data.
We underscore the limitations of relying solely on a wave-driven model to assess seagrass-mediated hydrodynamic processes. While the current framework captures wave attenuation patterns, it neglects the interplay between currents and vegetation as discussed earlier, therefore future work must explicitly couple waves with the circulation model to resolve these interactions. As demonstrated by Gacia and Duarte (2001), by trapping sediments, seagrass meadows enhance sediment deposition and reduce resuspension through flow attenuation, stabilizing the seabed and promoting canopy persistence. Integrating sediment transport processes into such coupled frameworks is essential to unravelling how sediment–vegetation interactions govern long-term seagrass resilience.
A1
Numerical propagation for the unstructured triangular grid was set to CRD-N-scheme (Ricchiuto et al., 2005), and the spectral propagation part is solved with simple implicit first-order upwind schemes. The linear input source term was activated for initial wave growth and consistent model spin-up, as described by Cavaleri and Rizzoli (1981), with the filter function to limit the effect of low-frequency energies at initial growth (Tolman, 1992). Sink terms, due to negative wind input, whitecapping dissipation, and wave–turbulence interactions, as defined by Ardhuin et al. (2009), were also included. Non-linear wave–wave interactions were modelled using the discrete interaction approximation (DIA) (Hasselmann and Hasselmann, 1985). For the bottom friction, the simple linear JONSWAP parametrization derived by Hasselmann et al. (1973) was used. As a function of bottom topography, waves exceeding a threshold height, determined by a statistical description of surf-zone wave heights, were set to break and dissipate energy following the approach of Battjes and Janssen (1978). Triad non-linear interactions were resolved using the Lumped Triad Approximation (LTA) of Eldeberky (1996). Wind stresses were computed according to Donelan et al. (2012), while the wind field was interpolated linearly in time and space. Shoreline reflection was activated. Flexible vegetation was incorporated into the bottom friction definition, also introducing the seasonal variations where leaves undergo growth and regression, with elongation during favourable conditions and shortening due to natural senescence and environmental factors, as shown in Fig. 5. The initial leaf parameters were encoded, and a mask file was used to mark vegetation distribution and a substrate type at each location.
A2
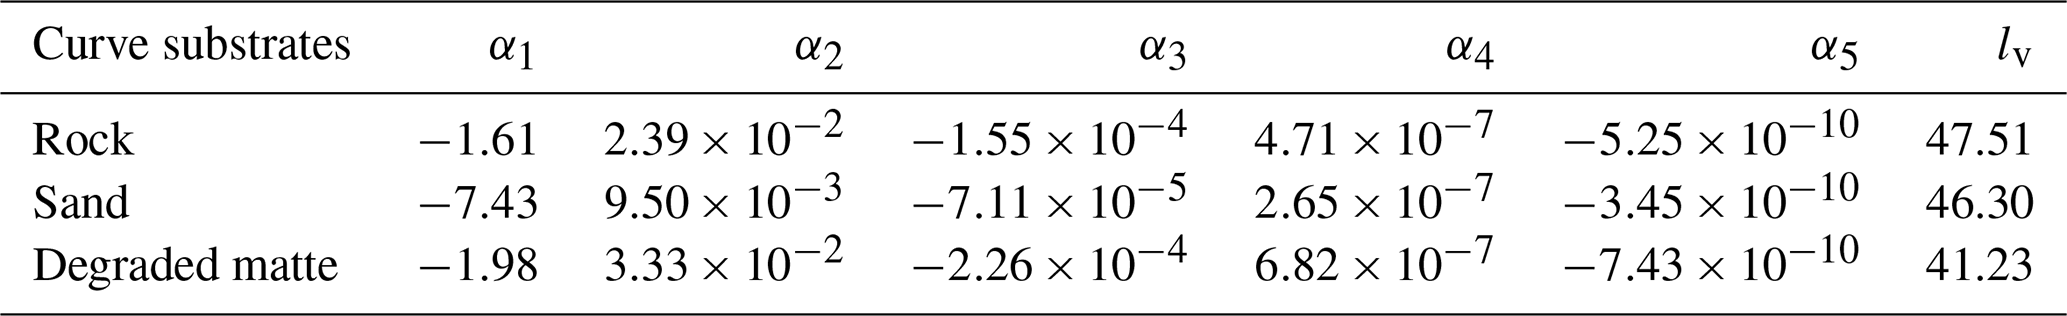
Table A1 presents the coefficients used to construct the growth curves shown in Fig. 5. The growth curves are modelled using the following fifth-order polynomial, similar to Ott (1980): , where lv represents the initial leaf length at the start of the simulation in October, t denotes the day of the year, and l is the adjusted leaf length (accounting for seasonal variations).
Table A1Growth curve coefficients for the considered P. oceanica traits in the study.
The following Fig. B1 illustrates the impact of vegetation on wave characteristics. Similar to the observations of Beudin et al. (2017), we note the reduction in wave steepness towards the shore as waves interact with seagrass patches. This reduction arises from a combination of wave height damping and a localized increase in the mean wavelength. The latter reflects a spectral shift resulting from seagrass preferentially attenuating shorter high-frequency waves, rather than an elongation of individual wave components. Such frequency-dependent attenuation has been documented in previous studies, where submerged aquatic vegetation acts as a low-pass filter, selectively damping higher-frequency wave components and allowing longer-period waves to propagate more effectively (Nowacki et al., 2017; Bradley and Houser, 2009).
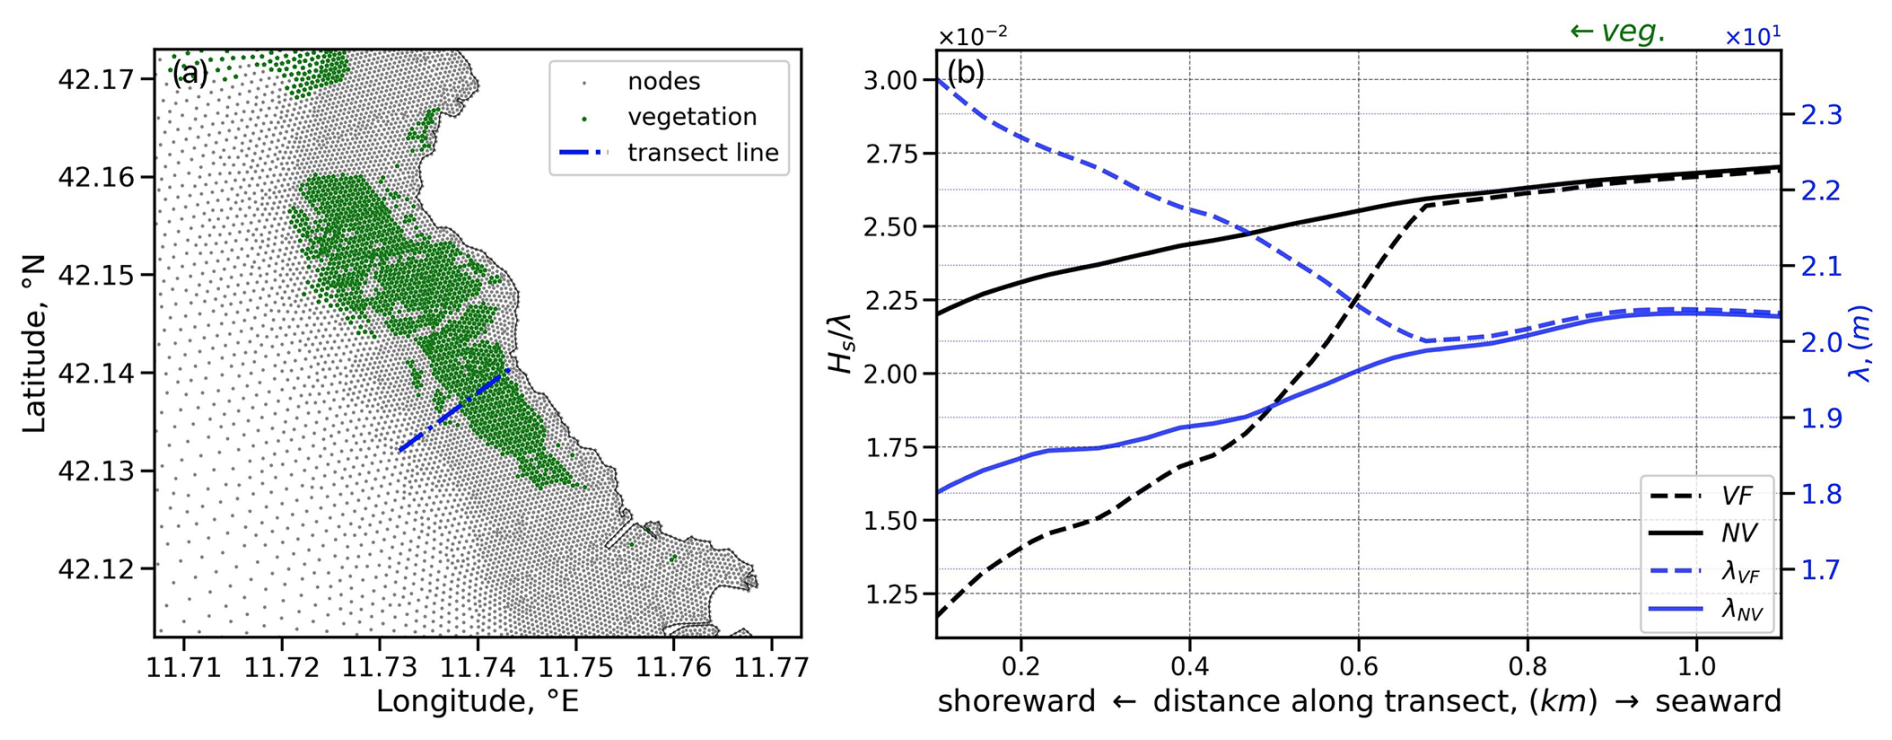
Figure B1The impact of vegetation on wave characteristics. (a) Transect line at the SCI 2 site, near the P05 sampling station. (b) Wave steepness and mean wavelength profiles (annual means) along the transect line, where the shore end is the origin of the x axis.
Figure C1a and b depict the maps of wave orbital excursion (Aw) with the L-ratios over the vegetated areas for the VFS experiment. These maps are constructed using the annual mean lavg and maximum lmax (leaf length values) in relation to the maximum and 90th percentile of the wave orbital excursion. The results indicate that the condition L≪1 is primarily associated with high-energy wave events characterized by peak near-bed orbital excursions. In contrast, the L≫1 regime is more commonly encountered under typical wave conditions.
The domain-averaged monthly mean L-ratios over vegetation areas in Fig. C1c illustrate that at least 65 % of wave conditions fall within the L≫1 regime, scaling effective leaf length as . Notably, this regime dominates during the summer months (June–August), a period characterized by both reduced wave orbital excursions and peak leaf lengths.
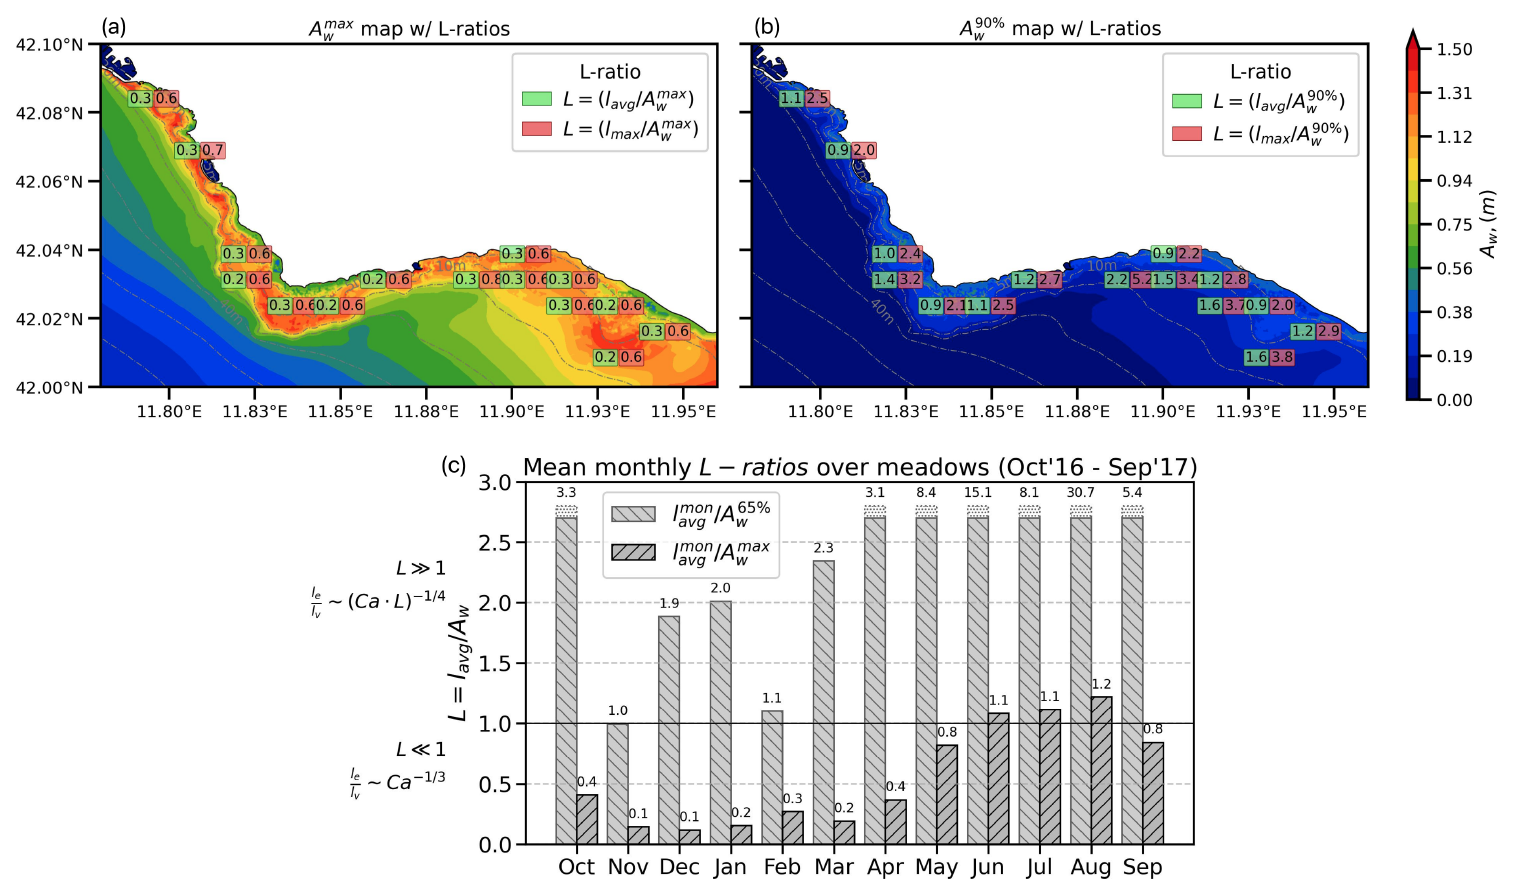
Figure C1Maps (a, b) of wave orbital excursion (Aw) with the L-ratios over the vegetated areas and (c) the domain-averaged (over vegetation only) monthly mean L-ratios.
The source code used in this study is openly available on Zenodo at https://doi.org/10.5281/zenodo.17201365 (Shirinov, 2025).
Conceptualization: SS, IF, SB, SC, and NP. Data curation: SS, SB, VP, and DP. Formal analysis: SS, SB, and SC. Funding acquisition: GC and MM. Investigation: SS, SC, and SB. Methodology: SS and SC. Project administration: VP and GC. Resources: IF, GC, and MM. Software: SS, SC, NB, and JA. Supervision: IF and NP. Validation: SS and SC. Visualization: SS, SC, and SB. Writing (original draft): SS and IF. Writing (review and editing): SS, IF, SC, SB, LM, and NP.
The contact author has declared that none of the authors has any competing interests.
Publisher's note: Copernicus Publications remains neutral with regard to jurisdictional claims made in the text, published maps, institutional affiliations, or any other geographical representation in this paper. While Copernicus Publications makes every effort to include appropriate place names, the final responsibility lies with the authors.
This research has been supported by the Horizon Europe Digital, Industry and Space (FOCCUS, grant no. 101133911); the Horizon Europe Food, Bioeconomy, Natural Resources, Agriculture and Environment (EDITO-Model Lab, grant no. 101093293); the Ministero dell'Università e della Ricerca (PNRR BIO, grant no. CN00000033); and RENOVATE – Convenzione n. 3 Bis, Decreto 81 del 15 March 2022, Autorità di Sistema Portuale del Mar Tirreno Centro Settentrionale.
This paper was edited by Ira Didenkulova and reviewed by Davide Vettori and one anonymous referee.
Abdolali, A., Hesser, T. J., Anderson Bryant, M., Roland, A., Khalid, A., Smith, J., Ferreira, C., Mehra, A., and Sikiric, M. D.: Wave attenuation by vegetation: model implementation and validation study, Frontiers in Built Environment, 8, https://doi.org/10.3389/fbuil.2022.891612, 2022. a, b, c
Alcoverro, T., Duarte, C. M., and Romero, J.: Annual growth dynamics of Posidonia oceanica: contribution of large-scale versus local factors to seasonality, Mar. Ecol. Prog. Ser., 120, 203–210, http://www.jstor.org/stable/24851876, 1995. a
Anderson, M. E. and Smith, J.: Wave attenuation by flexible, idealized salt marsh vegetation, Coast. Eng., 83, 82–92, 2014. a
Ardhuin, F., Rogers, E., Babanin, A. V., Filipot, J.-F., Magne, R., Roland, A., van der Westhuysen, A., Queffeulou, P., Lefévre, J. M., Aouf, L., and Collard, F.: Semiempirical dissipation source functions for ocean waves. Part I: Definition, calibration, and validation, J. Phys. Oceanogr., 40, 1917–1941, https://api.semanticscholar.org/CorpusID:9635698, 2009. a
Ardizzone, G., Belluscio, A., and Criscoli, A.: Atlante degli habitat dei fondali marini del Lazio. Regione Lazio, Direzione Regionale Capitale Naturale, Parchi e Aree Protette, ISBN 978-88-9377-088-0, 2018. a
Astraldi, M. and Gasparini, G.: The seasonal characteristics of the circulation in the Tyrrhenian Sea, in: Seasonal and Interannual Variability of the Western Mediterranean Sea, Vol. 46, 115–134, https://doi.org/10.1029/CE046p0115, 1994. a
Battjes, J. A. and Janssen, J. P. F. M.: Energy Loss and Set-Up Due to Breaking of Random Waves, American Society of Civil Engineers, https://doi.org/10.1061/9780872621909.034, 569–587, 1978. a
Beth Schaefer, R. and Nepf, H.: Wave damping by seagrass meadows in combined wave-current conditions, Limnol. Oceanogr., 67, 1554–1565, https://doi.org/10.1002/lno.12102, 2022. a, b
Beudin, A., Kalra, T. S., Ganju, N. K., and Warner, J. C.: Development of a coupled wave-flow-vegetation interaction model, Comput. Geosci., 100, 76–86, https://doi.org/10.1016/j.cageo.2016.12.010, 2017. a, b, c, d
Blender Community: Blender – a 3D modelling and rendering package, Blender Foundation, Blender v4.2.2, Blender Institute, Amsterdam, http://www.blender.org (last access: 16 July 2024), 1994. a
Bonamano, S., Paladini de Mendoza, F., Piermattei, V., Martellucci, R., Madonia, A., Gnisci, V., Mancini, E., Fersini, G., Burgio, C., Marcelli, M., Zappalà, G.: Mathematical models supporting the monitoring of Civitavecchia harbour (Rome), WIT Trans. Model. Sim., 59, 443–454, https://doi.org/10.2495/CMEM150401, 2015. a
Bonamano, S., Piermattei, V., Madonia, A., Paladini de Mendoza, F., Pierattini, A., Martellucci, R., Stefanì, C., Zappalà, G., Caruso, G., and Marcelli, M.: The Civitavecchia Coastal Environment Monitoring System (C-CEMS): a new tool to analyze the conflicts between coastal pressures and sensitivity areas, Ocean Sci., 12, 87–100, 2016. a
Bonamano, S., Piazzolla, D., Scanu, S., Mancini, E., Madonia, A., Piermattei, V., and Marcelli, M.: Modelling approach for the evaluation of burial and erosion processes on Posidonia oceanica meadows, Estuar. Coast. Shelf S., 254, 107321, https://doi.org/10.1016/j.ecss.2021.107321, 2021. a, b
Bonamano, S., Peviani, M. A., Burgio, C. G., Fersini, G., and Marcelli, M.: High resolution numerical modeling supporting the evaluation of the WaveSAX-2 power generation in the coastal area around the Civitavecchia port, EGU General Assembly 2023, Vienna, Austria, 24–28 Apr 2023, EGU23-7655, https://doi.org/10.5194/egusphere-egu23-7655, 2023. a
Bonamano, S., Federico, I., Causio, S., Piermattei, V., Piazzolla, D., Scanu, S., Madonia, A., Madonia, N., De Cillis, G., Jansen, E., Fersini, G., Coppini, G., and Marcelli, M.: River–coastal–ocean continuum modeling along the Lazio coast (Tyrrhenian Sea, Italy): assessment of near river dynamics in the Tiber delta, Estuar. Coast. Shelf S., 297, 108618, https://doi.org/10.1016/j.ecss.2024.108618, 2024. a
Borfecchia, F., Micheli, C., Cibic, T., Pignatelli, V., Cecco, L. D., Consalvi, N., Caroppo, C., Rubino, F., Poi, E. D., Kralj, M., and Negro, P. D.: Multispectral data by the new generation of high-resolution satellite sensors for mapping phytoplankton blooms in the Mar Piccolo of Taranto (Ionian Sea, southern Italy), Eur. J. Remote Sens., 52, 400–418, https://api.semanticscholar.org/CorpusID:197500904, 2019. a
Borum, J., Duarte, C., Krause-Jensen, D., and Greve, T.: European Seagrasses: An Introduction to Monitoring and Management, Monitoring and Managing of European Seagrasses Project, ISBN 87-89143-21-3, https://doi.org/10.25607/OBP-1997, 88, 2004. a
Bradley, K. and Houser, C.: Relative velocity of seagrass blades: implications for wave attenuation in low-energy environments, J. Geophys. Res.-Earth, 114, https://doi.org/10.1029/2007JF000951, 2009. a, b
Buia, M. C., Gambi, M. C., and Dappiano, M.: Seagrass systems, Biologia Marina Mediterranea, 11, 133–183, 2004. a
Catucci, E. and Scardi, M.: Modeling Posidonia oceanica shoot density and rhizome primary production, Sci. Rep.-UK, 10, 16978, https://doi.org/10.1038/s41598-020-73722-9, 2020. a
Causio, S., Ciliberti, S. A., Clementi, E., Coppini, G., and Lionello, P.: A modelling approach for the assessment of wave-currents interaction in the black sea, Journal of Marine Science and Engineering, 9, 893, https://doi.org/10.3390/jmse9080893, 2021. a
Causio, S., Federico, I., Jansen, E., Mentaschi, L., Ciliberti, S. A., Coppini, G., and Lionello, P.: The Black Sea near-past wave climate and its variability: a hindcast study, Frontiers in Marine Science, 11, 1406855, https://doi.org/10.3389/fmars.2024.1406855, 2024. a
Causio, S., Shirinov, S., Federico, I., De Cillis, G., Clementi, E., Mentaschi, L., and Coppini, G.: Coupling ocean currents and waves for seamless cross-scale modeling during Medicane Ianos, Ocean Sci., 21, 1105–1123, https://doi.org/10.5194/os-21-1105-2025, 2025. a
Cavaleri, L. and Rizzoli, P. M.: Wind wave prediction in shallow water: theory and applications, J. Geophys. Res.-Oceans, 86, 10961–10973, 1981. a
Clementi, E., Oddo, P., Drudi, M., Pinardi, N., Korres, G., and Grandi, A.: Coupling hydrodynamic and wave models: first step and sensitivity experiments in the Mediterranean Sea, Ocean Dynam., 67, 1293–1312, 2017. a
Contti Neto, N., Lowe, R. J., Ghisalberti, M., Pomeroy, A., Reidenbach, M., Conde-Frias, M., and da Silva, R. F.: Spectral wave energy dissipation by a seagrass meadow, J. Geophys. Res.-Oceans, 130, e2024JC020938, https://doi.org/10.1029/2024JC020938, 2025. a
Dalrymple, R. A., Kirby, J. T., and Hwang, P. A.: Wave diffraction due to areas of energy dissipation, Civil and Environmental Engineering, 110, 67–79, https://doi.org/10.1061/%28ASCE%290733-950X%281984%29110%3A1%2867%29, 1984. a, b
Di Maida, G., Tomasello, A., Sciandra, M., Pirrotta, M., Milazzo, M., and Calvo, S.: Effect of different substrata on rhizome growth, leaf biometry and shoot density of Posidonia oceanica, Mar. Environ. Res., 87, 96–102, 2013. a
Donelan, M. A., Curcic, M., Chen, S. S., and Magnusson, A. K.: Modeling waves and wind stress, J. Geophys. Res.-Oceans, 117, https://doi.org/10.1029/2011JC007787, 2012. a
Duarte, C. M.: Temporal biomass variability and production/biomass relationships of seagrass communities, Mar. Ecol. Prog. Ser., Oldendorf, 51, 269–276, 1989. a
Dubi, A. and Tørum, A.: Wave damping by kelp vegetation, Coastal Engineering Proceedings, 1, 142–154, https://doi.org/10.9753/icce.v24.%p, https://doi.org/10.1061/9780784400890.012, 1994. a
Eldeberky, Y.: Nonlinear transformationations of wave spectra in the nearshore zone, PhD thesis, Deflt University of Technology, Delft, the Netherlands, 203 pp., https://repository.tudelft.nl/record/uuid:707ca57d-81c3-4103-bc6e-aae1c90fce63 (last access: 23 September 2025), 1996. a
Elkalay, K., Frangoulis, C., Skliris, N., Goffart, A., Gobert, S., Lepoint, G., and Hecq, J.-H.: A model of the seasonal dynamics of biomass and production of the seagrass Posidonia oceanica in the Bay of Calvi (Northwestern Mediterranean), Ecol. Model., 167, 1–18, https://doi.org/10.1016/S0304-3800(03)00074-7, 2003. a, b
EMODnet Bathymetry Consortium: EMODnet Digital Bathymetry (DTM 2016), https://doi.org/10.12770/c7b53704-999d-4721-b1a3-04ec60c87238, 2016. a
Folkard, A. M.: Hydrodynamics of model Posidonia oceanica patches in shallow water, Limnol. Oceanogr., 50, 1592–1600, https://doi.org/10.4319/lo.2005.50.5.1592, 2005. a
Fonseca, M. S. and Cahalan, J. A.: A preliminary evaluation of wave attenuation by four species of seagrass, Estuar. Coast. Shelf S., 35, 565–576, https://doi.org/10.1016/S0272-7714(05)80039-3, 1992. a
Gacia, E. and Duarte, C. M.: Sediment retention by a Mediterranean Posidonia oceanica meadow: the balance between deposition and resuspension, Estuar. Coast. Shelf S., 52, 505–514, 2001. a
Geuzaine, C. and Remacle, J.-F.: Gmsh: A 3-D finite element mesh generator with built-in pre- and post-processing facilities, Int. J. Numer. Meth. Eng., 79, 1309–1331, https://doi.org/10.1002/nme.2579, 2009. a
Giovannetti, E., Lasagna, R., Montefalcone, M., Bianchi, C. N., Albertelli, G., and Morri, C.: Inconsistent responses to substratum nature in Posidonia oceanica meadows: an integration through complexity levels?, Chem. Ecol., 24, 83–91, https://doi.org/10.1080/02757540801966439, 2008. a
Giraud, G.: Recensement des floraisons de Posidonia oceanica (Linne) Delile en Mediterranee, Rapports et Proces-Verbaux des Reunions-Commission Internationale pour l'Exploration Scientifique de la Mer Mediterranee (CIESM). v. 24 (4), https://agris.fao.org/search/en/providers/123819/records/64735d46e17b74d222526e3b, 1977. a
Giraud, G., Boudouresque, C.-F., Cinelli, F., Fresi, E., and Mazzella, L.: Observations sur l'herbier de Posidonia oceanica (L.) Delile autour de l'Ile d'Ischia (Italie), Giornale botanico italiano, 113, 261–274, https://doi.org/10.1080/11263507909426647, 1979. a
Gnisci, V., de Martiis, S. C., Belmonte, A., Micheli, C., Piermattei, V., Bonamano, S., and Marcelli, M.: Assessment of the ecological structure of Posidonia oceanica (L.) Delile on the northern coast of Lazio, Italy (central Tyrrhenian, Mediterranean), Italian Botanist, 9, 1–19, 2020. a, b, c
Gupta, A., Behera, M. R., and Heidarpour, A.: Numerical Modeling of Wave Damping Induced by Emerged Moving Vegetation, in: International Conference on Offshore Mechanics and Arctic Engineering, Vol. 84379, American Society of Mechanical Engineers, V06AT06A013, https://doi.org/10.1115/OMAE2020-18588, 2020. a
Haklay, M. and Weber, P.: Openstreetmap: User-generated street maps, IEEE Pervasive Computing, 7, 12–18, https://doi.org/10.1109/MPRV.2008.80, 2008. a
Hasselmann, K., Barnett, T. P., Bouws, E., Carlson, H., Cartwright, D. E., Enke, K., Ewing, J. A., Gienapp, A., Hasselmann, D. E., Kruseman, P., Meerburg, A., Müller, P., Olbers, D. J., Richter, K., Shell, W., and Walden, H.: Measurements of wind-wave growth and swell decay during the Joint North Sea Wave Project (JONSWAP), Ergaenzungsheft zur Deutschen Hydrographischen Zeitschrift, Reihe A, 1973. a, b
Hasselmann, S. and Hasselmann, K. F.: Computations and Parameterizations of the Nonlinear Energy Transfer in a Gravity-Wave Spectrum. Part I: A New Method for Efficient Computations of the Exact Nonlinear Transfer Integral, J. Phys. Oceanogr., 15, 1369–1377, https://api.semanticscholar.org/CorpusID:129135885, 1985. a
Hemminga, M. A. and Duarte, C. M.: Seagrass Ecology, Cambridge University Press, ISBN 0521661846, 2000. a
Iacono, R., Napolitano, E., Palma, M., and Sannino, G.: The Tyrrhenian sea circulation: a review of recent work, Sustainability, 13, 6371, https://doi.org/10.3390/su13116371, 2021. a
Infantes, E., Orfila, A., Simarro, G., Terrados, J., Luhar, M., and Nepf, H.: Effect of a seagrass (Posidonia oceanica) meadow on wave propagation, Mar. Ecol. Prog. Ser., 456, 63–72, https://doi.org/10.3354/meps09754, 2012. a, b, c, d, e, f, g, h, i, j, k, l
Jacob, B., Dolch, T., Wurpts, A., and Staneva, J.: Evaluation of seagrass as a nature-based solution for coastal protection in the German Wadden Sea, Ocean Dynam., 73, 699–727, https://doi.org/10.1007/s10236-023-01577-5, 2023. a, b, c, d
Jeong, J.-S. and Lee, H. S.: Unstructured grid-based river–coastal ocean circulation modeling towards a digital twin of the Seto Inland Sea, Appl. Sci.-Basel, 13, https://doi.org/10.3390/app13148143, 2023. a
Koftis, T., Prinos, P., and Stratigaki, V.: Wave damping over artificial Posidonia oceanica meadow: a large-scale experimental study, Coast. Eng., 73, 71–83, https://doi.org/10.1016/j.coastaleng.2012.10.007, 2013. a
Korres, G., Oikonomou, C., Denaxa, D., and Sotiropoulou, M.: Mediterranean Sea Waves Analysis and Forecast (Copernicus Marine Service MED-Waves, MEDWAM4 system) (Version 1), Copernicus Marine Service [data set], https://doi.org/10.25423/CMCC/MEDSEA_ANALYSISFORECAST_WAV_006_017_MEDWAM4, 2023. a
Lei, J. and Nepf, H.: Wave damping by flexible vegetation: connecting individual blade dynamics to the meadow scale, Coast. Eng., 147, 138–148, https://doi.org/10.1016/j.coastaleng.2019.01.008, 2019. a, b, c
Luhar, M. and Nepf, H.: Wave-induced dynamics of flexible blades, J. Fluid Struct., 61, 20–41, https://doi.org/10.1016/j.jfluidstructs.2015.11.007, 2016. a, b, c, d, e, f
Luhar, M. and Nepf, H. M.: Flow-induced reconfiguration of buoyant and flexible aquatic vegetation, Limnol. Oceanogr., 56, 2003–2017, https://doi.org/10.4319/lo.2011.56.6.2003, 2011. a, b, c
Løvås, S. M. and Tørum, A.: Effect of the kelp Laminaria hyperborea upon sand dune erosion and water particle velocities, Coast. Eng., 44, 37–63, https://doi.org/10.1016/S0378-3839(01)00021-7, 2001. a
Madsen, J. D., Chambers, P. A., James, W. F., Koch, E. W., and Westlake, D. F.: The interaction between water movement, sediment dynamics and submersed macrophytes, Hydrobiologia, 444, 71–84, https://doi.org/10.1023/A:1017520800568, 2001. a
Manca, E., Cáceres, I., Alsina, J., Stratigaki, V., Townend, I., and Amos, C.: Wave energy and wave-induced flow reduction by full-scale model Posidonia oceanica seagrass, Cont. Shelf Res., 50–51, 100–116, https://doi.org/10.1016/j.csr.2012.10.008, 2012. a
Marbà, N., Díaz-Almela, E., and Duarte, C. M.: Mediterranean seagrass (Posidonia oceanica) loss between 1842 and 2009, Biol. Conserv., 176, 183–190, https://doi.org/10.1016/j.biocon.2014.05.024, 2014. a
Marcelli, M., Piermattei, V., Bonamano, S., Causio, S., Ceccherelli, G., Coppini, G., De Lucia, G. A., Del Negro, P., Falace, A., Federico, I., Madonia, A., Mentaschi, L., Piazzolla, D., Pinardi, N., Sarà, G., Savini, A., Scanu, S., and Fersini, G.: RENOVATE Project: ecosystem approach for compensation and mitigation actions in the coastal marine environment, in: EGU General Assembly Conference Abstracts, EGU-13554, https://doi.org/10.5194/egusphere-egu23-13554, 2023. a
Mendez, F. J. and Losada, I. J.: An empirical model to estimate the propagation of random breaking and nonbreaking waves over vegetation fields, Coast. Eng., 51, 103–118, https://doi.org/10.1016/j.coastaleng.2003.11.003, 2004. a, b, c
Mentaschi, L., Vousdoukas, M., Montblanc, T. F., Kakoulaki, G., Voukouvalas, E., Besio, G., and Salamon, P.: Assessment of global wave models on regular and unstructured grids using the unresolved obstacles source term, Ocean Dynam., 70, 1475–1483, 2020. a
Molenaar, H., Barthélémy, D., de Reffye, P., Meinesz, A., and Mialet, I.: Modelling architecture and growth patterns of Posidonia oceanica, Aquat. Bot., 66, 85–99, https://doi.org/10.1016/S0304-3770(99)00071-6, 2000. a
Nowacki, D. J., Beudin, A., and Ganju, N. K.: Spectral wave dissipation by submerged aquatic vegetation in a back-barrier estuary, Limnol. Oceanogr., 62, 736–753, https://doi.org/10.1002/lno.10456, 2017. a
Oprandi, A., Mucerino, L., De Leo, F., Bianchi, C., Morri, C., Azzola, A., Benelli, F., Besio, G., Ferrari, M., and Montefalcone, M.: Effects of a severe storm on seagrass meadows, Sci. Total Environ., 748, 141373, https://doi.org/10.1016/j.scitotenv.2020.141373, 2020. a
Ott, J. A.: Growth and production in Posidonia Oceanica (L.) Delile, Marine Ecology, 1, 47–64, https://doi.org/10.1111/j.1439-0485.1980.tb00221.x, 1980. a, b, c
Owens, R. and Hewson, T.: ECMWF Forecast User Guide, Tech. rep., ECMWF, Reading, https://doi.org/10.21957/m1cs7h, 2018. a
Paul, M., Bouma, T., and Amos, C.: Wave attenuation by submerged vegetation: combining the effect of organism traits and tidal current, Mar. Ecol. Prog. Ser., 444, 31–41, https://doi.org/10.3354/meps09489, 2012. a
Pergent-Martini, C., Pergent, G., Monnier, B., Boudouresque, C.-F., Mori, C., and Valette-Sansevin, A.: Contribution of Posidonia oceanica meadows in the context of climate change mitigation in the Mediterranean Sea, Marine Environmental Research, 165, 105236, https://doi.org/10.1016/j.marenvres.2020.105236, 2021. a
Piazzolla, D., Scanu, S., Mancuso, F. P., Bosch-Belmar, M., Bonamano, S., Madonia, A., Scagnoli, E., Tantillo, M. F., Russi, M., Savini, A., Fersini, G., Sarà, G., Coppini, G., Marcelli, M., and Piermattei, V.: An integrated approach for the benthic habitat mapping based on innovative surveying technologies and ecosystem functioning measurements, Sci. Rep.-UK, 14, 5888, https://doi.org/10.1038/s41598-024-56662-6, 2024. a
Pillai, U. P. A., Pinardi, N., Alessandri, J., Federico, I., Causio, S., Unguendoli, S., Valentini, A., and Staneva, J.: A digital twin modelling framework for the assessment of seagrass nature based solutions against storm surges, Sci. Total Environ., 847, https://doi.org/10.1016/j.scitotenv.2022.157603, 2022. a, b, c, d, e
Remacle, J.-F., Henrotte, F., Carrier-Baudouin, T., Béchet, E., Marchandise, E., Geuzaine, C., and Mouton, T.: A frontal Delaunay quad mesh generator using the L∞ norm, Int. J. Numer. Meth. Eng., 94, 494–512, https://doi.org/10.1002/nme.4458, 2013. a
Ricchiuto, M., Csík, Á., and Deconinck, H.: Residual distribution for general time-dependent conservation laws, J. Comput. Phys., 209, 249–289, https://api.semanticscholar.org/CorpusID:120849657, 2005. a
Roelvink, D., Reniers, A., Van Dongeren, A., De Vries, J. V. T., McCall, R., and Lescinski, J.: Modelling storm impacts on beaches, dunes and barrier islands, Coast. Eng., 56, 1133–1152, 2009. a
Sánchez-González, J. F., Sánchez-Rojas, V., and Memos, C. D.: Wave attenuation due to Posidonia oceanica meadows, J. Hydrol., 49, 503–514, https://doi.org/10.1080/00221686.2011.552464, 2011. a, b
Sharmar, V. D., Markina, M. Y., and Gulev, S. K.: Global ocean wind-wave model hindcasts forced by different reanalyzes: a comparative assessment, J. Geophys. Res.-Oceans, 126, e2020JC016710, https://doi.org/10.1029/2020JC016710, 2021. a
Shirinov, S.: WaveWatch III v6.07.1 with the extentions of flexible vegetation and seasonal growth patterns, Zenodo [code], https://doi.org/10.5281/zenodo.17201365, 2025. a
Stratigaki, V., Manca, E., Prinos, P., Losada, I. J., Lara, J. L., Sclavo, M., Amos, C. L., Cáceres, I., and and, A. S.-A.: Large-scale experiments on wave propagation over Posidonia oceanica, J. Hydrol., 49, 31–43, https://doi.org/10.1080/00221686.2011.583388, 2011. a
Suzuki, T. and Dijkstra, J.: Wave propagation over strongly varying topography: cliffs and vegetation, in: 32nd Congress of IAHR, the international Association of Hydraulic Engineering and Research, Venice, Italy, edited by: Prince Sultan Bin Abdulaziz, 1–10, Corila, https://resolver.tudelft.nl/uuid:64cbabbf-125d-4abf-808b-e94e0133b132 (last access: 22 January 2025), 2007. a
Suzuki, T., Zijlema, M., Burger, B., Meijer, M. C., and Narayan, S.: Wave dissipation by vegetation with layer schematization in SWAN, Coast. Eng., 59, 64–71, https://doi.org/10.1016/j.coastaleng.2011.07.006, 2012. a
Telesca, L., Belluscio, A., Criscoli, A., Ardizzone, G., Apostolaki, E. T., Fraschetti, S., Gristina, M., Knittweis, L., Martin, C. S., Pergent, G., Alagna, A., Badalamenti, F., Garofalo, G., Gerakaris, V., Louise Pace, M., Pergent-Martini, C., and Salomidi, M.: Seagrass meadows (Posidonia oceanica) distribution and trajectories of change, Sci. Rep.-UK, 5, 12505, https://doi.org/10.1038/srep12505, 2015. a
Tolman, H. L.: Effects of numerics on the physics in a third-generation wind-wave model, J. Phys. Oceanogr., 22, 1095–1111, 1992. a
Touchette, B. W. and Burkholder, J. M.: Overview of the physiological ecology of carbon metabolism in seagrasses, J. Exp. Mar. Biol. Ecol., 250, 169–205, 2000. a
Unguendoli, S., Biolchi, L. G., Aguzzi, M., Pillai, U. P. A., Alessandri, J., and Valentini, A.: A modeling application of integrated nature based solutions (NBS) for coastal erosion and flooding mitigation in the Emilia-Romagna coastline (Northeast Italy), Sci. Total Environ., 867, 161357, https://doi.org/10.1016/j.scitotenv.2022.161357, 2023. a
Vassallo, P., Paoli, C., Rovere, A., Montefalcone, M., Morri, C., and Bianchi, C. N.: The value of the seagrass Posidonia oceanica: a natural capital assessment, Mar. Pollut. Bull., 75, 157–167, https://doi.org/10.1016/j.marpolbul.2013.07.044, 2013. a
Vetrano, A., Napolitano, E., Iacono, R., Schroeder, K., and Gasparini, G. P.: Tyrrhenian Sea circulation and water mass fluxes in spring 2004: observations and model results, J. Geophys. Res.-Oceans, 115, https://doi.org/10.1029/2009JC005680, 2010. a
Vettori, D., Pezzutto, P., Bouma, T. J., Shahmohammadi, A., and Manes, C.: On the wave attenuation properties of seagrass meadows, Coast. Eng., 189, 104472, https://doi.org/10.1016/j.coastaleng.2024.104472, 2024. a, b
Vettori, D., Giordana, F., and Manes, C.: Turbulence enhances wave attenuation of seagrass in combined wave–current flows, P. Natl. Acad. Sci. USA, 122, e2414150122, https://doi.org/10.1073/pnas.2414150122, 2025. a
WW3DG: User Manual and System Documentation of WAVEWATCH III, NOAA/NWS/NCEP/MMAB, College Park, MD, USA, https://polar.ncep.noaa.gov/waves/wavewatch (last access: 10 July 2025), 2019. a
Zhang, X., Lin, P., Gong, Z., Li, B., and Chen, X.: Wave attenuation by Spartina alterniflora under macro-tidal and storm surge conditions, Wetlands, 40, https://doi.org/10.1007/s13157-020-01346-w, 2020. a
Zupo, V., Buia, M., and Mazzella, L.: A production model for Posidonia oceanica based on Temperature, Estuar. Coast. Shelf S., 44, 483–492, https://doi.org/10.1006/ecss.1996.0137, 1997. a, b