the Creative Commons Attribution 4.0 License.
the Creative Commons Attribution 4.0 License.
 | 11 Sep 2025
Constraining landslide frequency across the United States to inform county-level risk reduction
Jacob B. Woodard
Janice L. Bytheway
Gina M. Belair
Benjamin B. Mirus
Informative landslide hazard estimates are needed to support landslide mitigation strategies to reduce landslide risk across the United States. Whereas existing national-scale landslide susceptibility products assess where landslides are likely to occur, they do not address how often, which is a critical element of landslide hazard and risk assessments. In particular, the U.S. Federal Emergency Management Agency's National Risk Index (NRI) requires landslide frequency estimates to inform expected annual loss estimates. We present county-level landslide frequency (landslides per area per year) estimates for the 50 US states. We applied Bayesian negative binomial regression to estimate both the expected (average) reported landslide frequency and full distribution of annual landslide counts for each county. We compared a suite of models that used combinations of landslide-susceptible area, probability of potentially triggering earthquakes, frequency of potentially triggering precipitation, and ecological region as predictors. We trained our models with landslide inventory data from counties with the most comprehensive records available nationwide and used zero-inflated negative binomial distributions as an incompleteness model to correct for temporal reporting gaps. We selected a preferred frequency model to inform the NRI based on information criteria and physically plausible parameter estimates. The model showed that average annual reported landslide frequencies vary by 5 orders of magnitude across US counties, ranging from 0.002 (0.00015–0.05) landslides 1000 km−2 yr−1 in Kusilvak Census Area, Alaska, to 29 (19–46) landslides 1000 km−2 yr−1 in Lake County, California, reflecting the country's strong variations in landslide susceptibility, earthquake probability, and other factors for which ecological region serves as a proxy. Counties with estimated frequencies in the top 20 % of all counties are predominately along the West Coast of the continental United States, in mountainous regions of the Pacific Northwest and Intermountain West, in locally steep or earthquake-prone regions of the Midwest and Southeast, along the Appalachians, in southern and southeastern Alaska, and on some Hawaiian islands. By examining the number of landslides predicted in 99th percentile years for each county, we identified that 26 % of US counties likely have potential for widespread landsliding with more than 10 landslides 1000 km−2 yr−1, even when such large events have not been reported in the training data for that county. Overall, our results better represent the range of possible landslide frequencies and spatial variations than previous national-scale estimates reported in the NRI, and our approach can inform other risk-reduction and loss-mitigation efforts across the United States and globally.
- Article
(13159 KB) - Full-text XML
- BibTeX
- EndNote


Informative landslide hazard estimates are needed to support landslide mitigation strategies and reduce landslide risk across the United States (Godt et al., 2022). Landslides claim lives annually in the United States (Froude and Petley, 2018; National Research Council, 1985), and the landslide-related economic losses estimated decades ago (Schuster, 1996) would amount to USD 3–6 billion annually in 2024 US dollars (U.S. Bureau of Labor Statistics, 2024). Changes in climate and land use, including urban development in steeper terrain, are expected to have increased these losses in recent years and are likely to continue to do so in the future, unless effective mitigation practices are implemented (Gariano and Guzzetti, 2016; Ozturk et al., 2022). To address this major economic disruption, the United States Geological Survey (USGS) developed a National Strategy for Landslide Loss Reduction (Godt et al., 2022). This strategy calls for developing a publicly accessible national landslide hazard and risk database to ensure that decision-makers have access to nationwide information on landslide hazards and risk, among other goals. In this context, the USGS is working with the Federal Emergency Management Agency (FEMA) to improve the quantitative characterization of landslide hazards in ongoing updates to their National Risk Index (NRI) (Federal Emergency Management Agency, 2023a; Zuzak et al., 2022).
The NRI is a relative metric of community-level risk assessed across 18 natural hazards, including landslides (Zuzak et al., 2022). The index combines expected annual loss estimates for each of these hazards with social vulnerability and community resilience scores for each US county and census tract (Federal Emergency Management Agency, 2023b). Expected annual loss is a common metric used to quantify risk from natural hazards and results from multiplying the expected, or average, frequency of a hazard with the population exposed and a historical loss ratio that quantifies loss resulting from past events.
Landslide frequency, which we define as landslides per area per time interval (Corominas and Moya, 2008), is a critical component of expected annual loss and thus risk but has rarely been assessed, particularly at the scale of the entire United States (Corominas et al., 2014; Glade and Crozier, 2005). Many studies have assessed landslide susceptibility at local to continental scales (Reichenbach et al., 2018), which indicates how prone an area is to landsliding and addresses the question “where are landslides likely to occur?” For example, the USGS recently published the National Landslide Susceptibility Model, which estimates landslide susceptibility based on topographic characteristics for the 50 US states and Puerto Rico (Mirus et al., 2024). Few studies, however, have assessed frequency, which incorporates temporal probability and addresses the question “how often are landslides likely to occur in a given area?” (Corominas and Moya, 2008; Dahal et al., 2024a; Guzzetti et al., 2005; Ko and Lo, 2018; Lombardo et al., 2020). Differences in the frequency of occurrence of landslide-triggering conditions, the most common of which in the United States are large earthquakes and precipitating storms, can drive differences in landslide frequency between areas that are equally susceptible to landsliding. For example, a steep area in an earthquake-prone wet region will likely have a higher landslide frequency than a similarly steep area in a non-earthquake-prone dry region. When combined with estimates of magnitude (how large are landslides likely to be?), susceptibility and frequency make up the key components of the most widely accepted definition of landslide hazard (Crozier and Glade, 2005; Dahal et al., 2024a; Guzzetti et al., 2005).
Landslide hazard estimates typically rely on either physics-based models of landslide processes or statistical models trained with historical records of landslide occurrences over time (Corominas et al., 2014). Physics-based models attempt to explicitly account for the geotechnical attributes of hillslopes to estimate the frequency of conditions that will lead to slope failure (Baum et al., 2010; Frattini et al., 2009; Iverson, 2000; Jibson, 2011; Salvatici et al., 2018). Consequently, these methods require detailed in situ data of local hillslopes to be accurate. Such data are highly heterogeneous and hard to estimate remotely, making it difficult to obtain accurate results over regions larger than catchment-scale. Alternatively, statistical and machine learning models analyze the patterns of past landslide events to estimate landslide hazard (Bordoni et al., 2021; Dahal et al., 2024b; Di Napoli et al., 2023; Guzzetti et al., 2005; Lari et al., 2014; Marc et al., 2017; Segoni et al., 2018). These methods are generally preferred for assessing landslide hazard over regions larger than a few catchments because they require less data compared to physics-based models.
Nevertheless, both data-driven and physics-based methods require accurate inventories of landslide timing and location over a sufficiently long temporal range to evaluate the validity of estimated landslide frequency (Corominas and Moya, 2008; Lombardo et al., 2020). The need for accurate landslide data presents a substantial challenge, because landslide reporting is often spatially and temporally heterogeneous, even over small regions. As a result, application of statistical hazard models has generally been reserved for regional analyses in data-rich parts of the world (Bordoni et al., 2021; Guzzetti et al., 2005; Ko and Lo, 2018; Lombardo et al., 2020). Landslide inventory data are presence-only data, meaning that although inventories document reported landslides, some landslides that occur may go unreported. Landslide inventories thus reflect a combination of physical landslide processes and reporting processes. Failing to account for the reporting process can bias models and lead to incorrect estimates (Steger et al., 2021).
The USGS maintains a National Landslide Inventory (Mirus et al., 2020), which is compiled from multiple federal, state, and local agencies, as well as academic publications and historical records from across the United States. The compilation is updated intermittently, and the current iteration (version 3.0, February 2025) compiled reported landslides from 55 local, state, and national-scale inventories (Belair et al., 2025). These reports are vector geospatial data containing points or polygons that represent slope failures along with a diverse set of attributes that may include time of occurrence. We use “landslide” as an overarching term to describe the range of slope failure types reported in these inventories which, where documented, include slides, falls, flows, and complex movements, among others. Inventories included in the compilation have different reporting approaches that capture different aspects of landslide frequency. Inventories compiled by transportation departments, like the Alaska Department of Transportation inventory (Alaska Department of Transportation and Public Facilities, 2022), for example, capture only landslides that impacted the road network but may do so consistently over a given timeframe. In contrast, event-based inventories, like the USGS San Francisco Bay region 2016–2017 inventory (Corbett and Collins, 2023b), often map landslides triggered by storms or earthquakes during a short time period from optical imagery or high-resolution topographic data and tend to be more spatially complete over the domain mapped, but they only capture individual events in time. Bringing such diverse inventories together to estimate landslide frequencies over broader regions has shown promise in the Pacific Northwest region of the United States (Luna and Korup, 2022) but has yet to be attempted at the near-continental scale. However, an additional challenge is that many landslide-susceptible regions of the United States completely lack temporal constraints on when landslides have occurred. Previous releases of the NRI estimated landslide frequency from events reported between 2010 and 2021 in the National Aeronautics and Space Administration (NASA)'s Cooperative Open Online Landslide Repository (COOLR), which compiled landslides from news and citizen reports (Juang et al., 2019). As the reporting method of this catalog captures only events reported in the news or by citizens, it represents a small subset of all landslides that occurred over the reporting period and does not capture the high numbers of landslides triggered during widespread events. Noting that many landslide-susceptible regions of the United States had no reported landslides in this catalog, the NRI authors chose a default minimum value of 0.01 landslides per year for census tracts in these areas, which were later aggregated to county level (Federal Emergency Management Agency, 2023b). This approach likely misrepresents the true number of landslides, and hence landslide frequencies, and may not adequately portray the spatial pattern of landslide hazard across the United States.
In this study, we estimated landslide frequency distributions for all counties in the 50 US states as input to the 2025 update of the NRI. We introduced a pragmatic and adaptable Bayesian statistical modelling framework for estimating landslide frequency distributions, modelled as counts per area per year, at a near continental scale. We compared models trained with the best available landslide inventory data from 316 counties nationwide and varying combinations of relative indicators of county-level landslide susceptibility, frequency of potentially landslide-triggering precipitation, probability of potentially landslide-triggering earthquakes, and ecology as predictors. We then predicted landslide frequencies for all 3144 counties in the 50 US states and the District of Columbia (U.S. Census Bureau, 2023a), the majority of which lacked landslide records with reported timing. Bayesian statistical models have advantages for estimating components of landslide hazard from spatially and temporally heterogeneous inventory data (Bryce et al., 2022; Korup et al., 2024; Lombardo et al., 2020; Luna and Korup, 2022; Woodard et al., 2023). First, Bayesian statistical models are conditional on the available data, the model, and prior knowledge about parameter values. The obtained posterior parameter distributions, which show the probability of possible parameter estimates, allow us to transparently report model uncertainty given the available landslide inventory data (McElreath, 2020; van de Schoot et al., 2021). Second, by incorporating prior knowledge about a model's parameters to estimate final values, models can consider the users' expectations of what a parameter value should be to overcome sparse data issues in some regions (Patton et al., 2023; Woodard et al., 2023). Finally, Bayesian models provide frameworks that allow for updating model parameters in light of new data, meaning that if new landslide data are collected in the future, parameter estimates can be seamlessly updated. Our modelling approach can thus overcome some of the limitations associated with spatially and temporally heterogenous landslide inventory data. However, we emphasize that we estimate what reported landslide frequencies would be if each county had available landslide inventory data like counties with the most comprehensive data nationwide. Our consistent estimates across counties are reported to promote an equitable allocation of resources and support improved resilience to landslide hazards (Dowling and Santi, 2014; Pollock and Wartman, 2020; Santi et al., 2011).
We used Bayesian negative binomial regression trained on the best available landslide inventory data nationwide and physically relevant predictors to estimate county-scale landslide frequency distributions. To do so, we
-
collected landslide inventory data with reported annual timing,
-
selected training counties based on data quality and coverage criteria,
-
corrected historical inventory time series for reporting gaps using zero-inflated negative binomial distributions as an incompleteness model,
-
chose physically relevant predictor variables at county scale,
-
fit a series of Bayesian negative binomial regression models with varying combinations of predictors to training counties,
-
compared models using information criteria to identify a preferred model with the highest estimated out-of-sample predictive accuracy and physically plausible parameter estimates,
-
used the preferred negative binomial regression model to predict landslide frequency distributions for all counties,
-
evaluated the model fit by comparing predictions to observations and its robustness by performing training–test cross-validation,
-
compared our results to previous landslide frequency estimates from the NRI.
Our visualizations rely largely on color schemes from scientific color maps (Crameri, 2023) and ColorBrewer (Brewer et al., 2013).
2.1 Landslide inventory data with reported annual timing
We used the most recent version of the USGS Landslide Inventories Across the United States compilation (Belair et al., 2025), which includes 991 272 landslides reported in 55 inventories created by local, state, and national entities. These inventories reflect a variety of reporting protocols, cover varying time periods and regions, and document a range of slope failure types. For this analysis, we first subset the compilation to landslides with a reported year of occurrence (189 282 landslides). We then removed duplicates by (1) checking for points that overlap polygons and were reported in the same year, which can happen in inventories that include both point and polygon layers for the same slope failures, and (2) dissolving polygons that touch each other and were reported in the same year, which can occur when inventories map source and deposition areas separately for the same landslide, for example. Limiting our spatial domain to the 50 US states leaves 77 714 landslides from 33 inventories for further analysis (Table A1). By examining the time series for each inventory, we categorized these inventories into two classes with different reporting styles that affect the resulting time series of landslide occurrences: historical and event-based inventories. Historical inventories report landslides over an extended period of time that may include reporting gaps, and event-based inventories report landslides from specific events, like individual earthquakes or storms. For our training dataset, we selected counties that have at least one landslide reported in a historical inventory created by a state or local entity (Table A1), which gives 316 training counties with 62 720 reported landslides (Fig. 1). We assumed that these inventories have more reliable reporting over time than inventories created by national or other entities.
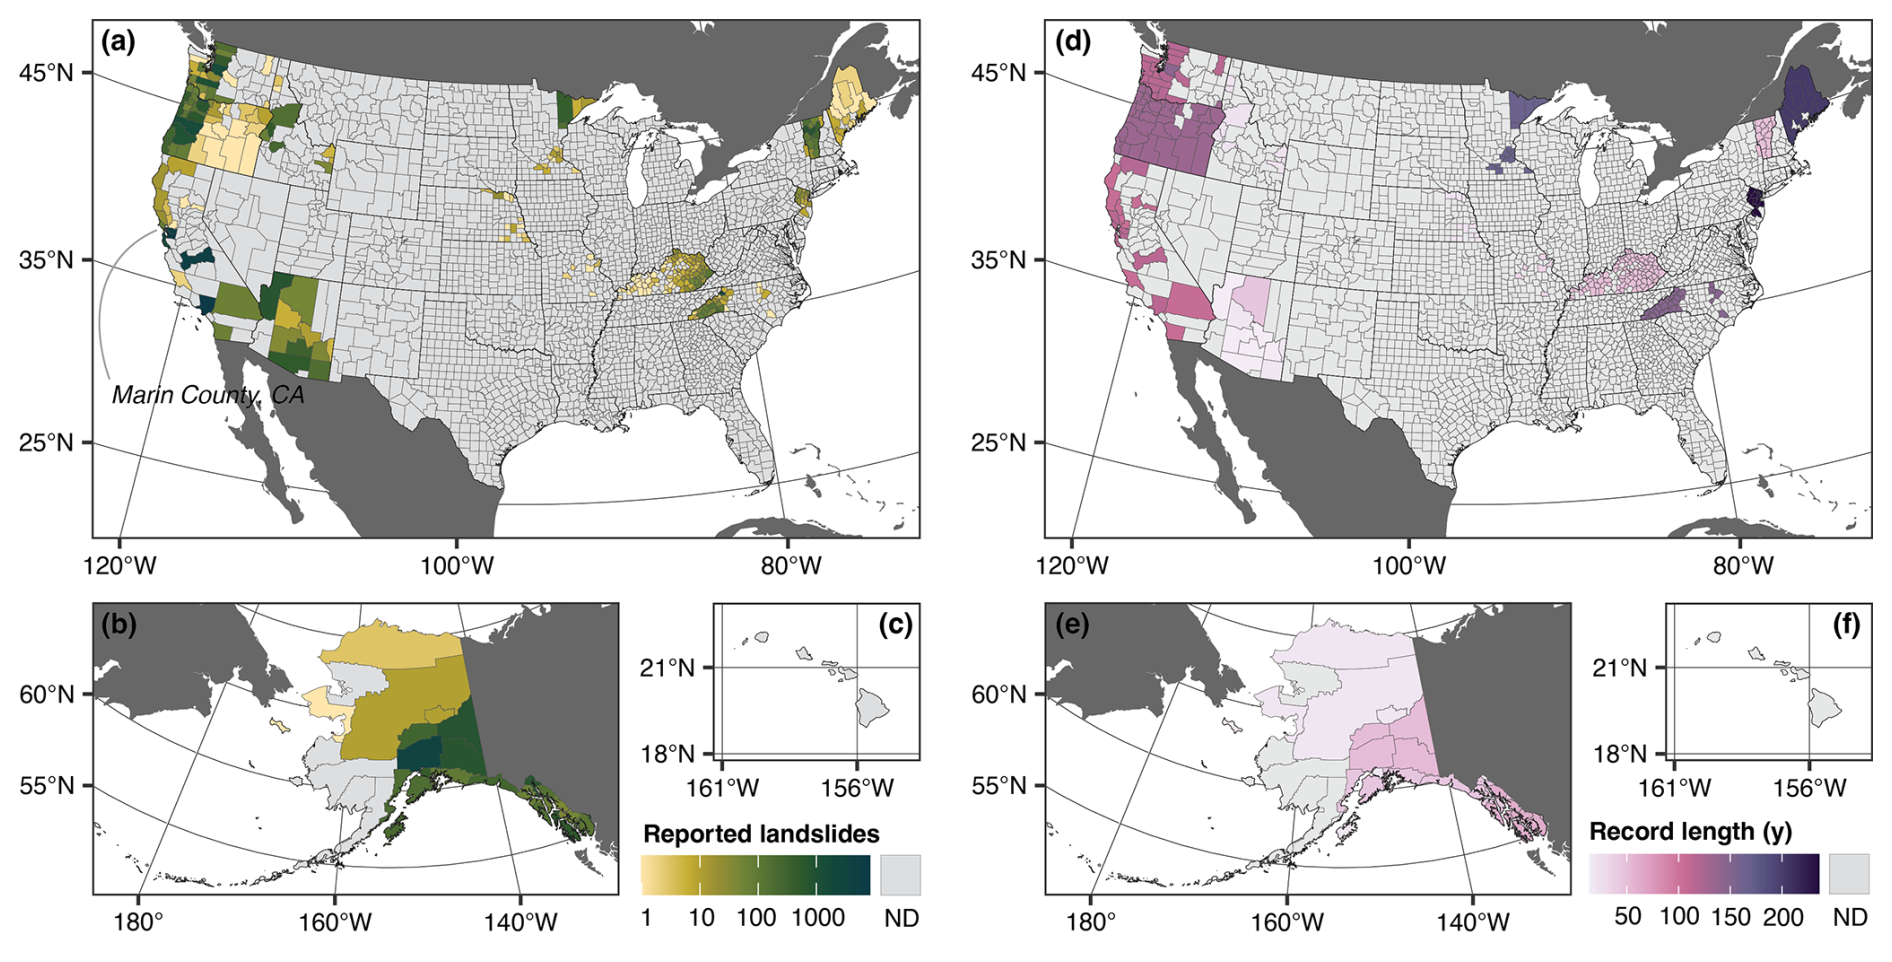
Figure 1Reported landslides with annual timing in counties covered by state or local historical landslide inventories. (a–c) Total number of reported landslides with annual timing. ND = no data. (d–f) Length of records from earliest to latest reported landslide. ND = no data. Base map data in panels (a)–(f): US counties from U.S. Census Bureau Cartographic Boundary Files 1 : 500 000 (U.S. Census Bureau, 2023b), non-US administrative boundaries from Natural Earth (Natural Earth, 2022). Landslide inventory data subset from the USGS Landslide Inventories across the United States dataset (Belair et al., 2025). Projection and datum: (a, d) continental United States – Albers North American Datum 1983 (EPSG:5070); (b, e) Alaska – Albers North American Datum 1983 (EPSG:3467); (c, f) Hawaii – Old Hawaiian (EPSG:4135).
2.2 Constructing reporting-gap-corrected time series
We selected negative binomial distributions to model landslide frequency (landslides per area per year). Although negative binomial and related distributions have been widely used in fields like ecology (e.g., Minami et al., 2007) and public health (e.g., Rose et al., 2006), they have seen little use in landslide research. Negative binomial distributions are suitable for modelling counts, which in our case is the reported number of landslides in a year in a given area (White and Bennetts, 1996). Distributions of annual landslide counts per county in our dataset were typically heavily right-skewed, with few years showing many reported landslides and with many years showing few reported landslides, as well as over-dispersed, with variances that exceeded means (Fig. 2). The negative binomial distribution can capture over-dispersion with its two parameters: a rate parameter (μ) that indicates the expected or average frequency and a shape parameter (φ), which together control the variance. We therefore preferred it to the Poisson distribution, an alternative count distribution that requires the mean and variance to be equal (White and Bennetts, 1996). To train our landslide frequency models (refer to Sect. 2.4), we needed time series of landslide counts by county.
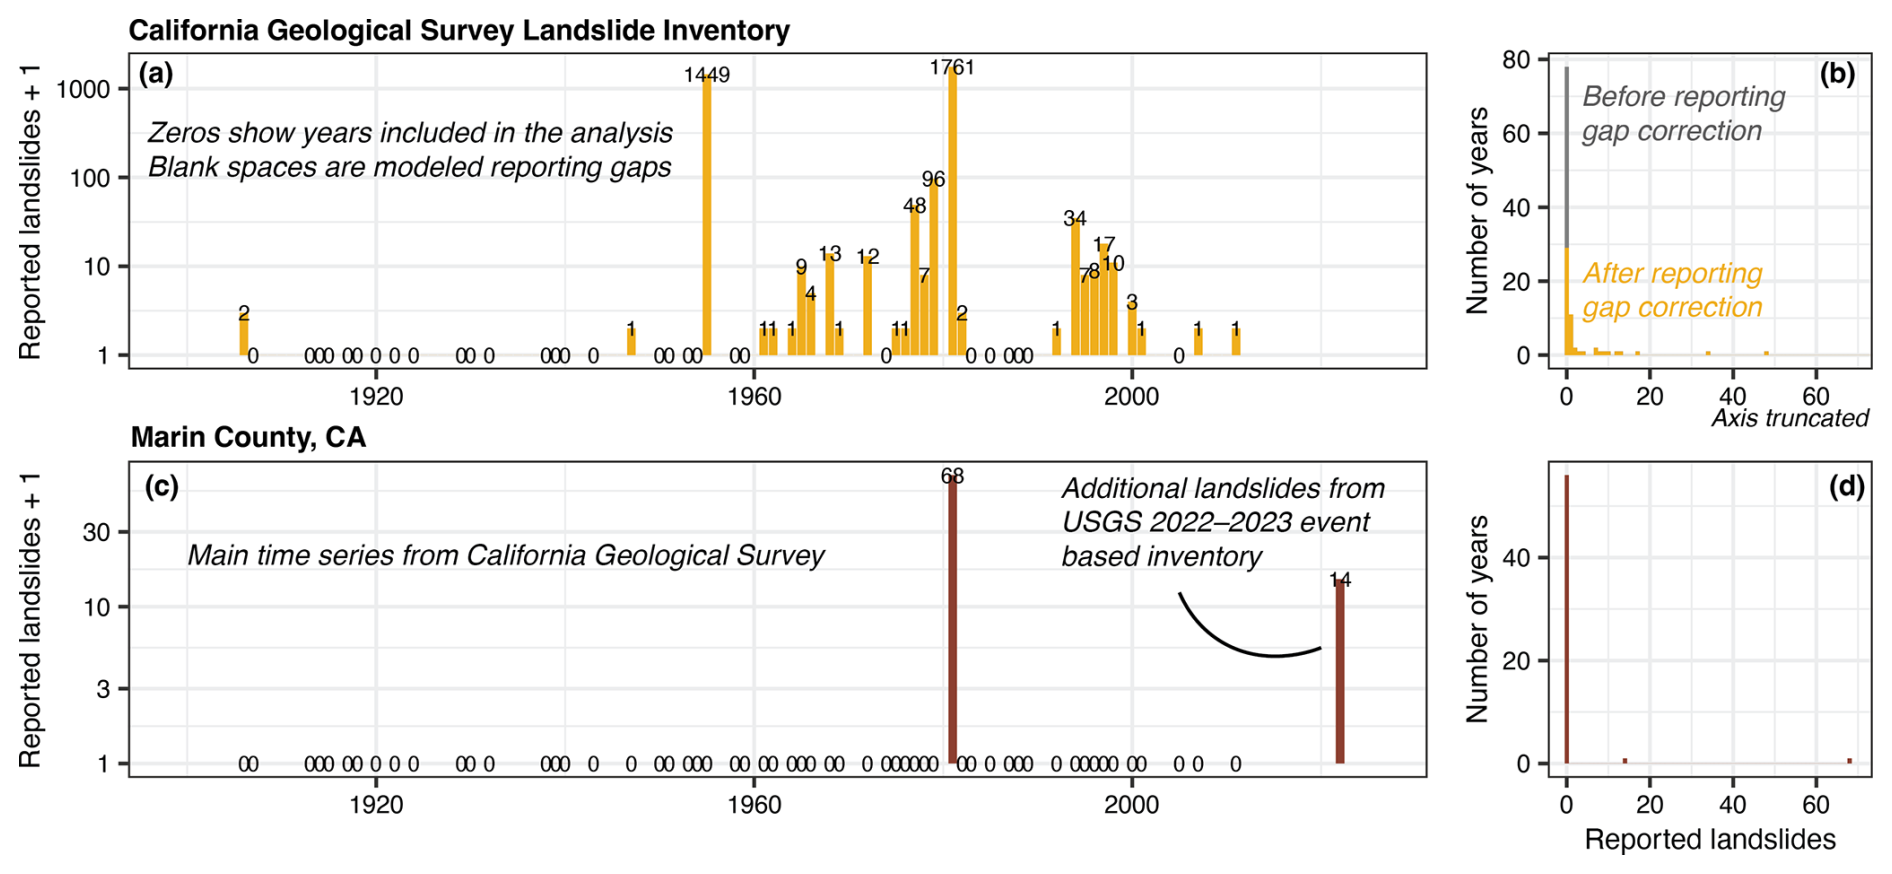
Figure 2Constructing reporting-gap-corrected county-level time series. (a) Example time series and (b) histogram of reported landslides from the California Geological Survey (2019) landslide inventory, showing the effect of the reporting-gap-correction model. (c) Example time series and (d) histogram of reported landslides in Marin County, California (CA) (Fig. 1a), showing how a county-level time series is constructed.
Historical landslide inventory time series often feature reporting gaps that, if unaccounted for, can lead to underestimated landslide frequencies. These gaps arise from the reporting protocols used to construct the inventory. We chose to correct for these gaps at the inventory level to take advantage of information on reporting contained in the inventory time series before breaking these down to the county level. Conceptually, we consider that for each inventory there is a switch that turns recording “on”, resulting in a period during which landslide occurrences are documented, or “off”, resulting in a reporting gap. Knowing the position of this switch at any given time is needed for accurate landslide frequency estimates but is rarely documented in landslide inventory data. For event-based inventories, which are designed to capture individual events, the position is always known: if landslides are reported, the switch is on; if no landslides are reported, the switch is off. For historical inventories, however, the position is only known when it is on: if landslides are reported, the switch is on; if no landslides are reported, the position is unknown, unless otherwise documented. The California Geological Survey (2019) landslide inventory, for example, has documented landslides between 1906 and 2011 but contains several multiple-year periods with no reported landslides (Fig. 2a). These periods can occur either because recording was on but no landslides occurred or because recording was off. Without documentation of when reporting gaps occurred, we are left to estimate these from the inventory time series itself. Two simple solutions to this challenge present disadvantages: (1) taking the full time series from the first reported to last reported landslide will likely lead to underestimated frequencies, because too many zeros resulting from reporting gaps enter the model, but (2) assuming that all zeros result from reporting gaps and removing these from the time series would likely lead to overestimation, as some years with few to no landslides could be expected, e.g., during droughts. Instead, we designed a statistical incompleteness model to estimate the fraction of zeros in each inventory time series that are true non-occurrences and the fraction that is due to reporting gaps.
We chose zero-inflated negative binomial distributions as an incompleteness model to characterize these gaps at the inventory level for each historical inventory. Assuming that landslide counts follow a negative binomial distribution, zero-inflated negative binomial distributions are able to estimate the share of zeros that result from reporting gaps (Bürkner, 2017). Zero-inflated negative binomial distributions are a mixture of a binomial and a negative binomial distribution and have an additional parameter (z). This parameter represents the zero inflation: the fraction of zeros in a dataset that would not be expected according to a negative binomial distribution. For a year with no reported landslides, this is the model's estimate for the probability that the recording switch was in the “off” position. We fit zero-inflated negative binomial distributions (ZINB) to each historical inventory to estimate this share of zeros (zv) (Table A1).
where yi,v is the number of reported landslides in an inventory per year, μv is the expected (average) number of landslides per inventory per year, φv is a shape parameter, and zv is the zero-inflation. We assumed that the posterior median share of zeros (zv) arose from reporting gaps and removed them from the time series. For the California Geological Survey (2019) landslide inventory, for example, we estimated that 73 % of zeros are due to reporting gaps (Fig. 2a, b; Table A1). We note that because we modelled these distributions with stationary parameters over time and assume consecutive years to be independent, the exact timing of the reporting gaps is not relevant, but rather the share of gaps in the time series. The gaps in Fig. 2a are schematic examples. This procedure produced a zero-inflation corrected time series for each historical inventory.
To create a time series for each training county, we used the zero-inflation corrected time series for the historical state or local inventories that contained landslides in that county as a base time series (Fig. 2, Table A1, Eq. 1). We then added landslides reported in the county from other event-based inventories to this time series. For example, in Marin County, California, the base time series came from the historical California Geological Survey (2019) landslide inventory and landslides reported in the USGS California San Francisco Bay 2022–2023 event-based inventory (Brien et al., 2023) were added to the time series (Fig. 2c). We reserved the NASA COOLR catalog (Juang et al., 2019), which formed the basis of the 2023 NRI release, as independent test data and did not include it in these time series. These steps resulted in a time series for each training county that we used to train our negative binomial regression models (Sect. 2.4).
2.3 County-level landslide frequency predictors
We modelled landslide frequency as a function of landslide susceptibility, ecological region (ecoregion), and the two primary triggering factors at a continental scale: precipitation and earthquakes (Fig. 3). For landslide susceptibility (Fig. 3a–c), we calculated the percent area of each county considered susceptible to landslides from the USGS National Landslide Susceptibility Model, which estimates landslide susceptibility at 10 m resolution based on a slope–relief threshold and topographic data (Belair et al., 2024; Mirus et al., 2024). We used county boundaries from the U.S. Census Bureau Tiger/Line 2023 dataset (U.S. Census Bureau, 2023a) and excluded water bodies from each county's area with the U.S. National Atlas Water Feature Areas dataset (ESRI, 2022).
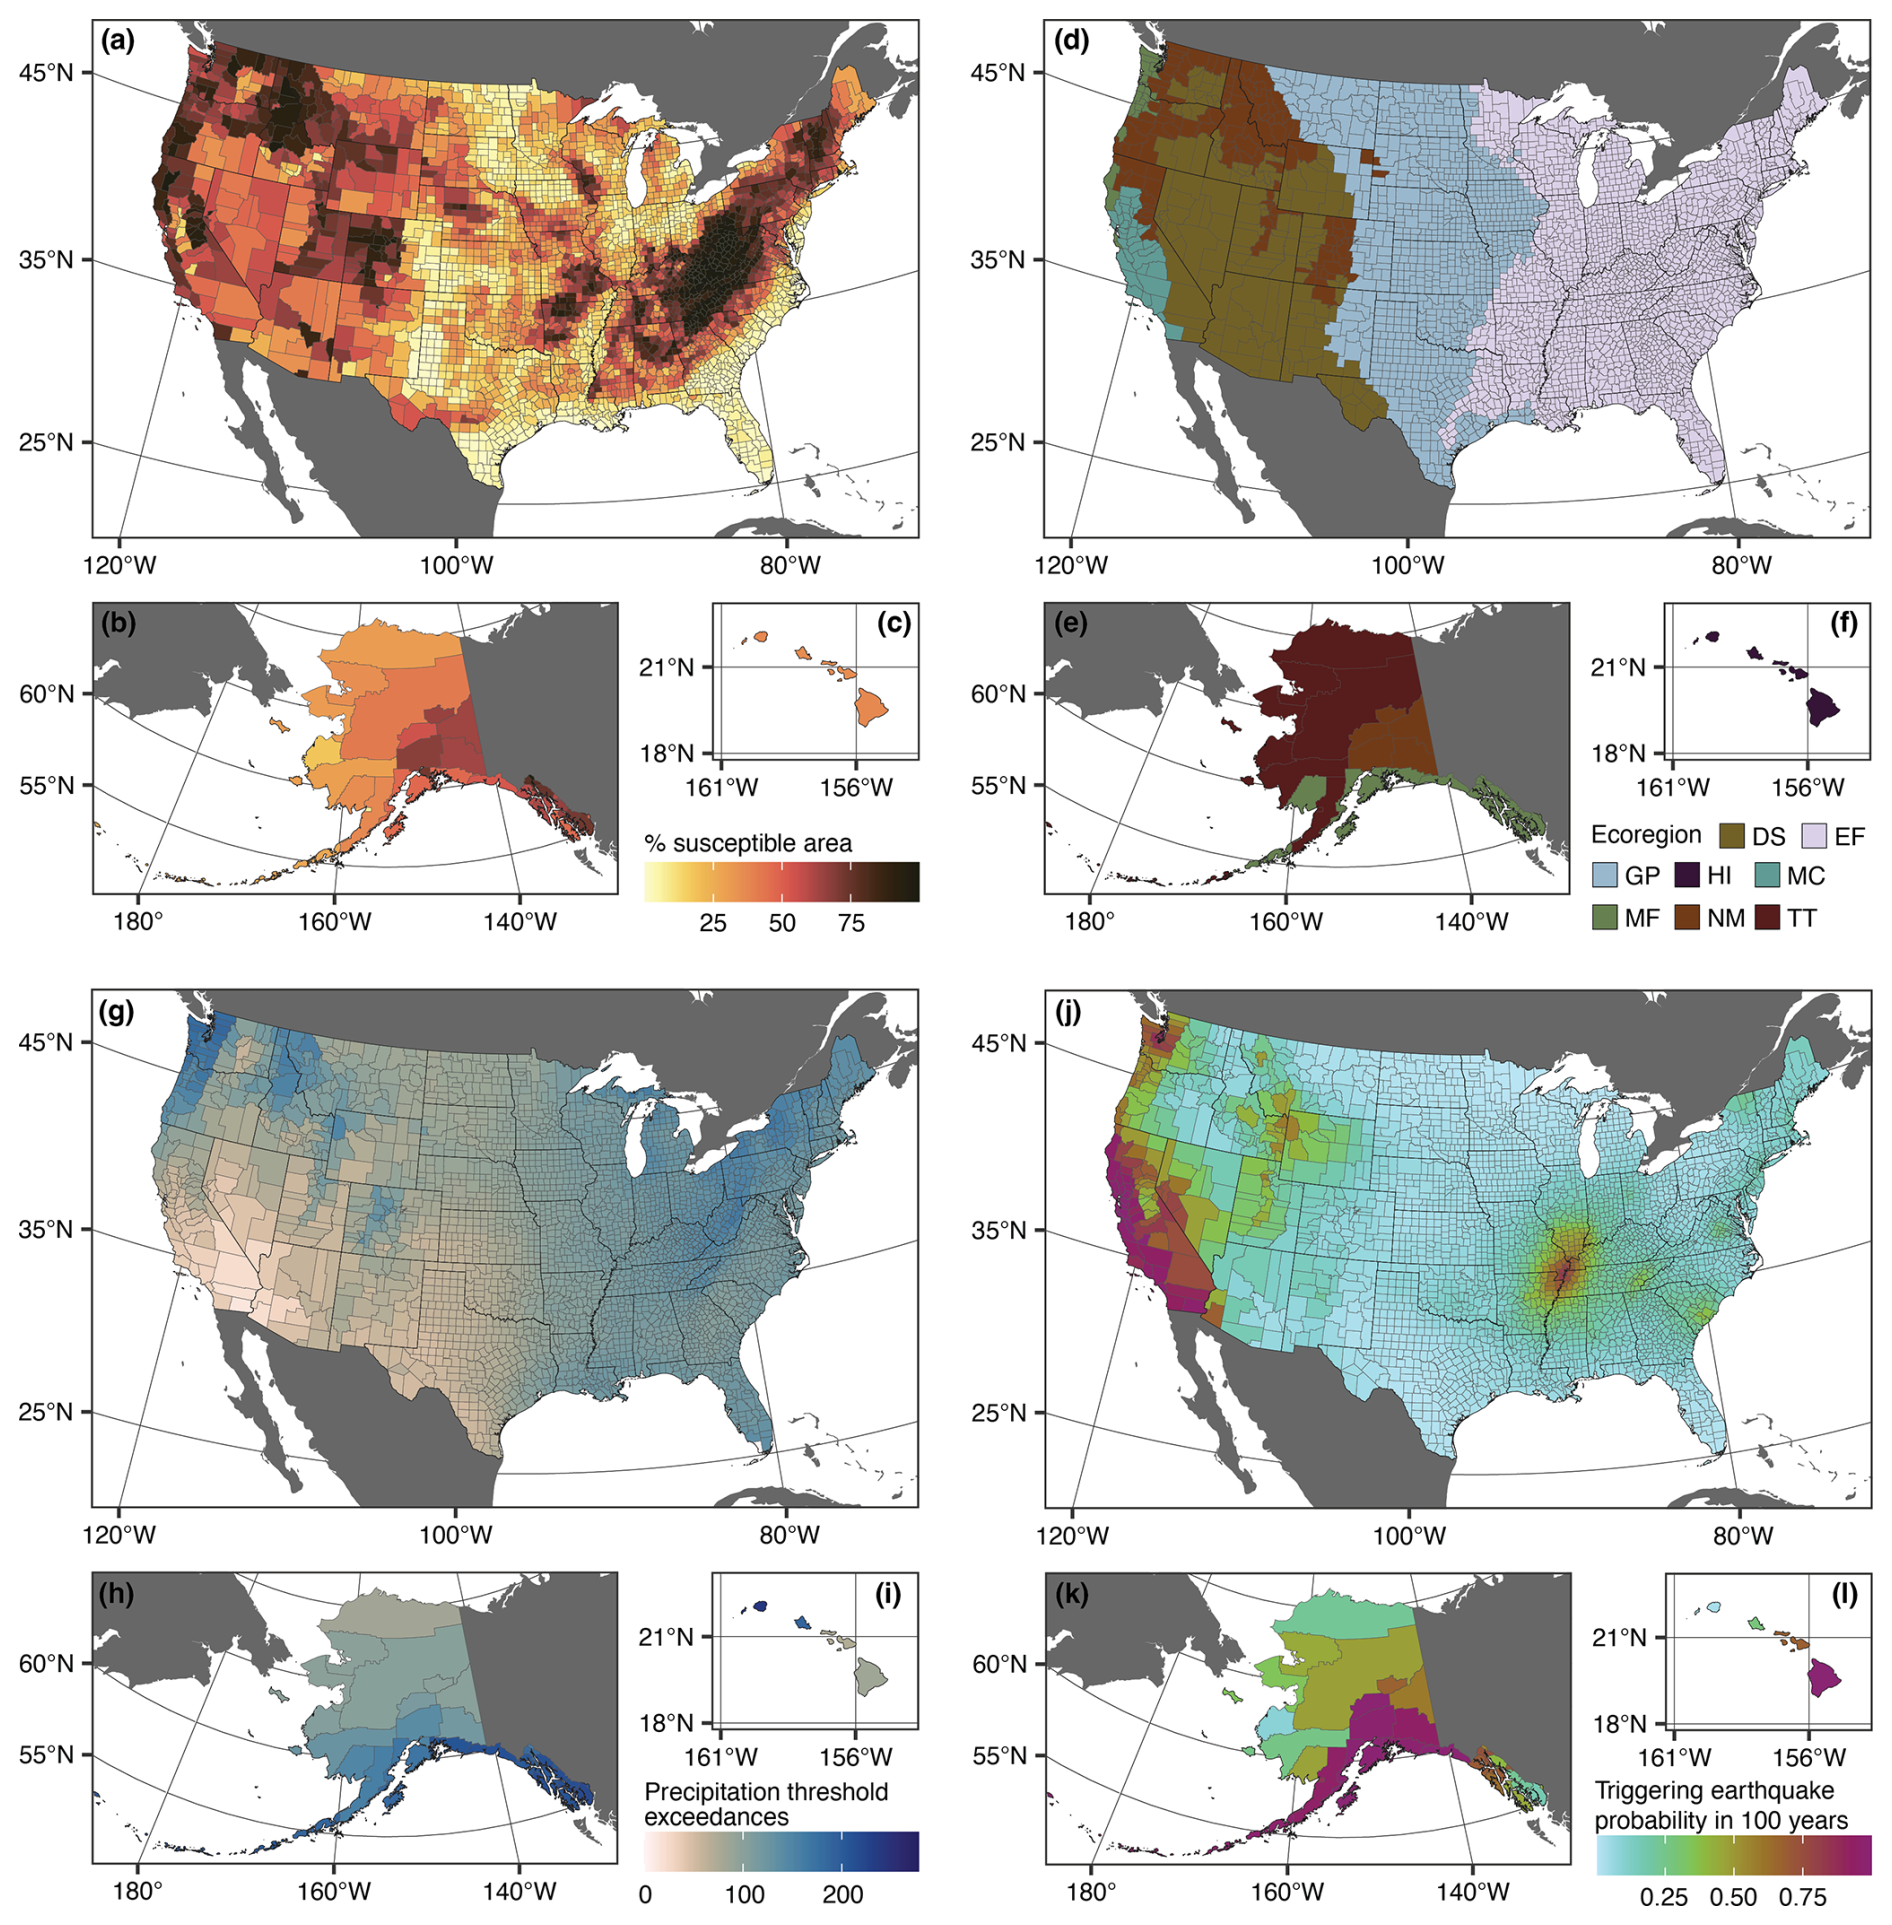
Figure 3Landslide frequency predictor data for US counties. (a–c) Percentage of county area that is susceptible to landslides from the U.S. Geological Survey National Landslide Susceptibility Model (Belair et al., 2025). (d–f) Simplified ecoregions: Deserts (DS), Eastern Forests (EF), Great Plains (GP), Hawaii (HI), Marine West Coast Forest (MF), Mediterranean California (MC), Northwestern Forested Mountains (NM), and Tundra and Taiga (TT). Modified from Level I ecoregions of North America (U.S. Environmental Protection Agency, 2010). (g–i) Average number of times the Guzzetti et al. (2008) global rainfall threshold for shallow landslides and debris flows was exceeded at 24 h duration annually from 2002 to 2021 (continental United States (CONUS), Hawaii) and 2002 to 2019 (Alaska). Precipitation from Analysis of Record for Calibration (AORC) dataset for CONUS and Alaska (Fall et al., 2023) and Global Historical Climatology Network Daily dataset for Hawaii (National Centers for Environmental Information, 2024). (j–l) County average probability of an earthquake with modified Mercalli intensity ≧ VI in 100 years from the U.S. 50-State National Seismic Hazard Model (Petersen et al., 2023). (a–l) US counties from U.S. Census Bureau Cartographic Boundary Files 1 : 500 000 (U.S. Census Bureau, 2023b), non-US administrative boundaries from Natural Earth (Natural Earth, 2022). Projection and datum: (a, d, g, j) CONUS – Albers North American Datum 1983 (EPSG:5070); (b, e, h, k) Alaska – Albers North American Datum 1983 (EPSG:3467); (c, f, i, l) Hawaii – Old Hawaiian (EPSG:4135).
We used a simplified version of the Level I ecoregions (Fig. 3d–f) as a proxy for regional factors that may influence landslide frequency that we do not explicitly consider in our model and which the topography-based USGS National Landslide Susceptibility Model does not account for. Ecoregions are areas of general similarity in ecosystems that result from a classification that integrates major ecosystem components including geology, physiography, vegetation, climate, and soils (Omernik, 2004). Because we expect these factors to also influence landslide activity (Corominas et al., 2014; Reichenbach et al., 2018), we chose ecoregion as a proxy to delineate areas likely to have broadly similar conditions that contribute to landslide frequency. Ecoregions have previously been explored for applications in automated landslide mapping and continental scale landslide susceptibility assessment (Nagendra et al., 2022; Woodard et al., 2023). Fourteen Level I ecoregions have been identified in the continental United States and Alaska (U.S. Environmental Protection Agency, 2010), which we further simplified using proximity to avoid having small regions with no available landslide inventory data. Specifically, we combined Eastern Temperate Forests (1766 counties), Tropical Wet Forests (5 counties), and Northern Forests (156 counties) into Eastern Forests; North American Deserts (140 counties), Southern Semi-Arid Highlands (3 counties), and Temperate Sierras (5 counties) into Deserts; and Tundra (7 counties) and Taiga (2 counties). This resulted in seven regions, which we term Deserts (DS), Eastern Forests (EF), Great Plains (GP), Marine West Coast Forest (MF), Mediterranean California (MC), Northwestern Forested Mountains (NM), and Tundra and Taiga (TT). No Level I ecoregion classification is available for Hawaii (HI), so we considered it to be its own region. We assigned each county to the ecoregion with greatest overlap.
For precipitation, we calculated the average number of times that the Guzzetti et al. (2008) global rainfall threshold for shallow landslides and debris flows was exceeded at 24 h duration annually. This intensity–duration threshold quantifies a minimum rainfall intensity above which landslides have been observed worldwide and thus serves as a conservative indicator of potentially triggering rainfall. Although local rainfall thresholds exist for a few regions of the United States (Baum and Godt, 2010; Collins et al., 2012; Patton et al., 2023; Scheevel et al., 2017), no nationwide threshold or methods to interpolate spatially between regions are available, so we chose a global threshold. For the continental United States (CONUS) and Alaska, we relied on precipitation estimates from the Analysis of Record for Calibration (AORC) version 1.1 dataset from 2002 through 2021 for CONUS and from 2002 through 2019 for Alaska, when the Alaskan record ends. AORC is a gridded hydrometeorological dataset with 4.76 km spatial resolution and hourly temporal resolution (Fall et al., 2023). Although the AORC dataset includes a variety of data sources and slightly different processing methodologies over its period of record (refer to Fall et al., 2023, for full details), the period from 2002 through 2024 relies heavily on input data from radar-based precipitation products, primarily the National Centers for Environmental Prediction (NCEP) Stage IV dataset (Du, 2011; Nelson et al., 2016). As such, in this study we focus on the period from 2002–2021 to take advantage of the use of radar data in the dataset. AORC 4.76 km data are stored in regional files for individual River Forecast Centers (RFC), which were combined onto single grids for CONUS and Alaska before identifying the annual number of instances in each grid cell when the Guzzetti et al. (2008) threshold was exceeded. For each county, we then averaged across grid cells and years to obtain a final value for average annual threshold exceedances per year (Fig. 3g–i). For Hawaii, which AORC does not cover, we relied on meteorological station data from the Global Historical Climatology Network Daily dataset (GHCNd) (National Centers for Environmental Information, 2024). We calculated the annual number of threshold exceedances at 24 h duration for all stations in Hawaii from 2002 through 2021 for consistency with CONUS. We used only years with at least 360 days with reported data. We then assigned each station within 15 km of a county to that county and calculated the average annual exceedances across stations and years.
We used the probability of occurrence of an earthquake with a modified Mercalli intensity (MMI) greater than or equal to VI in 100 years to indicate potential for landslide-triggering earthquakes. The MMI scale measures the effect of an earthquake on the Earth's surface and ranges from I, indicating a level of shaking that is not felt, to X, indicating extreme shaking. We selected an MMI threshold of VI to indicate landslide-triggering potential based on a global study of earthquake-triggered landslides that showed that more than 80 % of reported landslides were triggered at or above this level (Tanyaş et al., 2017). We calculated the average probability of occurrence of an earthquake with an MMI ≧ VI in 100 years across each county using data from the 2023 U.S. National Seismic Hazard Model (NSHM) (Petersen et al., 2023, 2024) (Fig. 3j–l).
2.4 Estimating landslide frequency distributions with Bayesian negative binomial regression
We applied Bayesian negative binomial regression to estimate the distribution of landslide counts per year for each county (Luna and Woodard, 2025). Negative binomial regression is a generalized linear model that estimates landslide frequency as a function of predictors (Eq. 2). Other examples of generalized linear models include logistic regression, which relies on the binomial distribution to model probabilities, and Poisson regression, which uses the Poisson distribution to model frequencies or rates (McElreath, 2020). We chose the negative binomial distribution because it is well suited to over-dispersed count data (refer to Sect. 2.2).
We compared a series of negative binomial regression models that included landslide susceptibility, frequency of potentially landslide-triggering precipitation, probability of potentially landslide-triggering earthquakes, and ecoregion as predictors. We trained these models using zero-inflation corrected time series for 316 counties covered by state or local inventories (Sect. 2.2). With the trained models, we predicted the expected, or average, landslide frequency (landslides 1000 km−2 yr−1) and the distribution of counts across years for 3144 counties, including many with no available landslide timing information, by using their known predictor values. We considered two sets of models: national models, which pooled training counties across the country together to estimate parameters, and regional models, which further considered differences by ecoregion.
The national models had the following general form:
where yi,c is the number of reported landslides in a given county (c) per area per year, NB indicates the negative binomial distribution, μc is the expected (average) number of landslides per area per year, and φ is a shape parameter that, together with μc, controls the variance of the negative binomial distribution. β0 serves as an intercept for the generalized linear model and refers to the natural logarithm of the frequency if all other predictors are at their mean value. Lc is the standardized percent landslide-susceptible area, Mc is the standardized probability of potentially landslide-triggering earthquakes, and Pc is the standardized frequency of potentially landslide-triggering precipitation. We standardized each of these predictors by subtracting the mean and dividing by the standard deviation across all counties. represents these predictors' coefficients. We included an offset of the natural logarithm of the county's area (Ac) to account for differences in area between counties, as larger counties should have higher frequencies than smaller counties given the same predictor values.
The regional models were multi-level models that included the simplified Level I ecoregion as a varying intercept, sometimes called a random effect. Multi-level models estimate parameters within and between groups. We chose to include ecoregion as a grouping variable that served as a proxy for the many factors that may influence landslide frequency that we do not explicitly include in our models, e.g., climate, land cover, and geology. In contrast to the pooled models that estimated parameters for the whole domain (Eq. 2), these multi-level models explicitly modelled regional variation in landslide frequency by learning a different intercept for each ecoregion (β0,r), while simultaneously learning the mean (β0,p) and standard deviation (σr) of intercepts among ecoregions (Eq. 3). This means that for a fixed set of predictor values, the estimated landslide frequency is allowed to vary by ecoregion if the data support this. Nevertheless, because each ecoregion's intercept must belong to the population-level distribution, the model is guarded from overfitting regions with many counties with reported landslides and estimates for areas with less available data are informed by data rich regions, which generally improves predictions (McElreath, 2020). These models have the following general form:
where β0,p is a population-level intercept that indicates the mean intercept across ecoregions. β0,r is a group-level intercept for each ecoregion that belongs to the overarching distribution of intercepts across all ecoregions, which we modelled as a normal (Gaussian) distribution with a mean of zero and standard deviation σr. We compared models with various combinations of predictors (Sect. 2.5).
We emphasize that these generalized linear models used standardized predictors for percent landslide-susceptible area (Lc), probability of potentially landslide-triggering earthquakes, and frequency of potentially landslide-triggering precipitation (Pc). This means that the expected landslide frequency (μc) for each county is estimated as a function of the county's characteristics relative to other counties not the absolute values of the predictor variables shown in Fig. 3. If a county has a percent landslide susceptibility that is 1 standard deviation above the mean across counties (Lc=1), for example, the natural logarithm of expected frequency ln (μc) will change by β1 relative to a county with mean percent landslide susceptibility (Lc=0).
Our national models required priors for φ and . In Bayesian inference, priors can encode previous knowledge or beliefs about parameter values. Whereas uninformative priors consider all possible parameter values equally probable, weakly informative priors assign a probability to possible parameters but do not exclude any values that might be learned from the data (Kruschke, 2014; McElreath, 2020). We chose the following weakly informative priors:
Our regionalized models required an additional prior for σr, and we chose the same prior for β0,p as for β0.
Our choices of a log-normal prior for φ and a half Student-t prior for σr are consistent with the need for a positive shape parameter and standard deviation. As φ→∞, the negative binomial distribution's variance decreases, approaching a Poisson distribution; as φ→0, variance approaches ∞. Our choice of prior for φ acknowledged overdispersion in landslide count data compared to a Poisson distribution and constrained variance to a reasonable range. Our choice of prior for β0 encodes our belief that landslide frequencies will be well below 1 landslide km−2 yr−1 in areas with average predictor values. Through the log-link function that relates β0 to μc (Eqs. 2, 3), the mean prior for β0 of −4.5 corresponds to 0.01 landslides km−2 yr−1 when all other predictors are at their mean. Our choice of priors for allow for both positive or negative correlations between frequencies and predictor values. For datasets with many observations, like ours, these priors primarily serve as a starting point for the fitting algorithm (refer to next paragraph), and the posterior parameter estimates are generally insensitive to the exact choice of prior parameter values (Kruschke, 2014; McElreath, 2020).
Posterior distributions are probability distributions of all parameters that are consistent with the data, prior, and model. This is an advantage of Bayesian inference: we obtain a distribution of estimates for each parameter rather than, for example, a single maximum likelihood estimate. Bayesian statistical models thus inherently provide transparent estimates of parameter uncertainty (Kruschke, 2014; McElreath, 2020; van de Schoot et al., 2021) but require advanced algorithms to estimate the posterior distributions. To do so, we used Markov chain Monte Carlo (MCMC) implemented via the R package brms v2.21.0 (Bürkner, 2017), which calls STAN v2.32.6, a statistical programming language that uses the No U-Turn Sampler (NUTS) Hamiltonian Monte Carlo fitting algorithm (Stan Development Team, 2023). MCMC is a stochastic process that samples from the posterior distribution and the NUTS Hamiltonian Monte Carlo algorithm is an MCMC method that generates efficient transitions that span the posterior (McElreath, 2020; Stan Development Team, 2023). We ran four independent chains, or sequences of samples, for 4000 iterations, discarding the first 1000 iterations as warm up, for a total of 12 000 post-warmup draws, or samples from the posterior. The Gelman–Rubin coefficient (R-hat) was 1.00 for all parameters, indicating that the four chains converged around the same distribution. All model diagnostics indicated acceptable fitting algorithm performance (Kruschke, 2014; McElreath, 2020).
We report median posterior parameter estimates, which is the median of the posterior distribution, and 95 % quantile interval (QI) as credibility intervals, which encompass 95 % of the posterior distribution. Wider posterior distributions (higher 95 % QI) indicate more parameter uncertainty, whereas narrower posterior distributions indicate less parameter uncertainty (lower 95 % QI). Posterior predictive distributions are simulations from the model that use the full posterior parameter distributions. In this way, when we make predictions with Bayesian models, for example, by simulating the distribution of landslide counts for each county, we naturally propagate parameter uncertainty into our predictions.
2.5 Model comparison
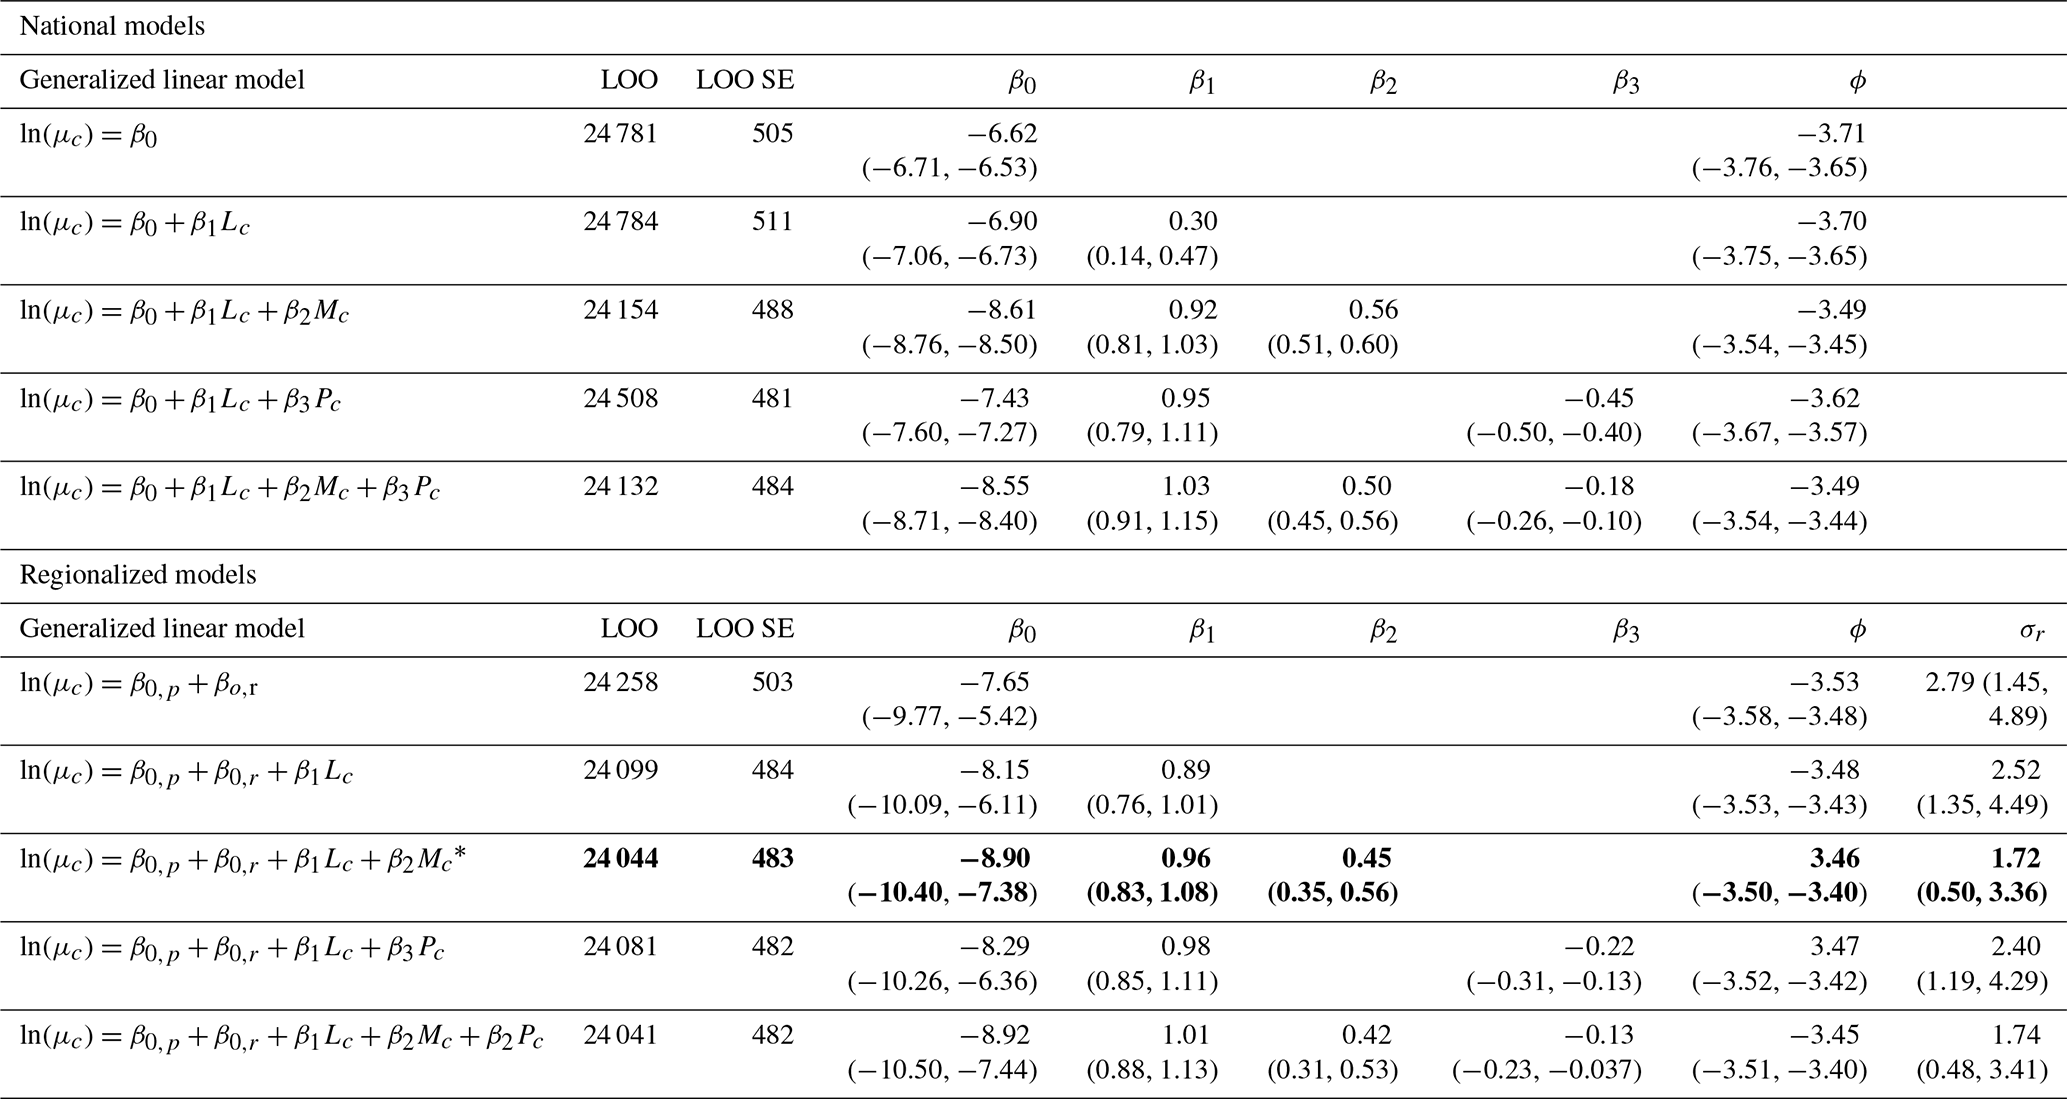
We compared 10 total national and regionalized model setups with differing combinations of predictors to arrive at a preferred landslide frequency model (Table 1). We used two criteria for our selection: (1) leave-one-out (LOO) information criterion (IC) and (2) physically plausible parameter values. LOO estimates the out-of-sample predictive accuracy of each model (Vehtari et al., 2017). A lower LOO value indicates better estimated out-of-sample predictive accuracy, and vice versa. Although we also considered error as a goodness-of-fit measure in our additional evaluation of the preferred model (Sect. 2.6), we preferred information criteria for model comparison because this approach penalizes models with higher numbers of parameters that may achieve better fits to the training data but worse generalizability (overfitting). We required that parameter estimates for reflect physically plausible, positive relations between the chosen predictors and landslide frequency. Based on these criteria, we selected a regionalized model that included landslide-susceptible area and probability of potentially triggering earthquakes as our preferred model.
Table 1Model comparison. The preferred model is indicated with an asterisk and in bold text. Leave-one-out (LOO) information criteria and its standard error (SE) are reported for each model.
2.6 Model evaluation
We evaluated our preferred model results with three criteria: fit (estimated compared to reported), robustness (training–test cross-validation), and comparison to previous landslide frequency estimates from the NRI. To evaluate fit, we calculated reported landslide frequency for our training counties by dividing the total number of reported landslides by the number of years in the zero-inflation corrected time series for that county and the county's area. We then computed error (residuals) by subtracting the reported frequency from the model's posterior median estimated frequency. To evaluate robustness, we performed k-fold training–test cross-validation, randomly splitting our training counties further into training (80 % of counties) and testing (20 % of counties) folds. We refit the model to the training fold and used it to predict the average landslide frequency for counties in both the training and testing folds. We then computed error (predicted minus reported) for each of these folds, repeating the process 10 times. A similar error distribution indicates that the model is robust and not overly influenced by the training counties selected, whereas a markedly different error distribution indicates that the model is sensitive to the training counties selected. We also compared our model's county-level average landslide frequency estimates to those reported in the March 2023 release of the NRI (Federal Emergency Management Agency, 2023a). Because the NRI is based on NASA's COOLR dataset (Juang et al., 2019), we excluded this dataset from our training data. The NRI thus serves as an independent comparison.
We found that average annual landslide frequencies varied by 5 orders of magnitude across US counties, reflecting the country's strong variation in landslide susceptibility, earthquake probability, and other factors for which ecoregion serves as a proxy, based on our preferred model (Fig. 4a–c). Frequency estimates ranged from 0.002 (0.0001–0.05) landslides 1000 km−2 yr−1 in Kusilvak Census Area, Alaska, a county with low landslide susceptibility (17 % susceptible area) and low triggering earthquake potential located in the Tundra and Taiga ecoregion, to 31 (21–43) landslides 1000 km−2 yr−1 in Lake County, California, a county with high landslide susceptibility (93 % susceptible area) and high triggering earthquake probability located in the Mediterranean California ecoregion (Figs. 3 and 4). Here we refer to frequencies per area, which allows for a fairer comparison between large counties and small counties. For reference, US county areas range from 120 km2 (Hudson County, New Jersey) to 377 055 km2 (Yukon-Koyukuk Census Area, Alaska). Estimated uncertainties, shown as the range of the 95 % quantile interval, generally followed the pattern of estimated frequencies (Fig. 4d–f). Low uncertainties in areas with low estimated frequencies express the model's confidence that few landslides are likely to be reported, whereas higher uncertainties in high-frequency areas reflect the model's prediction that many landslides are likely, but exactly how many earthquakes is difficult to pinpoint. Particularly high uncertainties in earthquake-prone areas likely demonstrate the potential for high numbers of landslides in widespread events but few reported events in the training data. The Tundra and Taiga ecoregion shows low estimated frequencies with relatively high uncertainties, reflecting the few reported landslides but relevant landslide susceptibility and triggering earthquake probability in this region.
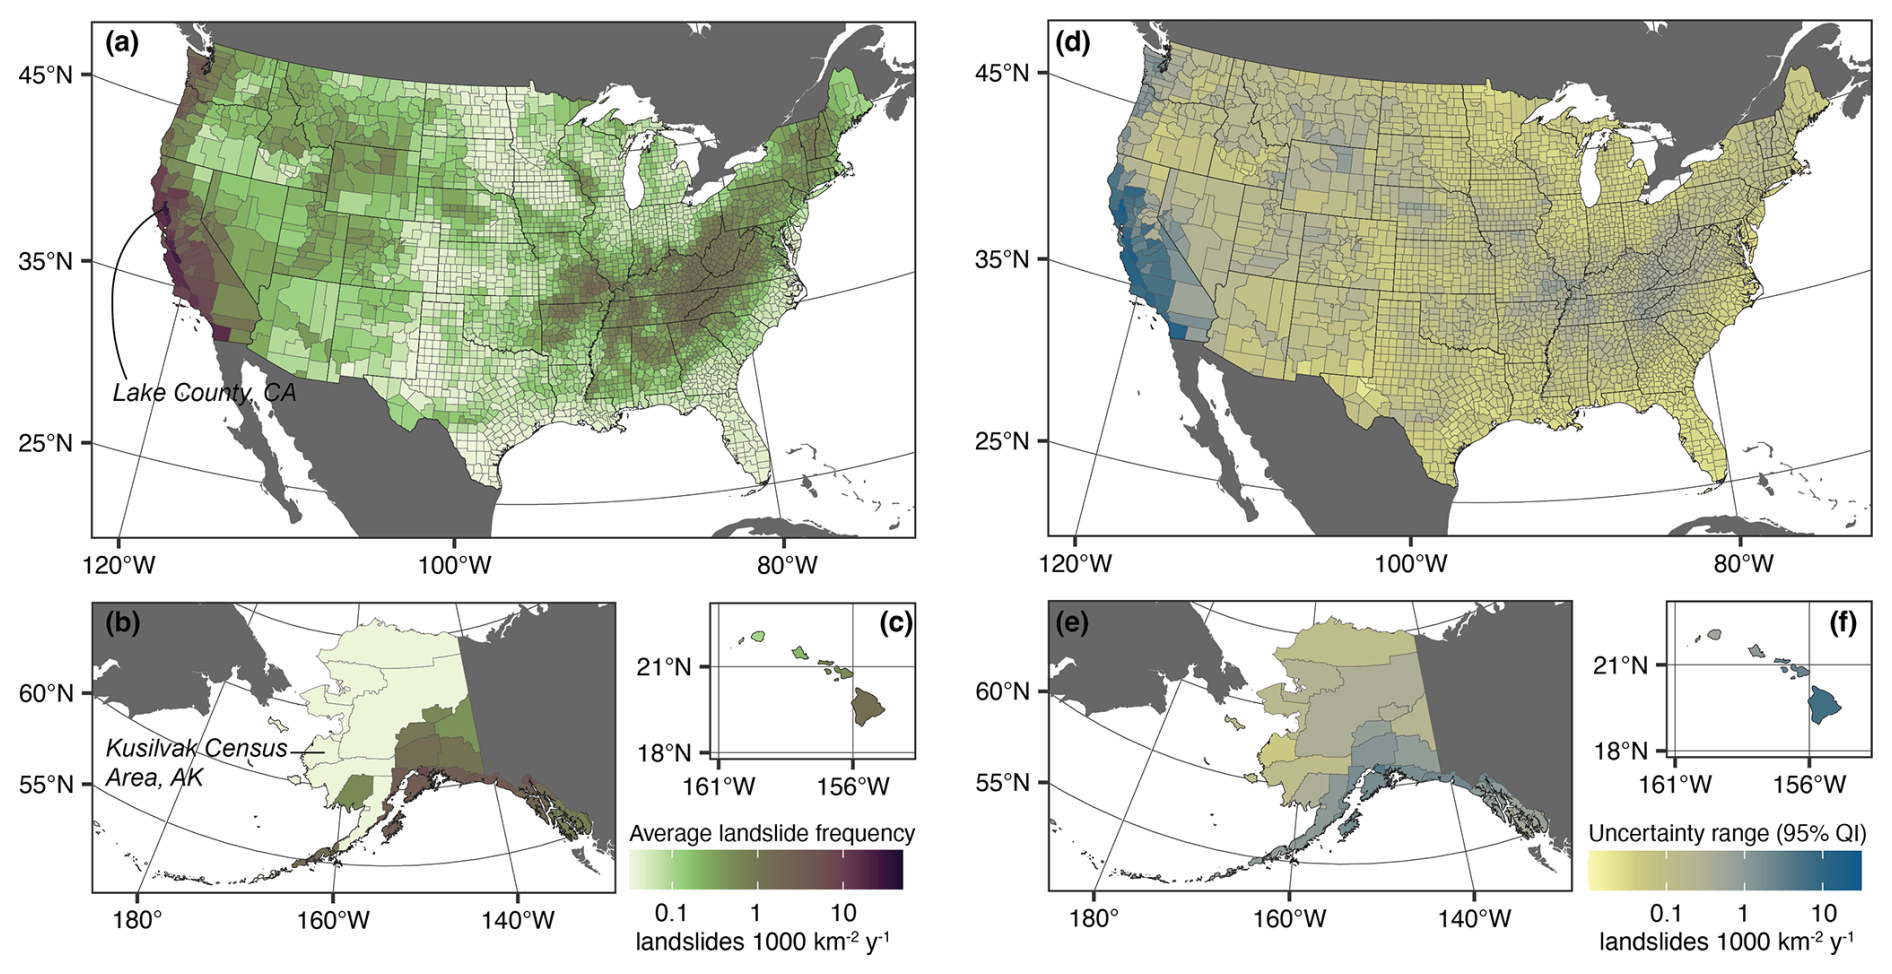
Figure 4Average annual landslide frequency by county. (a–c) Posterior median expected (average) annual landslide frequency 1000 km−2 yr−1 for 50-state US counties. Lake County, California (CA) had the highest estimated frequency and Kusilvak Census Area, Alaska (AK) the lowest. (d–f) Range of posterior 95 % quantile interval (QI). Base map data in panels (a)–(f): US counties from U.S. Census Bureau Cartographic Boundary Files 1 : 500 000 (U.S. Census Bureau, 2023b), non-US administrative boundaries from Natural Earth (Natural Earth, 2022). Projection and datum: (a, d) continental United States – Albers North American Datum 1983 (EPSG:5070); (b, e) Alaska – Albers North American Datum 1983 (EPSG:3467); (c, f) Hawaii – Old Hawaiian (EPSG:4135).
Counties with the highest estimated frequencies tend to have high percentages of landslide-susceptible area and are in areas with high triggering earthquake probability, landslide-prone ecoregions, or both (Figs. 3 and 4). Counties with estimated frequencies in the top 20 % of all counties from our preferred model are predominately along the West Coast of CONUS, in mountainous regions of the Pacific Northwest and Intermountain West, in locally steep or earthquake-prone regions of the Midwest and Southeast, along the Appalachians, in southern Alaska, and on some Hawaiian islands (Fig. 5). Model parameter estimates from our preferred model showed that both percent susceptible area and potentially triggering earthquake probability had a credibly positive effect on landslide frequency (Fig. A1), but the effect of susceptible area is larger. With 1 standard deviation increase in percent susceptible area, the natural logarithm of landslide frequency, ln (μ), was estimated to increase by 0.96 (0.83–1.1) (β1); with 1 standard deviation increase in potentially triggering earthquake probability, the natural logarithm of landslide frequency was estimated to increase by 0.45 (0.35–0.56) (β2). Considering equal percent susceptible area and potentially triggering earthquake probability, counties in the MC, MF, EF, and GP ecoregions had above-average posterior median landslide frequency estimates, whereas counties in the ND, NM, and TT ecoregions had below-average estimates (Fig. A1b). However, only TT was credibly distinguishable from the mean across all ecoregions when taking into account the full posterior distributions (95 % QI). Given the lack of available training data, HI took the mean across ecoregions. Overall, we observed that learning from landslide inventory data substantially reduced parameter uncertainty compared to the prior (Fig. A1).
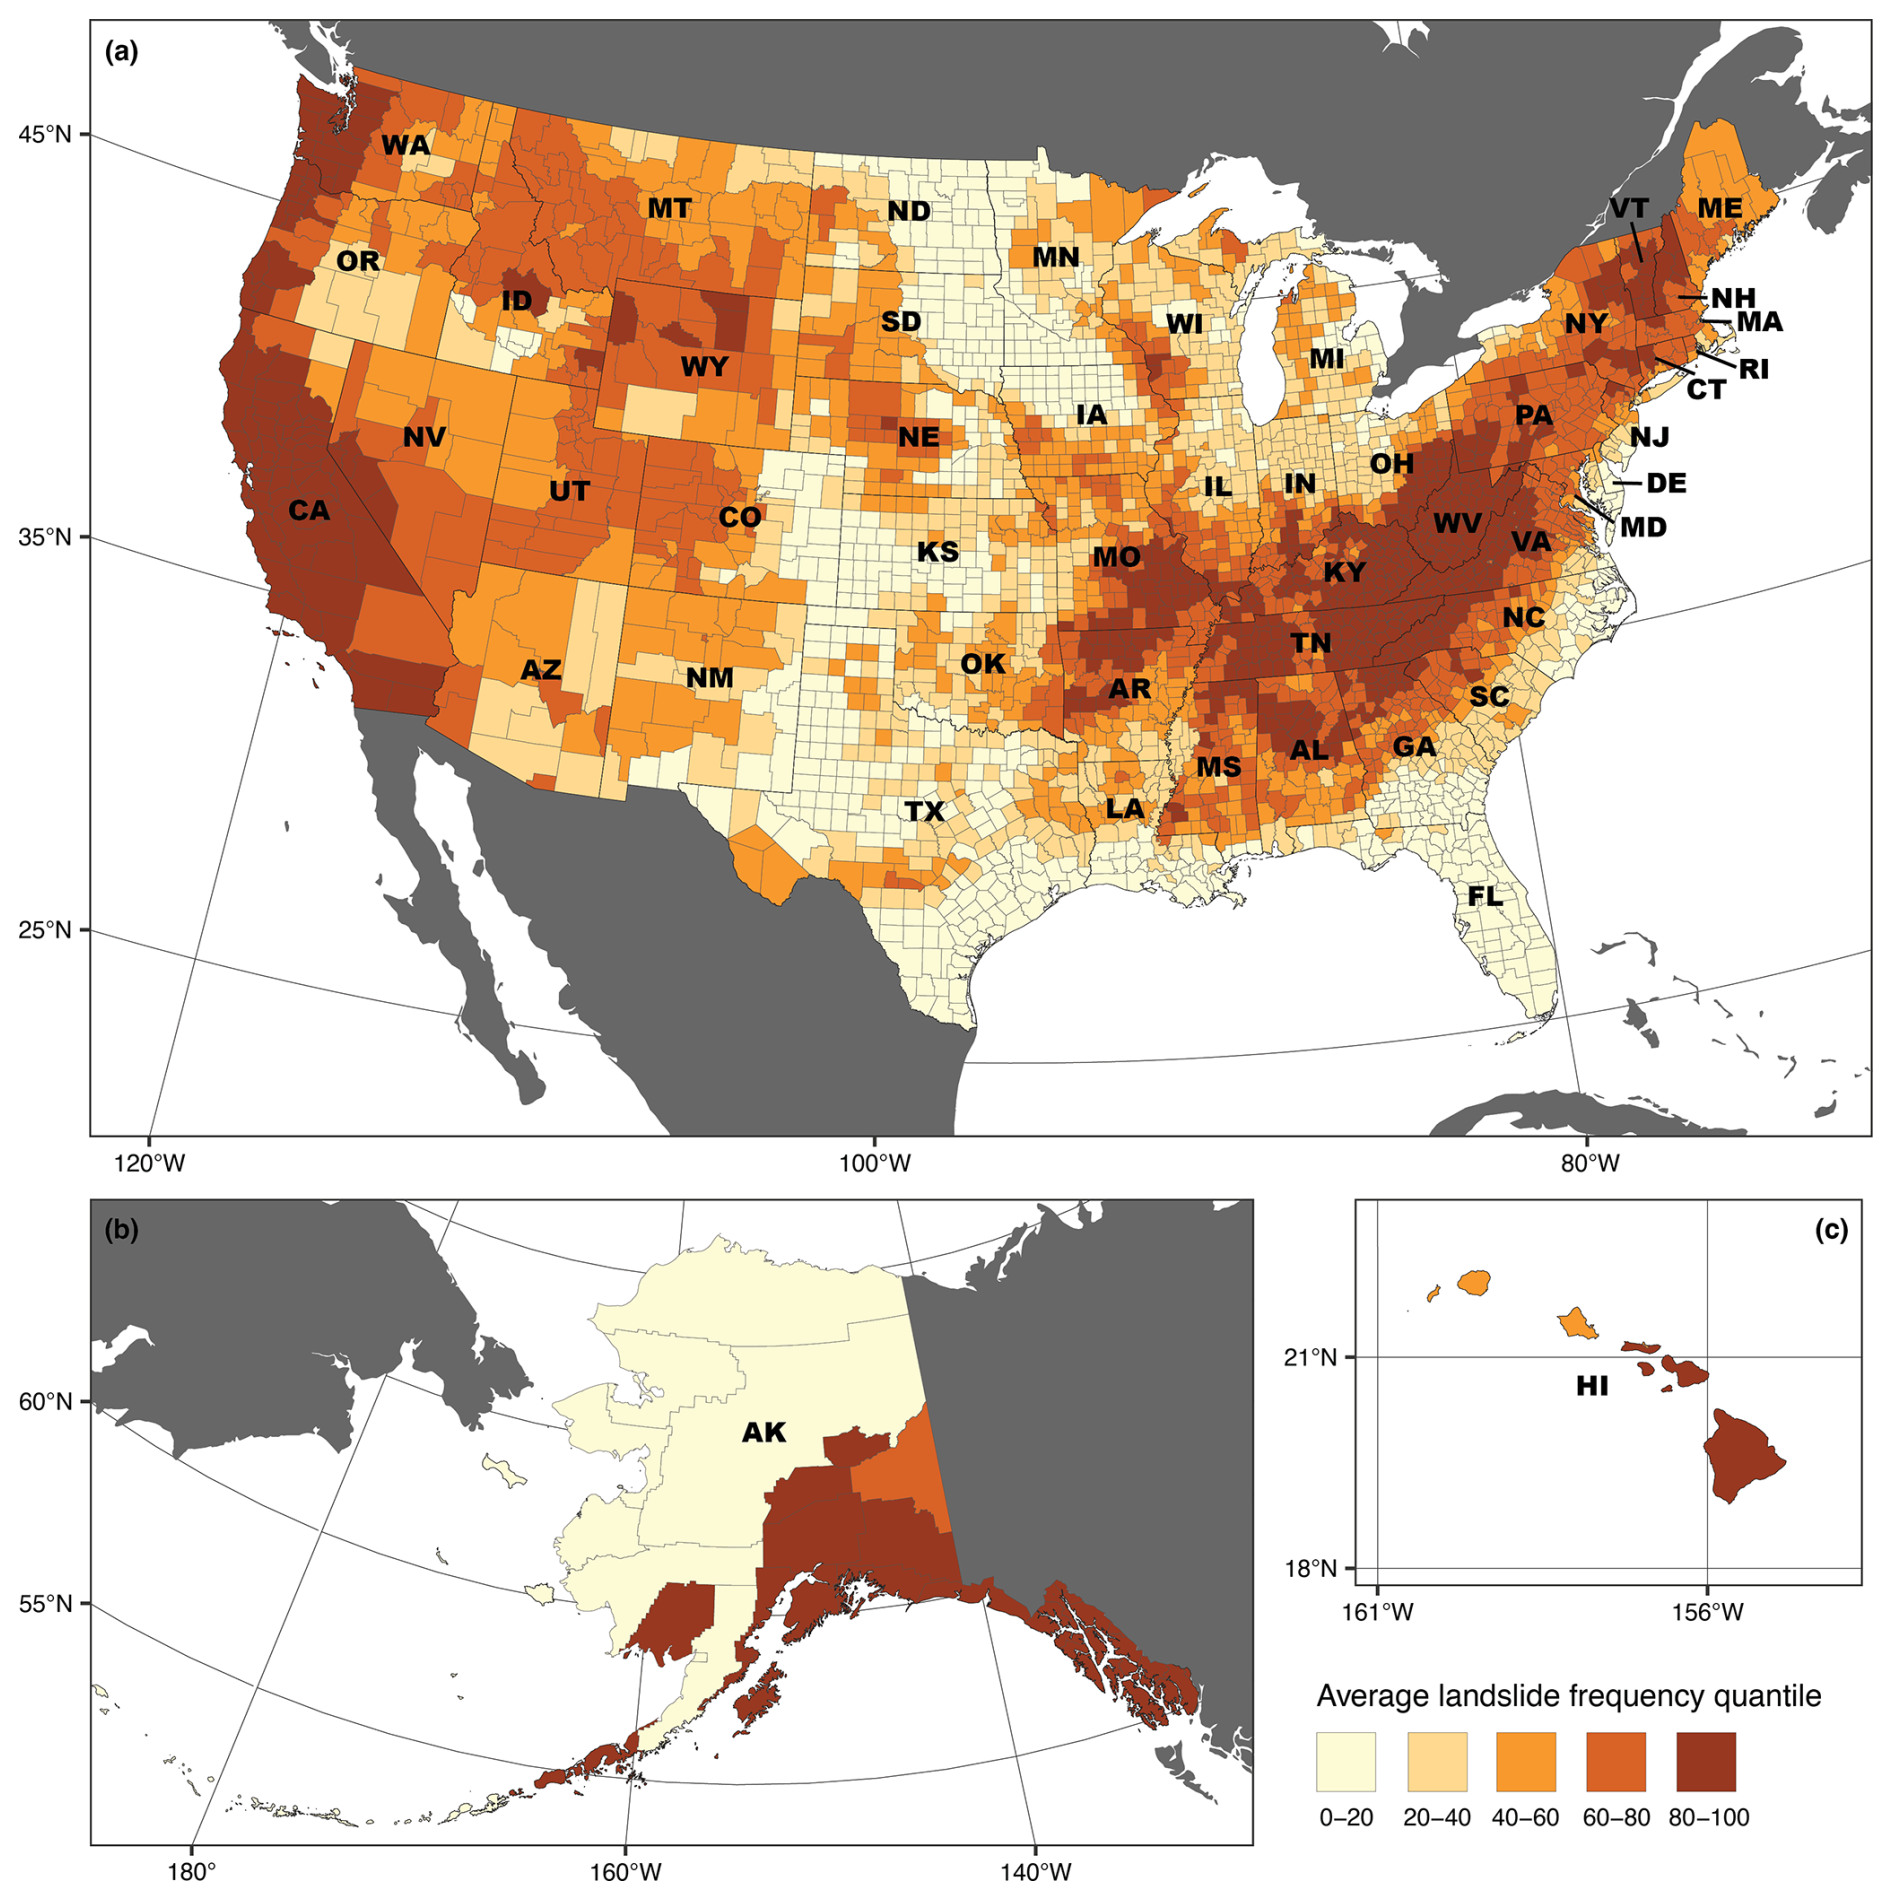
Figure 5Landslide frequency distribution across counties. (a–c) Quantile class of county-level landslide frequency (average landslides 1000 km−2 yr−1) compared to other counties. For example, counties in the 80–100 class have frequencies higher than the other 80 % of counties. The 50 US states and their abbreviations are Alabama (AL), Alaska (AK), Arizona (AZ), Arkansas (AR), California (CA), Colorado (CO), Connecticut (CT), Delaware (DE), Florida (FL), Georgia (GA), Hawaii (HI), Idaho (ID), Illinois (IL), Indiana (IN), Iowa (IA), Kansas (KS), Kentucky (KY), Louisiana (LA), Maine (ME), Maryland (MD), Massachusetts (MA), Michigan (MI), Minnesota (MN), Mississippi (MS), Missouri (MO), MT (Montana), Nebraska (NE), Nevada (NV), New Hampshire (NH), New Jersey (NJ), New Mexico (NM), New York (NY), North Carolina (NC), North Dakota (ND), Ohio (OH), Oklahoma (OK), Oregon (OR), Pennsylvania (PA), Rhode Island (RI), South Carolina (SC), Tennessee (TN), Texas (TX), Utah (UT), Vermont (VT), Virginia (VA), Washington (WA), West Virginia (WV), Wisconsin (WI), and Wyoming (WY). Base map data in panels (a)–(c): US counties from U.S. Census Bureau Cartographic Boundary Files 1 : 500 000 (U.S. Census Bureau, 2023b), non-US administrative boundaries from Natural Earth (Natural Earth, 2022). Projection and datum: (a) continental United States Albers North American Datum 1983 (EPSG:5070); (b) Alaska Albers North American Datum 1983 (EPSG:3467); (c) Old Hawaiian (EPSG:4135).
Comparing models with different combinations of predictors provided insights into factors that influence landslide frequency at national and regional scales and led us to a preferred model that considered susceptible area, earthquake probability, and ecoregion. The national model that considered only landslide-susceptible area had a lower estimated out-of-sample predictive accuracy (LOO IC) than national models that included susceptible area along with potentially triggering earthquake probability or precipitation frequency (Table 1). This indicates that susceptible area alone provides limited information about landslide frequency at a national scale. Including earthquake probability markedly improved estimated predictive accuracy and resulted in positive parameter estimates for β1 and β2, indicating estimated increases in landslide frequency with increasing susceptible area and earthquake probability. Adding precipitation frequency, however, led to minimal further improvement in predictive accuracy and resulted in a counterintuitive and physically implausible negative relationship between landslide frequency and potentially triggering precipitation frequency. This indicates that the average frequency of daily precipitation above the global threshold used is too general a metric to add information on national-scale landslide frequency after susceptibility and earthquake probability are accounted for. In contrast, a regionalized model that included landslide susceptibility and a varying intercept by ecoregion showed better estimated predictive accuracy than any national model. This indicates relevant regional differences in landslide frequency at similar susceptibility levels and that ecoregions serve as a useful proxy for factors that influence landslide frequency but were not explicitly modelled. Including earthquake probability in this model improved predictive accuracy further, indicating that earthquake probability is relevant even after accounting for susceptible area and ecoregion, whereas, as in the national model, precipitation frequency had a negligible effect on predictive accuracy. Based on its comparatively high estimated predictive accuracy and physically plausible parameter estimates, we selected the regionalized, multi-level model with susceptible area, earthquake probability, and ecoregion as our preferred landslide frequency model.
Our model evaluation showed that for 76 % of counties (239 of 316 training counties) our estimates of average annual landslide frequency (median QI) were within 1 landslide 1000 km−2 yr−1 of rates estimated by dividing the total number of reported landslides by the number of years on record in the training data (Fig. 6a). The remaining 24 % were divided between overprediction (49 counties, 15 % of total) and underprediction (28 counties, 9 % of total). Counties where the model substantially overpredicted compared to reported data are in some parts of the West Coast and southern Alaska (Figs. 6b–d and A2a–c). Notably, these counties are near counties with very low error, which could indicate that true landslide rates are higher than reported in these areas. Counties where the model substantially underpredicted are sprinkled through Vermont, North Carolina, northern California, Oregon, and Idaho, with no notable spatial pattern. These isolated counties may have more detailed reporting than their neighbors, have experienced an exceptional widespread event during the reporting period, or have local conditions that cause rates of landsliding to be higher than similar counties. We evaluated robustness or the model's sensitivity to the specific training data using k-fold training–test cross-validation (Fig. A2d). We found that the distribution of errors between the training and test splits were nearly identical in 10 different folds, indicating that the model is robust and is not overly influenced by specific counties in the training data.
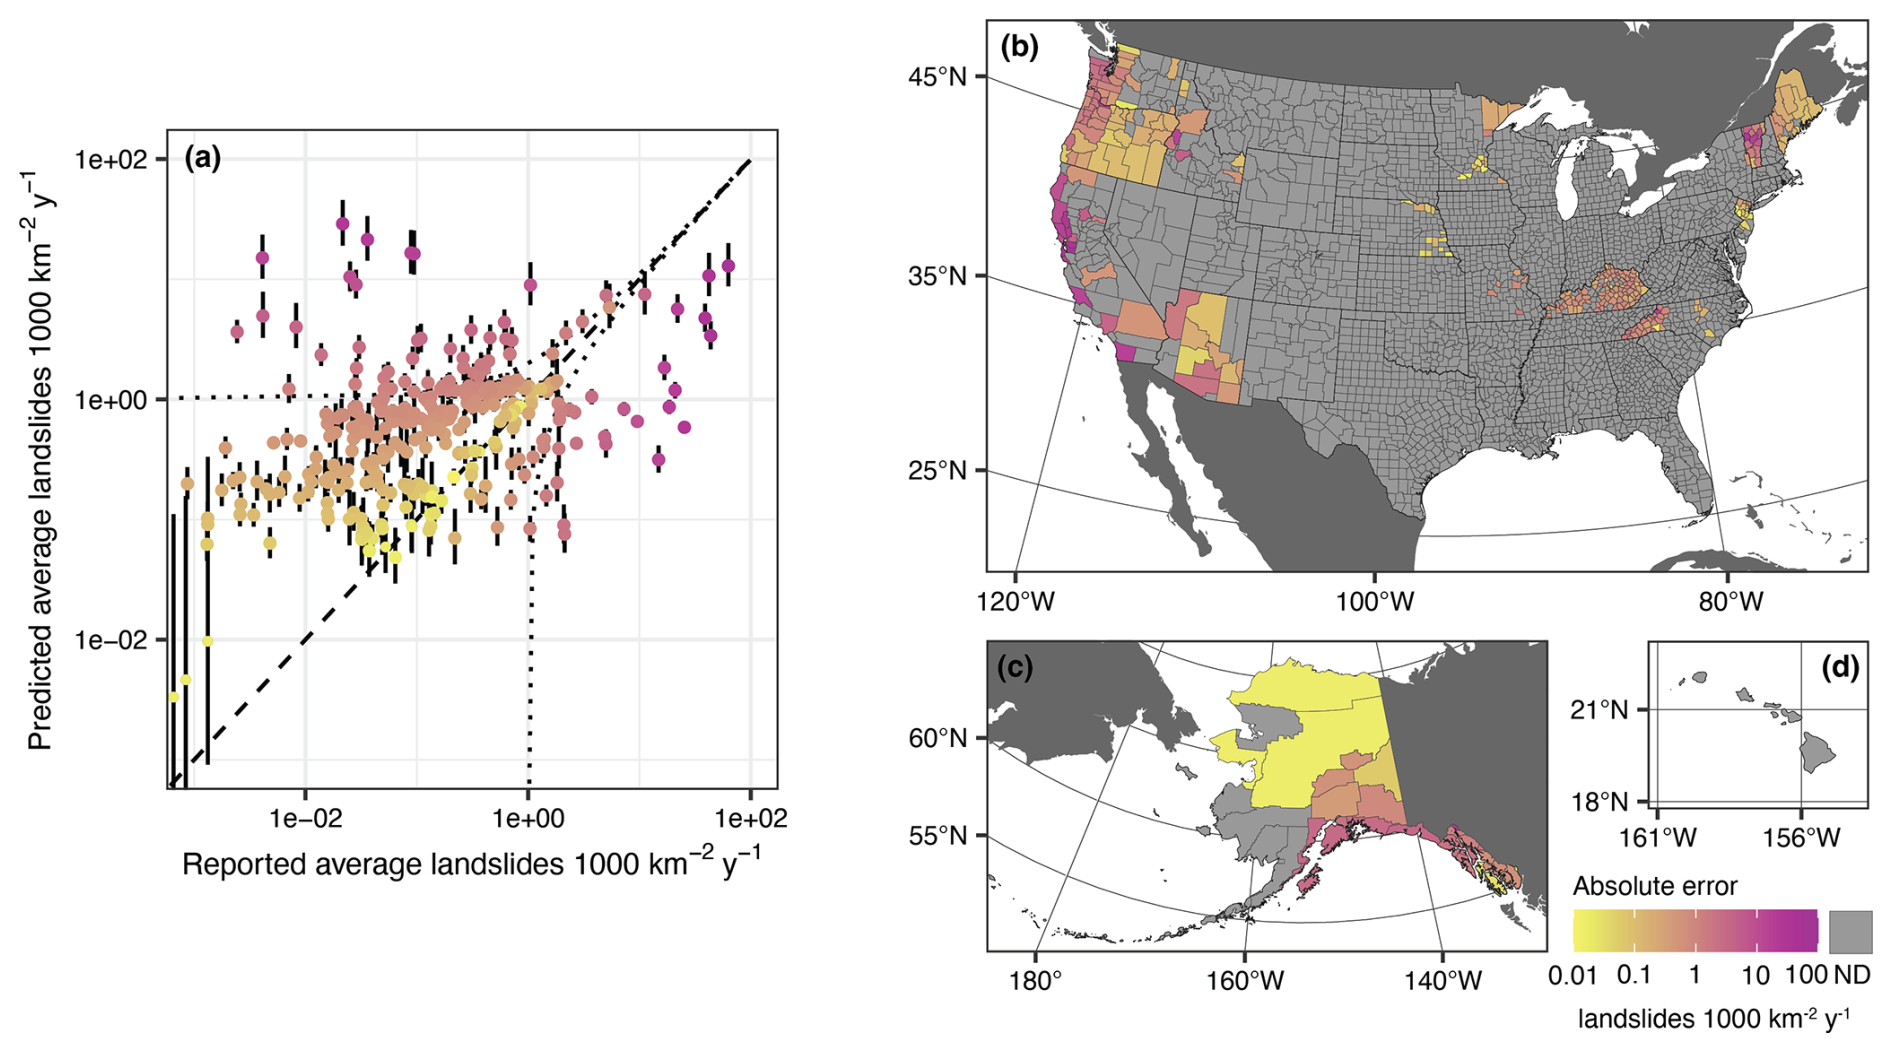
Figure 6Model evaluation. (a) Reported versus predicted average annual landslide frequencies (points; error bars show 95 % quantile intervals). Dashed line is a visual guide at a 1 : 1 ratio, indicating zero error. Dotted lines are visual guides at errors of −1 and 1 landslides 1000 km−2 yr−1. Colors correspond to absolute error scale from panel (d). (b–d) County-level error calculated as the absolute difference between predicted and reported average annual landslide frequencies shown on a log10 scale to better display counties with low errors. Base map data in panels (b)–(d): US counties from U.S. Census Bureau Cartographic Boundary Files 1 : 500 000 (U.S. Census Bureau, 2023b), non-U.S. administrative boundaries from Natural Earth (Natural Earth, 2022). Projection and datum: (b) continental United States Albers North American Datum 1983 (EPSG:5070); (c) Alaska Albers North American Datum 1983 (EPSG:3467); (d) Old Hawaiian (EPSG:4135).
Negative binomial regression models predict not just the expected or average frequency shown in Fig. 4 but also the full distribution of landslide counts per year in each county. Both predicted and reported distributions of annual landslide counts were heavily right-skewed, meaning that many years had few or no landslides and that few years had many landslides. As such, any individual year may be far from the average. Marin County, California, for example, had 58 years on record after zero-inflation correction with 82 total reported landslides, giving an average of 1.4 landslides per county per year (Fig. 2). However, 0 landslides were reported in 56 of those years, and the 2 years with reported landslides had 68 and 16 reported landslides, demonstrating that it is worthwhile to consider the full predicted distributions rather than only the averages. Figure 7 shows the posterior predictive distributions of annual landslide counts 1000 km−2 for a random selection of 50 example counties compared to reported data. Median predicted counts 1000 km−2 yr−1 are zero in all counties, meaning that the model predicted no reported landslides for half of the years in a simulated time series. This result is consistent with the training data for most counties; 96 % of training counties (including Marin County, California) had median reported annual counts of zero. In contrast, 99th percentile years were predicted to have hundreds of landslides in some counties and fewer than 10 in others (Fig. 7). Although the range of predicted 99th percentile years was within the range of observed values across counties, in some counties, like Multnomah County, Oregon, for example, the model underpredicted high-magnitude years compared to observed data, whereas in others, like Kodiak Island Borough, Alaska, the model overpredicted compared to observed data. Counties where the model overpredicted may have less complete reporting than counties with similar characteristics, may be prone to widespread events that have not occurred during the reporting period, or may have local processes that lead to lower-than-average rates of landsliding that our national-scale model does not capture. Counties where the model underpredicted, in turn, may have more complete reporting, have experienced more extreme landsliding events during the period of record, or have local processes that lead to higher-than-average rates of landsliding.
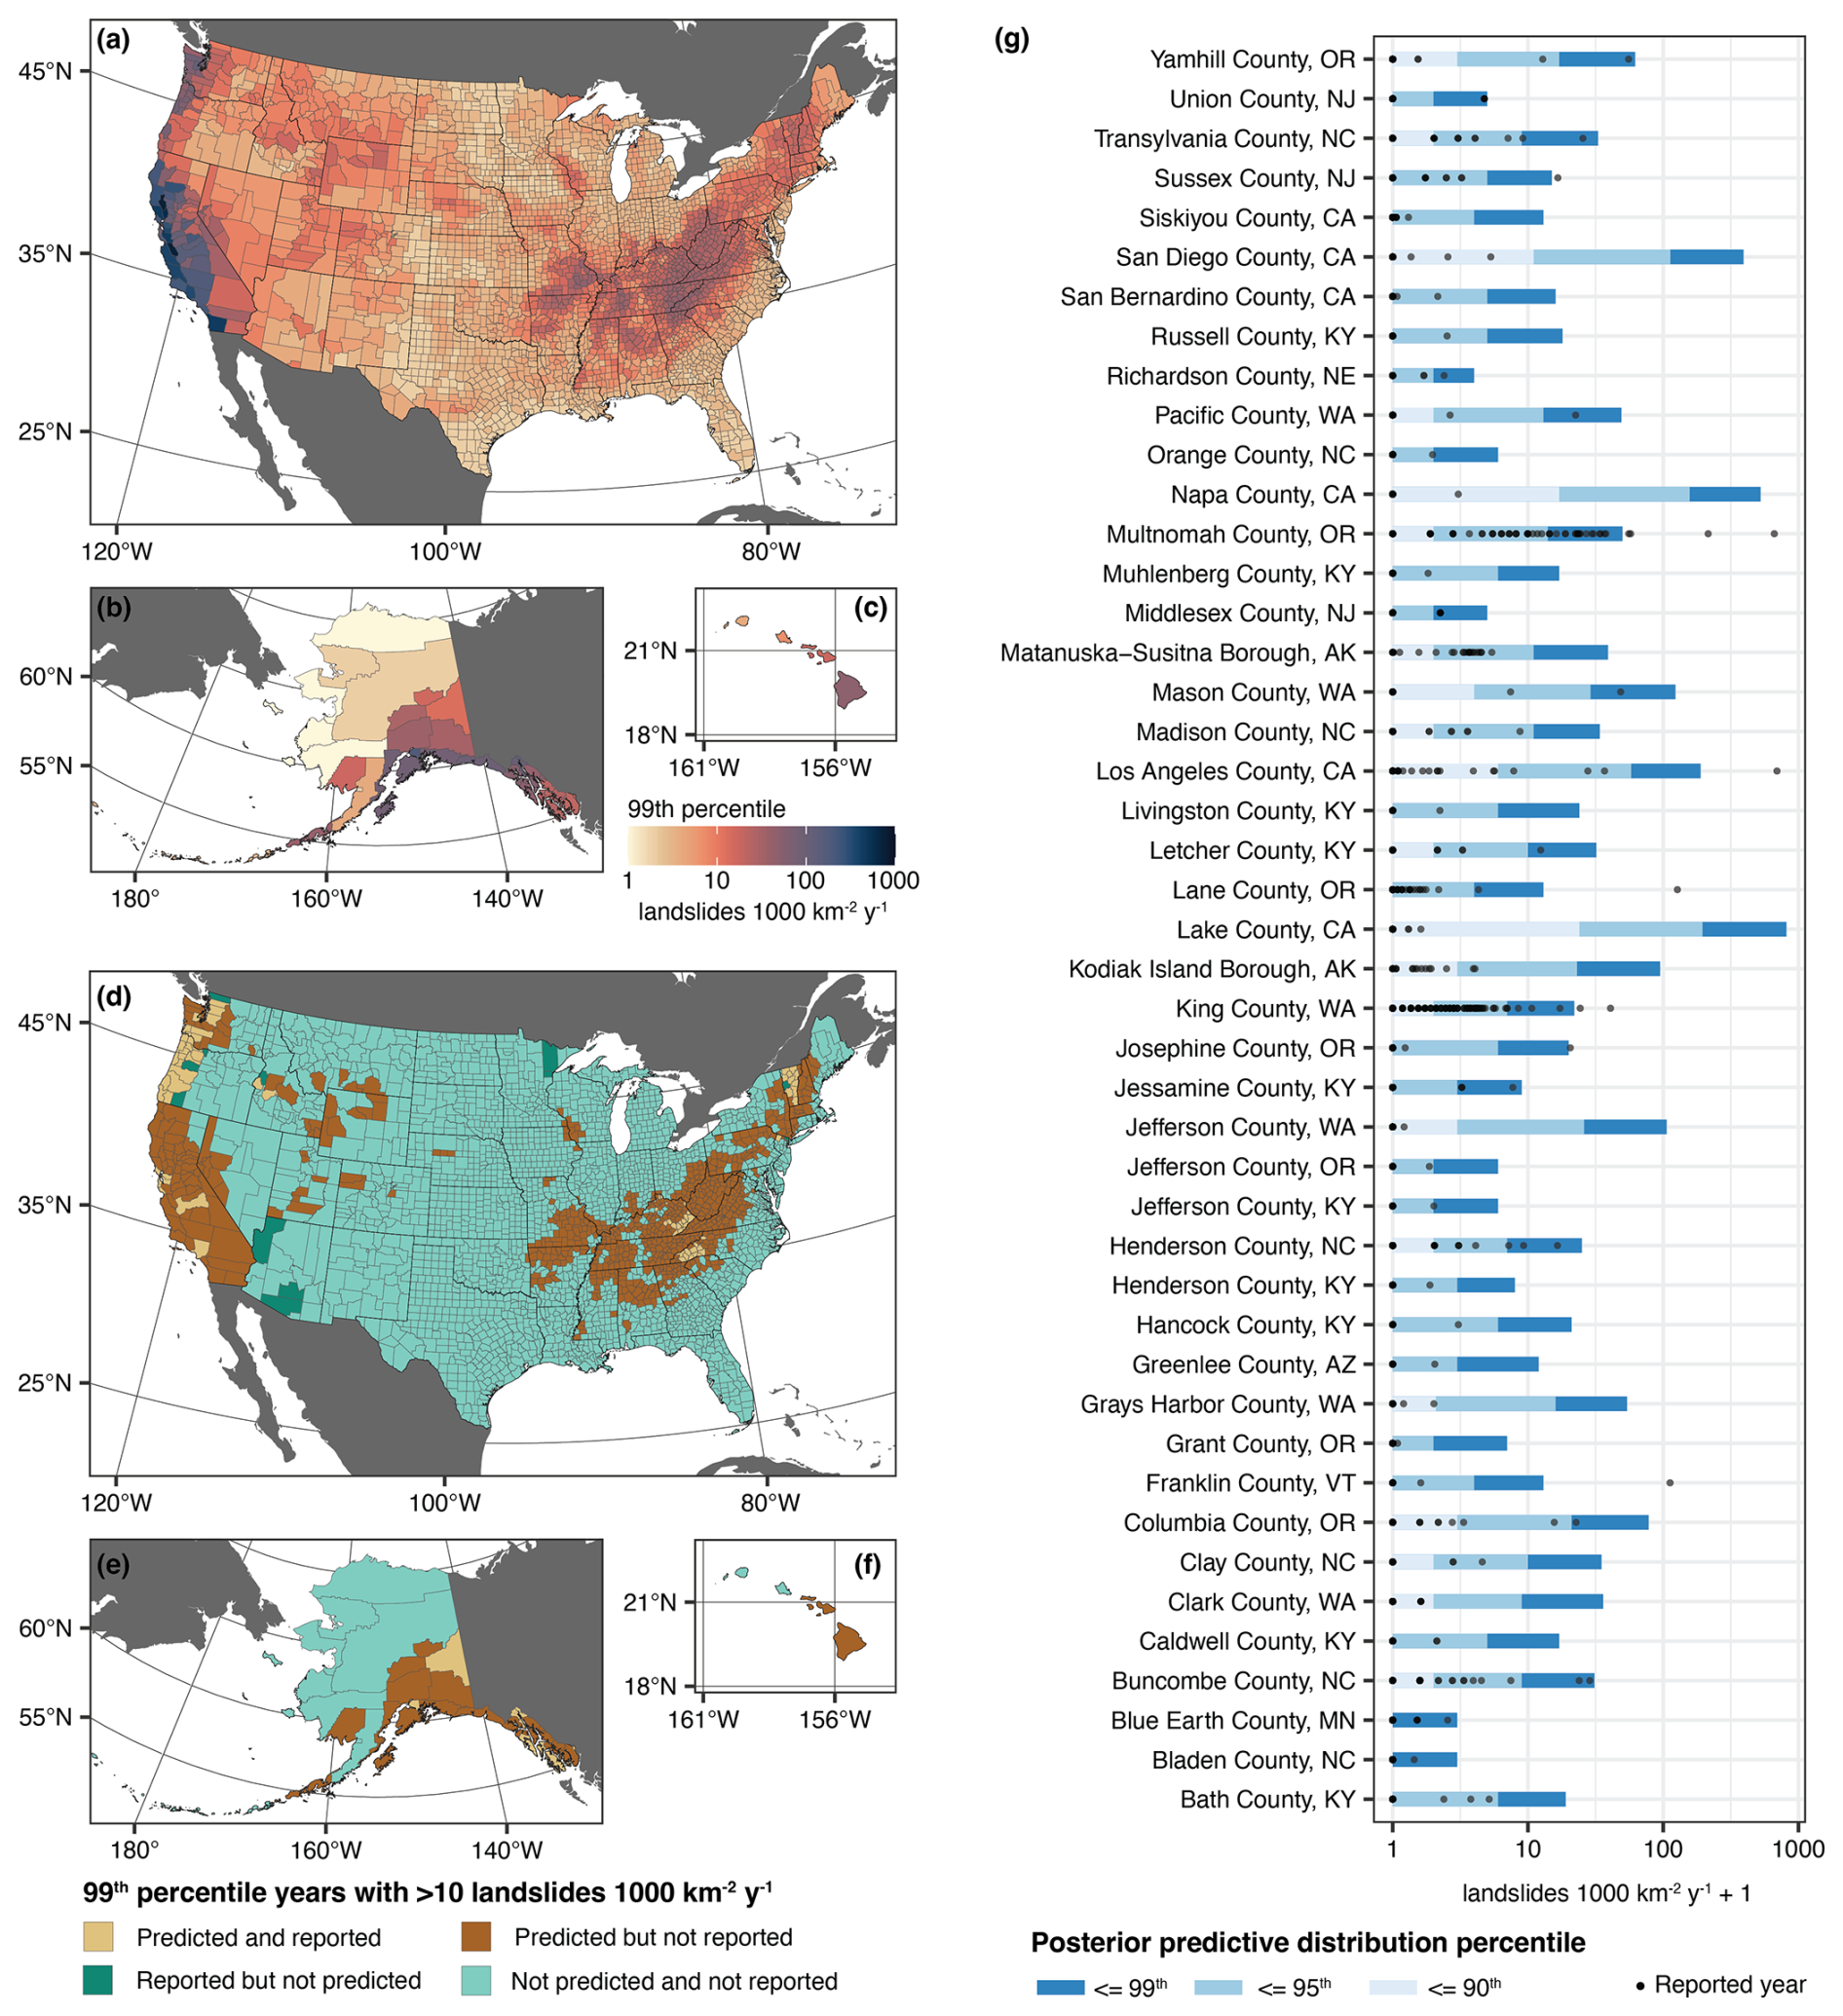
Figure 7Predicted distributions of landslide counts per year. (a–c) 99th percentile of the posterior predictive distribution for each county. The top 1 % of years is estimated to have landslide counts at this level or higher. (d–f) Counties with more than 10 landslides 1000 km−2 yr−1 predicted in 99th percentile years compared to whether such a year was reported in our training dataset. (g) Posterior predictive distributions for 50 randomly selected counties compared to reported data. These counties are in the states of Alaska (AK), Arizona (AZ), California (CA), Kentucky (KY), Minnesota (MN), Nebraska (NE), New Jersey (NJ), North Carolina (NC), Oregon (OR), Vermont (VT), and Washington (WA) (refer to Fig. 5). Base map data in panels (a)–(f): US counties from U.S. Census Bureau Cartographic Boundary Files 1 : 500 000 (U.S. Census Bureau, 2023b), non-US administrative boundaries from Natural Earth (Natural Earth, 2022). Projection and datum: (a, d) continental United States – Albers North American Datum 1983 (EPSG:5070); (b, e) Alaska – Albers North American Datum 1983 (EPSG:3467); (c, f) Hawaii – Old Hawaiian (EPSG:4135).
Although isolated landslides can be extremely destructive if they impact populated areas, widespread landslide events with tens to thousands of landslides cause regional effects. Figure 7a–c shows the estimated number of landslides 1000 km−2 for the 99th percentile (most extreme 1 %) of predicted years for each county, which could serve as an indicator of a county's potential for widespread landsliding. We observed that the range of magnitudes across counties was much larger than when we considered the average, whereas averages ranged from near 0 to ∼ 30 landslides 1000 km−2 yr−1; 99th percentiles ranged from 1 to more than 700 landslides 1000 km−2 yr−1. High intensities have been reported in both earthquake and rainfall-triggered widespread events: for example, strong winter storms triggered 2315 landslides 1000 km−2 yr−1 in Contra Costa County, California, in 2016, and the Northridge earthquake triggered 692 landslides 1000 km−2 yr−1 in Los Angeles County, California, in 1994. Counties with high 99th percentile years are located in areas with high landslide susceptibility and/or high earthquake hazard; these counties also have high predicted average frequencies because of the influence of years with many landslides.
Many counties with predicted potential for widespread landslide events had no such events reported in the inventories we considered in our training dataset. Figure 7d–f shows counties with more than 10 landslides 1000 km−2 yr−1 predicted in 99th percentile years compared to whether such a year was reported in our training dataset. These results show that our model was able to identify areas with potential for widespread landsliding, even when such large events were not reported in the training data for that county. We found that 756 (24 %) of US counties had predicted 99th percentile years with > 10 landslides 1000 km−2 yr−1 but had no such years in our training dataset; in total, 27 % of counties had this potential, including those where they have been reported. We observed that many counties with predicted potential for widespread landsliding but no reported events (dark brown in Fig. 7d–f) are near counties with similar characteristics that have had reported widespread events (light brown in Fig. 7d–f). For example, although years with more than 10 landslides 1000 km−2 yr−1 have been reported in most Vermont counties, neighboring counties in New Hampshire had no reported landslides in our training data; our model predicts that these New Hampshire counties have widespread landsliding potential. In 13 counties, years with more than 10 landslides 1000 km−2 yr−1 have been reported but are not predicted by our model. These isolated counties in Arizona, Minnesota, Vermont, and the Pacific Northwest likely have local landslide processes that our national-scale model was unable to capture. For example, some of the larger reported events in Arizona were post-fire debris flows, which occur under conditions that our model did not explicitly consider.
Our landslide frequency estimates were generally higher and more variable than the landslide frequency estimates reported in the March 2023 release of the NRI (Fig. 8) (Federal Emergency Management Agency, 2023a). The NRI estimates were calculated for census tracts, which are smaller than counties, and relied on 3637 landslides reported between 2010 and 2021 in NASA's COOLR database. A minimum annual frequency of 0.01 landslides per tract per year was used to fill in gaps for tracts with no reported landslides, and census tract level estimates were aggregated to county level using area-weighted averages. As a result, NRI landslide frequency estimates ranged from 0 to 1.3 landslides per county per year (Fig. 8) (Federal Emergency Management Agency, 2023b). Our estimates, which used 62 720 landslides reported over varying time periods as training data (Table A1, Fig. 1) and statistical modelling to fill gaps, ranged from 0 to 177 landslides per county per year (median QI). We did not include reported landslides from the COOLR database in our training data, such that it serves as an independent validation. Our results showed elevated landslide frequencies in many counties with low estimated frequencies in the NRI and were also more spatially consistent because our model took susceptibility and controls on triggering conditions into account rather than relying on a small and dispersed sample of reported landslides. We also provided estimates for the state of Alaska, which has counties with some of the highest estimated frequencies nationwide and was not included in the previous NRI release.
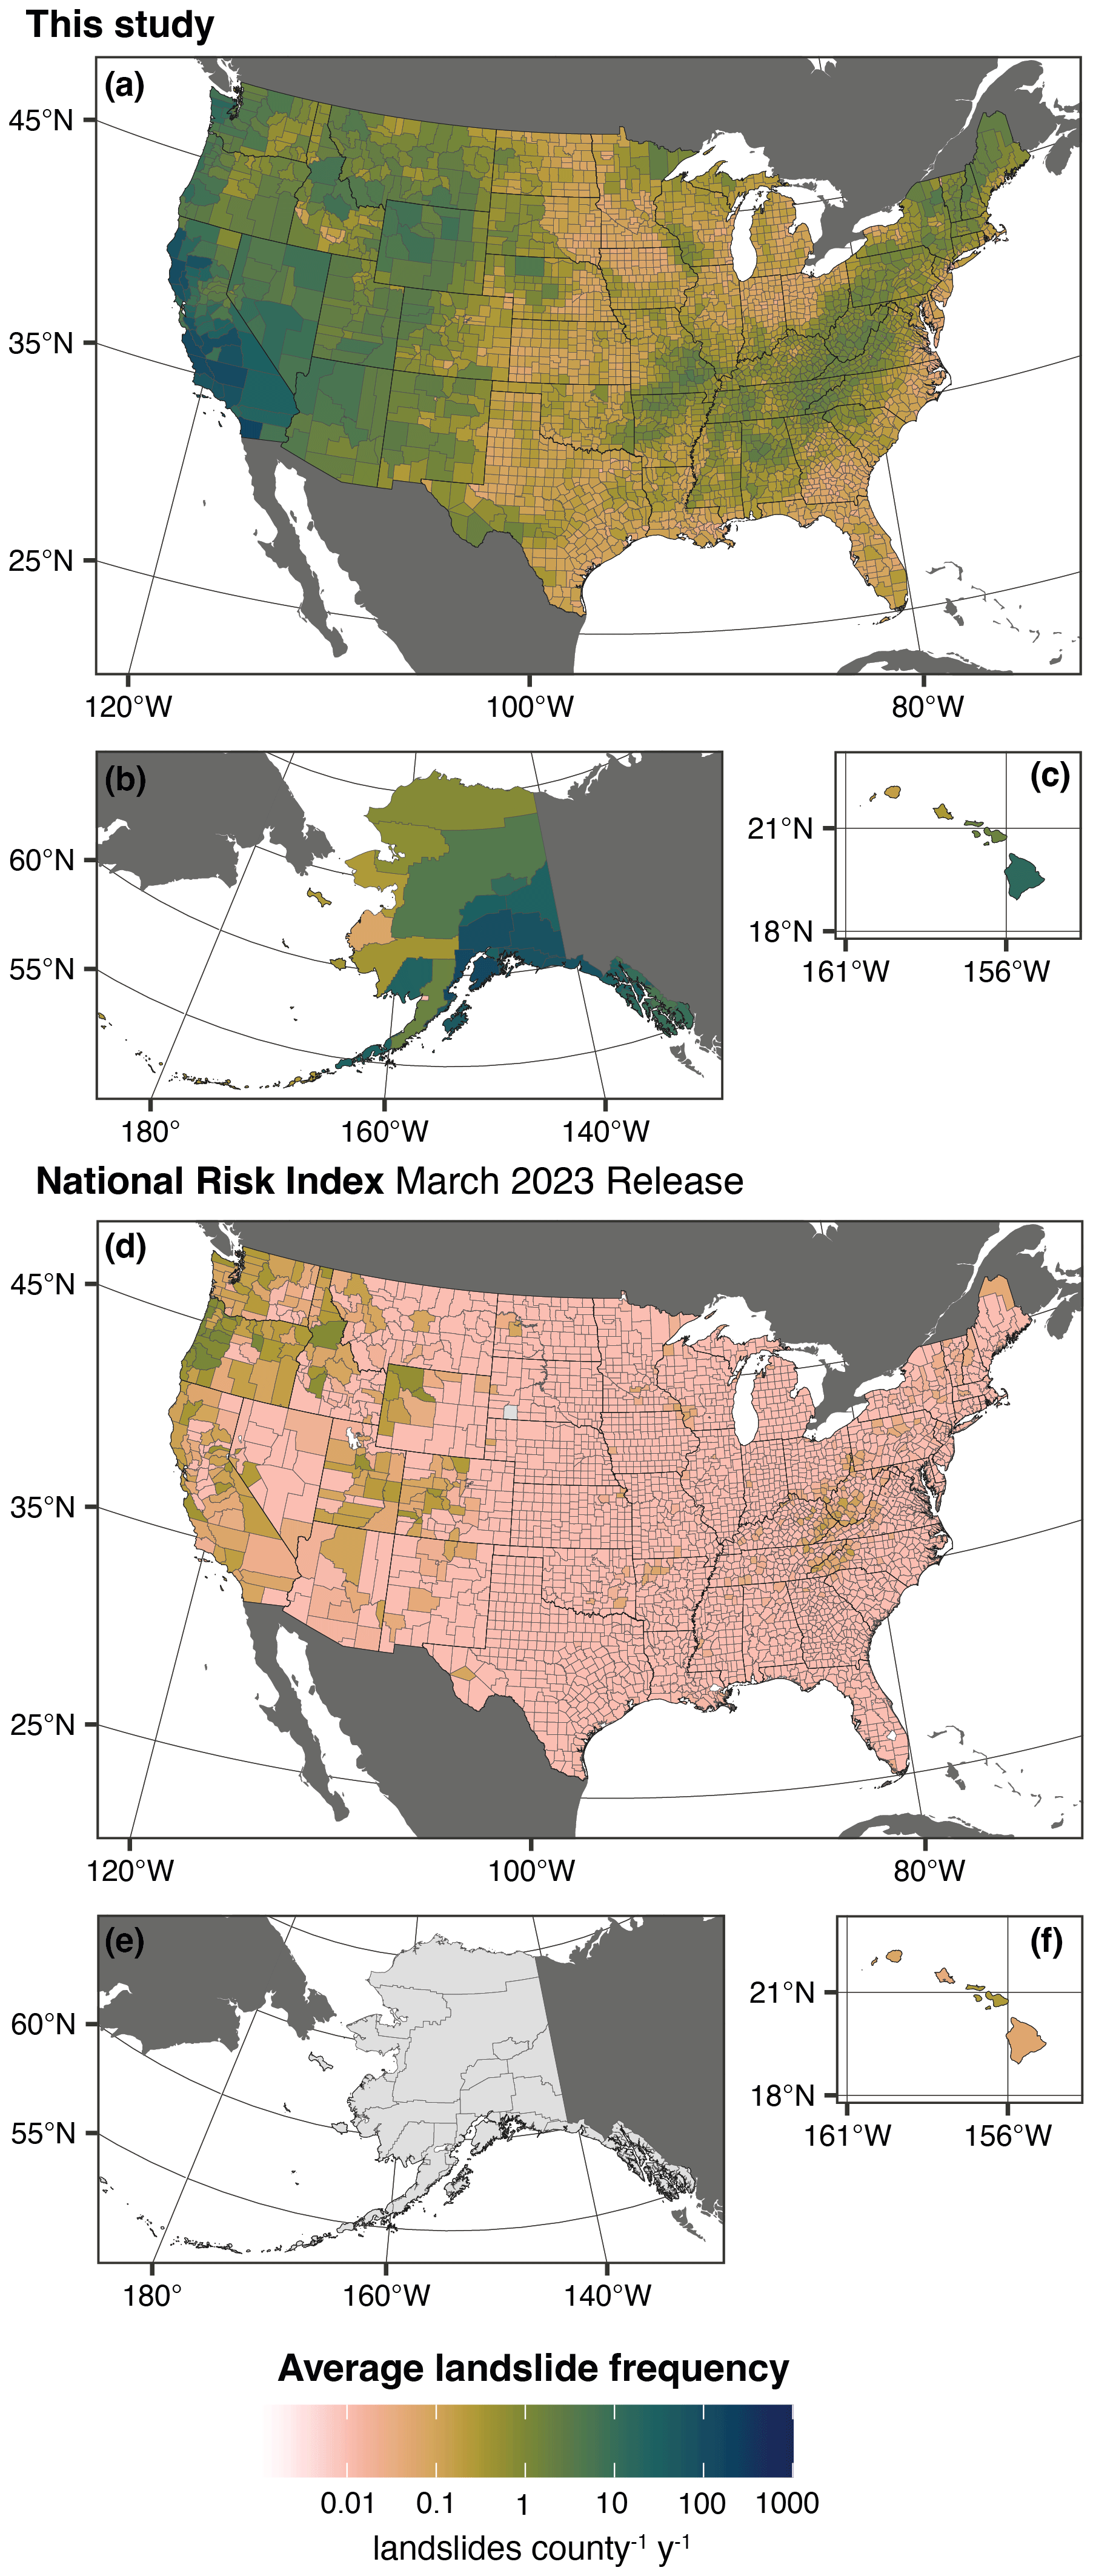
Figure 8Comparison to county-level landslide frequencies from the National Risk Index (NRI) March 2023 release. (a–c) Average landslide frequencies (landslides per county per year; posterior median) for 50-state US counties from this study. Note that these results are not normalized by area for consistency with the NRI; large counties will have higher estimated frequencies than small counties with the same landslide susceptibility and triggering characteristics. (d–f) Average landslide frequencies (landslides per county per year) for 50-state US counties from the Federal Emergency Management Agency (FEMA)'s National Risk Index (NRI) March 2023 release (Federal Emergency Management Agency, 2023a). Base map data in panels (a)–(c): US counties from U.S. Census Bureau Cartographic Boundary Files 1 : 500 000 (U.S. Census Bureau, 2023b), non-US administrative boundaries from Natural Earth (Natural Earth, 2022). (d–f) US counties and landslide frequency estimates from FEMA National Risk Index March 2023 release (Federal Emergency Management Agency, 2023a), non-US administrative boundaries from Natural Earth (Natural Earth, 2022). Projection and datum: (a, d) continental United States – Albers North American Datum 1983 (EPSG:5070); (b, e) Alaska – Albers North American Datum 1983 (EPSG:3467); (c, f) Hawaii – Old Hawaiian (EPSG:4135).
We present the first map of landslide frequencies for the entire United States, which we report at the county level across all 50 states. Our probabilistic estimates result from a Bayesian statistical model trained with data from counties with high-quality landslide inventories and account for gaps in reporting over time. We incorporated spatial information on terrain susceptibility and the relative frequency of potential-landslide-triggering conditions, which allowed for a consistent and accurate estimate of landslide hazard, even in areas without temporal constraints on landsliding. This approach offers advantages over approaches that assume that landslide inventories are complete in space and time. For example, Yuan and Chen (2023) applied a machine-learning model over CONUS and demonstrated that it predicted landslides only in those regions where they have been previously observed, but not in regions without any landslide timing data. Our model, in contrast, predicted the full distribution of landslide counts per year for each county, including for regions with known landslide susceptibility, but few or no landslides with reported timing. Furthermore, we report transparent uncertainty ranges for our estimates of annual landslide frequency and evaluate potential for the most extreme widespread landsliding events. These uncertainties reflect the difficulty in constraining a complex hazard that involves both landscape evolution processes over geologic time and the stochastic triggering conditions that are critical on the shorter timescale of concern for human effects. Comparing models with differing sets of predictor variables highlighted the utility of interpretable data-driven models for landslide frequency estimation, as they allowed us to identify and exclude models with satisfactory predictive accuracy but physically implausible parameter estimates.
Our results are largely consistent with available reported ranges of landslide recurrences from studies over smaller regions based on localized data and models. For example, Wooten et al. (2016) showed that widespread landslide events with hundreds of landslides occur every 9 years and thousands of landslides every 25 years across southern Appalachia. Cordeira et al. (2019) found at least 254 landslide days in 142 years of records for the San Francisco Bay Area, although they clarify that the actual number of landslides during this interval is known to be incomplete. Overall, three-quarters of our model predictions are within 1 landslide of the observed rates from our inventory. The remaining one-quarter that are less consistent with observations include predicted larger events with numerous landslides, where the observed number can vary considerably depending on many conditions from reporting biases to storm or earthquake size and extent and whether such events have occurred during the observation period.
One noteworthy advantage of using negative binomial distributions is that it enables us to consider the potential for extreme events, even for areas where they have not yet been recorded; this results in a much broader and realistic range of landslide frequencies than previous estimates. In contrast, the existing NRI model took a simpler approach to addressing landslide frequency by dividing the number of landslides reported in an inventory based on news and citizen scientists by the length of the record between 2010 and 2021, and then assigning a constant value to areas without sufficient data (Federal Emergency Management Agency, 2023b). This resulted in an underestimated and overly narrow range of landslide frequencies. Our model's predictions were higher, more variable, and more realistic as indicated by the more complete inventory data (Belair et al., 2025). Given the episodic and dispersed nature of landslides, as well as the incomplete and sparse historical records relative to other geologic hazards such as volcanic eruptions, earthquakes, and tsunamis, accounting for extreme events is important when considering estimates of annualized losses and planning risk mitigation efforts.
Our approach makes advances toward providing consistent landslide frequency estimates at a continental scale across the entire United States. However, limited understanding of how specific triggering conditions influence landslide activity across different regions of the country presented a considerable challenge to developing locally accurate estimates of landslide frequency. Accounting for these knowledge gaps required simplifying assumptions when selecting predictor variables to characterize seismic and hydrometeorological triggering conditions. Further research on regional landslide-triggering conditions could ultimately lead to major improvements in local estimates of landslide hazard. In the United States, rainfall thresholds for shallow landslides are known to vary regionally (e.g., Baum and Godt, 2010), but this variability has not been linked to specific environmental or terrain attributes that could be used to constrain thresholds across the entire country. Indeed, our model comparison showed that including the frequency of daily precipitation above a global threshold added little additional information on landslide frequency and resulted in a counterintuitive negative relationship between precipitation and landslide frequency. One explanation for this is that infrequently occurring storms with high precipitation accumulations have triggered widespread landsliding in areas that are often dry, e.g., atmospheric rivers in the San Francisco Bay Area (Corbett and Collins, 2023a; Thomas et al., 2018). Linking landslide occurrences to both frequency and magnitude of precipitation beyond a single intensity–duration threshold could improve estimates, but additional research would be needed to characterize the hydrometeorological conditions that are relevant for triggering landslides across the country. Thus, expansion beyond currently existing local studies would be needed (e.g., Collins et al., 2020; Oakley et al., 2017). For example, landslide frequency estimates for Hong Kong SAR, which has an area smaller than many US counties (1110 km2), were based on predicted landslide response to specific triggering storm scenarios. The estimated recurrence intervals of those storms were then used to constrain landslide frequency (Ko and Lo, 2018). Nevertheless, including ecoregion in our model served as an effective proxy for climate and other conditions that we did not explicitly incorporate, improving predictive accuracy.
Similarly, linking earthquake-triggered landslide activity to seismological parameters in specific regions (Luo et al., 2022; Marc et al., 2017; Meunier et al., 2007; Tanyaş et al., 2017) could allow for improved landslide frequency estimation. Our model comparison showed that including the 100-year probability of earthquakes with MMI ≧ VI improved predictive accuracy beyond models that considered only susceptible area and ecoregion, demonstrating its utility as a county-level indicator at a continental scale. However, as with precipitation, considering both frequency and magnitude of triggering earthquakes beyond a simple threshold would likely provide additional detail. The USGS Ground Failure product, for example, relies on peak ground velocity and a suite of other factors to predict areas expected to experience landslides from specific earthquakes (Allstadt et al., 2022; Nowicki Jessee et al., 2018). Integrating this knowledge with estimated earthquake frequencies from the NSHM could improve frequency estimates for earthquake-triggered landslides. We also acknowledge that areas with high earthquake probability tend to have higher uplift and erosion rates that likely correlate with increased landslide frequency, even in the absence of specific triggering earthquake events in our inventory data for some counties. Moreover, differentiating by slope failure type could improve characterization of frequencies based on the expected range of triggering conditions associated with these types: our model may not adequately capture the isolated large deep-seated landslides triggered by prolonged low-intensity rainfall over several weeks or months, for example. Given the uncertainty in the spatial and temporal controls that drive landsliding over an area as vast as the United States, our pragmatic approach provides a framework and benchmark at continental scales, and we expect that improved regional sub-models would likely lead to further improvements in our estimates.
Overall, our landslide frequency estimates are likely conservative, as reported landslides are known to be a small subset of all landslides, and our historical records include only a few truly extreme events relative to the geologic timescale of landscape evolution. Although we acknowledge that these records are likely incomplete, we consider it unlikely that the observed right-skewed distributions result from reporting bias, given the consistent occurrence of such distributions across counties covered by different inventories. The influence of underreporting on average landslide frequency estimates is, however, particularly pronounced in the Tundra and Taiga ecoregion in Alaska, which has few reported landslides in our inventory data despite substantial potential for landsliding, e.g., due to permafrost degradation (Patton et al., 2019). Nevertheless, we do offer estimates of reported landslide frequency for all counties if those counties had landslide inventory data like the counties with the most comprehensive information available nationwide and account for the spatial distribution of landsliding by including terrain and triggering characteristics in our model. Our results successfully addressed the primary objective of providing improved input on landslide frequencies for pending revisions to FEMA's national-scale risk assessment and can also inform other risk-reduction and loss-mitigation efforts across the United States (Godt et al., 2022).
We present a novel framework for estimating landslide frequency across vast areas by leveraging available landslide inventory data with reported timing and using statistical modelling to make predictions for areas with limited landslide records. Our approach uses Bayesian negative binomial regression to estimate county-level landslide frequency as a function of landslide susceptibility, probability of potentially landslide-triggering earthquakes, and ecoregion as a proxy for factors influencing landslide frequency that we do not explicitly consider in our model. Our method enables accurate estimates of very low landslide frequencies and considers the potential for extreme, widespread landsliding events. Our results are consistent with existing landslide occurrence data and previous local frequency estimates but represent the range of possible landslide frequencies and spatial variations across the entire United States more accurately than previous national estimates reported in the NRI. These contributions represent an advance for the United States by taking a major step beyond the current national landslide susceptibility map that shows only where landslides are likely (regardless of timescale) to quantifying how landslide frequency (how often) varies across the entire nation. This step toward a national landslide hazard model is limited by data availability and process understanding of regionally specific landslide response to triggering conditions. As such, by incorporating future data collection and research advances, our framework can be updated to drive further improvements in continental-scale modelling of landslide frequency for hazard and risk assessments.
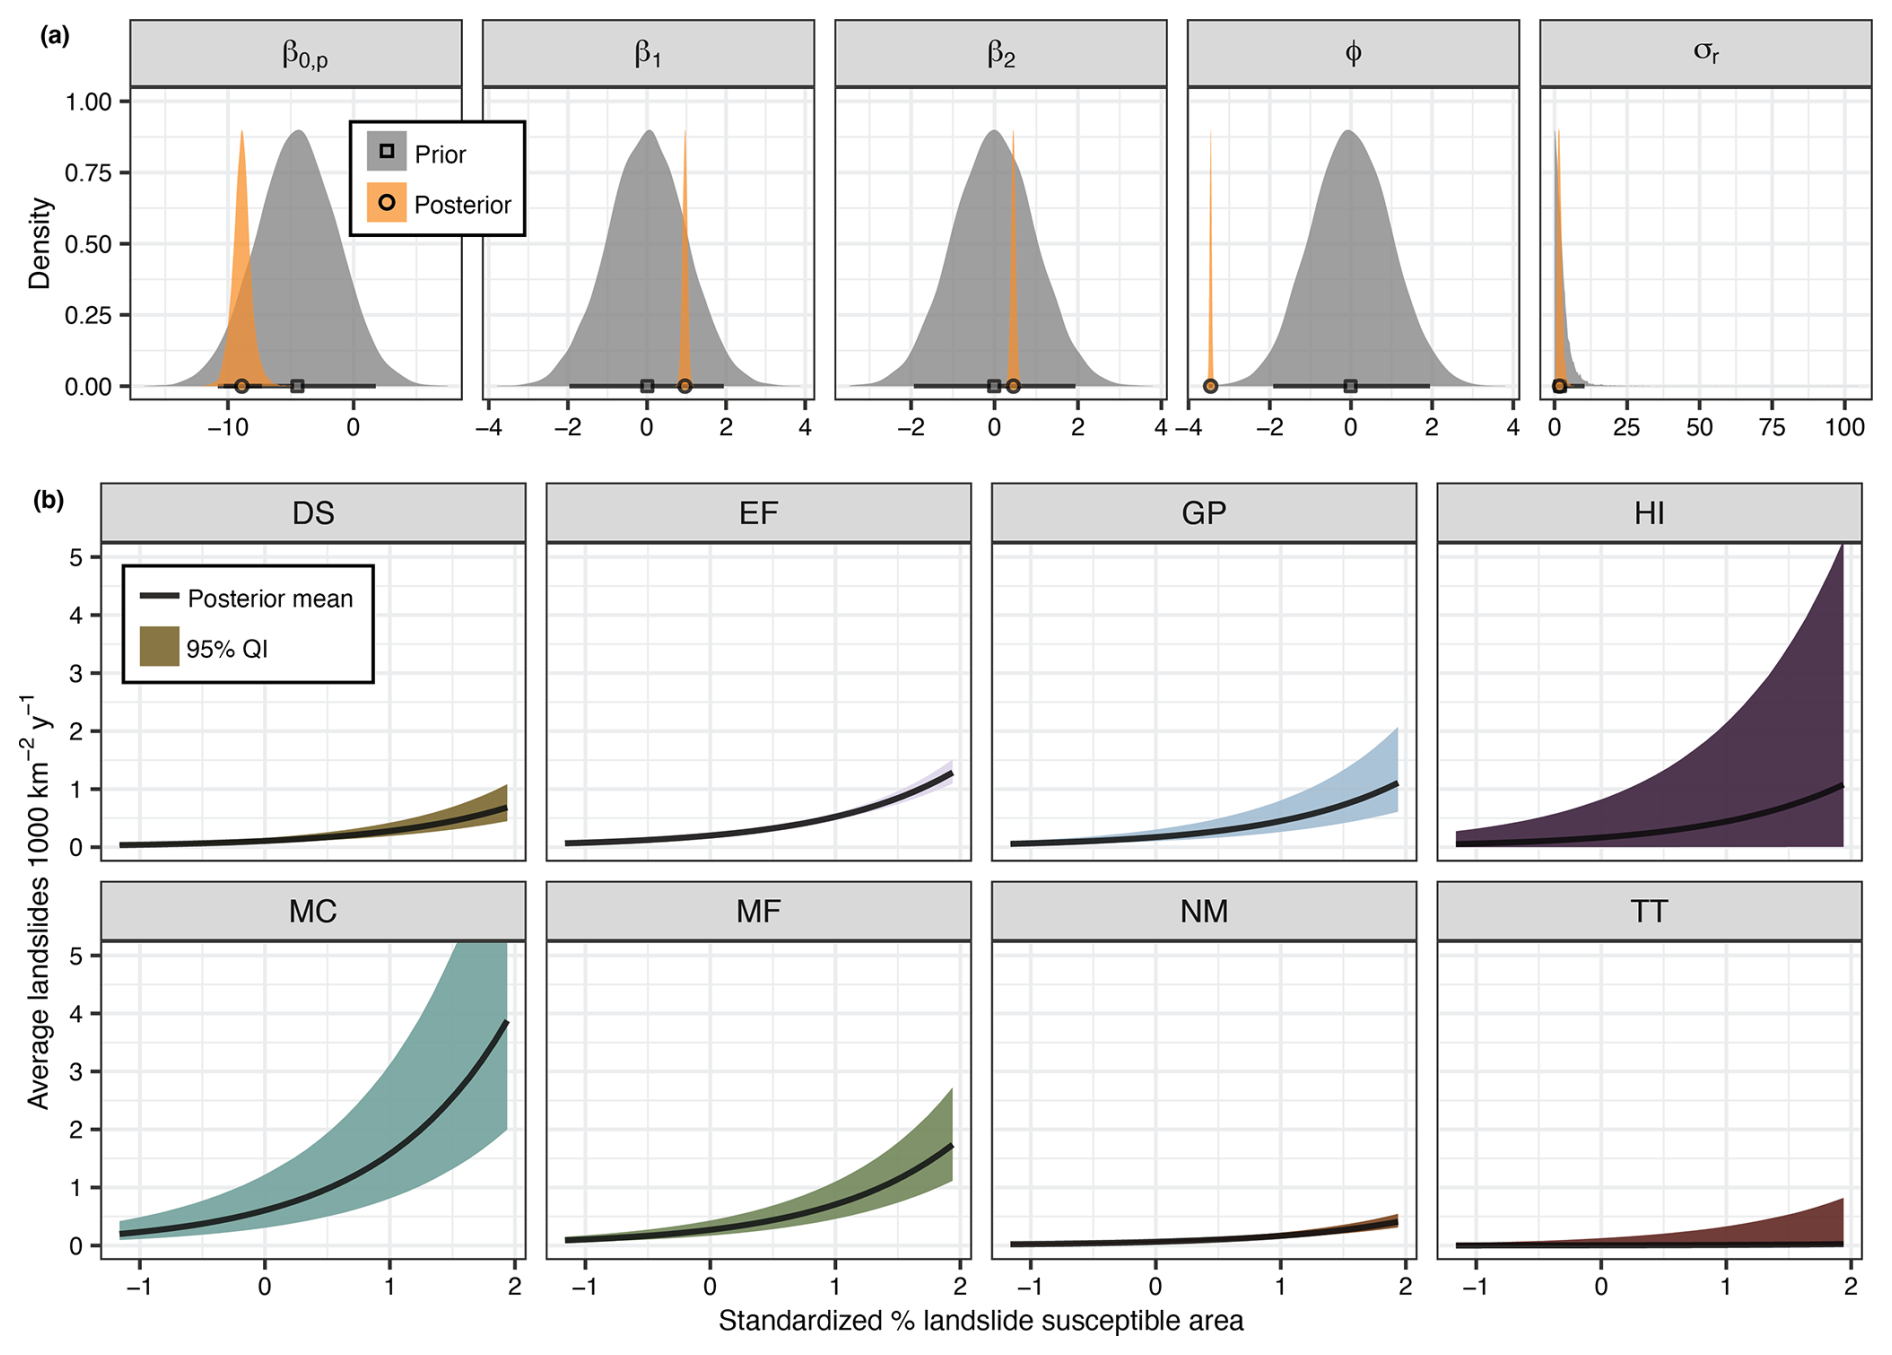
Figure A1Parameter distributions. (a) Prior and posterior parameter distributions. Points and bars show the median and 95 % quantile interval (QI), respectively. In the generalized linear model, β0,p is the population level intercept, β1 is the coefficient of standardized percent landslide-susceptible area, and β2 of is the coefficient of standardized probability of potentially landslide-triggering earthquakes. φ is the shape parameter of the negative binomial distribution, and σr describes the spread between ecoregion groups. (b) Expected value of the posterior distribution at mean probability of potentially landslide-triggering earthquakes by ecoregion: Deserts (DS), Eastern Forests (EF), Great Plains (GP), Marine West Coast Forest (MF), Mediterranean California (MC), Northwestern Forested Mountains (NM), and Tundra and Taiga (TT). Lines show the mean and shaded regions the 95th percentile QI. These counterfactual plots visualize how the average landslide frequency changes with varying standardized susceptible area in each ecoregion, assuming a constant triggering earthquake probability (the mean across counties, 0.15 probability of an earthquake with modified Mercalli intensity (MMI) ≧ VI in 100 years). A standardized susceptible area of 0 indicates the mean percent susceptible area across counties (41 %), with 1 indicating 1 standard deviation above the mean and with −1 indicating 1 standard deviation below the mean.
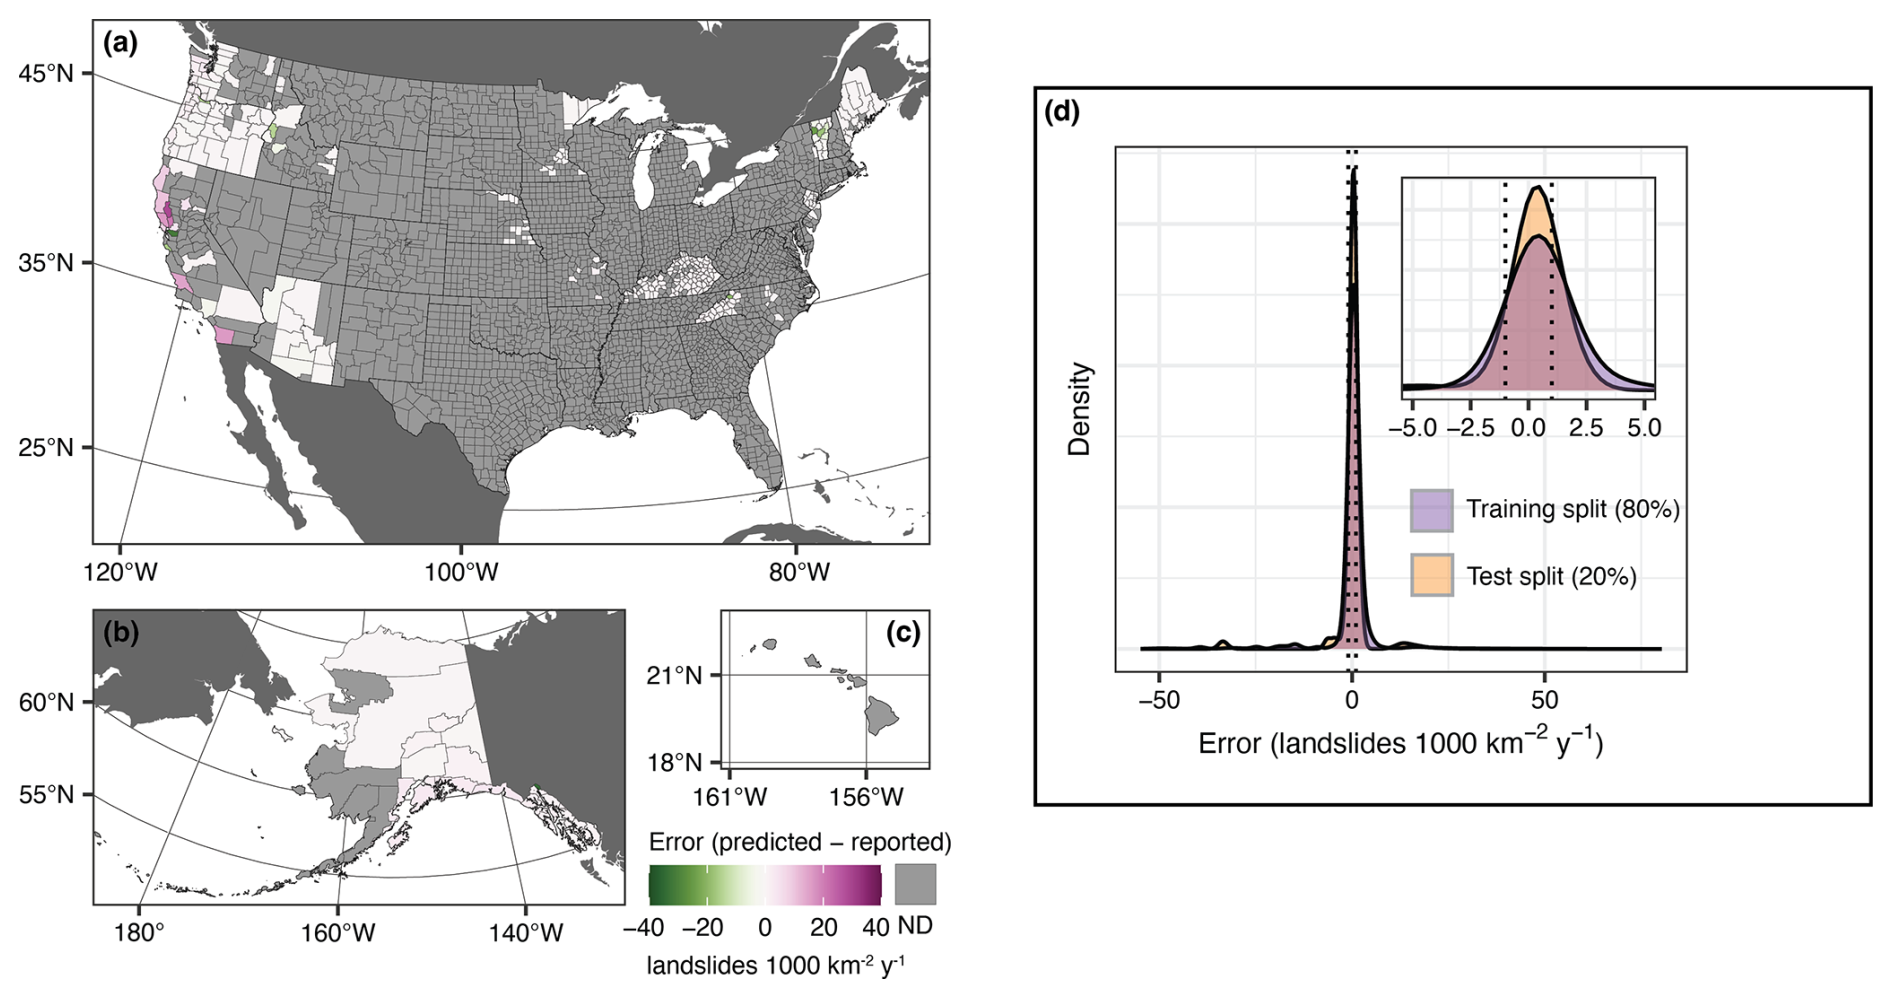
Figure A2Error distribution. (a–c) County-level error calculated as the difference between predicted and reported average annual landslide frequencies. (d) Error distributions for one example training and testing cross-validation split. Dotted lines are visual guides at errors of −1 and 1 landslides 1000 km−2 yr−1. Base map data in panels (a)–(c): US counties from U.S. Census Bureau Cartographic Boundary Files 1 : 500 000 (U.S. Census Bureau, 2023b), non-US administrative boundaries from Natural Earth (Natural Earth, 2022). Projection and datum: (a) continental United States Albers North American Datum 1983 (EPSG:5070); (b) Alaska Albers North American Datum 1983 (EPSG:3467); (c, f) Old Hawaiian (EPSG:4135).
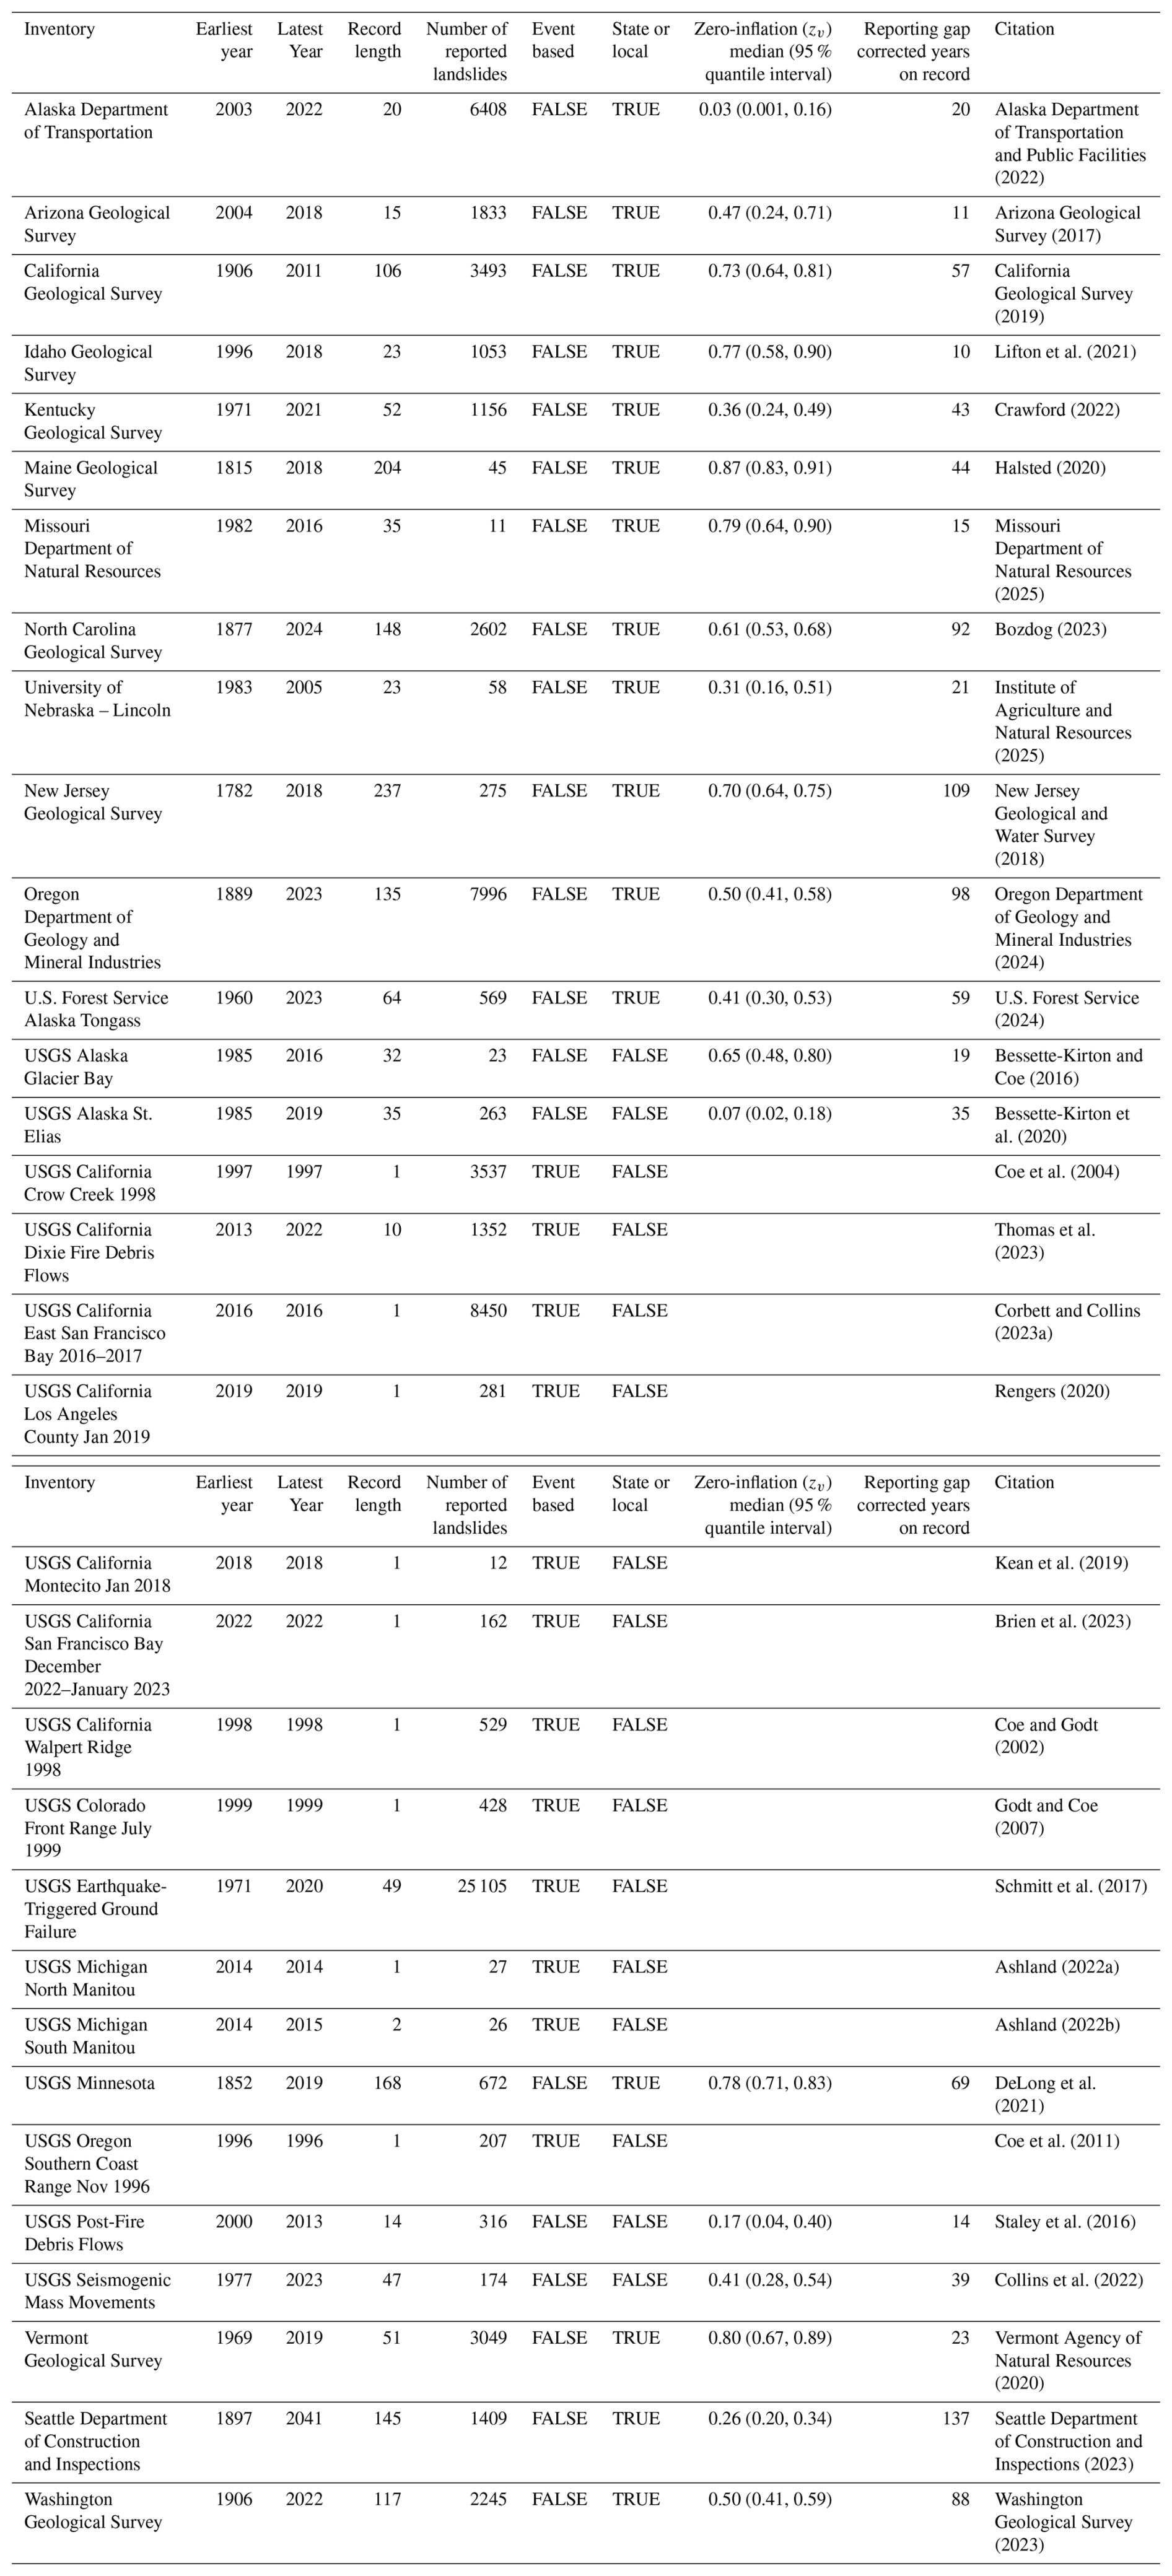
The code used to perform the analysis is archived as a USGS software release (https://doi.org/10.5066/P142ZLDX, Luna and Woodard, 2025).
All data used in this study are publicly available from the following sources:
-
This dataset includes all landslide inventories listed in Table A1. USGS Landslide Inventories Across the United States compilation, version 3: https://doi.org/10.5066/P14AJF8I (Belair et al., 2025),
-
U.S. Census Bureau Cartographic Boundary Files 1 : 500 000: https://www.census.gov/geographies/mapping-files/time-series/geo/cartographic-boundary.html (last access: 11 September 2024),
-
Natural Earth Administrative Boundaries: https://www.naturalearthdata.com/downloads/50m-cultural-vectors/ (last access: 11 September 2024),
-
USGS National Landslide Susceptibility Model: https://doi.org/10.5066/P13KAGU3 (Belair et al., 2024),
-
U.S. Census Bureau Tiger/Line Counties 2023: https://www.census.gov/cgi-bin/geo/shapefiles/index.php (last access: 19 September 2024),
-
U.S. National Atlas Water Feature Areas dataset: https://www.arcgis.com/home/item.html?id=0eb5f7b586ea4e08b5003b3554032453 (last access: 24 July 2023),
-
Level 1 Ecoregions of North America: https://www.epa.gov/eco-research/ecoregions-north-america (last accesss: 15 January 2025),
-
Analysis of Record for Calibration (AORC) v1.1: https://hydrology.nws.noaa.gov/pub/AORC/V1.1/ (last access: 17 January 2025),
-
Global Historical Climatology Network Daily: https://www.ncei.noaa.gov/pub/data/ghcn/daily/by_station/ (last access: 15 October 2024),
-
U.S. 50-State National Seismic Hazard Model: https://doi.org/10.5066/P9GNPCOD (Petersen et al., 2023).
Conceptualization: LVL, JBW, BBM. Data curation: GMB, JLB. Formal analysis: LVL, JBW. Methodology: LVL, JBW. Software: LVL, JBW. Validation: LVL, JBW. Visualization: LVL. Writing (original draft): LVL, JBW, BBM, JLB. Writing (reviewing and editing): LVL, JBW, BBM, JLB, GMB.
The contact author has declared that none of the authors has any competing interests.
Any use of trade, firm, or product names is for descriptive purposes only and does not imply endorsement by the U.S. Government.
Publisher's note: Copernicus Publications remains neutral with regard to jurisdictional claims made in the text, published maps, institutional affiliations, or any other geographical representation in this paper. While Copernicus Publications makes every effort to include appropriate place names, the final responsibility lies with the authors.
We thank USGS colleagues for valuable feedback and discussions that inspired this work and improved the approach and manuscript. We thank Maria Teresa Brunetti and an anonymous reviewer for constructive reviews that helped to improve the manuscript.
This paper was edited by Oded Katz and reviewed by Maria Teresa Brunetti and one anonymous referee.
Alaska Department of Transportation and Public Facilities: Geo Event Tracker, Alaska Department of Transportation and Public Facilities [data set], https://www.arcgis.com/home/item.html?id=7d34a6dc51194296be7a38fd965c22c2 (last access: 15 October 2024), 2022.
Allstadt, K. E., Thompson, E. M., Jibson, R. W., Wald, D. J., Hearne, M., Hunter, E. J., Fee, J., Schovanec, H., Slosky, D., and Haynie, K. L.: The US Geological Survey ground failure product: Near-real-time estimates of earthquake-triggered landslides and liquefaction, Earthq. Spectra, 38, 5–36, https://doi.org/10.1177/87552930211032685, 2022.
Arizona Geological Survey: Landslides, Arizona Geological Survey [data set], https://uagis.maps.arcgis.com/apps/webappviewer/index.html?id=98729f76e4644f1093d1c2cd6dabb584 (last access: 15 October 2024), 2017.
Ashland, F. X.: Preliminary reconnaissance inventory map data of landslides and related features, North Manitou Island, Sleeping Bear Dunes National Lakeshore, Michigan, U.S. Geological Survey data release [data set], https://doi.org/10.5066/P92LZ8R2, 2022a.
Ashland, F. X.: Preliminary reconnaissance inventory map data of landslides and related features, South Manitou Island, Sleeping Bear Dunes National Lakeshore, Michigan, U.S. Geological Survey data release [data set], https://doi.org/10.5066/P9SQWQ37, 2022b.
Baum, R. L. and Godt, J. W.: Early warning of rainfall-induced shallow landslides and debris flows in the USA, Landslides, 7, 259–272, https://doi.org/10.1007/s10346-009-0177-0, 2010.
Baum, R. L., Godt, J. W., and Savage, W. Z.: Estimating the timing and location of shallow rainfall-induced landslides using a model for transient, unsaturated infiltration, J. Geophys. Res.-Earth, 115, https://doi.org/10.1029/2009JF001321, 2010.
Belair, G. M., Jones, J. M., Martinez, S. N., Mirus, B. B., and Wood, N. J.: Slope-relief threshold landslide susceptibility models for the United States and Puerto Rico, U.S. Geological Survey data release [data set], https://doi.org/10.5066/P13KAGU3, 2024.
Belair, G. M., Jones, E. S., Luna, L. V., and Mirus, B. B.: Landslide inventories across the United States (ver. 3.0, February 2025), U.S. Geological Survey data release [data set], https://doi.org/10.5066/P14AJF8I, 2025.
Bessette-Kirton, E. K. and Coe, J. A.: Inventory of rock avalanches in western Glacier Bay National Park and Preserve, Alaska, 1984–2016: A baseline data set for evaluating the impact of climate change on avalanche magnitude, mobility, and frequency, U.S. Geological Survey data release [data set], https://doi.org/10.5066/F7C827F8, 2016.
Bessette-Kirton, E. K., Coe, J. A., and Kellogg, I. N.: Inventory data of rock avalanches in the Saint Elias Mountains of southeast Alaska, derived from Landsat imagery (1984–2019), U.S. Geological Survey data release [data set], https://doi.org/10.5066/P97JTGDH, 2020.
Bordoni, M., Vivaldi, V., Lucchelli, L., Ciabatta, L., Brocca, L., Galve, J. P., and Meisina, C.: Development of a data-driven model for spatial and temporal shallow landslide probability of occurrence at catchment scale, Landslides, 18, 1209–1229, https://doi.org/10.1007/s10346-020-01592-3, 2021.
Bozdog, N.: North Carolina landslide points, outlines, deposits, North Carolina Department of Environmental Quality [data set], https://www.nconemap.gov/search?q=landslides (last access: 15 March 2022), 2023.
Brewer, C., Harrower, M., Sheesley, B., Woodruff, A., and Heyman, D.: ColorBrewer 2.0, [code], https://colorbrewer2.org/# (last access: 29 August 2025), 2013.
Brien, D. L., Collins, B. D., Corbett, S. C., and Perkins, J. P.: San Francisco Bay Area Reconnaissance Landslide Inventory, January 2023, U.S. Geological Survey data release [data set], https://doi.org/10.5066/P9NJ3KMG, 2023.
Bryce, E., Lombardo, L., van Westen, C., Tanyas, H., and Castro-Camilo, D.: Unified landslide hazard assessment using hurdle models: a case study in the Island of Dominica, Stoch. Environ. Res. Risk Assess., 36, 2071–2084, https://doi.org/10.1007/s00477-022-02239-6, 2022.
Bürkner, P.-C.: brms: An R package for Bayesian multilevel models using Stan, J. Stat. Softw., 80, 1–28, https://doi.org/10.18637/jss.v080.i01, 2017.
California Geological Survey: Landslide inventory, California Geological Survey [data set], https://maps.conservation.ca.gov/cgs/lsi/app/ (last access: 15 March 2022), 2019.
Coe, J. A. and Godt, J. W.: Debris flows triggered by the El Niño rainstorm of February 2–3, 1998, Walpert Ridge and vicinity, Alameda County, California, U.S. Geological Survey Miscellaneous Field Studies Map MF-2384 [data set], https://pubs.usgs.gov/mf/2002/mf-2384/ (last access: 15 March 2022), 2002.
Coe, J. A., Godt, J. W., and Tachker, P.: Map showing recent (1997-98 El Niño) and historical landslides, Crow Creek and vicinity, Alameda and Contra Costa Counties, California, U.S. Geological Survey Scientific Investigations Map 2859 [data set], https://pubs.usgs.gov/sim/2004/2859/ (last access: 15 March 2022), 2004.
Coe, J. A., Michael, J. A., and Mercado Burgos, M.: Map of debris flows caused by rainfall during 1996 in parts of the Reedsport and Deer Head Point quadrangles, Douglas County, Southern Coast Range, Oregon, U.S. Geological Survey Open-File Report 2011–1150, 9 pp. pamphlet, 1 sheet, scale 1 : 12 000, https://pubs.usgs.gov/of/2011/1150/ (last access: 15 March 2022), 2011.
Collins, B. D., Stock, J. D., Weber, L. C., Whitman, K., and Knepprath, N.: Monitoring subsurface hydrologic response for precipitation-induced shallow landsliding in the San Francisco Bay area, California, USA, in: Landslides and engineered slopes: Protecting society through improved understanding, Proceedings of the 11th International Symposium on Landslides, 2–8 June 2012, Banff, Alberta, Canada, https://pubs.usgs.gov/publication/70191838 (last access: 29 August 2025), 2012.
Collins, B. D., Oakley, N. S., Perkins, J. P., East, A. E., Corbett, S. C., and Hatchett, B. J.: Linking mesoscale meteorology with extreme landscape response: Effects of Narrow Cold Frontal Rainbands (NCFR), J. Geophys. Res.-Earth, 125, e2020JF005675, https://doi.org/10.1029/2020JF005675, 2020.
Collins, E. A., Allstadt, K. E., Groult, C., Hibert, C., Maley, J.-P., Toney, L. D., and Jensen, E. K.: Seismogenic landslides and other mass movements (ver. 2.0, December 2023), U.S. Geological Survey data release [data set], https://doi.org/10.5066/P90VGCSK, 2022.
Corbett, S. C. and Collins, B. D.: Landslides triggered by the 2016–2017 storm season, eastern San Francisco Bay region, California, U.S. Geological Survey data release [data set], https://doi.org/10.3133/sim3503, 2023a.
Corbett, S. C. and Collins, B. D.: Mapped polygons of landslides triggered by the 2016–2017 storm season, eastern San Francisco Bay region, California, U.S. Geological Survey data release [data set], https://doi.org/10.5066/P98MVEGI, 2023b.
Cordeira, J. M., Stock, J., Dettinger, M. D., Young, A. M., Kalansky, J. F., and Ralph, F. M.: A 142-Year climatology of Northern California landslides and atmospheric rivers, B. Am. Meteorol. Soc., 100, 1499–1509, https://doi.org/10.1175/BAMS-D-18-0158.1, 2019.
Corominas, J. and Moya, J.: A review of assessing landslide frequency for hazard zoning purposes, Eng. Geol., 102, 193–213, https://doi.org/10.1016/j.enggeo.2008.03.018, 2008.
Corominas, J., van Westen, C., Frattini, P., Cascini, L., Malet, J.-P., Fotopoulou, S., Catani, F., Van Den Eeckhaut, M., Mavrouli, O., Agliardi, F., Pitilakis, K., Winter, M. G., Pastor, M., Ferlisi, S., Tofani, V., Hervás, J., and Smith, J. T.: Recommendations for the quantitative analysis of landslide risk, B. Eng. Geol. Environ., 73, 209–263, https://doi.org/10.1007/s10064-013-0538-8, 2014.
Crameri, F.: Scientific colour maps, Zenodo [code], https://doi.org/10.5281/zenodo.8409685, 2023.
Crawford, M. M.: Kentucky Geological Survey landslide inventory [2022-01], Kentucky Geological Survey research data [data set], https://uknowledge.uky.edu/kgs_data/7/ (last access: 15 October 2024), 2022.
Crozier, M. J. and Glade, T.: Landslide hazard and risk: Issues, concepts and approach, in: Landslide Hazard and Risk, John Wiley & Sons, Ltd, 1–40, https://doi.org/10.1002/9780470012659.ch1, 2005.
Dahal, A., Huser, R., and Lombardo, L.: At the junction between deep learning and statistics of extremes: Formalizing the landslide hazard definition, J. Geophys. Res.-Machine Learning and Computation, 1, e2024JH000164, https://doi.org/10.1029/2024JH000164, 2024a.
Dahal, A., Tanyas, H., van Westen, C., van der Meijde, M., Mai, P. M., Huser, R., and Lombardo, L.: Space–time landslide hazard modeling via Ensemble Neural Networks, Nat. Hazards Earth Syst. Sci., 24, 823–845, https://doi.org/10.5194/nhess-24-823-2024, 2024b.
DeLong, S. B., Engle, Z. T., Hammer, M. N., Jennings, C. E., Gran, K. B., Bartley, J. K., Blumentritt, D. J., Breckenridge, A. J., Day, S., Larson, P. H., McDermott, J. A., Triplett, L. D., Wickert, A. D., Richard, E. M., Swanson, M. A., Allison, M., Dahlseid, A., Dahly, D. T., Dean, B. A., Endres, M., Kurak, E., Link, S., Matti, B., Rehwinkel, R. W., Sockness, B., VanBerkel, J., Willard, J. G., and Williams, A. B.: Inventory of landslides in the northwestern, northeastern, southern, and southeastern parts of Minnesota, U.S. Geological Survey data release [data set], https://doi.org/10.5066/P94KF6OM, 2021.
Di Napoli, M., Tanyas, H., Castro-Camilo, D., Calcaterra, D., Cevasco, A., Di Martire, D., Pepe, G., Brandolini, P., and Lombardo, L.: On the estimation of landslide intensity, hazard and density via data-driven models, Nat. Hazards, 119, 1513–1530, https://doi.org/10.1007/s11069-023-06153-0, 2023.
Dowling, C. A. and Santi, P. M.: Debris flows and their toll on human life: a global analysis of debris-flow fatalities from 1950 to 2011, Nat. Hazards, 71, 203–227, https://doi.org/10.1007/s11069-013-0907-4, 2014.
Du, J.: NCEP/EMC 4KM Gridded Data (GRIB) Stage IV Data, Version 1.0 (1.0), NSF NCAR Earth Observing Laboratory [data set], https://doi.org/10.5065/D6PG1QDD, 2011.
ESRI: U.S. National Atlas Water Feature Areas – Water Bodies, ESRI [data set], https://www.arcgis.com/home/item.html?id=0eb5f7b586ea4e08b5003b3554032453 (last access: 24 July 2023), 2022.
Fall, G., Kitzmiller, D., Pavlovic, S., Zhang, Z., Patrick, N., St. Laurent, M., Trypaluk, C., Wu, W., and Miller, D.: The Office of Water Prediction's Analysis of Record for Calibration, version 1.1: Dataset description and precipitation evaluation, J. Am. Water Resour. As., 59, 1246–1272, https://doi.org/10.1111/1752-1688.13143, 2023.
Federal Emergency Management Agency: National Risk Index (1.19.0), Federal Emergency Management Agency [data set], https://hazards.fema.gov/nri/data-resources (last access: 13 November 2024), 2023a.
Federal Emergency Management Agency: National Risk Index Technical Documentation, Federal Emergency Management Agency:, https://www.fema.gov/sites/default/files/documents/fema_national-risk-index_technical-documentation.pdf (last access: 13 November 2024), 2023b.
Frattini, P., Crosta, G., and Sosio, R.: Approaches for defining thresholds and return periods for rainfall-triggered shallow landslides, Hydrol. Process., 23, 1444–1460, https://doi.org/10.1002/hyp.7269, 2009.
Froude, M. J. and Petley, D. N.: Global fatal landslide occurrence from 2004 to 2016, Nat. Hazards Earth Syst. Sci., 18, 2161–2181, https://doi.org/10.5194/nhess-18-2161-2018, 2018.
Gariano, S. L. and Guzzetti, F.: Landslides in a changing climate, Earth-Sci. Rev., 162, 227–252, https://doi.org/10.1016/j.earscirev.2016.08.011, 2016.
Glade, T. and Crozier, M. J.: A review of scale dependency in landslide hazard and risk analysis, in: Landslide Hazard and Risk, John Wiley & Sons, Ltd, 75–138, https://doi.org/10.1002/9780470012659.ch3, 2005.
Godt, J. W. and Coe, J. A.: Alpine debris flows triggered by a 28 July 1999 thunderstorm in the central Front Range, Colorado, Geomorphology, 84, 80–97, https://doi.org/10.1016/j.geomorph.2006.07.009, 2007.
Godt, J. W., Wood, N. J., Pennaz, A. B., Dacey, C. M., Mirus, B. B., Shaefer, L. N., and Slaughter, S. L.: National strategy for landslide loss reduction: U.S. Geological Survey Open-File Report 2022–1075, https://doi.org/10.3133/ofr20221075, 2022.
Guzzetti, F., Reichenbach, P., Cardinali, M., Galli, M., and Ardizzone, F.: Probabilistic landslide hazard assessment at the basin scale, Geomorphology, 72, 272–299, https://doi.org/10.1016/j.geomorph.2005.06.002, 2005.
Guzzetti, F., Peruccacci, S., Rossi, M., and Stark, C. P.: The rainfall intensity–duration control of shallow landslides and debris flows: an update, Landslides, 5, 3–17, https://doi.org/10.1007/s10346-007-0112-1, 2008.
Halsted, C. H.: Maine landslides, Maine Geological Survey [data set], https://www.maine.gov/dacf/mgs/hazards/landslides/inland/index.shtml (last access: 15 October 2024), 2020.
Institute of Agriculture and Natural Resources: Collection of Nebraska Landslides, University of Nebraska Lincoln School of Natural Resources, https://snr.unl.edu/data/geologysoils/landslides/landslidedatabase.aspx (last access: 15 October 2024), 2025.
Iverson, R. M.: Landslide triggering by rain infiltration, Water Resour. Res., 36, 1897–1910, https://doi.org/10.1029/2000WR900090, 2000.
Jibson, R. W.: Methods for assessing the stability of slopes during earthquakes – A retrospective, Eng. Geol., 122, 43–50, https://doi.org/10.1016/j.enggeo.2010.09.017, 2011.
Juang, C. S., Stanley, T. A., and Kirschbaum, D. B.: Using citizen science to expand the global map of landslides: Introducing the Cooperative Open Online Landslide Repository (COOLR), PLOS ONE, 14, e0218657, https://doi.org/10.1371/journal.pone.0218657, 2019.
Kean, J. W., Staley, D. M., Lancaster, J. T., Rengers, F. K., Swanson, B. J., Coe, J. A., Hernandez, J. L., Sigman, A. J., Allstadt, K. E., and Lindsay, D. N.: Debris-flow inundation and damage data from the 9 January 2018 Montecito debris-flow event, U.S. Geological Survey data release [data set], https://doi.org/10.5066/P9JQJU0E, 2019.
Ko, F. W. Y. and Lo, F. L. C.: From landslide susceptibility to landslide frequency: A territory-wide study in Hong Kong, Eng. Geol., 242, 12–22, https://doi.org/10.1016/j.enggeo.2018.05.001, 2018.
Korup, O., Luna, L. V., and Ferrer, J. V.: Size scaling of large landslides from incomplete inventories, Nat. Hazards Earth Syst. Sci., 24, 3815–3832, https://doi.org/10.5194/nhess-24-3815-2024, 2024.
Kruschke, J.: Doing Bayesian Data Analysis: A Tutorial with R, JAGS, and Stan, Academic Press, 772 pp., ISBN 978-0-12-405916-0, 2014.
Lari, S., Frattini, P., and Crosta, G. B.: A probabilistic approach for landslide hazard analysis, Eng. Geol., 182, 3–14, https://doi.org/10.1016/j.enggeo.2014.07.015, 2014.
Lifton, Z. M., Ducar, S. D., and Tate, C. A.: Landslide inventory database for Idaho, Idaho Geological Survey [data set], https://www.idahogeology.org/product/DD-10 (last access: 15 October 2024), 2021.
Lombardo, L., Opitz, T., Ardizzone, F., Guzzetti, F., and Huser, R.: Space-time landslide predictive modelling, Earth-Sci. Rev., 209, 103318, https://doi.org/10.1016/j.earscirev.2020.103318, 2020.
Luna, L. V. and Korup, O.: Seasonal landslide activity lags annual precipitation pattern in the Pacific Northwest, Geophys. Res. Lett., 49, e2022GL098506, https://doi.org/10.1029/2022GL098506, 2022.
Luna, L. V. and Woodard, J. B.: Bayesian county-level landslide frequency estimation for the 50 U.S. States, U.S. Geological Survey software release [code], https://doi.org/10.5066/P142ZLDX, 2025.
Luo, L., Lombardo, L., van Westen, C., Pei, X., and Huang, R.: From scenario-based seismic hazard to scenario-based landslide hazard: rewinding to the past via statistical simulations, Stoch. Environ. Res. Risk Assess., 36, 2243–2264, https://doi.org/10.1007/s00477-020-01959-x, 2022.
Marc, O., Meunier, P., and Hovius, N.: Prediction of the area affected by earthquake-induced landsliding based on seismological parameters, Nat. Hazards Earth Syst. Sci., 17, 1159–1175, https://doi.org/10.5194/nhess-17-1159-2017, 2017.
McElreath, R.: Statistical rethinking a Bayesian course with examples in R and STAN, 2nd edn., Chapman and Hall/CRC Press, ISBN 978-0-367-13991-9, 2020.
Meunier, P., Hovius, N., and Haines, A. J.: Regional patterns of earthquake-triggered landslides and their relation to ground motion, Geophys. Res. Lett., 34, https://doi.org/10.1029/2007GL031337, 2007.
Minami, M., Lennert-Cody, C. E., Gao, W., and Román-Verdesoto, M.: Modeling shark bycatch: The zero-inflated negative binomial regression model with smoothing, Fish. Res., 84, 210–221, https://doi.org/10.1016/j.fishres.2006.10.019, 2007.
Mirus, B. B., Jones, E. S., Baum, R. L., Godt, J. W., Slaughter, S., Crawford, M. M., Lancaster, J., Stanley, T., Kirschbaum, D. B., Burns, W. J., Schmitt, R. G., Lindsey, K. O., and McCoy, K. M.: Landslides across the USA: occurrence, susceptibility, and data limitations, Landslides, 17, 2271–2285, https://doi.org/10.1007/s10346-020-01424-4, 2020.
Mirus, B. B., Belair, G. M., Wood, N. J., Jones, J., and Martinez, S. N.: Parsimonious high-resolution landslide susceptibility modeling at continental scales, AGU Advances, 5, e2024AV001214, https://doi.org/10.1029/2024AV001214, 2024.
Missouri Department of Natural Resources: Landslides, Missouri Department of Natural Resources [data set], https://dnr.mo.gov/land-geology/hazards/landslides, (last access: 15 March 2022), 2025.
Nagendra, S., Kifer, D., Mirus, B., Pei, T., Lawson, K., Manjunatha, S. B., Li, W., Nguyen, H., Qiu, T., Tran, S., and Shen, C.: Constructing a large-scale landslide database across heterogeneous environments using task-specific model updates, IEEE J. Sel. Top. Appl., 15, 4349–4370, https://doi.org/10.1109/JSTARS.2022.3177025, 2022.
National Centers for Environmental Information: Global Historical Climatology Network – Daily, National Centers for Environmental Information [data set], https://www.ncei.noaa.gov/products/land-based-station/global-historical-climatology-network-daily (last access: 15 October 2024), 2024.
National Research Council: Reducing losses from landsliding in the United States, The National Academies Press, Washington, D.C., https://doi.org/10.17226/19286, 1985.
Natural Earth: Natural Earth – Admin 0 Countries (5.5.1), Natural Earth [data set], https://www.naturalearthdata.com/downloads/50m-cultural-vectors/ (last access: 11 September 2024), 2022.
Nelson, B. R., Prat, O. P., Seo, D.-J., and Habib, E.: Assessment and implications of NCEP Stage IV quantitative precipitation estimates for product intercomparisons, Weather Forecast., 31, 371–394, https://doi.org/10.1175/WAF-D-14-00112.1, 2016.
New Jersey Geological and Water Survey: Landslides in New Jersey, Digital Geodata Series DGS06-3, New Jersey Geological and Water Survey [data set], https://www.state.nj.us/dep/njgs/geodata/dgs06-3.htm (last access: 15 March 2022), 2018.
Nowicki Jessee, M. A., Hamburger, M. W., Allstadt, K., Wald, D. J., Robeson, S. M., Tanyas, H., Hearne, M., and Thompson, E. M.: A global empirical model for near-real-time assessment of seismically induced landslides, J. Geophys. Res.-Earth, 123, 1835–1859, https://doi.org/10.1029/2017JF004494, 2018.
Oakley, N. S., Lancaster, J. T., Kaplan, M. L., and Ralph, F. M.: Synoptic conditions associated with cool season post-fire debris flows in the Transverse Ranges of southern California, Nat. Hazards, 88, 327–354, https://doi.org/10.1007/s11069-017-2867-6, 2017.
Omernik, J. M.: Perspectives on the nature and definition of ecological regions, Environ. Manage., 34, S27–S38, https://doi.org/10.1007/s00267-003-5197-2, 2004.
Oregon Department of Geology and Mineral Industries: Statewide landslide information database for Oregon, Oregon Department of Geology and Mineral Industries [data set], https://www.oregon.gov/dogami/slido/Pages/data.aspx (last access: 15 October 2024), 2024.
Ozturk, U., Bozzolan, E., Holcombe, E. A., Shukla, R., Pianosi, F., and Wagener, T.: How climate change and unplanned urban sprawl bring more landslides, Nature, 608, 262–265, https://doi.org/10.1038/d41586-022-02141-9, 2022.
Patton, A. I., Rathburn, S. L., and Capps, D. M.: Landslide response to climate change in permafrost regions, Geomorphology, 340, 116–128, https://doi.org/10.1016/j.geomorph.2019.04.029, 2019.
Patton, A. I., Luna, L. V., Roering, J. J., Jacobs, A., Korup, O., and Mirus, B. B.: Landslide initiation thresholds in data-sparse regions: application to landslide early warning criteria in Sitka, Alaska, USA, Nat. Hazards Earth Syst. Sci., 23, 3261–3284, https://doi.org/10.5194/nhess-23-3261-2023, 2023.
Petersen, M. D., Shumway, A. M., Powers, P. M., Field, N., Moschetti, M. P., Jaiswal, K., Milner, K. R., Rezaeian, S., Frankel, A. D., Llenos, A. L., Michael, A. J., Altekruse, J. M., Ahdi, S. K., Withers, K., Mueller, C. S., Zeng, Y., Chase, R. E., Salditch, L. M., Luco, N., Rukstales, K. S., Herrick, J. A., Girot, D. L., Aagaard, B. T., Bender, A. M., Blanpied, M. L., Briggs, R., Boyd, O. S., Clayton, B. S., Duross, C. B., Evans, E., Haeussler, P. J., Hatem, A. E., Haynie, K. L., Hearn, E., Johnson, K., Kortum, Z. A., Kwong, N., Makdisi, A. J., Mason, H. B., McNamara, D. E., McPhillips, D. F., Okubo, P. G., Page, M. T., Pollitz, F., Rubinstein, J. L., Shaw, B., Shen, Z.-K., Shiro, B. R., Smith, J. A., Stephenson, W. J., Thompson, E. M., Jobe, J. A., Moriarty, E. W., and Witter, R. C.: Data release for the 2023 U.S. 50-State National Seismic Hazard Model – Overview, U.S. Geological Survey data release [data set], https://doi.org/10.5066/P9GNPCOD, 2023.
Petersen, M. D., Shumway, A. M., Powers, P. M., Field, E. H., Moschetti, M. P., Jaiswal, K. S., Milner, K. R., Rezaeian, S., Frankel, A. D., Llenos, A. L., Michael, A. J., Altekruse, J. M., Ahdi, S. K., Withers, K. B., Mueller, C. S., Zeng, Y., Chase, R. E., Salditch, L. M., Luco, N., Rukstales, K. S., Herrick, J. A., Girot, D. L., Aagaard, B. T., Bender, A. M., Blanpied, M. L., Briggs, R. W., Boyd, O. S., Clayton, B. S., DuRoss, C. B., Evans, E. L., Haeussler, P. J., Hatem, A. E., Haynie, K. L., Hearn, E. H., Johnson, K. M., Kortum, Z. A., Kwong, N. S., Makdisi, A. J., Mason, H. B., McNamara, D. E., McPhillips, D. F., Okubo, P. G., Page, M. T., Pollitz, F. F., Rubinstein, J. L., Shaw, B. E., Shen, Z.-K., Shiro, B. R., Smith, J. A., Stephenson, W. J., Thompson, E. M., Thompson Jobe, J. A., Wirth, E. A., and Witter, R. C.: The 2023 U.S. 50-State National Seismic Hazard Model: Overview and implications, Earthq. Spectra, 40, 5–88, https://doi.org/10.1177/87552930231215428, 2024.
Pollock, W. and Wartman, J.: Human vulnerability to landslides, GeoHealth, 4, e2020GH000287, https://doi.org/10.1029/2020GH000287, 2020.
Reichenbach, P., Rossi, M., Malamud, B. D., Mihir, M., and Guzzetti, F.: A review of statistically-based landslide susceptibility models, Earth-Sci. Rev., 180, 60–91, https://doi.org/10.1016/j.earscirev.2018.03.001, 2018.
Rengers, F. K.: Inventory of landslides triggered by rainfall on 16–17 January 2019, Los Angeles County, CA, U.S. Geological Survey data release [data set], https://doi.org/10.5066/P97GU3UV, 2020.
Rose, C. E., Martin, S. W., Wannemuehler, K. A., and Plikaytis, B. D.: On the use of zero-Inflated and hurdle models for modeling vaccine adverse event count data, J. Biopharm. Stat., 16, 463–481, https://doi.org/10.1080/10543400600719384, 2006.
Salvatici, T., Tofani, V., Rossi, G., D'Ambrosio, M., Tacconi Stefanelli, C., Masi, E. B., Rosi, A., Pazzi, V., Vannocci, P., Petrolo, M., Catani, F., Ratto, S., Stevenin, H., and Casagli, N.: Application of a physically based model to forecast shallow landslides at a regional scale, Nat. Hazards Earth Syst. Sci., 18, 1919–1935, https://doi.org/10.5194/nhess-18-1919-2018, 2018.
Santi, P. M., Hewitt, K., VanDine, D. F., and Barillas Cruz, E.: Debris-flow impact, vulnerability, and response, Nat. Hazards, 56, 371–402, https://doi.org/10.1007/s11069-010-9576-8, 2011.
Scheevel, C. R., Baum, R. L., Mirus, B. B., and Smith, J. B.: Precipitation thresholds for landslide occurrence near Seattle, Mukilteo, and Everett, Washington, U.S. Geological Survey Open-File Report 2017–1039, 51 pp., Reston, VA, https://doi.org/10.3133/ofr20171039, 2017.
Schmitt, R. G., Tanyas, H., Nowicki Jessee, M. A., Zhu, J., Biegel, K. M., Allstadt, K. E., Jibson, R. W., Thompson, E. M., van Westen, C. J., Sato, H. P., Wald, D. J., Godt, J. W., Gorum, T., Xu, C., Rathje, E. M., and Knudsen, K. L.: An open repository of earthquake-triggered ground-failure inventories (ver 4.0, October 2022), U.S. Geological Survey data release [data set], https://doi.org/10.5066/F7H70DB4, 2017.
Schuster, R. L.: Socioeconomic significance of landslides, in: Landslides: Investigation and mitigation, Transportation Research Board Special Report, 247, 12–35, ISBN 0-309-06151-2,1996.
Seattle Department of Construction and Inspections: ECA known slide (initiation point, scarp, affected property), Seattle Department of Construction and Inspections [data set], https://data-seattlecitygis.opendata.arcgis.com/datasets/eca-known-slide-events/explore (last access: 15 March 2022), 2023.
Segoni, S., Tofani, V., Rosi, A., Catani, F., and Casagli, N.: Combination of rainfall thresholds and susceptibility maps for dynamic landslide hazard assessment at regional scale, Front. Earth Sci., 6, https://doi.org/10.3389/feart.2018.00085, 2018.
Staley, D. M., Negri, J. A., Kean, J. W., Laber, J. M., Tillery, A. C., and Youberg, A. M.: Updated logistic regression equations for the calculation of post-fire debris-flow likelihood in the western United States, U.S. Geological Survey Open-File Report 2016–1106, 13, https://doi.org/10.3133/ofr20161106, 2016.
Stan Development Team: Stan modeling language users guide and reference manual, version 2.32, https://mc-stan.org/docs/2_32/stan-users-guide-2_32.pdf (last access: 29 August 2025).2023.
Steger, S., Mair, V., Kofler, C., Pittore, M., Zebisch, M., and Schneiderbauer, S.: Correlation does not imply geomorphic causation in data-driven landslide susceptibility modelling – Benefits of exploring landslide data collection effects, Sci. Total Environ., 776, 145935, https://doi.org/10.1016/j.scitotenv.2021.145935, 2021.
Tanyaş, H., van Westen, C. J., Allstadt, K. E., Anna Nowicki Jessee, M., Görüm, T., Jibson, R. W., Godt, J. W., Sato, H. P., Schmitt, R. G., Marc, O., and Hovius, N.: Presentation and analysis of a worldwide database of earthquake-induced landslide inventories, J. Geophys. Res.-Earth, 122, 1991–2015, https://doi.org/10.1002/2017JF004236, 2017.
Thomas, M. A., Mirus, B. B., and Collins, B. D.: Identifying physics-based thresholds for rainfall-induced landsliding, Geophys. Res. Lett., 45, 9651–9661, https://doi.org/10.1029/2018GL079662, 2018.
Thomas, M. A., Lindsay, D. N., Cavagnaro, D. B., Kean, J. W., McCoy, S. W., and Graber, A. P.: Field-verified inventory of postfire debris flows for the 2021 Dixie Fire following a 23-25 October 2021 atmospheric river storm and 12 June 2022 thunderstorm, U.S. Geological Survey data release, https://doi.org/10.5066/P9YPX1BM, 2023.
U.S. Bureau of Labor Statistics: CPI Inflation Calculator, U.S. Bureau of Labor Statistics, https://www.bls.gov/data/inflation_calculator.htm (last access: 15 October 2024), 2024.
U.S. Census Bureau: Tiger/Line 2023 Counties (and equivalent), U.S. Census Bureau [data set], https://www.census.gov/cgi-bin/geo/shapefiles/index.php (last access: 19 September 2024), 2023a.
U.S. Census Bureau: Cartographic Boundary Files 1 : 500 000, U.S. Census Bureau [data set], https://www.census.gov/geographies/mapping-files/time-series/geo/cartographic-boundary.html (last access: 11 September 2024), 2023b.
U.S. Environmental Protection Agency: Level I Ecoregions of North America Shapefile, U.S. Environmental Protection Agency [data set], https://www.epa.gov/eco-research/ecoregions-north-america (last access: 15 January 2025), 2010.
U.S. Forest Service: Tongass Landslide Initiation and Areas, U.S. Forest Service [data set], https://hub.arcgis.com/datasets/usfs::tongass-landslide-areas-feature-layer/about (last access: 15 October 2024), 2024.
van de Schoot, R., Depaoli, S., King, R., Kramer, B., Märtens, K., Tadesse, M. G., Vannucci, M., Gelman, A., Veen, D., Willemsen, J., and Yau, C.: Bayesian statistics and modelling, Nature Reviews Methods Primers, 1, 1–26, https://doi.org/10.1038/s43586-020-00001-2, 2021.
Vehtari, A., Gelman, A., and Gabry, J.: Practical Bayesian model evaluation using leave-one-out cross-validation and WAIC, Stat. Comput., 27, 1413–1432, https://doi.org/10.1007/s11222-016-9696-4, 2017.
Vermont Agency of Natural Resources: Landslides, Vermont Agency of Natural Resources [data set], https://geodata.vermont.gov/datasets/VTANR::landslides/about (last access: 15 March 2022), 2020.
Washington Geological Survey: Washington State Landslide Inventory Database (WASLID), Washington Geological Survey [data set], https://www.dnr.wa.gov/programs-and-services/geology/publications-and-data/gis-data-and-databases (last access: 15 October 2024), 2023.
White, G. C. and Bennetts, R. E.: Analysis of frequency count data using the negative binomial distribution, Ecology, 77, 2549–2557, https://doi.org/10.2307/2265753, 1996.
Woodard, J. B., Mirus, B. B., Crawford, M. M., Or, D., Leshchinsky, B. A., Allstadt, K. E., and Wood, N. J.: Mapping landslide susceptibility over large regions with limited data, J. Geophys. Res.-Earth, 128, e2022JF006810, https://doi.org/10.1029/2022JF006810, 2023.
Wooten, R. M., Witt, A. C., Miniat, C. F., Hales, T. C., and Aldred, J. L.: Frequency and magnitude of selected historical landslide events in the Southern Appalachian Highlands of North Carolina and Virginia: Relationships to rainfall, geological and ecohydrological controls, and effects, in: Natural Disturbances and Historic Range of Variation: Type, Frequency, Severity, and Post-disturbance Structure in Central Hardwood Forests USA, edited by: Greenberg, C. H. and Collins, B. S., Springer International Publishing, Cham, 203–262, https://doi.org/10.1007/978-3-319-21527-3_9, 2016.
Yuan, R. and Chen, J.: A novel method based on deep learning model for national-scale landslide hazard assessment, Landslides, 20, 2379–2403, https://doi.org/10.1007/s10346-023-02101-y, 2023.
Zuzak, C., Mowrer, M., Goodenough, E., Burns, J., Ranalli, N., and Rozelle, J.: The national risk index: Establishing a nationwide baseline for natural hazard risk in the US, Nat. Hazards, 114, 2331–2355, https://doi.org/10.1007/s11069-022-05474-w, 2022.