the Creative Commons Attribution 4.0 License.
the Creative Commons Attribution 4.0 License.
 | 05 Sep 2025
Evaluating Yangtze River Delta Urban Agglomeration flood risk using a hybrid method of automated machine learning and analytic hierarchy process
Haipeng Lu
Yaru Zhang
Hengxu Jin
Shuai Wu
Yixuan Gao
Shuliang Zhang
With rapid urbanization, the scientific assessment of disaster risk caused by flooding events has become an essential task for disaster prevention and mitigation. However, adaptively selecting optimal machine learning (ML) models for flood risk assessment and further conducting spatial and temporal analyses of flood risk characteristics in urban agglomerations remain challenging. This study establishes an H–E–V–R risk assessment index system that integrates hazard, exposure, vulnerability, and resilience based on the factors influencing flood risk in the Yangtze River Delta Urban Agglomeration (YRDUA). Utilizing automated machine learning (AutoML) and the analytic hierarchy process (AHP), a comprehensive flood risk assessment model is constructed. Results indicate that, among the different assessment models, the accuracy, precision, F1 score, and kappa coefficient of the categorical boosting (CatBoost) model for flooded point identification are the highest. Among the flood hazard factors, elevation ranks highest in importance, with a contribution rate of up to 68.55 %. The spatial distribution of flood risk in the study area from 1990 to 2020 is heterogeneous, with an overall increasing risk trend. This study is of great significance, advancing disaster prevention, mitigation, and sustainable development in the YRDUA.
- Article
(8308 KB) - Full-text XML
- BibTeX
- EndNote


Under global climate change and accelerated urbanization, China has been experiencing pervasive flooding ever more frequently (Tang et al., 2024). Floods threaten people's lives, hinder social development, and cause huge economic losses in China (Anon, 2021; Echendu, 2020; Milanesi et al., 2015). Flood formation has been exacerbated by climate change and urbanization, leading to increased frequency, extent, and intensity of urban flooding and impacting urban flood risk (Mahmoud and Gan, 2018; Khadka et al., 2023; Scott et al., 2023; Seemuangngam and Lin, 2024). Modern human society is faced with the possibility of serious flood hazards and associated challenges, and in addition to post-disaster emergency management, the scientific assessment of disaster risks arising from flood events has gradually become a crucial aspect of preventing and mitigating disasters.
Currently, most research in the field of flooding focuses on the flood risks of individual cities (Wang et al., 2021, 2023b; Guan et al., 2024). However, in recent years, the frequency and intensity of urban flooding in China have increased dramatically, and individual cities are no longer able to independently mitigate the risks arising from floods. Studies indicate that China's flood risk management needs to be transformed from the scale of isolated individual cities to the scale of urban agglomerations, conducted in a regionally coordinated manner (Morales-Torres et al., 2016; Wang et al., 2023a). City clusters, constituting the spatial organizational structure of cities that have reached an advanced stage of development, have become key areas for regional disaster management and sustainable development. Due to the unique geographical location and climate conditions of the Yangtze River Delta Urban Agglomeration (YRDUA), as well as the impact of urbanization over the past 30 years, the frequency and intensity of flood disasters have been increasing, posing a serious threat to the sustainable development of cities. Therefore, implementing relevant emergency management strategies for flood risks is urgently needed. Furthermore, the region comprises multiple cities, among which distinct resource interactions, such as population mobility and risk transfer, exist (Lu et al., 2022). Thus, it is essential to assess both the overall flood risk characteristics and changes in the urban agglomeration as well as the spatial correlations of flood risks between cities, to explore the mutual influences and interaction mechanisms among regional disaster risks, and to provide a scientific basis for sustainable development within the urban agglomeration (Xu et al., 2024).
Statistical analyses of historical disaster statistics (Lang et al., 2004), indicator system methods (Wang et al., 2018b), scenario simulation methods (Yang et al., 2018), and data-driven methods (Abu-Salih et al., 2023) are the primary flood risk assessment methods currently. With the development of artificial intelligence technology, data-driven methods, such as machine learning, deep learning, and artificial neural networks, have emerged, providing new opportunities to improve traditional flood risk assessment methods (Liu and Zhang, 2015). Ensemble methods are a class of machine learning (ML) techniques that combine multiple base learners to form a stronger predictive model (Webb and Zheng, 2004). They are designed to overcome several limitations of individual models, such as high variance, overfitting, sensitivity to noise, and poor generalization (Yang et al., 2013). By aggregating the outputs of weak learners, ensemble methods significantly enhance model stability, accuracy, and robustness – especially in high-dimensional and complex classification or regression tasks (Kazienko et al., 2015). Various ensemble ML techniques, including bagging (e.g., random forest), boosting (e.g., extreme gradient boosting (XGBoost), categorical boosting (CatBoost)), and stacking, have been widely used in hydrology, with boosting algorithms in particular showing strong performance in flood prediction and risk assessment (Shafizadeh-Moghadam et al., 2018; Mirzaei et al., 2021; Yan et al., 2024). However, ensemble ML techniques often lack preprocessing and feature selection abilities, and their application effects vary considerably across different regions. To fully mine data and discover more effective features, experts have proposed other solutions, namely hybrid models such as ANFIS, LSTM-ALO, and LSSVM-GSA (Nayak et al., 2004; Yuan et al., 2018; Adnan et al., 2017). These methods have achieved good performance for given hydrological time series, focusing more on data preprocessing and feature selection. Although research on data-driven urban flood risk assessment methods has increased, certain limitations remain. For example, the physical importance of urban hydrological processes is often ignored in the model assessment process, interpretation of the assessment results is weak, and quantifying the boundaries and scales is challenging (Abu-Salih et al., 2023; Guo et al., 2022).
Furthermore, attempting to combine the data processing and feature selection abilities of hybrid models with those of ensemble models remains challenging (Li et al., 2017). While ML algorithms have demonstrated strong performance in many domains, no single algorithm consistently performs best across all types of problems (Wolpert and Macready, 1997). Therefore, to achieve optimal performance, it is essential to carefully configure key components of the ML pipeline, including feature engineering, model selection, and hyperparameter tuning (Li et al., 2017; Raschka, 2020). Hence, ML applications require the participation of many experts, leading to disproportionate costs for ML development and improvement (Wagenaar et al., 2020; Sarro et al., 2022; Rashidi Shikhteymour et al., 2023). The effectiveness of ML improves with experience, where “experience” refers to the model's iterative exposure to training data and its ability to learn patterns from labeled examples (Jordan and Mitchell, 2015; Nagarajah and Poravi, 2019). One key challenge addressed in this study is how to automatically optimize model components such as feature selection and algorithm configuration in flood risk prediction while maintaining high accuracy and adaptability across complex hydrological conditions. Automated machine learning (AutoML) is an innovative ML framework that automates key stages of the model development pipeline, including feature selection, model selection, hyperparameter tuning, and ensemble learning (He et al., 2021). By addressing these challenges, AutoML reduces reliance on expert knowledge and minimizes subjectivity in model building (He et al., 2021; Consuegra-Ayala et al., 2022). In the context of this study, AutoML enables the automatic optimization of hazard factor selection, model construction, and parameter adjustment for flood risk assessment tasks, thereby improving efficiency, objectivity, and reproducibility in model development. However, AutoML has not been widely applied in the fields of hydrology and disaster risk management, and research has mainly focused on optimizing the ensemble model to achieve better performance (Özdemir et al., 2023). Continuous research has highlighted the potential role of AutoML in flood risk detection and assessment (Guo et al., 2022; Vincent et al., 2023; Munim et al., 2024). Guo et al. (2022) compared AutoML with three single ML algorithms (CatBoost, XGBoost, and BPDNN) and concluded that AutoML performed better at building rapid-warning and comprehensive analysis models for urban waterlogging. A model based on AutoML can be applied to areas without water level monitoring and achieve accurate predictions and rapid warnings of waterlogging depth (Guo et al., 2022; Yan et al., 2024). Abu-Salih et al. (2023) proposed a data-driven flood risk area detection model that combined the ensemble model with the AutoML tool and successfully solved the problems of data balance and strategy modeling while reducing the complexity of flood risk area prediction. Previous studies have provided a theoretical basis and scientific reference for the application of AutoML methods to flood risk assessment. However, the use of AutoML for research purposes is a complex issue, and many new opportunities and challenges remain regarding its specific applications.
In the field of flood risk assessment, AutoML has been preliminarily demonstrated to perform well in flood hazard prediction (Guo et al., 2022). As an efficient “black-box” modeling approach, AutoML provides strong support for flood risk modeling through automated feature selection, model training, and parameter optimization (Hutter et al., 2019; He et al., 2021). In urban agglomerations, flood risk assessment is a highly complex task involving diverse natural and socioeconomic factors derived from heterogeneous and often multisource datasets (Wang et al., 2023c). These factors – such as rainfall, topography, land use, drainage, and population density – differ in type and often interact in nonlinear and uncertain ways (Shuster et al., 2005; Zhang et al., 2017; Wang et al., 2018a). Under such complex circumstances, AutoML struggles to systematically evaluate the multidimensional indicators of flood risk. To address this limitation, this study introduces a multi-criterion decision analysis (MCDA) approach to quantify the importance of various indicators within the evaluation framework (Pham et al., 2021). MCDA facilitates the integration of heterogeneous indicators into a unified evaluation framework by constructing structured weighting schemes, thereby aligning the assessment results more closely with real-world conditions and expert knowledge (Fernández and Lutz, 2010). In cases where data are limited or certain indicators are difficult to quantify, MCDA methods allow for the incorporation of expert judgment through scoring systems and pairwise comparison matrices, enhancing the practical applicability and robustness of the model (Hites et al., 2006). The analytic hierarchy process (AHP) is one of the most popular MCDA techniques (Donegan et al., 1992). This technique emphasizes the importance of the subjective judgment of decision makers and the consistency of pairwise comparisons of standards in the decision-making process (Saaty, 1980). Recent studies have focused on integrated frameworks of ML models and MCDA technology for flood hazard assessment (Kanani-Sadat et al., 2019; Khosravi et al., 2019; Gudiyangada Nachappa et al., 2020; Mia et al., 2023). However, research focusing on using an integrated framework of AutoML and AHP techniques is still limited.
This study develops a flood risk assessment model for the YRDUA by analyzing the factors influencing flood risk and integrating the AutoML and AHP methods. In this model, AutoML is employed to construct the flood hazard submodel, using indicators that represent natural environmental drivers as input features. The hazard is modeled as a binary classification problem (i.e., whether flooding occurs), and the resulting feature importance rankings provide an objective basis for subsequent indicator weighting. Nevertheless, as a data-driven approach, AutoML alone cannot structurally interpret the relative influence of social and systemic factors within a multidimensional flood risk assessment framework. Therefore, this study incorporates the AHP to calculate the weights of flood exposure, vulnerability, and resilience in the YRDUA based on expert knowledge and the existing literature. A regional flood risk zoning map is then generated. A comparative analysis with observed inundation point data shows a strong spatial alignment between the distribution of flooded points and the high- to medium-high-risk zones, highlighting the reliability and applicability of the proposed model. The remainder of this paper is structured as follows: Sect. 2 describes the study area, data sources, and methodology; Sect. 3 presents the results and analysis; Sect. 3 discusses the findings and their implications; and Sect. 4 concludes the study with key insights and recommendations.
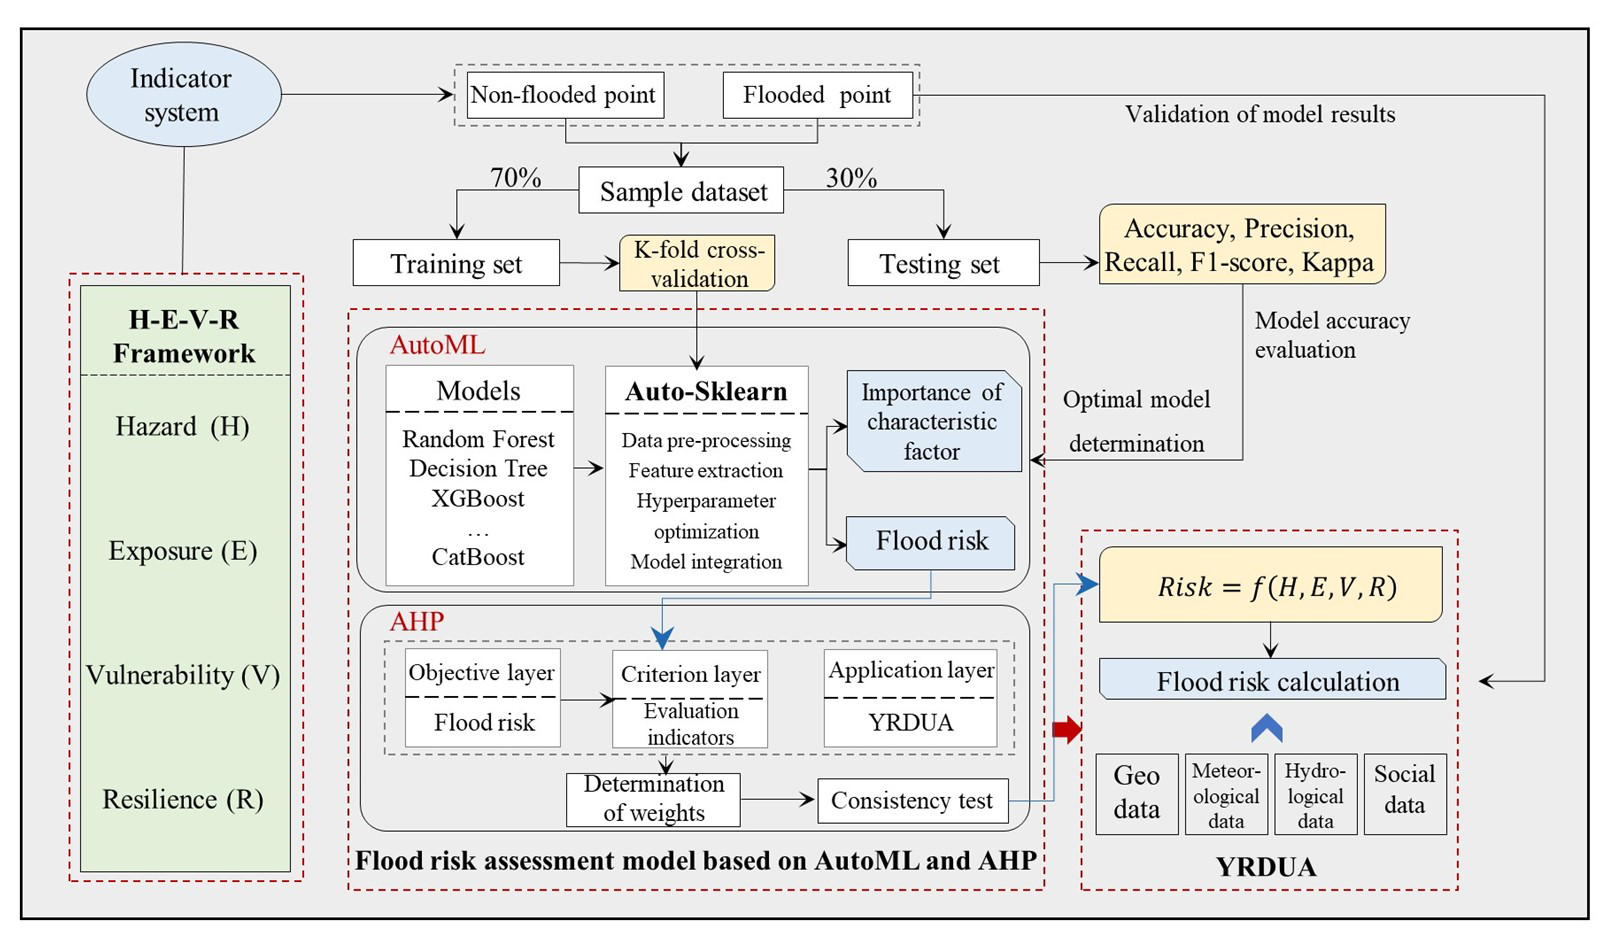
In this section, the study area is briefly introduced (Sect. 2.1), and each individual component of the study is further discussed, along with the basic geographic information, meteorology, social statistics, historical disaster data, and other fields involved in the study of urban agglomeration flood disasters and their risks (Sect. 2.2). The framework of the flood risk assessment model is shown in Fig. 1. The factors influencing flood risk in the YRDUA are explored, and a flood risk assessment index system is established (Sect. 2.3). The optimal model in AutoML is selected to calculate the importance of flood hazard and hazard characteristic factors (Sect. 2.4), and the model is combined with AHP to determine the weight of each risk indicator (Sect. 2.5). Ultimately, a flood risk assessment model based on AutoML and AHP is constructed.
2.1 Study area
The Yangtze River Delta Urban Agglomeration, located in the eastern coastal region of China (27°04′–34°49′ N, 115°75′–122°95′ E), includes 27 cities: 8 in Anhui Province, 9 in Jiangsu Province, 9 in Zhejiang Province, and Shanghai (Fig. 2) (Yang et al., 2024). Influenced by the East Asian summer monsoon, the study area features low-lying plains in the northern region and higher hilly terrain in the southern region, along with numerous waterways (Ding et al., 2021). With recent accelerated climate change and urbanization, extreme precipitation events in the Yangtze River Delta (YRD) have been occurring ever more frequently, and the temporal and spatial distribution differences in precipitation have increased. Additionally, the increase in impervious surfaces, the narrow rivers on the plains, and poor drainage may result in more frequent and widespread urban flooding and waterlogging disasters (Wan et al., 2013). This region is economically developed and densely populated, making it the largest urban agglomeration in Asia (Sun et al., 2023). In 2008, the gross domestic product (GDP) of the YRD accounted for 17.5 % of the GDP of the entire country, i.e., CNY 4.3 trillion, and the per capita GDP was CNY 44 468, i.e., twice the national average level. The population has reached 97.2 million, i.e., 7.3 % of China's total population, and the region's average population density is 877 persons km−2, i.e., approximately twice the national average (Gu et al., 2011). Therefore, the potential risks of flood and waterlogging disasters are substantial.
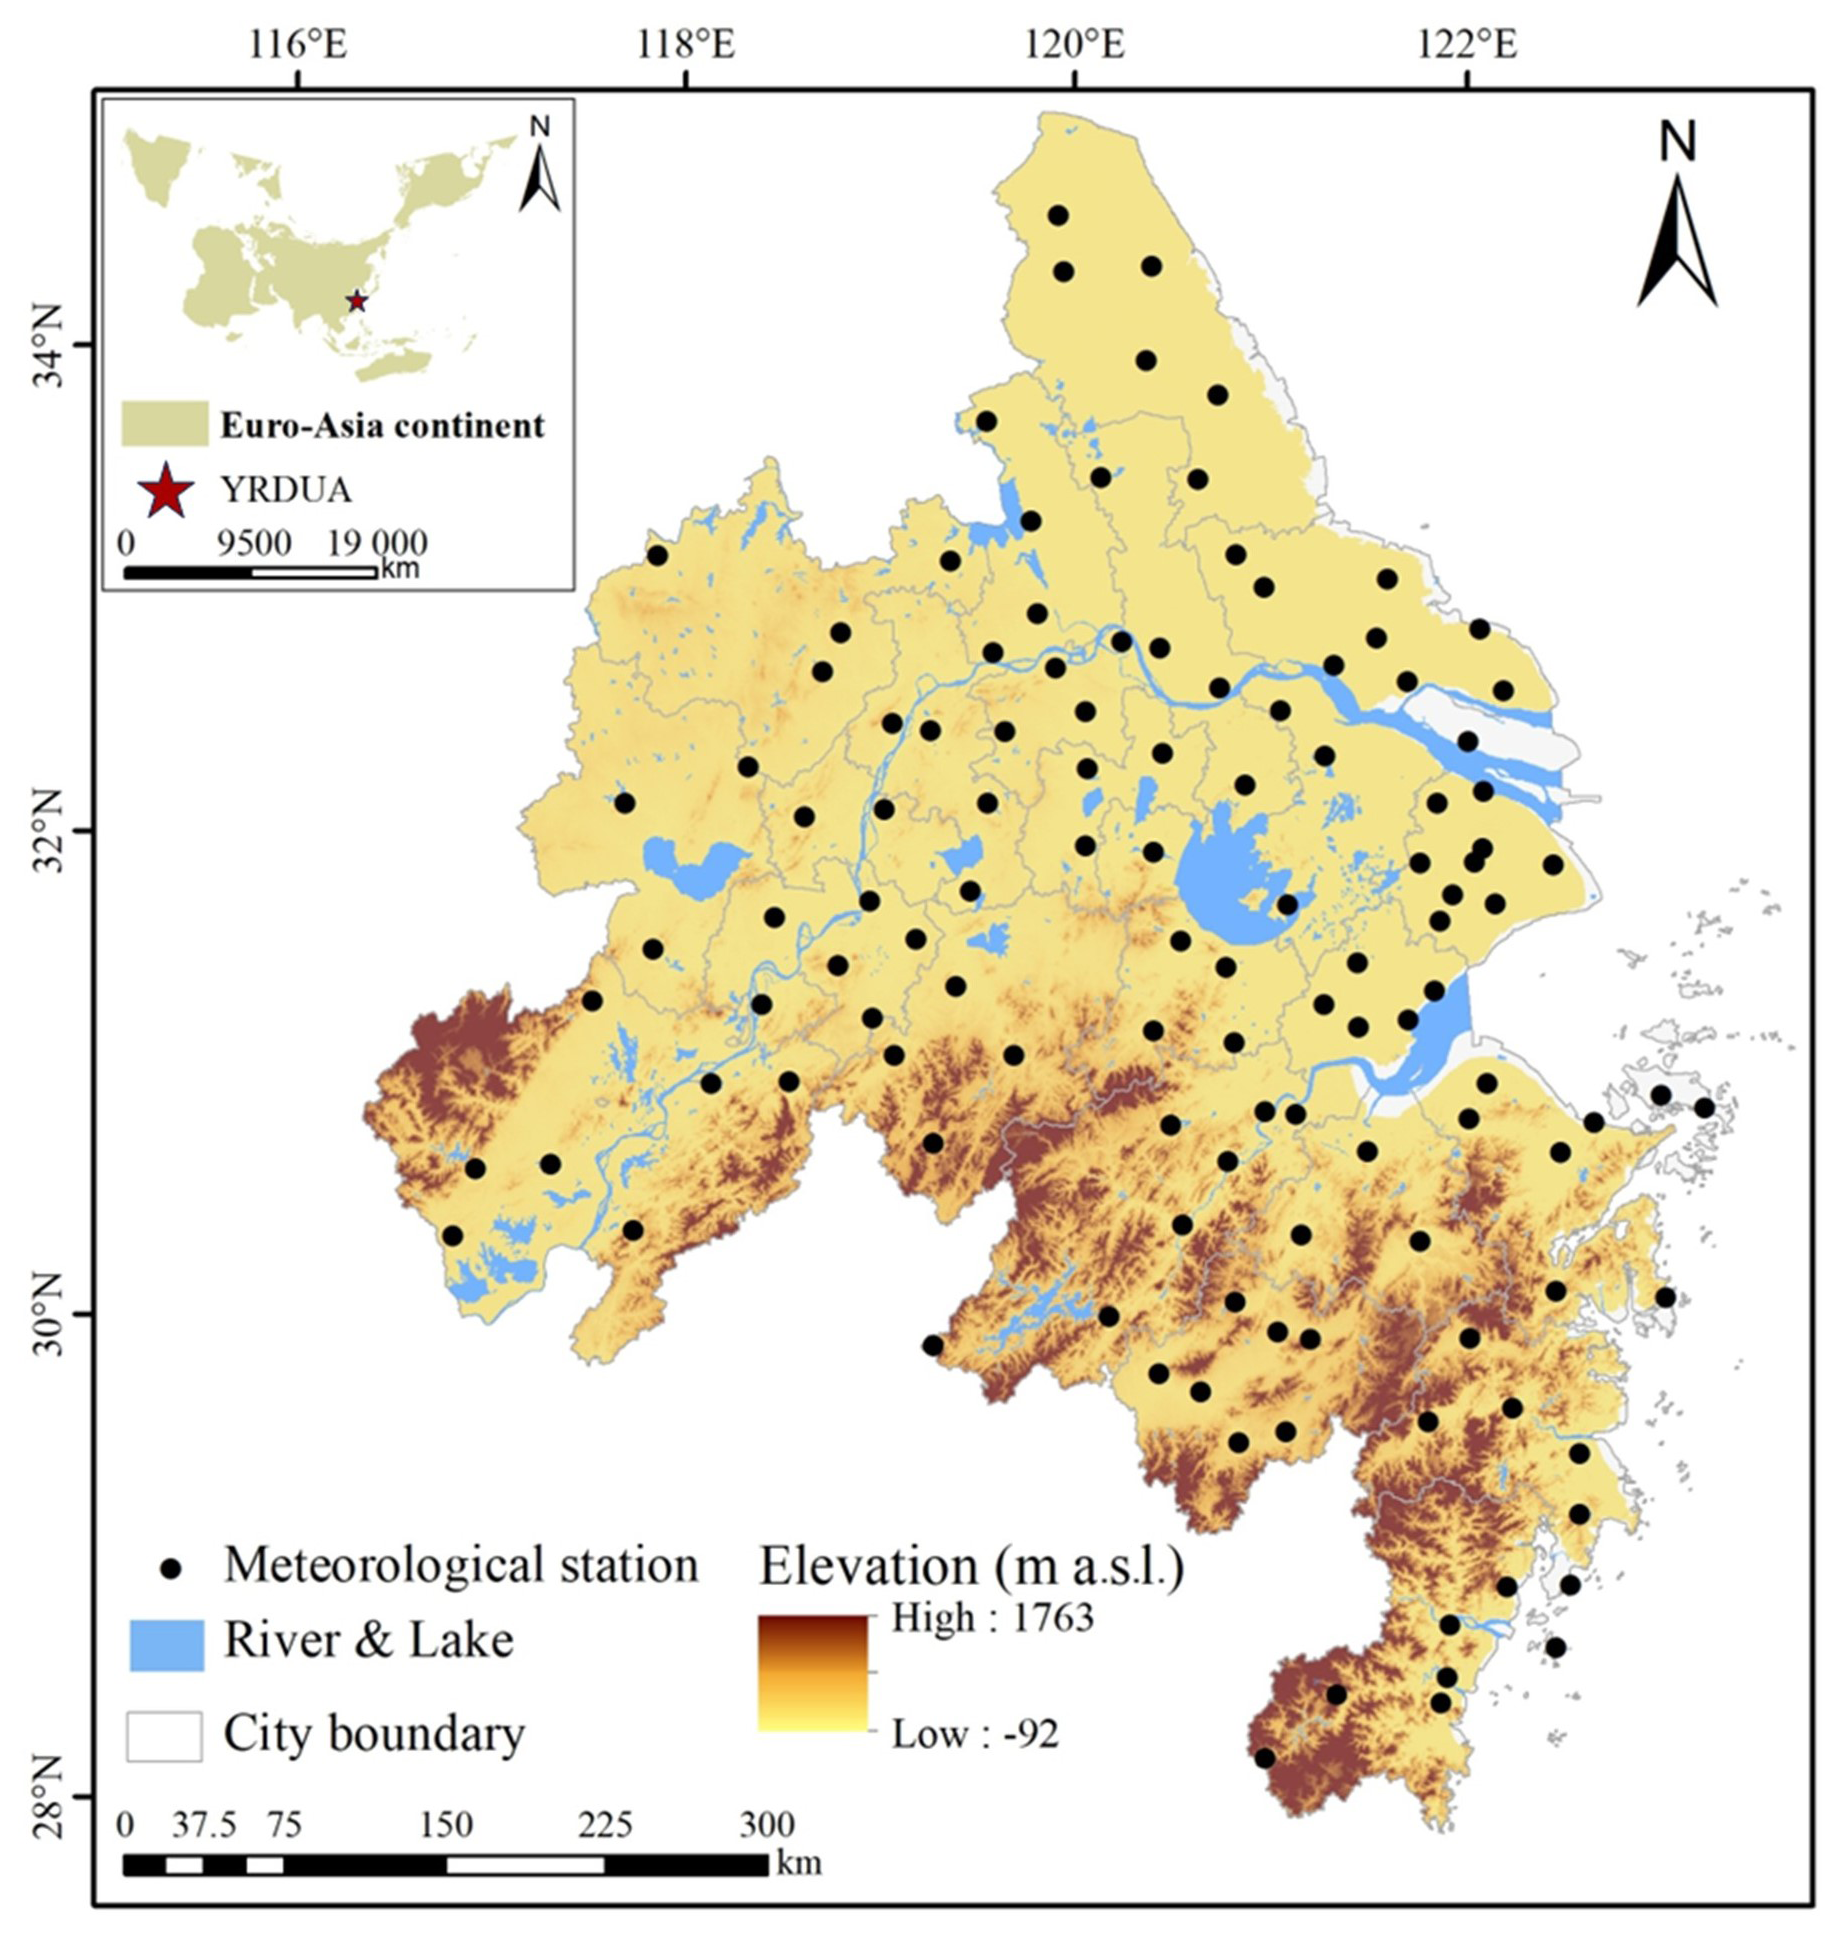
Figure 2The schematic map of the YRDUA.
2.2 Data sources and processing
2.2.1 Data sources
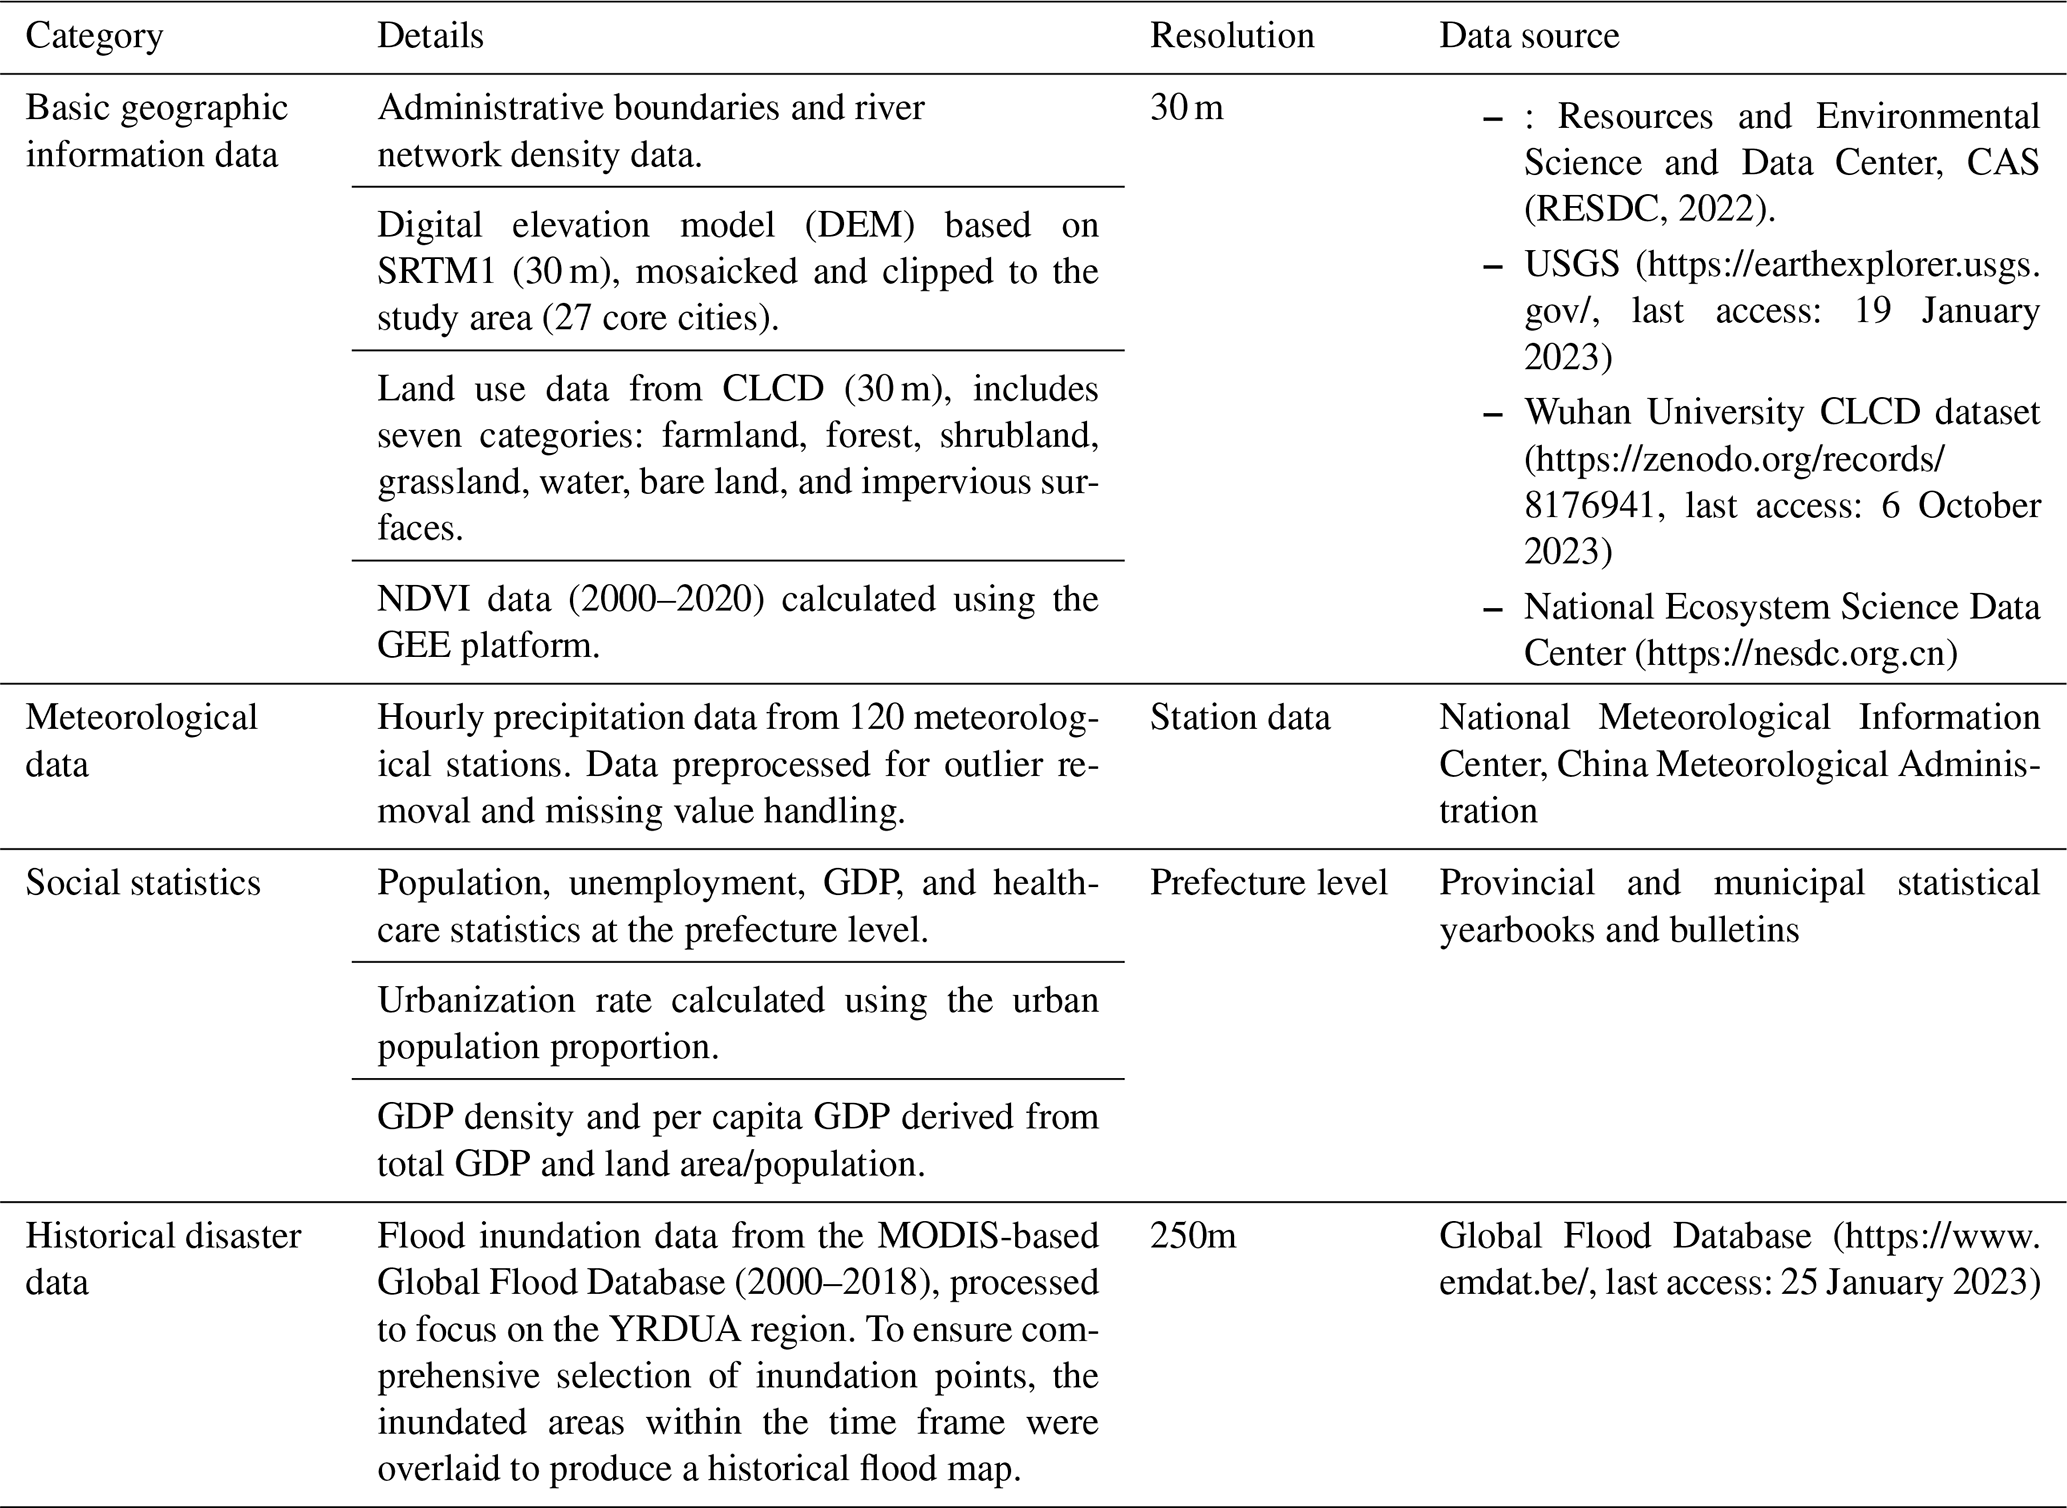
The study of flood disasters and their associated risks in urban agglomerations involves complex natural and socioeconomic factors. Therefore, we collected and preprocessed data from multiple fields, such as basic geography, meteorology, social statistics, and historical disasters. Table 1 lists the data types and resolutions collected for the research area.
Table 1Description of the datasets used for flood risk assessment, their characteristics, and data sources.
2.2.2 Data standardization and preprocessing
Due to variations in data sources and formats, the flood disaster risk data collected exhibit differences in spatial resolution, dimensions, and magnitude. To ensure consistency and comparability, standardization of both spatial scale and numerical range was performed before using these datasets as flood risk indicators.
-
Unification of spatial scale means aligning data within the same coordinate range and resolution. The research data are standardized through projection transformation, converting all datasets into the same geographic and projected coordinate systems. To generate continuous spatial surfaces from discrete data points, we applied the ordinary kriging interpolation method, which assumes a constant but unknown local mean (Cressie, 1990). A spherical semivariogram model was adopted to capture spatial autocorrelation, as it is widely used in environmental geostatistics for its bounded range and smooth continuity (Webster and Oliver, 2007). The interpolation process was carried out using ArcGIS 10.8. Finally, if the spatial data have different resolutions, resampling is performed to standardize all data to the same resolution, which in this study is unified to 30 m × 30 m.
-
Normalization of the numerical range can be achieved using a normalization process. In this study, the min–max normalization method is applied. Specifically, the minimum and maximum values of each feature are computed only from the training set, and both the training and test sets are then normalized using these training-derived parameters. This ensures that the normalized values in the training set are scaled to the range of [0,1], while the values in the test set may exceed this range if they fall outside the training set's value distribution. The formula is as follows:
2.3 Historical flood inundation point extraction
The historical flood inundation map of the study area is shown in Fig. 3a. The flood inventory map used in this study was created based on inundation data from the Global Flood Database and the EM-DAT flood disaster database and was further verified through satellite imagery, Google Earth, and documented historical flood records. The actual flooded areas were delineated from flood traces in the inundation dataset and image interpretation. A flooded point is defined as a location that lies within the inundation extent of at least one recorded flood event during the study period. Based on this definition, 278 flooded points were randomly selected from the validated inundated areas. These points serve as the foundation for subsequent statistical analysis and model training, with their spatial distribution shown in Fig. 3b.
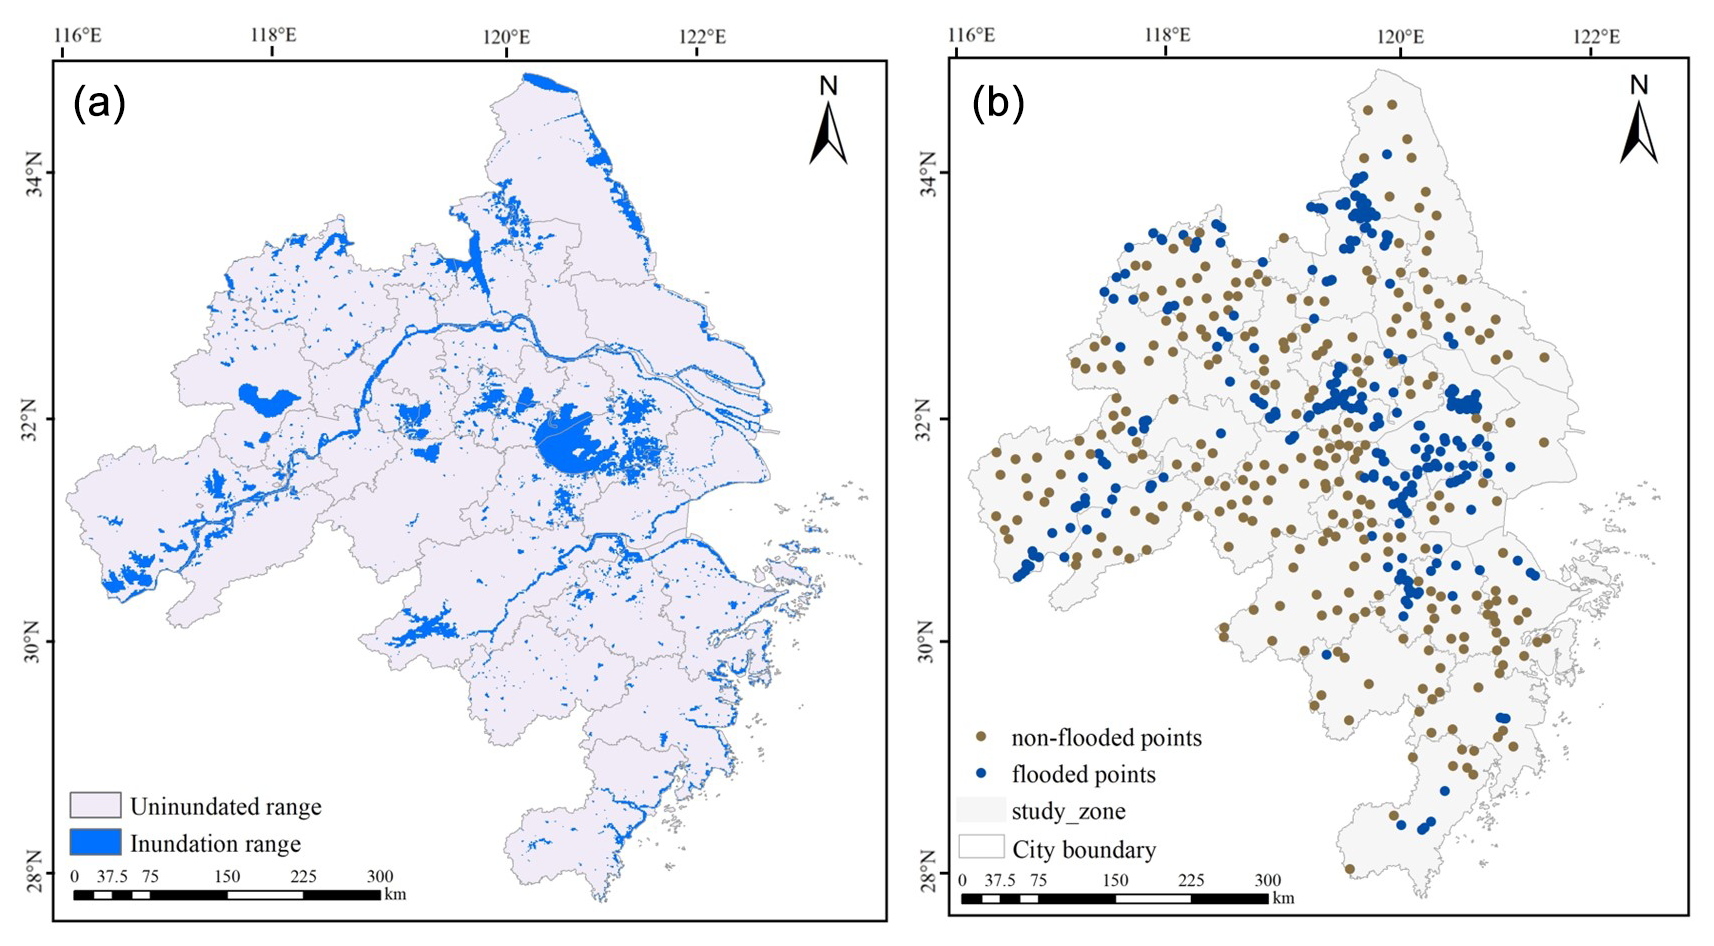
Figure 3(a) Flood inundation map of the study area. (b) Spatial distribution of flooded and non-flooded points in the YRDUA.
To calculate flood hazard, it is necessary to select training samples. The task of identifying flooded and non-flooded points using AutoML is essentially a binary classification problem, which requires a balanced number of samples. An imbalanced ratio of positive and negative samples can result in unreliable classification outcomes. Previous studies (Pham et al., 2021; Bostan et al., 2012) have shown that the best classification performance is achieved when the ratio of flooded to non-flooded points is 1:1. Therefore, after selecting the flooded points, 278 non-flooded points were randomly sampled to ensure a balanced 1:1 ratio, excluding high-altitude areas based on the region's actual characteristics. Finally, the flooded and non-flooded points were used as sample data and were divided into a 7:3 ratio (70 % for training and 30 % for testing) for model training.
2.4 Establishment of a flood risk assessment indicator system
Although risk is a universal concept, it has no universal definition (Aven, 2016; Mishra and Sinha, 2020). Based on the hazard–exposure–vulnerability (H–E–V) disaster risk framework, we considered the particularity of flood risk research at the urban agglomeration scale, incorporated resilience indicators into the existing framework, and constructed a four-dimensional flood risk assessment framework of hazard–exposure–vulnerability–resilience (H–E–V–R) that can assess regional flood risks more comprehensively and systematically. The conceptual description of flood risk in this study can be expressed as Eq. (2):
where H, E, V, and R represent the danger of, exposure to, vulnerability to, and resilience in response to floods, respectively; ωH, ωE, ωV, and ωR are the weights of danger, exposure, vulnerability, and resilience, respectively; Hi, Ei, Vi, and Ri are the values of items i of the indicators; and a, b, c, and d are the numbers of the indicators.
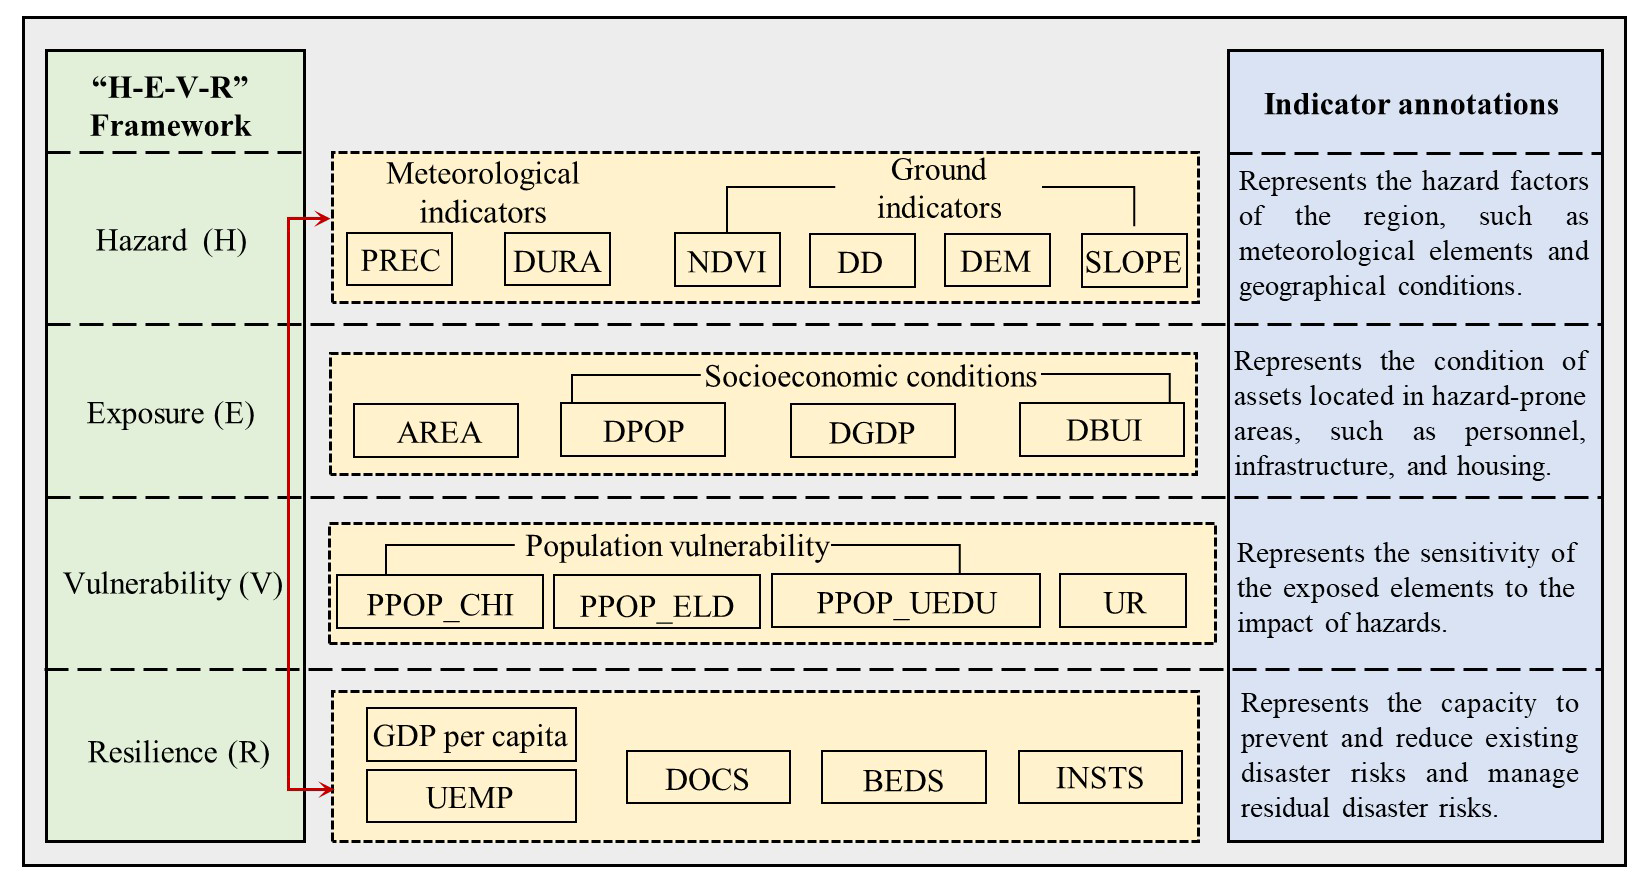
We constructed a flood risk assessment index system for the YRDUA based on the H–E–V–R framework, the actual situation in the study area, the formation mechanisms of flood disasters, and the findings of relevant studies (Gain et al., 2015; Criado et al., 2019; Hsiao et al., 2021). We selected 4 first-level indicators (i.e., the hazard, exposure, vulnerability, and resilience indices) and 19 second-level indicators. A detailed description of the flood risk assessment index system is presented in Fig. 4.
The hazard indicators consisted of six markers: average annual precipitation (PREC), annual cumulative heavy-rainfall duration (DURA), a digital elevation model (DEM), slope, drainage density (DD), and the normalized difference vegetation index (NDVI). Rainfall is the primary factor leading to flooding, particularly extreme rainstorms caused by climate change. According to the Meteorological Bureau's definition, a heavy-rainstorm event is characterized by rainfall of 50 mm or more within 24 h. DURA is defined as the total number of days with heavy-rainstorm events occurring at all meteorological stations within the study area each year. The more days heavy rainstorms accumulate and the longer their duration, the greater the likelihood of flooding and other disaster events. DEM and slope are important topographical indicators. Areas with low DEM and slope values are generally more susceptible to flood threats. DD refers to the area of rivers or lakes per unit of land surface area and is a crucial indicator of a watershed's structural characteristics. It determines the watershed's capacity to withstand flooding. The higher the DD, the greater the likelihood of flooding and the higher the potential flood risk. Vegetation plays a role in water storage, retention, and infiltration. The lower the vegetation coverage, the weaker the buffering capacity, making it more likely for surface water to accumulate. The NDVI index measures the relative abundance of green vegetation, with values ranging from −1 to 1. The higher the value, the greater the vegetation coverage and the lower the risk of flooding.
Land area (AREA), population density (DPOP), GDP density (DGDP), and building density (DBUI) were selected as exposure indicators to assess the degree of vulnerability of both the natural environment and social systems to flooding. The land area for each administrative unit at the prefecture-level city is calculated individually. A larger land area corresponds to a greater extent exposed to flooding. DPOP and DGDP represent the concentrations of population and assets, respectively. Areas with higher DPOP and DGDP are more susceptible to potential threats from pluvial flooding. DBUI, the ratio of total building area to total land area in a region, indicates the building density. A higher DBUI reflects greater exposure to flooding.
Vulnerability indicators focus more on the social aspects of flood disasters. This study selects four vulnerability indicators: proportion of child population (PPOP_CHI), proportion of elderly population (PPOP_ELD), proportion of uneducated population (PPOP_UEDU), and urbanization rate (UR). Age is a key feature of social vulnerability, and the population aged 0–14 and those over 65 are considered vulnerable groups, as these age groups are more susceptible to flood damage. The uneducated population generally has a weaker awareness of disaster risks and lower self-protection capacity, which makes this group more vulnerable to flooding. The urbanization rate refers to the proportion of the urban population in the total resident population of a region. This indicator is inversely related to flood vulnerability. In general, a higher urbanization rate indicates greater social development and stronger protective capacities, which can reduce vulnerability to flooding to some extent.
The resilience indicators selected in this study include gross domestic product (GDP) per capita, unemployment rate (UEMP), number of doctors (DOCS), number of medical institutions (INSTS), and number of hospital beds (BEDS). GDP per capita is the ratio of a region's GDP to its total resident population over a specified period, reflecting the region's economic condition. A higher GDP per capita indicates a more developed economy, which is associated with a greater capacity to recover quickly after a flooding event. The unemployment rate (UEMP) measures the proportion of the idle labor force, indirectly reflecting the stability of urban development. A high unemployment rate signals economic instability, which weakens the capacity to cope with floods and extends the time required for post-disaster recovery, thus impeding disaster response efforts. The indicators DOCS, INSTS, and BEDS provide insights into a region's healthcare and medical support capabilities. Areas with stronger healthcare systems are better positioned to manage flood risks and recover more effectively from such disasters.
2.5 Flood risk calculation method based on AutoML
2.5.1 Feature selection
The flood inventory map in this paper was developed using inundation data from the Global Flood Database and flood disaster data from the EM-DAT database, supplemented by satellite and Google image interpretation and verified against existing historical flood records. The actual flood-affected areas were delineated based on flood traces from the inundation datasets and image interpretations. For this study, 278 flood inundation points were randomly selected within the inundation data range during the study period, and the location of each point was used as the basis for subsequent statistical analysis of flood events. The main factors affecting flood risk were considered during input feature selection. Rainfall and rainstorms are important factors that lead to floods, and flooding is closely related to topography, slope, vegetation cover, and hydrological conditions. Therefore, six indicator factors, namely PREC, DURA, DEM, slope, NDVI, and DD, were selected as the input features of the model. To verify the model, 70 % of the data in the sample were set as the training dataset and the remaining 30 % of the data were set as the testing dataset through random sampling.
When the number of samples is small, data balancing is essential to ensure uniform sampling and reduce the deviations among the training, validation, and original datasets. Data balancing refers to the process of achieving a balanced distribution of data for each labeled category; it is particularly important when the number of observations in each class is significantly different. One way to address an imbalanced dataset is to oversample the minority classes. In this study, we assessed flood risk based on the identification of flooded points in the sample, which is essentially a binary classification problem; therefore, the output features are 0, i.e., negative categories (non-flooded points), vs. 1, i.e., positive categories (flooded points). The processed dataset comprised 278 positive samples (flooded points) and 278 negative samples (non-flooded points), with each label consisting of 278 points representing the entire dataset.
2.5.2 Model training and hyperparameter optimization
Training samples were generated using the data from flooded and non-flooded points in the study area, and Auto-Sklearn was used for model training; its principles are is shown in Fig. 5. The Auto-Sklearn framework has multiple built-in machine learning algorithms. We selected nine models that are more typical or have better performance in flood hazard research: random forest (RF), extreme gradient boosting (XGBoost), light gradient boosting machine (LightGBM), categorical feature boosting (CatBoost), extra trees, decision tree, nearest neighbors, multilayer perceptron (MLP) neural network, and linear regression. The training and testing datasets were used to train the nine machine learning models, and the hyperparameters were continuously adjusted and optimized.
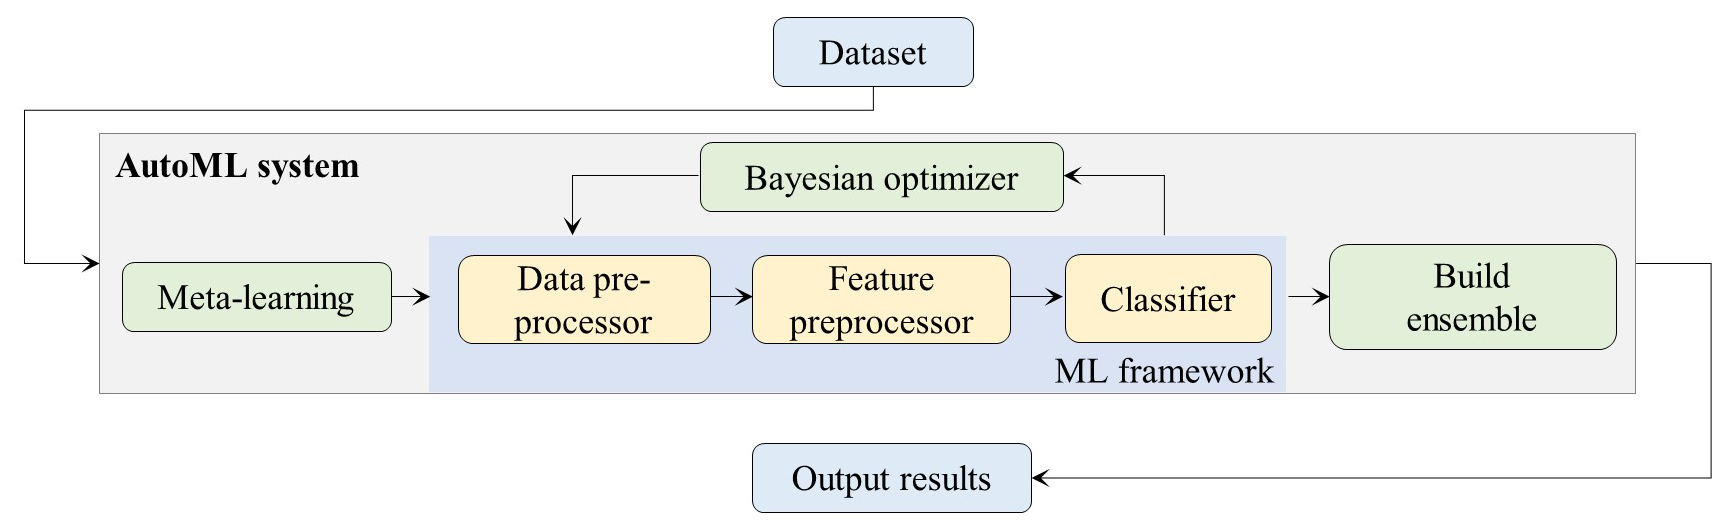
Hyperparameter optimization is an important step in ML model training. The aim of this step is to determine a hyperparameter combination to generate an ML model that performs well on a specific dataset and reduces the effect of the predefined loss function on a given dataset. In this study, we used a grid search strategy for optimization. For each set of hyperparameter combinations, k-fold cross-validation was used to evaluate the model. To quantify the balance between precision and recall, the F1 score was used as the primary evaluation metric. The hyperparameter combination corresponding to the model with the highest average F1 score was selected as optimal. Briefly, the training dataset was divided into k parts, of which one was selected as the test set and the rest were used as the training set. The cross-validation was repeated k times and the results were averaged k times. The model with the best average result among all models was selected as the optimal model, and the final classification prediction result was the output. In this study, we used five-fold cross-validation.
It is important to note that the five-fold cross-validation was employed at two distinct stages in this study. First, it was conducted within the training set during hyperparameter tuning as part of the AutoML model selection process. Second, following the final model selection, an independent five-fold cross-validation was applied to the entire dataset to evaluate the generalization performance of the model and identify potential overfitting. The data partitions used in the two stages were entirely separate, ensuring that no data leakage occurred.
2.5.3 Performance evaluation
To better compare the performance of the nine selected ML models in the Auto-Sklearn framework for flood risk assessment, multiple evaluation indicators were used to assess the test dataset. The following combinations of the true category of the sample point and the category predicted by the classifier were used: true positive (TP) – the sample point is a flooded point, and the model classifier also predicts that it is a flooded point; true negative (TN) – the sample point is a non-flooded point, and the model classifier also predicts that it is a non-flooded point; false positive (FP) – the sample point is a non-flooded point, and the model classifier mistakenly predicts that it is a flooded point; and false negative (FN) – the sample point is a flooded point, and the model classifier mistakenly predicts that it is a non-flooded point. Therefore, four related indicators were selected: precision, recall, and F1 score, and the consistency metric of the Kappa coefficient. The calculation formulas are as follows:
Among the indicators, precision refers to the proportion of correctly predicted flooded points among all predicted flooded points, reflecting the model's ability to avoid false positives. Recall measures the proportion of correctly identified flooded points among all actual flooded points, representing the model's sensitivity. F1 score is the harmonic mean of precision and recall, providing a balanced evaluation of both metrics and reflecting the overall recognition performance of the model.
The Kappa coefficient is a statistical consistency metric used to measure classification performance, which is calculated based on the confusion matrix of true and predicted categories. Its value is in the range of : a Kappa value of 1 indicates perfect agreement, 0 means that the classification is no better than random guessing, and negative values suggest that the classification is worse than random prediction. Kappa is calculated using Eq. (6), where Pe is given by Eq. (7).
where Pe represents the expected agreement by chance.
Combining multiple indicators allows for a more comprehensive evaluation of models within the Auto-Sklearn framework for flood point identification and flood risk assessment.
2.6 Method for determining flood risk index weights based on AHP
2.6.1 Establishing a hierarchical model
According to the decision-making objectives, factors, and applications in decision-making problems, the AHP can be divided from bottom to top into the target, criterion, and application layers. Among them, the target layer is the problem to be solved (i.e., final flood risk). The criterion layer is the intermediate link, including the factors to be considered and the decision-making criteria. The factors can be divided into different evaluation indicators, including 4 first-level indicators (danger, exposure, vulnerability, and resilience) and the corresponding 19 second-level indicators. The criterion layer comprises various weight combination schemes linked to the target layer. The application layer is the final optional scheme and the specific application of the decision. The final weight scheme and evaluation results of this study were applied to the YRDUA.
2.6.2 Constructing the judgment matrix
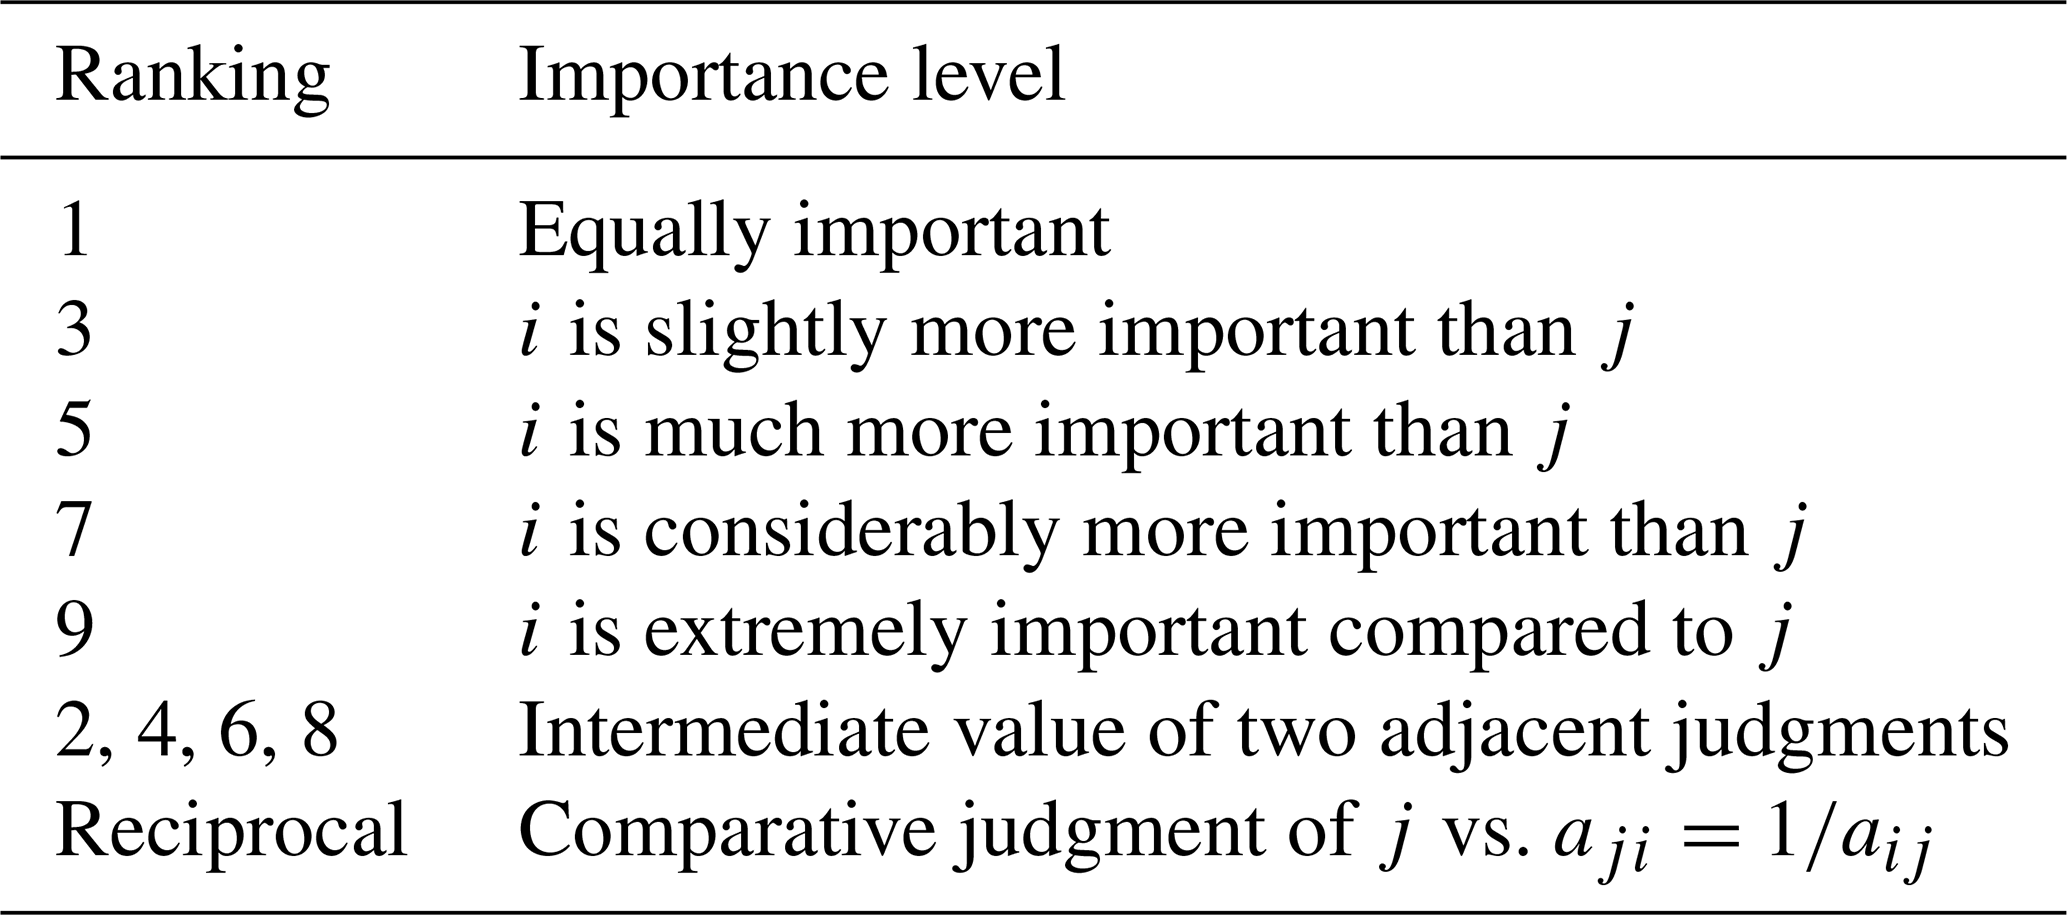
After the hierarchical structure was established, a judgment matrix was constructed based on the relationship between the criteria and indicators. Different elements in the sub-level were compared pairwise, and the relative importance of all elements in the current layer and previous layer were compared. Typically, a pairwise comparison matrix is used as a representative model. In this study, we adopted the 1–9-scale method as the importance measurement standard. The importance comparison relationship is presented in Table 2, where the matrix element aij represents the comparison result of the ith element relative to the jth element.
Table 2The pairwise comparison point-based rating scale of AHP.
2.6.3 Solving the eigenvector of the judgment matrix
Based on the judgment matrix, the square root method was used to solve the eigenvector and eigenroot. The first step is calculating the square root aij of the product of each row of the judgment matrix n, then normalizing it, and finally calculating the maximum eigenroot of the judgment matrix. The formulas are Eqs. (8)–(10).
2.6.4 Consistency check?
After the eigenvector calculation is completed, a consistency test is required to reduce the subjectivity in the judgment matrix and to enhance the scientific nature of the data and calculations. In a pairwise comparison matrix, consistency means that the decision-maker's judgments must exhibit logical coherence and transitivity. Specifically, if option A is considered more important than option B, and option B is considered more important than option C, then consistency requires that option A must also be judged more important than option C (Saaty, 1984).
The consistency indicator (CI) is used to measure the deviation of the judgment matrix from the consistency: the smaller the CI, the greater the consistency of the judgment matrix. When CI = 0, the judgment matrix is completely consistent. The CI calculation formula is given as Eq. (11).
To quantify the standard, the relative consistency (CR) index was further calculated as Eq. (12).
Table 3Consistency index (RI) for a randomly generated matrix.
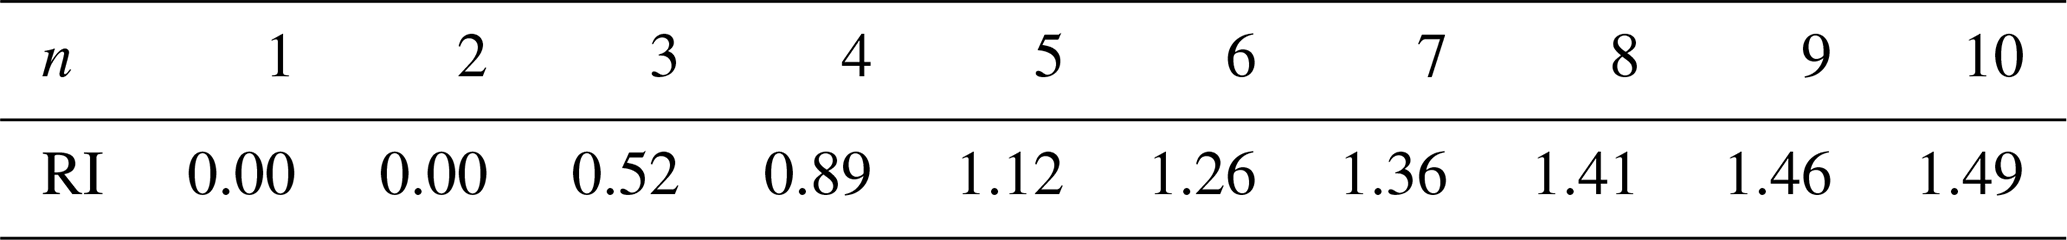
where the average random consistency index (RI) represents the average random consistency, which depends only on the order of the judgment matrix. The RI values for judgment matrices of orders 1 to 10 are shown in Table 3.
CR was determined based on the RI value. When CR < 0.1, the consistency of the judgment matrix is considered good. When CR > 0.1, the consistency of the judgment matrix is unacceptable, and the judgment matrix must be adjusted and modified. In such cases, the corresponding judgment matrix was further constructed, and the eigenvector and eigenvalue were calculated using Eqs. (11) and (12).
Finally, the judgment matrix that passed the consistency test was used to calculate the weights of the indicators at the different levels.
2.7 Determination of flood risk levels
The classification of flood risk levels often involves manually setting thresholds, which can introduce subjectivity and influence the accuracy of the risk assessment outcomes (Ma et al., 2022). To calculate the flood risk, we employed the natural-breakpoint classification method, which groups data into classes based on natural divisions within the dataset (Lin et al., 2019). This method works by identifying points where the data distribution changes most significantly and dividing the data into ranges based on these breaks. Unlike clustering methods, which do not focus on the number and range of elements in each group, the natural-breakpoint method ensures that the range and number of elements in each group are as balanced as possible (Ma et al., 2022).
3.1 Model flood risk results and evaluation
3.1.1 AutoML optimal model selection
In the experiment, nine typical ML models under the Auto-Sklearn framework were used to process the sample dataset, with 70 % of the sample set being used as the training dataset and 30 % being used as the testing dataset. The results of the comparative analysis of the model performance based on the test dataset are presented in Table 4. A comprehensive analysis of the results on the testing data revealed that, in terms of precision, CatBoost had the highest value (0.9030), followed by LightGBM (0.8960) and extra trees (0.8893). Meanwhile, CatBoost had the highest recall rate of 0.8883, followed by that of extra trees at 0.8870. The probability thresholds for precision, recall, and the F1 score are in the [0,1] range, while the Kappa coefficient range is . The F1 score and Kappa coefficient of the CatBoost model were also markedly higher than those of the other models, reflecting the model's good consistency. A comprehensive comparison showed that the precision, F1 score, and Kappa coefficient of the CatBoost model were the highest, with its precision reaching 0.9030, indicating that the recognition and prediction precision of the flooded points in the study area based on the CatBoost model were obviously better than those of other common machine learning models.
Table 4Comparative analysis of the performance of different ML models.
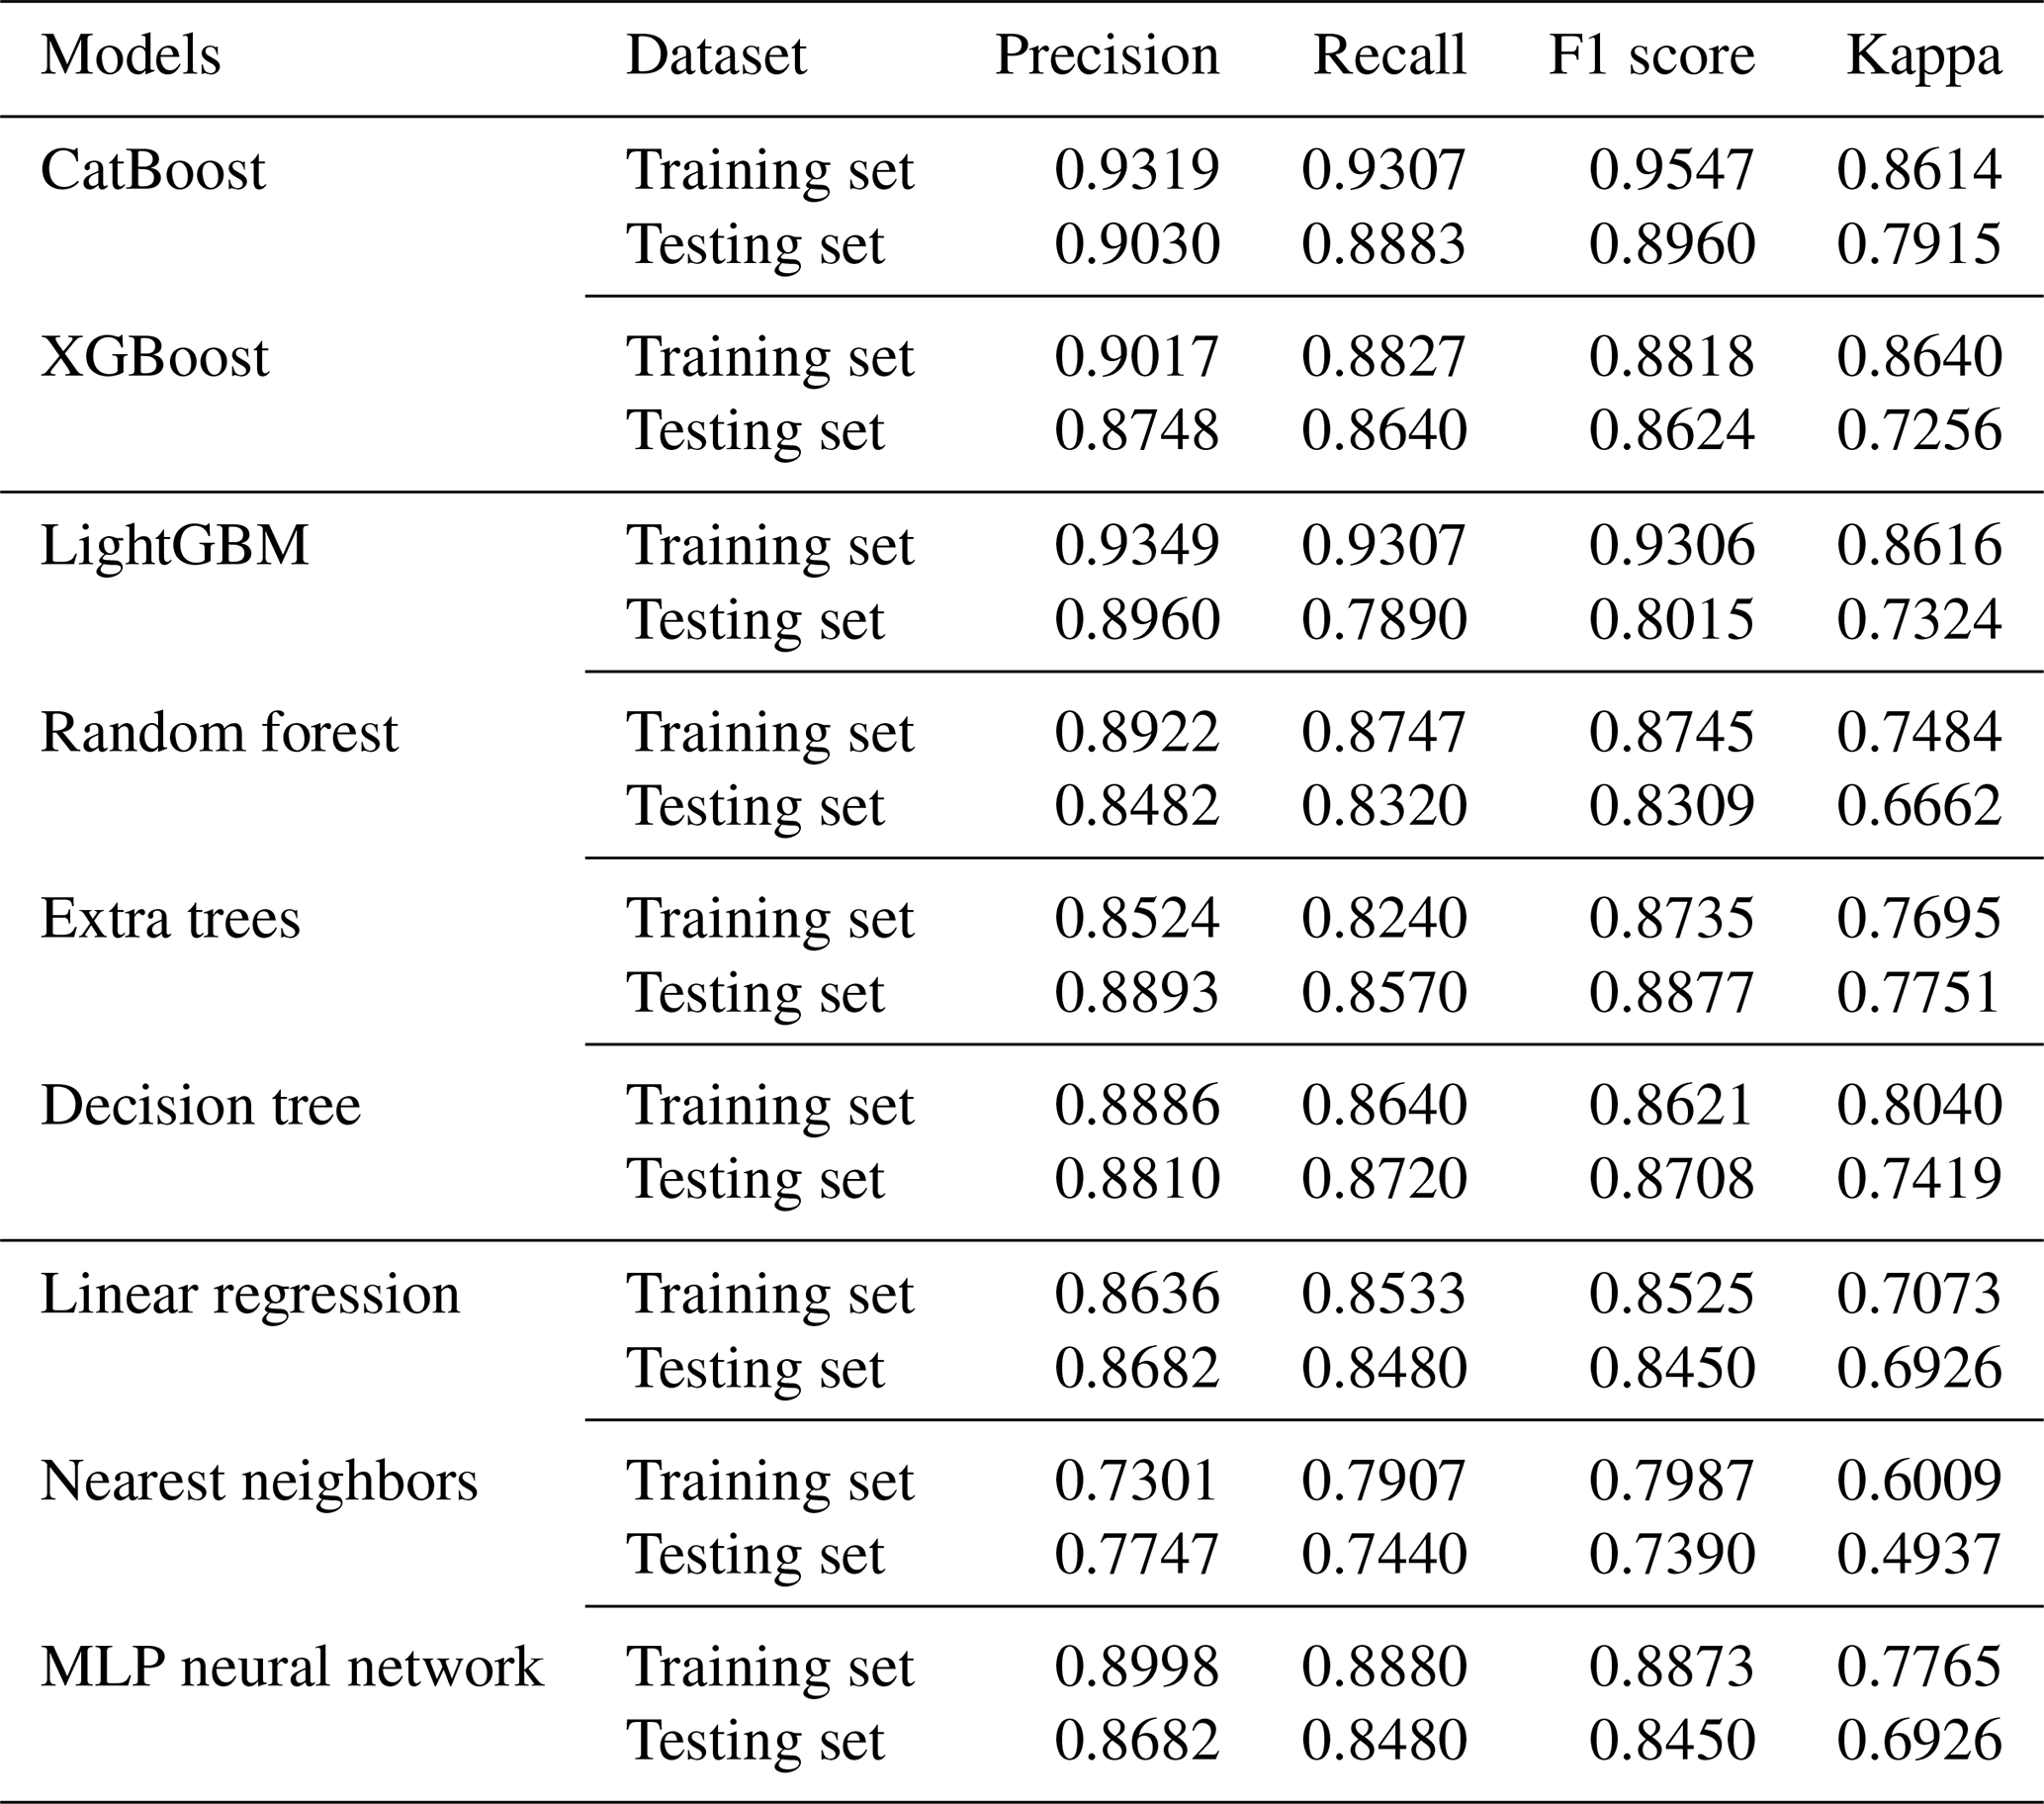
Flood data often involve various environmental factors and complex interactions, but the CatBoost model is highly effective at handling these nonlinear relationships and feature interactions. Additionally, the model incorporates multiple regularization mechanisms during tree construction, which helps reduce overfitting and enhances the model's generalization ability. As shown in Table 4, most models performed well on the training set, but their performance slightly declined on the test set, highlighting variations in generalization ability. CatBoost demonstrated strong robustness, achieving precision of 0.9319 on the training set and 0.9030 on the test set. Additionally, LightGBM and XGBoost showed relatively consistent performance between the training and test sets, suggesting better generalization. However, models such as decision tree and nearest neighbors exhibited a more significant performance drop on the test set, indicating a higher sensitivity to overfitting. Interestingly, in a few cases (e.g., extra trees), the test set performance slightly exceeded that of the training set for certain metrics. This is not uncommon in small, balanced datasets and may result from a combination of factors such as random sampling variation, slightly easier test samples, or appropriate regularization that reduces overfitting in the training set. To further evaluate overfitting, we used five-fold cross-validation by comparing the performance of the training and testing sets. The experimental results indicate that while most models showed some decline in performance on the test set, CatBoost maintained relatively stable performance, suggesting that the model does not exhibit significant overfitting and has good generalization ability.
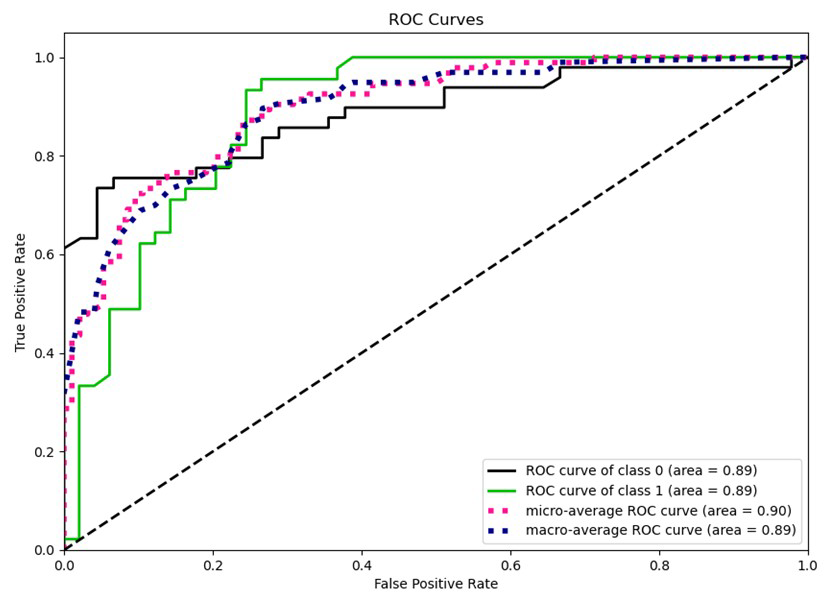
Figure 6Receiver operating characteristic (ROC) curves and corresponding area under the curve (AUC) values of the CatBoost model.
By comparing the performance of the nine models, we found that the CatBoost model was more effective at identifying flooded points. To further verify the excellent performance of the model, the receiver operating characteristic (ROC) curve and area enclosed by the coordinate axes (corresponding area under the curve (AUC) value) were plotted based on the test dataset to assess the model's binary classification effectiveness: the larger the AUC value, the better the model distinguishes between classes. When AUC > 0.8, the model prediction effect is very good (Sinha et al., 2008). In this study, both micro- and macro-average ROC curves were plotted. The micro-average ROC curve aggregates the contributions of all classes to compute the average ROC curve, treating each instance equally, while the macro-average ROC curve computes the ROC curve for each class independently and then averages the results. These two methods are commonly used for multiclass classification problems, but in this study, they were used to give a more comprehensive comparison of model performance. The verification results are shown in Fig. 6. The AUC value of the CatBoost model reached 0.91, guaranteeing the performance and prediction reliability of the CatBoost model. Based on this, the CatBoost model was selected to calculate the flood risk in the YRDUA.
3.1.2 Importance and interpretability analysis of hazard factors
In this study, the AutoML model was used specifically to assess flood hazard, which represents the physical likelihood of flood occurrence and is directly driven by environmental factors such as rainfall, topography, and drainage characteristics. Therefore, only the six second-level indicators under the hazard dimension were used as input features in the AutoML model. This approach allowed us to focus the model on identifying the key natural drivers of flooding, while the other dimensions – exposure, vulnerability, and resilience – were later incorporated via the AHP method for comprehensive flood risk evaluation.
To better understand the contribution of different hazard indicators to flood risk in the YRDUA, we conducted importance ranking analysis using the CatBoost model and interpretability analysis based on shapley additive explanations (SHAPs).
The CatBoost model was used to quantify the relative importance of six key hazard indicators. The results, shown in Fig. 7, reveal significant differences in their influence. DEM was identified as the most critical factor, contributing 68.55 %, which far exceeds the other factors, which is also in line with the findings of many researchers within the region (Mei et al., 2021; Wan et al., 2013). Low-lying areas naturally function as water accumulation zones, increasing flood vulnerability. Additionally, urban areas in the YRDUA are dominated by impervious surfaces, limiting infiltration and exacerbating flood risks. While PREC is a primary factor in storm-induced flooding, its direct contribution to flood risk was relatively low compared to DURA, which accounted for 10.07 %. This highlights the fact that the persistence of extreme rainfall events is a stronger predictor of flood hazard than total annual precipitation.
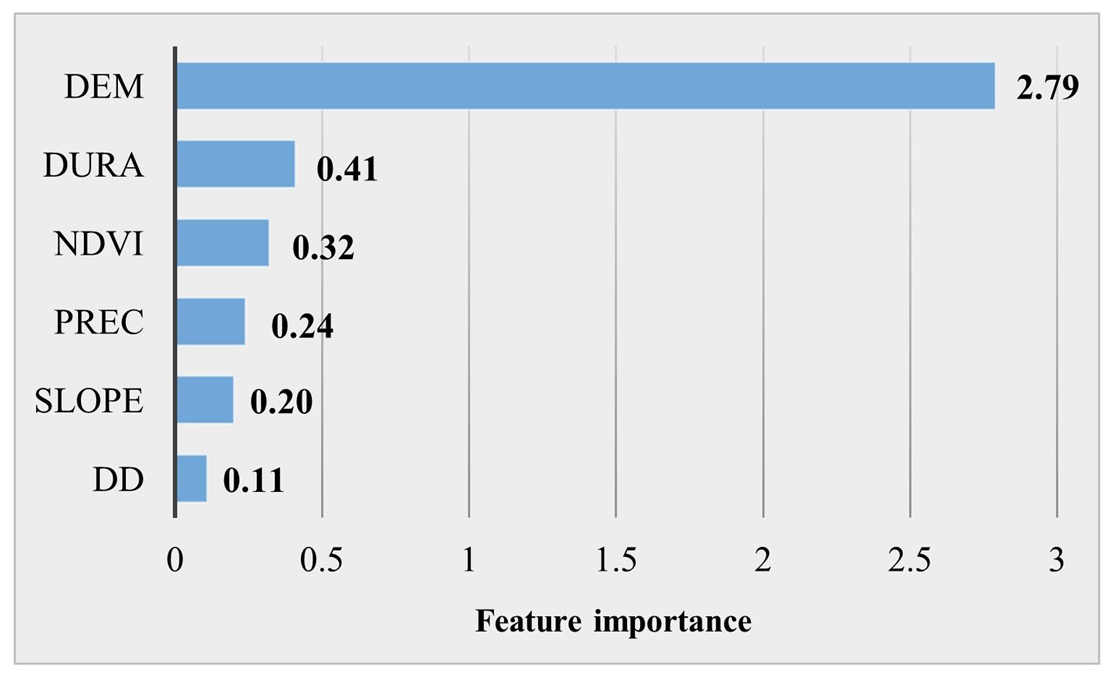
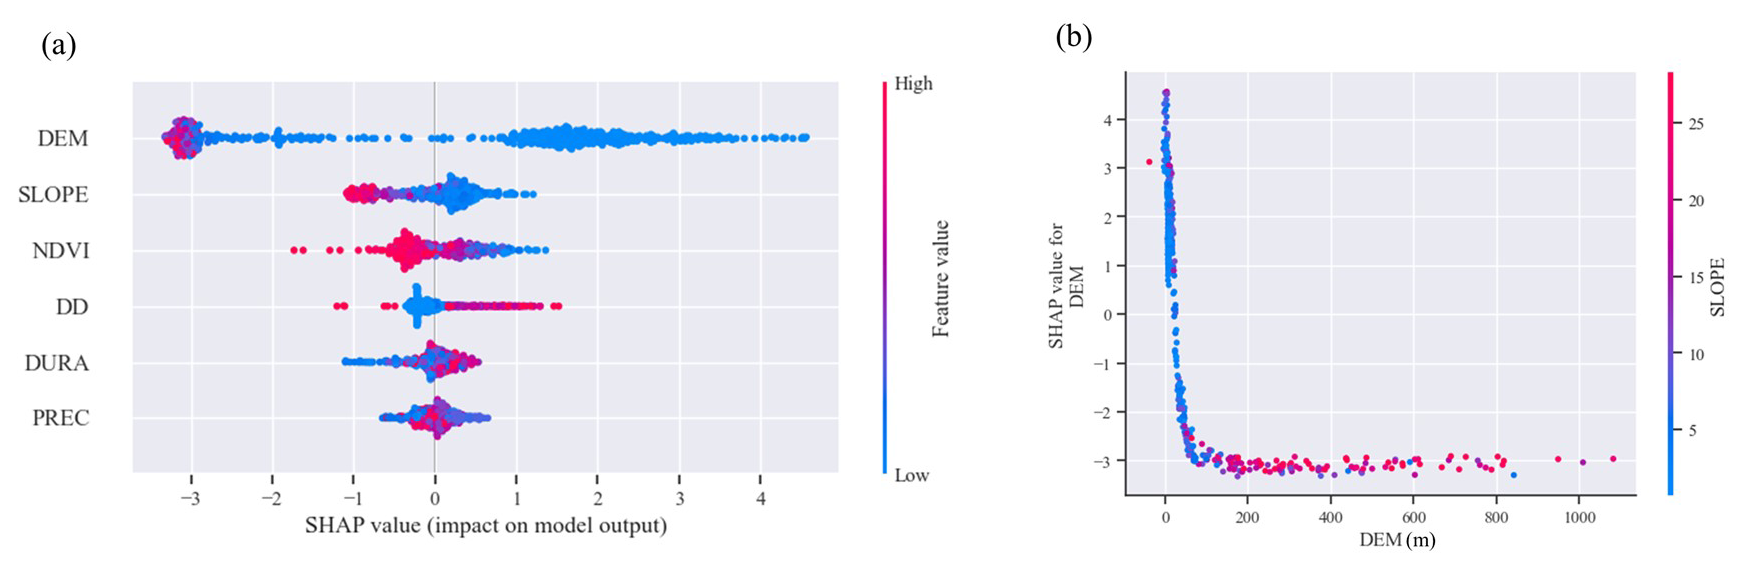
Figure 8(a) Scatter plot of hazard indicators from SHAP analysis. (b) SHAP dual-dependence analysis of elevation and slope factors.
To further analyze the interpretability of the model and understand the impact of individual flood hazard indicators on the model's classification results, this paper calculates SHAPs to indicate the contribution of each feature to the sample (Lundberg and Lee, 2017). SHAP, a game-theory-based post hoc interpretation method, quantifies the marginal impact of each feature on model predictions. The SHAP summary plot in Fig. 8a ranks features based on their absolute SHAP values, consistent with the CatBoost importance ranking. Each row represents a feature, where red indicates higher feature values and blue indicates lower values. The results show that DEM, slope, and NDVI negatively impact flood risk, meaning that higher elevation, steeper slopes, and greater vegetation coverage reduce flood hazards. In contrast, DD, DURA, and PREC positively impact flood risk, indicating that higher drainage density, longer durations of extreme rainfall, and increased precipitation levels contribute to higher flood hazards. Among these, DEM has the highest absolute SHAP value, with a strong clustering below zero, reinforcing its dominant role in flood risk determination.
To directly capture the interaction effects between paired indicator factors, this study used SHAP interaction values based on game theory, ensuring consistency while also explaining the interaction effects of individual predictions. For the DEM feature, which had the highest importance in the SHAP analysis, the factor most strongly correlated with it was slope. Therefore, to illustrate how one feature interacts with another to affect the model training results, this study used DEM and slope as examples to plot the SHAP interaction scatter plot, representing the dependency of the DEM feature. The results are shown in Fig. 8b. This dependency plot takes the form of a logarithmic function, indicating that as DEM increases, the flood hazard decreases. Additionally, the slope has a negative effect on the flood hazard in relation to elevation; that is, at lower elevations and gentler slopes, the flood hazard is greater.
3.1.3 Determination of flood risk index weights
A judgment matrix was constructed for the 19 indicator factors. A hazard index was constructed based on the feature importance calculated using AutoML. The exposure, vulnerability, and resilience indicators were determined based on the existing literature and relevant expert scores (Hsiao et al., 2021). The judgment matrices were constructed using a hybrid approach. For the hazard indicators, feature importance scores generated from the AutoML model were used to inform the pairwise comparisons. For the exposure, vulnerability, and resilience indicators, the weights were determined by the authors based on a combination of expert judgment, a review of existing studies, and consideration of the local conditions in the YRDUA. The Saaty 1–9 scale was applied to assign the relative importance to each pair of indicators. Finally, the judgment matrix results were tested for consistency, and the CR value was 0.0058, i.e., ≪ 0.100, indicating that the results passed the consistency test and that the flood risk index weight values calculated using the AHP were acceptable. The specific indicator weights and their corresponding impacts on flood risk are shown in Table 5. The “attribute” column represents the impact of each indicator on flood risk, with “+” indicating a positive impact on flood risk and “–” indicating a negative impact on flood risk.
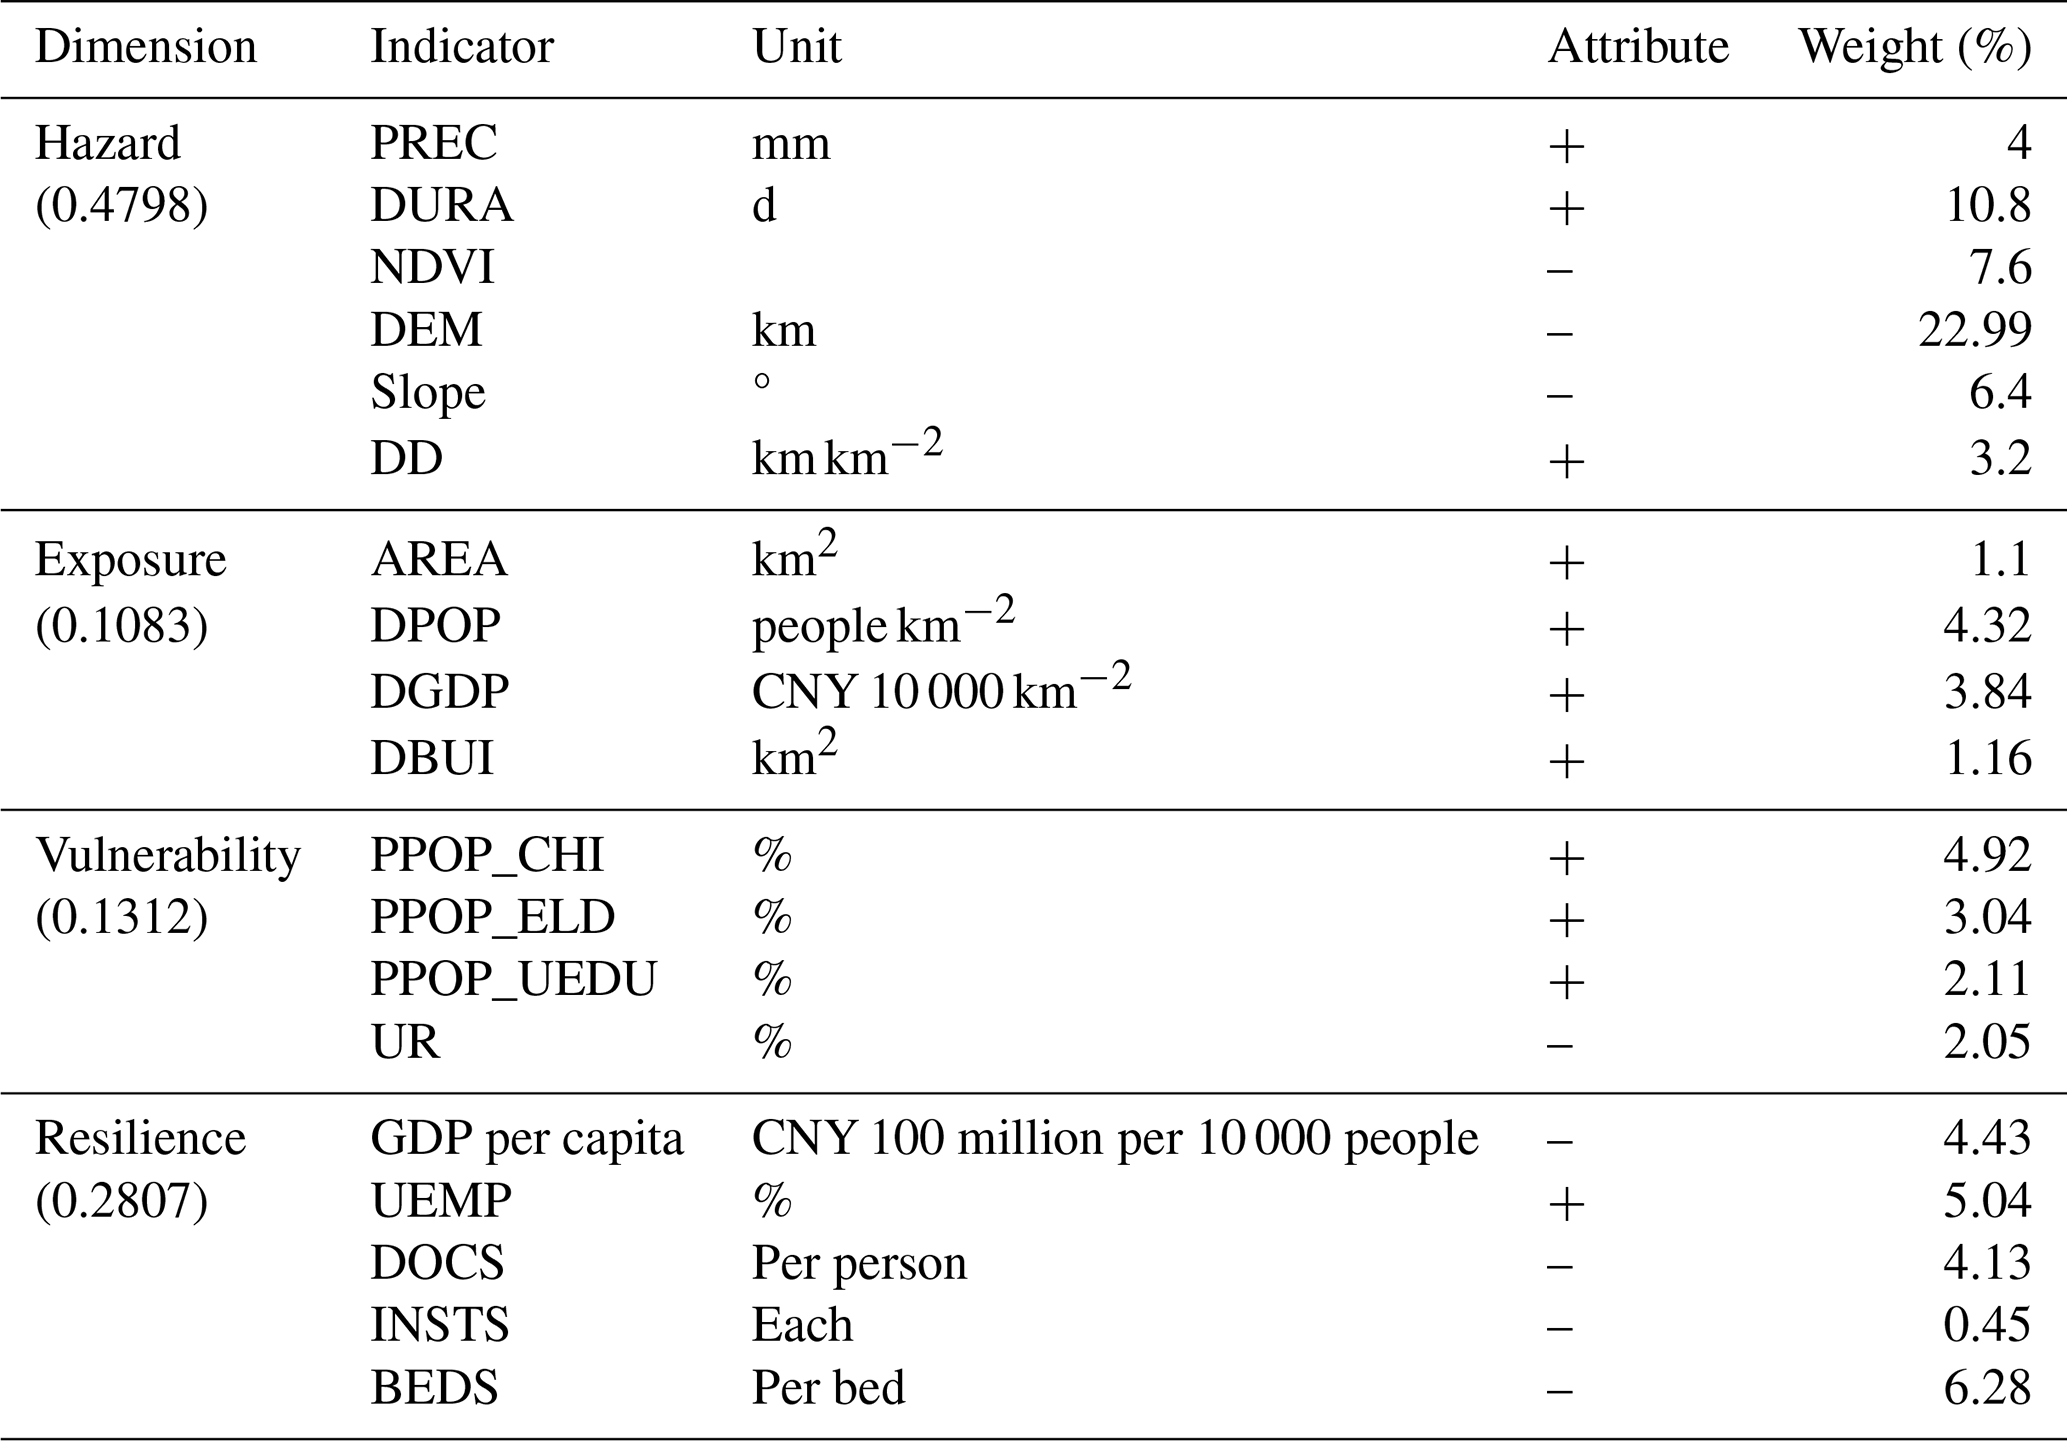
The weighted results reflect the degrees of influence of the different indicator factors on flood risk. Hazard was the decisive factor affecting flood risk, with a weight of 0.4798, followed by resilience and vulnerability. Exposure had a relatively low impact on flood risk. In terms of hazard, the topography and DURA were the main factors affecting the occurrence of flooding. These two indicators determined the characteristics of flood disasters in the YRDUA from the perspective of disaster-prone environments and driving factors, respectively. In terms of exposure, the YRDUA is a typical area with rapid social, economic, and population growth in China. High population and GDP densities increase the risk of flood exposure. In addition, the uneven age distribution and education levels of the population are important social factors affecting the risk of flood disasters in urban agglomerations. In terms of resilience, improving health and medical infrastructure, developing the regional economy, and reducing unemployment rates are conducive to improving the overall disaster response capacity of the region and reducing the risk of flood disasters in the YRDUA.
3.1.4 Model result verification
Based on CatBoost under the AutoML framework and AHP, the levels of flood hazard, exposure, vulnerability, and resilience were calculated for floods in the YRDUA, and the spatial distribution of flood risks in the region was obtained according to the weights determined by the model. Combined with the natural-breakpoint classification method, a flood risk zoning map of the YRDUA was constructed. The extracted flood points were superimposed on the map to verify whether the model exhibited good flood risk assessment capabilities. The results are shown in Fig. 9, indicating that the distribution of flood points was consistent with the distribution of high- and medium-to-high-risk areas in the region, with the model assessment results corresponding well with the actual flooding situation. To specifically illustrate the correspondence of the results, the proportion of flood points distributed in high- and medium-to-high-risk areas was quantitatively calculated. The value obtained was 87.45 %, indicating that the flood risk assessment results of the model in this study were highly credible, and subsequent analysis could be conducted.
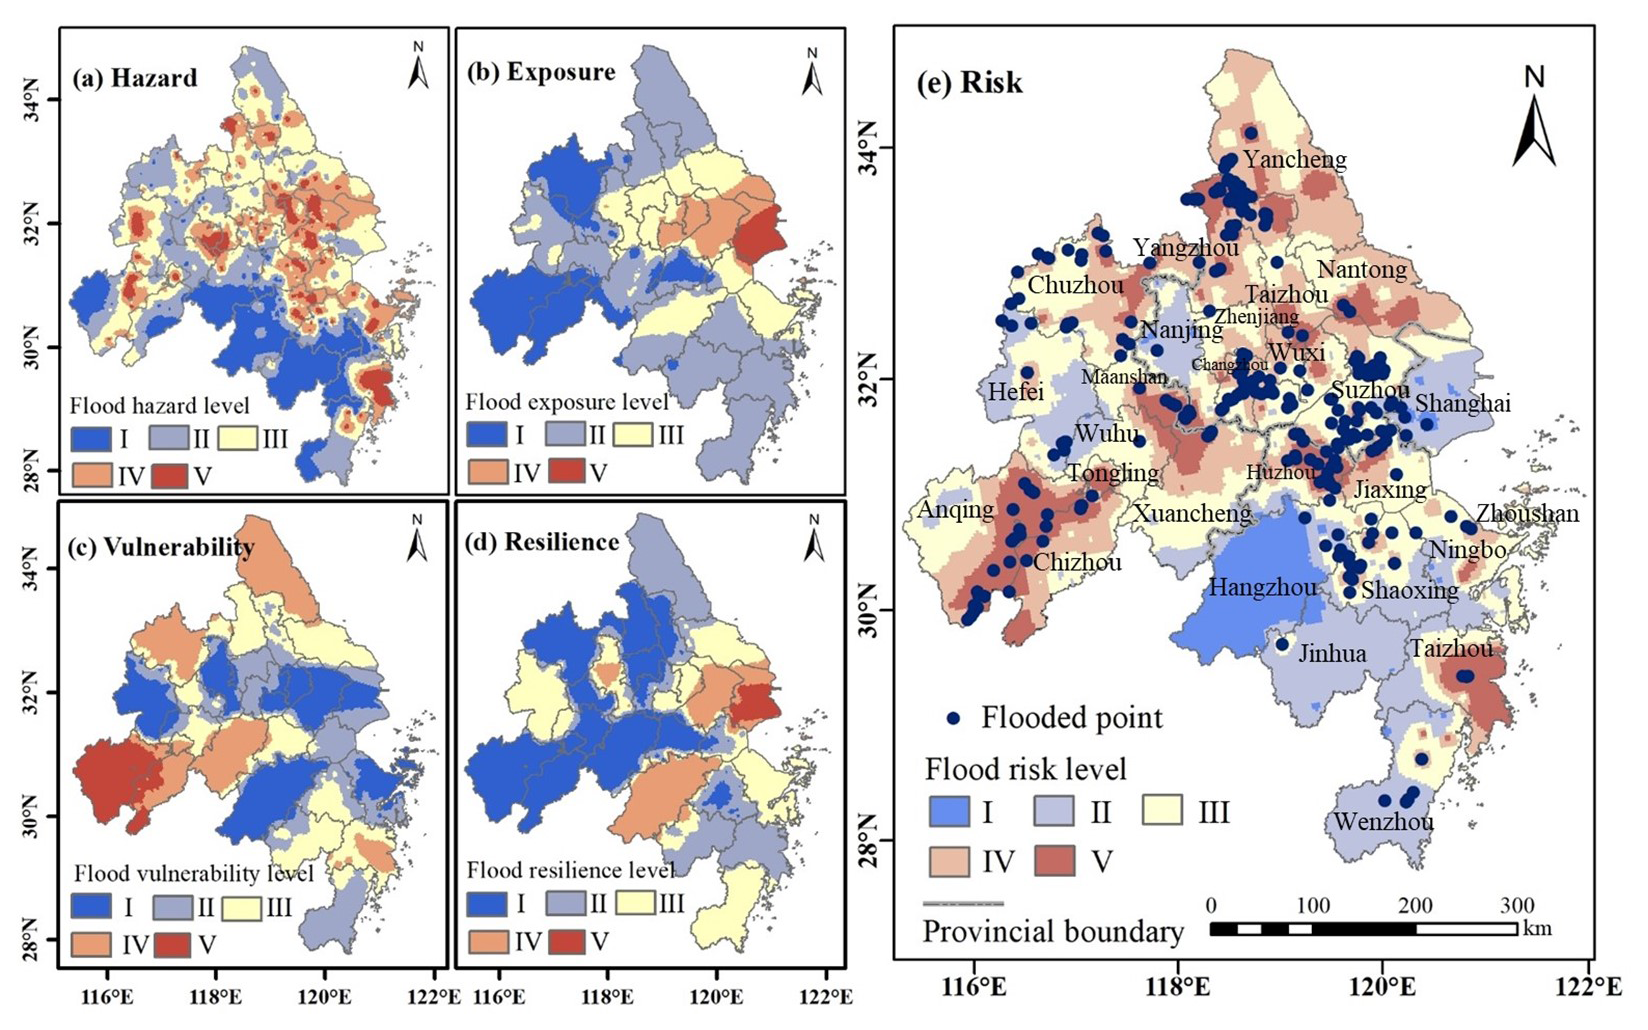
Figure 9Flood risk level distribution and verification results based on a flood risk assessment model. The flood hazard, exposure, vulnerability, and resilience of the YRDUA were calculated using CatBoost under the AutoML framework and AHP. The flood hazard level (a), flood exposure level (b), flood vulnerability level (c), flood resilience level (d), and flood risk spatial distribution (e) were derived through natural-breakpoint classification in the ArcGIS software based on model-determined weights, resulting in a flood risk zoning map for the Yangtze River Delta region.
As shown in Fig. 9, the high- and medium-to-high-risk areas of the YRDUA were mainly located in the northern part of the region, concentrated in Chizhou, Anqing, Ma'anshan, and Xuancheng cities in Anhui province; Yancheng and Yangzhou cities in Jiangsu province; and Taizhou city in Zhejiang province. Meanwhile, most areas of Hangzhou city had the lowest risk. The flood risks in cities such as Shanghai, Nanjing, and Jinhua were also relatively low. The overall analysis showed that the flood risk in the study area was low in the southwest and high in the northeast, determined largely by natural terrain and meteorological factors. The spatial distribution of the flood hazard class was similar to the distribution of flood risks; exposure decreased stepwise from Shanghai into the surrounding areas, reflecting the fact that densely populated and economically developed cities have higher exposure. Areas with higher vulnerability were mainly concentrated in Chizhou, Anqing, Xuancheng, Chuzhou, and Yancheng cities. The number of vulnerable people in these cities was relatively high. Vulnerability has aggravated the flood risks in Chizhou and Anqing cities on the basis of flood risk. Meanwhile, Shanghai had the best resilience performance, followed by that of Hangzhou, Suzhou, and Nanjing cities, greatly lessening the flood risks in these cities.
3.2 Analysis of changes in the spatiotemporal characteristics of flood risk
The flood risk results for the YRDUA from 1990 to 2020 were obtained based on the flood risk assessment model proposed in this study. The differences in flood risk among cities in the YRDUA over the past few decades are primarily due to a complex interplay of various factors, including geographic and climatic conditions, urbanization processes, socioeconomic factors, ecological changes, and historical flood events. The topography and precipitation patterns of different cities affect their capacity for rainwater drainage and accumulation, while urbanization leads to an increase in impervious surfaces and variations in infrastructure development, impacting flood management capabilities. Additionally, differences in DPOP, economic development levels, and flood management policies can exacerbate flood risk. Furthermore, the increasing frequency of extreme weather events due to climate change further elevates flood risk. These factors determine the varying levels of flood risk among cities within the YRDUA.
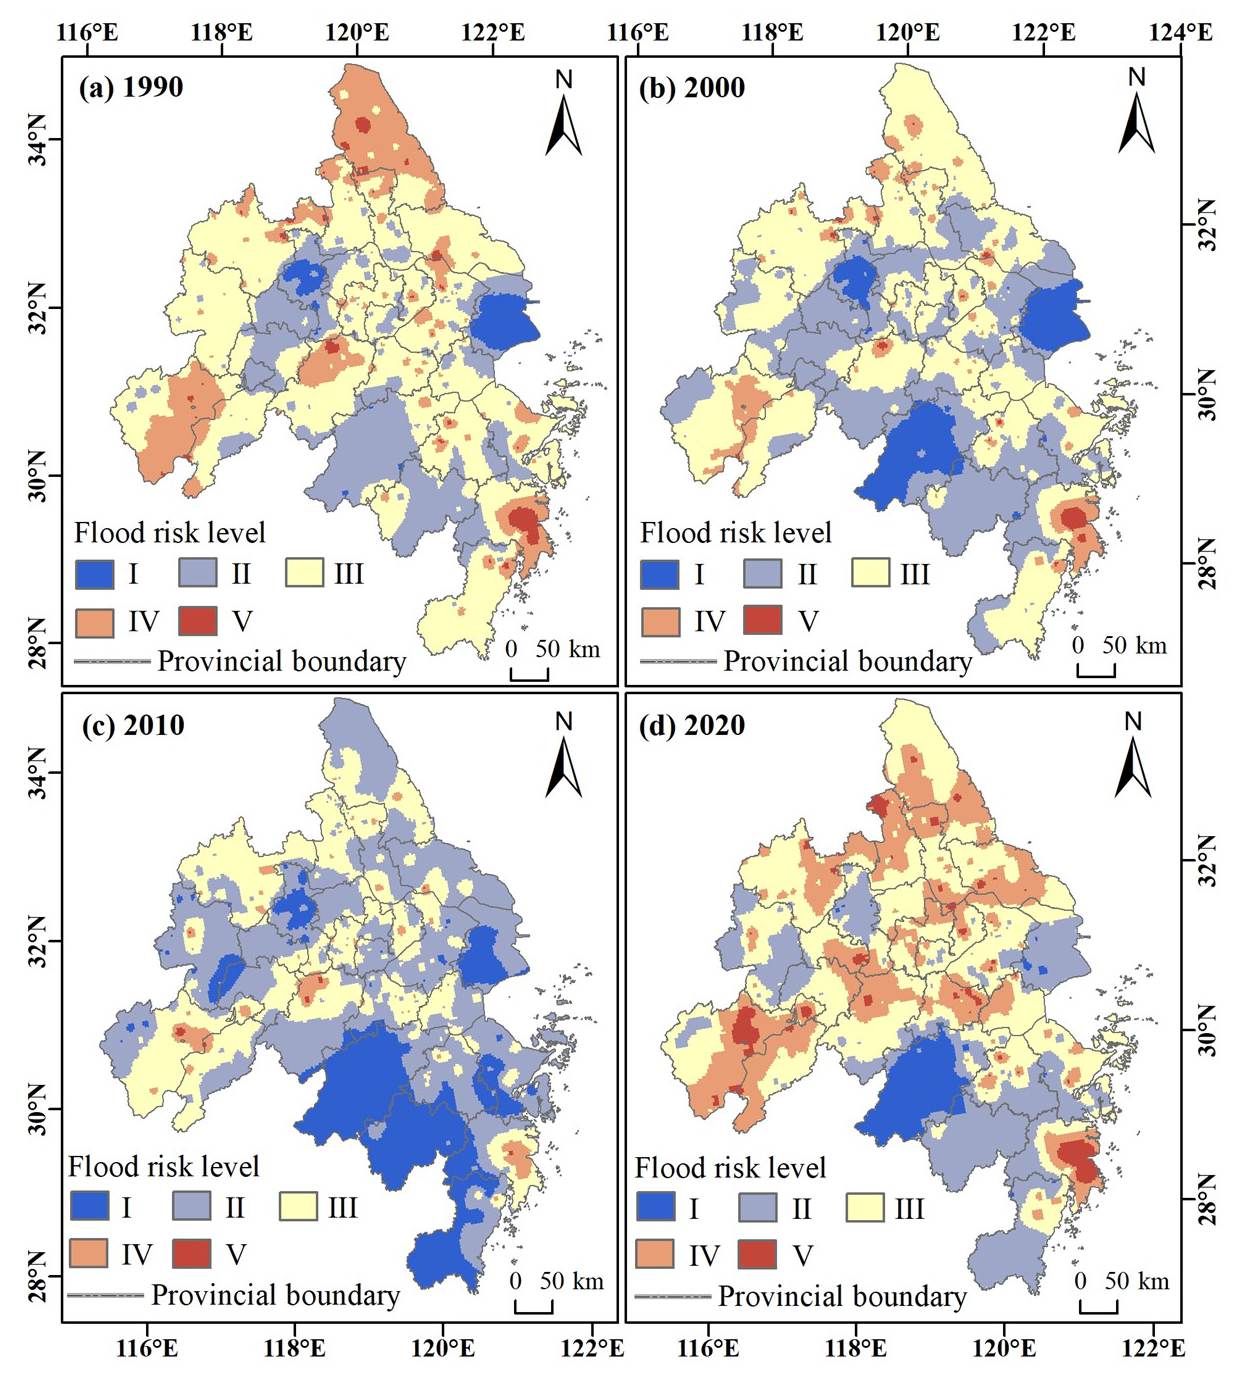
Figure 10Spatial distributions of flood risk in the YRDUA in different years between 1990 and 2020.
As the interannual difference in flood risk in the region was small and the change response was weak, we selected the flood risk results for 1990, 2000, 2010, and 2020 to analyze the changes in the spatiotemporal pattern. In this analysis, variables such as PREC and DURA exhibit clear temporal variability, as they change year by year due to weather patterns. However, other factors like DEM, slope, and NDVI and urbanization indicators such as DPOP and GDP are spatial variables that do not exhibit direct temporal changes, but their effects on flood risk are influenced by changing socioeconomic and ecological conditions.
Regarding spatial patterns (Fig. 10), the flood risk in the YRDUA showed clear spatial heterogeneity. The southwestern part of the study area and Shanghai have shown low flood risk over the past 30 years, whereas the central and northern parts of the region have been more likely to face flood risks depending on the natural conditions, population, economic conditions, and recovery capacity of the region. Regarding temporal patterns, from 1990 to 2010, areas with high and medium-to-high risk decreased markedly. By 2010, most of the YRDUA (except for a few areas) was in a state of medium risk or below, with the southwestern region exhibiting a large range of low risk levels. The corresponding areas for each risk level are shown in Fig. 11. From 1990 to 2010, areas of low- and low-to-medium-risk levels gradually increased, maximizing in 2010, whereas areas of medium risk and above continued to decrease. By 2020, the number of high-risk areas for flooding had increased. There is a tendency for areas of medium-to-high risk in the central region to shift towards high-risk areas in 2020, as compared to the state in 1990. Meanwhile, high-risk areas for floods also appeared in Chizhou and Anqing cities in Anhui province, which was mainly due to the intensification of extreme weather, unbalanced population distribution, and rapid economic development in recent years.
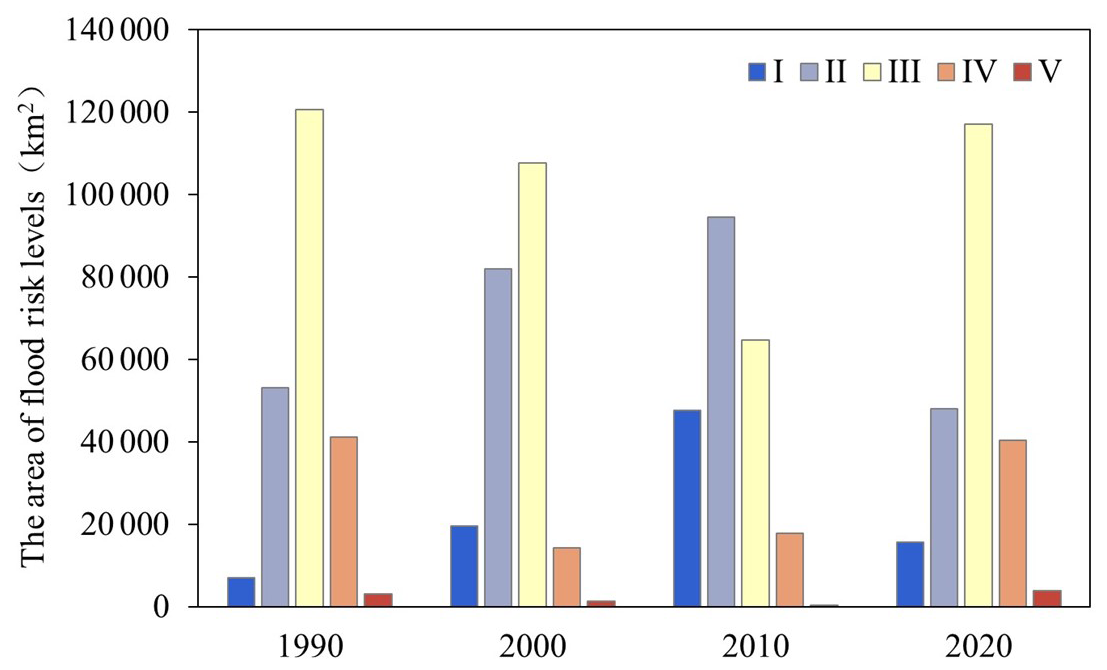
Figure 11Areas at different levels of flood risk in the YRDUA in different years between 1990 and 2020.
To further analyze the changes in flood risk in the region, we calculated the change rate of the area of different risk levels every 10 years and the overall change rate over 30 years. The interannual rate of change is expressed in Eq. (13).
where Rl,ij is the rate of change in the flood risk area of a certain level l in a certain year, i and j are different years, and riskl,j and riskl,j are the areas corresponding to the flood risk of this level in different years.
Table 6Interannual change rates of flood risk areas of different levels (expressed as percentages). The flood risk levels are classified into five categories represented by Roman numerals: I (very low), II (low), III (moderate), IV (high), and V (very high).
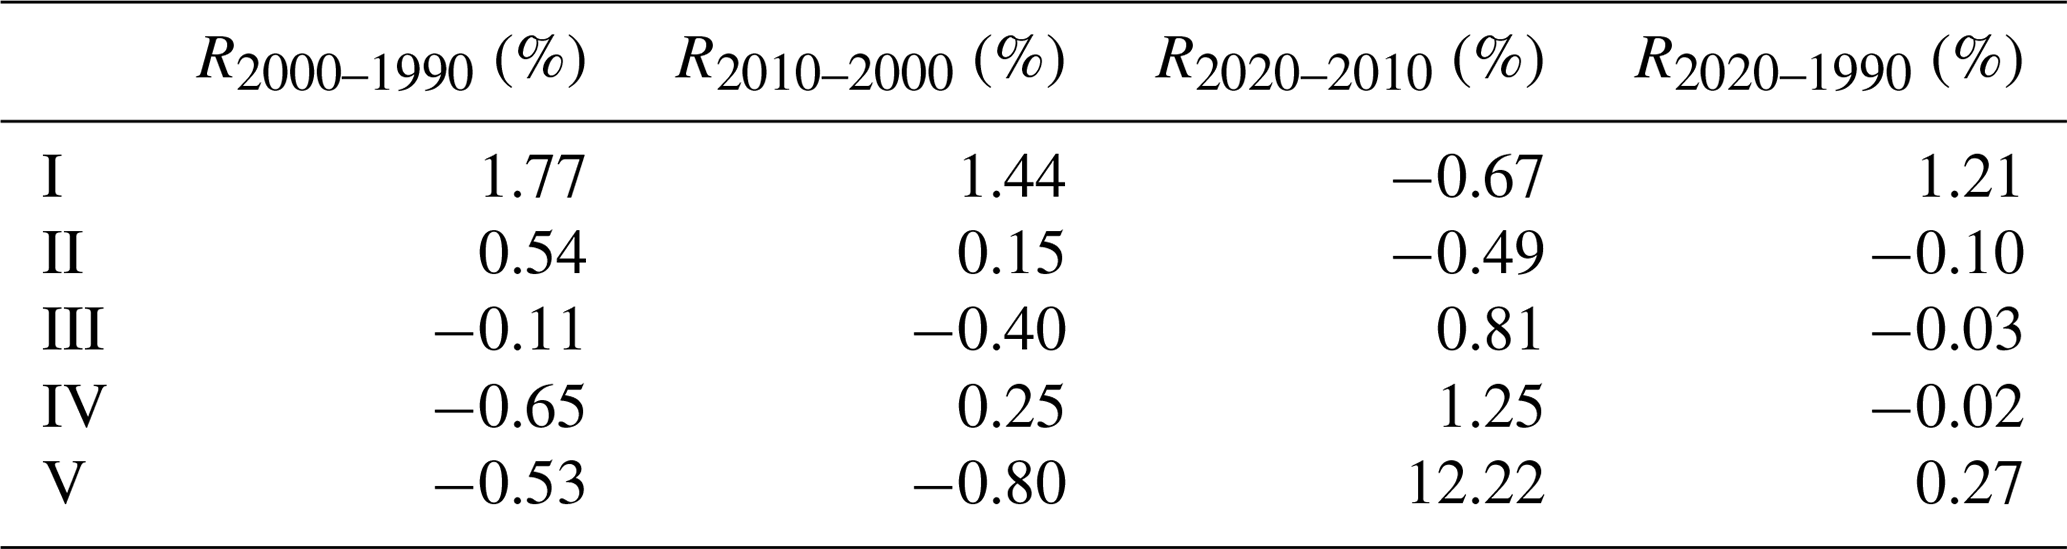
The interannual variation rate of the flood risk is shown in Table 6. Results showed that the interannual variation between the areas of low and high risk was relatively large. The low-risk area was at a maximum in 2010, and both R2000–1990 and R2010–2000 showed a positive variation rate. The high-risk area showed the largest interannual variation rate from 2010 to 2020, reaching 12.22 % and causing the high-risk flood area in 2020 to spread, resulting in a large high-risk area.
Analyzing the flood risk of the entire urban agglomeration does not reveal the spatial-scale effect of flood risk, nor does it consider the correlation and impact of flood risk at different spatial scales. To reflect the distribution of and changes in flood risk at different spatial scales within the region, the risk intensity of different provinces was further analyzed, and the results are shown in Fig. 12. In Fig. 12, the average flood risk reflects the differences in risk development of the provincial administrative units in Shanghai, Anhui, Zhejiang, and Jiangsu in terms of time and space. Overall, all administrative units in the YRDUA exhibited the highest flood risk in 2020, and the overall risk trend increased. At the provincial level, Shanghai's flood risk was consistently low, showing a trend of first decreasing from 0.152 in 1990 to 0.123 in 2000 and then gradually increasing to 0.311 in 2020. Among the other three provinces, Jiangsu and Anhui had relatively high flood risks, reaching 0.525 and 0.516, respectively, in 2020, whereas Zhejiang had a relatively low flood risk, which remained stable between 1990 and 2010, with no distinct changes.
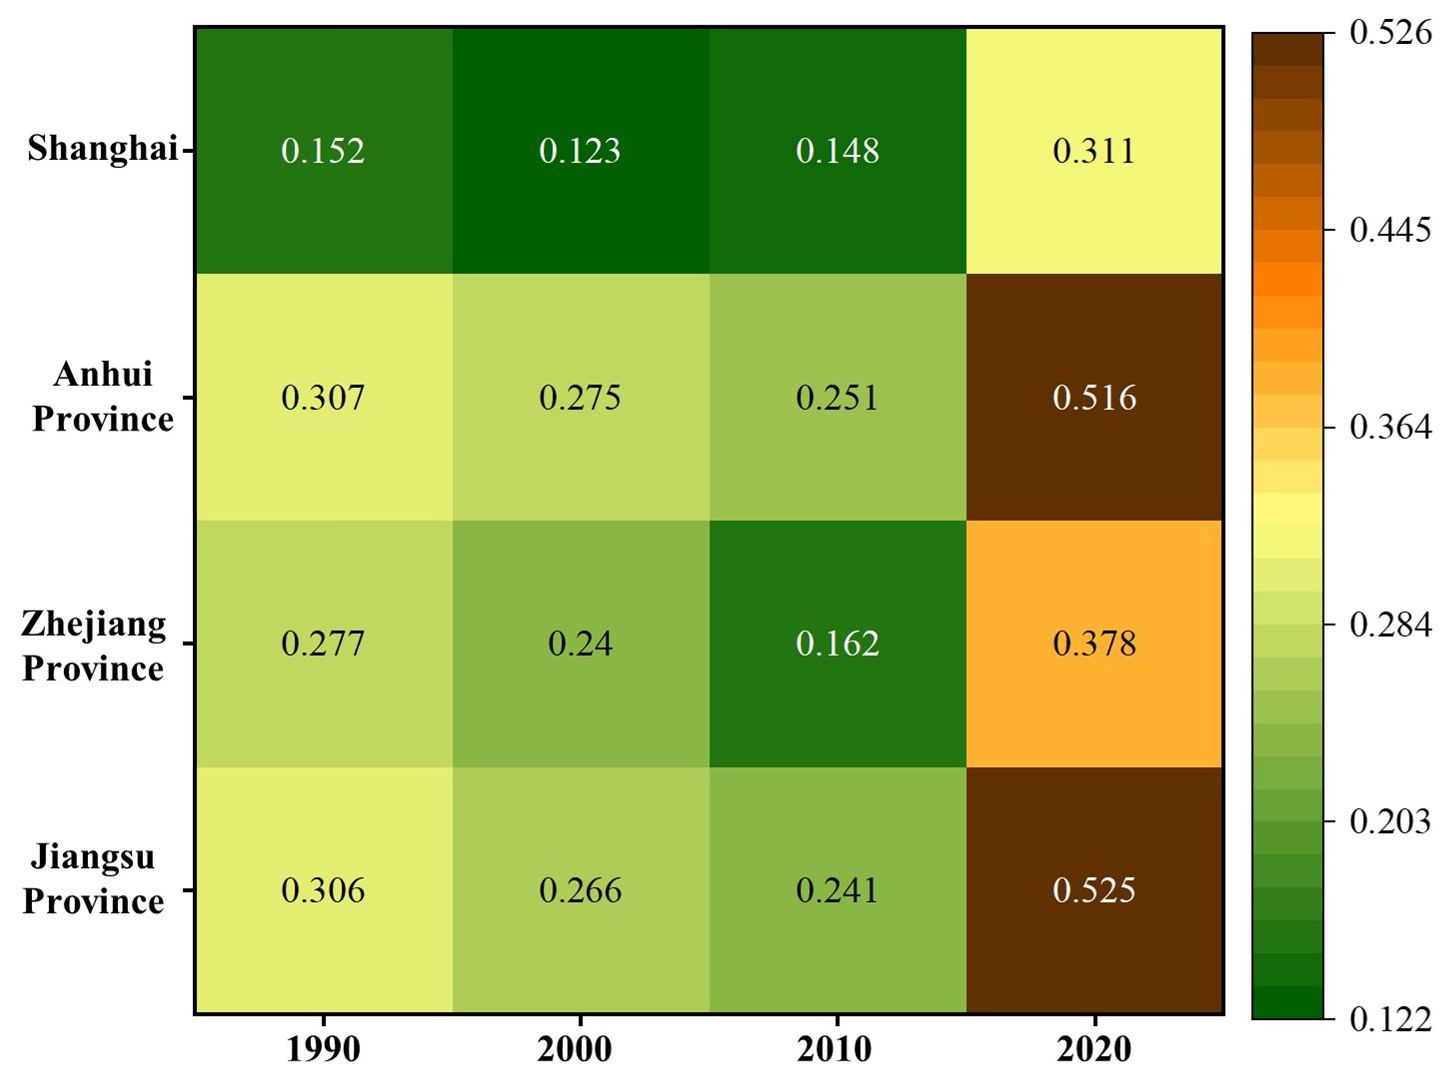
Figure 12Distribution of average flood risk in each province of the Yangtze River Delta Urban Agglomeration from 1990 to 2020.
Flood risk assessment at the scale of urban agglomeration is a hot research topic in the field of disaster prevention and mitigation. In this study, the flood risk assessment indexes for YRDUA were determined related to different dimensions of hazard, exposure, vulnerability and resilience, and a flood risk assessment model based on AutoML and AHP was constructed to study the changes in the spatial and temporal characteristics of flood risk in the region in the last 30 years from 1990 to 2020, aiming to provide a scientific basis for the prevention of damage and the resilience of the YRDUA. The main conclusions of this study are as follows:
-
In the flood risk calculation, the CatBoost model has the highest precision, F1 score, and Kappa, and its precision can reach 0.9030. Further analysis of the ROC curve and the corresponding AUC value of the model shows that its AUC value is 0.91, which indicates that the CatBoost model has the best performance and prediction reliability. Therefore, the CatBoost model was selected to calculate the flood risk in the YRDUA.
-
Using the flood risk assessment model based on AutoML and AHP to obtain the flood risk of the YRDUA, superimposed on the flooded point data for comparative analysis, we found that the distribution of flooded points in the study area is basically consistent with the distribution of high- and medium-to-high-risk areas of flooding, and the proportion of the distribution is 87.45 %, which indicates that the model in this study has a good performance and credibility regarding the assessment of flood risk.
-
The spatial distribution of flood risk in the YRDUA during the 30-year study period shows obvious heterogeneity, with the southwestern part of the region and Shanghai city having a low flood risk, whereas the north-central part of the region faces a relatively high probability of flood risk. Between 1990 and 2010, there was a substantial decrease in the high- and medium-to-high-risk flood zones, yet by 2020, there was an increase in the high-risk flood zones. There is a tendency for the medium-to-high-risk area in the center of the region to shift to a high-risk area, whereas high-risk areas also occur in the cities of Chizhou and Anqing in Anhui province.
-
All administrative units of the YRDUA exhibited the highest flood risk in 2020, with an overall trend of increasing risk. At the provincial level, Jiangsu and Anhui provinces possess relatively high flood risks, whereas Zhejiang province has a relatively low flood risk.
-
The findings of this study provide valuable insights for flood risk management and policy-making. The flood risk maps generated in this study can serve as a scientific basis for urban planning, infrastructure development, emergency response, and disaster prevention strategies. By integrating these risk assessments into decision-making processes, government agencies and urban planners can optimize flood prevention measures and enhance regional resilience. Furthermore, the AutoML framework used in this study can be applied to other regions for flood risk assessment and can be integrated into future climate change scenarios to enable long-term forecasting and proactive disaster mitigation strategies.
Administrative boundaries and river network density were obtained from the Resource and Environmental Science and Data Center, Chinese Academy of Sciences (https://www.resdc.cn/DataList.aspx, last access: 13 May 2022, 2022.). Digital elevation data were derived from the SRTM1 dataset provided by USGS (https://earthexplorer.usgs.gov/, last access: 19 January 2023). Land use data were sourced from the China Land Cover Dataset (CLCD) developed by Wuhan University (https://doi.org/10.5281/zenodo.8176941, last access: 6 October 2023). Hourly precipitation data from 120 meteorological stations were obtained from the National Meteorological Information Center, China Meteorological Administration (https://data.cma.cn/, last access: 3 December 2021). Historical flood inundation data were obtained from the MODIS-based Global Flood Database and validated using the EM-DAT disaster database (https://developers.google.com/earth-engine/datasets/catalog/GLOBAL_FLOOD_DB_MODIS_EVENTS_V1, last access: 25 January 2023.).
YG: writing – original draft preparation, validation, software, methodology, conceptualization. HL: writing – review and editing, visualization, supervision, formal analysis. YZ: methodology, formal analysis. HJ: writing – review and editing, methodology. SW: software, formal analysis. YG: visualization, software. SZ: writing – review and editing, resources, project administration, funding acquisition, conceptualization.
The contact author has declared that none of the authors has any competing interests.
Publisher's note: Copernicus Publications remains neutral with regard to jurisdictional claims made in the text, published maps, institutional affiliations, or any other geographical representation in this paper. While Copernicus Publications makes every effort to include appropriate place names, the final responsibility lies with the authors.
We would like to thank Editage (https://www.editage.cn, last access: 10 July 2024) for the English language editing of an earlier version of the paper.
This study was supported by the National Natural Science Foundation of China (Grant Nos. 42271483 and 42071364) and Jiangsu Provincial Natural Resources Science and Technology Project (JSZRKJ202405).
This paper was edited by Brunella Bonaccorso and reviewed by Abhineet Gupta and one anonymous referee.
Abu-Salih, B., Wongthongtham, P., Coutinho, K., Qaddoura, R., Alshaweesh, O., and Wedyan, M.: The development of a road network flood risk detection model using optimised ensemble learning, Eng. Appl. Artif. Intel., 122, 106081, https://doi.org/10.1016/j.engappai.2023.106081, 2023.
Adnan, R. M., Yuan, X., Kisi, O., and Anam, R.: Improving Accuracy of River Flow Forecasting Using LSSVR with Gravitational Search Algorithm, Adv. Meteorol., 2017, 1–23, https://doi.org/10.1155/2017/2391621, 2017.
Anon: Identification of sensitivity indicators of urban rainstorm flood disasters: A case study in China, J. Hydrol., 599, 126393, https://doi.org/10.1016/j.jhydrol.2021.126393, 2021.
Aven, T.: Risk assessment and risk management: Review of recent advances on their foundation, Eur. J. Oper. Res., 253, 1–13, https://doi.org/10.1016/j.ejor.2015.12.023, 2016.
Bostan, P. A., Heuvelink, G. B. M., and Akyurek, S. Z.: Comparison of regression and kriging techniques for mapping the average annual precipitation of Turkey, Int. J. Appl. Earth Obs., 19, 115–126, https://doi.org/10.1016/j.jag.2012.04.010, 2012.
Consuegra-Ayala, J. P., Gutiérrez, Y., Almeida-Cruz, Y., and Palomar, M.: Intelligent ensembling of auto-ML system outputs for solving classification problems, Inform. Sciences, 609, 766–780, https://doi.org/10.1016/j.ins.2022.07.061, 2022.
Cressie, N.: The origins of kriging, Math. Geol., 22, 239–252, https://doi.org/10.1007/BF00889887, 1990.
Criado, M., Martínez-Graña, A., San Román, J. S., and Santos-Francés, F.: Flood risk evaluation in urban spaces: The study case of Tormes River (Salamanca, Spain), Int. J. Env. Res. Pub. He., 16, 5, https://doi.org/10.3390/ijerph16010005, 2019.
Ding, T., Chen, J., Fang, Z., and Chen, J.: Assessment of coordinative relationship between comprehensive ecosystem service and urbanization: A case study of Yangtze River Delta urban Agglomerations, China, Ecol. Indic., 133, 108454, https://doi.org/10.1016/j.ecolind.2021.108454, 2021.
Donegan, H. A., Dodd, F. J., and McMaster, T. B. M.: A New Approach to Ahp Decision-Making, J. Roy. Stat. Soc. D-Sta., 41, 295–302, https://doi.org/10.2307/2348551, 1992.
Echendu, A. J.: The impact of flooding on Nigeria's sustainable development goals (SDGs), Ecosyst. Health Sustainability, 6, 1791735, https://doi.org/10.1080/20964129.2020.1791735, 2020.
Fernández, D. S. and Lutz, M. A.: Urban flood hazard zoning in Tucumán Province, Argentina, using GIS and multicriteria decision analysis, Eng. Geol., 111, 90–98, 2010.
Gain, A. K., Mojtahed, V., Biscaro, C., Balbi, S., and Giupponi, C.: An integrated approach of flood risk assessment in the eastern part of Dhaka City, Nat. Hazards, 79, 1499–1530, https://doi.org/10.1007/s11069-015-1911-7, 2015.
Gu, C., Hu, L., Zhang, X., Wang, X., and Guo, J.: Climate change and urbanization in the Yangtze River Delta, Habitat Int., 35, 544–552, https://doi.org/10.1016/j.habitatint.2011.03.002, 2011.
Guan, X., Yu, F., Xu, H., Li, C., and Guan, Y.: Flood risk assessment of urban metro system using random forest algorithm and triangular fuzzy number based analytical hierarchy process approach, Sustain. Cities Soc., 109, 105546, https://doi.org/10.1016/j.scs.2024.105546, 2024.
Gudiyangada Nachappa, T., Tavakkoli Piralilou, S., Gholamnia, K., Ghorbanzadeh, O., Rahmati, O., and Blaschke, T.: Flood susceptibility mapping with machine learning, multi-criteria decision analysis and ensemble using Dempster Shafer Theory, J. Hydrol., 590, 125275, https://doi.org/10.1016/j.jhydrol.2020.125275, 2020.
Guo, Y., Quan, L., Song, L., and Liang, H.: Construction of rapid early warning and comprehensive analysis models for urban waterlogging based on AutoML and comparison of the other three machine learning algorithms, J. Hydrol., 605, 127367, https://doi.org/10.1016/j.jhydrol.2021.127367, 2022.
He, X., Zhao, K., and Chu, X.: AutoML: A survey of the state-of-the-art, Knowl.-Based Syst., 212, 106622, https://doi.org/10.1016/j.knosys.2020.106622, 2021.
Hites, R., De Smet, Y., Risse, N., Salazar-Neumann, M., and Vincke, P.: About the applicability of MCDA to some robustness problems, Eur. J. Oper. Res., 174, 322–332, https://doi.org/10.1016/j.ejor.2005.01.031, 2006.
Hsiao, S.-C., Chiang, W.-S., Jang, J.-H., Wu, H.-L., Lu, W.-S., Chen, W.-B., and Wu, Y.-T.: Flood risk influenced by the compound effect of storm surge and rainfall under climate change for low-lying coastal areas, Sci. Total Environ., 764, 144439, https://doi.org/10.1016/j.scitotenv.2020.144439, 2021.
Hutter, F., Kotthoff, L., and Vanschoren, J. (Eds.): Automated Machine Learning: Methods, Systems, Challenges, Springer Nature, https://doi.org/10.1007/978-3-030-05318-5, 2019.
Jordan, M. and Mitchell, T.: Machine learning: Trends, perspectives, and prospects, Science, 349, 255–260, https://doi.org/10.1126/science.aaa8415, 2015.
Kanani-Sadat, Y., Arabsheibani, R., Karimipour, F., and Nasseri, M.: A new approach to flood susceptibility assessment in data-scarce and ungauged regions based on GIS-based hybrid multi criteria decision-making method, J. Hydrol., 572, 17–31, https://doi.org/10.1016/j.jhydrol.2019.02.034, 2019.
Kazienko, P., Lughofer, E., and Trawinski, B.: Editorial on the special issue “Hybrid and ensemble techniques in soft computing: recent advances and emerging trends,” Soft Comput., 19, 3353–3355, https://doi.org/10.1007/s00500-015-1916-x, 2015.
Khadka, D., Babel, M. S., and Kamalamma, A. G.: Assessing the Impact of Climate and Land-Use Changes on the Hydrologic Cycle Using the SWAT Model in the Mun River Basin in Northeast Thailand, Water, 15, 3672, https://doi.org/10.3390/w15203672, 2023.
Khosravi, K., Shahabi, H., Pham, B. T., Adamowski, J., Shirzadi, A., Pradhan, B., Dou, J., Ly, H.-B., Gróf, G., Ho, H. L., Hong, H., Chapi, K., and Prakash, I.: A comparative assessment of flood susceptibility modeling using Multi-Criteria Decision-Making Analysis and Machine Learning Methods, J. Hydrol., 573, 311–323, https://doi.org/10.1016/j.jhydrol.2019.03.073, 2019.
Lang, M., Barriendos, M., Llasat, M. C., Francés, F., Ouarda, T., Thorndycraft, V., Enzel, Y., Bardossy, A., Coeur, D., and Bobée, B.: Use of Systematic, Palaeoflood and Historical Data for the Improvement of Flood Risk Estimation. Review of Scientific Methods, Nat. Hazards, 31, 623–643, https://doi.org/10.1023/B:NHAZ.0000024895.48463.eb, 2004.
Li, J., Cheng, K., Wang, S., Morstatter, F., Trevino, R. P., Tang, J., and Liu, H.: Feature Selection: A Data Perspective, ACM Comput. Surv., 50, 94:1–94:45, https://doi.org/10.1145/3136625, 2017.
Lin, L., Wu, Z., and Liang, Q.: Urban flood susceptibility analysis using a GIS-based multi-criteria analysis framework, Nat. Hazards, 97, 455–475, https://doi.org/10.1007/s11069-019-03615-2, 2019.
Liu, J. and Zhang, B.: Progress of Rainstorm Flood Risk Assessment, Geographical Science, 35, 346–351, https://doi.org/10.13249/j.cnki.sgs.2015.03.013, 2015.
Lu, H., Lu, X., Jiao, L., and Zhang, Y.: Evaluating urban agglomeration resilience to disaster in the Yangtze Delta city group in China, Sustain. Cities Soc., 76, 103464, https://doi.org/10.1016/j.scs.2021.103464, 2022.
Lundberg, S. M. and Lee, S.-I.: A unified approach to interpreting model predictions, in: Advances in Neural Information Processing Systems, Vol. 30, Proceedings of the 31st Conference on Neural Information Processing Systems (NIPS 2017), Long Beach, CA, USA, 4–9 December 2017, Curran Associates, Inc., Red Hook, NY, USA, 4765–4774, https://doi.org/10.48550/arXiv.1705.07874, 2017.
Ma, C., Chen, Z., Zhao, K., Xu, H., and Qi, W.: Improved urban flood risk assessment based on spontaneous-triggered risk assessment conceptual model considering road environment, J. Hydrol., 608, 127693, https://doi.org/10.1016/j.jhydrol.2022.127693, 2022.
Mahmoud, S. H. and Gan, T. Y.: Urbanization and climate change implications in flood risk management: Developing an efficient decision support system for flood susceptibility mapping, Sci. Total Environ., 636, 152–167, https://doi.org/10.1016/j.scitotenv.2018.04.282, 2018.
Mei, C., Liu, J., Wang, H., Shao, W., Yang, Z., Huang, Z., Li, Z., and Li, M.: Flood risk related to changing rainfall regimes in arterial traffic systems of the Yangtze River Delta, Anthropocene, 35, 100306, https://doi.org/10.1016/j.ancene.2021.100306, 2021.
Mia, M. U., Rahman, M., Elbeltagi, A., Abdullah-Al-Mahbub, M., Sharma, G., Islam, H. M. T., Pal, S. C., Costache, R., Islam, A. R. M. T., Islam, M. M., Chen, N., Alam, E., and Washakh, R. M. A.: Sustainable flood risk assessment using deep learning-based algorithms with a blockchain technology, Geocarto Int., 38, 1–29, https://doi.org/10.1080/10106049.2022.2112982, 2023.
Milanesi, L., Pilotti, M., and Ranzi, R.: A conceptual model of people's vulnerability to floods, Water Resour. Res., 51, 182–197, https://doi.org/10.1002/2014WR016172, 2015.
Mirzaei, S., Vafakhah, M., Pradhan, B., and Alavi, S. J.: Flood susceptibility assessment using extreme gradient boosting (EGB), Iran, Earth Sci. Inform., 14, 51–67, https://doi.org/10.1007/s12145-020-00530-0, 2021.
Mishra, K. and Sinha, R.: Flood risk assessment in the Kosi megafan using multi-criteria decision analysis: A hydro-geomorphic approach, Geomorphology, 350, 106861, https://doi.org/10.1016/j.geomorph.2019.106861, 2020.
Morales-Torres, A., Escuder-Bueno, I., Andrés-Doménech, I., and Perales-Momparler, S.: Decision Support Tool for energy-efficient, sustainable and integrated urban stormwater management, Environ. Model. Softw., 84, 518–528, https://doi.org/10.1016/j.envsoft.2016.07.019, 2016.
Munim, Z. H., Sørli, M. A., Kim, H., and Alon, I.: Predicting maritime accident risk using Automated Machine Learning, Reliab. Eng. Syst. Safe., 248, 110148, https://doi.org/10.1016/j.ress.2024.110148, 2024.
Nagarajah, T. and Poravi, G.: A review on automated machine learning (AutoML) systems, in: Proceedings of the 2019 IEEE 5th International Conference for Convergence in Technology (I2CT), Bombay, India, 29–31 March 2019, IEEE, Piscataway, NJ, USA, 1–6, https://doi.org/10.1109/I2CT45611.2019.9033810, 2019.
National Meteorological Information Center, China Meteorological Administration (CMA): Hourly precipitation data from 120 meteorological stations, [dataset], available at: https://data.cma.cn/, last access: 3 December 2021, 2021.
Nayak, P. C., Sudheer, K. P., Rangan, D. M., and Ramasastri, K. S.: A neuro-fuzzy computing technique for modeling hydrological time series, J. Hydrol., 291, 52–66, 2004.
Özdemir, H., Baduna Koçyiğit, M., and Akay, D.: Flood susceptibility mapping with ensemble machine learning: a case of Eastern Mediterranean basin, Türkiye, Stoch. Env. Res. Risk A, 37, 4273–4290, https://doi.org/10.1007/s00477-023-02507-z, 2023.
Pham, B. T., Luu, C., Dao, D. V., Phong, T. V., Nguyen, H. D., Le, H. V., von Meding, J., and Prakash, I.: Flood risk assessment using deep learning integrated with multi-criteria decision analysis, Knowl.-Based Syst., 219, 106899, https://doi.org/10.1016/j.knosys.2021.106899, 2021.
Raschka, S.: Model Evaluation, Model Selection, and Algorithm Selection in Machine Learning, arXiv [preprint], arXiv:1811.12808, https://doi.org/10.48550/arXiv.1811.12808, 2020.
Rashidi Shikhteymour, S., Borji, M., Bagheri-Gavkosh, M., Azimi, E., and Collins, T. W.: A novel approach for assessing flood risk with machine learning and multi-criteria decision-making methods, Appl. Geogr., 158, 103035, https://doi.org/10.1016/j.apgeog.2023.103035, 2023.
Resource and Environmental Science and Data Center (RESDC): Administrative boundaries and river network density, Chinese Academy of Sciences [data set], https://www.resdc.cn/DataList.aspx (last access: 13 May 2022), 2022.
Saaty, T. L.: The Analytic Hierarchy Process, McGraw-Hill, New York, 287 pp., ISBN 0070543712, 1980.
Saaty, T. L.: The Analytic Hierarchy Process: Decision Making in Complex Environments, in: Quantitative Assessment in Arms Control: Mathematical Modeling and Simulation in the Analysis of Arms Control Problems, edited by: Avenhaus, R. and Huber, R. K., Springer US, Boston, MA, https://doi.org/10.1007/978-1-4613-2805-6_12, 285–308, 1984.
Sarro, F., Moussa, R., Petrozziello, A., and Harman, M.: Learning From Mistakes: Machine Learning Enhanced Human Expert Effort Estimates, IEEE T. Software Eng., 48, 1868–1882, https://doi.org/10.1109/TSE.2020.3040793, 2022.
Scott, D., Hall, C. M., Rushton, B., and Gössling, S.: A review of the IPCC Sixth Assessment and implications for tourism development and sectoral climate action, J. Sustain. Tour., 32, 1725–1742, https://doi.org/10.1080/09669582.2023.2195597, 2023.
Seemuangngam, A. and Lin, H.-L.: The impact of urbanization on urban flood risk of Nakhon Ratchasima, Thailand, Appl. Geogr., 162, 103152, https://doi.org/10.1016/j.apgeog.2023.103152, 2024.
Shafizadeh-Moghadam, H., Valavi, R., Shahabi, H., Chapi, K., and Shirzadi, A.: Novel forecasting approaches using combination of machine learning and statistical models for flood susceptibility mapping, J. Environ. Manage., 217, 1–11, 2018.
Shuster, W. D., Bonta, J., Thurston, H., Warnemuende, E., and Smith, D. R.: Impacts of impervious surface on watershed hydrology: A review, Urban Water J., 2, 263–275, https://doi.org/10.1080/15730620500386529, 2005.
Sinha, R., Bapalu, G. V., Singh, L. K., and Rath, B.: Flood risk analysis in the Kosi river basin, north Bihar using multi-parametric approach of Analytical Hierarchy Process (AHP), J. Indian Soc. Remote, 36, 335–349, https://doi.org/10.1007/s12524-008-0034-y, 2008.
Sun, B., Fang, C., Liao, X., Guo, X., and Liu, Z.: The relationship between urbanization and air pollution affected by intercity factor mobility: A case of the Yangtze River Delta region, Environ. Impact Asses., 100, 107092, https://doi.org/10.1016/j.eiar.2023.107092, 2023.
Tang, Z., Wang, P., Li, Y., Sheng, Y., Wang, B., Popovych, N., and Hu, T.: Contributions of climate change and urbanization to urban flood hazard changes in China's 293 major cities since 1980, J. Environ. Manage., 353, 120113, https://doi.org/10.1016/j.jenvman.2024.120113, 2024.
Tellman, B., Sullivan, J. A., Kuhn, C., Kettner, A. J., Doyle, C. S., Brakenridge, G. R., Erickson, T. A., and Slayback, D. A.: Global Flood Database (GFDB) derived from MODIS imagery, Google Earth Engine Data Catalog, [dataset], available at: https://developers.google.com/earth-engine/datasets/catalog/GLOBAL_FLOOD_DB_MODIS_EVENTS_V1, last access: 25 January 2023.
U.S. Geological Survey (USGS): SRTM1 Digital Elevation Data, [dataset], available at: https://earthexplorer.usgs.gov/, last access: 19 January 2023, 2023.
Vincent, A. M., Parthasarathy K. S. S., and Jidesh, P.: Flood susceptibility mapping using AutoML and a deep learning framework with evolutionary algorithms for hyperparameter optimization, Appl. Soft Comput., 148, 110846, https://doi.org/10.1016/j.asoc.2023.110846, 2023.
Wagenaar, D., Curran, A., Balbi, M., Bhardwaj, A., Soden, R., Hartato, E., Mestav Sarica, G., Ruangpan, L., Molinario, G., and Lallemant, D.: Invited perspectives: How machine learning will change flood risk and impact assessment, Nat. Hazards Earth Syst. Sci., 20, 1149–1161, https://doi.org/10.5194/nhess-20-1149-2020, 2020.
Wan, H., Zhong, Z., Yang, X., and Li, X.: Impact of city belt in Yangtze River Delta in China on a precipitation process in summer: A case study, Atmos. Res., 125–126, 63–75, https://doi.org/10.1016/j.atmosres.2013.02.004, 2013.
Wang, M., Fu, X., Zhang, D., Chen, F., Liu, M., Zhou, S., Su, J., and Tan, S. K.: Assessing urban flooding risk in response to climate change and urbanization based on shared socio-economic pathways, Sci. Total Environ., 880, 163470, https://doi.org/10.1016/j.scitotenv.2023.163470, 2023a.
Wang, P., Deng, X., Zhou, H., and Qi, W.: Responses of urban ecosystem health to precipitation extreme: A case study in Beijing and Tianjin, J. Clean. Prod., 177, 124–133, https://doi.org/10.1016/j.jclepro.2017.12.125, 2018a.
Wang, P., Li, Y., Yu, P., and Zhang, Y.: The analysis of urban flood risk propagation based on the modified susceptible infected recovered model, J. Hydrol., 603, 127121, https://doi.org/10.1016/j.jhydrol.2021.127121, 2021.
Wang, T., Wang, H., Wang, Z., and Huang, J.: Dynamic risk assessment of urban flood disasters based on functional area division—A case study in Shenzhen, China, J. Environ. Manage., 345, 118787, https://doi.org/10.1016/j.jenvman.2023.118787, 2023b.
Wang, Y., Liu, G., Guo, E., and Yun, X.: Quantitative Agricultural Flood Risk Assessment Using Vulnerability Surface and Copula Functions, Water, 10, 1229, https://doi.org/10.3390/w10091229, 2018b.
Wang, Y., Li, C., Hu, Y., Lv, J., Liu, M., Xiong, Z., and Wang, Y.: Evaluation of urban flooding and potential exposure risk in central and southern Liaoning urban agglomeration, China, Ecol. Indic., 154, 110845, https://doi.org/10.1016/j.ecolind.2023.110845, 2023c.
Webb, G. I. and Zheng, Z.: Multistrategy ensemble learning: reducing error by combining ensemble learning techniques, IEEE T. Knowl. Data En., 16, 980–991, https://doi.org/10.1109/TKDE.2004.29, 2004.
Webster, R. and Oliver, M. A.: Geostatistics for Environmental Scientists, John Wiley & Sons, 333 pp., https://doi.org/10.1002/9780470517277, 2007.
Wolpert, D. H. and Macready, W. G.: No free lunch theorems for optimization, IEEE T. Evolut. Comput., 1, 67–82, https://doi.org/10.1109/4235.585893, 1997.
Xu, H., Hou, X., Pan, S., Bray, M., and Wang, C.: Socioeconomic impacts from coastal flooding in the 21st century China's coastal zone: A coupling analysis between coastal flood risk and socioeconomic development, Sci. Total Environ., 917, 170187, https://doi.org/10.1016/j.scitotenv.2024.170187, 2024.
Yan, M., Yang, J., Ni, X., Liu, K., Wang, Y., and Xu, F.: Urban waterlogging susceptibility assessment based on hybrid ensemble machine learning models: A case study in the metropolitan area in Beijing, China, J. Hydrol., 630, 130695, 2024.
Yang, J. and Huang, X.: The 30 m annual land cover datasets and its dynamics in China from 1985 to 2022, Earth Syst. Sci. Data, Zenodo, [dataset], https://doi.org/10.5281/zenodo.8176941, last access: 6 October 2023, 2023.
Yang, J., Zeng, X., Zhong, S., and Wu, S.: Effective Neural Network Ensemble Approach for Improving Generalization Performance, IEEE T. Neur. Net. Lear., 24, 878–887, https://doi.org/10.1109/TNNLS.2013.2246578, 2013.
Yang, W., Xu, K., Lian, J., Ma, C., and Bin, L.: Integrated flood vulnerability assessment approach based on TOPSIS and Shannon entropy methods, Ecol. Indic., 89, 269–280, https://doi.org/10.1016/j.ecolind.2018.02.015, 2018.
Yang, X., Li, H., Zhang, J., Niu, S., and Miao, M.: Urban economic resilience within the Yangtze River Delta urban agglomeration: Exploring spatially correlated network and spatial heterogeneity, Sustain. Cities Soc., 103, 105270, https://doi.org/10.1016/j.scs.2024.105270, 2024.
Yuan, X., Chen, C., Lei, X., Yuan, Y., and Muhammad Adnan, R.: Monthly runoff forecasting based on LSTM–ALO model, Stoch. Env. Res. Risk A, 32, 2199–2212, https://doi.org/10.1007/s00477-018-1560-y, 2018.
Zhang, H., Wu, C., Chen, W., and Huang, G.: Assessing the Impact of Climate Change on the Waterlogging Risk in Coastal Cities: A Case Study of Guangzhou, South China, 18, 1549–1562, https://doi.org/10.1175/JHM-D-16-0157.1, 2017.