the Creative Commons Attribution 4.0 License.
the Creative Commons Attribution 4.0 License.
Spatial identification of regions exposed to multi-hazards at the pan-European level
Tiberiu-Eugen Antofie
Stefano Luoni
Aloïs Tilloy
Andrea Sibilia
Sandro Salari
Gustav Eklund
Davide Rodomonti
Christos Bountzouklis
Christina Corbane
The European Commission Disaster Risk Management Knowledge Centre (DRMKC) has developed and hosts a web platform, the Risk Data Hub (RDH), designed to facilitate access to and sharing of curated, EU-wide risk data, tools, and methodologies, ultimately supporting disaster risk management (DRM) initiatives. Based on the RDH data, we propose a methodology for the identification of regions with multi-hazard exposure at the pan-European level (EU27+UK). This methodology aims to support disaster risk management (DRM) decision-making processes at both national and subnational levels in the EU. By employing a meta-analysis approach and aggregating the hotspots of exposure to single hazards, we provide an objective, statistically robust assessment of the European multi-hazard landscape at the finest spatial subdivision level, local administrative units (LAUs). Our results suggest that 21.4 % of European LAUs are exposed to multiple natural hazards, affecting around 87 million people (18.8 % of the European population). Furthermore, nearly half this population is exposed to more than three hazards. We find that beyond population density, the income level (i.e. high, medium, low) is the primary driver that influences risk status at the local level, within both rural and urban areas. On average, we find higher multi-hazard exposure for people living in high-income urban areas or low-income rural areas. We further validate our results by comparing them with empirical data on fatalities and disaster events, revealing a relatively high correlation between statistically significant multi-hazard hotspots and fatalities (r=0.59). By providing a detailed assessment of multi-hazard exposure at the pan-European scale, this study contributes to a better integration of multi-hazard risks in European disaster risk management plans.
- Article
(8538 KB) - Full-text XML
-
Supplement
(3398 KB) - BibTeX
- EndNote
Since the beginning of the 21st century, several international frameworks, such as the Hyogo Framework for Action (UN-ISDR, 2005) and the Sendai Framework for Disaster Risk Reduction 2015–2030, have endorsed the multi-hazard approach for disaster risk reduction. Additionally, a “needs and gaps” analysis conducted as part of the preparation of the European Commission Staff Working Document “Overview of natural and man-made disaster risks the European Union may face” identified a significant knowledge and data gap in multi-hazard assessments (EUR-Lex, 2014; European Commission, 2017, 2020).
It is now well recognized in the research community that for an adequate understanding of disaster risk potential within a region, it is essential to move from a single-hazard to a multi-hazard approach (Marzocchi et al., 2009; Kappes et al., 2012a; Gill and Malamud, 2014; Tilloy et al., 2019; Ward et al., 2022). Multi-hazard interrelations can lead to a combined impact that is different from the sum of each hazards' impacts taken separately. To assess the potential hazards and risks to which a region is exposed, some studies have employed an approach that combines independent analysis of individual hazards (Granger et al., 1999; van Westen et al., 2002; Greiving et al., 2006; Grünthal et al., 2006; Marzocchi et al., 2012; Forzieri et al., 2016). This approach, often referred to as “multi-layer hazards”, superposes natural hazards over a region. Conversely, other studies explicitly considered hazard interrelations (Tarvainen et al., 2006; Han et al., 2007; De Pippo et al., 2008; Kappes et al., 2010, 2012b; van Westen et al., 2014; Liu et al., 2016; Sadegh et al., 2018; Gill et al., 2020; Claassen et al., 2023; Lee et al., 2024). However, these assessments are often based on case studies within limited spatial extension, addressing a limited number of perils or hazards and a limited number of sectors (Ciurean et al., 2018; Tilloy et al., 2019).
In this context, our study aligns with the first definition of multi-layer hazards, as we examine the combined exposure levels of several natural hazards over a region, recognizing that hazard interrelations can result in an impact distinct from the sum of individual hazard impacts. This is exemplified by events such as the Portugal wildfires and flash floods of October 2017, where both hazards occurred in relatively close succession (Figueiredo et al., 2021), both affecting the same buildings and infrastructure. Similarly, the floods and subsequent dam failure in the Czech Republic during the summer of 2002 had a devastating impact, causing significant damage to buildings, infrastructure, and agricultural land and exacerbating the destruction by affecting structures already weakened by the floods (Daňhelka, 2004).
Research on multi-hazard analysis has underscored several critical gaps that request attention for more effective multi-hazard assessments. These gaps include the following:
-
data quality (e.g. incomplete, outdated) that hampers accurate multi-hazard assessments (Cutter et al., 2014; Gentile et al., 2022),
-
the complexity of hazard interrelations (Gill and Malamud, 2016; Lee et al., 2024),
-
temporal dynamics (Fuchs and Thaler, 2018; De Angelis et al., 2022),
-
the varying vulnerabilities across hazards (Saaty, 1987; UNISDR, 2004).
Additionally, there has been limited attention given to uncertainty and sensitivity analyses in multi-hazard assessments (Haasnoot et al., 2013; Camus et al., 2021). Most multi-hazard assessments tend to overlook the implications of climate change (IPCC, 2012; Gallina et al., 2016; Ghanbari et al., 2021). The effective communication of multi-hazard risks to stakeholders also remains a challenge (Dallo et al., 2020; De Fino et al., 2023).
The Risk Data Hub (RDH) platform of the Disaster Risk Management Knowledge Centre (DRMKC) aims to address these multiple challenges. The platform serves as a central hub for accessing and sharing curated, European-wide risk data and methodologies, providing essential support for disaster risk management (DRM) and climate change adaptation (CCA) actions at both the national and the subnational level (European Civil Protection Knowledge Network, 2021; European Commission, 2021). Within the RDH development, we propose a methodology that is accessible, scalable, and replicable even at the subnational and local level for the identification of regions exposed to multi-hazards.
The multi-hazard methodological approach is the main goal of this study, focused on addressing four major challenges:
-
identification of regions with significant multi-hazard potential,
-
identification of exposure relationships between assets and multiple hazards,
-
quantification of multi-hazard exposure,
-
transferability of the method.
These challenges are further constrained by the wide scale of our analysis (European coverage); the alignment to a common hazard definition; and practical implementation on the online web platform, the RDH.
This study addresses Challenge 1 by introducing a novel methodology that identifies, at a pan-European scale, regions (local administrative units, LAUs) exhibiting statistically significant exposure to multi-hazards (p value<0.10). Our approach employs a meta-analysis technique, which serves as a robust significance test (Hak et al., 2016), allowing us to integrate and synthesize disparate findings. By combining the hotspots of exposure to individual hazards, we generate a unified result that effectively resolves the challenge posed by divergent and potentially contradictory independent findings. Notably, this study represents the first application of spatial pattern analysis (clusters/hotspots) in conjunction with meta-analysis to assess multi-hazard exposure.
Moreover, regarding Challenge 2, the proposed methodology enables the identification of regions exposed to multi-hazards, considering the distinct typology of assets and their varying vulnerabilities. This directly reveals relationships between asset types and threats, offering valuable insights for the identification of the DRM pathways in multi-hazard assessment (Ward et al., 2022). This is a key aspect of the multi-hazard analysis presented in this study, namely the examination of the relationships between specific assets (population and residential built-up areas, respectively) and a range of natural hazards, including landslides, coastal flooding, river flooding, earthquakes, wildfires, and subsidence.
We tackle Challenge 3 by summing the assets found only for the regions exposed to multi-hazards with a high level of significance. This approach does not enable the examination of hazard interrelations when quantifying the impacts from multi-hazards. Nevertheless, our methodology offers a spatially explicit understanding of the specific assets exposed to multiple hazards, enabling the identification of which hazard is most likely to contribute to potential impacts.
Ultimately, our study addresses Challenge 4 by demonstrating that the developed methodology is transferable across different contexts, thereby overcoming the limitations of previous studies that relied on case-study-specific data and methods. Notably, the methodological approach presented in this study has already been implemented on the Risk Data Hub platform, leveraging existing pan-European data that are hosted and shared through the platform.
We structure the study as follows: after the Introduction, we describe the data and the methodologies used (Sect. 2). In the Results section (Sect. 3), based on our identified regions, we provide a statistical analysis looking at different socioeconomic features. Then a validation exercise is performed (Sect. 4), which is followed by the Discussions (Sect. 5) and Conclusions (Sect. 6).
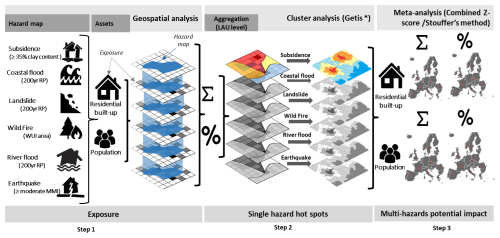
We present the methodological approach in three steps: first, we describe the underlying exposure data and methodology that create the basis for our single- and multiple-hazard analysis (1). We then present the methodological approach used to identify hotspots for single hazards' exposure (2). Finally, we present the meta-analysis methodology used to combine the hotspots of single hazards' exposure and to identify regions with significant multi-hazard potential (3). Figure 1 depicts a representation of the entire methodological chain.
2.1 The exposure data and methodology
2.1.1 The areal dimension
The multi-hazard spatial coincidence is assessed at the level of the areal dimension, represented by local administrative units (LAUs). LAUs are the finest hierarchical subdivision of the European economic territory for which statistics are available. LAUs are provided by the statistical office of the European Union (Eurostat) and represent the administrative units of municipalities and communes of Europe. In the present study, we use the 2013 version of LAUs covering the EU27+UK and the European Free Trade Association (EFTA) countries. LAUs are used as statistical areas for multi-hazard exposure and hotspot analysis. Administrative directives, organizations, and operational services are coordinated at the level of administrative entities, and they become of high relevance when linked down to the local level, challenging the gap in the scale of policy and scale of practice (Gaillard and Mercer, 2013).
Here we consider 122 034 LAUs on which we perform the aggregations and statistical analysis. Their average area is 39.6 km2, the maximum area is 20 688 km2 (Kiruna, Sweden), and the minimum area is 0.2 km2 (Thorpe Hamlet, UK). LAUs present heterogeneities across Europe in terms of area covered, especially in northern part of Europe (e.g. Scandinavia) but remain rather homogeneously distributed within the national boundaries (Fig. 2).
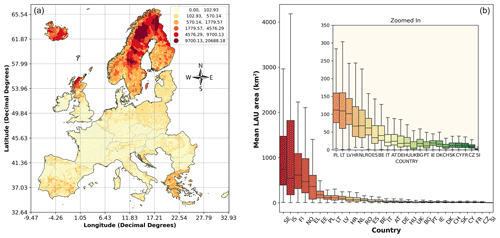
Figure 2Local administrative unit areas (km2): spatial distribution (a) and mean LAU area per country (b). The abbreviations for countries shown in the figures follow the ISO 3166-1 alpha-2 standard (ISO, 2020).
Despite being a well-established geographic concept, the process of aggregating higher-resolution data to larger administrative units comes with a potential source of error known as the modifiable areal unit problem (MAUP). Two issues related to the MAUP presented in the literature (Fotheringham and Wong, 1991; Jelinski and Wu, 1996; Openshaw, 1984) are scaling and zonation effects (Charlton and Kemp, 2008). These generally alter the variance structure of the data when aggregated due to disconnection across scales and to different ways of subdividing the geographical space at the same scale (Stillwell et al., 2014). In order to minimize the MAUP effect, recommended practices focus on using smaller areal unit (e.g. LAUs rather than provinces or countries) for data aggregation (Kwan, 2012). This reduces the potential errors in spatial pattern distortion without entirely removing them.
2.1.2 Input hazard and exposure data
The exposure data are built on the relationship between hazard (i) and assets (ii): exposure or assets at risk = f(assets, hazard). We overlay spatial information about residential built-up areas and population with data describing hazard areas in order to define the assets exposed to single hazards. We then aggregate the exposure at the level of LAUs. We identify statistically significant hotspots of asset exposure to single hazards through the application of two distinct exposure aggregation methods:
-
based on absolute values, the sum of the exposed asset;
-
based on relative values, as ratios or share of the exposure from the total assets in LAUs.
For the exposure to earthquakes, due to the continuous spatial extent of the hazard area, we depict the relative aggregation schema using the density (or share of the exposure compared to the total area of the LAUs). The relative aggregation schema intends to address risk management strategies based on cost-efficient measures, while the absolute schema supports risk management strategies that prioritize the most affected areas and people.
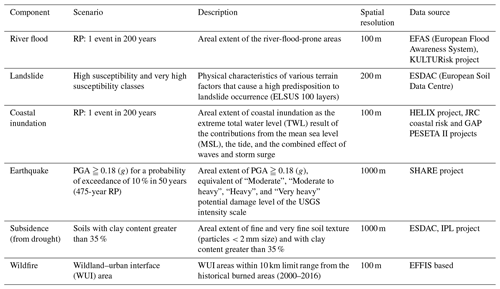
(i) Hazard layers. The hazard layers considered in this study represent areal extension rather than intensity. We use not a probabilistic assessment but rather a deterministic approach, selecting hazards with average temporal (frequency of occurrence) and spatial probability (susceptibility). The hazard datasets used here and their characteristics are presented in Table 1. The motivations for their selection along with their usage in disaster risk assessments are detailed in the sections dedicated to individual hazards in the Supplement (Sect. S1 – “Hazard layers and their definitions”).
Table 1Description of the hazard scenarios and datasets considered and their characteristics. RP denotes return period; PGA denotes peak ground acceleration.
(ii) Asset layers. As asset layers, we use the residential built-up areas from the European Settlement Map (ESM) (Florczyk et al., 2019) and residential population from the Global Human Settlement Layer (GHSL) (Freire et al., 2015). These are two main groups of assets that are currently present across all types of analysis within the DRMKC Risk Data Hub. The residential built-up category is represented as built-up area (km2), while the population is expressed as the number of people within a 100 m×100 m grid cell.
To discriminate between the residential typology for both built-up areas and population, the CORINE Land Cover (EEA, 2018) code 1.111 (continuous urban fabric) and 2.112 (discontinuous urban fabric) is used as the artificial explanatory layer.
2.2 Single-hazard hotspot analysis
The study uses a hotspot analysis to identify clusters (concentrations) of regions – LAUs – with assets (or elements at risk) exposed to single hazards. The chosen approach facilitates the identification of spatial patterns and trends that are not readily apparent in raw data, thereby revealing underlying spatial processes that are driven by non-random mechanisms (Getis and Ord, 1992). We argue that these spatial patterns (hotspots), once combined across multiple hazards, will describe the statistically significant multi-hazard exposure across regions.
Various methods for combining single-hazard datasets have been explored in the literature, including classifications and index developments. For more information on this topic, the reader can refer to Kappes et al. (2012c).
For this study, the statistic is used for local spatial autocorrelation analysis using the Python-based Exploratory Spatial Data Analysis (PySAL-esda) package (Rey and Anselin, 2007). The method describes the spatial autocorrelation as the Z score (standard deviations), p value (probability), and confidence level (significance) for each feature (each LAU region). Very high (positive) or very low (negative) Z scores, associated with very small p values (e.g. values of p<0.1), describe spatial clusters as hotspots and cold spots, respectively, with a high significance level. We consider that for a p value<0.10, the observed spatial cluster is highly unlikely to be the result of a random statistical process, thereby suggesting statistically significant clustering. In the field of disaster risk reduction and management, identifying both cold spots and hotspots is crucial for allocating resources efficiently. Here, hotspots refer to areas or regions with higher susceptibility to multi-hazard risks, while the cold spots can be considered less prone to multi-hazard risks.
Conceptualization of spatial relationship
A known characteristic is that the statistics we are interested in (high Z scores, low p values) are placed in the tails of the distribution and therefore are susceptible to noise and spatial outliers. Moreover, the skewness of a distribution can bias the statistics (Cousineau and Chartier, 2010). These aspects are important to consider because the resulting distribution areas of the single-hazard clusters need to be homogeneous in order to be correctly combined in a multi-hazard spatial cluster through meta-analysis (Hak et al., 2016). Therefore, to ensure reliable results, we address noise and outliers through a spatial weight matrix. This matrix defines neighbouring regions defined with the k-nearest neighbours (KNN) (Fix and Hodges, 1951; Cover and Hart, 1967) algorithm. The KNN algorithm is based on the proximity (k) information in order to represent the spatial relationship between regions (LAUs). We opted for the KNN weight method over contiguity-based weights as it avoids the “island” problem, where isolated polygons lack shared boundaries with other polygons, and ensures that every region has at least one neighbouring entity. For more information on the factors affecting the clustering performances and the merits of weighted matrices, the reader can refer to Zhao and Jingchao (2016). We also consider the optimization of spatial autocorrelation and clustering across exposure to single hazards by selecting the optimal neighbourhood size (k) in the k-nearest neighbours (KNN) algorithm (see Sect. S2).
2.3 Meta-analysis: identifying regions with potential exposure to multi-hazards
We adopt a meta-analysis approach to identify regions with multi-hazard potential. This involves combining probabilities (Z scores and p values) from independent hotspots. From the hotspot analysis of different hazards exposure, the same region can show statistically significant positive clustering (hotspot), statistically significant negative clustering (cold spot), or statistically non-significant clustering. By the combined outcome of these individual tests that can differ and contradict each other, we measure the multi-hazard potential at the regional level. The meta-analysis serves as a viable solution for addressing the challenge of seemingly conflicting evidence in research (Hak et al., 2016; Borenstein et al., 2009). Notably, it serves as a potent tool for conducting robust significance tests (Hak et al., 2016). Consequently, meta-analysis also proves instrumental in resolving the issue of “insignificant results”. In the context of our study, meta-analysis serves as a mechanism for synthesizing findings from various clustering analyses. Furthermore, by elucidating the statistical significance of the common estimation, it furnishes an objective “statistical proof” of the potential for multi-hazard clustering in our particular case.
Many p-value or Z-score combining methods are used in meta-analysis to aggregate summary statistics. The most used methods are the following:
- i.
Fisher's method (Fisher, 1932), based on p values to test the significance of the aggregations;
- ii.
Lancaster's method (Lancaster, 1961), which is a generalization of Fisher's test by assigning different weights;
- iii.
Stouffer's method (Stouffer et al., 1949), based on the Z-transform test;
- iv.
Lipták's method (Lipták, 1958), which is Stouffer's method with weights, known as the weighted Z test;
- v.
the binomial test (Wilkinson, 1951), which counts the number of p values that are below a threshold α;
- vi.
the truncated p-value method (Zaykin et al., 2002), which adds up p values that fall below a threshold α.
For a good overview and comparison of these methods, please refer to Whitlock (2005), Zaykin (2011), and Chen (2011). Meta-analyses are in widespread use due to their applicability, primarily in psychology, biology, and medicine (McFarland et al., 2015). Within the field of disaster risk management, meta-analysis has mainly been used to assess the macroeconomy of disasters (Peter and van Bergeijk, 2015).
We chose to use the Stouffer's method (Z-transform test), without weighting, applied to the two-tailed distribution of the single clusters as in Eq. (1):
The sum of Z scores (Zi) divided by the square root of the number of tests, k, provides a test of the cumulative evidence on the common null hypothesis (Whitlock, 2005).
Generally, the Z-transform test converts the one-tailed p values from each of k independent tests into standard normal deviates Zi. A common approach in meta-analysis is to sum the Z scores across studies, weighting them appropriately using the sample sizes. For details of the two-tailed method, please see Whitlock (2005) and Yoon et al. (2021), and for the advantages and disadvantages of using the unweighted version of this method, please see Becker (1994). The Z-transform test was performed in Python using the “scipy.stats” package (SciPy, 2024).
We identify the regions (LAUs) in Europe exposed to multi-hazards by combining the Z scores and p values across the hotspots of single-hazard exposure (i.e. population and built-up) computed on absolute and relative aggregations. In Fig. 3, we map these regions, and we further consider, for a statistical overview, the regions with more than one hazard exposure (Hz>1) and confidence level set at 90 % (p value<0.10 and positive Z score>0). In the Supplement (Fig. S25), we also present a map displaying all identified hazard types at the LAU level as determined by our analysis of relative population exposure. Notably, analyses of other asset types are expected to reveal different spatial distributions of hazard types.
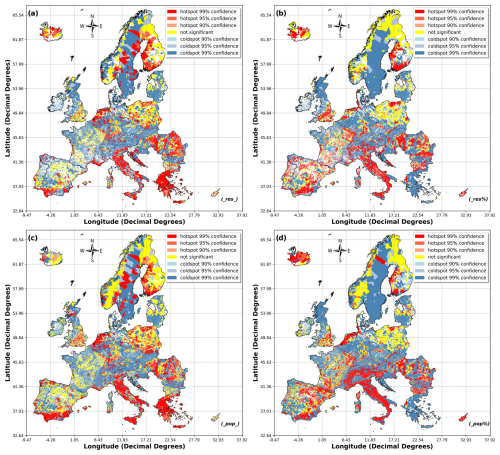
Figure 3Regions (LAUs) exposed to multi-hazards identified by the meta-data analysis performed on (a) absolute residential built-up exposure, (b) relative (%) residential built-up exposure, (c) absolute population exposure, and (d) relative (%) population exposure.
The identification of these regions yielded disparate outcomes contingent upon the specific exposure types scrutinized within our analysis, namely, population density or residential built-up areas. Moreover, the choice of aggregation method, whether relative or absolute, introduces variations in both the quantity and the spatial arrangement of regions identified as susceptible to multi-hazard events. The difference in multi-hazard exposure when considering absolute versus relative aggregation is influenced by the sensitivity of the clustering algorithm to distance (computed by the k parameter) and similarity measures. Absolute aggregation accentuates variance and is sensitive to outliers, while relative aggregation smooths dominance of extreme values, potentially overlooking high-exposure areas within densely populated regions. Additionally, a higher number of regions at the European level were identified as susceptible to multi-hazard risks when considering population-based criteria as opposed to residential built-up exposure (see Fig. 4). Furthermore, there is a significant difference between the number of regions being exposed to multi-hazards identified with absolute aggregation (12 % for population and 10.6 % for residential built-up) compared with the relative aggregation (21 % for population and 13.6 % for residential built-up). In order to simplify the interpretation of the results and clearly present the potential of the methodology used, we further focus only on the regions exposed to multi-hazards identified by the relative (%) population.
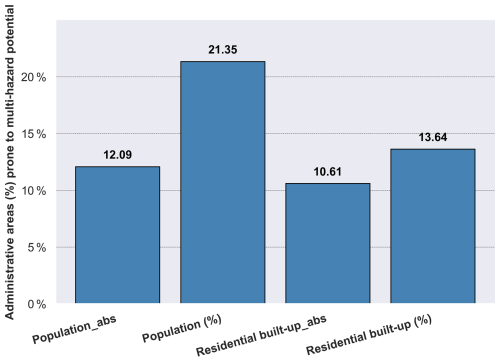
Figure 4Local administrative units (as percentages of the total in Europe) identified as being prone to multi-hazards based on different indicators (population and residential built-up) and aggregation types (relative and absolute).
Regions (LAUs) with significant multi-hazard potential
Based on population exposure, we find 26 058 LAUs prone to multi-hazards in Europe with high significance level (Fig. 5). Most of these regions (20 912) are described statistically as hotspots with the highest confidence, 99 %, while all of the considered hazards are present in only six regions in Europe (five in Italy and one in Croatia) (Fig. 5c). These are mountainous and coastal regions. Regions prone to multiple hazards represent 21.4 % of the local administrative units of Europe and around 87 million people (18.8 % of the European population) (Fig. 5c and d). In Fig. 5d, we show that almost half of the population is exposed to more than three hazards. Most of these regions are found in France (6956), Italy (4627), Slovenia (3802), Bulgaria (1876), Spain (1779), and Germany and Romania (around 1000 each). Approximately a quarter of the population exposed to multi-hazards resides in Italy, with 21.4 million individuals affected. When combined with the Netherlands (10.1 million), France (9.5 million), and Spain and Germany (7.1 million each), these countries account for more than 55 % of the population exposed to multi-hazards, as shown in Fig. 5b and d.
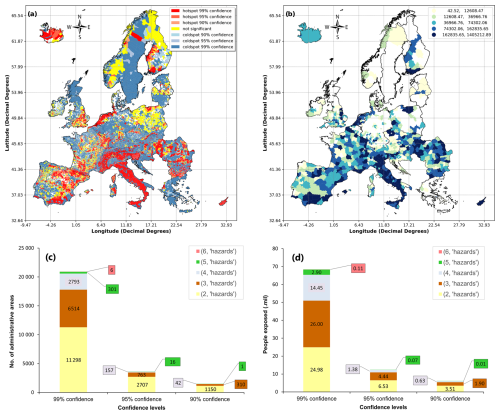
Figure 5Regions (LAUs) with population exposed to multi-hazards by significance level (a); sum of population exposed to multi-hazards assessed at the NUTS3 level (only hotspot regions with >90 % confidence interval) (b); number of administrative areas exposed to multi-hazards by confidence interval and number of hazards (c); population exposed to multi-hazards by confidence interval and number of hazards (d).
We present a statistical overview of these regions identified as being exposed to multi-hazards, looking at their spatial distribution and their population exposed considering the following (see Sect. 3.1):
- i.
various levels of economic development (high-income, high-middle-income, low-middle-income, and low-income regions – LAUs);
- ii.
urbanization levels, rural or urban (according to 2018 Urban Audit (URAU) definitions across European LAUs);
- iii.
metropolitan areas1 exposed to multi-hazards;
- iv.
city centres (city cores – C) compared to functional urban area (FUA) levels in a metropolitan area.
(i) Economic development. In Fig. 6, we present the results per income group and degree of urbanization at the European level (Fig. 6a and c) and by countries (Fig. 6b and d). From Fig. 6a, it can be seen that about 36 % (9496) of the LAUs with population exposed to multi-hazards are low-income regions and, together with the regions of low middle income, they add up to 67 % of the LAUs of this category. High-income regions represent 10 % of the LAUs, and regions of high middle income represent 23 %. The groups of high-income and high-middle-income administrative regions total around 50 % (43.4 million) of the population exposed to multi-hazards (Fig. 6c).
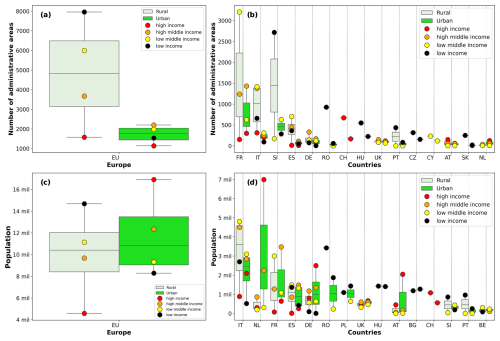
Figure 6Number of administrative areas (LAUs) with population exposed to multi-hazards by income level and urbanization level (a – Europe-wide, b – the 15 highest-ranked countries) (upper part); population exposed to multi-hazards by income level and urbanization level (c – Europe-wide, d – the 15 highest-ranked countries) (lower part).
Figure 6b displays the top countries with LAUs exposed to multi-hazards, categorized by income group and degree of urbanization. Based on income groups, most of the high-income administrative regions exposed to multi-hazards are in Switzerland (30.9 %); Italy (19.1 %) France; (16.7 %) and Austria, Germany, and the Netherlands (each >5 %), while the low-income administrative regions are mostly found in southern and eastern Europe in Slovenia (31.6 %), Bulgaria (19.8 %), Romania (10.4 %), Hungary (8.9 %), and Italy and Portugal (each >5 %).
In Fig. 6d, most of the low-income population exposed to multi-hazards is concentrated in Romania (23 %), Italy, Hungary, Poland, and Bulgaria (each >10 %), while the high-income population exposed to multi-hazards is found in the Netherlands (33 %), Germany, Italy, and Austria (each >10 %).
(ii) Urbanization levels. Moreover, from Fig. 6a, we observe that the number of urban LAUs (based on 2018 URAU definitions and on correspondence to LAUs) is much smaller than the number of rural ones (26.3 % or 6585 and 73.7 % or 19 200, respectively). Nevertheless, the urban population exposed to multi-hazards totals 54 % (46.8 million) compared with the rural administrative areas at 46 % (40.1 million) (Fig. 6c).
Based on the urbanization degree, 15 countries in Europe have a higher share of population exposed to multi-hazards in rural areas compared to urban areas: Sweden and Norway (100 %); Croatia, Cyprus, Portugal, and Slovakia (between 70 %–90 %); and Hungary, Spain, Belgium, Slovenia, Romania, and Switzerland (between 50 %–70 %). In the remaining countries like the Netherlands and Austria (<20 %); Poland, Germany, and Greece (20 %–40 %); and Ireland, the United Kingdom, France, Denmark, the Czech Republic, and Bulgaria (40 %–50 %), the share of population exposed to multi-hazards in rural areas is lower compared to urban areas.
This suggests that individuals living in regions with higher GDP and greater population density (characterized by high-income and high-middle-income levels and urban areas, which comprise approximately 12 % of European administrative regions) are more exposed to multi-hazards compared to those residing in regions with lower GDP and lower population density (typically low-income and low-middle-income areas and rural regions) (54 % of LAUs). By considering the degree of urbanization only, people are more exposed to multi-hazards if they live in either high-income urban areas (compared with low-income urban areas) or low-income rural areas (compared with high-income rural areas) (Fig. 6c).
As can be seen in Fig. 7, exploring the differences between various income classes, we find that as countries and their regions get richer, they are more exposed to multi-hazard risk. After reaching a higher level of income (in the middle-income category), the population exposed to multi-hazards decreases towards the high-income category. This can suggest that low-income countries have a major part of the population exposed in the rural areas compared to the high-income countries, where most of the population exposed is in densely populated urban areas and only a quarter of the population exposed (25 %) lives in the rural area. The peak in the countries with regions in the middle-income category could suggest a balance between the high number of urban areas (the largest across various income classes) and the rural areas with high densities of population.
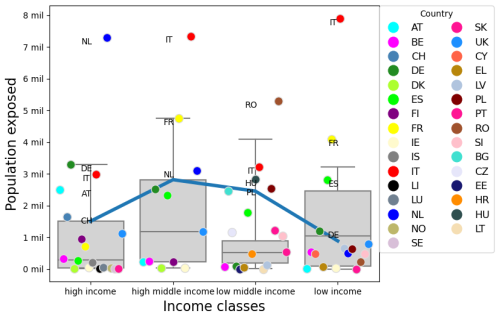
Figure 7Population exposed per income level. The markers represent countries' population exposed to multi-hazards split by income level. The blue line links the 75th quantile of the income classes.
(iii) Metropolitan areas. Using the Urban Audit 2018 definition and based on correspondence to LAUs, we establish that 46 % of the urban/metropolitan areas in Europe (442 of a total of 952) have populations exposed to multi-hazards. These urban areas, totalling 46.8 million people, are mostly in the high-income and high-middle-income categories (62.4 %). The high-income urban areas are mostly found in the Netherlands (28), UK (23), Germany (20), France (9), and Italy (9), while the low-income areas (110 at the European level) are found in Romania (17), Bulgaria (16), Poland (15), Hungary (13), the Czech Republic (11), and others (in Fig. S23 and Table S6).
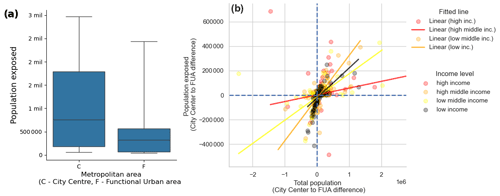
Figure 8Population exposed to multi-hazards at the level of metropolitan areas. (a) European countries' population exposed within metropolitan categories: city centres (C) and functional urban areas (F). The lower and upper whiskers represent the lowest 5 % and the highest 95 %, respectively, of the calculated population exposed to multi-hazards for each metropolitan category. (b) The linear relation between the population exposed and total population assessed as the difference between FUAs and the city centres. A flatter fitted line indicates a weaker or less pronounced relationship between the population exposed and the total population. In this case, changes in the total population have a relatively small impact on the population exposed. This suggests that the income category of the region may not strongly influence the risk factors within the population. A less flat fitted line, on the other hand, indicates a stronger relationship between the population exposed and the total population, with changes in the total population having a more significant impact on the population exposed.
(iv) City centres vs. functional urban areas. In Fig. 8a and b, we further explore the distribution of population exposed to multi-hazards within the urban areas comparing the following categories: cities (or city cores/centres – C) and larger urbanized zones (commuting zones/functional urban areas – F in Fig. 8a, FUAs throughout the paper). We show that from this local perspective, the population exposed to multi-hazards is controlled either by urban population density or by expansion of urban land. Indeed, 58 % (257 out of 442) of commuting zones (FUAs) are more exposed to multi-hazards compared to city centres. However, 57 % of the population exposed in the metropolitan areas in Europe lives in city centres. This would suggest that a higher population density in the city centres leads to a greater exposure of the metropolitan area. This positive relationship is depicted in Fig. 8b but is particularly weak in the case of high-income metropolitan areas, as shown by the almost flat fitting (red) line, and is stronger for the high-middle-income and low-income areas. This shows an increased risk for richer metropolitan areas due to the expansion of urban areas (into the functional urban areas) and, additionally, going towards less rich metropolitan areas due to population density increase. This is confirmed, with some exceptions (the Netherlands, Austria, Iceland), by the high-income Nordic and western-country metropolitan areas, where a higher proportion of population exposed to multi-hazards is found in the functional urban areas compared with the city centres: Denmark and Luxembourg (100 %); Finland, Belgium, and Switzerland (between 60 %–80 %); and Ireland, Italy, Germany, and the UK (between 50 %–60 %). Conversely, in France, Spain, and Portugal, most of the population exposed (between 50 %–60 %) is concentrated in city centres of middle-income metropolitan areas which are also the most populated. For the eastern European lower-income countries, the population exposed to multi-hazards is greater in the city centres compared with the functional urban areas: Latvia, Romania, and Poland (>70 %) and Bulgaria, Slovenia, Slovakia, Hungary, and the Czech Republic (between 60 %–70 %) (Fig. S24). However, we recognize that the intended comparison could be better explained through complex urban processes such as changing patterns of residential-choice behaviour due to socioeconomic growth that we do not address in this work.

Figure 9Identified hotspot/cold-spot regions (NUTS3) with (a) population exposed to multi-hazards, (b) fatalities from multi-hazards, and (c) number of events with fatalities, used in Spearman correlation analysis for the purpose of validation.
The present validation is based on Spearman correlation analysis of the population exposed to multi-hazards with two empirical datasets as independent variables: the recorded DRMKC RDH data on fatalities from past events and the count of events with fatalities (for the period 1980–2019), for coastal floods, earthquakes, river floods, landslides, subsidence, and wildfires. The input data, both the population exposed to multi-hazards and the empirical data, are brought to a common geographical scale (NUTS3) and metrics (Z scores and p values of clusters). We use the methodological approach described in Sect. 2 to generate single-hazard hotspots (clusters). The single-hazard hotspots of empirical data (fatalities and event count) and population exposed to multi-hazards are combined through meta-analysis in order to obtain multi-hazard hotspots of fatalities, event counts, and hotspots of population exposed at the NUTS3 level (Fig. 9). Finally, hotspot/cold-spot regions of the two independent variables (fatalities and event count) are compared to the population exposed to multi-hazards.
Using a correlation coefficient analysis, we aimed to capture the strength of the relationship between the two paired datasets numerically. We employed a non-parametric test, the Spearman rank correlation test, due to its absence of distributional assumptions and its ability to capture monotonic relationships through rank-based computation. This approach was selected as a neutral method for assessing the general central tendency, specifically the median, among pairs of variables at the NUTS3 level. The Spearman shows the degree to which two variables tend to change in the same direction. Therefore, variables with high correlation increase and decrease simultaneously, while variables with low absolute correlation rarely increase and decrease together.
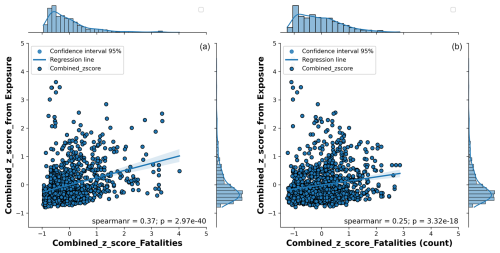
The results presented in Fig. 10 refer to the Spearman correlation coefficients between population exposed and the number of fatalities (a) and count of events (b) from the empirical data. We find a rather inconclusive relationship between the multi-hazard risk data and the empirical data if we consider all regions for all significance levels. The scatterplots suggest a positive correlation between the variables, but their increasing monotonic relationship is weak (r=0.37 with fatalities and r=0.25 with the event count).
Table 2Spearman correlation coefficient between the empirical data (fatalities and count of past events) and the population exposed to multi-hazards for regions (NUTS3) with different significance levels.

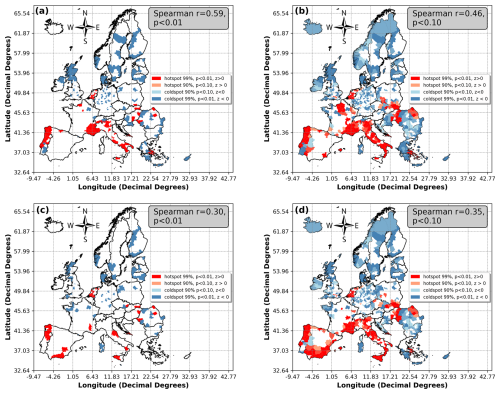
Figure 11Regions (NUTS3) exposed to multi-hazards identified with high significance, p<0.01 (a, c) and p<0.10 (b, d), as hotspots/cold spots and their correlation coefficient (Spearman r) with independent variables: (a, b) empirical data – fatalities – and (c, d) empirical data – count of events.
However, if we consider only the regions with higher significance (p<0.01, p<0.05, p<0.10), we notice a stronger correlation (Table 2 and Fig. 11). This means that going towards more significant clustering (hotspots/cold spots), the independent variables used for the validation tend to better follow the changes in value of the population exposed to multi-hazards.
Therefore, the more significant the multi-hazard clustering, the stronger the relationship with the independent variables. The monotonic relationship is strong (r=0.59) with fatalities as the independent variable for the regions with the highest significance (p<0.01), while the for the event count, the strongest correlation (r=0.40) is reached for the regions with the significance p<0.05. This makes the recorded data on fatalities a better explanatory variable for the clustered population exposed to multi-hazards.
The identification of exposure or risk on the DRMKC RDH platform is generally performed by relating an asset to a specific hazard. There is also the possibility of relating an asset to multiple hazards and having a multi-hazard assessment (of exposure or risk) on the single asset. This latter situation is the central aspect of the analysis presented in this study that considers the relation of a single asset (e.g. population or the residential built-up) to multiple hazards: landslides, coastal flooding, river flooding, earthquakes, wildfires, and subsidence. Starting from this initial setting of the analysis, specific characteristics and limitations need to be presented.
First, we show that the proposed methodology allows for the detection of the regions exposed to multi-hazards, differently, as a function of the typology of the assets. This is important as it directly reveals specific asset–threat relationships, valuable for the identification of the disaster risk management pathways in multi-hazard assessment (Ward et al., 2022).
Furthermore, our approach identifies LAUs prone to multi-hazards with a high level of significance. The meta-analysis approach adopted combines single-hazard hotspots with the objective to solve the problem of insignificant results and provides an objective statistical proof of the multi-hazard potential of a region. We support these results through a validation process that considers empirical data as explanatory variables. We highlight that the more significant multi-hazard clustering results in a stronger correlation relationship with the independent variables.
We also demonstrate that the proposed methodology allows for detecting changing patterns of the population being exposed to multi-hazards by considering socioeconomic factors. Our findings are in line with previous studies, highlighting an increasing gradient of multi-hazard risks from low-income countries towards higher-income countries and then a decrease as countries' incomes increase (Koks et al., 2019). We also identified highly urbanized regions (urban areas) as a space of risk for multi-hazard occurrence (Hansjürgens and Antes, 2008) compared with the rural administrative units. Furthermore, we show the potential of this methodological approach in detecting the risk of multi-hazards associated with complex socioeconomic urban processes. We find that high population density is a good explanatory variable for the increase in risk of the metropolitan areas. However, this situation is particularly different in the case of high-income metropolitan areas, where the populations more exposed to multi-hazards live in the (less densely populated) functional urban areas.
Whilst we believe that the disaster risk management for multi-hazard assessment is brought forward by the ability of the proposed approach to identify LAUs exposed to multi-hazards with high significance, we acknowledge several shortcomings. Among these, a notable limitation of our approach is that vulnerability (an aspect of the research design considered) is not taken into account in the assessment of asset exposure (population and residential built-up areas) to multi-hazards. The multi-hazard potential of each region is simply expressed by means of exposure (or assets exposed). Nevertheless, the overall analytical approach detects significant patterns of multi-hazard potential across regions, revealing spatially explicit clusters and thereby setting the basis for more precise and focused analysis. The areal-dimension approach excludes a detailed level of study that could more accurately examine the spatial coincidence of multiple hazards at localized levels. Moreover, subdividing the exposure data at the level of areal dimensions that are heterogeneous in size (as described in Sect. 2.1.1) may introduce biases into the cluster analysis, particularly when neighbouring relations are defined by distance. This can lead to underestimations or overestimations of the clusters. However, we mitigated this issue by identifying the optimal k value, which is dynamically determined for each hazard–asset relationship, in order to minimize the influence of noise and outliers on the clustering analysis. Future research opportunities include revising the meta-analysis approach (based on Stouffer's method) employed in this study, specifically exploring the use of weighted or unweighted versions of the Z-transform test for the Stouffer method when aggregating single-hazard hotspots into multi-hazard hotspots. There is evidence in the statistical literature (Whitlock, 2005) suggesting that the weighted Z approach may be preferable, particularly when there is variation in the sample size across studies or clusters, as is the case in our study, where the number of regions varies depending on the exposure type. However, the choice between the weighted and unweighted versions of this test remains an open question in meta-analysis, as highlighted by Becker (1994).
To our knowledge, this study is the first that uses spatial patterns (clusters/hotspots) and meta-analysis to identify the regions at a European level that are exposed to multi-hazards. The methodology presented in this study offers valuable insights into the European multi-hazard landscape, thereby informing the identification of DRM pathways in multi-hazard risk assessments. The findings point out the socioeconomic dimension as a determining factor in the spatial variability and in the risk potential of the local administrative units in terms of multi-hazards. Our results indicate that high population density is a significant explanatory variable for identifying regions exposed to multi-hazards, whereas the economic aspect is the primary driver that influences risk status at the local level, within rural and urban areas and in complex socioeconomic urban structures. By identifying LAUs exposed to multi-hazards, we also reduce the uncertainty surrounding two of the major challenges in multi-hazard studies: identifying regions susceptible to multi-hazards and quantifying multi-hazard exposure. This study contributes a valuable methodological framework, which is accessible through the Risk Data Hub platform, and has the potential to support national authorities in addressing the multi-hazard approach during the preparation of national risk assessments. Future research should aim to address identified limitations by incorporating vulnerability assessments into multi-hazard analyses and considering multi-hazard interrelations.
The code developed for this study performs a hotspot analysis to identify European regions (local administrative units) with built-up assets and population exposed to single hazards, such as coastal floods, earthquakes, river floods, landslides, subsidence, and wildfires. Additionally, the code integrates these single-hazard hotspots to identify multi-hazard hotspots at the European level. The code is publicly available under https://doi.org/10.5281/zenodo.14190957 (Tiberiu-79, 2024).
The data supporting this study are publicly accessible and have been deposited in the GitHub repository titled “Spatial identification of regions exposed to multi-hazards at pan-European level – EMHERG”. These data can be accessed directly at the following persistent URL: https://github.com/Tiberiu-79/Spatial-identification-of-regions-exposed-to-multi-hazards-at-pan (Tiberiu-79, 2025).
The supplement related to this article is available online at: https://doi.org/10.5194/nhess-25-287-2025-supplement.
TEA led the conceptualization of the study and the data processing, serving as the main author. SL contributed with the technical framework and the implementation. AT and AS contributed with the technical framework, conducted reviews, and created part of the graphical information. SSa and DR supported IT development and data processing. CB contributed expertise on hazard identification and analysis. GE provided critical review and validation. CC contributed to the conceptualization of the study and provided significant input through reviews and guidance. All authors approved the final publication.
The contact author has declared that none of the authors has any competing interests.
Publisher's note: Copernicus Publications remains neutral with regard to jurisdictional claims made in the text, published maps, institutional affiliations, or any other geographical representation in this paper. While Copernicus Publications makes every effort to include appropriate place names, the final responsibility lies with the authors.
This article is part of the special issue “Methodological innovations for the analysis and management of compound risk and multi-risk, including climate-related and geophysical hazards (NHESS/ESD/ESSD/GC/HESS inter-journal SI)”. It is not associated with a conference.
This paper was edited by Robert Sakic Trogrlic and reviewed by two anonymous referees.
Becker, B. J.: Combining significance levels, in: The Handbook of Research Synthesis, edited by: Cooper, H. and Hedges, L. V., Russell Sage Foundation, New York, 15–230, ISBN 978-0871542267, 1994.
Borenstein, M., Hedges, L. V., Higgins, J. P. T., and Rothstein, H. R.: Front Matter, in: Introduction to Meta-Analysis, John Wiley & Sons, Ltd, Chichester, UK, https://doi.org/10.1002/9780470743386, 2009.
Camus, P., Haigh, I. D., Nasr, A. A., Wahl, T., Darby, S. E., and Nicholls, R. J.: Regional analysis of multivariate compound coastal flooding potential around Europe and environs: sensitivity analysis and spatial patterns, Nat. Hazards Earth Syst. Sci., 21, 2021–2040, https://doi.org/10.5194/nhess-21-2021-2021, 2021.
Charlton, M. and Kemp, K. K.: Encyclopaedia of Geographic Information Science, SAGE Publications, Inc., 289–290, ISBN 978-1-4129-1313-3, 2008.
Chen, Z.: Is the weighted z-test the best method for combining probabilities from independent tests?, J. Evolution. Biol., 24, 926–930, 2011.
Ciurean, R., Gill, J. C., Reeves, H., O'Grady, S. K., Donald, K., and Aldridge, T.: Review of multi-hazards research and risk assessments, British Geological Survey Engineering Geology & Infrastructure Programme, Open Report OR/18/057, British Geological Survey, UK, https://nora.nerc.ac.uk/id/eprint/524399 (last access: 17 January 2025), 2018.
Claassen, J. N., Ward, P. J., Daniell, J., Koks, E. E., Tiggeloven, T., and de Ruiter, M. C.: A new method to compile global multi-hazard event sets, Sci. Rep.-UK, 13, 1–14, https://doi.org/10.1038/s41598-023-40400-5, 2023.
Cousineau, D. and Chartier, S.: Outliers Detection and Treatment: A Review, International Journal of Psychological Research, 3, 58–67, 2010.
Cutter, S. L., Ash, K. D., and Emrich, C. T.: The geographies of community disaster resilience, Global Environ. Change, 29, 65–77, https://doi.org/10.1016/j.gloenvcha.2014.08.005, 2014.
Cover, T. M. and Hart, P. E.: Nearest Neighbor Pattern Classification, IEEE T. Inform. Theory, IT-13, 21–27, 1967.
Dallo, I., Stauffacher, M., and Marti, M.: What defines the success of maps and additional information on a multi-hazard platform?, Int. J. Disast. Risk Re., 49, 101761, https://doi.org/10.1016/j.ijdrr.2020.101761, 2020.
Daňhelka, J.: August 2002 flood in the Czech Republic: meteorological causes and hydrological response, Geografie, 109, 84–92, https://doi.org/10.37040/geografie2004109020084, 2004.
De Angelis, S., Malamud, B. D., Rossi, L., Taylor, F. E., Trasforini, E., and Rudari, R.: A multi-hazard framework for spatial–temporal impact analysis, Int. J. Disast. Risk Re., 73, 102829, https://doi.org/10.1016/j.ijdrr.2022.102829, 2022.
De Fino, M., Tavolare, R., Bernardini, G., Quagliarini, E., and Fatiguso, F.: Boosting urban community resilience to multi-hazard scenarios in open spaces: A virtual reality – serious game training prototype for heat wave protection and earthquake response, Sustain. Cities Soc., 99, 104847, https://doi.org/10.1016/j.scs.2023.104847, 2023.
De Pippo, T., Donadio, C., Pennetta, M., Petrosino, C., Terlizzi, F., and Valente, A.: Coastal hazard assessment and mapping in Northern Campania, Italy, Geomorphology, 97, 451–466, https://doi.org/10.1016/j.geomorph.2007.08.015, 2008.
EEA – European Environment Agency: Corine Land Cover 2018 (CLC2018), https://www.eea.europa.eu/data-and-maps/data/corine-land-cover-2018 (last access: 16 January 2025), 2018.
EUR-Lex: 52014SC0134 – EN – EUR-Lex, https://eur-lex.europa.eu/legal-content/EN/TXT/?uri=CELEX%3A52014SC0134 (last access: 18 October 2023), 2014.
European Civil Protection Knowledge Network: Data & Tools, https://civil-protection-knowledge-network.europa.eu/knowledge-network-science/data-tools (last access: 18 October 2023), 2021.
European Commission: Overview of Natural and Man made Disaster Risks the European Union May Face, https://op.europa.eu/en/publication-detail/-/publication/285d038f-b543-11e7-837e-01aa75ed71a1 (last access: 16 January 2025), 2017.
European Commission: Overview of Natural and Man-made Dis aster Risks the European Union May Face, https://op.europa.eu/en/publication-detail/-/publication/89fcf0fc-edb9-11eb-a71c-01aa75ed71a1/language-en/format-PDF/source-236404726 (last access: 16 January 2025), 2020.
European Commission: Forging a climate-resilient Europe – The new EU Strategy on Adaptation to Climate Change, https://eur-lex.europa.eu/legal-content/EN/TXT/PDF/?uri=CELEX:52021DC0082 (last access: 18 October 2023), 2021.
Figueiredo, R., Paupério, E., and Romão, X.: Understanding the impacts of the October 2017 Portugal wildfires on cultural heritage, Heritage, 4, 2580–2598, https://doi.org/10.3390/heritage4040146, 2021.
Fisher, R.: Statistical methods for research workers, Oliver and Boyd, Edinburgh, ISBN 978-1178814261, 1932.
Fix, E. and Hodges, J. L.: Nonparametric Discrimination: Consistency Properties, Randolph Field, Texas, Project 21-49-004, Report No. 4, https://doi.org/10.2307/1403796, 1951.
Florczyk, A. J., Corbane, C., Schiavina, M., Pesaresi, M., Maffenini, L., Melchiorri, M., Politis, P., Sabo, F., Freire, S., Ehrlich, D., Kemper, T., Tommasi, P., Airaghi, D., and Zanchetta, L.: GHS-UCDB R2019A – GHS Urban Centre Database 2015, multitemporal and multidimensional attributes, JRC Data Catalogue, https://doi.org/10.2905/53473144-B88C-44BC-B4A3-4583ED1F547E, 2019.
Forzieri, G., Feyen, L., Russo, S., Vousdoukas, M., Alfieri, L., Outten, S., Migliavacca, M., Bianchi, A., Rojas, R., and Cid, A.: Multi-hazard assessment in Europe under climate change, Climatic Change, 137, 105–119, https://doi.org/10.1007/s10584-016-1661-x, 2016.
Fotheringham, A. S. and Wong, D. W. S.: The modifiable areal unit problem in multivariate statistical analysis, Environ. Plann. A, 23, 1025–1044, 1991.
Freire, S., Kemper, T., Pesaresi, M., Florczyk, A., and Syrris, V.: Combining GHSL and GPW to improve global population mapping, in: 2015 IEEE International Geoscience and Remote Sensing Symposium (IGARSS), Milan, Italy, 2541–2543, hhttps://doi.org/10.1109/IGARSS.2015.7326329, 2015.
Fuchs, S. and Thaler, T. (Eds.): Vulnerability and Resilience to Natural Hazards, Cambridge University Press, https://doi.org/10.1017/9781316651143, 2018.
Gaillard, J. C. and Mercer, J.: From knowledge to action: Bridging gaps in disaster risk reduction, Prog. Hum. Geog., 37, 93–114, https://doi.org/10.1177/0309132512446717, 2013.
Gallina, V., Torresan, S., Critto, A., Sperotto, A., Glade, T., and Marcomini, A.: A review of multi-risk methodologies for natural hazards: consequences and challenges for a climate change impact assessment, J. Environ. Manage., 168, 123–132, https://doi.org/10.1016/j.jenvman.2015.11.011, 2016.
Gentile, R., Cremen, G., Galasso, C., Jenkins, L. T., Manandhar, V., Menteşe, E. Y., Guragain, R., and McCloskey, J.: Scoring, selecting, and developing physical impact models for multi-hazard risk assessment, Int. J. Disast. Risk Re., 82, 103365, https://doi.org/10.1016/j.ijdrr.2022.103365, 2022.
Getis, A. and Ord, J. K.: The Analysis of Spatial Association by Use of Distance Statistics, Geogr. Anal., 24, 189–206, https://doi.org/10.1111/j.1538-4632.1992.tb00261.x, 1992.
Ghanbari, M., Arabi, M., Kao, S. C., Obeysekera, J., and Sweet, W.: Climate change and changes in compound coastal-riverine flooding hazard along the U.S. coasts, Earths Future, 9, e2021EF002055, https://doi.org/10.1029/2021EF002055, 2021.
Gill, J. C. and Malamud, B. D.: Reviewing and visualizing the interactions of natural hazards, Rev. Geophys., 52, 680–722, 2014.
Gill, J. C. and Malamud, B. D.: Hazard interactions and interaction networks (cascades) within multi-hazard methodologies, Earth Syst. Dynam., 7, 659–679, https://doi.org/10.5194/esd-7-659-2016, 2016.
Gill, J. C., Malamud, B. D., Barillas, E. M., and Guerra Noriega, A.: Construction of regional multi-hazard interaction frameworks, with an application to Guatemala, Nat. Hazards Earth Syst. Sci., 20, 149–180, https://doi.org/10.5194/nhess-20-149-2020, 2020.
Granger, K., Jones, T., Leiba, M., and Scott, G.: Community Risk in Cairns: A Multi-Hazard Risk Assessment, Commonwealth of Australia Publishing, Canberra, https://pid.geoscience.gov.au/dataset/ga/33548 (last access: 16 January 2025), 1999.
Greiving, S., Fleischhauer, M., and Lückenkötter, J.: A methodology for an integrated risk assessment of spatially relevant hazards, J. Environ. Plann. Man., 49, 1–19, 2006.
Grünthal, G., Thieken, A. H., Schwarz, J., Radtke, K. S., Smolka, A., and Merz, B.: Comparative risk assessment for the city of Cologne-storms, floods, earthquake, Nat. Hazards, 38, 21–44, 2006.
Haasnoot, M., Kwakkel, J. H., Walker, W. E., and ter Maat, J.: Dynamic adaptive policy pathways: A method for crafting robust decisions for a deeply uncertain world, Global Environ. Change, 23, 485–498, https://doi.org/10.1016/j.gloenvcha.2012.12.006, 2013.
Hak, T., van Rhee, H., and Suurmond, R.: How to interpret results of meta-analysis, SSRN, https://doi.org/10.2139/ssrn.3241367, 2016.
Han, J., Wu, S., and Wang, H.: Preliminary study on geological hazard chains, Earth Science Frontiers, 14, 11–20, https://doi.org/10.1016/S1872-5791(08)60001-9, 2007.
Hansjürgens, B. and Antes, R.: Economics and management of climate change: risks, mitigation and adaptation, Springer, Berlin, Heidelberg, https://doi.org/10.1007/978-3-540-77658-5, 2008.
IPCC: Managing the risks of extreme events and disasters to advance climate change adaptation. A special report of working groups I and II of the intergovernmental panel on climate change, Cambridge University Press, Cambridge, ISBN 978-1-107-02506-6, 2012.
ISO: ISO 3166-1 – Codes for the representation of names of countries and their subdivisions – Part 1: Country codes, International Organization for Standardization, Geneva, Switzerland, https://www.iso.org/obp/ui/en/#iso:std:iso:3166:-1:ed-4:v1:en (last access: 17 January 2025), 2020.
Jelinski, D. E. and Wu, J.: The modifiable areal unit problem and implications for landscape ecology, Landscape Ecol., 11, 129–140, 1996.
Kappes, M. S., Keiler, M., and Glade, T.: From single- to multi-hazard risk analyses: a concept addressing emerging challenges, in: Mountain Risks: Bringing Science to Society, edited by: Malet, J. P., Glade, T., and Casagli, N., CERG Editions, Strasbourg, France, 351–356, ISBN 2-9518317-1-5, 2010.
Kappes, M. S., Frigerio, S., and Malet, J. P.: Multi-hazard exposure analyses with multirisk – a platform for user-friendly analysis, 12th Congress INTERPRAEVENT, April 2012, Grenoble, France, 487–495, 2012a.
Kappes, M. S., Gruber, K., Frigerio, S., Bell, R., Keiler, M., and Glade, T.: The multirisk platform: the technical concept and application of a regional scale multihazard exposure analysis tool, Geomorphology, 151–152, 139–155, https://doi.org/10.1016/j.geomorph.2012.01.024, 2012b.
Kappes, M. S., Keiler, M., von Elverfeldt, K., and Glade, T.: Challenges of analyzing multi-hazard risk: a review, Nat. Hazards, 64, 1925–1958, 2012c.
Koks, E. E., Rozenberg, J., Zorn, C., Tariverdi, M., Vousdoukas, M., Fraser, S. A., Hall, J. W., and Hallegatte, S.: A global multi-hazard risk analysis of road and railway infrastructure assets, Nat. Commun., 10, 2677, https://doi.org/10.1038/s41467-019-10442-3, 2019.
Kwan, M.-P.: The Uncertain Geographic Context Problem, Ann. Assoc. Am. Geogr., 102, 958–968, https://doi.org/10.1080/00045608.2012.687349, 2012.
Lancaster, H.: The combination of probabilities: An application of orthonormal functions, Aust. J. Stat. 3, 20–33, 1961.
Lee, R., White, C. J., Adnan, M. S. G., Douglas, J., Mahecha, M. D., O'Loughlin, F. E., Patelli, E., Ramos, A. M., Roberts, M. J., Martius, O., Tubaldi, E., van den Hurk, B., Ward, P. J., and Zscheischler, J.: Reclassifying historical disasters: From single to multi-hazards, Sci. Total Environ., 912, 169120, https://doi.org/10.1016/j.scitotenv.2023.169120, 2024.
Lipták, T.: On the combination of independent tests, Magyar Tud. Akad. Mat. Kutato Int. Közl, 3, 171–196, 1958.
Liu, B., Siu, Y. L., and Mitchell, G.: Hazard interaction analysis for multi-hazard risk assessment: a systematic classification based on hazard-forming environment, Nat. Hazards Earth Syst. Sci., 16, 629–642, https://doi.org/10.5194/nhess-16-629-2016, 2016.
Marzocchi, W., Mastellone, M., Di Ruocco, A., Novelli, P., Romeo, E., and Gasparini, P.: Principles of Multi-Risk Assessment: Interactions Amongst Natural and Man-Induced Risks, European Commission, Directorate-General for Research, Environment Directorate, Luxembourg, 72 pp., ISBN 978-92-79-07963-4, https://doi.org/10.2777/30886, 2009.
Marzocchi, W., Garcia-Aristizabal, A., Gasparini, P., Mastellone, M., and Di Ruocco, A.: Basic principles of multi-risk assessment: a case study in Italy, Nat. Hazards, 62, 551–573, 2012.
McFarland, L., Huang, Y., Wang, L., and Malfertheiner, P.: Systematic review and meta-analysis: Multi-strain probiotics as adjunct therapy for Helicobacter pylori eradication and prevention of adverse events, United Eur. Gastroenterol. J., 4, 546–561, https://doi.org/10.1177/2050640615617358, 2015.
Openshaw, S.: The Modifiable Areal Unit Problem, CATMOG 38, GeoBooks, Norwich, https://doi.org/10.1007/s11069-012-0092-x, 1984.
Peter, A. G. and van Bergeijk, L.: Macroeconomics of Natural Disasters: Strengths and Weaknesses of Meta-Analysis Versus Review of Literature, Risk Anal., 35, 1050–1072, 2015.
Rey, S. J. and Anselin, L.: PySAL: A Python Library of Spatial Analytical Methods, Review of Regional Studies, 37, 5–27, 2007.
Saaty, R. W.: The analytic hierarchy process – what it is and how it is used, Math. Model., 9, 161–176, https://doi.org/10.1016/0270-0255(87)90473-8, 1987.
Sadegh, M., Moftakhari, H., Gupta, H. V., Ragno, E., Mazdiyasni, O., Sanders, B., Matthew, R., and Agha Kouchak, A.: Multihazard scenarios for analysis of compound extreme events, Geophys. Res. Lett., 45, 5470–5480, 2018.
SciPy: Statistics (scipy.stats) – SciPy v1.10.1 Manual, https://docs.scipy.org/doc/scipy/tutorial/stats.html (last access: 16 January 2025), 2024.
Stillwell, J., Daras, K., Bell, M., and Lomax, N.: The IMAGE studio: a tool for internal migration analysis and modelling, Appl. Spat. Anal. Polic., 7, 5–23, 2014.
Stouffer, S., DeVinney, L., and Suchmen, E.: The American soldier: Adjustment during army life, vol. 1, Princeton University Press Princeton, USA, ISBN 978-0691056286, 1949.
Tarvainen, T., Jarva, J., and Greiving, S.: Spatial pattern of hazards and hazard interactions in Europe, in: Natural and Technological Hazards and Risks Affecting the Spatial Development of European Regions, edited by: Schmidt-Thomé, P., Geological Survey of Finland, Espoo, Finland, 42, 83–91, https://scholar.google.com/scholar_lookup?hl=en&volume=42&publication_year=2006&journal=Special+Paper+of+the+Geological+Survey+of+Finland&issue=83&author=T.+Tarvainen&author=J.+Jarva&author=S.+Greiving&title=Spatial+pattern+of+hazards+and+hazard+interactions+in+Europe (last access: 16 January 2025), 2006.
Tiberiu-79: Tiberiu-79/Spatial-identification-of-regions-exposed-to-multi-hazards-at-pan-European-level-EMHERG-: v2.0.0 (v2.0.0), Zenodo [code]m https://doi.org/10.5281/zenodo.14190957, 2024.
Tiberiu-79: Spatial-identification-of-regions-exposed-to-multi-hazards-at-pan-European-level-EMHERG-, GitHub [data set], https://github.com/Tiberiu-79/Spatial-identification-of-regions-exposed-to-multi-hazards-at (last access: 16 January 2025), 2025.
Tilloy, A., Malamud, B. D., Winter, H., and Joly-Laugel, A.: A review of quantification methodologies for multi-hazard interrelationships, Earth-Sci. Rev., 196, 102881, https://doi.org/10.1016/j.earscirev.2019.102881, 2019.
UNISDR – UN International Strategy for Disaster Reduction: Living with Risk: A Global Review of Disaster Reduction Initiatives, United Nations, Geneva, https://www.undrr.org/publication/living-risk-global-review-disaster-reduction-initiatives? (last access: 17 January 2017), 2004.
van Westen, C., Kappes, M. S., Luna, B. Q., Frigerio, S., Glade, T., and Malet, J. P.: Medium-Scale Multi-hazard Risk Assessment of Gravitational Processes, in: Mountain Risks: From Prediction to Management and Governance, Advances in Natural and Technological Hazards Research, vol. 34, edited by: Van Asch, T., Corominas, J., Greiving, S., Malet, J. P., and Sterlacchini S., Springer, Dordrecht, eBook ISBN 978-94-007-6769-0, 2014.
van Westen, C. J., Montoya, L., Boerboom, L., and Badilla Coto, E.: Multi-hazard risk assessment using GIS in urban areas: a case study for the city of Turrialba, Costa Rica, 120–136, https://api.semanticscholar.org/CorpusID:129619800 (last access: 16 January 2025), 2002.
Ward, P. J., Daniell, J., Duncan, M., Dunne, A., Hananel, C., Hochrainer-Stigler, S., Tijssen, A., Torresan, S., Ciurean, R., Gill, J. C., Sillmann, J., Couasnon, A., Koks, E., Padrón-Fumero, N., Tatman, S., Tronstad Lund, M., Adesiyun, A., Aerts, J. C. J. H., Alabaster, A., Bulder, B., Campillo Torres, C., Critto, A., Hernández-Martín, R., Machado, M., Mysiak, J., Orth, R., Palomino Antolín, I., Petrescu, E.-C., Reichstein, M., Tiggeloven, T., Van Loon, A. F., Vuong Pham, H., and de Ruiter, M. C.: Invited perspectives: A research agenda towards disaster risk management pathways in multi-(hazard-)risk assessment, Nat. Hazards Earth Syst. Sci., 22, 1487–1497, https://doi.org/10.5194/nhess-22-1487-2022, 2022.
Whitlock, M. C.: Combining probability from independent tests: the weighted Z-method is superior to Fisher's approach, J. Evolution. Biol., 18, 1368–1373, 2005.
Wilkinson, B.: A statistical consideration in psychological research, Psychol. Bull., 48, 156–158, https://doi.org/10.1037/h0059111, 1951.
Yoon, S., Baik, B., and Park, T.: Powerful p-value combination methods to detect incomplete association, Sci. Rep.-UK, 11, 6980, https://doi.org/10.1038/s41598-021-86465-y, 2021.
Zaykin, D., Zhivotovsky, L., Westfall, P., and Weir, B.: Truncated product method for combining P-values, Genet. Epidemiol., 22, 170–185, 2002.
Zaykin, D. V.: Optimally weighted Z-test is a powerful method for combining probabilities in meta-analysis, J. Evolution. Biol., 24, 1836–1841, https://doi.org/10.1111/j.1420-9101.2011.02297.x, 2011.
Zhao, M. and Jingchao, C.: Improvement and Comparison of Weighted k Nearest Neighbors Classifiers for Model Selection, Journal of Software Engineering, 10, 109–118, 2016.
The metropolitan areas according to 2018 URAU definitions and represented here are composed of core city, functional urban area, greater city, and trans-national functional urban area (codes: C, F, K, T).


