the Creative Commons Attribution 4.0 License.
the Creative Commons Attribution 4.0 License.
 | 15 Aug 2025
Cities near volcanoes: which cities are most exposed to volcanic hazards?
Elinor S. Meredith
Rui Xue Natalie Teng
Susanna F. Jenkins
Josh L. Hayes
Sébastien Biass
Heather Handley
Cities near volcanoes expose dense concentrations of people, buildings, and infrastructure to volcanic hazards. Identifying cities globally that are exposed to volcanic hazards helps guide local risk assessment for better land-use planning and hazard mitigation. Previous city exposure approaches have used the city centroid to represent an entire city and assess population exposure and proximity to volcanoes. However, cities can cover large areas and populations may not be equally distributed within their bounds, meaning that a centroid may not accurately capture the true exposure. In this study, we suggest a new framework to rank global city exposure to volcanic hazards. We assessed global city exposure to volcanoes in the Global Volcanism Program database that are active in the Holocene by analysing populations located within 10, 30, and 100 km of volcanoes. These distances are commonly used in volcanic hazard exposure assessment. City margins and populations were obtained from the Global Human Settlement (GHS) model datasets. We ranked 1133 cities based on the number of people exposed at different distances from volcanoes, the distance of the city margin from the nearest volcano, and the number of nearby volcanoes. Notably, 50 % of people living within 100 km of a volcano are in cities. We highlight Jakarta, Bandung, and San Salvador as scoring highly across these rankings. Bandung in Indonesia ranks highest overall, with over 8 million people exposed within 30 km of up to 12 volcanoes. South-East Asia has the highest number of exposed city populations (∼ 161 million). Jakarta (∼ 38 million), Tokyo (∼ 30 million), and Manila (∼ 24 million) have the largest number of people within 100 km. Central America has the highest proportion of its city population exposed, with Quezaltepeque and San Salvador exposed to the most volcanoes (n = 23). Additionally, we ranked the 1264 Holocene volcanoes by city populations exposed within 10, 30, and 100 km, the number of nearby cities, and the distance to the nearest city. Tangkuban Parahu, Tampomas, and San Pablo Volcanic Field score highly across these rankings. Notably, the Gede-Pangrango (∼ 48 million), Tangkuban Parahu (∼ 8 million), and Nejapa-Miraflores (∼ 0.8 million) volcanoes have the largest city populations within 100, 30, and 10 km, respectively. We developed a web app to visualize all cities with over 100 000 people exposed. This study provides a global perspective on city exposure to volcanic hazards, identifying critical areas for future research and mitigation efforts.
- Article
(5668 KB) - Full-text XML
- BibTeX
- EndNote


As of 2023, more than half (57 %) of the world's population reside in cities (World Bank, 2023). These dense urban clusters of buildings, infrastructure, and populations are particularly vulnerable to natural hazards (Degg, 1992; Godschalk, 2003), as urban residents are heavily reliant on city infrastructure (UNDP, 2021). Such susceptibility exposes cities to high potential losses and cascading systemic impacts that can affect the wider region, country, or world (Thouret, 1999; Chester et al., 2000; Heiken, 2013; Mani et al., 2021). Recent rapid urbanization into hazardous areas escalates the threat to cities (Pelling, 2012; Freire et al., 2019; Iglesias et al., 2021), driving increasing disaster impacts globally (Gu, 2019). Identification of the most exposed cities and analysis of the spatio-temporal patterns of urban hazard exposure is crucial for guiding effective land-use planning and mitigation efforts. This focus will help prioritize cities that need focussed attention for sustainable development and improved preparedness and resilience against future disasters (Ariyanti et al., 2020).
Cities situated near volcanoes face a variety of direct threats from volcanic hazards resulting from eruptions of various intensities. Historically, volcanic flows have destroyed whole cities; for example, pyroclastic density currents (PDCs) emplaced within 10 km destroyed Herculaneum, Italy, in 79 CE (Volcanic Explosivity Index VEI 5); Saint Pierre, Martinique, in 1902 CE (VEI 4); and Plymouth, Montserrat, in 1997 CE (VEI 3). Some cities are repeatedly impacted, such as Goma, Democratic Republic of Congo (DRC), less than 30 km from a volcano, which was partially inundated by lava flows in 1977 CE, 2002 CE, and 2021 CE. Lahars (volcanic mudflows) destroyed the city of Armero, Colombia, approximately 50 km from the Nevado del Ruiz volcano in 1985 CE (VEI 3), and the city of Lumajang, Indonesia, 35 km from Semeru volcano, in 1909 CE (VEI 2). Some cities are built on old lahar deposits, suggesting that they are likely to be impacted again (e.g. Arequipa, Peru; San Salvador, El Salvador). The more widely dispersed hazard of tephra falls destroyed the city of Akrotiri, Greece, around 1600 BCE (VEI 7) and disrupted and damaged the cities of Kagoshima, Japan, in 1914 CE (VEI 4), Anchorage, USA, in 1989 CE (VEI 3), and Angeles City, Philippines, in 1991 CE (VEI 5).
In order to reduce the risks faced by cities situated close to volcanoes, we must first identify which cities are most exposed to volcanic hazards. Some past studies have used a localized approach, whereby they identify exposed urban areas close to case study volcanoes (e.g. Thouret et al., 2001; Sandri et al., 2014; Strader et al., 2015; Magill and Blong, 2005; Alberico et al., 2011; Delgado Granados and Jenkins, 2015; Torres et al., 2023). However, a more systematic regional or global approach based on the locations of all of the cities would reveal which of them are most exposed. For example, taking a regional multi-volcano approach, Jenkins et al. (2018) evaluated the potential impact of tephra fall on 16 major cities in the Asia–Pacific region, highlighting Tokyo (Japan), Jakarta (Indonesia), and Manila (Philippines) as being most exposed. Ranking cities or volcanoes by city population exposure would allow us to identify global hotspots which may be missed by a more localized approach.
Whilst global city analyses have been conducted for other hazards such as coastal flooding (Hanson et al., 2011), earthquakes (Bilham, 2009), and multi-hazards (Degg, 1992; Brecht et al., 2013; Gu, 2019), for volcanic hazards, reports or studies often focus on growth rates or total population numbers of case study cities, based on the locations of city centroids close to volcanoes. For example, in 1989 CE, the UN estimated that, of the top 50 fastest-growing cities, only 4 were exposed to volcanic hazards (United Nations, 1989). Three years later, it was estimated that 10 of the world's most populated cities were located within 30 km of an active volcano (Degg, 1992). Pelling (2012) and Blaikie et al. (2004) highlight Jakarta as a major city at risk from volcanic activity. Heiken (2013) identified 67 cities with populations larger than 100 000, home to a total of ∼ 116 million people, and located on or near active volcanoes. Other studies considered a city's distance and direction from volcanoes. Donovan and Oppenheimer (2014) listed 49 cities within 100 km of a volcano with recognized Quaternary activity, and Erfurt-Cooper (2014) provided a list of 25 cities in close proximity to active volcanoes. Chester et al. (2000) and subsequently Auker et al. (2013) plotted polar charts with examples of highly populated cities in relation to the distance and direction of the city centroid from nearby volcanoes, within 200 and 50 km of volcanoes, respectively. Brown et al. (2015) identified 7 capital cities globally within 10 km of volcanoes, 37 within 30 km, and 69 within 100 km. A systematic approach quantifying all global city populations at specific distances from volcanoes would better capture the variable distribution of populations across cities and the exposure to volcanoes.
Key cities identified as exposed to volcanic hazards can then be targeted for more localized research and mitigation efforts. For example, Jenkins et al. (2022) ranked volcanoes in South-East Asia by population and physical exposure and proposed that populations near Guntur volcano, Indonesia, are highly exposed and thus require further study. For identified highly exposed cities, combining high-resolution exposure with hazard maps or footprints can identify key areas in a city on which to focus future mitigation, such as structural adaptations (e.g. to tephra fall in Kagoshima: Durand, 2001) and/or land-use planning efforts (e.g. Nieto-Torres et al., 2021; Strader et al., 2015; Thouret et al., 2001).
In this study, we propose a new framework to quantify and rank global cities exposed to volcanoes situated within varying proximity thresholds (10, 30, and 100 km), based on three variables: population exposed, distance to the nearest volcano, and the total count of volcanoes each city is exposed to. Leveraging high-resolution updated population data allows for assessment of the spatial variation of population exposure within each city. Instead of looking at the total population of the city as presented in past studies, this approach more accurately identifies the proportion of the city population within each distance threshold. Furthermore, our framework also ranks volcanoes by city exposure based on their proximity to city populations, considering the total count of cities and their respective populations within the specified distances from volcanoes.
Measuring population exposure around volcanoes
To quantify global population exposure around volcanoes, studies typically count the number of people residing within concentric radial buffers of certain sizes around a volcanic vent (e.g. Small and Naumann, 2001; Ewert, 2007; Aspinall et al., 2011; Brown et al., 2015; Freire et al., 2019; Nieto-Torres et al., 2021; Guimarães et al., 2021). For example, Freire et al. (2019) calculated total populations living within 10, 30, 50, and 100 km radial buffers around active volcanoes between 1975 and 2015 CE. The concentric radial buffer size approach allows for a conservative estimate of exposure at each volcano so that the cities can be compared and ranked, which is especially useful for volcanoes without historical eruptions or high-resolution topography data (Biass et al., 2024). The radius sizes of buffers around the volcanic vent used to calculate exposure are determined by the maximum distances of primary volcanic hazards and the extents of potential VEI events. For instance, the emplacement of the majority of primary hazards in a VEI < 4 eruption are within a 10 km radius around the volcano, including extents of ballistic projectiles and most dome collapse PDCs (Biass et al., 2024). A 30 km radius generally represents the extent of the majority of VEI < 5 eruption hazard extents, while a 100 km radius signifies the extent of the majority of VEI < 6 eruption hazard extents. However, larger eruptions, secondary hazards, or eruptions occurring from fields or fissures beyond the vent might extend beyond these maximum hazard distances. For example, as shown by modelling of a VEI 5 scenario in Biass et al. (2024), tephra loads exceeding 1 kg m−2 could extend as far as 600 km away.
These exposure counts can be assigned to specific indices for comparison across volcanoes. For example, the Volcanic Population Index (VPI) estimates the number of people living within 5 and 10 km of volcanoes (Ewert and Harpel, 2004). Aspinall et al. (2011) developed this methodology to assess populations within 10, 30, and 100 km of volcanoes. To calculate the Population Exposure Index (PEI), the population counts are weighted according to evidence of historical distributions of fatalities within a given distance from the vent, and each volcano is assigned to one of seven PEIs (Brown et al., 2015). On a local or regional scale, past studies combined these population counts with physical exposure (e.g. Mount Etna, Italy: Del Negro et al., 2020; Rainier volcano, USA: Wood and Soulard, 2009) and/or hazard factors to understand localized volcanic threat (e.g. Ewert et al., 2018; Mangan et al., 2018; Nieto-Torres et al., 2021). Nieto-Torres et al. (2021) developed a volcanic risk index considering 41 different factors related to hazards and exposure, assessing population risks within distances of 5, 10, 30, and 100 km from volcanoes. Researchers used various buffer sizes in ongoing efforts to accurately assess the risks that volcanic hazards pose to total populations. No studies conducted exposure analysis based on population exposure by urban type, such as city populations. In this study, we quantify and rank global cities exposed to volcanoes situated within 10, 30, and 100 km of volcanoes.
We developed a framework designed to quantify, rank, and assess city exposure to volcanoes (see Figs. 1 and 2). In this study, exposed populations refer to populations in cities within 100 km (unless the distance is specified) from at least one volcano active in the Holocene, as explained in Sect. 2.1. Below we detail how we prepared the city outlines, extracted populations, and ranked the cities and volcanoes. The R code used to generate the results of this study is provided at https://github.com/vharg/VolcCities (last access: 7 August 2025). The figures presented in this study focus on the top 10 cities or volcanoes. We developed a web app to comprehensively present the results of this study, including the population exposure and maps of city polygons for all cities with over 100 000 people exposed, which is available at https://vharg.github.io/shiny_VolcCities/ (last access: 7 August 2025).
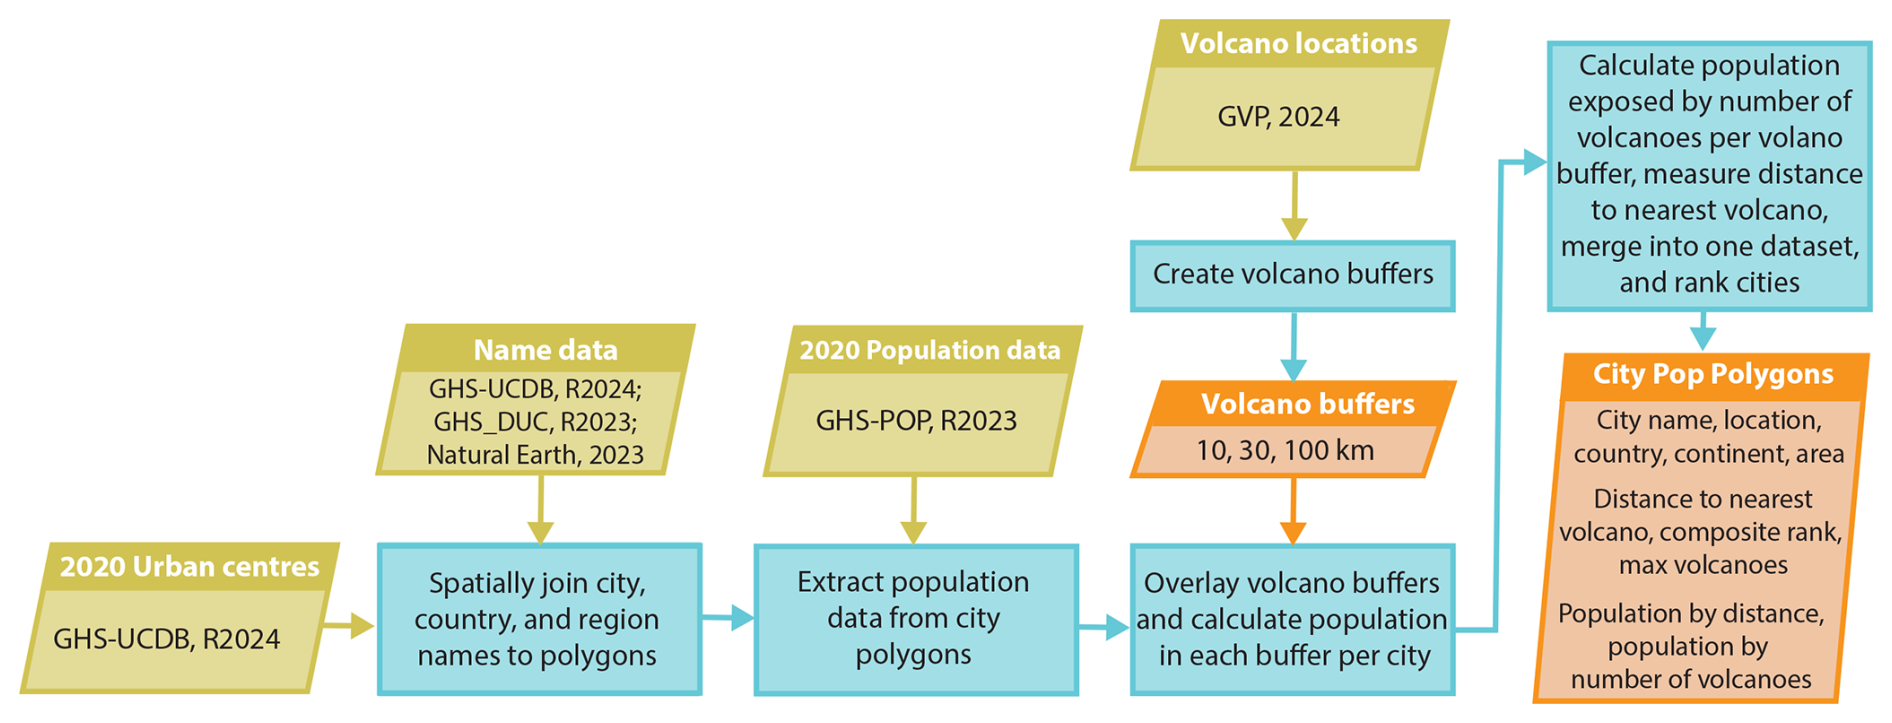
Figure 1A flowchart of our framework to assess city exposure to volcanoes. Input datasets (yellow rectangles) are fed into the GIS process (blue rectangles) to collate city polygons (left orange rectangle) and attribute data, clipped by radial buffers (central orange rectangle), into the exposed population polygon dataset (right orange rectangle). For the 2020 urban centres, the GHS-UCDB (Marí Rivero et al., 2024) dataset was used, and the spatially joined centroids of this dataset were used for names. The GHS-DUC ( Schiavina et al., 2023a) Name_2 column was used for city names if they were not available. The cities were ranked by the population size, the distance to the nearest volcano, and the maximum number of volcanoes exposed, and the average of these was presented as the composite rank. The volcanoes chosen are those active in the Holocene epoch. GVP stands for the Global Volcanism Program and GHS stands for Global Human Settlement. The code used in this paper is provided at https://github.com/vharg/VolcCities.
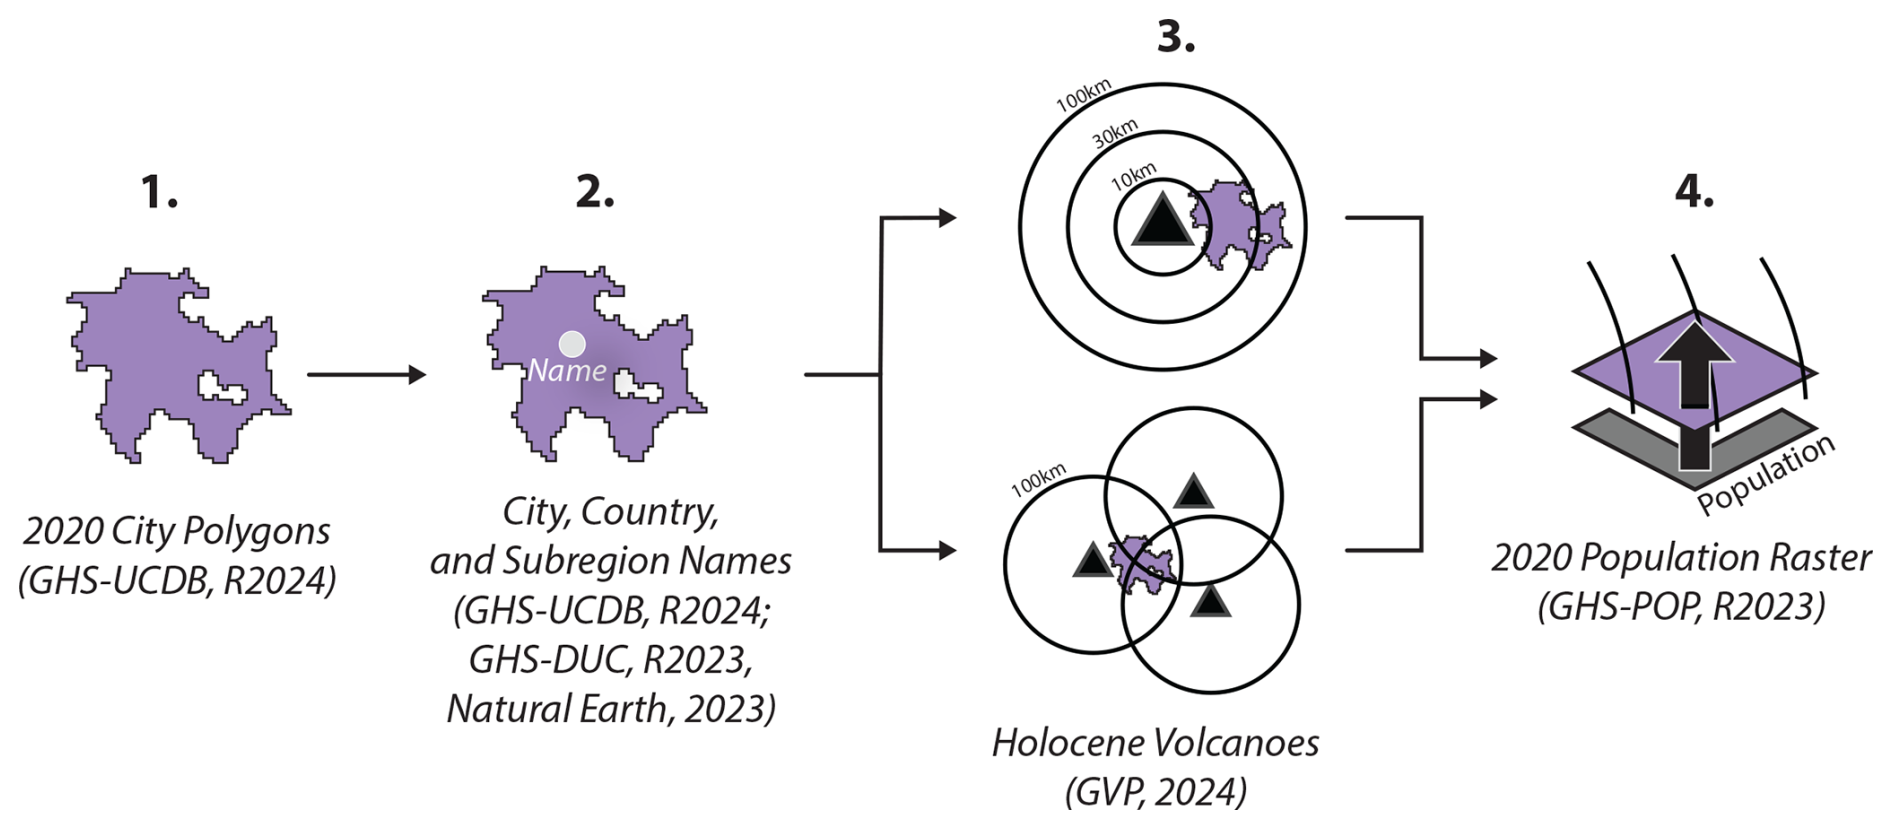
Figure 2A schematic of our framework for assessing city exposure to volcanoes. The framework includes the following steps: (1) obtaining city polygons for 2020 from the GHS-UCDB (Marí Rivero et al., 2024) urban centre polygon dataset, (2) joining city and country names from GHS-UCDB (Marí Rivero et al., 2024) centroids (otherwise, GHS_DUC polygons were used, and Natural Earth (Schiavina et al., 2023a) was used for subregion names), (3) conducting distance analysis by clipping city polygons within 10, 30, and 100 km buffers from volcanoes and analysing the number of volcanoes by counting overlaps of 100 km volcano buffers across city polygons, and (4) extracting the population of city polygons within volcano buffers using a population raster. Cities were ranked by population size and the maximum number of exposed volcanoes. The volcanoes included are those active in the Holocene, as per the GVP. The code used in this paper is provided at https://github.com/vharg/VolcCities.
2.1 Preparing the exposed city population polygon dataset
We obtained 2020 city area outlines from the 2024 release of the Global Human Settlement Layer – Settlement Model, Urban Centre Database (GHS-UCDB; Marí Rivero et al., 2024). This dataset is in the World Mollweide (EPSG:54009) projection and we did not re-project it. The dataset identifies urban centres, classified as having a population density of ≥ 1500 inhabitants per square kilometre and a total population size of at least 50 000 people (Marí Rivero et al., 2024). These city areas will be referred to from here on as city polygons. We identified the centroid coordinates and the areas of the city polygons.
We only selected those polygons that had all or part of their area within 100 km of a volcano resulting in 1154 polygons. The volcano locations in this study were based on coordinates from the 1264 Holocene Volcano List from the Volcanoes of the World (VOTW) v 5.2.7 database (Global Volcanism Program, 2024). Coordinates of the Holocene volcanoes in the database are positioned either at the summit of volcanoes with a distinct primary edifice or close to known vents. For volcanic fields with multiple vents, the database presents the most prominent or active vent, the most recently erupting vent, or the centre of the volcanic field, depending on the information availability. Using a single point to represent the distributed volcanism introduces uncertainty, as the precise locations of future eruptions are unknown.
The city polygons generated from the raster lacked attribute data. Therefore, we spatially joined each polygon with the city and country names of the 2025 projected city polygons from the 2024 release of the GHS-UCDB dataset (Marí Rivero et al., 2024). The spatial join was based on the overlap of the centroids with the city polygons. For the 30 cities that did not have city names (as they are not in the 2025 dataset), we spatially joined the city polygons to the 2023 release of the GHS Degree of Urbanisation Classification (GHS-DUC; Schiavina et al., 2023a) polygon dataset and selected the name from the Name_2 column, and for one case, the Name_1 column as Name_2 was empty. For the 35 cities that did not have any country names, these were added from the spatially joined GHS_DUC dataset. The spatial join was based on the locations of the city polygons' centroids. For the subregions, we spatially joined the city polygons with the Natural Earth (2023) country polygons and selected the subregions, based on the location of the nearest polygon. This dataset was chosen as there were more subregions included than the GHS-UCDB dataset. We then grouped the city polygons by city name in each country, resulting in a dataset of 1133 cities.
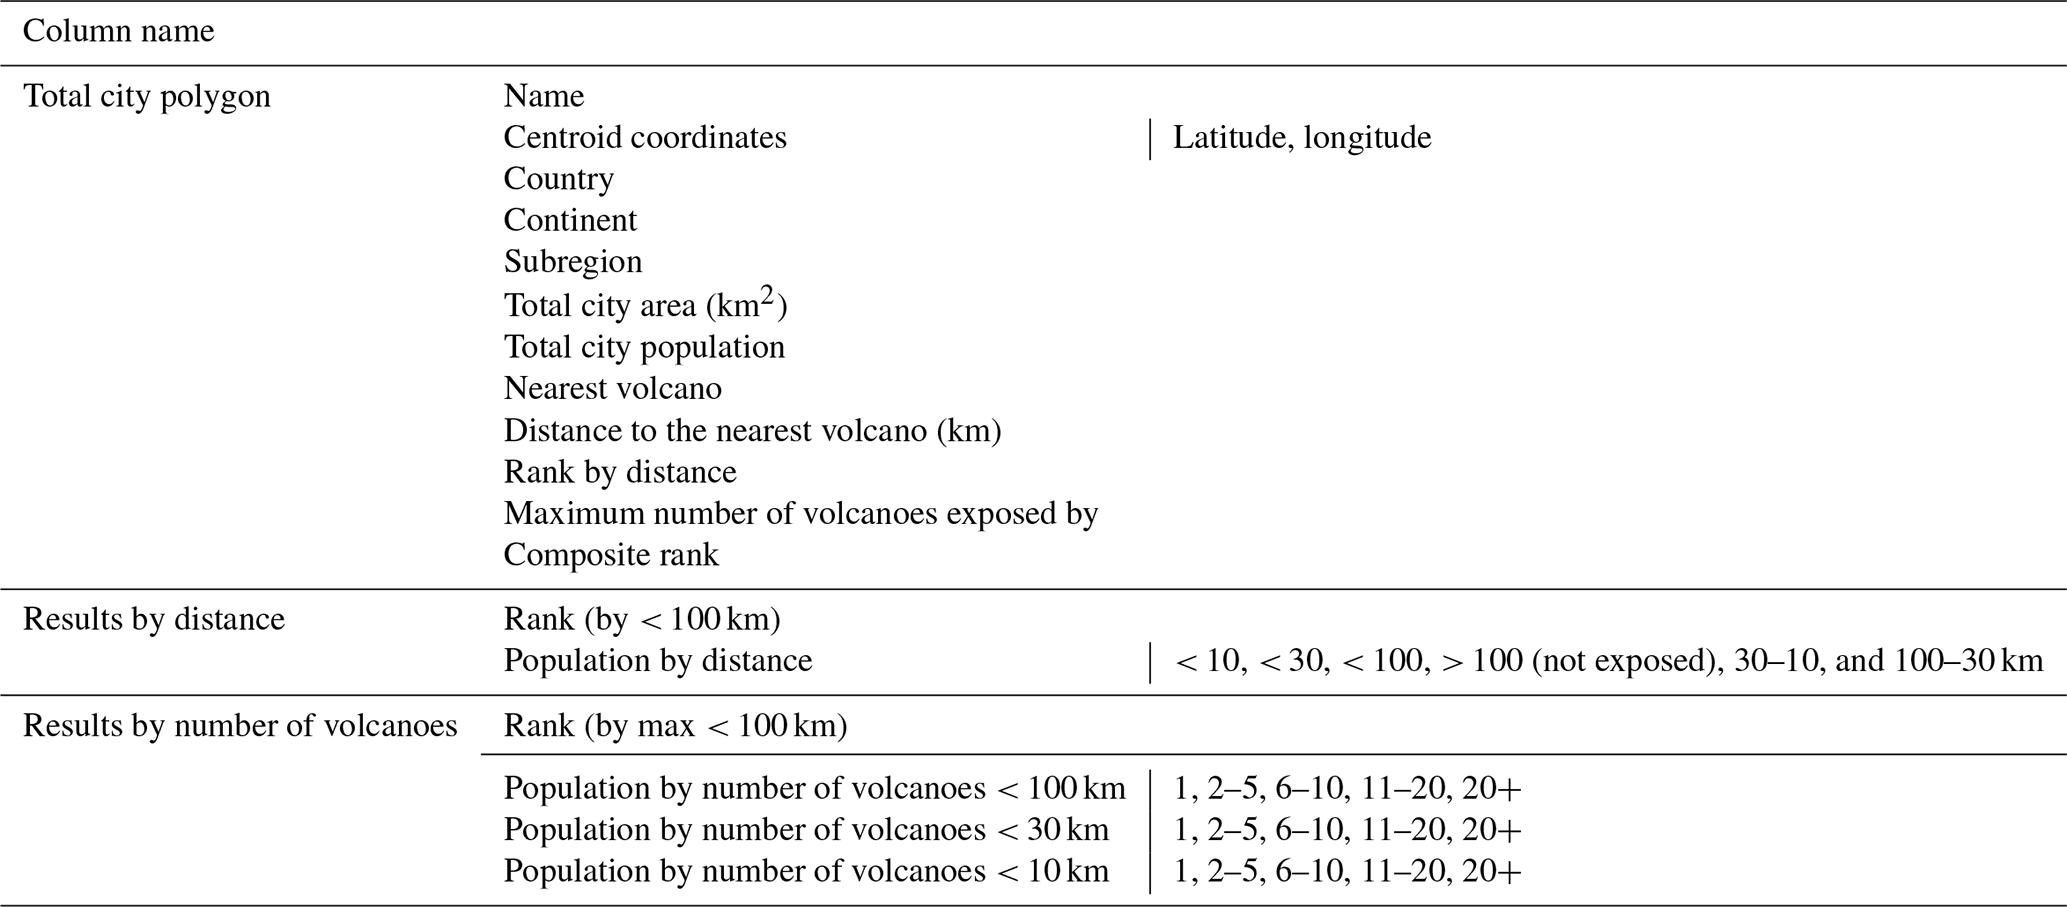
We performed other calculations for the other columns in the dataset shown in Table 1, and we included the city polygon centroid coordinates based on the largest polygon, calculated the city polygon area (km2), and measured the shortest distance (km) of the city polygon margin that lies closest to the nearest volcano. To calculate the total population of the city, we extracted the 2020 population from Global Human Settlement Layer – Population (GHS-POP; Schiavina et al., 2023b) 100 m population rasters within each of the city polygons using the exactextract function in R (Levine, 2022). This population dataset is in the EPSG:54009 projection, and we did not re-project it.
Table 1The results collated in this study are set out in a dataset with the columns named as in this table. One row represents one city.
2.2 Ranking cities
Using the volcano location coordinates as the centroids, we created 10, 30, and 100 km radial buffers around each volcano, as these are commonly used to assess volcanic exposure based on typical maximum distances of primary volcanic hazards (Ewert, 2007; Brown et al., 2015; Biass et al., 2024). From here on, these will be referred to as volcano buffers.
We clipped the city polygons by each of the three 10, 30, and 100 km radial volcano buffers and merged these together to create a map of the city classified by the distance to a volcano. This means that parts of the city, or specific proportions, fall into one of the distance categories: < 10, 10–30, 30–100, or > 100 km from a volcano. We extracted the population using the method shown in Sect. 2.1, and where the volcano buffer partially covers a population raster pixel, this function extracts the population number based on the proportion of pixels covered. We then merged and pivoted the dataset so that it resulted in the population in each volcano buffer for each city (Table 1). For each volcano buffer, we ranked the cities by the total populations exposed.
We also ranked cities by how many volcanoes each one's population is exposed to. We overlaid the 100 km volcano buffers and calculated the number of buffers that were in contact with each city polygon. By intersecting the overlaid buffers with the city polygons, we created a map where the areas within the city are classified by the number of volcanoes they are exposed to. From this map, we then extracted the population, so that, for each city, the numbers of people exposed to the numbers of volcanoes is known (Table 1). This was repeated for the 30 and 10 km volcano buffers. In separate columns we entered the maximum number of volcanoes that the city is exposed to (within 100 km) and ranked the cities by this number. This means that the maximum number of volcanoes the city is exposed to relates to the total number of 100 km volcano buffers in contact with the city polygon.
Finally, we calculated a composite ranking for each city, summing the three rankings of distance to the nearest volcano, population < 100 km, and number of volcanoes < 100 km and dividing by three to create a final ranking of cities. This assumes the same weighting for each ranking.
2.3 Ranking volcanoes
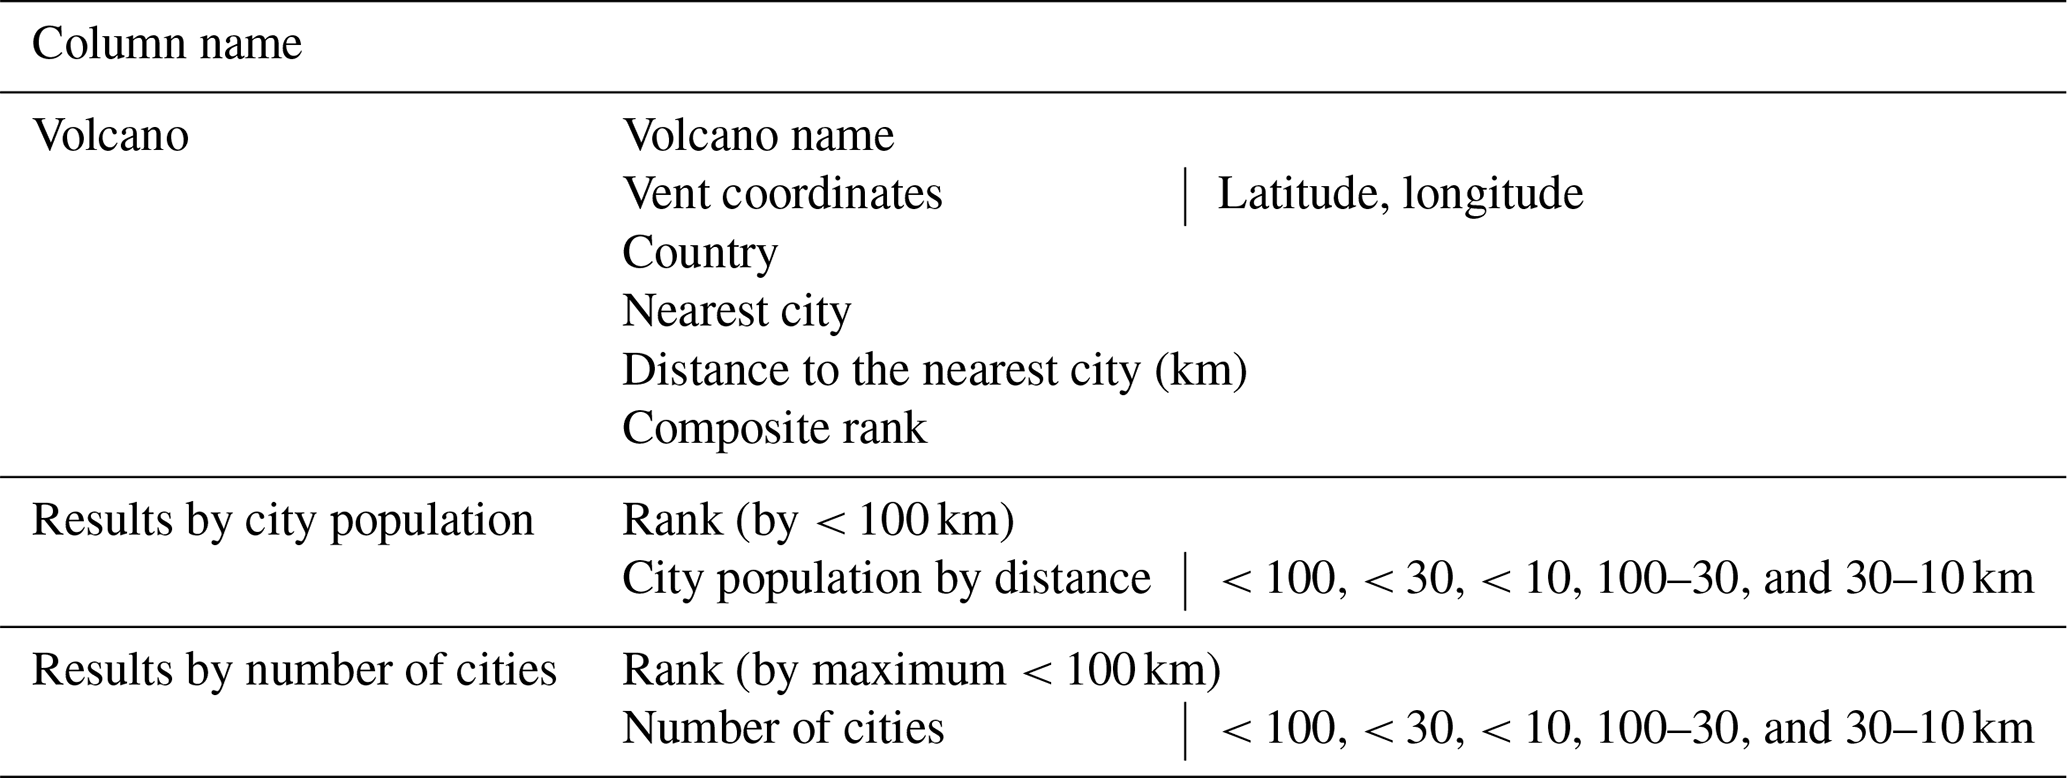
In a separate dataset shown in Table 2, for each volcano, we recorded the volcano name, vent coordinates, and country from the Global Volcanism Program (2024) Holocene Volcano List. We also calculated the distance of the vent location to the nearest city polygon. For each volcano buffer of each volcano, we calculated the total populations located within each volcano buffer and city polygons using the extraction method detailed in Sect. 2.1. We then ranked the volcanoes by the total city populations within 100 km of the volcano. We also calculated the total number of city polygons within each volcano buffer for each volcano and ranked the volcanoes by the total number of cities within 100 km of a volcano. Finally, we calculated a composite ranking for each volcano, summing the three rankings of total population < 100 km, number of cities < 100 km, and distance to the nearest city and dividing by three to create a final ranking of the volcanoes. This assumes the same weighting for each ranking.
Table 2The results collated in this study are set out in a dataset with the columns named as in this table. One row represents one city.
We present our results in two parts. Firstly, we present the rankings for cities and volcanoes within each of the 10, 30, and 100 km volcano buffers, and secondly, we present the regional trends in the city exposure. Cities were ranked based on (a) the total city population exposed to one or more volcanoes, (b) the number of volcanoes the city is exposed to, and (c) the distance to the nearest volcano. Volcanoes were ranked based on (a) the total exposed city population, (b) the number of cities exposed, and (c) the distance to the nearest city. Here, we define an exposed city population as the population of cities located within 100 km of a volcano. In the following section, we explore the quantification and ranking of these city populations and volcanoes, detailing spatial trends in city exposure. We also explore regional trends in city exposures. The results for all of our exposure analyses are presented in the Data availability section.
3.1 Quantifying and ranking city exposure to volcanoes
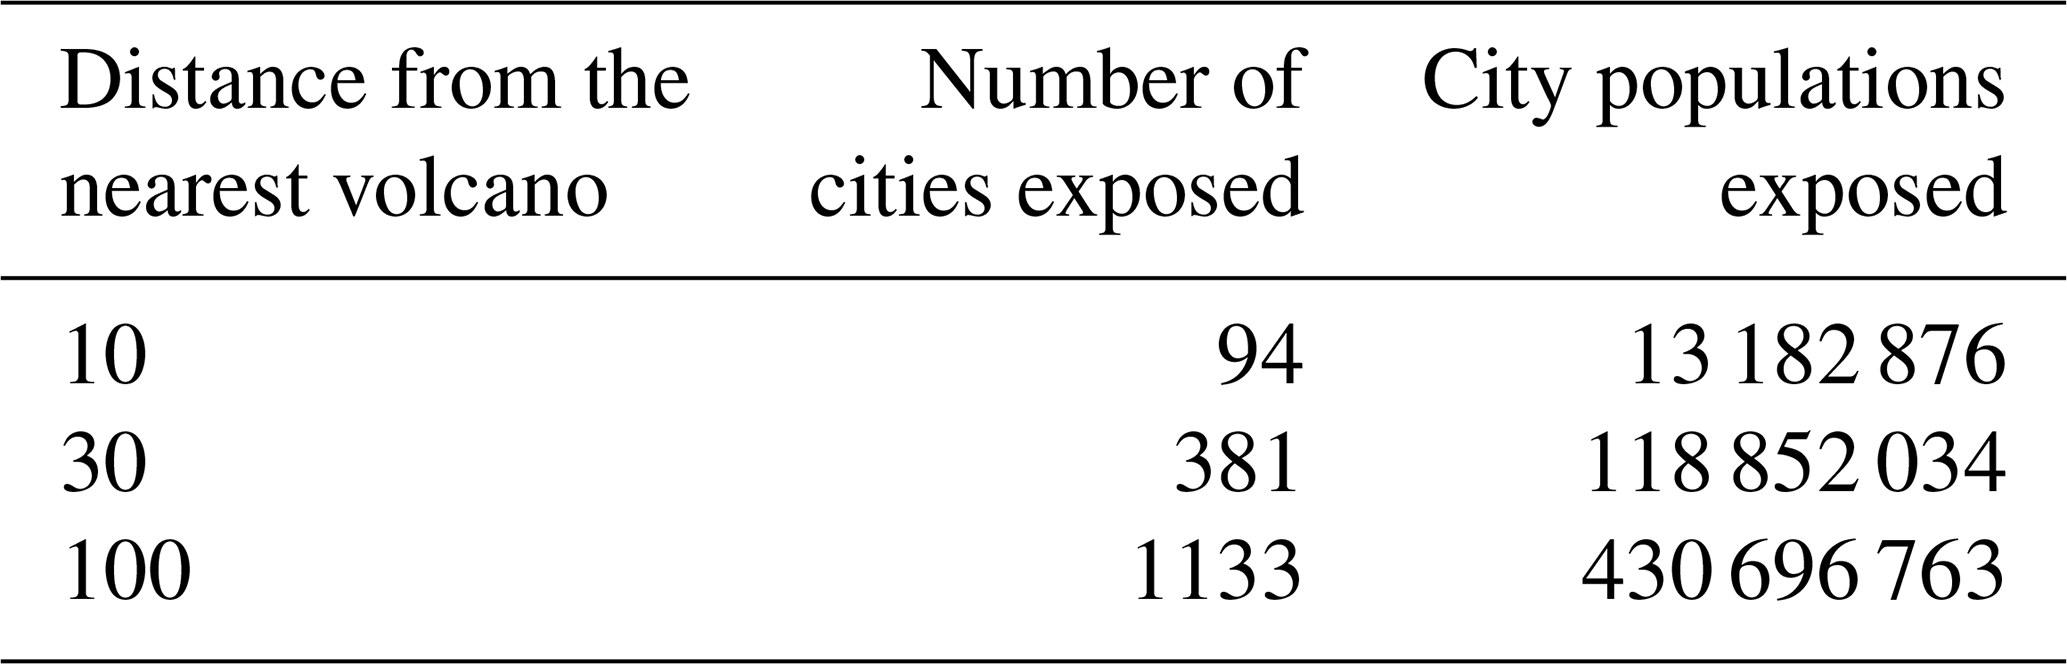
Globally, 1133 cities have some proportion of their populations living within 100 km of at least one volcano active in the Holocene (Table 3). Within these cities, ∼ 431 million people are exposed within 100 km of volcanoes (Table 3), representing ∼ 50 % of the total population exposed within 100 km (n = 852 989 097) and ∼ 21 % of the total population of cities globally (n = 2 022 199 789). For each city, the exposed population varies from 4 people in Hamamatsu, Japan, to ∼ 38.1 million people in Jakarta.
Table 3The total number of cities with some proportion of their area within the three volcano buffer distances of at least one volcano, together with the city populations exposed to volcanoes within each volcano buffer size used in our study.
The greatest number of cities and populations exposed are in Indonesia (see Fig. A1 in Appendix A). The top five cities with the most people living within 100 km of at least one volcano are Jakarta, Indonesia; Tokyo, Japan; Manila, Philippines; Mexico City, Mexico; and Seoul, South Korea (Fig. 4). For these cities, almost the entire populations are exposed to at least one volcano (Jakarta: Salak and Perbakti-Gagak; Manila: San Pablo Volcanic Field and Taal; Mexico City: Iztaccihuatl, Chichinautzin Volcanic Field, and Popocatepetl), except for Tokyo and Seoul, where parts of the cities are not exposed to any volcanoes (farther than 100 km; see Fig. A3 in Appendix A). These top five cities represent ∼ 28 % (∼ 121 million) of the total exposed city populations (∼ 431 million), with over 677 000 people within 10 km of a volcano. For the other exposed cities, exposed populations decrease gradually as rank increases (Fig. 4; Fig. A2 in Appendix A). When combining rankings of the number of people within 100 km, the number of volcanoes within 100 km, and the distance to the nearest volcano, Bandung is the highest ranked city (Fig. 3).
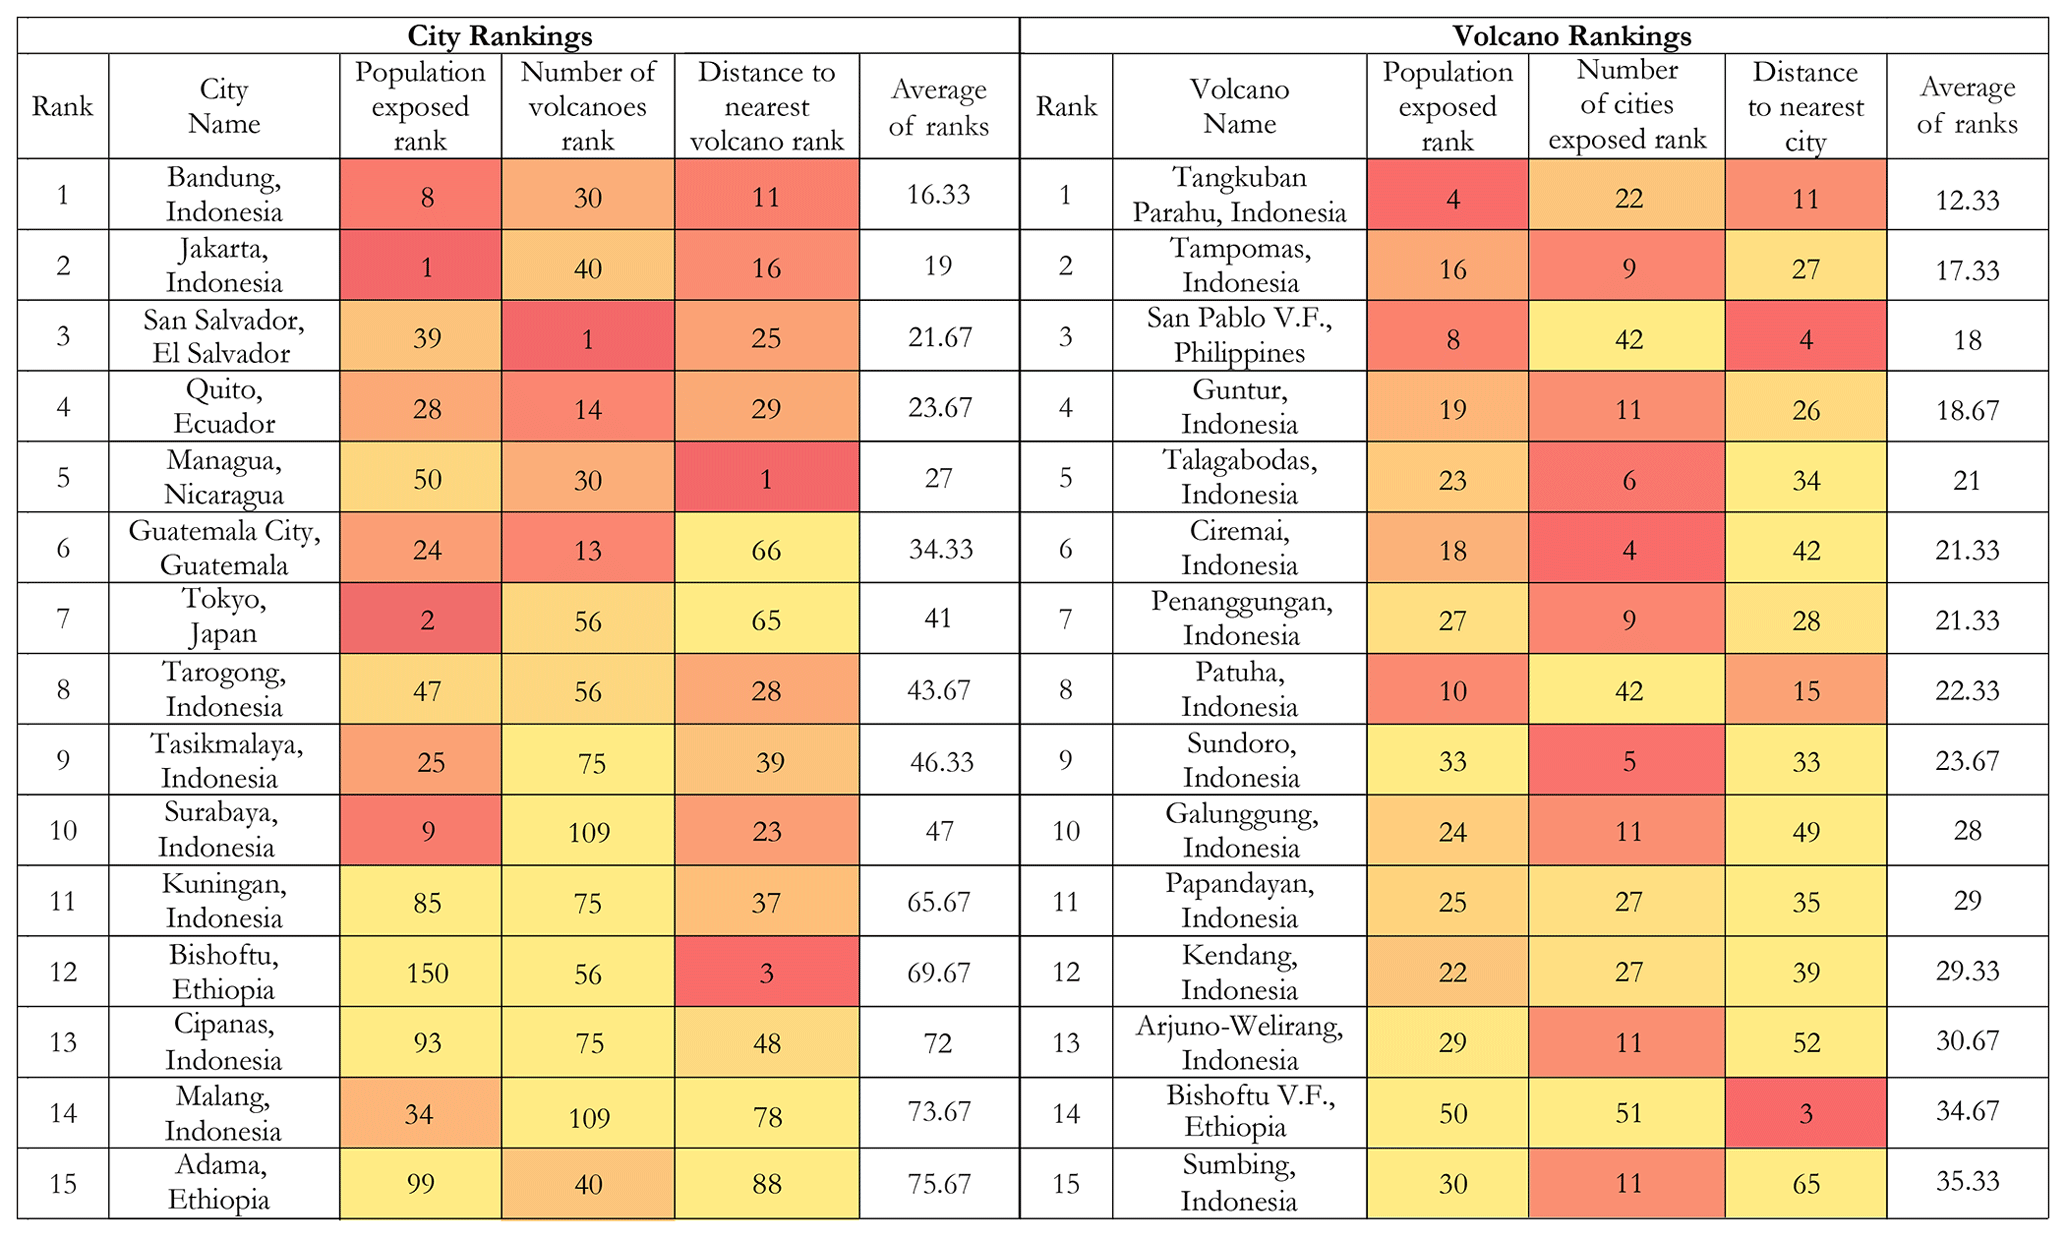
Figure 3Top 15 composite rankings of city exposure to volcanic hazards and their scores within the different ranks. For cities, these are based on three different ranks: (a) the total city population exposed to one or more volcanoes within 100 km of volcanoes, (b) the number of volcanoes the city is exposed to, and (c) the distance to the nearest volcano. For volcanoes, these rankings are based on three different ranks: (a) the total exposed city population within 100 km, (b) the number of cities exposed, and (c) the distance of the volcano to the nearest city. The cells are coloured by the ranking position within the column, with darker red as a higher ranking. The cities and volcanoes are ordered by the average of three rankings. V.F. stands for Volcanic Field.
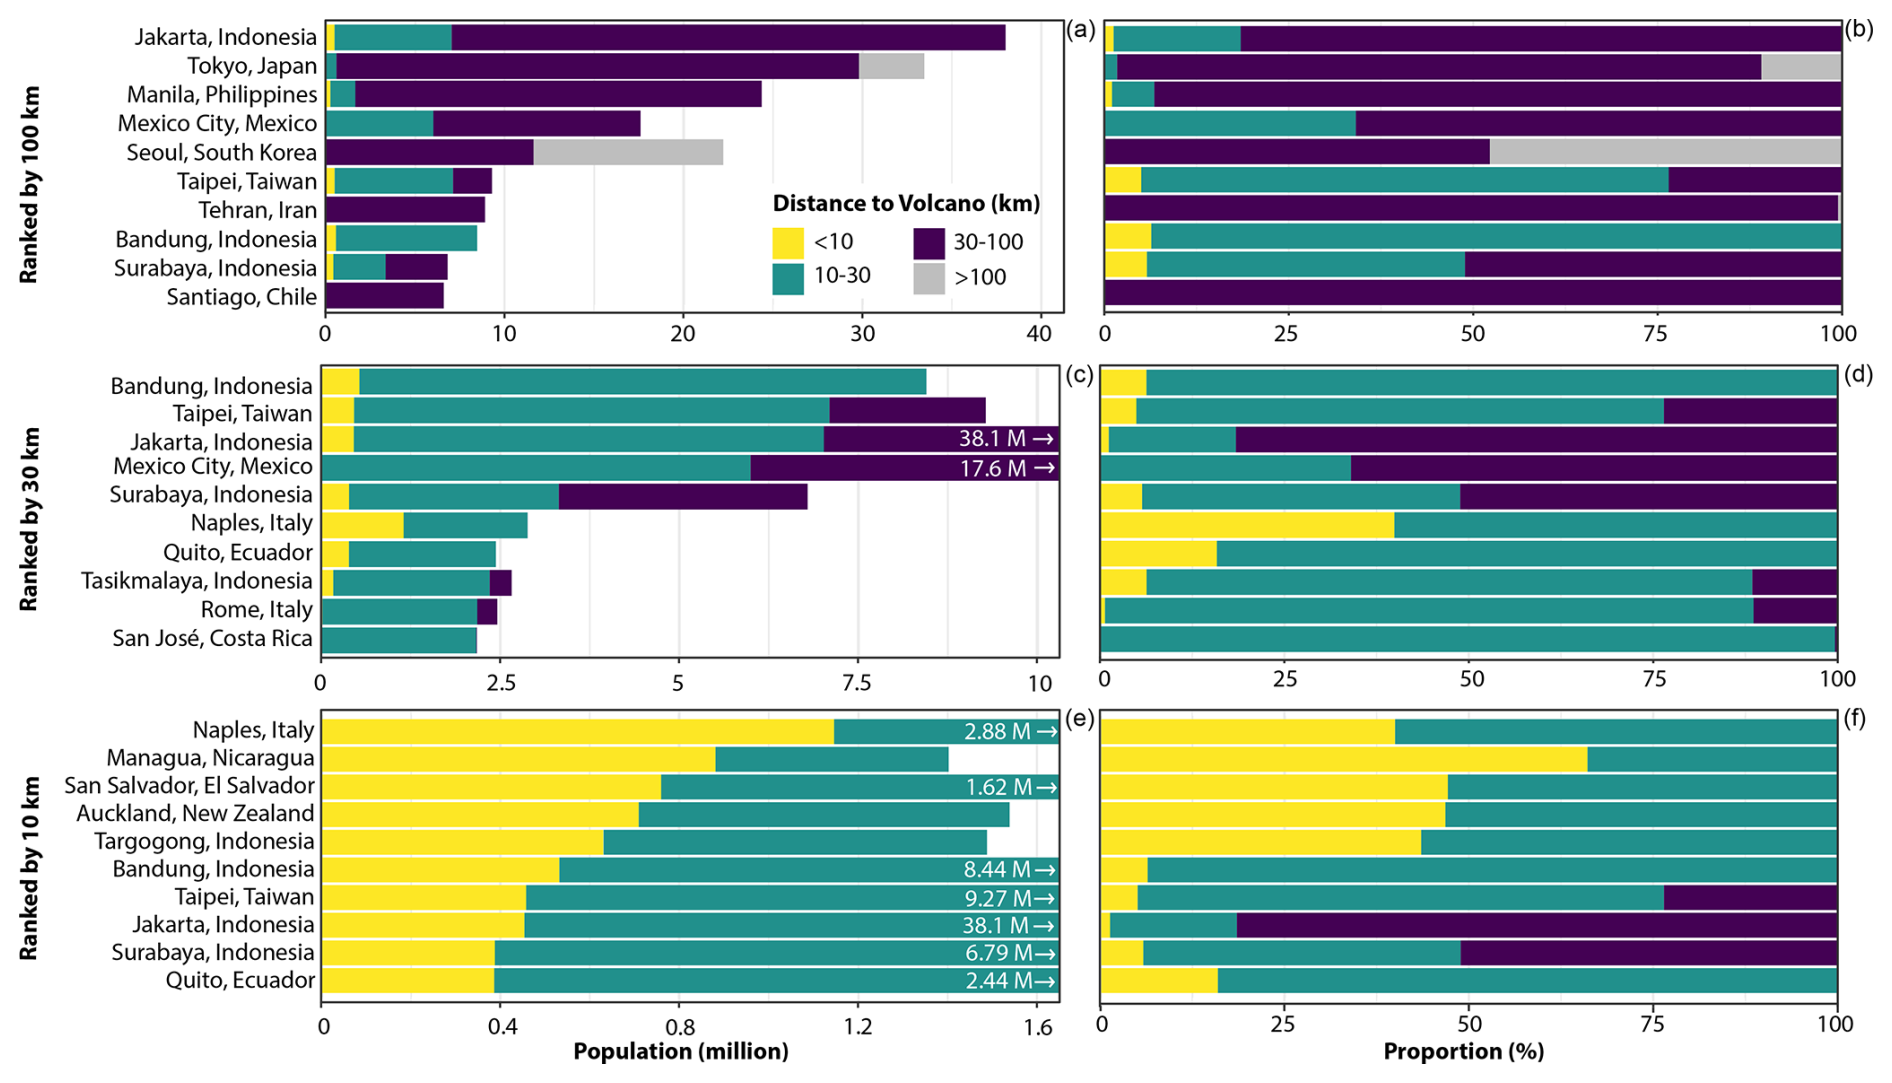
Figure 4Horizontal stacked bar charts of the city population (a, c, e) and proportion (b, d, f) of each city classified by the distance of the city margin to the nearest volcano (within <10, 10–30, and 30–100 km distances from volcanoes) and ranked by 100, 30, and 10 km radial buffers. Each bar represents a city exposed to volcanoes, and the x-axis limits (a, c, e) reflect the population range for that volcano buffer.
As the spatial distribution of populations varies across cities, we found that some of the highly ranked cities have proportions of their populations located more than 100 km from volcanoes (e.g. Tokyo in Japan, Seoul in South Korea, and Tehran in Iran), while others have high proportions of their populations located very close to volcanoes. Notably, for the 30 km volcano buffer, the entire population of Bandung, Indonesia (n = 8 443 660), and Quito, Ecuador (n = 2 435 784), resides within 30 km of at least one volcano. The top five cities ranked by people living within 100 km of volcanoes have relatively low proportions of their populations within 30 km (∼ 11 %), with most (∼ 78 %) living between 30 and 100 km. As a result, for rankings at smaller volcano buffer distances, these cities drop down to lower rankings (Fig. 4). However, Jakarta and Bandung feature in the top 10 ranked cities for exposed populations within all three volcano buffer distances and have the highest number of people exposed to at least one volcano within 100 km (n = 46 494 144) and 30 km (n = 15 456 793). The top two ranked cities for the 10 km volcano buffer, Naples (Italy) and Managua (Nicaragua) combined, have a smaller total population than Jakarta; however, they have 40 % and 66 % of their city populations living within 10 km of volcanoes compared to the 1 % of Jakarta (Fig. 4). Thus, cities may have low total populations but have high proportions of their populations living in close proximity to nearby volcanoes.
Figure 4 shows city rankings of populations by distances to their nearest volcanoes, with 94 cities having their city margins within 10 km of a volcano. However, ∼ 61 % of cities with populations within 100 km of volcanoes (n = 695) are exposed to more than one volcano. Figure 5 presents the top 20 ranking of cities by exposed populations, classified by the number of volcanoes the city is exposed to. Figure 5 shows that portions of the populations of Tokyo (Japan), Seoul (South Korea), and Nagoya (Japan) are not exposed to any volcanoes, but these cities still rank within the top 20 exposed cities. Interestingly, not all of the largest exposed populations are exposed to multiple volcanoes, such as Seoul (South Korea), Tehran (Iran), Barcelona (Spain), Antananarivo (Madagascar), and Athens (Greece), which have populations exposed to only one volcano. The top four cities with exposed populations have much larger populations compared to the others, with millions more residents. In contrast, the differences in exposed populations among the remaining cities exhibit a more gradual increase, illustrated in Fig. 5 and, for mid-sized cities (populations under 1 million), in the Appendix (Fig. A2).
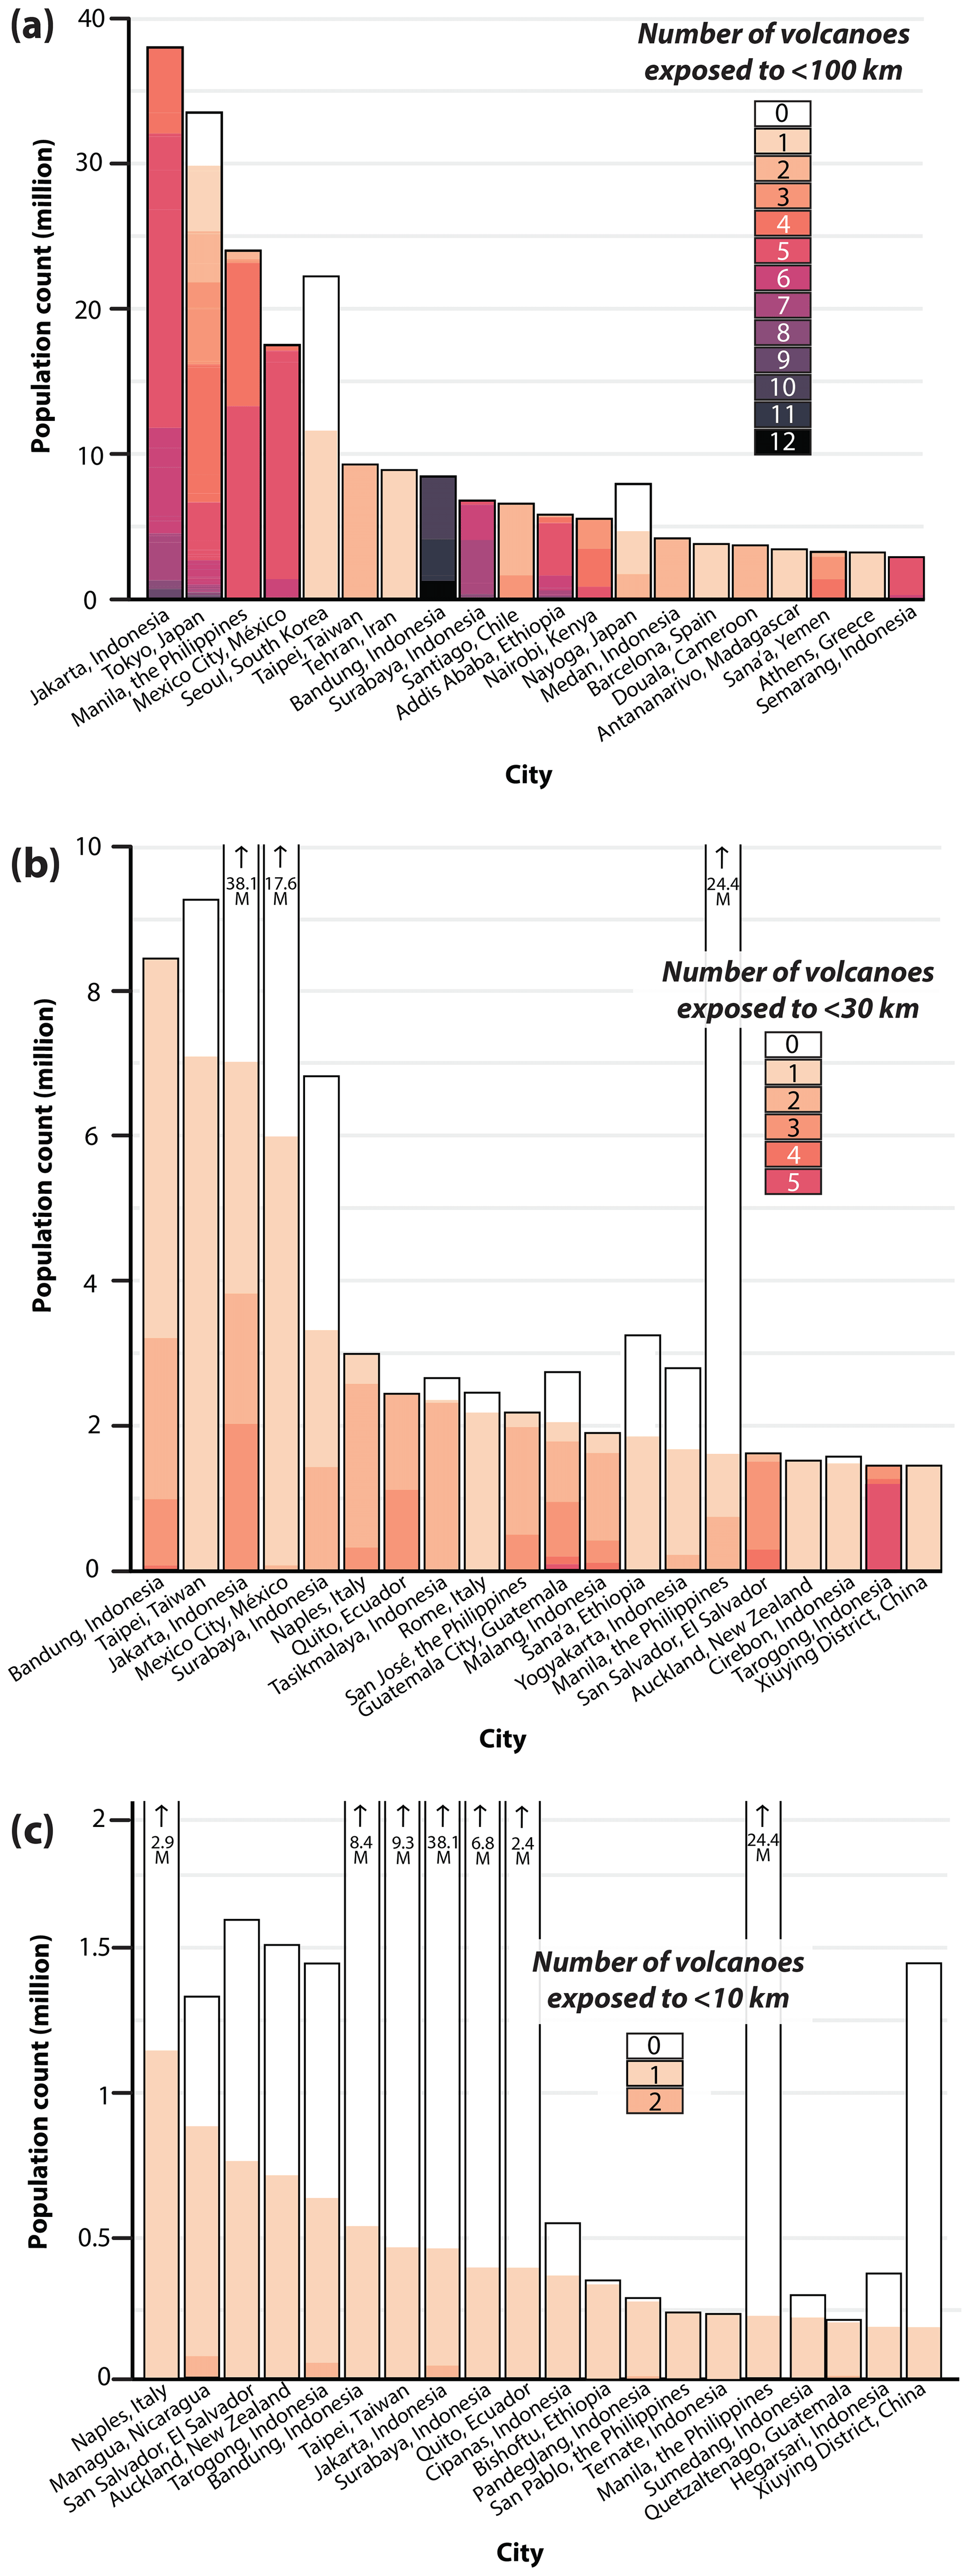
Figure 5Stacked bar charts of city population exposure for the top 20 cities coloured by the number of volcanoes the populations are exposed to for (a) 100 km, (b) 30 km, and (c) 10 km volcano buffers.
Most of the cities exposed to multiple volcanoes are in Central America. The population in Quezaltepeque (El Salvador) is exposed to the highest number of volcanoes (n = 23), and San Salvador (El Salvador) is a city with > 1 million people exposed to the highest number of volcanoes (n = 23) (Fig. 6). Although San Salvador is ranked 39th by population within 100 km, it is third in the composite ranking behind Bandung and Jakarta, due to its high ranking of the number of volcanoes (Fig. 3). Despite this proximity of cities to multiple volcanoes, this is the same ranking of top 10 cities when ranked by the people exposed to the nearest volcano and those exposed to at least one volcano. Bandung ranks highly for both the maximum number of volcanoes to which the city is exposed and the number of people exposed, with exposed populations within 100 km of between 9 and 12 volcanoes, with the most, ∼ 4 million, exposed to 10 volcanoes (Fig. 6).
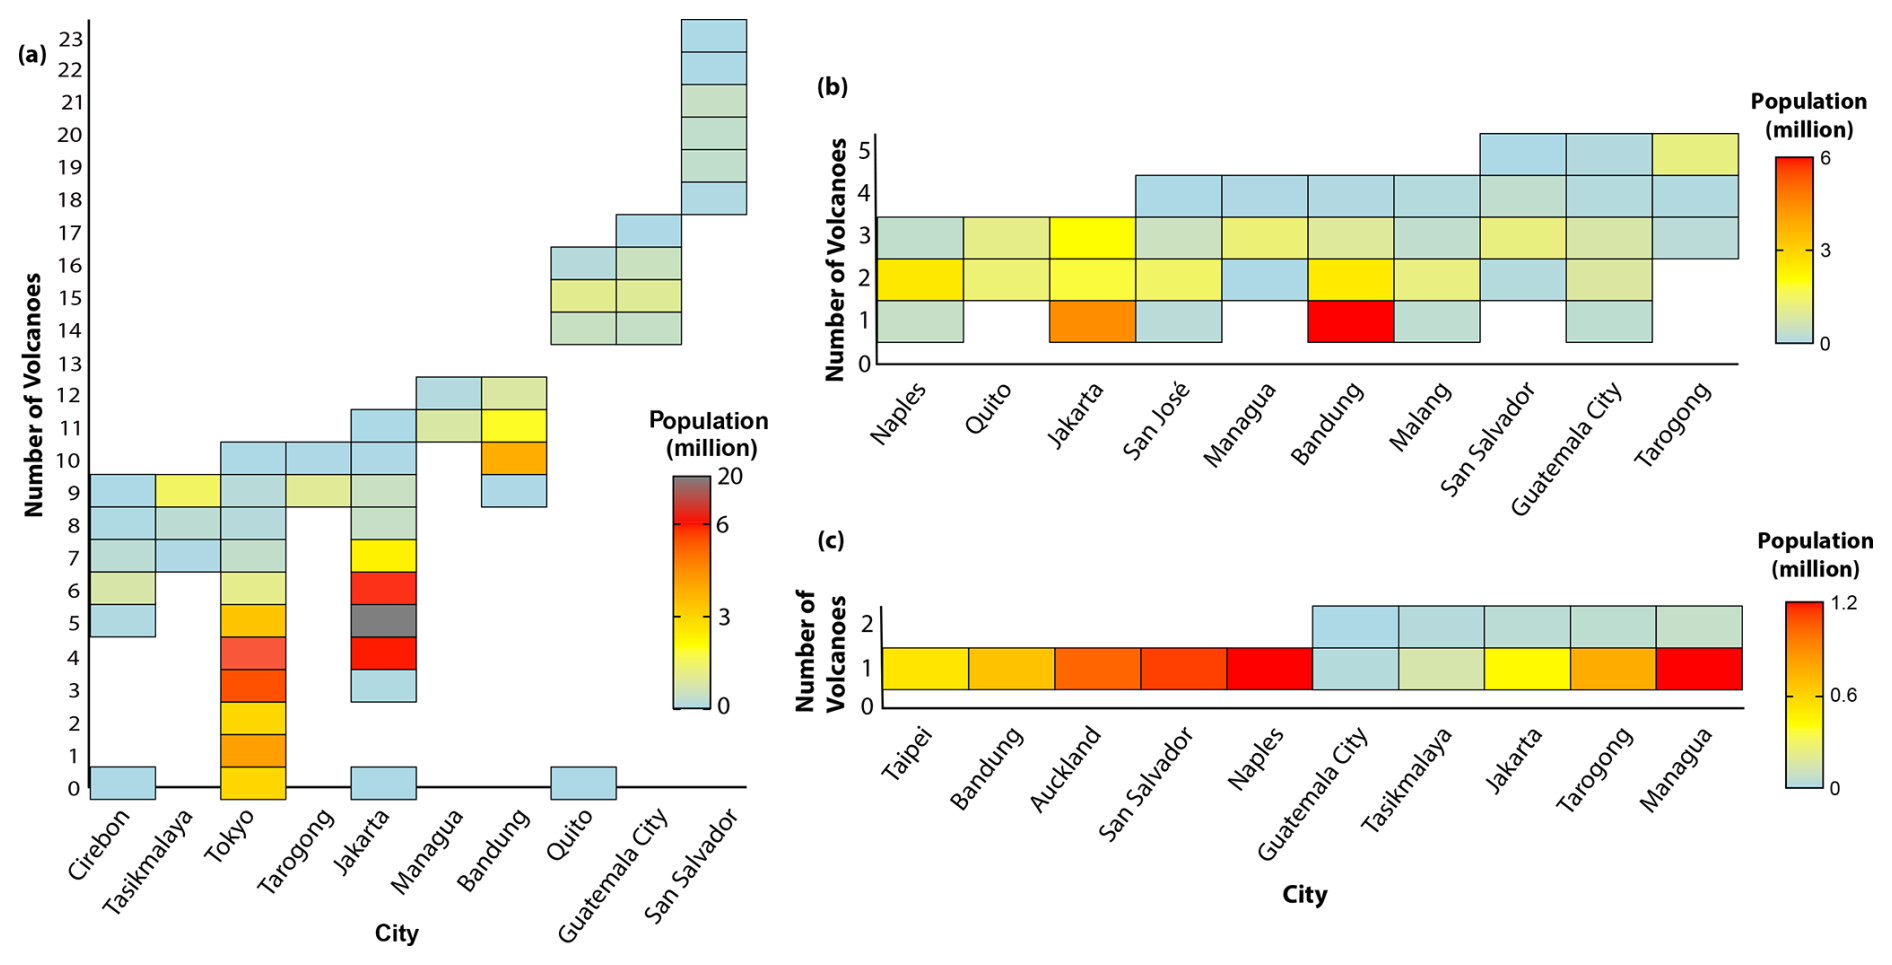
Figure 6Heatmap for the top 10 cities with total populations of over 1 million ranked by exposure to number of volcanoes, showing the city population exposed to increasing numbers of volcanoes for (a) 100 km, (b) 30 km, and (c) 10 km volcano buffers.
3.2 Ranking volcanoes by city exposure
Almost 46 % of Holocene volcanoes (n = 578) have city populations located within 100 km of their assumed vents. Indonesia dominates the rankings for city populations within 100 km of volcanoes. Six, 8, and 3 of the top 10 volcanoes within the 100, 30, and 10 km buffers, respectively, are in Indonesia. Of the 578 volcanoes close to city populations, Gede-Pangrango, Salak, and Pebakti-Gagak, all located in Indonesia, rank highest in terms of city population exposure within 100 km (Fig. 7), including the entire population of Jakarta for Salak and Gede-Pangrango, as shown in the Appendix (Fig. A3). For the top 10 volcanoes with cities within 100 km, up to 9 % of their populations live within 30 km, with most between 30 and 100 km (Fig. 7). Notably, Gede-Pangrango has the most city populations living within 100 km and Guntur has the largest population within a 10 km distance in Indonesia, reaching the populations of Bandung and Jakarta. Outside of Indonesia, Nejapa-Miraflores, Nicaragua, and the Auckland Volcanic Field have almost 50 % of their city populations nearby, living within 10 km of volcanoes. In fact, the Auckland Volcanic Field and San Salvador have almost complete city population exposure within 30 km of volcanoes, and the entire country of El Salvador is within 30 km of a volcano (Fig. 9).
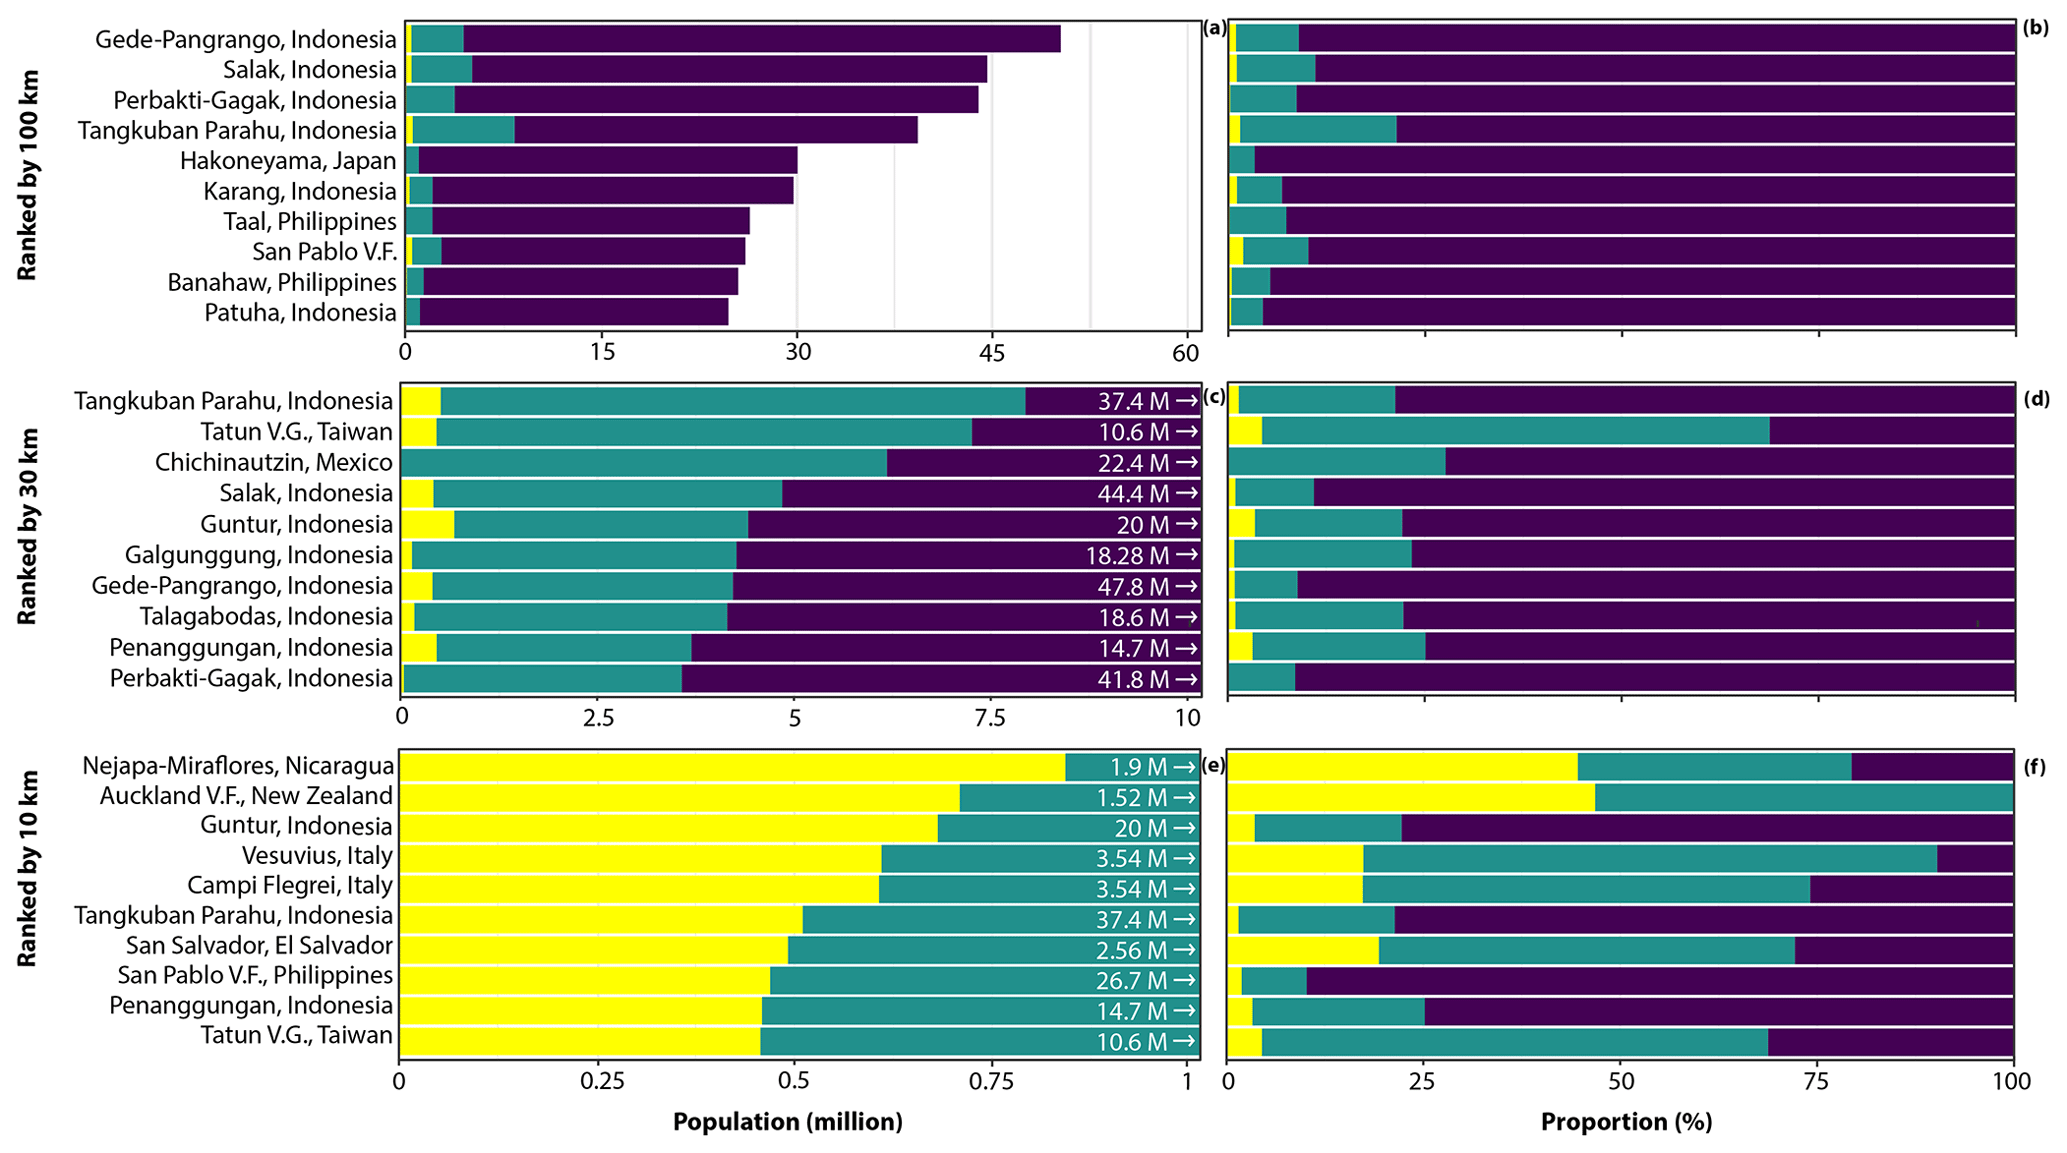
Figure 7Horizontal stacked bar charts of the city population (a, c, e) and proportion (b, d, f) around each volcano, classified by the distance of the city margin to the nearest volcano (within < 10, 10–30, and 30–100 km distances from volcanoes) and ranked by 100, 30, and 10 km radial buffers. Each bar represents a volcano, and the x-axis limits (a, c, e) reflect the population range for that volcano buffer.
In addition to distances, it is also important to consider the number of cities that are close to volcanoes. Ethiopia is noted for its high number (n = 96) of cities close to volcanoes, and the greatest number of cities within the country (n = 18) have the Northern Lake Abaya Volcanic Field as their nearest volcano, as detailed in the Appendix (Fig. A1). Tangkuban Parahu volcano ranks highly across our rankings of the number of people within 100 km, the number of cities, and the distance to the nearest city (Fig. 3).
3.3 Regional trends in city exposure to volcanoes
The largest numbers of people living in cities exposed to at least one volcano are in South-East Asia, with 5 847 751, 52 621 515, and 160 870 875 people, respectively, living within 10, 30, and 100 km of a volcano (Fig. 8a). However, the highest proportion of city populations exposed to volcanoes is in Central America (Fig. 8b), where approximately 57 %, 27 %, and 3 % of city populations are located within 100, 30, and 10 km, respectively, of at least one volcano. Australia and New Zealand and Europe are the subregions where the least number of people are exposed, with 1 660 474 and 22 077 280, respectively, within 100 km. City populations in the subregions of Australia and New Zealand and Europe are also exposed to fewer volcanoes than the other continents, with ∼ 10 % of the populations exposed to one or two volcanoes (Fig. 8b). However, 4 % of the total city population of Australia and New Zealand lies within 10 km of at least one volcano, the highest proportion of any subregion (Fig. 8).
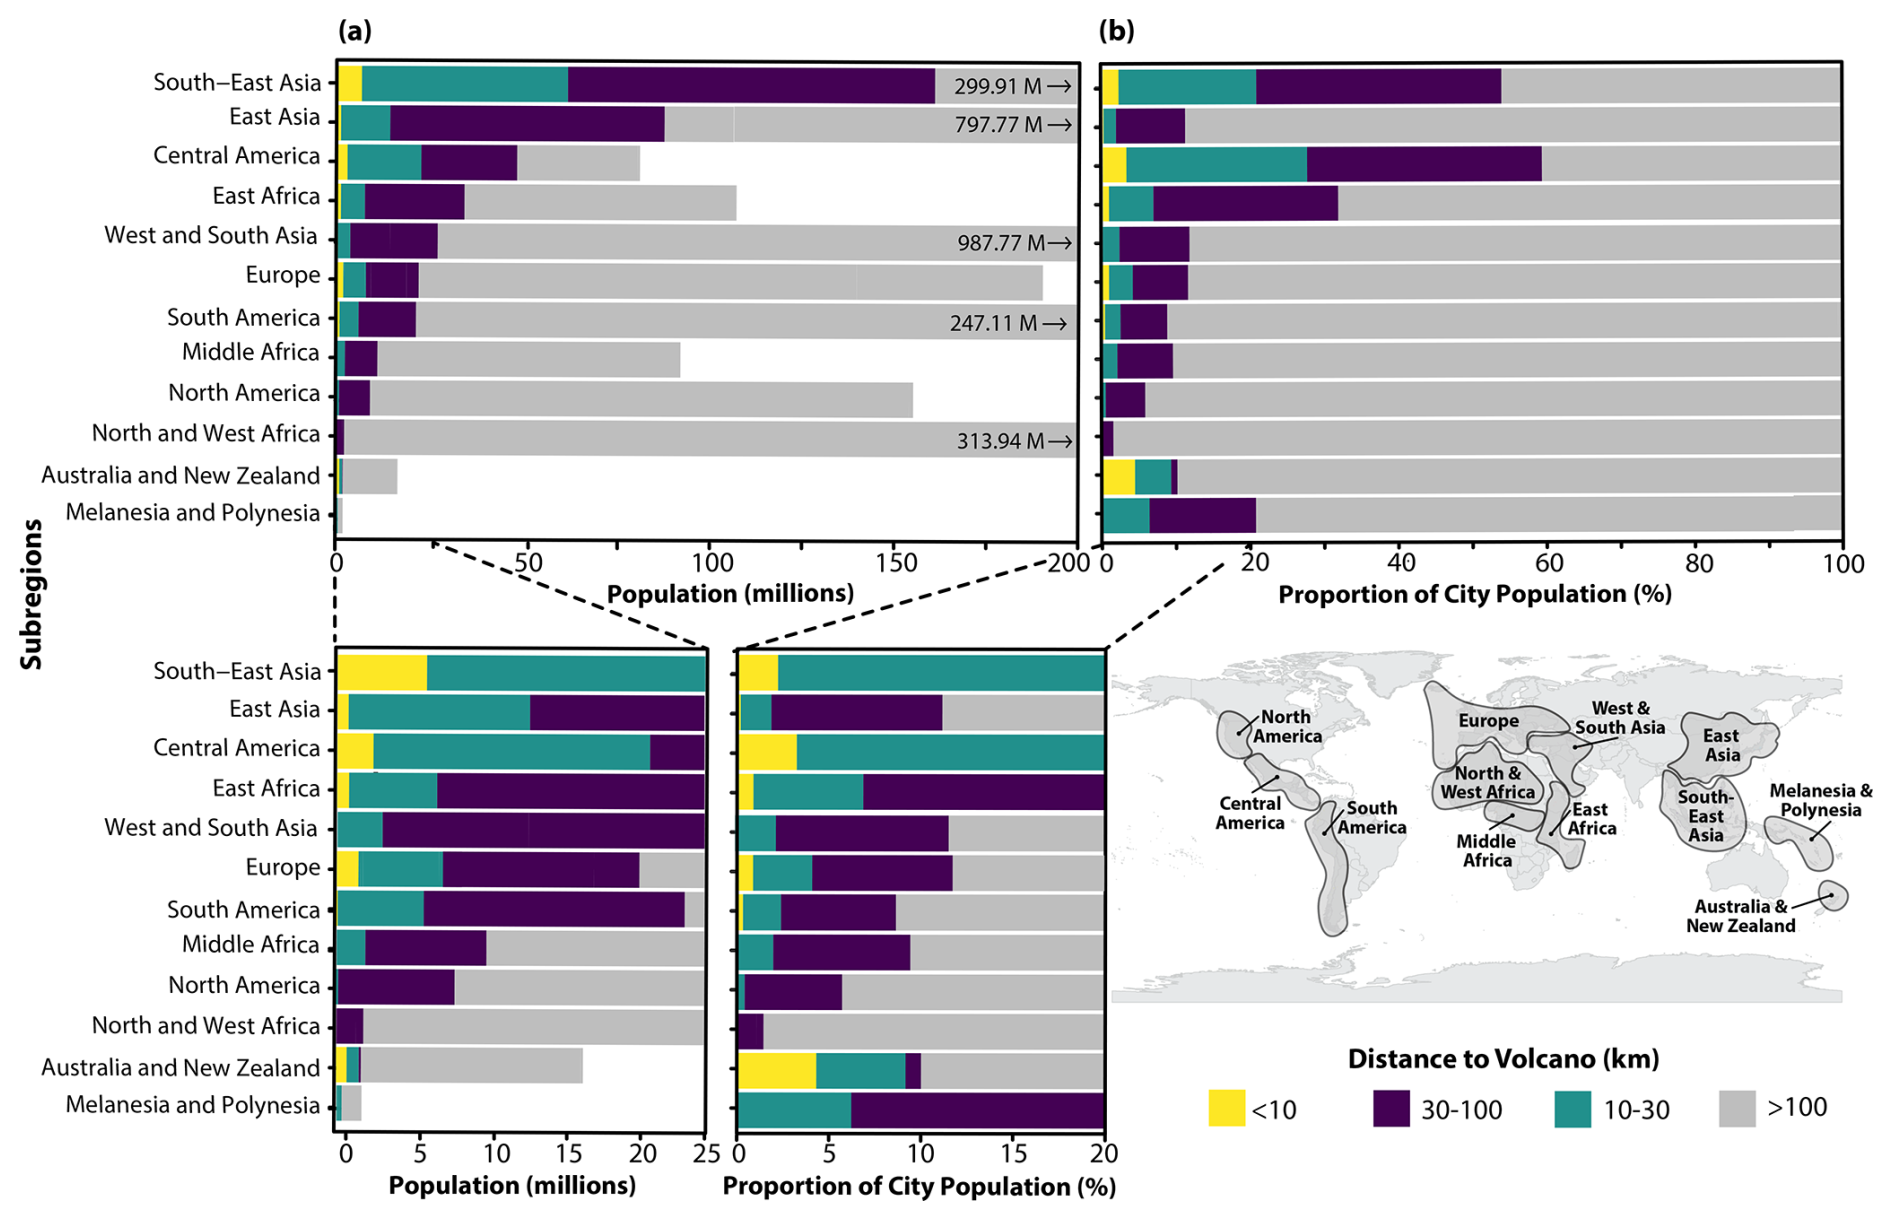
Figure 8The exposed city population (a) and proportion of the total city population (b) split by subregion and classified by the distance of the population to the nearest volcano. The subregions are highlighted on the bottom-right schematic map showing an approximate location of where the cities are located. Note that cities in French Polynesia are included in Melanesia and Polynesia, and Réunion, Martinique, Mayotte, and Kamchatka are included in Europe.
Indonesia stands out globally for having the greatest number of cities and residents located in proximity to volcanoes, with the largest populations within 10, 30, and 100 km of at least one volcano (Fig. 9). Japan ranked second for the 100 km volcano buffer but ranks 6th and 13th for the 30 and 10 km volcano buffers, as a high proportion of the city populations lives within 30 and 100 km of volcanoes. This is also the case for South Korea, Iran, and Chile, with high numbers of people living within 30 and 100 km of volcanoes compared to < 30 km. Meanwhile, the Philippines, ranked third for the 100 km buffer, has a high proportion of its city populations residing within all three distances, meaning that it ranks highly for all three buffer sizes. For the 33 % of city populations exposed in East Africa (Fig. 8), these are dominated by Ethiopia and Yemen (Fig. 9), where the cities are not reflected in the top city rankings of Fig. 4 as their populations are split across multiple smaller cities. Ethiopia has almost 100 cities exposed, and Yemen has almost 60 cities exposed to volcanoes (see Fig. A1 in Appendix A). Remarkably, El Salvador presents a unique case for the top 10 ranked cities, where the entirety of its population lives within 30 km of at least one volcano. Both Nicaragua and El Salvador have over 40 % of their city populations living within 10 km of at least one volcano.
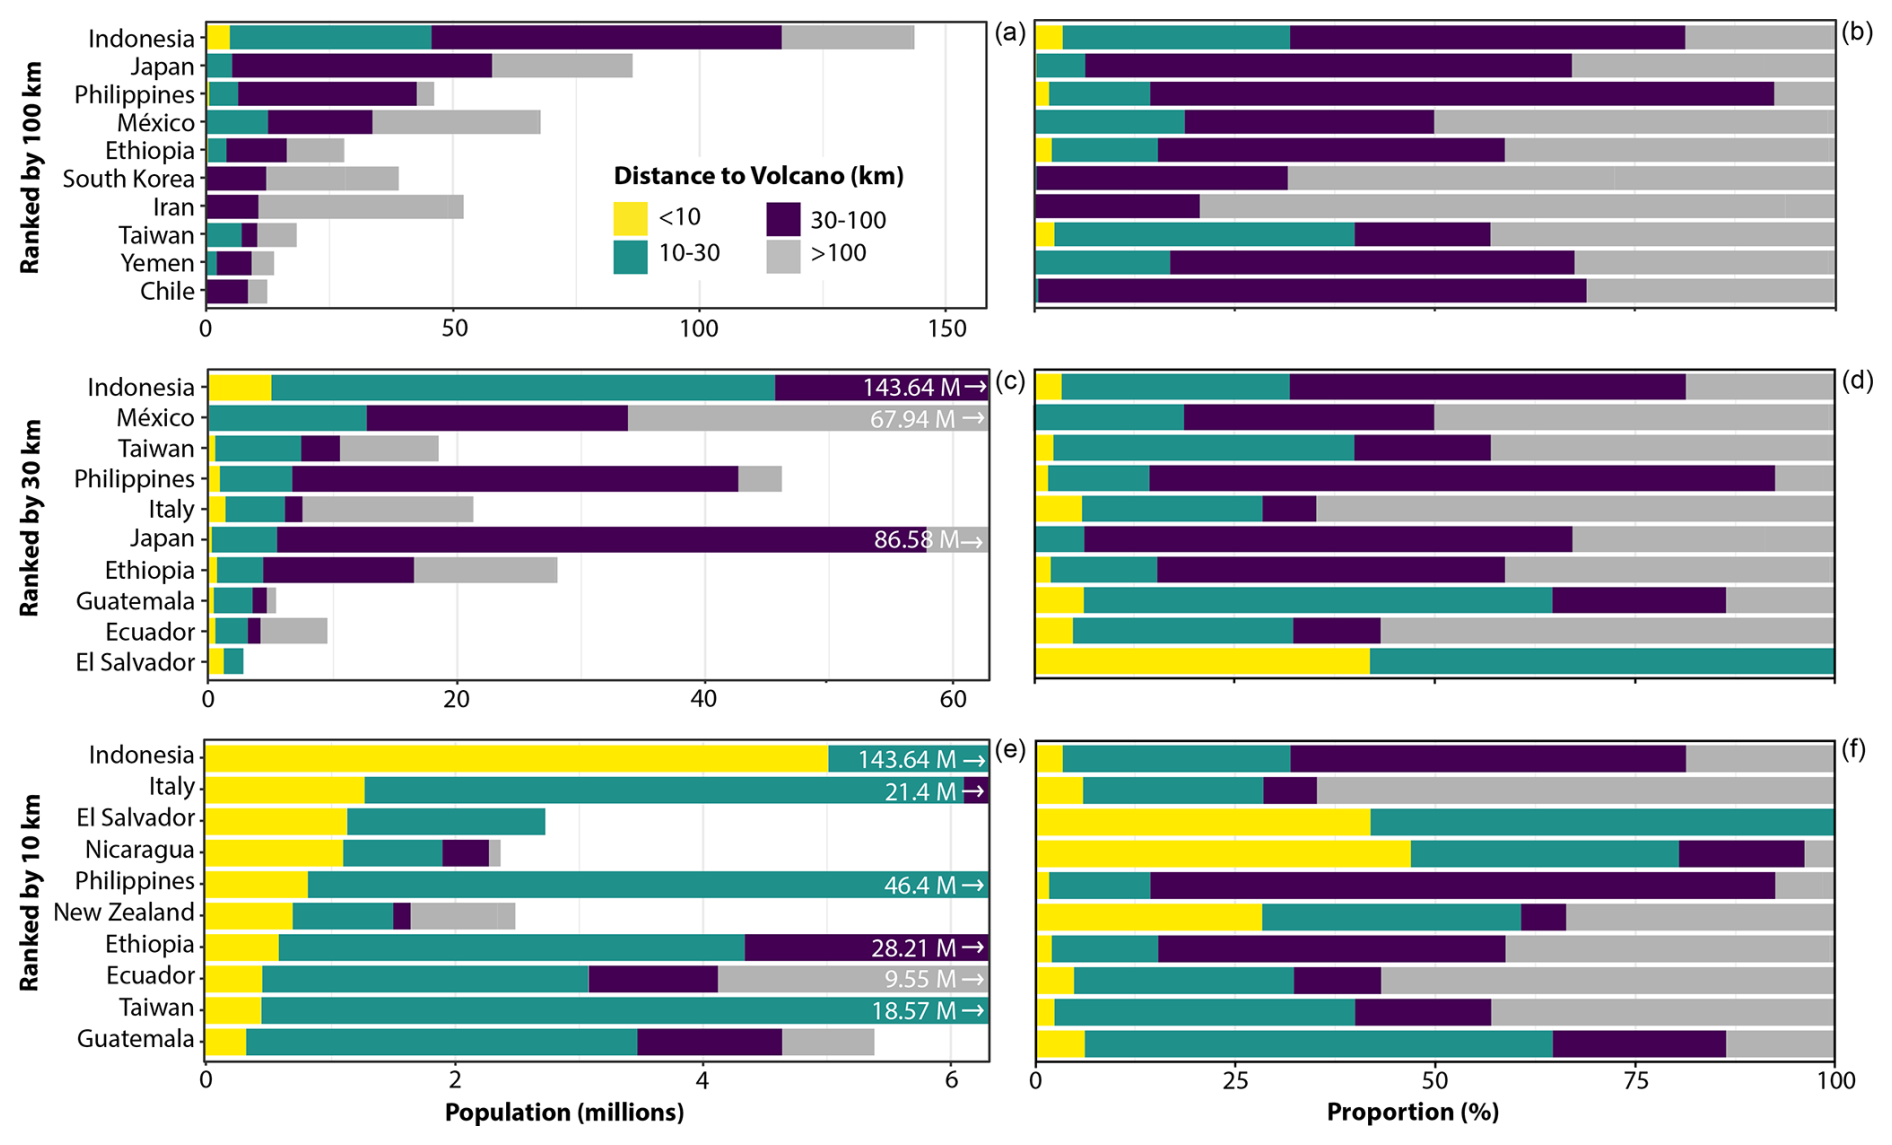
Figure 9Horizontal stacked bar charts of city populations (a, c, e) and the proportion (b, d, f) around each volcano, grouped by country, classified by the distance of the city margin to the nearest volcano (within < 10, 10–30, and 30–100 km distances from volcanoes), and ranked by 100, 30, and 10 km radial buffers. Each bar represents a country, and the x-axis limits (a, c, e) reflect the population range for that volcano buffer.
4.1 City rankings
Our methodology offers a ranking of cities and revised population metrics and distance to the nearest volcanoes, advancing the polar charts of past studies showing the distance, direction, and population of example cities (Auker et al., 2013; Chester et al., 2000). We updated city populations: for instance, while Chester et al. (2000) reported that Manila had a population of 7.94 million and Tokyo had a population of 25 million, our 2020 data were ∼ 16 million and ∼ 5 million higher, respectively. In this study, 575 cities exposed to volcanoes have populations of more than 100 000 people, a substantial increase from the 67 cities documented by Heiken (2013). We identify Jakarta, Tokyo, and Manila as having the highest exposures within 100 km of volcanoes. These large cities have high proportions of people living between 30 and 100 km from the nearest volcano and populations spread across the three volcano buffers (Fig. 4; Table 4), highlighting the potential for variable impacts. Jenkins et al. (2018) also identified these three cities as having the greatest tephra fall hazard and risk in Asia, when wind conditions, eruption characteristics, and tephra transport were accounted for. Jakarta was highlighted in Pelling (2012) and Blaikie et al. (2004) as the largest city exposed to volcanic hazards. However, Heiken (2013) identified Tokyo, Manila, and Mexico City as the only megacities exposed to volcanic hazards. Jakarta was not selected as an example by Heiken (2013), Auker et al. (2013), or Chester et al. (2000). This may be due to potential differences in the criteria used in assessing exposure.
Table 4Cities with populations across three different buffer distances of volcanoes, i.e. 10, 10–30, and 30–100 km, with the city population exposed, area of city polygons, and the averaged population density within each buffer distance. The population, area, and densities in bold font are those higher than the other two buffer distances. The cities are in order of population density < 10 km of volcanoes. Numbers are rounded to the nearest integer.
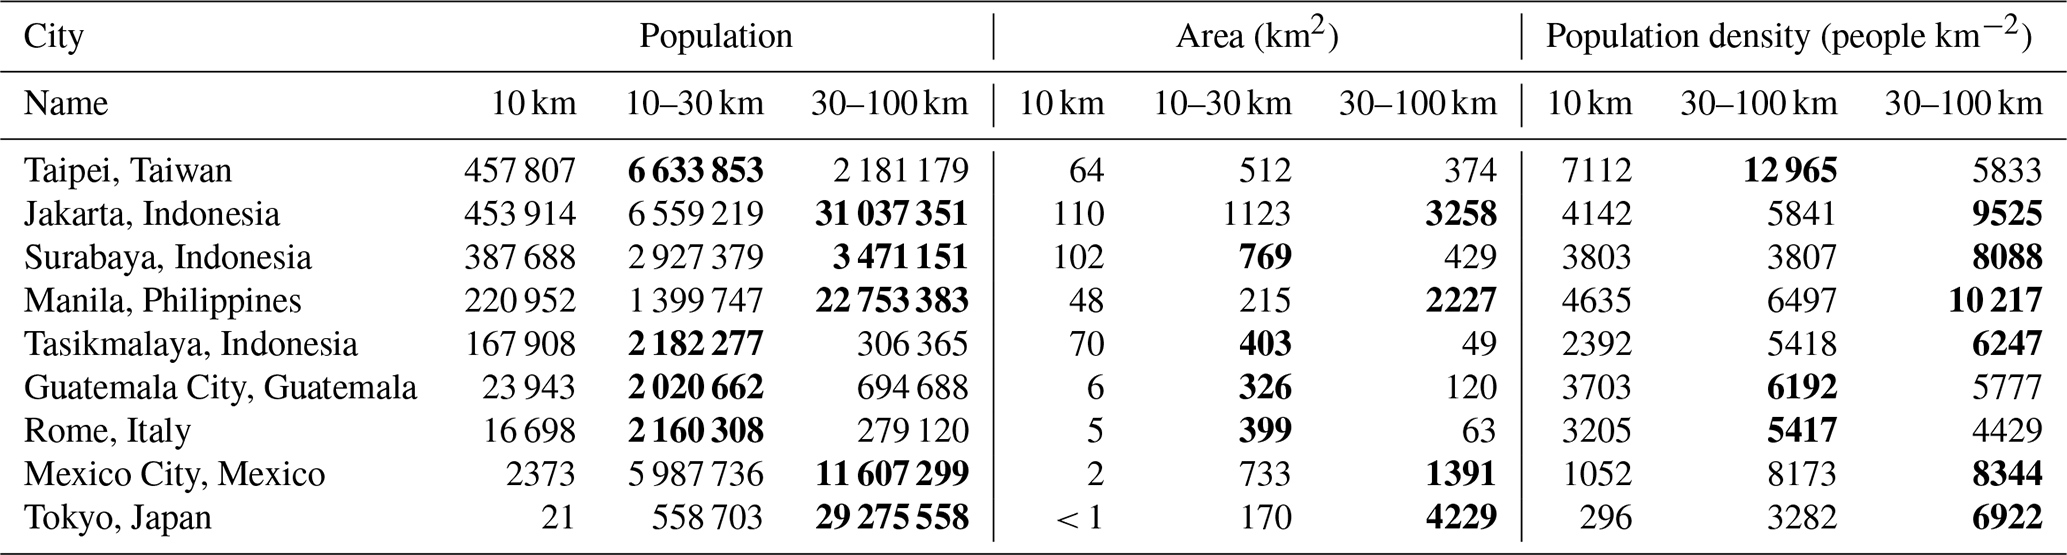
Identifying an exposed city by its centroid alone is not an ideal representation of city exposure as it does not capture the spatial extent (sprawl) of a city or changes in population density across the city. City margins are closer to volcanoes than the centroids (Fig. 10). Some cities have higher population densities closer to volcanoes despite having greater areas of the city farther away (Table 4), suggesting that cities can have higher population densities in the city peripheries away from the city centre. For example, the city centroid of Seoul is located more than 100 km from Mount Baekdu (Changbaishan). However, approximately half of Seoul's city population (n = 11 607 675) and some of the most densely populated parts of the city (∼ 11 362 people per square kilometre) are located within the 100 km volcano buffer (Fig. 10), with the closest margin of the city ∼84 km from the volcano. This is likely due to residential zones being situated farther from the city centre, in areas where population density may increase as cities expand. These close city margins place dense populations very close to potential volcanic hazards. Therefore, our approach better captures the spatial sprawl and variation in population across the cities, which are overlooked by the centroid approach.
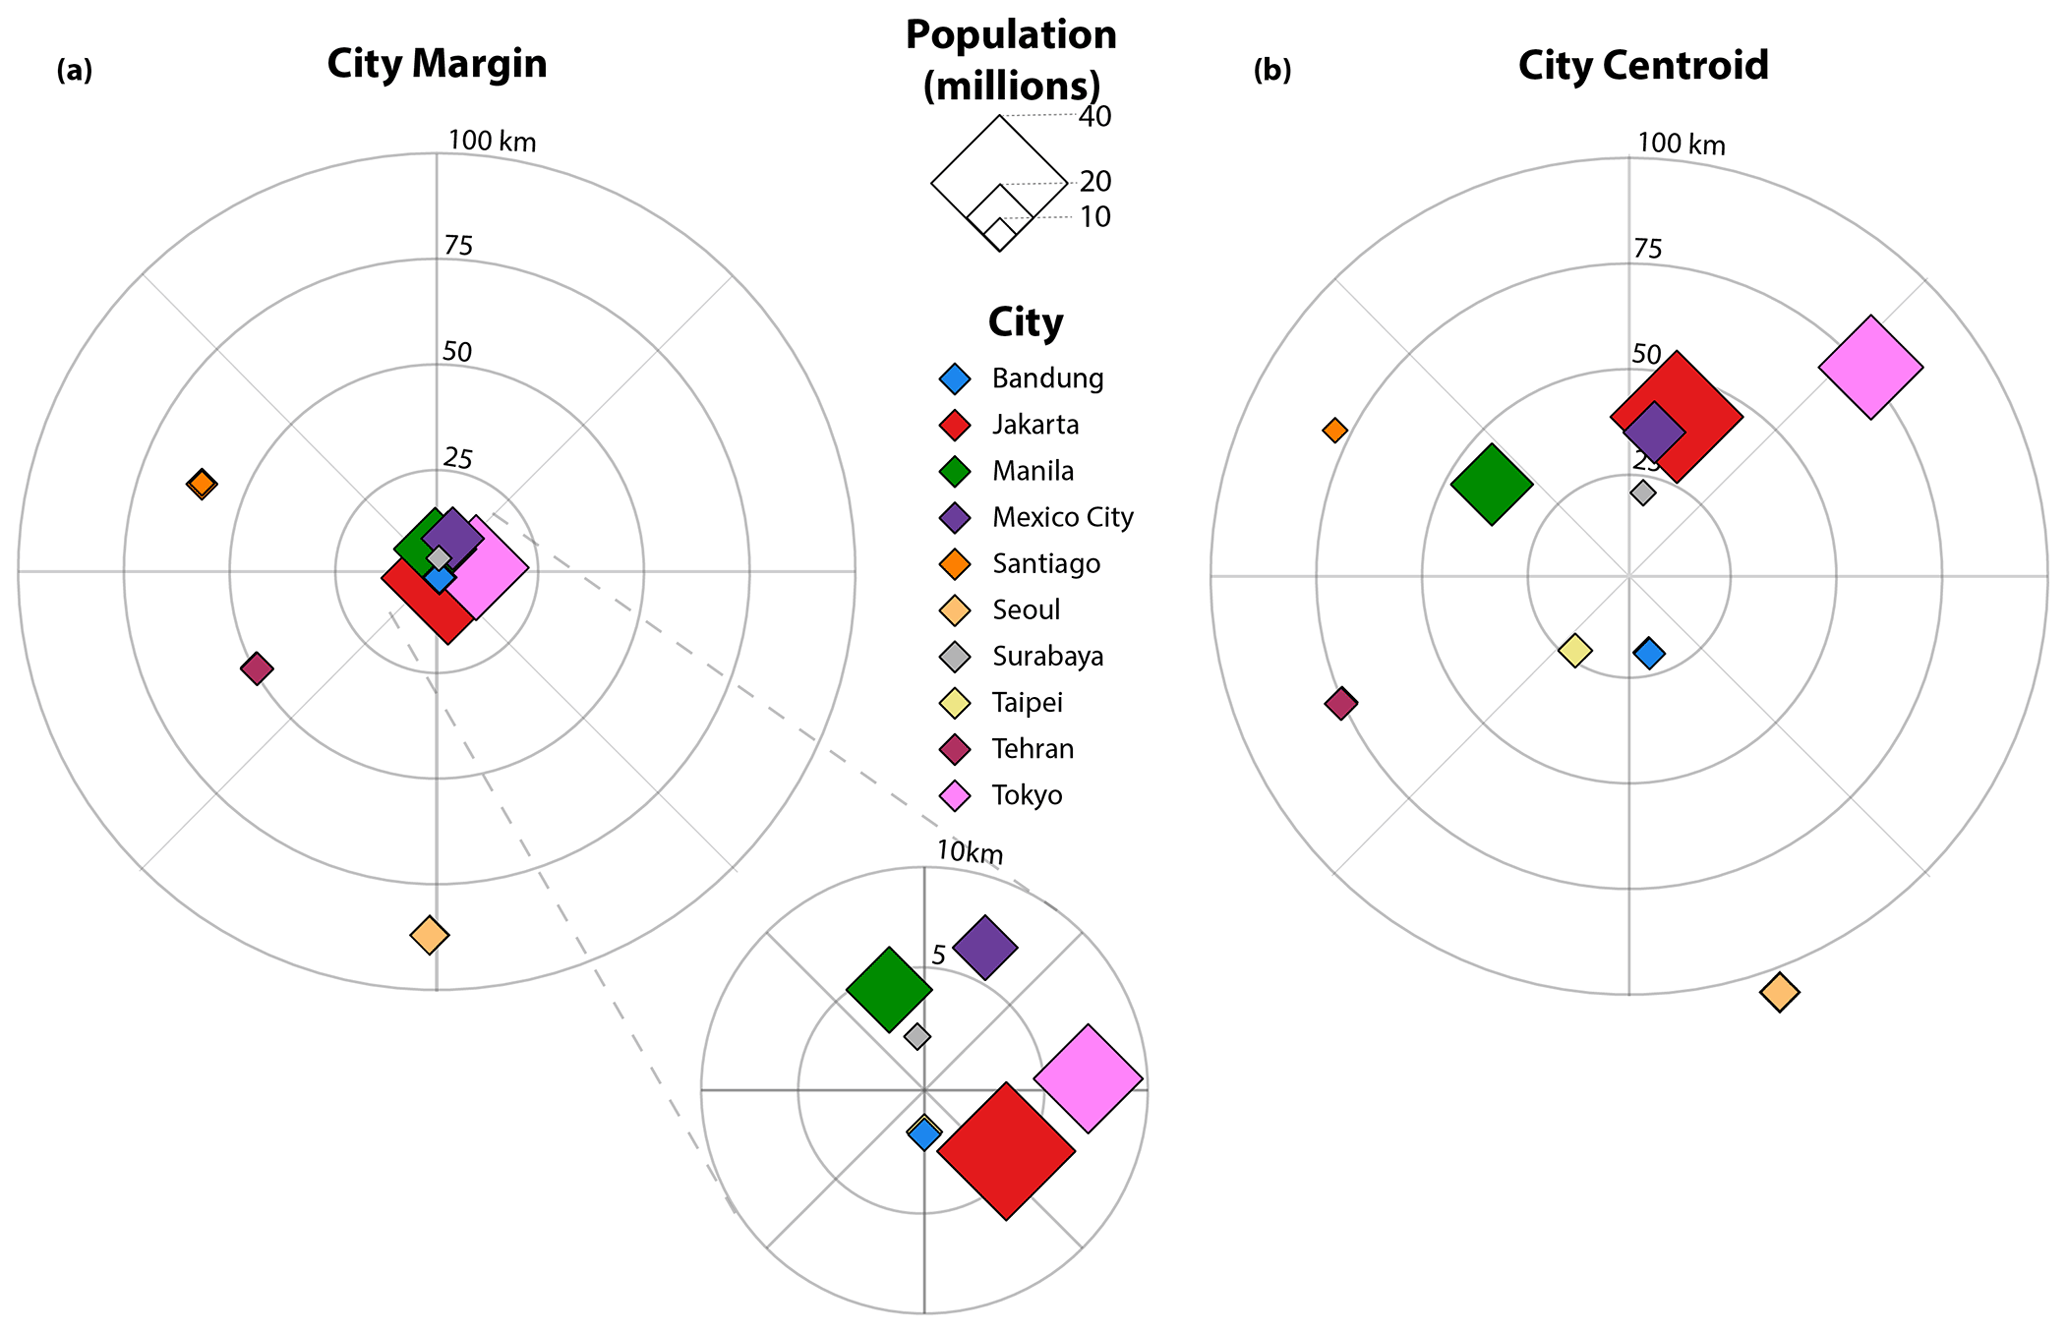
Figure 10Polar chart to show the top 10 cities with the most exposed city populations within 100 km of the nearest volcano. The city centroids (a) and nearest city margin to the volcano (c) are plotted as diamonds relative to the nearest volcano (b), and the diamond size refers to the size of the population exposed. The centroid of Seoul is located outside of the 100 km radial buffer, but the population within 100 km is high enough to rank the city in the top 10 exposed.
In this research we focussed on identifying cities with high populations exposed to volcanic hazards. However, we emphasize the importance of assessing both the total numbers of exposure and the proportions of the city (Fig. 4b), as less populated and smaller cities may have their entire population exposed. While these cities may not rank highly in terms of total population, smaller cities may be more susceptible to complete destruction (Pelling, 2012), whereas an eruption affecting part of a larger city may allow for a greater capacity to recover. Limited resources and less infrastructure in smaller cities may also magnify the impacts of eruptions. Thus, eruptions affecting an entire city potentially cause challenges in terms of evacuation, continuity, and recovery. An eruption that affects multiple neighbouring cities can compound this effect. If the eruption affects multiple small cities instead of one large city, it may result in a high total number of exposed individuals dispersed across multiple cities. This scenario can strain emergency response efforts and limit the options for evacuation and recovery. We accounted for this in our composite ranking by including ranks by the number of nearby cities (Fig. 3).
Conversely, an eruption affecting part of a large populous city can have implications for the entire city, neighbouring cities, the country, and potentially globally. In large urban areas, the interdependence of infrastructure systems, such as transportation and utilities, means that even minor damage can lead to widespread functional disruptions, affecting populations beyond the immediate impacted area (Pelling, 2012; Heiken, 2013; Weir et al., 2024). For example, lahars triggered following the 1991 Pinatubo eruption in the Philippines (VEI 5) damaged highways to the north of Metro Manila, resulting in cascading impacts that disrupted access to the city (Solway, 1994; Pelling, 2012). These indirect impacts can extend beyond infrastructure disruption, affecting supply chains, labour markets, and public health systems, with the potential for the effects of an eruption to have impacts regionally or globally, particularly for those cities that are central to financial systems (Pelling, 2012). Thus, these large cities that have a small proportion exposed may be ranked low in our analysis in terms of exposure, but this could mask potential widespread indirect impacts across the broader city (Mossler, 1996; Pelling, 2012). Understanding these wider effects is crucial for assessing the full scope of urban vulnerability to volcanic hazards. Further localized assessments and systemic risk evaluations are recommended to capture a more complete range of potential impacts (Mossler, 1996; Pelling, 2012).
4.2 Volcano rankings
We highlight key volcanoes such as Salak, Gede-Pangrango, and Perbakti-Gagak with the most people exposed within cities nearby, as well as Tangkuban Parahu and Tampomas, Indonesia, and San Pablo Volcanic Field, Philippines, which rank highly in our composite ranking. Other studies highlight volcanoes in Indonesia as having high levels of exposure. For example, in our study, Gede-Pangrango was ranked first and seventh for populations living within 100 and 30 km of volcanoes, respectively. Gede-Pangrango was also ranked by Small and Naumann (2001) as the most populous volcano globally and by Jenkins et al. (2022) as the fifth-highest volcano for exposure in Indonesia and the Philippines when considering both populations and physical assets threatened by VEI 3–5 eruptions. Jenkins et al. (2022) also identified Guntur volcano as one in need of further study due to its resulting exposure and the lack of localized hazard or exposure assessments. Our findings support this, as Guntur volcano ranks highest in Indonesia for city populations within 10 km of the volcano and fourth in the composite ranking. Our findings highlight key hotspot volcanoes for further localized exposure and hazard assessments.
Large city populations within 10 km of volcanoes, a distance reached by destructive proximal hazards, can be affected by a smaller or moderate eruption at one of these volcanoes, which may have greater direct impacts than a larger eruption where populations are located farther away. A large proportion of these close populations resides near volcanoes in Central and South America, such as Managua, Nicaragua, San Salvador, El Salvador, and Quito, Ecuador (Figs. 4 and 9). Escobar et al. (2007) found that a high proportion of city populations in Central America live close to the most dangerous volcanoes in the region, something supported by our study (Fig. 7). Ewert and Harpel (2004) highlighted Central America as having potentially significant exposure to volcanic hazards, with 2.7 million people (data from 2004 CE) within 10 km of volcanoes living in both urban and rural areas. In our study, using 2020 city population data for the same buffer distance, we find that a similar number (2.6 million) of people now live just within urban (city) areas. The high proportions of urban populations close to volcanoes in Central and South America (Fig. 8) is perhaps linked to the colonial past of the region, whereby investments in agriculture in the early to mid-20th century resulted in a growth in agricultural settlements through time (Swyngedouw, 2006). Nejapa-Miraflores volcano in Nicaragua is one example of where almost 1 million people, or 45 % of the exposed population, are located within 10 km of the volcano. These populations are distributed over multiple cities, adding complexity to potential eruption impacts and response strategies.
4.3 Future research directions
In this study, we define cities as those areas classified in the GHS-UCDB dataset as urban centres, which excludes suburbs and regions of lower population densities. For example, the remaining ∼ 54 % (n = 686) of volcanoes that do not have city populations within 100 km may still be situated near suburban or rural populations or have tourists, which is not assessed in this study. The delineation between urban, peri-urban, and rural areas is not always clear (Chen et al., 2018; Sorensen and Labbé, 2020). Urban centres can sprawl into surrounding peri-urban and rural regions, and through time urban centres may merge together and densify. Therefore, total city populations may differ slightly when using other datasets. If suburban and rural populations were also considered, the ranking of volcanoes would likely change, as these areas may have higher exposure to volcanic hazards. Past volcanic eruptions such as the 1982 El Chichon eruption in Mexico primarily affected rural communities rather than city centres. Our approach could be expanded or used to explore more than just cities by assessing changing land-use patterns, transient populations using different population datasets (e.g. the LandScan ambient population dataset: Lebakula et al., 2024), or gradations of population density around volcanoes using different buffer distances. We can also explore past trends in city population exposure through time and future projections to quantify rates of exposure change. Mapping the urban sprawl of these cities allows us to identify key areas around volcanoes to focus on future mitigation efforts and land-use planning. Further research is needed to understand how the interconnectedness of cities and suburbs influences impact.
Additionally, our 2020 dataset includes 137 cities exposed to volcanoes located in other countries, underscoring the need for research in cross-border cooperation and planning to mitigate the impacts of eruptions with transboundary effects (Donovan and Oppenheimer, 2019).
We used a comparative approach to quantify the hazard by using the distance to the nearest volcano and the number of nearby volcanoes, which could be explored further. For example, the volcano buffers used in this study relate to the average maximum distances of primary hazards. However, our use of a 100 km radial buffer does not account for far-reaching volcanic flows or tephra falls that may reach beyond 100 km (Biass et al., 2024) or cascading hazards that may extend beyond this distance, such as tsunamis. Future studies could explore these cascading and widespread impacts, in the key cities identified in this study, to capture potential losses.
The selection of the location of the volcanic crater as point coordinates provided by the Global Volcanism Program (2024) does not account for the uncertainty at the next eruption site, e.g. within volcanic fields or rift zones. Additionally, research could explore alternative methods to traditional volcano buffers, considering approaches that account for the spatial variability of distributed volcanism, such as those used in Nieto-Torres et al. (2021), and of shield volcanoes. Future work could classify volcanoes by probability of eruption, last eruption, VEI range, or tectonic setting to better understand the specific types of potential hazard they pose to nearby cities. For example, the presence of multiple volcanoes within 100 km, as in San Salvador, does not directly equate to higher hazard, as eruption probabilities vary. While our approach identifies cities with high volcanic exposure, localized hazard assessments are essential for a more precise evaluation of the threat (Biass et al., 2024; Jenkins et al., 2022; Diefenbach et al., 2015). Future research can incorporate local topography, seasonal weather patterns, eruption frequencies, and hazard probabilities as well as exposures beyond population and the vulnerability of these to the hazards to understand the specific risks faced by individual cities.
Cities close to volcanoes are at high risk of volcanic hazards. We present a framework to quantify and rank global city population exposure. Although topography and weather can affect hazard footprints, our method using concentric radial buffers conservatively estimates and compares city exposure. Our results are provided in the Data availability section and as a web app for visualization of all city exposures (https://vharg.github.io/shiny_VolcCities/). The rankings of 1133 cities within 100 km of 578 Holocene volcanoes provide a foundation for identifying areas for future detailed and localized exposure or risk assessments, especially for cities with limited past hazard or exposure data. Ranking cities by exposure also helps identify key locations for future research and land-use planning.
We highlight Jakarta, Bandung, and San Salvador as scoring highly across these rankings. Jakarta, Bandung, and Naples have the largest city populations within 100, 30, and 10 km, respectively, of at least one volcano. San Salvador, Guatemala City, and Managua are cities of over 1 million people that have the largest number of people exposed to the largest number of volcanoes within 100, 30, and 10 km, respectively, with 23, 6, and 2 volcanoes, respectively. We also ranked volcanoes in three ways: by number of exposed city populations, by the number of nearby cities, and the distance of the nearest city. We highlight Tangkuban Parahu, Tampomas, and San Pablo Volcanic Field as scoring highly across these rankings. Gede-Pangrango, Tangkuban Parahu, and Nejapa-Miraflores volcanoes have the largest number of city populations within 100, 30, and 10 km, respectively. These rankings reveal hotspot cities with high populations exposed to multiple volcanoes; for example, ∼ 8.5 million people in Bandung are exposed within 100 km of 12 volcanoes.
Globally, 50 % of people exposed to volcanoes (within 100 km) live in cities. The size, number, and distance of cities near volcanoes, or the spread of population density across cities, create different challenges regarding exposure to volcanoes. For example, Jakarta has a high population density between 30 and 100 km of volcanoes, while 39 smaller cities in Ethiopia are exposed to a single volcano: Northern Lake Abaya Volcanic Field. Other cities, such as Auckland, are located on volcanic fields. Some countries are highly exposed to volcanic hazards. For example, all cities in El Salvador are located within 30 km of a volcano, and in the Philippines, ∼ 80 % of cities have some part of the city located within 100 km of a volcano. Understanding these diverse exposures is crucial for developing effective risk management strategies tailored to the specific needs of each country.
These findings can inform decision-making and further research around volcanoes. This work prompts more localized studies that overlay these exposures with probabilistic hazard maps, which can enhance our understanding of the dynamic risks surrounding volcanoes.
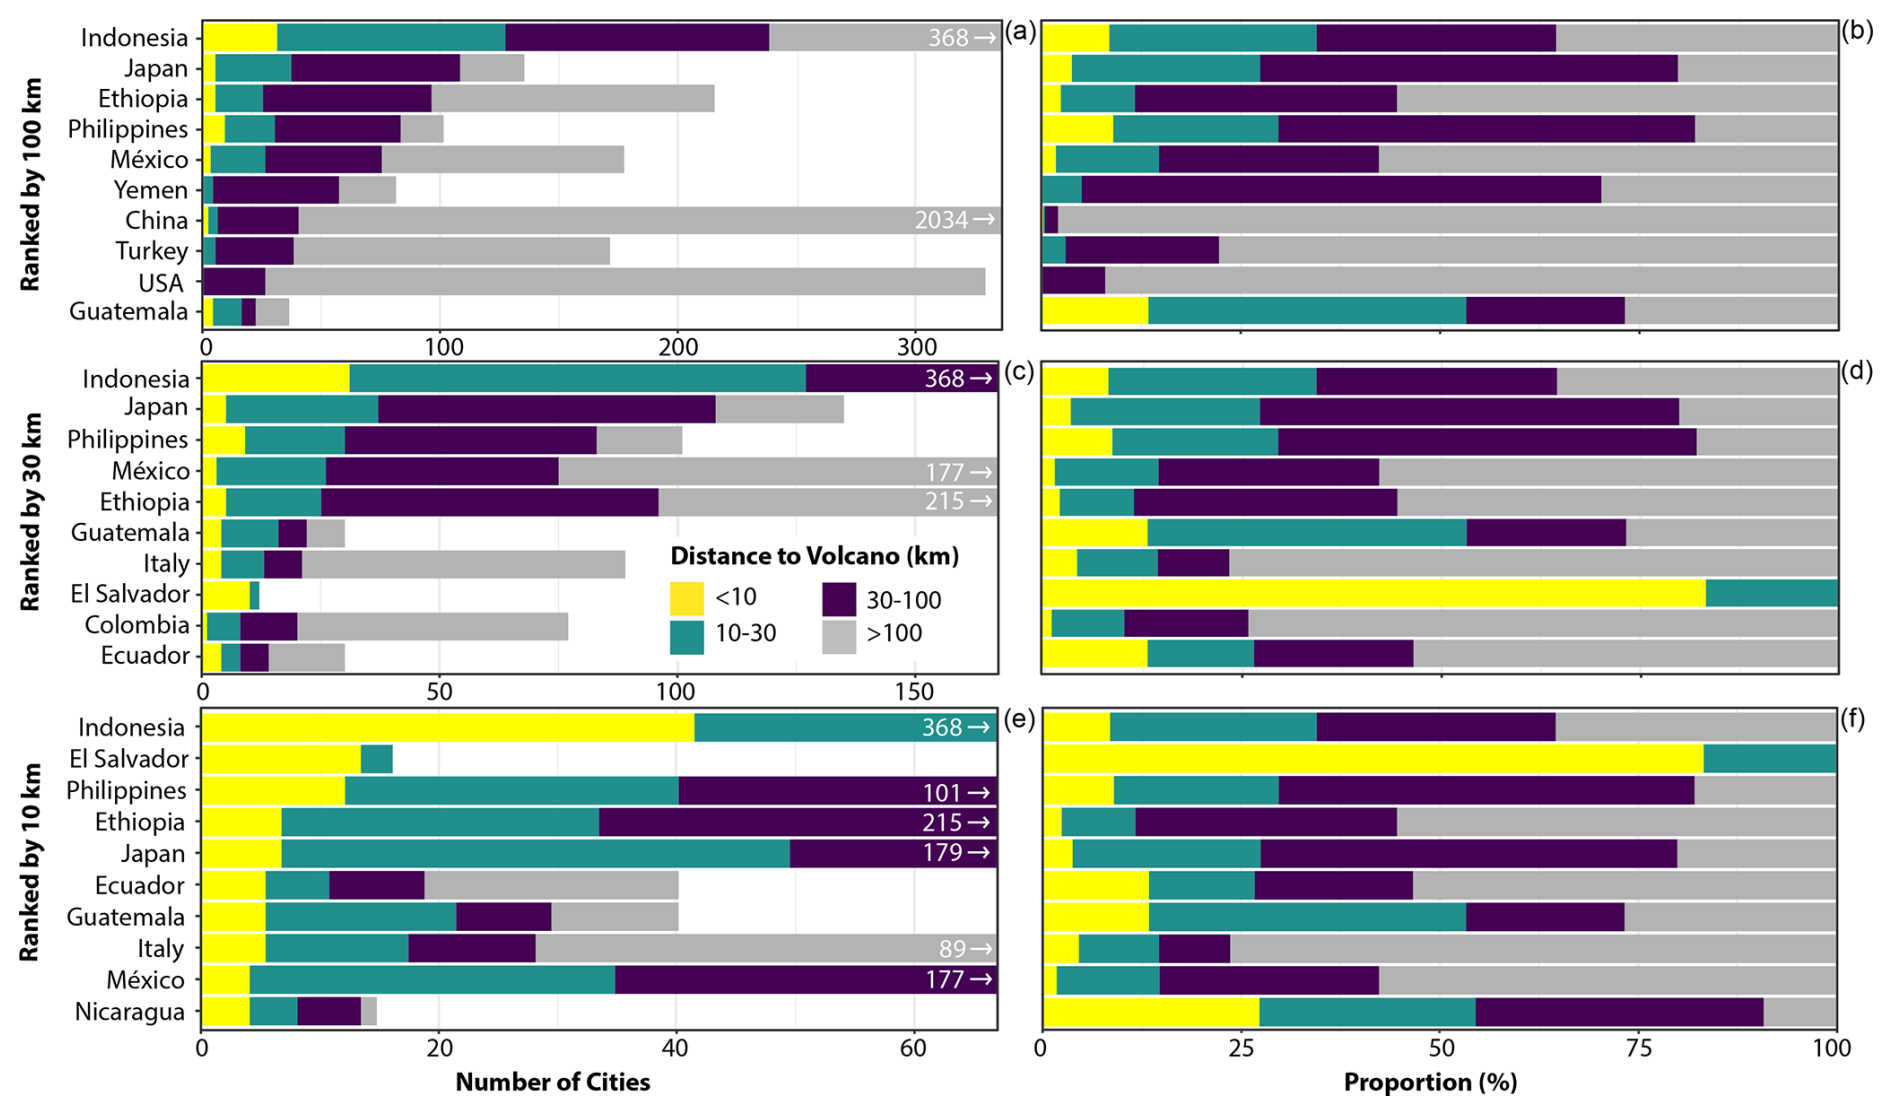
Figure A1Horizontal stacked bar charts of the number of cities with populations within each buffer distance (a, c, e) and proportion (b, d, f) around each volcano, grouped by country, classified by the distance of the city margin to the nearest volcano (within < 10, 10–30, and 30–100 km distances from volcanoes), and ranked by 100, 30, and 10 km radial buffers. If cities is spread across multiple buffers, the one closest to a volcano is selected. Each bar represents a country, and the x-axis limits (a, c, e) reflect the population range for that volcano buffer.
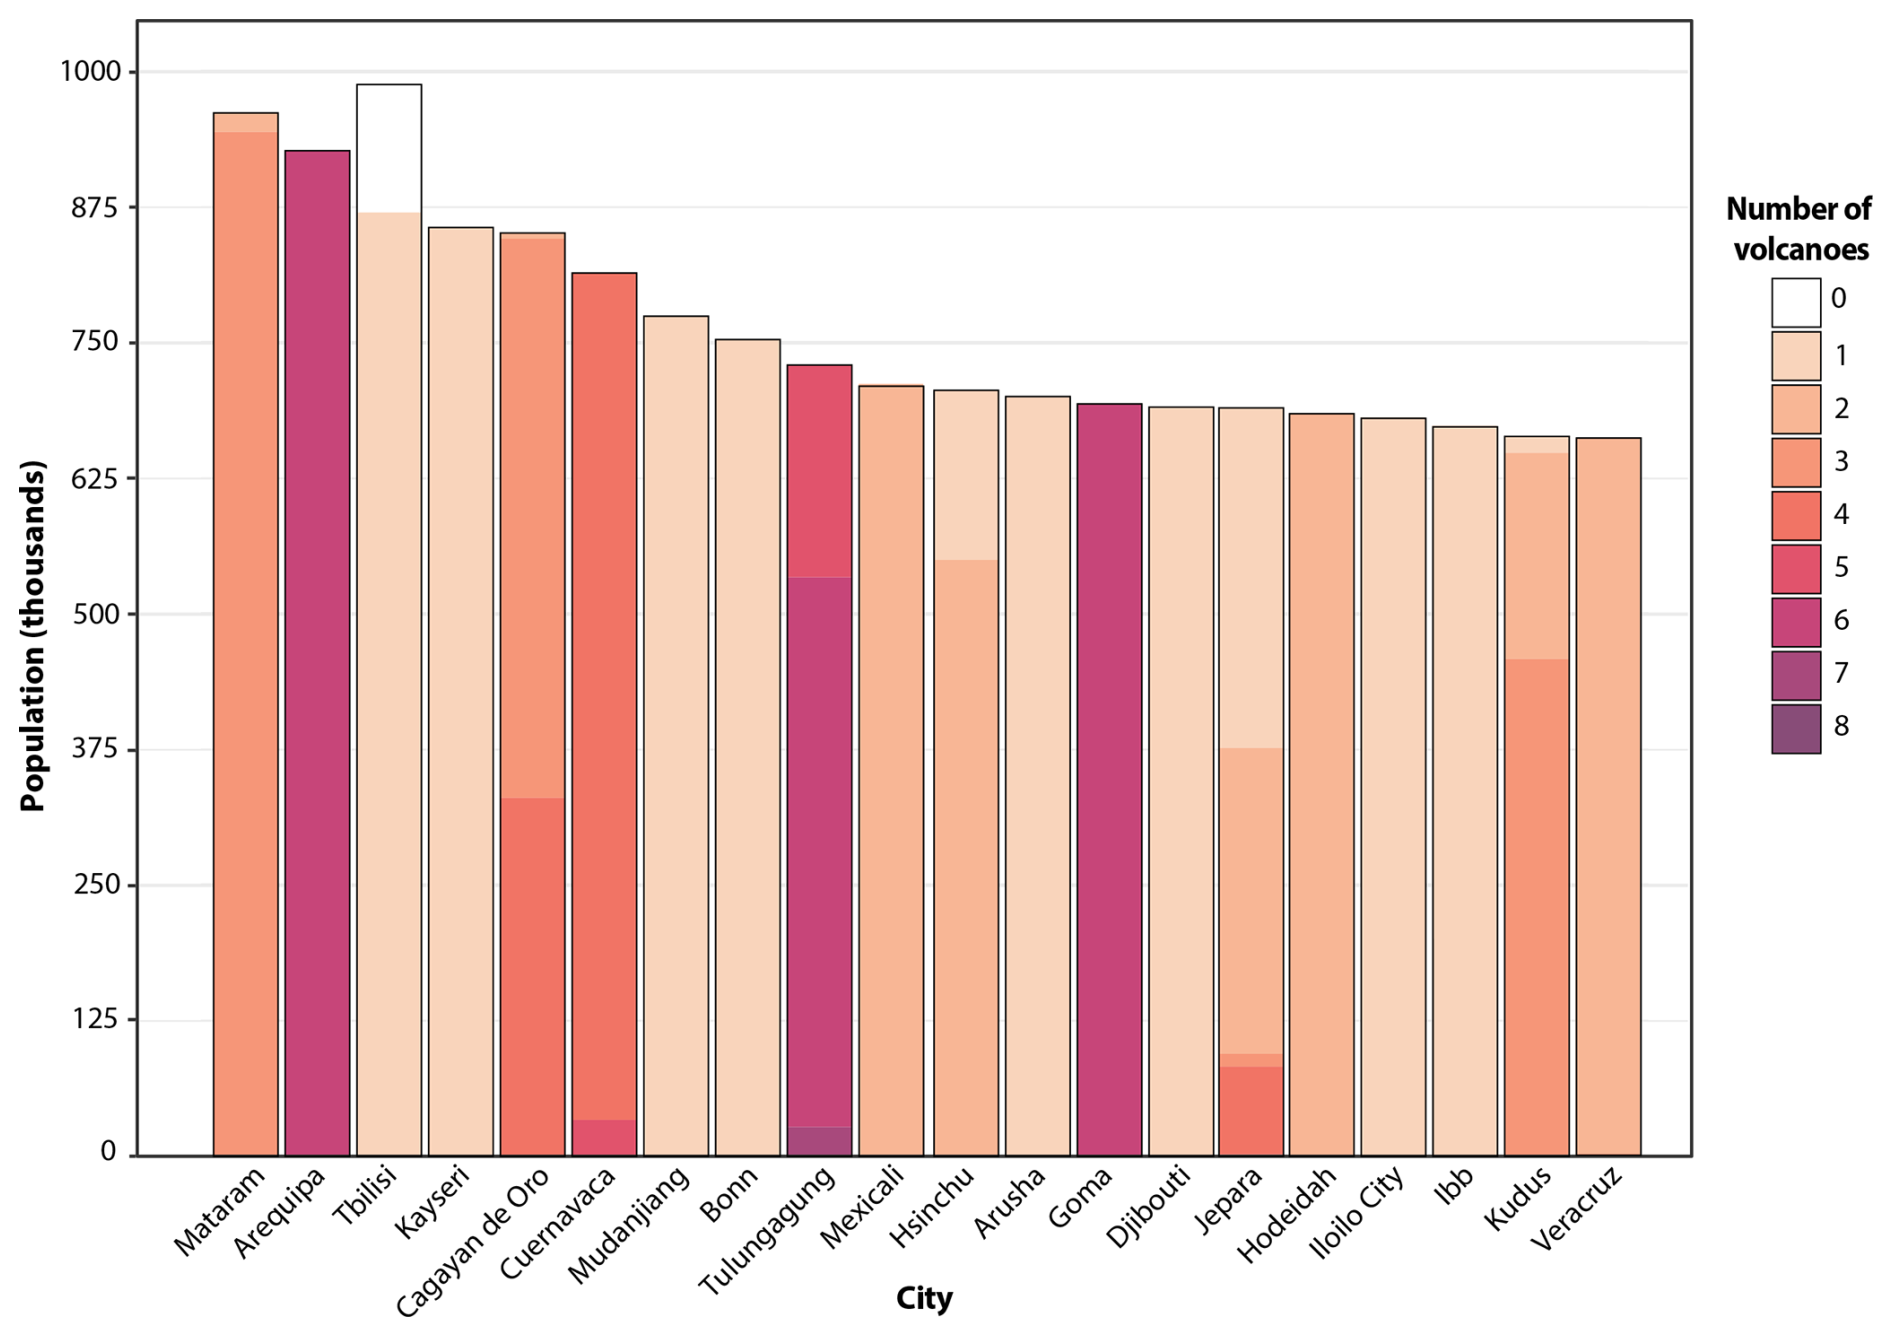
Figure A2Top 20 cities with exposed populations below 1 million, coloured by the number of volcanoes for which a city lies within a 100 km radius.
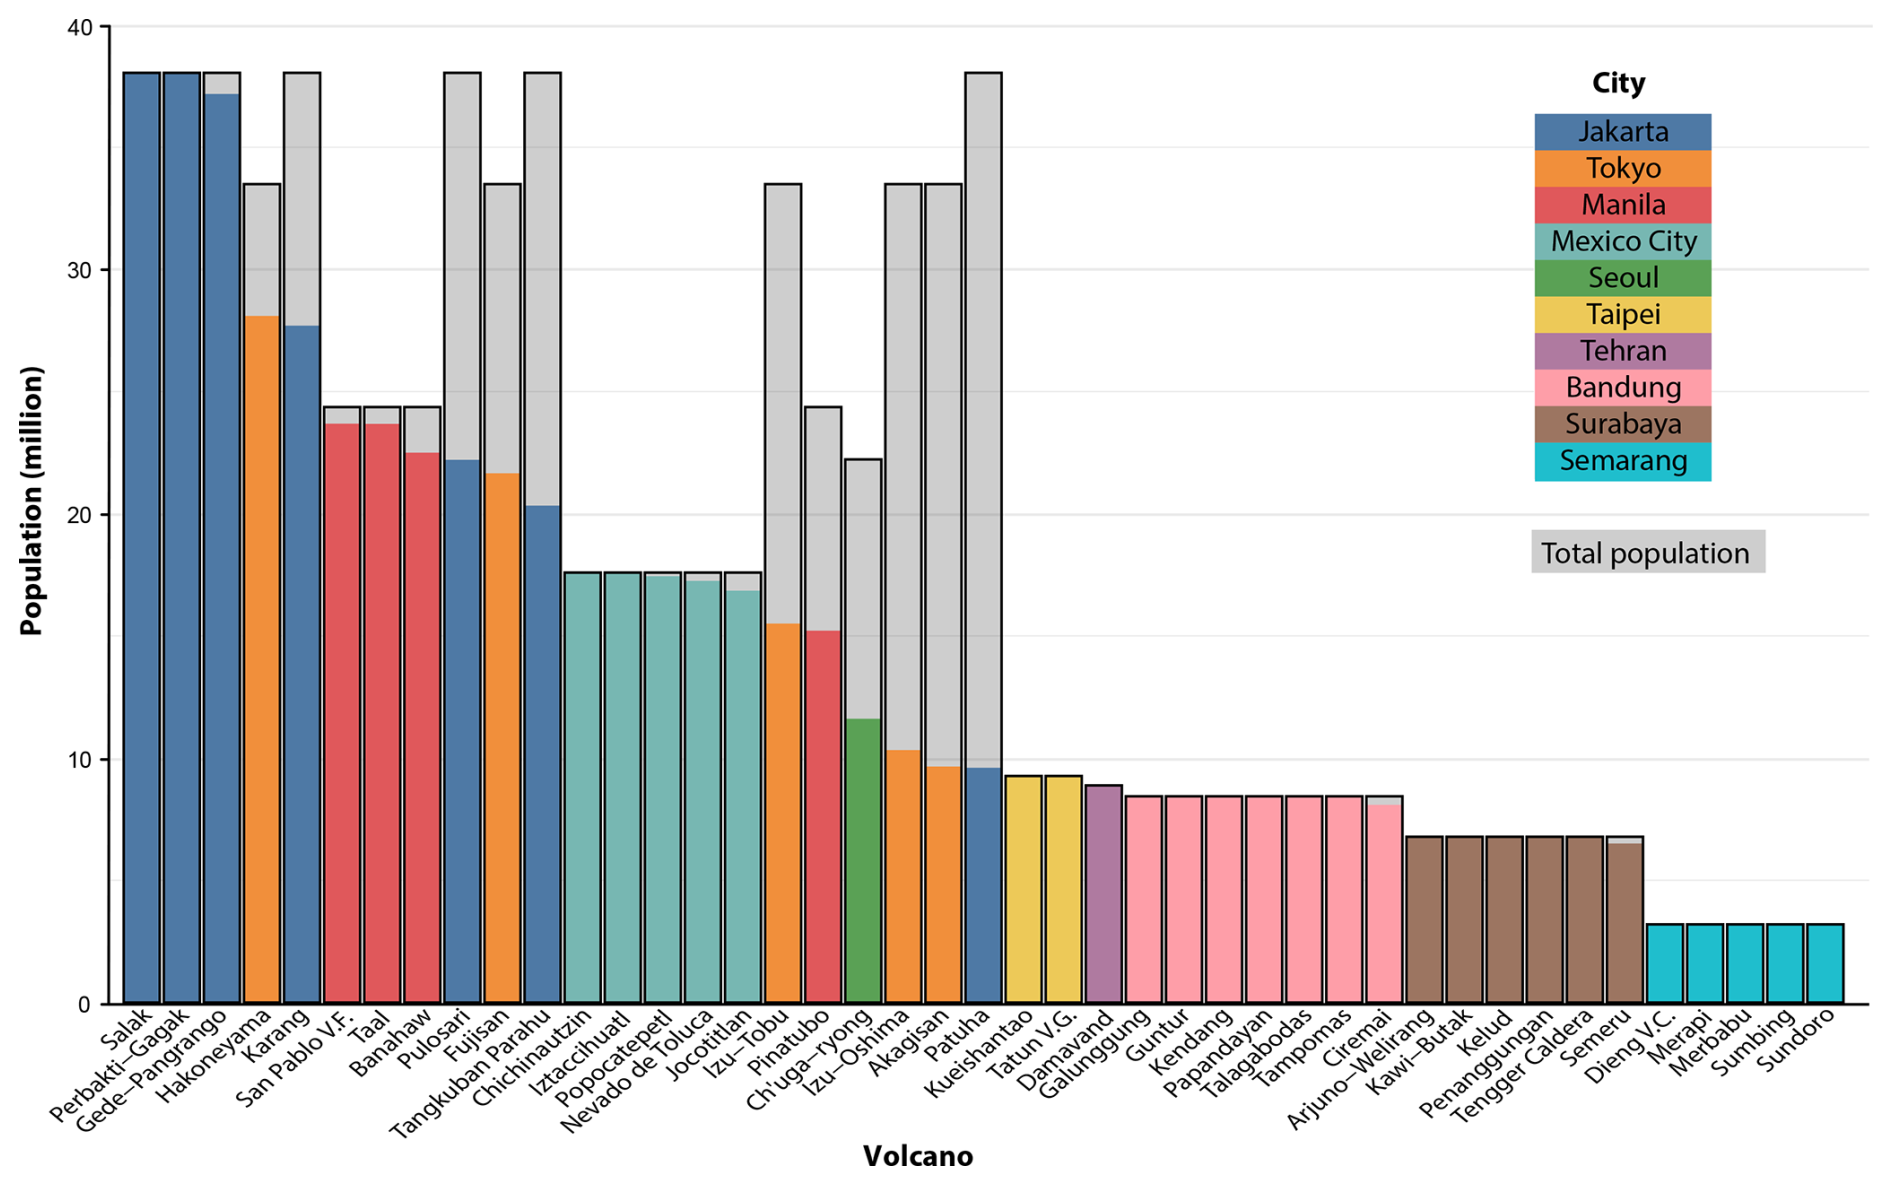
Figure A3City populations exposed to individual volcanoes within 100 km, ranked by the dominant city. Bars are coloured by the dominant city's exposed population. V.F. stands for Volcanic Field, V.G. stands for Volcanic Group, and V.C. stands for Volcanic Complex.
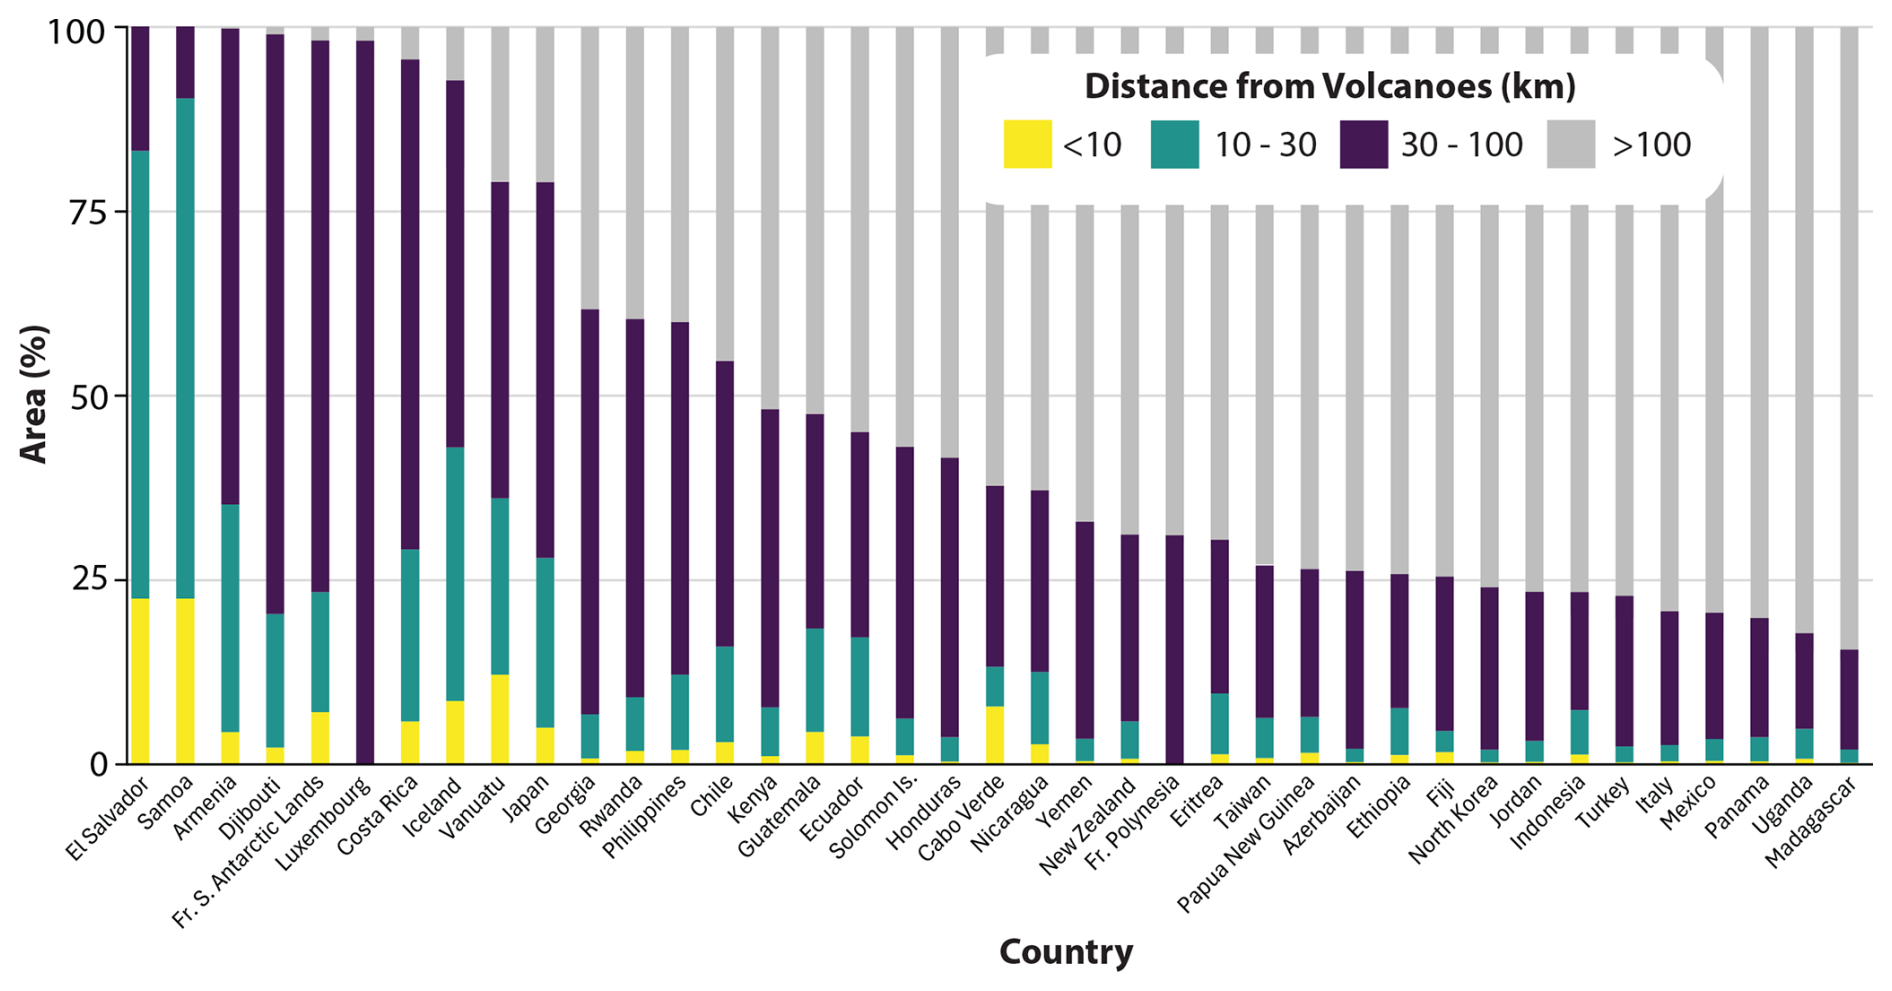
Figure A4Top 40 countries with a total area of > 2000 km2 ranked in order of their total land area exposed to volcanic hazards and coloured by the percentage of the area. Is. stands for islands, Fr. stands for French, and S. stands for southern. Land area from Natural Earth (2023).
The R code used in this paper is available at https://github.com/vharg/VolcCities (Meredith et al., 2025b).
The web app results for cities with populations over 100 000 are available at https://vharg.github.io/shiny_VolcCities/ (Teng et al., 2025). The ranking results of city exposure to volcanic hazards and volcanoes by exposed populations are available at https://doi.org/10.21979/N9/WISBHF (Meredith et al., 2025a).
The project was conceptualized by ESM, RXNT, SJF, and SB. The methodology was developed by ESM and RXNT with support from SFJ, JLH, and SB. Visualizations were made by ESM, and the web app was developed by RXNT. The original draft was written by ESM. All of the authors contributed to editing and reviewing the manuscript.
The contact author has declared that none of the authors has any competing interests.
Publisher's note: Copernicus Publications remains neutral with regard to jurisdictional claims made in the text, published maps, institutional affiliations, or any other geographical representation in this paper. While Copernicus Publications makes every effort to include appropriate place names, the final responsibility lies with the authors.
We are grateful for the helpful reviews by Amiel Nieto Torres and Luis E. Lara that enhanced the manuscript. We thank the editor Giovanni Macedonio for overseeing the review process. This work comprises EOS contribution no. 631. Susanna F. Jenkins acknowledges the financial support from the AXA Joint Research Initiative. We acknowledge the support for this work from the Centre for Disaster Resilience, ITC Faculty, University of Twente.
This research was partly supported by the Ministry of Education of Singapore under its MOE Academic Research Fund Tier-3 InVEST project (grant no. MOE-MOET32021-0002).
This paper was edited by Giovanni Macedonio and reviewed by Amiel Nieto Torres and Luis E. Lara.
Alberico, I., Petrosino, P., and Lirer, L.: Volcanic hazard and risk assessment in a multi-source volcanic area: the example of Napoli city (Southern Italy), Nat. Hazards Earth Syst. Sci., 11, 1057–1070, https://doi.org/10.5194/nhess-11-1057-2011, 2011.
Ariyanti, V., Gaafar, T., De La Sala, S., Edelenbos, J., and Scholten, P.: Towards liveable volcanic cities: A look at the governance of lahars in Yogyakarta, Indonesia, and Latacunga, Ecuador, Cities, 107, 102893, https://doi.org/10.1016/j.cities.2020.102893, 2020.
Aspinall, W., Auker, M., Hincks, T., Mahony, S., Nadim, F., Pooley, J., Sparks, R.S.J., and Syre, E.: Volcano hazard and exposure in GFDRR priority countries and risk mitigation measures – GFDRR Volcano Risk Study, The World Bank, Washington DC, 309 pp., https://research-information.bris.ac.uk/en/publications/volcano-hazard-and-exposure-in-track-ii-countries-and-risk-mitiga (last access: 8 July 2025), 2011.
Auker, M. R., Sparks, R. S. J., Siebert, L., Crosweller, H. S., and Ewert, J.: A statistical analysis of the global historical volcanic fatalities record, Journal of Applied Volcanology, 2, 2, https://doi.org/10.1186/2191-5040-2-2, 2013.
Biass, S., Jenkins, S. F., Hayes, J. L., Williams, G. T., Meredith, E. S., Tennant, E., Yang, Q., Lerner, G. A., Burgos, V., Syarifuddin, M., and Verolino, A.: How well do concentric radii approximate population exposure to volcanic hazards?, B. Volcanol., 86, 3, https://doi.org/10.1007/s00445-023-01686-5, 2024.
Bilham, R.: The seismic future of cities, B. Earthq. Eng., 7, 839–887, https://doi.org/10.1007/s10518-009-9147-0, 2009.
Blaikie, P., Cannon, T., Davis, I., and Wisner, B.: At risk: Natural hazards, people's vulnerability and disasters, Routledge, https://doi.org/10.4324/9780203714775, 2004.
Brecht, H., Deichmann, U., and Wang, H. G.: A global urban risk index, World Bank Working Paper, http://documents.worldbank.org/curated/en/804651468331205546 (last access: 7 August 2025), 2013.
Brown, S. K., Auker, M. R., and Sparks, R. S. J.: Populations around Holocene volcanoes and development of the Population Exposure Index, in: Global Volcanic Hazards and Risk, edited by: Loughlin, S. C., Sparks, R. S. J., Brown, S. K., Jenkins, S. F., and Vye-Brown, C., Cambridge, 223–232, https://doi.org/10.1017/CBO9781316276273.006, 2015.
Chen, C., LeGates, R., Zhao, M., and Fang, C.: The changing rural-urban divide in China's megacities, Cities, 81, 81–90, https://doi.org/10.1016/j.cities.2018.03.017, 2018.
Chester, D. K., Degg, M., Duncan, A. M., and Guest, J. E.: The increasing exposure of cities to the effects of volcanic eruptions: A global survey, Global Environmental Change Part B: Environmental Hazards, 2, 89–103, https://doi.org/10.3763/ehaz.2000.0214, 2000.
Degg, M.: Natural disasters: Recent trends and future prospects, Geography, 77, 198–209, 1992.
Delgado Granados, H. and Jenkins, S. F.: Extreme volcanic risks 1: Mexico City, in: Volcanic hazards, risks and disasters, edited by: Shroder, J., Elsevier, 315–354, https://doi.org/10.1016/B978-0-12-396453-3.00013-7, 2015.
Del Negro, C., Cappello, A., Bilotta, G., Ganci, G., Hérault, A., and Zago, V.: Living at the edge of an active volcano: Risk from lava flows on Mt. Etna, Geol. Soc. Am. Bull., 132, 1615–1625, https://doi.org/10.1130/B35290.1, 2020.
Diefenbach, A. K., Wood, N. J., and Ewert, J. W.: Variations in community exposure to lahar hazards from multiple volcanoes in Washington State (USA), Journal of Applied Volcanology, 4, 4, https://doi.org/10.1186/s13617-015-0024-z, 2015.
Donovan, A. and Oppenheimer, C.: Extreme volcanism: disaster risk and societal implications, in: Extreme natural hazards: Disaster risks and societal implications, 29–46, https://doi.org/10.1017/CBO9781139523905.006, 2014.
Donovan, A. and Oppenheimer, C.: Volcanoes on borders: A scientific and (geo)political challenge, B. Volcanol., 81, 28, https://doi.org/10.1007/s00445-019-1291-z, 2019.
Durand, M.: Impacts of, and responses to ashfall in Kagoshima from Sakurajima volcano: Lessons for New Zealand, Inst. Geol. Nucl. Sci. Ltd., New Zealand, ISBN 978-0478097481, 2001.
Erfurt-Cooper, P. (Ed.): Volcanic tourist destinations, Springer, https://doi.org/10.1007/978-3-642-16191-9, 2014.
Escobar, R., Alvarado, G., Soto, G., Navarro, M., Escobar, D., Pullinger, C., and Bonis, S.: Volcanic activity, hazards, and monitoring, in: Central America: Geology, Resources and Hazards, edited by: Bundschuh, J. and Alvarado, G. E., Taylor & Francis, Chap. 38, 1155–1188, https://doi.org/10.1201/9780203947043, 2007.
Ewert, J. W.: System for ranking relative threats of US volcanoes, Nat. Hazards Rev., 8, 112–124, 2007.
Ewert, J. W. and Harpel, C. J.: In harm's way: Population and volcanic risk, Geotimes, 49, 14–17, 2004.
Ewert, J. W., Diefenbach, A. K., and Ramsey, D. W.: Update to the U.S. Geological Survey National Volcanic Threat Assessment, U.S. Geological Survey Scientific Investigations Report 2018–5140, U.S. Geological Survey, https://pubs.er.usgs.gov/publication/sir20185140 (last access: 22 July 2024), 2018.
Freire, S., Florczyk, A. J., Pesaresi, M., and Sliuzas, R.: An improved global analysis of population distribution in proximity to active volcanoes, 1975–2015, ISPRS Int. J. Geo-Inf., 8, 341, https://doi.org/10.3390/ijgi8080341, 2019.
Global Volcanism Program: Volcanoes of the world, version 5.2.7, Smithsonian Institution [data set], https://doi.org/10.5479/si.GVP.VOTW5-2024.5.2, 2024.
Godschalk, D. R.: Urban hazard mitigation: Creating resilient cities, Nat. Hazards Rev., 4, 136–143, https://doi.org/10.1061/(ASCE)1527-6988(2003)4:3(136), 2003.
Gu, D.: Population exposure and vulnerability to natural disasters for world's cities, United Nations Populations Division Working Paper, https://www.unpopulation.org/ (last access: 24 May 2025), 2019.
Guimarães, L. F., Nieto-Torres, A., Bonadonna, C., and Frischknecht, C.: A new inclusive volcanic risk ranking, Part 2: Application to Latin America, Frontiers in Earth Science, 9, 757742, https://doi.org/10.3389/feart.2021.757742, 2021.
Hanson, S., Nicholls, R., Ranger, N., Hallegatte, S., Corfee-Morlot, J., Herweijer, C., and Chateau, J.: A global ranking of port cities with high exposure to climate extremes, Clim. Change, 104, 89–111, https://doi.org/10.1007/s10584-010-9977-4, 2011.
Heiken, G.: Dangerous neighbors: Volcanoes and cities, Cambridge University Press, Cambridge, https://doi.org/10.1017/CBO9781139856676, 2013.
Iglesias, V., Braswell, A. E., Rossi, M. W., Joseph, M. B., McShane, C., Cattau, M., Koontz, M. J., McGlinchy, J., Nagy, R. C., Balch, J., Leyk, S., and Travis, W. R.: Risky development: Increasing exposure to natural hazards in the United States, Earth's Future, 9, e2020EF001795, https://doi.org/10.1029/2020EF001795, 2021.
Jenkins, S. F., Biass, S., Williams, G. T., Hayes, J. L., Tennant, E., Yang, Q., Burgos, V., Meredith, E. S., Lerner, G. A., Syarifuddin, M., and Verolino, A.: Evaluating and ranking Southeast Asia's exposure to explosive volcanic hazards, Nat. Hazards Earth Syst. Sci., 22, 1233–1265, https://doi.org/10.5194/nhess-22-1233-2022, 2022.
Jenkins, S. F., Magill, C. R., and Blong, R. J.: Evaluating relative tephra fall hazard and risk in the Asia-Pacific region, Geosphere, 14, 492–509, https://doi.org/10.1130/GES01549.1, 2018.
Lebakula, V., Epting, J., Moehl, J., Stipek, C., Adams, D., Reith, A., Kaufman, J., Gonzales, J., Reynolds, B., Basford, S., Martin, A., Buck, W., Faxon, A., Cunningham, A., Roy, A., Barbose, Z., Massaro, J., Walters, S., Woody, C., and Urban, M.: LandScan Silver Edition, Oak Ridge National Laboratory [data set], https://doi.org/10.48690/1531770, 2024.
Levine, D. J.: exactextractr: Fast extraction from raster datasets using polygons, R package version 0.8.3, https://CRAN.R-project.org/package=exactextractr (last access: January 2024), 2022.
Magill, C. and Blong, R.: Volcanic risk ranking for Auckland, New Zealand. II: Hazard consequences and risk calculation, B. Volcanol., 67, 340–349, https://doi.org/10.1007/s00445-004-0375-5, 2005.
Mani, L., Tzachor, A., and Cole, P.: Global catastrophic risk from lower magnitude volcanic eruptions, Nat. Commun., 12, 4756, https://doi.org/10.1038/s41467-021-25021-8, 2021.
Mangan, B. M., Ball, J., Wood, N., Jones, J. L., Peters, J., Abdollahian, N., Dinitz, L., Blankenheim, S., Fenton, J., and Pridmore, C.: SIR 2018–5159 ver. 1.1: California's exposure to volcanic hazards, U.S. Geological Survey, https://pubs.er.usgs.gov/publication/sir20185159 (last access: 22 July 2024), 2018.
Marí Rivero, I., Melchiorri, M., Florio, P., Schiavina, M., Krasnodębska, K., Politis, P., Uhl, J., Pesaresi, M., Maffenini, L., Sulis, P., Crippa, M., Guizzardi, D., Pisoni, E., Belis, C., Oom, D., Branco, A., Mwaniki, D., Kochulem, E., Githira, D., Carioli, A., Ehrlich, D., Tommasi, P., Kemper, T., and Dijkstra, L.: GHS-UCDB R2024A - GHS Urban Centre Database 2025, European Commission, Joint Research Centre (JRC) [data set], https://doi.org/10.2905/1A338BE6-7EAF-480C-9664-3A8ADE88CBCD, 2024.
Meredith, E. S., Teng, N. R. X., Jenkins, S. F., Hayes, J. L., Biass, S., and Handley, H.: Related data for: Cities near volcanoes: Which cities are most exposed to volcanic hazards?, Version V1, DR_NTU [data set], https://doi.org/10.21979/N9/WISBHF, 2025a.
Meredith, E. S., Teng, N. R. X., Jenkins, S. F., Hayes, J. L., Biass, S., and Handley, H.: VolcCities code repository, GitHub [code], https://github.com/vharg/VolcCities (last access: 7 August 2025), 2025b.
Mossler, M.: Environmental hazard analysis and small island states: rethinking academic approaches, Geogr. Zeitsch., 1, 86–93, 1996.
Natural Earth: Admin 0 – countries, 1:10m, 1:50m, and 1:110m scales, https://www.naturalearthdata.com/downloads/10m-cultural-vectors/10m-admin-0-countries/ (last access: January 2024), 2023.
Nieto-Torres, A., Guimarães, L. F., Bonadonna, C., and Frischknecht, C.: A new inclusive volcanic risk ranking, Part 1: Methodology, Front. Earth Sci., 9, 697451, https://doi.org/10.3389/feart.2021.697451, 2021.
Pelling, M.: The Vulnerability of Cities: Natural Disasters and Social Resilience, Routledge, London, 224 pp., https://doi.org/10.4324/9781849773379, 2012.
Sandri, L., Thouret, J. C., Constantinescu, R., Biass, S., and Tonini, R.: Long-term multi-hazard assessment for El Misti volcano (Peru), B. Volcanol., 76, 1–26, https://doi.org/10.1007/s00445-013-0771-9, 2014.
Schiavina, M., Melchiorri, M., and Freire, S.: GHS-DUC R2023A – GHS Degree of Urbanisation Classification: Application of the Degree of Urbanisation methodology stage II to GADM 4.1 layer, multitemporal 1975–2030, European Commission, Joint Research Centre (JRC) [data set], https://doi.org/10.2905/DC0EB21D-472C-4F5A-8846-823C50836305, 2023a.
Schiavina, M., Freire, S., Carioli, A., and MacManus, K.: GHS-POP R2023A – GHS population grid multitemporal 1975–2030, European Commission, Joint Research Centre (JRC) [data set], https://doi.org/10.2905/2FF68A52-5B5B-4A22-8F40-C41DA8332CFE, 2023b.
Small, C. and Naumann, T.: The global distribution of human population and recent volcanism, Global Environmental Change Part B: Environmental Hazards, 3, 93–109, https://doi.org/10.1016/S1464-2867(02)00002-5, 2001.
Solway, L.: Urban developments and megacities: vulnerability to natural disasters, Disaster Manag.-Redhill, 6, 160–169, 1994.
Sorensen, A. and Labbé, D. (Eds.): Megacities, megacity-regions, and the endgame of urbanization, in: Handbook of Megacities and Megacity-Regions, Edward Elgar Publishing, 1–19, https://doi.org/10.4337/9781788972703, 2020.
Strader, S. M., Ashley, W., and Walker, J.: Changes in volcanic hazard exposure in the Northwest USA from 1940 to 2100, Nat. Hazards, 77, 1365–1392, https://doi.org/10.1007/s11069-015-1658-1, 2015.
Swyngedouw, E.: Power, water and money: Exploring the nexus, Occasional Paper 2006/14, Human Development Report 2006, United Nations Development Programme, New York, 84 pp., https://hdr.undp.org/content/power-water-and-money-exploring-nexus (last access: 7 August 2025), 2006.
Teng, N. R. X., Meredith, E. S., Jenkins, S. F., Hayes, J. L., Biass, S., and Handley, H.: VolcCities Web App, https://vharg.github.io/shiny_VolcCities/ (last access: 7 August 2025), 2025.
Thouret, J.-C.: Urban hazards and risks; consequences of earthquakes and volcanic eruptions: an introduction, GeoJournal, 49, 131–135, https://doi.org/10.1023/A:1007118027266, 1999.
Thouret, J.-C., Finizola, A., Fornari, M., Legeley-Padovani, A., Suni, J., and Frechen, M.: Geology of El Misti volcano near the city of Arequipa, Peru, Geology, 113, 1593–1610, https://doi.org/10.1130/0016-7606(2001)1132.0.CO;2, 2001.
Torres, A. N., Del Pozzo, A. L. M., Groppelli, G., and Viera, M. D. C. J.: Risk scenarios for a future eruption in the Chichinautzin monogenetic volcanic field, South México City, J. Volcanol. Geoth. Res., 433, 107733, https://doi.org/10.1016/j.jvolgeores.2022.107733, 2023.
UNDP: Urban Risk Management and Resilience Strategy, United Nations Development Programme, https://www.undp.org/ (last access: 22 July 2025), 2021.
United Nations: Prospects of world urbanization, 1988, Population Studies No. 112, ST/ESA/SER.A/112, United Nations, Department of International Economic and Social Affairs, New York, ISBN 978-92-1-151182-6, 1989.
Weir, A. M., Wilson, T. M., Bebbington, M. S., Campbell-Smart, C., Williams, J. H., and Fairclough, R.: Quantifying systemic vulnerability of interdependent critical infrastructure networks: A case study for volcanic hazards, Int. J. Disast. Risk Re., 114, 104997, https://doi.org/10.1016/j.ijdrr.2024.104997, 2024.
Wood, N. and Soulard, C.: Variations in population exposure and sensitivity to lahar hazards from Mount Rainier, Washington, J. Volcanol. Geoth. Res., 188, 367–378, https://doi.org/10.1016/j.jvolgeores.2009.09.019, 2009.
World Bank: Urban Development, World Bank, Washington, DC, https://data.worldbank.org/topic/urban-development (last access: 21 November 2024), 2023.