the Creative Commons Attribution 4.0 License.
the Creative Commons Attribution 4.0 License.
 | 22 Jul 2025
Modelling flood losses of micro-businesses in Ho Chi Minh City, Vietnam
Dominik Paprotny
Kasra Rafiezadeh Shahi
Heidi Kreibich
Micro-businesses are important sources of livelihood for low- and middle-income households. In Ho Chi Minh City (HCMC), Vietnam, many micro-businesses are set up on the ground floor of residential houses susceptible to urban floods. Increasing flood risk in HCMC threatens the financial resources of micro-businesses by damaging business contents and causing business interruptions. Since flood loss estimations are rarely conducted at an object-level resolution and are often focused on households or large companies, the commercial losses suffered by micro-businesses are often overlooked. This study aims to derive the drivers of flood losses [%] for micro-businesses by applying a conditional random forest to survey data (relative business content losses: n=317; relative business interruption losses: n=361) collected from micro-businesses in HCMC. The variability in the losses of business contents and losses due to business interruption were adequately explained by the revenue of the businesses from monthly sales, the age of the building where the business is established, and the hydrological characteristics of the flood. Based on the identified drivers, probabilistic loss models (nonparametric Bayesian networks) were developed using a combination of data-driven and expert-based model formulation. The models estimated the flood losses for HCMC's micro-businesses with a mean absolute error of 3.8 % for content losses (observed mean: 4.7 %, Q50: 0.0) and 18.7 % for business interruption losses (observed mean: 18.2 %, Q50: 10). The Bayesian network model for business interruption had similar predictive performance when it was regionally transferred and applied to comparable survey data from another Vietnamese city, Can Tho. The flood loss models introduced in this study make it possible to derive flood risk metrics specific to micro-businesses to support adaptation decision-making and risk transfer mechanisms.
- Article
(3348 KB) - Full-text XML
-
Supplement
(981 KB) - BibTeX
- EndNote


Comprehensive risk management requires empirical evidence related to the drivers of risk and assessment of potential impacts. The lack of information on vulnerability of certain economic sectors or social groups and their often limited participation in local risk management in turn foster a lack of awareness among decision-makers, leading to biased risk management strategies. As impacts of climate change become more severe, comprehensive risk management that protects society as a whole is imperative – in particular the vulnerable and underrepresented groups. However, it is often not feasible in low- and middle-income countries due to poor data availability. An example of a vulnerable economic sector in a society with a high flood risk, which is explored in this study, is micro-businesses in Ho Chi Minh City (HCMC), Vietnam. These micro-sized companies are quite common across Southeast (SE) and South (S) Asia; a description of their operations and economic relevance with regard to Vietnam's urban areas is provided in Sect. 2.1.
In addition to the frequently studied structural damage, the commercial sector, specifically micro-businesses, also suffer directly from economic loss of business contents (e.g. inventory, goods, equipment) and due to business interruption. The latter refers to the decline in business revenue due to interrupted operations of flood-affected businesses during a reference period, such as the flood month or period of flooding (Meyer et al., 2013; Chinh et al., 2016). However, our definition of interruption losses does not consider long-term losses or impacts on businesses outside the flood zone. The literature on commercial losses often focuses on companies of various sizes in Europe or the USA, and these studies indicate that indirect losses represent a significant share of flood consequences (e.g. Hallegatte, 2008; Merz et al., 2010; Koks and Thissen, 2016; Sieg et al., 2019; Tsinda et al., 2019). Since the business structures and resources available to larger firms differ considerably from those of small- and micro-sized companies (Leitold and Diez, 2019), the state-of-the-art approaches for commercial flood loss modelling are not generalizable to Vietnam's micro-businesses. However, the better the drivers of flood losses for a specific sector are understood, the more informed loss assessments can be made and investments towards flood adaptation can be improved (Sieg et al., 2017).
Modelling flood losses in low- and middle-income countries is often hampered by the lack of comprehensive and open-source data, which necessitates reliance on primary data collection campaigns. The lack of information on flood losses among micro-businesses is explained by the fact that they mainly operate in the informal sector, which makes it difficult to record and thus to estimate their flood losses (Garschagen, 2015; Rand and Tarp, 2020). Despite these limitations, some studies have analysed and modelled content losses of micro-, small-, and medium-sized companies in SE and S Asia (Chinh et al., 2016; Wijayanti et al., 2017; Samantha, 2018). To the authors' knowledge, there is no existing analysis elucidating the drivers of flood losses specific to micro-businesses in the context of low- and middle-income countries. However, the identification of the drivers of loss is crucial to develop meaningful flood loss models that capture the role the drivers play in influencing losses (Rözer et al., 2019). The heterogeneity in flood loss processes at the object level necessitates the development of multivariable, probabilistic approaches capable of capturing nonlinear effects (Schröter et al., 2014; Vogel et al., 2014; Rözer et al., 2019; Paprotny et al., 2020; Paprotny et al., 2021; Rafiezadeh Shahi et al., 2024). The absence of such probabilistic loss models in the context of micro-businesses impedes the quantification and inclusion of uncertainties for adaptation decision-making. Furthermore, multivariate flood loss models are rarely evaluated under conditions other than those under which they were developed; consequently, their applicability to spatial/temporal transfers remains unknown (Apel et al., 2009; Gerl et al., 2014; Ootegem et al., 2017; Vogel et al., 2018; Amadio et al., 2019). Our study aims to address these limitations of the state-of-the-art flood loss modelling approaches for micro-businesses in the context of low- and middle-income countries by deriving empirical evidence related to the drivers of flood losses of micro-businesses in HCMC, by calibrating and validating process-based Bayesian network (BN) models for HCMC that predict content and business interruption losses, and by evaluating the transferability of the models by applying them to comparable data from a different city (Can Tho).
The paper is organized as follows (see Fig. S1 in the Supplement): Sect. 2 comprises an overview of the research domain and the empirical survey datasets used in the study; Sect. 3 has the methodology implemented, including the feature selection and the development of probabilistic flood loss models; Sect. 4 presents and discusses the results of this study; and the conclusions follow in Sect. 5.
2.1 Case studies
HCMC is one of the world's most flood-risk-exposed cities under current and future conditions (Hallegatte et al., 2013; Scussolini et al., 2017). Similar to other SE Asian metropolises, HCMC lies in a river delta area close to the coast. These densely populated, flat, riverine, and coastal regions experience regular flooding, in particular during the rainy season (Garschagen, 2015; Tierolf et al., 2021; Nguyen et al., 2021). In HCMC, these regular floods are often the result of compound events caused by the simultaneous occurrence of high tides, heavy rainfall, and high flows of the Saigon and Dong Nai rivers and their tributaries (Tran, 2014; Thuy et al., 2019). Other large cities in the delta areas of South Vietnam also experience regular urban flooding, for instance, Can Tho city in the Mekong Delta (abbreviated as Can Tho). Urban floods in Can Tho are predominantly fluvial in nature, such as a major flood event in 2011. Despite the ongoing efforts to improve protection and adaptation measures at the private and municipal levels, climate change and the ongoing growth of these important economic centres increase their risk to urban flooding (Güneralp et al., 2015; Rentschler et al., 2022). The existing infrastructure and adaptation measures in these cities are unable to counterbalance the new risks caused by intensified flood events and ongoing urban pressure (e.g. Bouwer, 2011; Bloch et al., 2012; Formetta and Feyen, 2019; Kreibich et al., 2022). The overview map in Fig. 1 illustrates the locations of both cities (HCMC, Can Tho) used in the case studies of this paper.
We define micro-businesses, including household businesses, according to the definition of the World Bank: very small businesses with fewer than 10 employees. However, this general definition for micro-businesses needs to be adapted to the regional context of SE and S Asia. Micro-businesses in these countries usually tend to employ fewer than three people. In most cases, micro-businesses are located on the ground floor of a building with residences on the upper floors, commonly called shop houses, in Vietnamese cities. Micro-businesses provide an important source of income for unemployed family members and people with limited opportunities on the labour market, the same as for migrant workers and people who received fewer possibilities for schooling (Samantha, 2018). Together with the operations of small- and medium-sized companies (SMEs), micro-businesses have driven the rapid economic development of many SE Asian states in the past decades (Trinh and Thanh, 2017). According to Vietnam's economic census of 2017, around 75 % of all enterprises are micro-businesses in the country (General Statistics Office, 2018). Vietnam's micro-businesses engage around 11 % of all employees (General Statistics Office, 2018), and the density of micro-businesses is particularly high in economic centres such as HCMC and other delta cities like Can Tho. The economic importance of HCMC becomes evident when the region's contribution to Vietnam's total economic output is considered – the HCMC region accounts for approximately 40 % of the national GDP (General Statistics Office, 2018). These values highlight the relevance of micro-businesses for Vietnam's local and national economy.
The micro-business owners are particularly vulnerable to the negative consequences of regular flooding due to their limited financial resources and inadequate support by local authorities and the government (Leitold et al., 2020). As a consequence, the owners often rely on their neighbouring network to cope with flooding (Chinh et al., 2016, 2017; Leitold and Revilla Diez, 2019; Leitold et al., 2021). Bank loans or micro-credit are less common due to the usually rather low credit rating of the owners (Patankar, 2019). In terms of flood losses, this means that repair measures and other business investments are often directly financed by the savings of the micro-business owner. Insufficient or missing flood insurance policies can further exacerbate the situation of flood-affected businesses (KPMG, 2016; Patankar, 2019). Aside from temporal decline in revenue, repair costs, or poor future prospects, the worst-case impacts may include business closures or unemployment among business owners and their employees (Bloch et al., 2012).
2.2 Data – post-flood survey of micro-businesses
The flood loss models for micro-businesses are built using empirical data from HCMC, and the transferability of the models is evaluated using empirical data from Can Tho. Both datasets are based on in-person structured surveys undertaken with flood-affected micro-businesses owners. The owner or the manager of the micro-business was asked to respond to the survey. They were informed about the project, how their responses would be used, and that they could leave the survey at any time. No personal or health-related information was collected in either survey. The data are stored and handled exclusively within the German Research Centre for Geosciences (GFZ) in compliance with data privacy and data protection regulations.
The workflow of this study presents the preparation of the survey datasets in the first main step (see Fig. S1); the respective key aspects are described in detail in the following sections and in Sect. S1 in the Supplement.
2.2.1 Ho Chi Minh City
The survey in HCMC was conducted during September–October 2020 and collected responses of 250 micro-businesses that experienced flooding between 2010 and the time of the survey (2020). The majority of micro-businesses surveyed in HCMC are shops or retailers (76 %), mostly selling groceries or other everyday objects. Around 17 % are services, such as restaurants or repair shop, and only 7 % produce consumer goods or processes raw materials. The shares of the business sectors presented in the HCMC survey are representative of the whole of Vietnam (General Statistics Office, 2018).
In order to achieve a reasonable representation of HCMC, we selected the districts with the most frequent flood risk and heterogeneity in socio-economic conditions. Within each district, the shop houses were chosen randomly. The sample size in each district was not chosen based on statistical considerations but on recommendation from local experts.
The interviewees could respond to questions on two flood events – the most severe event and the most recent event. However, not every interviewee provided information on both events, which led to 397 loss records in the HCMC dataset. Each record in this dataset comprises information about one or two types of flood losses experienced during an event. In detail, 361 samples from the loss records contain information about business interruption losses reported as relative values (e.g. reduced sales and production), while a similar sample size comprises flood losses of business contents reported as monetary values (e.g. losses of furniture, electrical devices, stored products, and vehicles). The conversion of the latter loss type to relative scales reduced it to 317 samples (relative content loss) using the value of business contents as exposure information (see Sect. S1). Consequently, the sample size referring to relative content losses (n=317) is smaller than for the relative interruption losses (n=361). Hereinafter both types of relative flood losses are referred to as flood loss variables (Table 1).
Table 1Candidate predictors and target variables related to flood losses in HCMC.
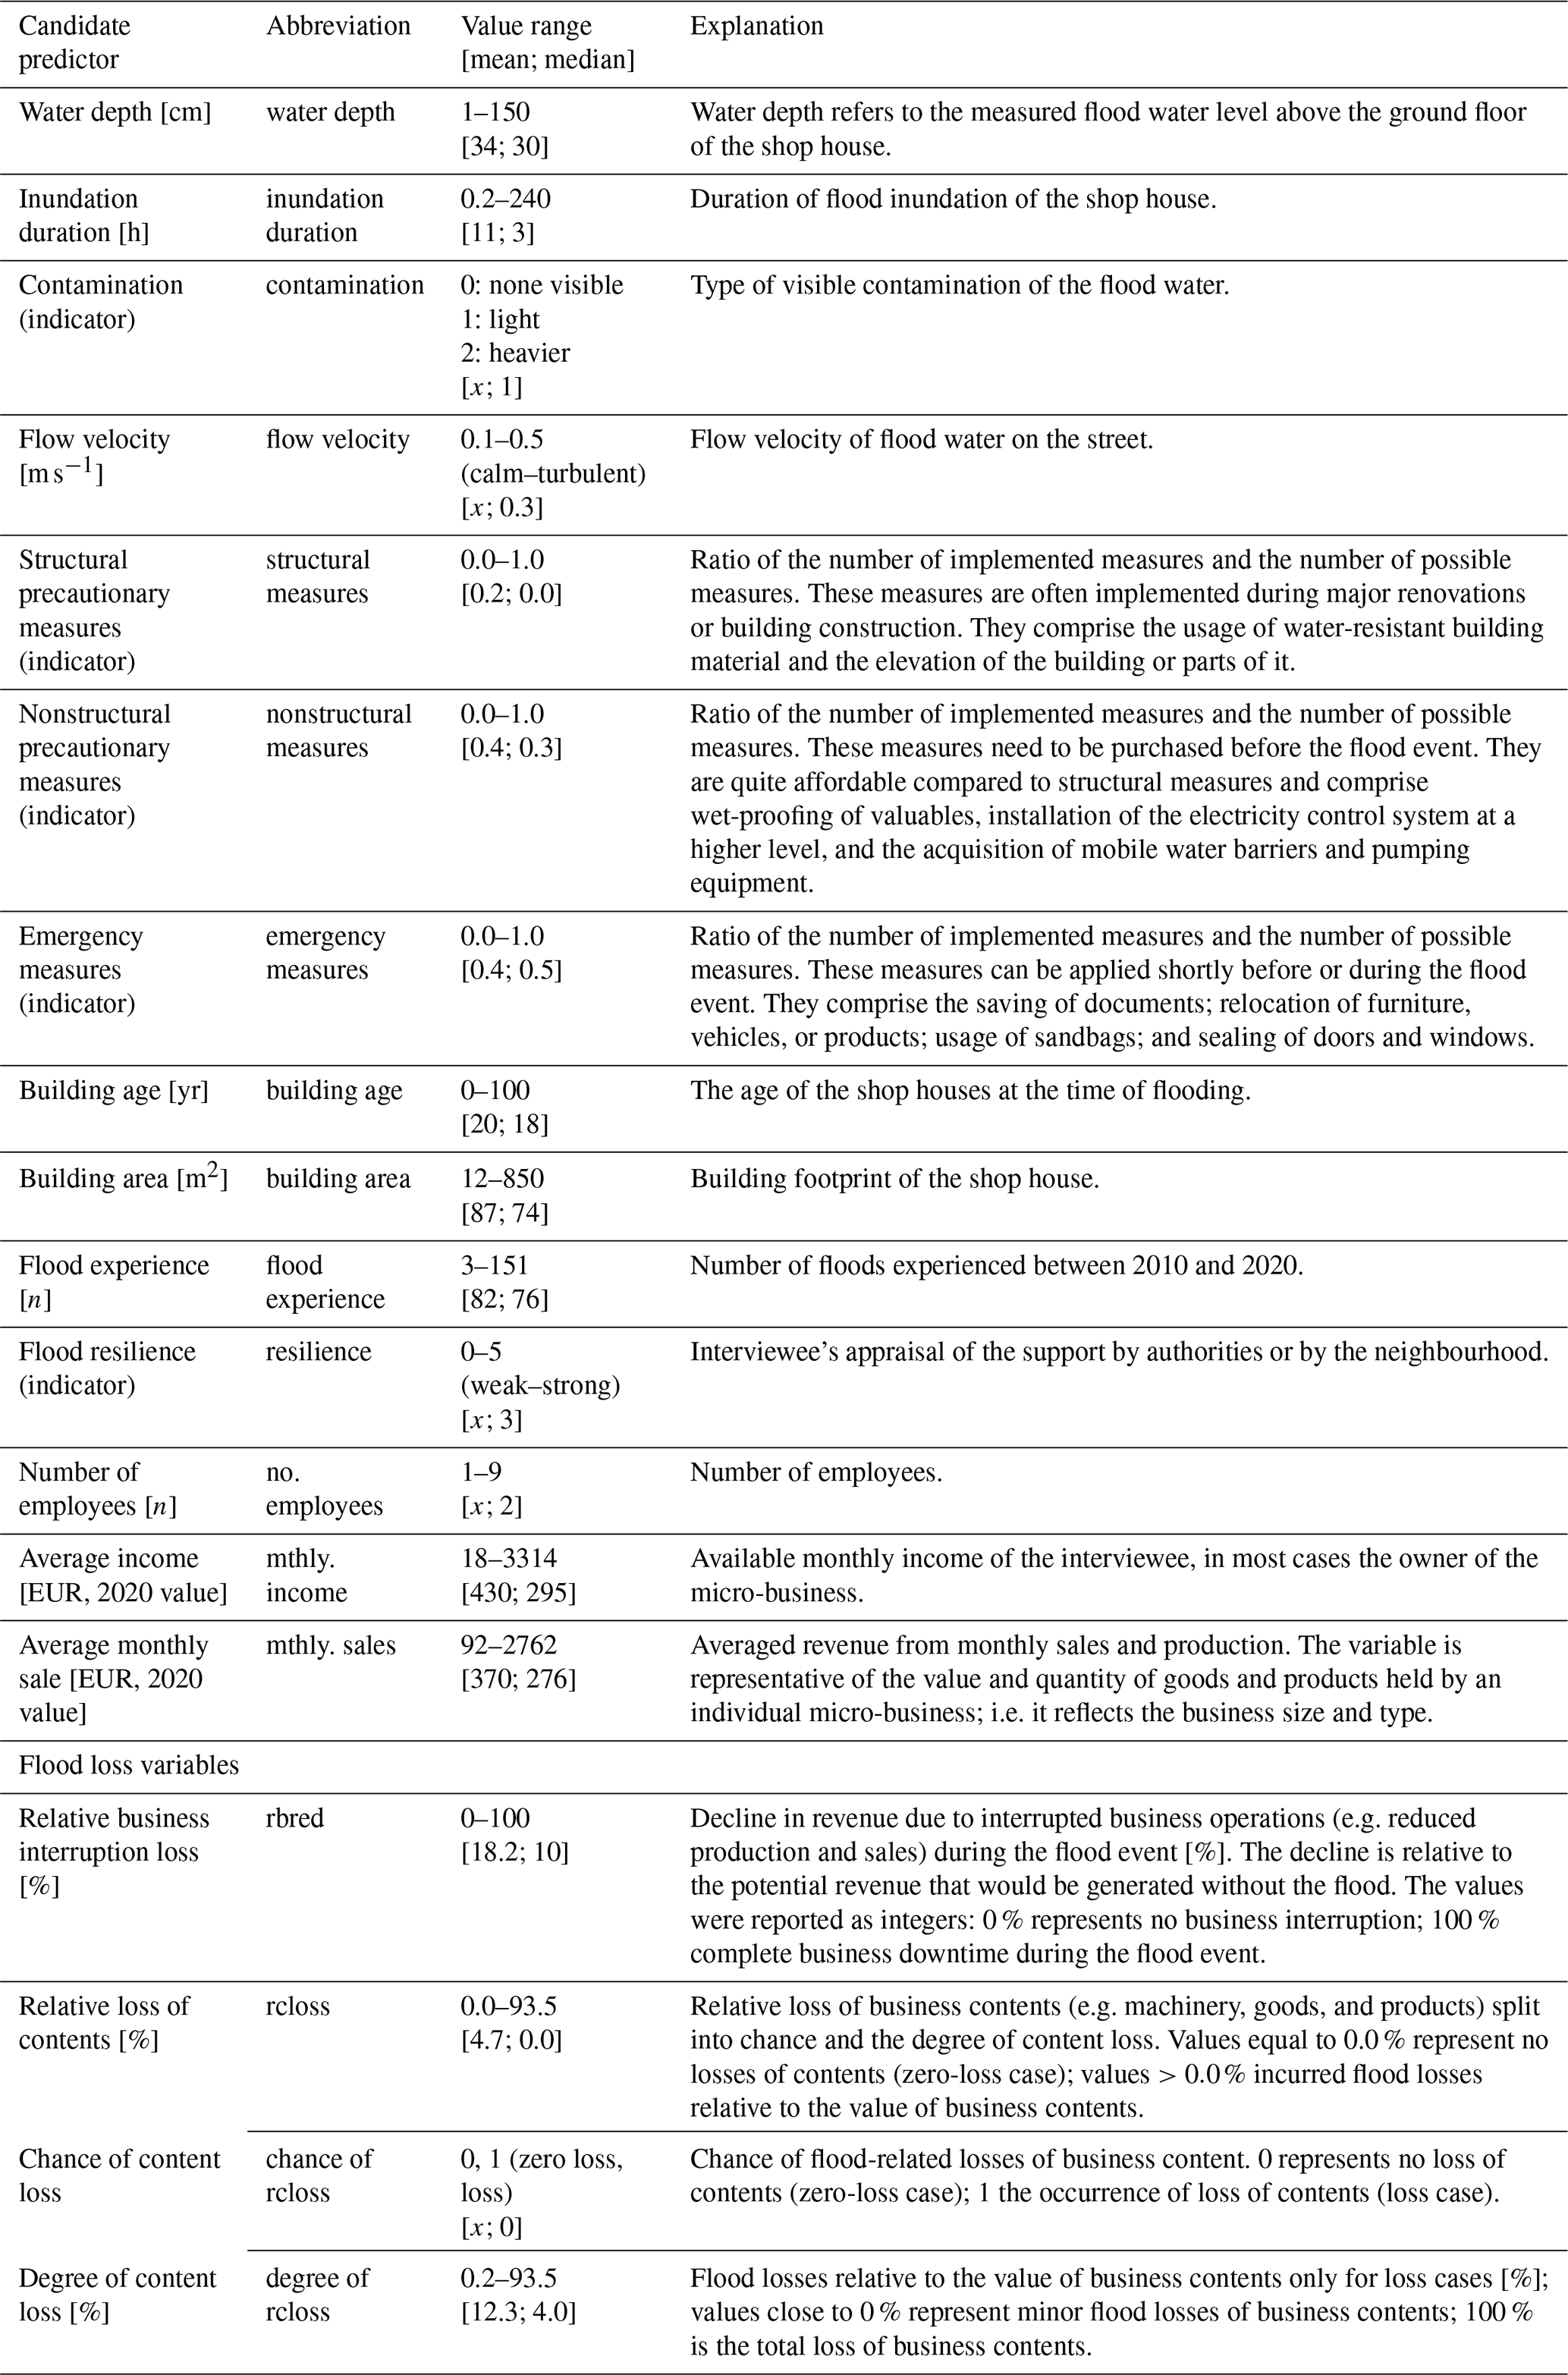
Figure 1 visualizes the approximate locations of the micro-businesses surveyed in HCMC. However, their exact geolocations are not shown to protect the anonymity of the interviewees. Furthermore, the map shows that the surveyed micro-businesses are often located near an open channel or tributary river.
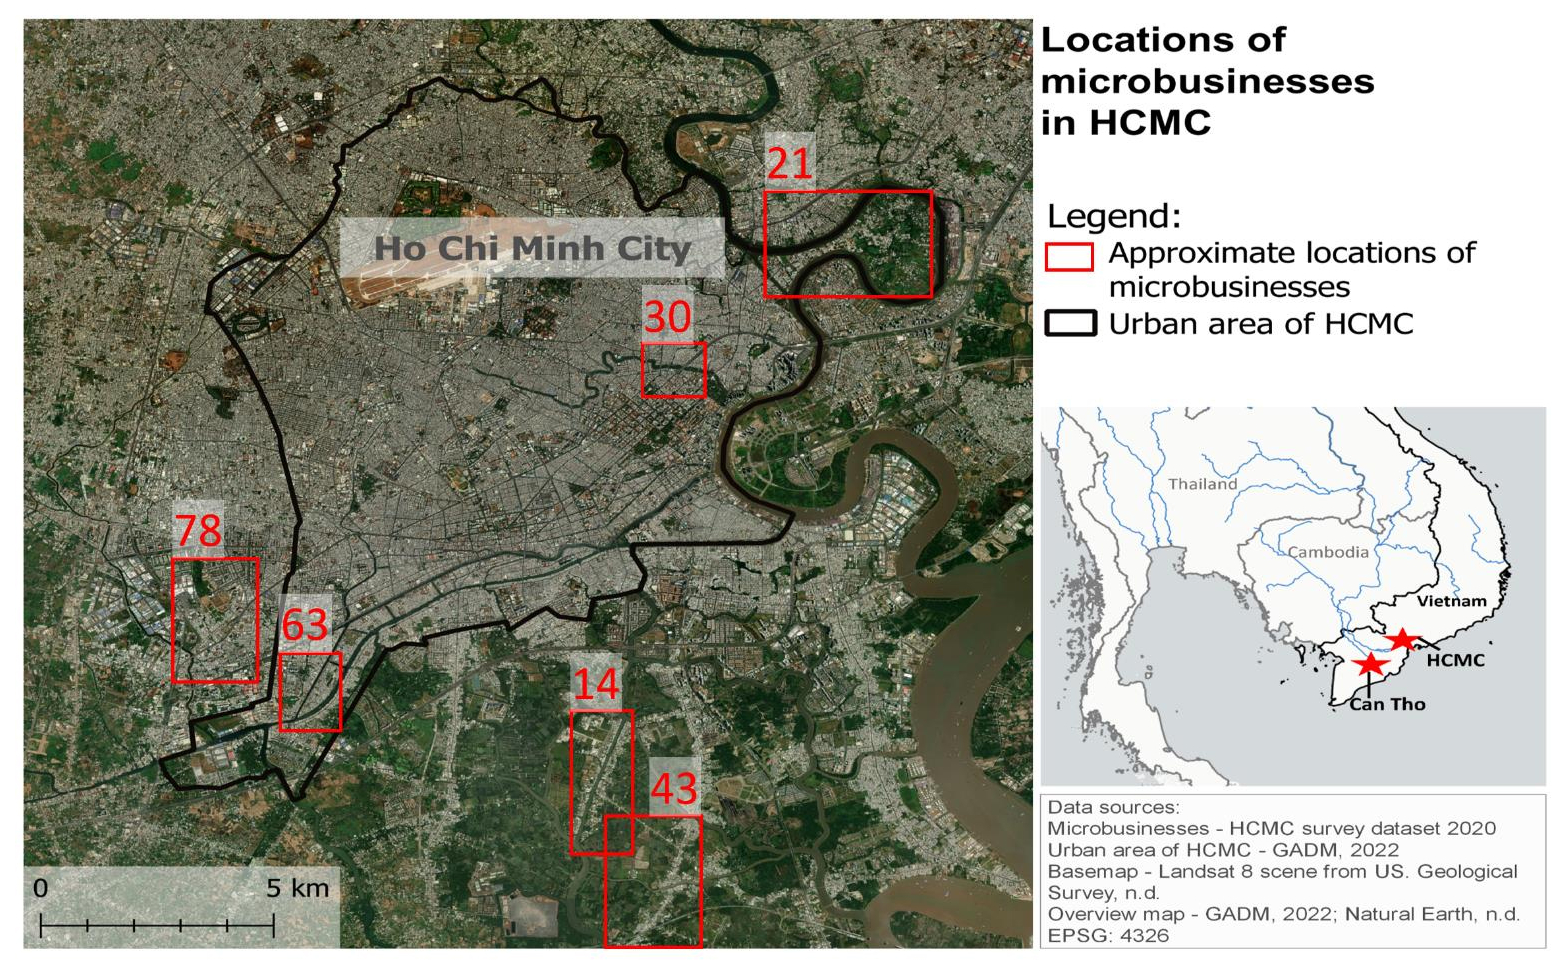
Figure 1Approximate locations of the micro-businesses surveyed that were affected by floods between 2010 and 2020 in Ho Chi Minh City (HCMC) are marked by red squares; the exact geolocations are not shown to protect the interviewees' anonymity. The values above the squares refer to the number of micro-businesses located in each square. The geolocation of one micro-business was highly inaccurate, and thus it is not shown in the map. The overview map on the lower-right side shows the locations of both study areas (HCMC and Can Tho) in Southeast Asia. However, the geolocations of micro-businesses in Can Tho are not reported.
2.2.2 Can Tho
Between August and December 2011, severe flooding affected several districts of Can Tho, causing damage to various economic sectors. The survey was undertaken in January–February 2012 and received responses from 373 micro-businesses, out of which 313 furnished information on losses of business contents and losses due to business interruption. The questionnaire is comparable to the survey undertaken in HCMC, except that each interviewee reported only about the most severe flood event in 2011 and provided information about the value of their business contents. The latter was used to calculate relative content losses. Furthermore, the micro-businesses' locations were not queried. All other preprocessing steps were the same as for the HCMC data.
The value distributions of common variables from the HCMC and Can Tho survey are shown in Fig. S2. Compared to the HCMC survey, the Can Tho dataset includes fewer micro-businesses operating in the trading sector (46 %). Consequently, more respondents provide services (45 %) or belong to Can Tho's manufacturing sector (9 %). Details on the preprocessing of the Can Tho survey data are provided in Sect. S1.
In order to derive the drivers of flood losses and to develop the loss models, the 14 preprocessed candidate predictors from the HCMC dataset are used (Table 1), while the data from Can Tho are used to assess the models' transferability.
Our approach to modelling flood impacts specific to micro-businesses consists of two components (see Fig. S1). First, we identify the drivers of content and interruption losses of HCMC's micro-businesses based on the set of candidate predictors (Table 1). For this feature selection, a variant of the random forest – the conditional random forest – was chosen since it provides a feature importance method not biased towards correlated predictors (see Sect. 3.1). Second, we calibrate probabilistic loss models – nonparametric Bayesian networks – specific to the micro-businesses based on the drivers identified (see Sect. 3.2).
Since more than half of the businesses in both cities reported no or only marginal losses of contents (see Fig. S4a and b), we model the chance of loss of business contents separately from the degree of loss. The former represents the absence or presence of loss of contents of micro-businesses and is binary (absence/presence), while the latter represents the severity of the loss experienced and is a continuous value (0, 100]. In contrast, a majority of the businesses reported incurring interruption losses; hence, the aspects of business interruption loss (chance and degree of interruption loss) were not considered separately (see Fig. S3).
The predictive performance of the machine learning (ML) model used for feature selection and of the flood loss models was assessed by the mean absolute error (MAE), root-mean-squared error (RMSE), mean bias error (MBE), and symmetric mean absolute percentage error (SMAPE). The MAE metric was chosen due to its outlier robustness as a selection criterion for the cross-validation of the ML-based models (Chicco et al., 2021). The equations of the performance metrics are listed in Table S1 in the Supplement.
3.1 Feature selection
3.1.1 Conditional random forest
The candidate predictors for flood losses presented in Table 1 exhibit a moderate to high degree of multicollinearity; for instance, the flood-related features are strongly correlated with each other. For this reason, conditional inference trees were applied to account for these correlations during feature selection. Conditional inference trees were initially introduced by Hothorn et al. (2006) and extended by Strobl et al. (2007) to an ensemble of trees, a conditional inference random forest (CRF). Each tree is grown only by a subset of features, which were identified before as significant based on their p values (Hothorn et al., 2006). Using this approach, predictive features are identified despite their potential collinearity with other candidate predictors. The choice of an unbiased version of the permutation-based feature importance method – namely conditional permutation importance (CPI) – further reduces the chance of biased importance scores for correlated features (Debeer and Strobl, 2020). The CPI accounts for linear and nonlinear interactions of correlated predictors using a chi-squared test (Debeer and Strobl, 2020). Although the CPI is a measure well suited to feature selection in CRF models (Levshina, 2020), the method is rather computationally expensive, but it is applicable to the presented approach due to the rather small sets of training samples.
For each of the flood loss variables a CRF model was trained and evaluated via nested cross-validation. Nested cross-validation is a state-of-the-art technique for determining the unbiased generalization ability of a model (Krstajic et al., 2014). It is recommended for relatively small datasets in particular (Brill, 2022; Liu et al., 2022). 10 repeated inner folds were used for hyperparameter tuning and 10 outer folds for performance evaluation of the estimators. Of these 10 evaluated estimators, the estimator with the best performance (smallest MAE score) was used for feature selection, i.e. for identifying the drivers of the degree of content loss and relative interruption loss of micro-businesses.
3.2 Probabilistic flood loss models for micro-businesses
3.2.1 Probabilistic logistic regression
The chance of content loss, as one component of relative content loss, is modelled using a probabilistic logistic regression model applied to the candidate predictors from Table 1. To prevent model overfitting, probabilistic logistic regression incorporates L1 and L2 regularization, which effectively manage multicollinearity in the feature space. The model returns the probability of assigning a micro-business to either the zero-loss or the loss category. However, the sample sizes between both categories are imbalanced (see Fig. S4a). To overcome this imbalance, the logistic regression model was trained on a weighted sample of zero-loss and loss cases. Similar to the CRF (see Sect. 3.1.1), the logistic regression model was also trained and evaluated using nested cross-validation consisting of 10 inner and 10 outer folds. However, we used all validated classifiers for modelling the chance of content loss rather than a single classifier due to their moderate predictive performance.
3.2.2 Bayesian network
Bayesian networks (BNs) are probabilistic, graphical models with many applications to flood loss modelling (Vogel et al., 2014; Wagenaar et al., 2018; Rözer et al., 2019; Paprotny et al., 2020, 2021; Rafiezadeh Shahi et al., 2024). They perform better in regional transfer settings compared to other ML-based models such as regularized linear regressions since BNs can be applied to incomplete information. Furthermore, they have the benefit of explicitly representing the dependency structures, quantifying uncertainty, and including expert knowledge alongside data. In more detail, the dependency structure of a BN represents (assumed) causal relations between variables; these dependencies can be set based on knowledge or logical conclusions.
In this study, nonparametric Bayesian networks, were chosen to model the degree of content loss and to model the relative business interruption loss. As the term “nonparametric” indicates, this type of Bayesian network does not rely on prior assumptions about the distribution of the data (Du and Swamy, 2019). Nonparametric BNs were first introduced by Kurowicka and Cooke (2006) and later extended by Hanea et al. (2006, 2015). They instead make use of the ranks of the empirical data, which is favourable in terms of the varying distributions of flood losses and their potential drivers. These drivers are used to construct the graphs of the BNs. Confirmed by the Cramér–von Mises measure for the single-variable pairs of the BN graphs, the joint distributions of the variables are represented by Gaussian copulas.
The flood loss models constructed are calibrated and validated on the flood losses reported in HCMC. The performance of the single Bayesian network model for relative interruption loss was determined by 5-fold cross-validation, while the performance of the modelling approach used for relative content loss was assessed by calculating the prediction bias directly between the reported losses and their probabilistic estimates.
The transferability of these models is assessed based on their performance predicting flood losses in Can Tho. The performance of the models at each prediction task is benchmarked against the performance of a reference random forest (RF) model (Chinh et al., 2017).
The section is structured as follows. Firstly, the performance metrics of the CRF model are reported, and the most important flood loss drivers for micro-businesses are derived and discussed briefly (see Sect. 4.1). Subsequently, the drivers identified are used to construct the Bayesian network flood loss models (see Sect. 4.2). The loss models are validated (see Sect. 4.3) and their transferability to other delta cities is tested using the survey data from Can Tho as a case study (see Sect. 4.4). Finally, the model uncertainties and the limitations of the proposed approach are discussed (see Sect. 4.5).
4.1 Drivers of flood losses of micro-businesses
The cross-validation of the CRF model shows that all its estimators, validated on the outer folds of the nested cross-validation, have similarly moderate performance when predicting the degree of losses of contents and the relative interruption losses. Furthermore, the similar sets of hyperparameter values across the validated estimators show that the ML algorithm applied is suitable for both prediction tasks. The prediction of the degree of losses of contents results in an averaged MAE of 12.8 %, an RMSE of 18.4 %, an MBE of −0.2 %, and a SMAPE of 51.4 %, while the prediction of relative interruption losses leads to an averaged MAE of 17.5 %, an RMSE of 22.6 %, an MBE of 0.3 %, and a SMAPE of 59.9 %. However, high SMAPE scores are caused by less severe cases of content loss being overestimated, while moderate- and severe-loss cases are often underestimated by the estimators. The same applies to the prediction of interruption losses.
Revenue returned from business operations (mthly. sales) influences the severity (degree) of the loss of business contents the most, while the number of emergency measures applied has the greatest impact on interruption losses. Further main drivers for the degree of loss of contents and relative interruption loss are the age of the shop house (building age), hydrological variables, and monthly income (Fig. 2a and b).
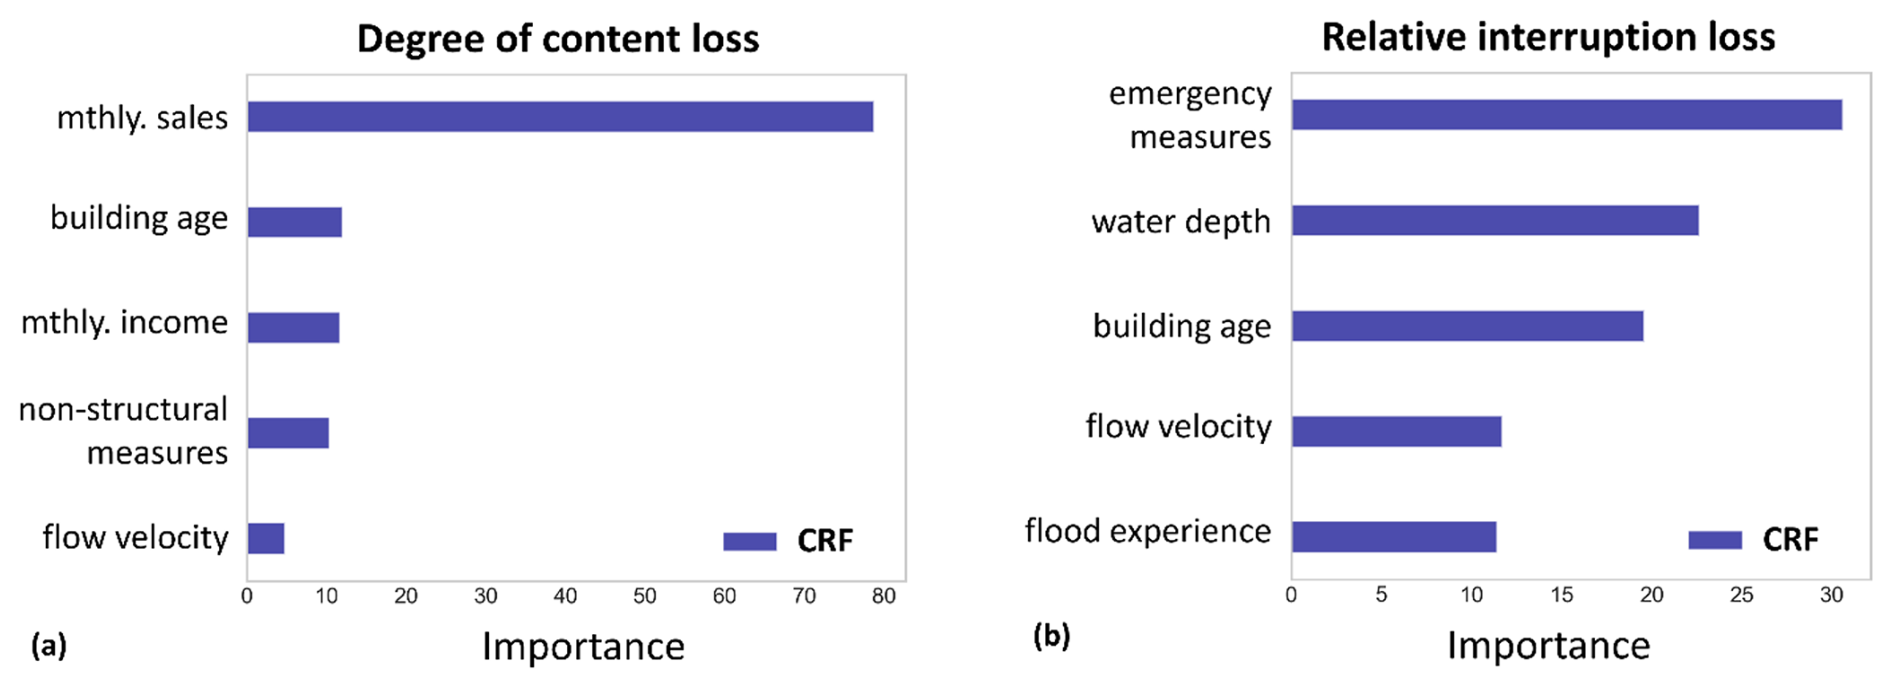
Figure 2Feature importance of the best-performing conditional random forest (CRF) estimator for predicting (a) the degree of losses of business contents and (b) the relative losses due to business interruptions in HCMC. Only the five most predictive features are shown.
The identified drivers of flood losses of micro-businesses in HCMC differ partly from those of companies with less flood experience in high-income countries. For instance, in Germany, the company's flood experience, size (number of employees), and the building area were identified as relevant for larger companies (e.g. Kreibich et al., 2007 (flood experience), Sieg et al., 2017 (employees – content loss), Sultana et al., 2018 (employees – interruption loss), Schoppa et al., 2020 (building area)). However, these factors were not found to be critical in the case of HCMC. Of these factors, the missing role of flood experience could be explained by HCMC's regular flooding, which leads to a high level of adaptive behaviour in the residents (Vishwanath Harish et al., 2023).
4.2 Bayesian network flood loss models
The graph of the nonparametric Bayesian network for estimating the degree of business content loss consists of six nodes; the graph for relative business interruption loss had five nodes. The structures of the graphs are visualized in Figs. 3 and 4. The first parent node of each BN graph was set based on the strongest unconditional rank correlation between a predictor and the target variable (degree of content loss, relative interruption loss). This highest unconditional correlation coefficient exists for both constructed BNs for the variable pair of water depth inside the building and the corresponding flood loss variable (Spearman's rank coefficient value, rho, for degree of content loss, rho: 0.37; for relative interruption loss, rho: 0.24). However, in the feature space for relative interruption losses, an equally strong correlation exists between the target and the indicator of emergency measures. This feature was identified by the CRF model as the most predictive for the estimation of the relative interruption losses (Fig. 2b) but was considered unimportant during the conditionalization of the BN, so the corresponding graph was constructed without it (Fig. 4). The variables for the remaining parent nodes were selected based on the strongest conditional ranking correlation, using the CRF ranking as a guideline to prioritize the testing of potential parent nodes.
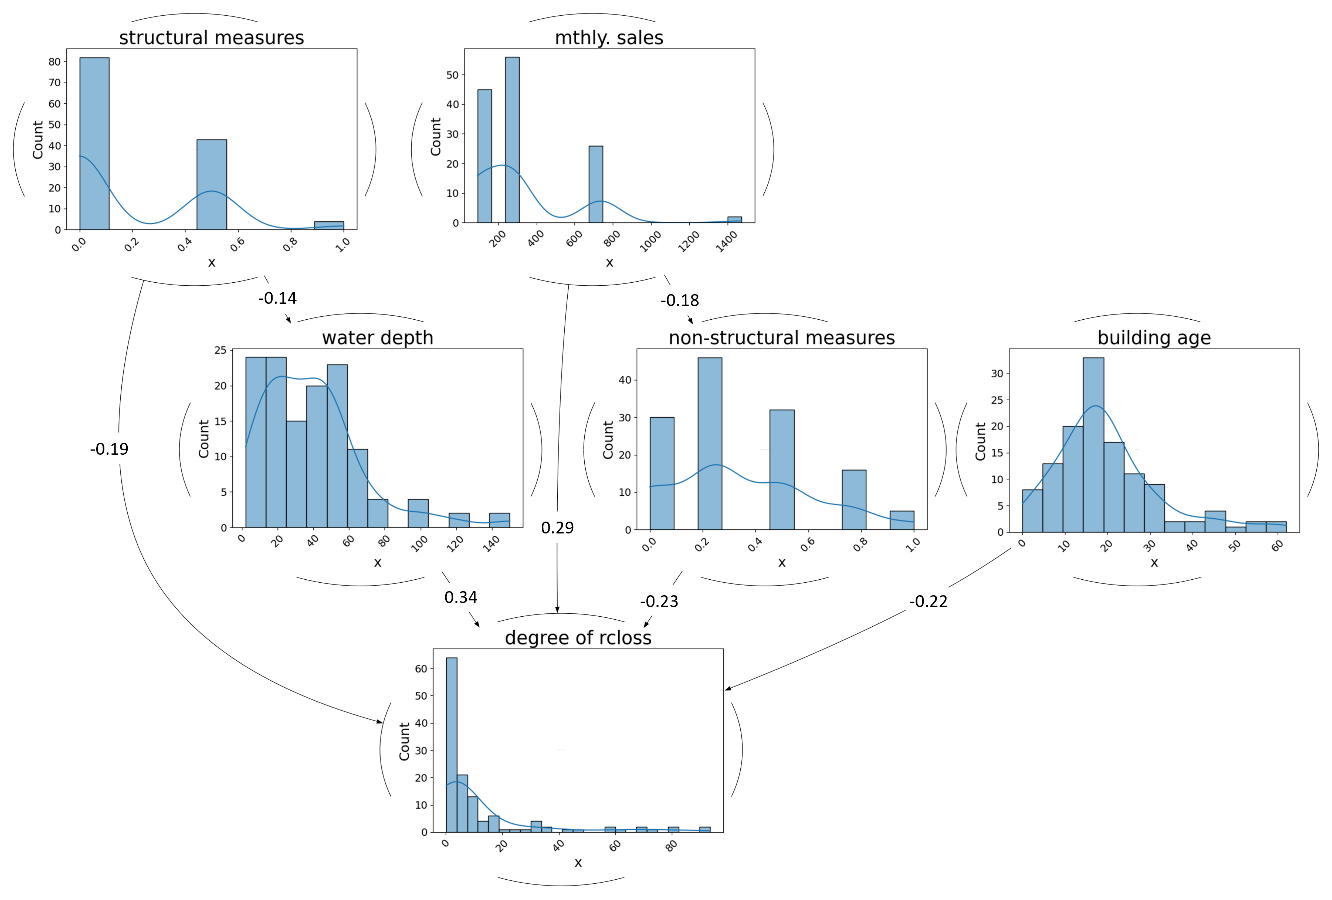
Figure 3Structure of the Bayesian network for predicting the degree of loss of the business contents (degree of rcloss). The values represent the rank correlation coefficients between the variables (rho).
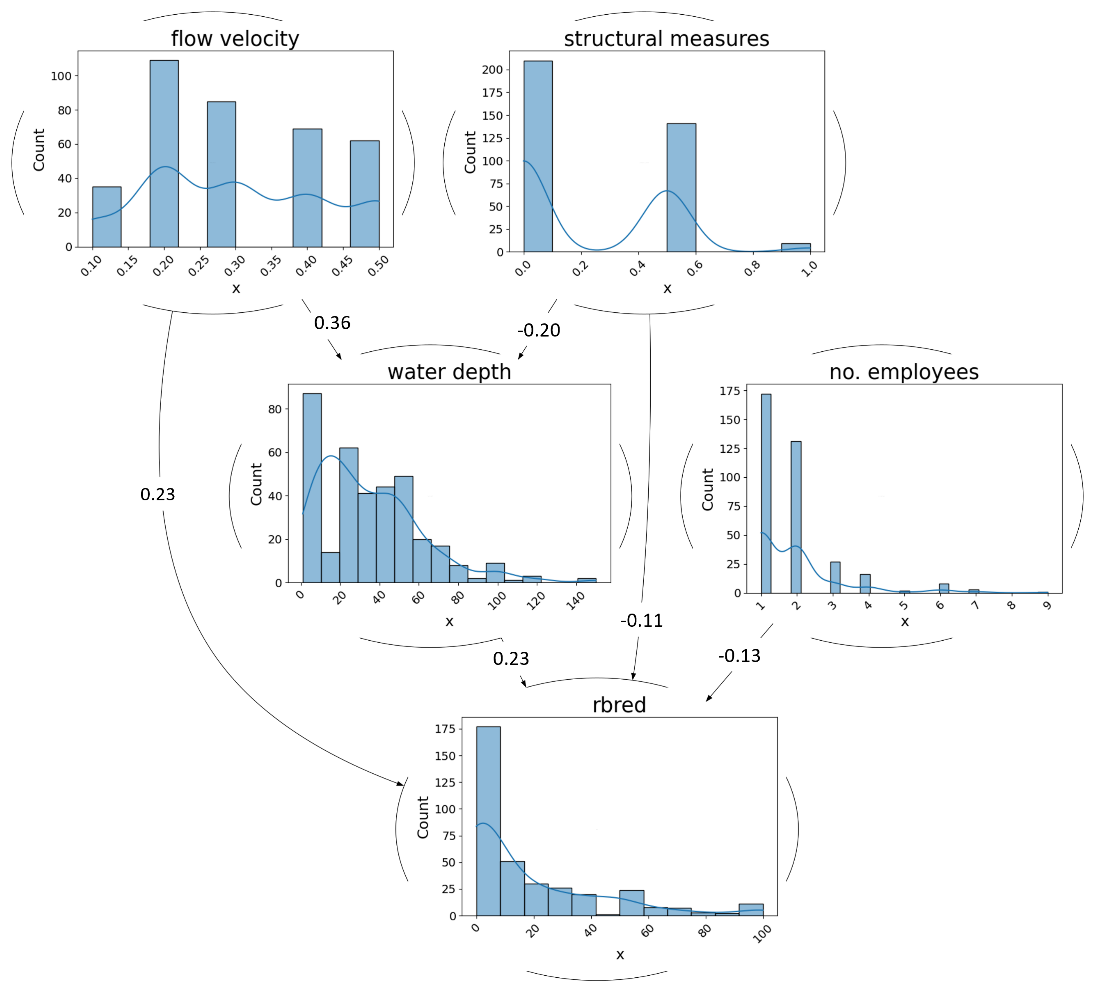
Figure 4Structure of the Bayesian network for predicting relative business interruption losses (rbred). The values represent the rank correlation coefficients between the variables (rho).
The predictors of flood losses and their assumed dependencies in the BN graphs are presented in the following:
-
The degree of losses of business contents and relative interruption losses correlate with water depth in the shop houses (water depth). It is the predictor with the strongest rank correlation with both flood loss types (rho: 0.34 in Fig. 3, rho: 0.23 in Fig. 4) and was also previously identified as a relevant predictor by the CRF model. Rising water levels in the building directly increase the potential damage to low-lying goods, equipment, and machinery (Kreibich et al., 2010; Chinh et al., 2015; Sieg et al., 2017). Apart from (non)structural damage, the flooding of the business premises themselves or indirect damage through power outages potentially lead to business interruptions (Kreibich et al., 2009; Sultana et al., 2018).
-
High flow velocities (flow velocity) on the streets are associated with more severe business interruptions, as indicated by a correlation coefficient of 0.23 (Fig. 4), but are not important for modelling the degree of content losses. Business activities are potentially affected when high velocities hamper transportation, such as when relocated objects block the streets, or damage infrastructure, such as the energy systems (Bloch et al., 2012). Additionally, flow velocities have a direct effect on the water level in buildings by pressing water through openings in windows or doors, as also expressed in the BN graph for relative interruption losses of Fig. 4 (rho: 0.36). However, the missing impact of flow velocity on the degree of content loss is explained by the high level of preparedness of HCMC's residents, with countermeasures such as the relocation of vehicles before potential flooding (Chinh et al., 2016), whereas business activities, especially those of shops and small retailers, cannot or can only partially be relocated to other premises.
-
Age of the shop house (building age) and degree of content loss have a negative relationship in the BN graph (rho: −0.22 in Fig. 3). The majority of shop houses in the HCMC samples were built in the 30 years before the flood event, i.e. mainly between the 1980s and late 2000s. These “newer” shop houses reported the most severe content losses, which can be explained by the strong urban pressure in these decades. The findings are confirmed by Downes and Storch (2014), Chinh et al. (2015), and Nguyen et al. (2016), who highlight the fact that “newer” buildings in HCMC are more flood-exposed than “older” ones.
-
The revenue from business operations (mthly. sales) is positively correlated with the degree of content loss in the BN graph, as shown in Fig. 3 (rho: 0.29). Monthly sales are seen as an indicator of the micro-business size and its type of business contents, as they reflect the heterogeneity among companies (Schoppa et al., 2020). The level of sales affect both exposure and vulnerability. Higher sales can increase exposure by driving expansion into risk-prone areas and requiring larger inventories, which are more susceptible to extreme-weather events. The variable of monthly sales has a negative correlation with the uptake of nonstructural precautionary measures in the graph for the degree of content loss (rho: −0.18 in Fig. 3). This is theoretically explained by the connections within the data: businesses with limited revenue are more likely to acquire nonstructural measures before the flood event, as loss of contents would have existential consequences for small retailers compared to more prosperous businesses.
-
As shown by the BN graph in Fig. 3, the implementation of nonstructural precautionary measures (nonstructural measures) reduces the severity (degree) of content losses of micro-businesses (rho: −0.23 in Fig. 3), although such measures are not relevant for modelling relative interruption losses. The impact of precautionary measures on reducing commercial content losses is well studied (Kreibich et al., 2007, 2010; Chinh et al., 2016; Sieg et al., 2017; Schoppa et al., 2020). Nonstructural measures usually prevent water from infiltrating the building but not in all cases. For instance, Chinh et al. (2016) found that in Can Tho, flood water can also come from the sewage system and thus bypass the precautionary measures implemented. Consequently, there is no link with water depth in our model due to the weak correlation between water depth and nonstructural measures.
-
The implementation of structural precautionary measures (structural measures) has mitigating effects on the severity of content and interruption losses of micro-businesses (rho: −0.19 in Fig. 3, rho: −0.11 in Fig. 4). The moderate dependencies in the BN graphs are in line with the findings of various studies, which highlight the usage of structural measures as an efficient individual precautionary measure (Scussolini et al., 2017; Trinh and Thanh, 2017; Du et al., 2020; Vishwanath Harish et al., 2023). The efficiency of these measures is represented indirectly in the BN graphs by lower water levels in the shop houses and directly in the flood loss variables; e.g. in elevated buildings, there is less chance that flood water will enter the building.
-
A higher number of employees (no. employees) is linked with lower interruption losses in the respective BN graph (rho: −0.13 in Fig. 4). Despite its rather-weak negative rank correlation, it improves the predictive accuracy of the BN model. The number of employees refers to the availability of human resources on which the business owner can draw, which in turn affects the possibility of keeping the business running during the flood event, for example, by relocating important business processes.
4.3 Flood loss model validation
4.3.1 Relative content loss
At first glance, the modelling approach consisting of a logistic regression and a Bayesian network seems to perform quite well when predicting relative content losses (MAE: 3.8 %, RMSE: 12.3 %). It marginally underestimates losses (MBE: −2.4 %) and has a remarkably low SMAPE of 16.3 %, indicating a good level of precision. The mean value of the modelled relative content losses is of a similar magnitude as the observed loss ratios (observed mean: 4.7 %, predicted mean: 4.6 %), as shown also by the clustering of the data points in the lower value range in Fig. 5a. However, the figure also illustrates that more severe losses of business contents are consistently underestimated by the models.
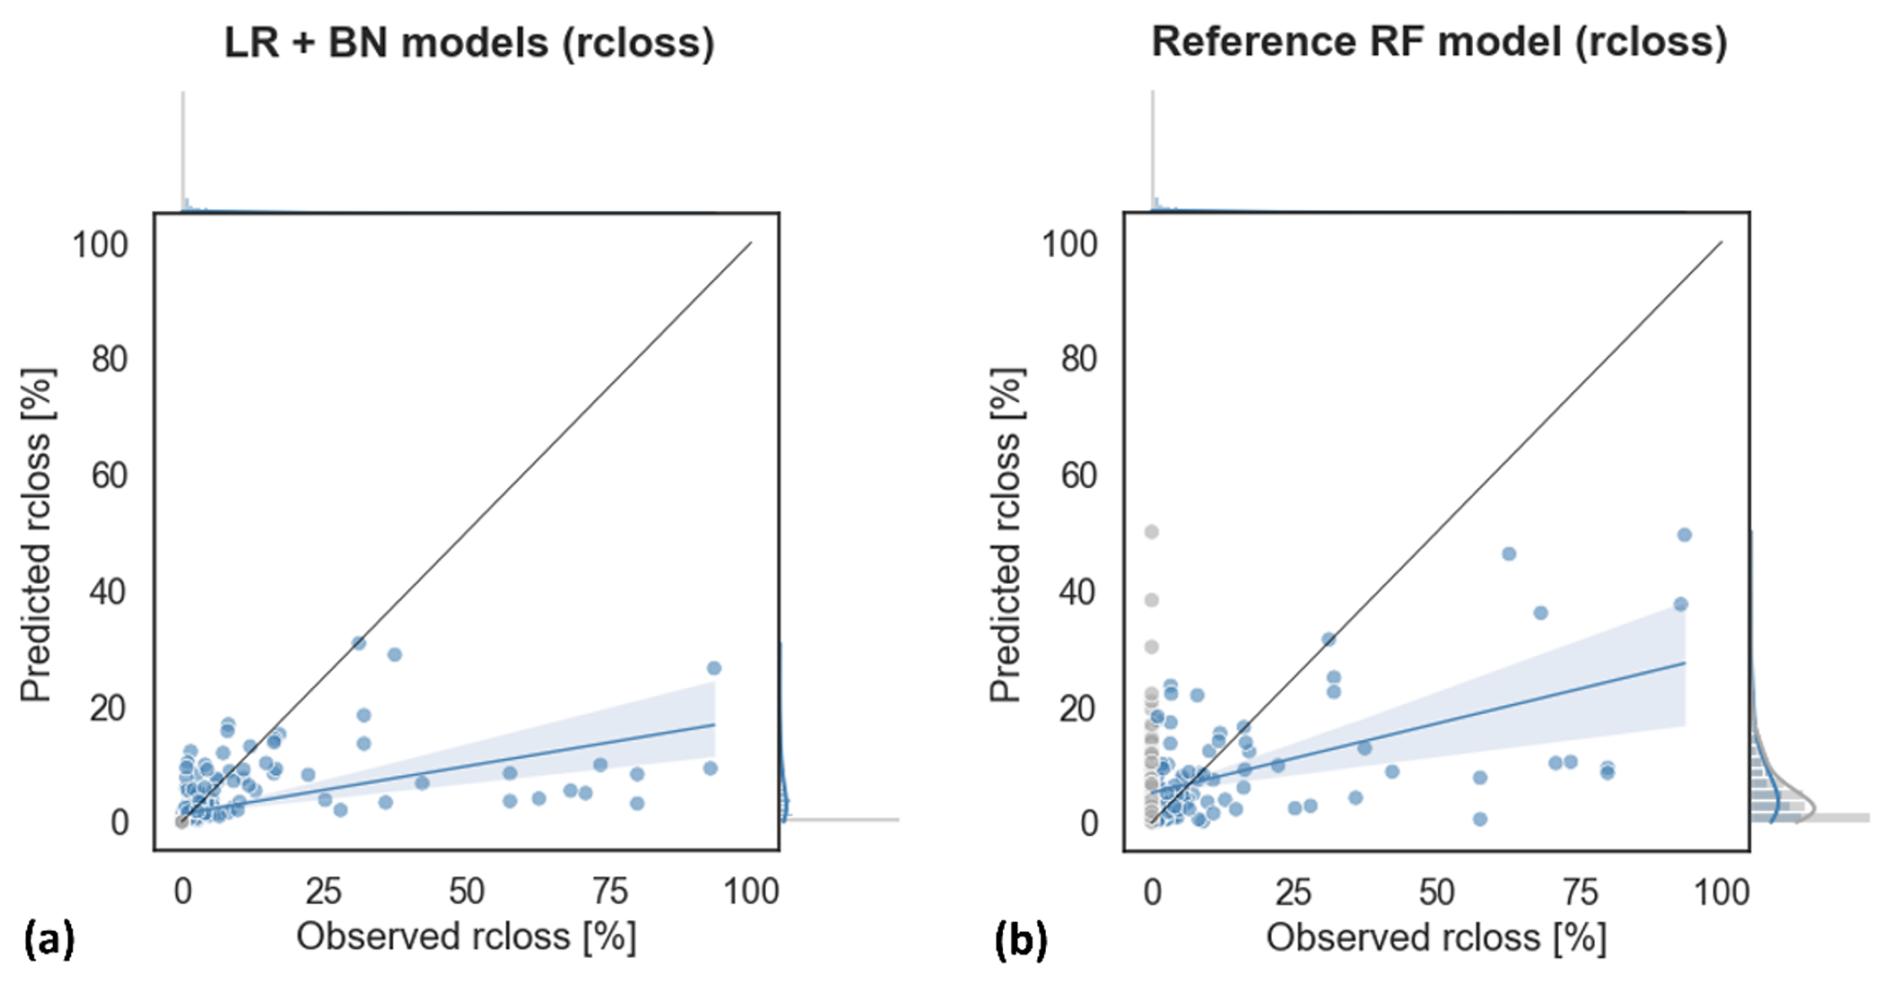
Figure 5Scatterplots of observed and modelled relative content losses (rcloss) of HCMC's micro-businesses for (a) the combination of logistic regression (LR) and Bayesian network (BN) models and (b) the reference random forest (RF) model used for benchmarking. The grey points represent the observations of zero loss. The ML-based classifiers assigned to most cases show an absence of content loss (zero loss); thus only one grey point seems to be visualized in (a).
The generally good predictive performance of the modelling approach is caused by the frequently low probability values for the chance of content loss. Having a critical look at the predicted probabilities of the chance of content loss, it becomes clear that the observed small prediction bias is caused by the logistic regression, which classified most samples of the chance of content loss as zero-loss cases. Thus, it assigns a low probability of losses to most predictor combinations (see the high share of cases predicted to be zero losses in the left half of Fig. 6a).
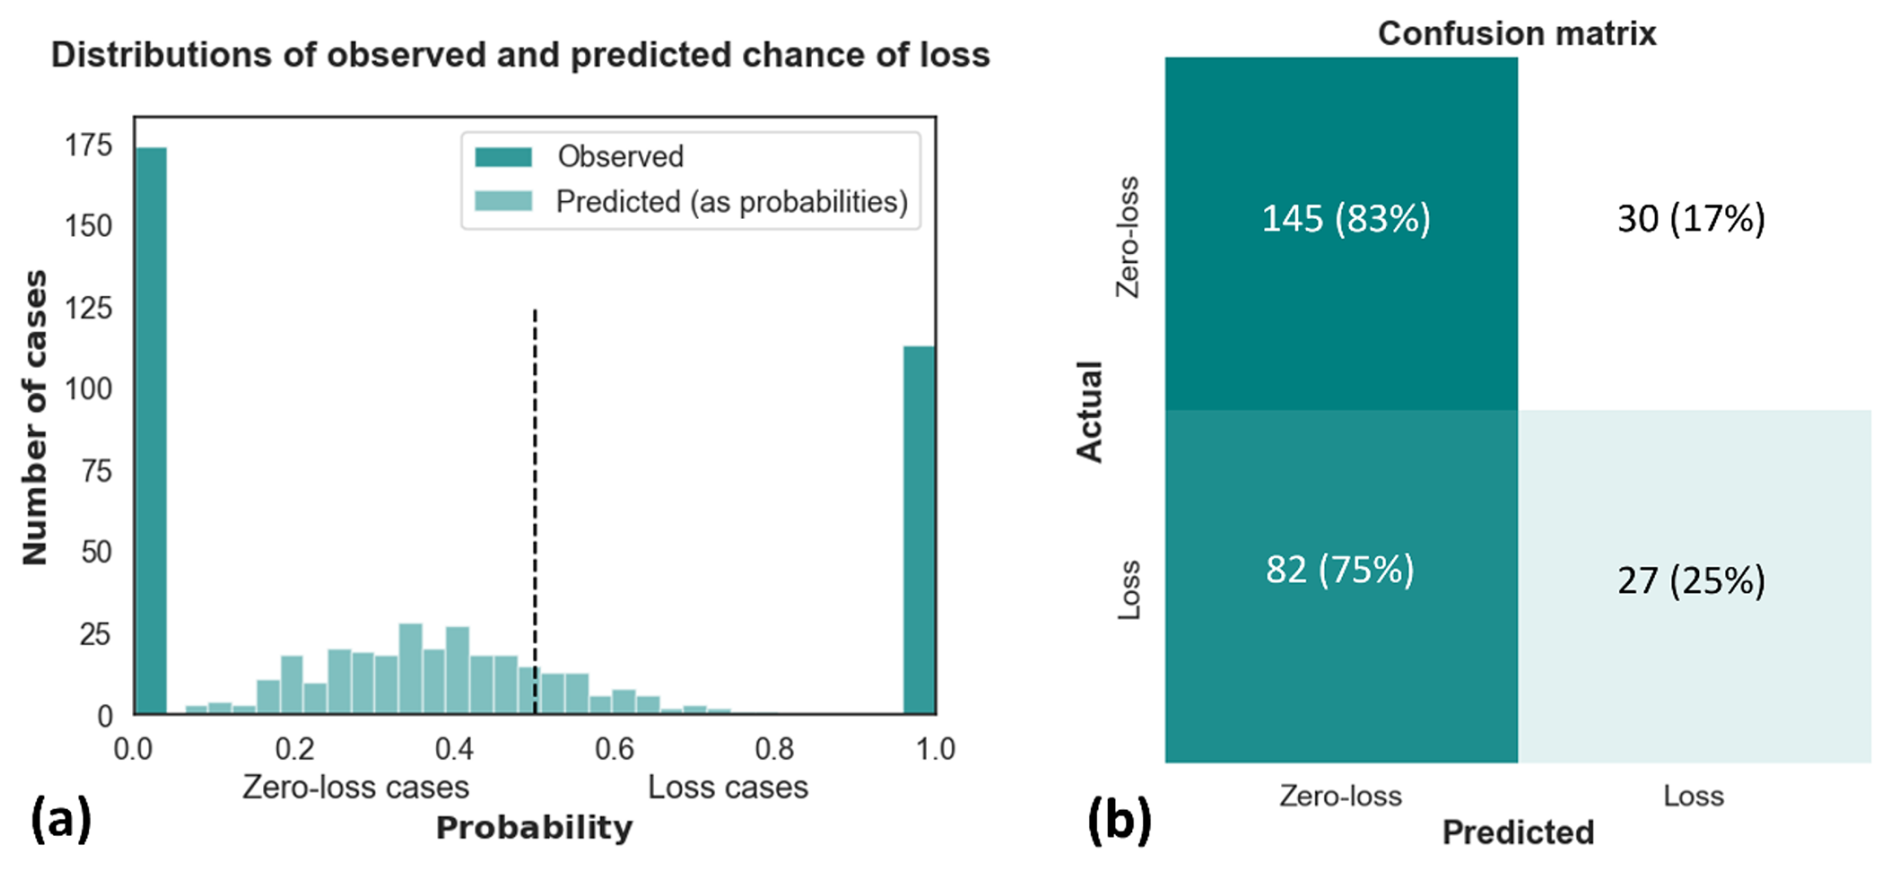
Figure 6(a) Distribution of observed (either 0.0 or 1.0) and predicted probabilities for the chance of loss of contents. A vertical dashed line separates the observed and predicted cases of zero loss from the observed and predicted loss cases. (b) The corresponding confusion matrix for the chance of loss of contents. The values in front of the brackets are the sample numbers; values in the brackets are the sample numbers normalized over the observations.
The large number of observations of content loss wrongly predicted to be zero losses further illustrates this (see false positives in the lower-left corner of Fig. 6b); only 25 % of the content losses experienced (loss cases) are correctly predicted by the ML classifiers (see true negatives in the lower-right corner of Fig. 6b).
As a consequence, most estimates of the relative loss of business content are reduced by more than half as soon as they are multiplied by the predicted probabilities for chance of loss. In particular, the estimates of severe cases of content loss are reduced in their magnitudes. Furthermore, the ML-based classifiers could hardly distinguish between cases with an absence of loss (zero loss) and small loss fractions (near-zero loss), which further reduced their calibration and performance.
In comparison to the modelling approach, the reference random forest model (Chinh et al., 2017) does not capture reported cases of zero loss as such. This is shown when comparing the predicted values of zero-loss cases from the modelling approach (see the grey dots in Fig. 5a) with the ones from the reference RF model (see grey dots in Fig. 5b). However, the general predictive performance is only marginally worse (Table 2). The cross-validated RF estimators have, on average, similar RMSE (12.4 %) and MBE (1.3 %) magnitudes as those in the modelling approach but have higher MAE (7.2 %) and SMAPE (78.9 %) values.
Table 2Model validation of flood loss models in HCMC and in the transfer region (Can Tho). The different sample sizes are due to the differences in the number of cases reported and in the way in which incomplete samples are treated in the models. MAE scores highlighted in bold font indicate the best-performing model in each subgroup.
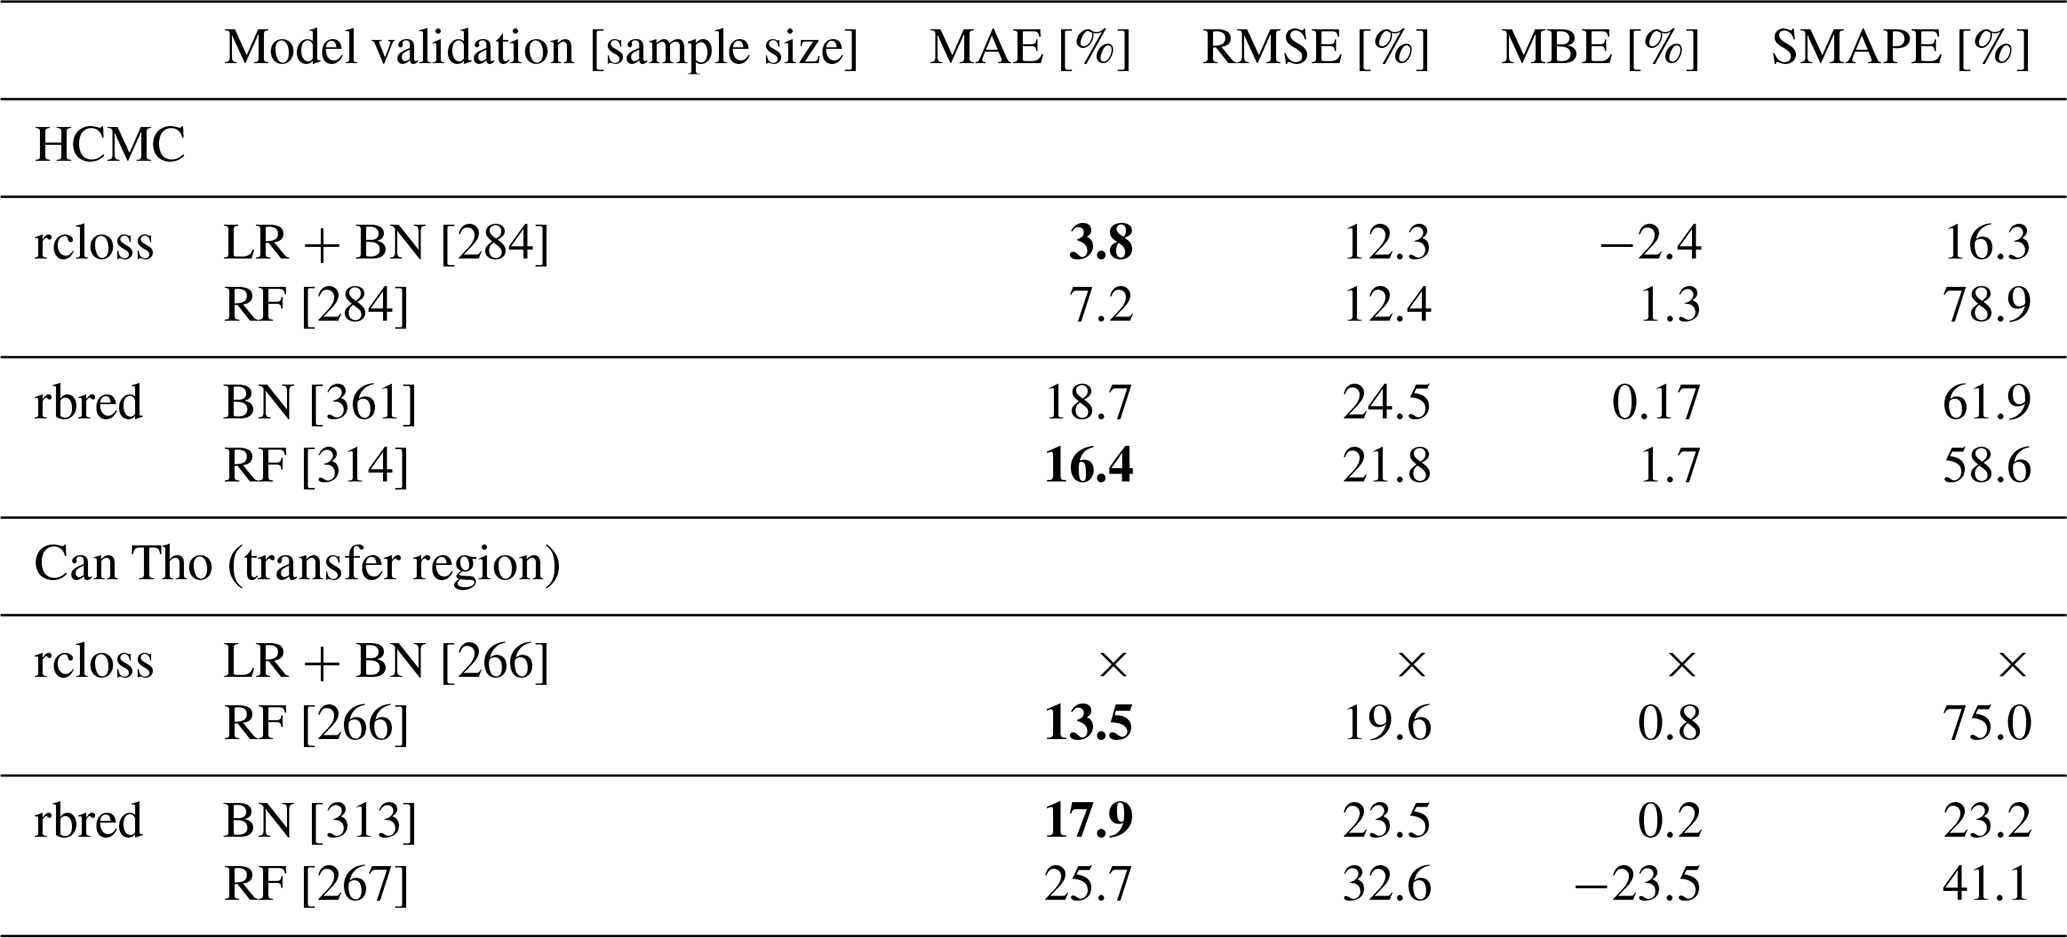
rcloss: relative loss of business content, rbred: relative loss due to business interruption, LR: probabilistic logistic regression, BN: Bayesian network, RF: reference random forest, ×: not applicable.
4.3.2 Relative interruption loss
The cross-validation of the BN model for relative interruption losses results in an averaged MAE of 18.7 %, an RMSE of 24.5 %, an MBE of 0.17 %, and a SMAPE of 61.9 %. The modelled mean value of the interruption losses is almost equal to the observed mean of around 18.5 %, yet the variation in the observations is not well represented in the model estimates, as visualized in Fig. 7a. Nearly all reported cases of interruption loss are predicted by the BN, with loss fractions between 10 % and 40 %. This is much narrower compared to the variation seen in the reported loss ratios, ranging between a 0 % and a 100 % decrease in business revenue. Additionally, the figure shows that more severe cases of interruption loss are underestimated by the BN despite their rather frequent occurrence.
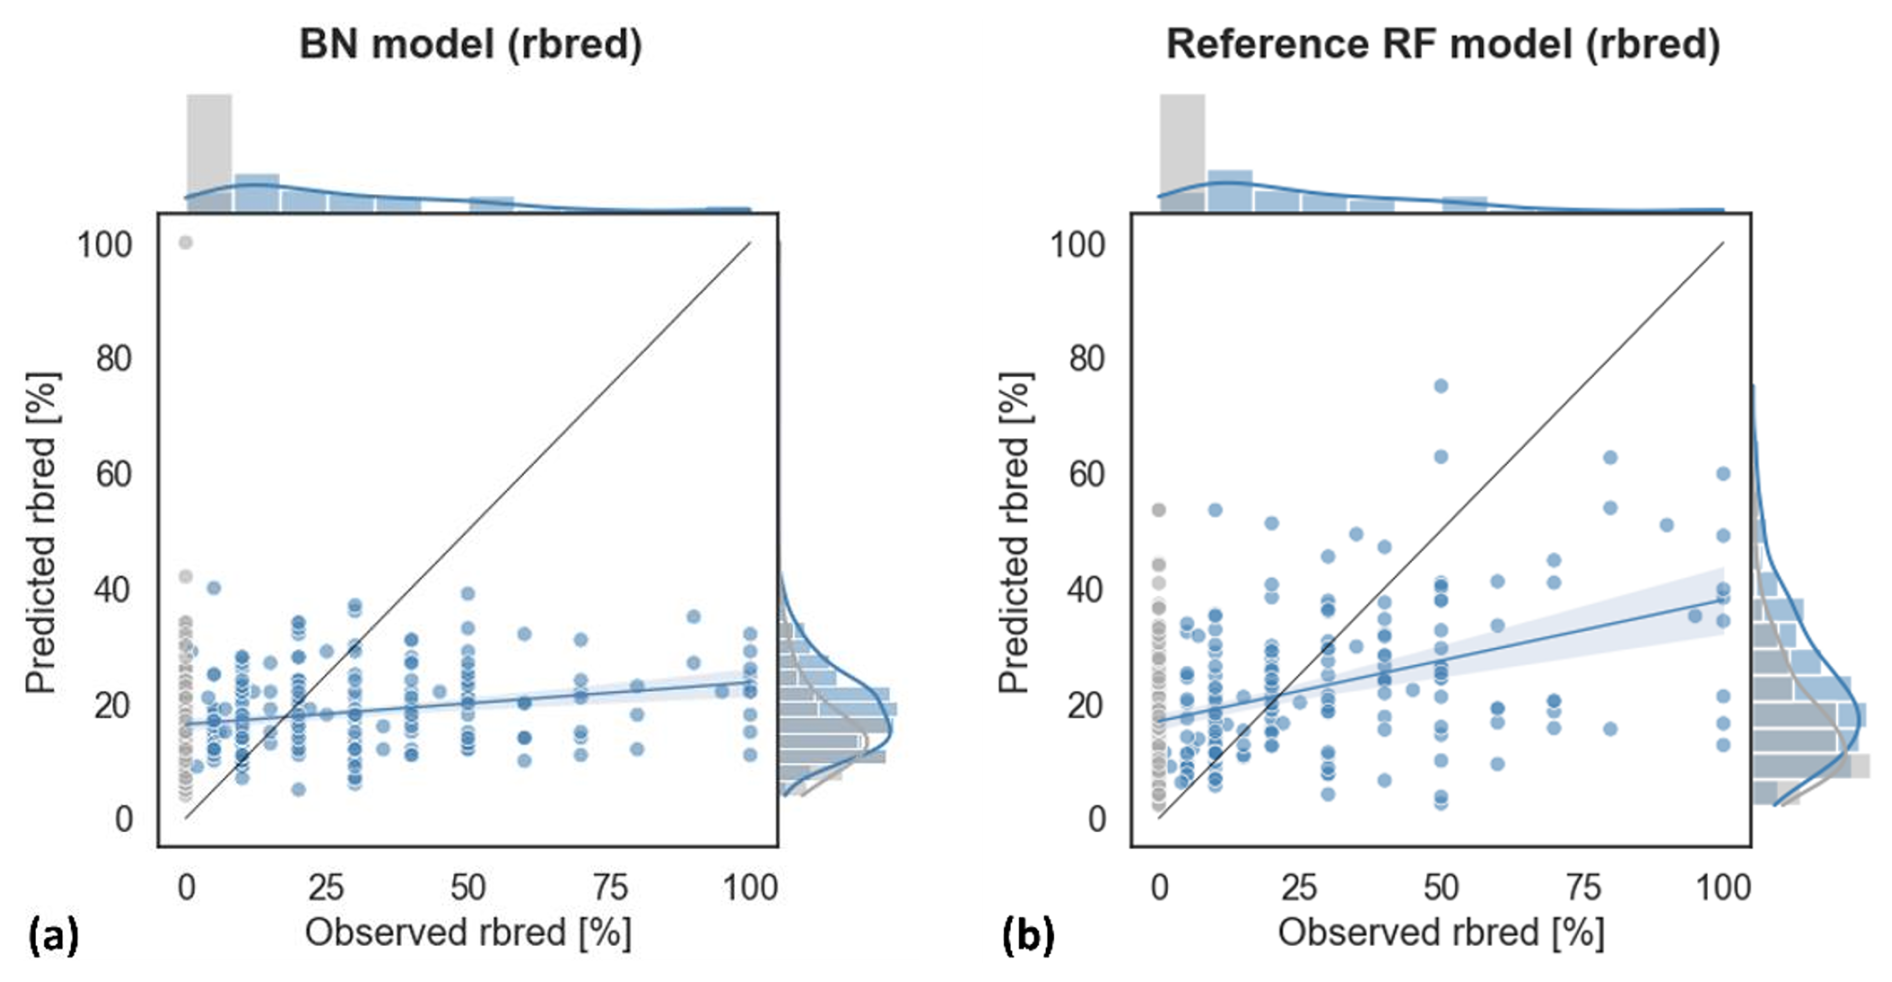
Figure 7Scatterplots for observed and modelled relative interruption losses (rbred) of HCMC's micro-businesses for (a) the Bayesian network and (b) the reference random forest model used for benchmarking. The grey points represent observations of zero loss, i.e. the absence of interruption loss.
The reference RF model results in similarly high prediction errors as the BN (Table 2). They overestimate cases of zero and near-zero loss in particular and underestimate severe loss cases (Fig. 7a and b).
4.4 Transferability of the flood loss models
In order to test the transferability, the interruption loss model calibrated on micro-businesses in HCMC was applied to predict interruption losses in Can Tho using a comparable survey dataset. The same procedure was applied to the models for content loss. However, the transferred logistic regression model was not able to capture the variation in chance of loss in the Can Tho samples. Thus, the study only presents the results of the transferred Bayesian network model for interruption losses and the corresponding reference random forest model.
The generalization ability of the BN model to the Can Tho samples results in similar prediction errors than during training on the HCMC samples, except for the SMAPE score. The transfer of the BN leads to an MAE of 17.9 %, an RMSE of 23.5 %, an MBE of 0.2 %, and a SMAPE of 23.2 %. The error scores show that the model's capacity to estimate interruption losses remains unchanged when transferred to Can Tho in contrast to the transferability of the reference random forest model, which resulted in degraded performance (Table 2). These findings are shown by the cumulative distribution functions (CDFs) in Fig. 8a and b. The cumulative distributions shown in this study represent the change in the predictive accuracy of a model due to regional transfer. In other words, the CDFs provide insight into the extent to which a transferred flood loss model suffers from the different information contained in the Can Tho samples. The CDFs are shown in their normalized version to facilitate comparability despite different sample sizes.
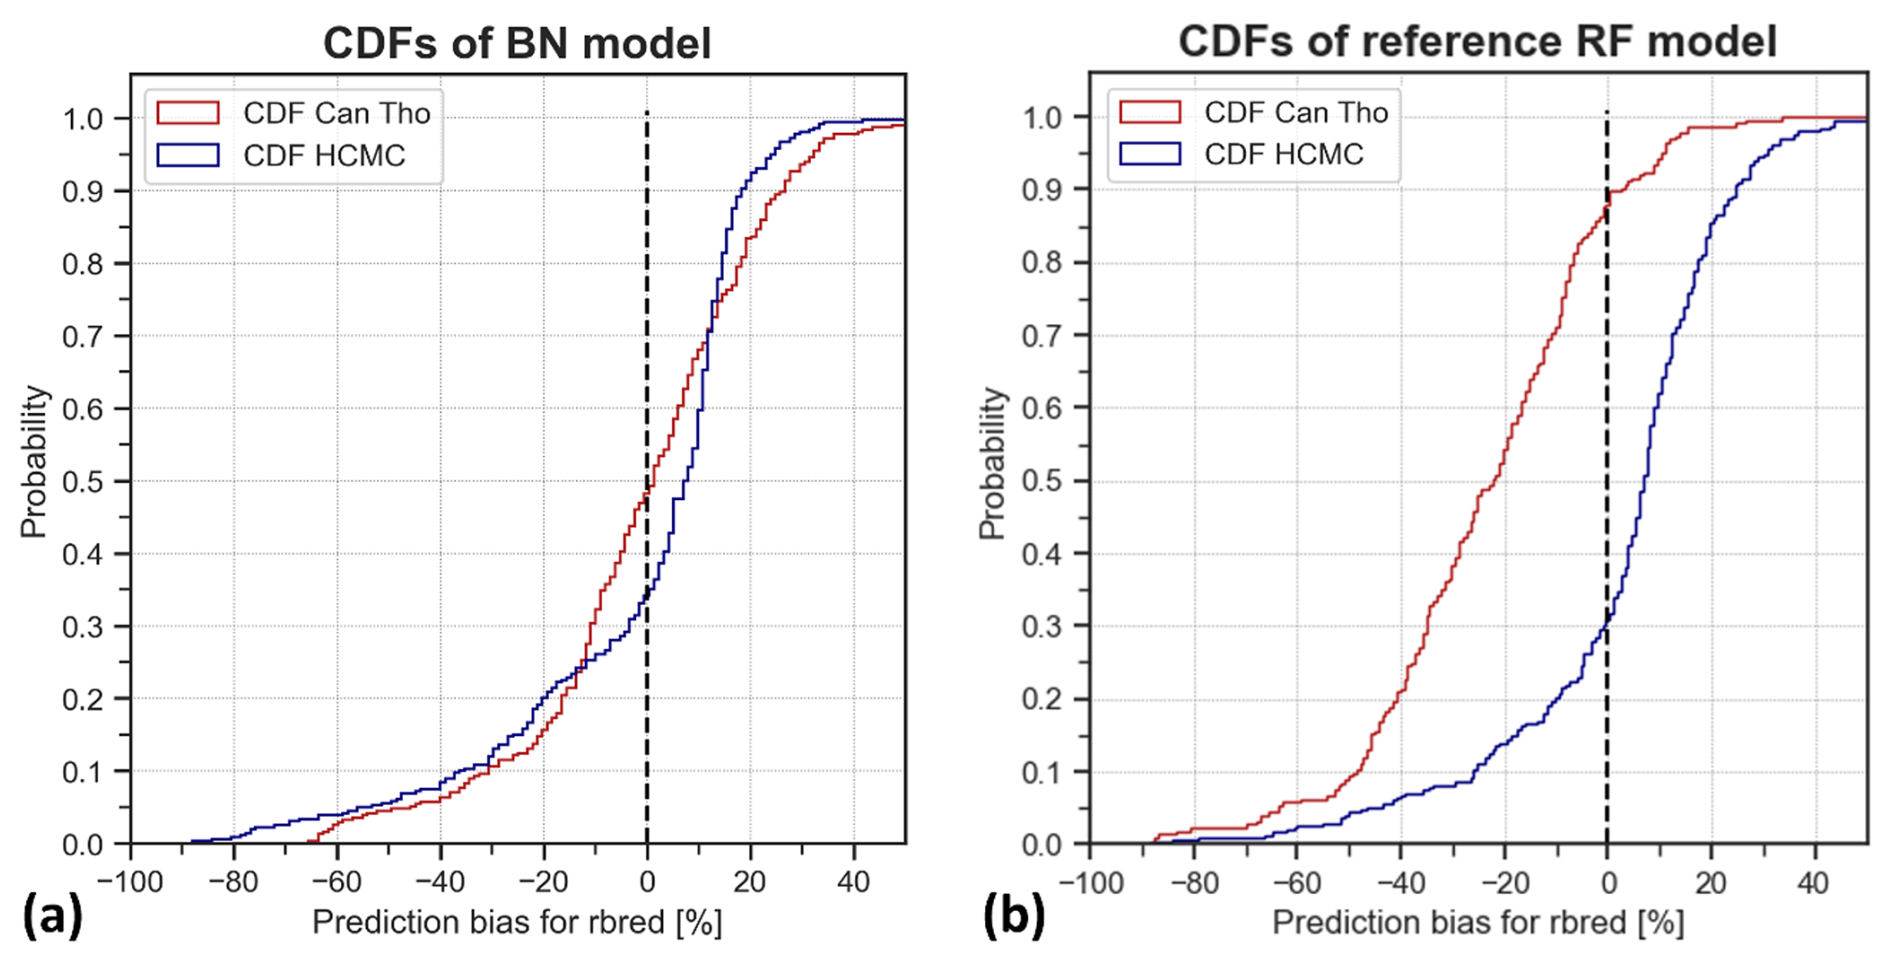
Figure 8The cumulative distribution function (CDF, normalized) of prediction errors for modelling business interruption losses (rbred) in HCMC and in the transfer region, Can Tho. (a) The CDF of the Bayesian network performance; (b) the CDF of the reference random forest model performance. The CDF for the reference RF model is cut by 50 %, as no larger prediction errors exist.
The probability of the BN predicting a Can Tho sample precisely (prediction ) remains unchanged (Fig. 8a) but drops for the reference RF model from around 45 % (HCMC samples) to 25 % (Can Tho samples) (Fig. 8b). The reference RF model underestimates interruption losses in nearly 90 % of the Can Tho samples but in only 30 % of the HCMC samples (Fig. 8b). These findings show that the reference RF model is less transferable than the BN model, despite both models performing similarly well at their calibration sites (i.e. HCMC).
Transfer experiments on (Bayesian network) flood loss models have highlighted the fact that model transfer usually leads to a stagnation or drop in the model's performance, in particular, when the new conditions differ remarkably from those in the calibration region (Schröter et al., 2014; Wagenaar et al., 2018). However, there was no drop in the performance of the BN model when transferred across regions. This is due to very similar local conditions between the calibration site (HCMC) and transfer site (Can Tho). These local conditions are reflected in the similar predictor ranges and distributions of both survey datasets (see Fig. S2). Additionally, the high heterogeneity in the HCMC samples, in particular in the hydrological, building-related, and business-related predictors, has the potential to increase the model robustness for new study sites (Wagenaar et al., 2018).
4.5 Applicability, limitations, and uncertainties
Reliable flood loss models are essential tools for stakeholders and practitioners across multiple sectors, including insurance, urban planning, flood risk management, and climate adaptation decision-making. The flood loss models presented in this study specifically address the economic impacts of flooding on micro-businesses in Vietnamese cities, focusing on business interruptions and content losses. To our knowledge, this type of economic sector is underrepresented in risk management, and the proposed models can advance decision-making with a focus on this sector. By representing key drivers of loss as graph structures, the models offer an interpretable and transparent framework for understanding how various factors contribute to flood-related damage. The models are based on nonparametric Bayesian networks, which enable probabilistic estimation of flood losses while explicitly quantifying uncertainty in both data and model formulation. This feature makes the models particularly robust, allowing for transparent assessment of risk and greater confidence in the results. Unlike traditional deterministic models, the Bayesian approach ensures flexibility in handling incomplete or uncertain data, which is a common challenge in flood loss estimation. The combination of an interpretable model structure and transparent uncertainty quantification opens the door to operationalize this modelling approach in practical settings. It provides stakeholders with a clearer understanding of how flood losses are calculated, promoting trust and facilitating decision-making. Furthermore, the model's ability to function effectively even with missing or limited data enhances its transferability to similar geographic regions and contexts. This adaptability is particularly valuable when expanding its application to data-scarce environments or to rapidly urbanizing areas where flood risks are evolving.
Despite these advantages, the models rely on empirical post-event survey datasets and have certain limitations. For instance, the sample was obtained voluntarily, which may introduce selection bias. The study focused on frequently flooded regions, including both well-established city areas and newly urbanized zones, to represent the city's expansion. However, the absence of official loss data prevents the validation of the reported figures, given the potential for underreporting in particular. In addition to the biases in the survey data, the modelling results indicate high uncertainty in reconstructing flood losses from survey data. One possible further analysis would be comparing the model estimates with those from other studies. However, comparability is limited by the fact that in contrast to our object-level modelling, state-of-the-art flood loss modelling in low- and middle-income countries is mainly carried out on the mesoscale or macroscale (Booij, 2004; Aerts et al., 2020; Tierolf et al., 2021), with commercial losses reported only in absolute values (Wijayanti et al., 2017; Patankar, 2019; Tsinda et al., 2019) and often without validation (Ke et al., 2012; Patankar and Patwardhan, 2015; Yang et al., 2016).
We did not observe an increase in model uncertainty in the Bayesian network model for interruption losses due to the regional transfer. Furthermore, the mean values of the empirical interruption losses are within the uncertainty ranges for both regions (within the 95 % confidence interval). However, as seen above, the majority of interruption-related losses are remarkably underestimated by the flood loss models.
The example of regional transfer illustrates the potential of nonparametric, continuous Bayesian network models compared to random forest models. However, since the transferability was validated for only one case study, there is a need to calibrate and validate the loss models using further local and temporal conditions.
We proposed a first approach to estimate flood losses of micro-businesses by combining expert knowledge with survey data on flood-affected micro-businesses from HCMC and Can Tho in Vietnam. A conditional random forest model was applied to obtain the main drivers of content and interruption losses from a set of heterogeneous samples and potential predictors that are partly correlated to each other. The drivers identified were used to calibrate knowledge-based probabilistic loss models consisting of nonparametric, continuous Bayesian networks and logistic regression. The findings of this study indicate that information on business revenue from monthly sales and production, building age, and hydrological characteristics of the flood is crucial in estimating content and interruption losses for micro-businesses.
The probabilistic flood loss models were calibrated and validated against reported flood losses in HCMC and in a transfer case study in Can Tho. The study resulted in interpretable and transferrable probabilistic flood loss models to predict the content losses and business interruption losses of micro-businesses. In addition, the models are openly provided, and integrating them with flood risk assessments has the potential to advance risk management decision-making with a focus on micro-businesses.
The survey data will be made openly available on the HOWAS21 database (https://doi.org/10.1594/GFZ.SDDB.HOWAS21, GFZ German Research Centre for Geosciences, 2020) after an embargo of 3 years after the end of the project (in 2027). In the meantime, the data can be accessed from the authors. The source code (Python) is openly available at https://doi.org/10.5281/zenodo.15226141 (Buch, 2025). The Bayesian network flood loss models were created with the PyBanshee toolbox (Koot et al., 2023); the conditional random forest models are based on the R package partykit (Hothorn et al., 2023, https://CRAN.R-project.org/package=partykit).
The supplement related to this article is available online at https://doi.org/10.5194/nhess-25-2437-2025-supplement.
Conceptualization: AB, DP, and NS; data curation, formal analysis, and visualization: AB; methodology: AB, DP, KRS, HK, and NS; supervision: DP and NS; writing – original draft: AB; writing – review and editing: AB, DP, KRS, HK, and NS.
At least one of the (co-)authors is a member of the editorial board of Natural Hazards and Earth System Sciences. The peer-review process was guided by an independent editor, and the authors also have no other competing interests to declare.
Publisher's note: Copernicus Publications remains neutral with regard to jurisdictional claims made in the text, published maps, institutional affiliations, or any other geographical representation in this paper. While Copernicus Publications makes every effort to include appropriate place names, the final responsibility lies with the authors.
The data collection was undertaken by the project DECIDER (grant nos. 01LZ1703G and 01LZ1703 A) and WISDOM II (“Water-related Information System for a Sustainable development of the Mekong Delta”), funded by the BMBF (German Ministry for Education and Research). Nivedita Sairam is funded by the project HI-CliF (grant no. 01LN2209 A), funded by the BMBF.
The article processing charges for this open-access publication were covered by the GFZ Helmholtz Centre for Geosciences.
This paper was edited by Sven Fuchs and reviewed by two anonymous referees.
Aerts, J. P. M., Uhlemann-Elmer, S., Eilander, D., and Ward, P. J.: Comparison of estimates of global flood models for flood hazard and exposed gross domestic product: a China case study, Nat. Hazards Earth Syst. Sci., 20, 3245–3260, https://doi.org/10.5194/nhess-20-3245-2020, 2020.
Amadio, M., Scorzini, A. R., Carisi, F., Essenfelder, A. H., Domeneghetti, A., Mysiak, J., and Castellarin, A.: Testing empirical and synthetic flood damage models: the case of Italy, Nat. Hazards Earth Syst. Sci., 19, 661–678, https://doi.org/10.5194/nhess-19-661-2019, 2019.
Apel, H., Aronica, G. T., Kreibich, H., and Thieken, A. H.: Flood risk analyses – how detailed do we need to be?, Nat. Hazards, 49, 79–98, https://doi.org/10.1007/s11069-008-9277-8, 2009.
Bloch, R., Jha, A. K., and Lamond, J.: Cities and Flooding: A Guide to Integrated Urban Flood Risk Management for the 21st Century, The World Bank, https://doi.org/10.1596/978-0-8213-8866-2, 2012.
Booij, M. J.: Flood Damage Assessment and Modelling in the Red River basin in Vietnam, International Workshop on Flood Controls Decision Support Systems (FLOCODS), in: International Workshop on Flood Controls Decision Support Systems (FLOCODS), Hanoi, Vietnam, 10–12 February 2004, 1–14, https://www.utwente.nl/en/et/cem/research/wem/people-attachments/booij/publications/44.pdf (last access: 20 January 2025), 2004.
Bouwer, L. M.: Have Disaster Losses Increased Due to Anthropogenic Climate Change?, B. Am. Meteorol. Soc., 92, 39–46, https://doi.org/10.1175/2010BAMS3092.1, 2011.
Brill, F. A.: Applications of machine learning and open geospatial data in flood risk modelling, PhD Thesis, University Potsdam, https://doi.org/10.25932/PUBLISHUP-55594, 2022.
Buch, A.: A-Buch/flood-loss-models-4-HCMC: Code for “Modelling Flood Losses to Microbusinesses in Ho Chi Minh City, Vietnam” (v1.0.0), Zenodo [data set], https://doi.org/10.5281/zenodo.15226141, 2025.
Chicco, D., Warrens, M. J., and Jurman, G.: The coefficient of determination R-squared is more informative than SMAPE, MAE, MAPE, MSE and RMSE in regression analysis evaluation, Peer J., 7, e623, https://doi.org/10.7717/peerj-cs.623, 2021.
Chinh, D. T., Gain, A., Dung, N. V., Haase, D., and Kreibich, H.: Multi-Variate Analyses of Flood Loss in Can Tho City, Mekong Delta, Water, 8, 6, https://doi.org/10.3390/w8010006, 2015.
Chinh, D. T., Bubeck, P., Dung, N. V., and Kreibich, H.: The 2011 flood event in the Mekong Delta: preparedness, response, damage and recovery of private households and small businesses, Disasters, 40, 753–778, https://doi.org/10.1111/disa.12171, 2016.
Chinh, D. T., Dung, N. V., Gain, A., and Kreibich, H.: Flood Loss Models and Risk Analysis for Private Households in Can Tho City, Vietnam, Water, 9, 313, https://doi.org/10.3390/w9050313, 2017.
Debeer, D. and Strobl, C.: Conditional permutation importance revisited, BMC Bioinformatics, 21, 307, https://doi.org/10.1186/s12859-020-03622-2, 2020.
Downes, N. K. and Storch, H.: Current Constraints and Future Directions for Risk Adapted Land-Use Planning Practices in the High-Density Asian Setting of Ho Chi Minh City, Planning Practice and Research, 29, 220–237, https://doi.org/10.1080/02697459.2014.929835, 2014.
Du, K.-L. and Swamy, M. N. S.: Neural Networks and Statistical Learning, Springer London, London, https://doi.org/10.1007/978-1-4471-7452-3, 2019.
Du, S., Scussolini, P., Ward, P. J., Zhang, M., Wen, J., Wang, L., Koks, E., Diaz-Loaiza, A., Gao, J., Ke, Q., and Aerts, J. C. J. H.: Hard or soft flood adaptation? Advantages of a hybrid strategy for Shanghai, Global Environ. Chang., 61, 102037, https://doi.org/10.1016/j.gloenvcha.2020.102037, 2020.
Formetta, G. and Feyen, L.: Empirical evidence of declining global vulnerability to climate-related hazards, Global Environ. Chang., 57, 101920, https://doi.org/10.1016/j.gloenvcha.2019.05.004, 2019.
GADM: Download GADM data (version 4.1), GADM Maps and Data, https://gadm.org/download_country.html (last access: 20 January 2025), 2022.
Garschagen, M.: Risky Change? Vietnam's Urban Flood Risk Governance between Climate Dynamics and Transformation, Pac. Aff., 88, 599–621, https://doi.org/10.5509/2015883599, 2015.
General Statistics Office: Results of the 2017 economic census, Statistical Publishing House, https://www.gso.gov.vn/en/data-and-statistics/2019/03/results-of-the-2017-economic-census/ (last access: 20 January 2025), 2018.
Gerl, T., Bochow, M., and Kreibich, H.: Flood Damage Modeling on the Basis of Urban Structure Mapping Using High-Resolution Remote Sensing Data, Water, 6, 2367–2393, https://doi.org/10.3390/w6082367, 2014.
GFZ German Research Centre for Geosciences: HOWAS 21, Helmholtz Centre Potsdam [data set], https://doi.org/10.1594/GFZ.SDDB.HOWAS21, 2020.
Güneralp, B., Güneralp, I., and Liu, Y.: Changing global patterns of urban exposure to flood and drought hazards, Global Environ. Chang., 31, 217–225, https://doi.org/10.1016/j.gloenvcha.2015.01.002, 2015.
Hallegatte, S.: An Adaptive Regional Input-Output Model and its Application to the Assessment of the Economic Cost of Katrina, Risk Anal., 28, 779–799, https://doi.org/10.1111/j.1539-6924.2008.01046.x, 2008.
Hallegatte, S., Green, C., Nicholls, R. J., and Corfee-Morlot, J.: Future flood losses in major coastal cities, Nat. Clim. Change, 3, 802–806, https://doi.org/10.1038/nclimate1979, 2013.
Hanea, A. M., Kurowicka, D., and Cooke, D.: Hybrid Method for Quantifying and Analyzing Bayesian Belief Nets, Qual. Reliab. Eng. Int., 22, 709–729, https://doi.org/10.1002/qre.808, 2006.
Hanea, A. M., Morales Napoles, O., and Ababei, D.: Non-parametric Bayesian networks: Improving theory and reviewing applications, Reliab. Eng. Syst. Safe., 144, 265–284, https://doi.org/10.1016/j.ress.2015.07.027, 2015.
Hothorn, T., Seibold, H., and Zeileis, A.: partykit: A Toolkit for Recursive Partytioning, R package [code], https://CRAN.R-project.org/package=partykit, 2023.
Hothorn, T., Hornik, K., and Zeileis, A.: Unbiased Recursive Partitioning: A Conditional Inference Framework, J. Comput. Graph. Stat., 15, 651–674, https://doi.org/10.1198/106186006X133933, 2006.
Ke, Q., Jonkman, S. N., Van Gelder, P. H. A. J. M., and Rijcken, T.: Flood damage estimation for downtown Shanghai – sensitivity analysis, in: Conference of the international society for integrated disaster risk management, Beijing, China, 7–9 September 2012, 260–273, https://research.tudelft.nl/en/publications/flood-damage-estimation-for-downtown-shanghai-sensitivity-analysi (last access: 20 January 2025), 2012.
Koks, E. E. and Thissen, M.: A Multiregional Impact Assessment Model for disaster analysis, Econ. Syst. Res., 28, 429–449, https://doi.org/10.1080/09535314.2016.1232701, 2016.
Koot, P., Mendoza-Lugo, M. A., Paprotny, D., Morales-Nápoles, O., Ragno, E., and Worm, D. T. H.: PyBanshee version (1.0): A Python implementation of the MATLAB toolbox BANSHEE for Non-Parametric Bayesian Networks with updated features, SoftwareX, 21, 101279, https://doi.org/10.1016/j.softx.2022.101279, 2023.
KPMG: Preparing MSMEs for effective disaster management, KPMG, https://assets.kpmg.com/content/dam/kpmg/pdf/2016/05/Disaster-Management-Preparedness-SME.pdf (last access: 20 January 2025), 2016.
Kreibich, H., Müller, M., Thieken, A. H., and Merz, B.: Flood precaution of companies and their ability to cope with the flood in August 2002 in Saxony, Germany, Water Resour. Res., 43, W03408, https://doi.org/10.1029/2005WR004691, 2007.
Kreibich, H., Piroth, K., Seifert, I., Maiwald, H., Kunert, U., Schwarz, J., Merz, B., and Thieken, A. H.: Is flow velocity a significant parameter in flood damage modelling?, Nat. Hazards Earth Syst. Sci., 9, 1679–1692, https://doi.org/10.5194/nhess-9-1679-2009, 2009.
Kreibich, H., Seifert, I., Merz, B., and Thieken, A. H.: Development of FLEMOcs – a new model for the estimation of flood losses in the commercial sector, Hydrolog. Sci. J., 55, 1302–1314, https://doi.org/10.1080/02626667.2010.529815, 2010.
Kreibich, H., Van Loon, A. F., Schröter, K., Ward, P. J., Mazzoleni, M., Sairam, N., Abeshu, G. W., Agafonova, S., AghaKouchak, A., Aksoy, H., Alvarez-Garreton, C., Aznar, B., Balkhi, L., Barendrecht, M. H., Biancamaria, S., Bos-Burgering, L., Bradley, C., Budiyono, Y., Buytaert, W., Capewell, L., Carlson, H., Cavus, Y., Couasnon, A., Coxon, G., Daliakopoulos, I., De Ruiter, M. C., Delus, C., Erfurt, M., Esposito, G., François, D., Frappart, F., Freer, J., Frolova, N., Gain, A. K., Grillakis, M., Grima, J. O., Guzmán, D. A., Huning, L. S., Ionita, M., Kharlamov, M., Khoi, D. N., Kieboom, N., Kireeva, M., Koutroulis, A., Lavado-Casimiro, W., Li, H.-Y., LLasat, M. C., Macdonald, D., Mård, J., Mathew-Richards, H., McKenzie, A., Mejia, A., Mendiondo, E. M., Mens, M., Mobini, S., Mohor, G. S., Nagavciuc, V., Ngo-Duc, T., Thao Nguyen Huynh, T., Nhi, P. T. T., Petrucci, O., Nguyen, H. Q., Quintana-Seguí, P., Razavi, S., Ridolfi, E., Riegel, J., Sadik, M. S., Savelli, E., Sazonov, A., Sharma, S., Sörensen, J., Arguello Souza, F. A., Stahl, K., Steinhausen, M., Stoelzle, M., Szalińska, W., Tang, Q., Tian, F., Tokarczyk, T., Tovar, C., Tran, T. V. T., Van Huijgevoort, M. H. J., Van Vliet, M. T. H., Vorogushyn, S., Wagener, T., Wang, Y., Wendt, D. E., Wickham, E., Yang, L., Zambrano-Bigiarini, M., Blöschl, G., and Di Baldassarre, G.: The challenge of unprecedented floods and droughts in risk management, Nature, 608, 80–86, https://doi.org/10.1038/s41586-022-04917-5, 2022.
Krstajic, D., Buturovic, L. J., Leahy, D. E., and Thomas, S.: Cross-validation pitfalls when selecting and assessing regression and classification models, J. Cheminformatics, 6, 10, https://doi.org/10.1186/1758-2946-6-10, 2014.
Kurowicka, D. and Cooke, R.: Uncertainty Analysis with High Dimensional Dependence Modelling, 1st edn., Wiley Ser. Prob. Stat., https://doi.org/10.1002/0470863072, 2006.
Leitold, R. and Revilla Diez, J.: Exposure of manufacturing firms to future sea level rise in Ho Chi Minh City, Vietnam, J. Maps, 15, 13–20, https://doi.org/10.1080/17445647.2018.1548385, 2019.
Leitold, R., Revilla Diez, J., and Tran, V.: Are we expecting too much from the private sector in flood adaptation? Scenario-based field experiments with small- and medium-sized firms in Ho Chi Minh City, Vietnam, Climatic Change, 163, 359–378, https://doi.org/10.1007/s10584-020-02888-y, 2020.
Leitold, R., Garschagen, M., Tran, V., and Revilla Diez, J.: Flood risk reduction and climate change adaptation of manufacturing firms: Global knowledge gaps and lessons from Ho Chi Minh City, Int. J. Disast. Risk Re., 61, 102351, https://doi.org/10.1016/j.ijdrr.2021.102351, 2021.
Levshina, N.: Conditional Inference Trees and Random Forests, in: A Practical Handbook of Corpus Linguistics, edited by: Paquot, M. and Gries, S. T., Cham: Springer, 611–643, https://doi.org/10.1007/978-3-030-46216-1_25, 2020.
Liu, X., Kounadi, O., and Zurita-Milla, R.: Incorporating Spatial Autocorrelation in Machine Learning Models Using Spatial Lag and Eigenvector Spatial Filtering Features, ISPRS Int. J. Geo-Inf., 11, 242, https://doi.org/10.3390/ijgi11040242, 2022.
Merz, B., Kreibich, H., Schwarze, R., and Thieken, A.: Review article “Assessment of economic flood damage”, Nat. Hazards Earth Syst. Sci., 10, 1697–1724, https://doi.org/10.5194/nhess-10-1697-2010, 2010.
Meyer, V., Becker, N., Markantonis, V., Schwarze, R., van den Bergh, J. C. J. M., Bouwer, L. M., Bubeck, P., Ciavola, P., Genovese, E., Green, C., Hallegatte, S., Kreibich, H., Lequeux, Q., Logar, I., Papyrakis, E., Pfurtscheller, C., Poussin, J., Przyluski, V., Thieken, A. H., and Viavattene, C.: Review article: Assessing the costs of natural hazards – state of the art and knowledge gaps, Nat. Hazards Earth Syst. Sci., 13, 1351–1373, https://doi.org/10.5194/nhess-13-1351-2013, 2013.
Natural Earth: Data from Natural Earth, https://www.naturalearthdata.com/downloads/, last access: 20 January 2025.
Nguyen, T. B., Samsura, D. A. A., Van Der Krabben, E., and Le, A.-D.: Saigon-Ho Chi Minh City, Cities, 50, 16–27, https://doi.org/10.1016/j.cities.2015.08.007, 2016.
Nguyen, M. T., Sebesvari, Z., Souvignet, M., Bachofer, F., Braun, A., Garschagen, M., Schinkel, U., Yang, L. E., Nguyen, L. H. K., Hochschild, V., Assmann, A., and Hagenlocher, M.: Understanding and assessing flood risk in Vietnam: Current status, persisting gaps, and future directions, J. Flood Risk Manag., 14, e12689, https://doi.org/10.1111/jfr3.12689, 2021.
Ootegem, L. V., Herck, K. V., Creten, T., Verhofstadt, E., Foresti, L., Goudenhoofdt, E., Reyniers, M., Delobbe, L., Tuyls, D. M., and Willems, P.: Exploring the potential of multivariate depth-damage and rainfall-damage models, J. Flood Risk Manag., 11, 916–929, https://doi.org/10.1111/jfr3.12284, 2017.
Paprotny, D., Kreibich, H., Morales-Nápoles, O., Terefenko, P., and Schröter, K.: Estimating exposure of residential assets to natural hazards in Europe using open data, Nat. Hazards Earth Syst. Sci., 20, 323–343, https://doi.org/10.5194/nhess-20-323-2020, 2020.
Paprotny, D., Kreibich, H., Morales-Nápoles, O., Wagenaar, D., Castellarin, A., Carisi, F., Bertin, X., Merz, B., and Schröter, K.: A probabilistic approach to estimating residential losses from different flood types, Nat. Hazards, 105, 2569–2601, https://doi.org/10.1007/s11069-020-04413-x, 2021.
Patankar, A.: Impacts of Natural Disasters on Households and Small Businesses in India, Asian Development Bank Economics Working Paper Series No. 603, SSRN Electron J., https://doi.org/10.2139/ssrn.3590902, 2019.
Patankar, A. and Patwardhan, A.: Estimating the uninsured losses due to extreme weather events and implications for informal sector vulnerability: a case study of Mumbai, India, Nat. Hazards, 80, 285–310, https://doi.org/10.1007/s11069-015-1968-3, 2015.
Rafiezadeh Shahi, K., Sairam, N., Schoppa, L., Sang, L. T., Tan, D. L. H., and Kreibich, H.: BN-FLEMOΔ: A Bayesian Network-based Flood Loss Estimation Model for Adaptation Planning in Ho Chi Minh City, Vietnam, ESS Open Archive [preprint], https://doi.org/10.22541/essoar.172081523.38063336/v1, 12 July 2024.
Rand, J. and Tarp, F.: Micro, Small, and Medium Enterprises in Vietnam, 1st edn., Oxford University Press, Oxford, https://doi.org/10.1093/oso/9780198851189.003.0001, 2020.
Rentschler, J., Salhab, M., and Jafino, B. A.: Flood exposure and poverty in 188 countries, Nat. Commun., 13, 3527, https://doi.org/10.1038/s41467-022-30727-4, 2022.
Rözer, V., Kreibich, H., Schröter, K., Müller, M., Sairam, N., Doss-Gollin, J., Lall, U., and Merz, B.: Probabilistic Models Significantly Reduce Uncertainty in Hurricane Harvey Pluvial Flood Loss Estimates, Earths Future, 7, 384–394, https://doi.org/10.1029/2018EF001074, 2019.
Samantha, G.: The Impact of Natural Disasters on Micro, Small and Medium Enterprises (MSMEs): A Case Study on 2016 Flood Event in Western Sri Lanka, Procedia Engineer., 212, 744–751, https://doi.org/10.1016/j.proeng.2018.01.096, 2018.
Schoppa, L., Sieg, T., Vogel, K., Zöller, G., and Kreibich, H.: Probabilistic Flood Loss Models for Companies, Water Resour. Res., 56, e2020WR027649, https://doi.org/10.1029/2020wr027649, 2020.
Schröter, K., Kreibich, H., Vogel, K., Riggelsen, C., Scherbaum, F., and Merz, B.: How useful are complex flood damage models?, Water Resour. Res., 50, 3378–3395, https://doi.org/10.1002/2013wr014396, 2014.
Scussolini, P., Tran, T. V. T., Koks, E., Diaz-Loaiza, A., Ho, P. L., and Lasage, R.: Adaptation to Sea Level Rise: A Multidisciplinary Analysis for Ho Chi Minh City, Vietnam, Water Resour. Res., 53, 10841–10857, https://doi.org/10.1002/2017wr021344, 2017.
Sieg, T., Vogel, K., Merz, B., and Kreibich, H.: Tree-based flood damage modeling of companies: Damage processes and model performance, Water Resour. Res., 53, 6050–6068, https://doi.org/10.1002/2017wr020784, 2017.
Sieg, T., Schinko, T., Vogel, K., Mechler, R., Merz, B., and Kreibich, H.: Integrated assessment of short-term direct and indirect economic flood impacts including uncertainty quantification, PLoS One, 14, e0212932, https://doi.org/10.1371/journal.pone.0212932, 2019.
Strobl, C., Boulesteix, A.-L., Zeileis, A., and Hothorn, T.: Bias in random forest variable importance measures: Illustrations, sources and a solution, BMC Bioinformatics, 8, 25, https://doi.org/10.1186/1471-2105-8-25, 2007.
Sultana, Z., Sieg, T., Kellermann, P., Müller, M., and Kreibich, H.: Assessment of Business Interruption of Flood-Affected Companies Using Random Forests, Water, 10, 1049, https://doi.org/10.3390/w10081049, 2018.
Thuy, N. B., Tien, T. Q., Wettre, C., and Hole, L. R.: Monsoon-Induced Surge during High Tides at the Southeast Coast of Vietnam: A Numerical Modeling Study, Geosciences, 9, 72, https://doi.org/10.3390/geosciences9020072, 2019.
Tierolf, L., De Moel, H., and Van Vliet, J.: Modeling urban development and its exposure to river flood risk in Southeast Asia, Comp. Environ. Urban, 87, 101620, https://doi.org/10.1016/j.compenvurbsys.2021.101620, 2021.
Tran, T. N.: Improvement of flood risk assessment under climate change in Ho Chi Minh City with GIS applications, PhD Thesis, University of Technology in Cottbus – Senftenberg, 186 pp., https://opus4.kobv.de/opus4-btu/files/3078/Tran_Thong_Nhat_Thesis_2014.pdf (last access: 20 January 2025), 2014.
Trinh, P. T. T. and Thanh, N. D.: Development Characteristics of SME Sector in Vietnam: Evidence from the Vietnam Enterprise Census 2006–2015 (Working Paper WP-18), working paper, VEPR [Viet Nam Institute for Economic and Policy Research, supported by the Friedrich Naumann Foundation for Freedom], Hanoi, Vietnam, http://vepr.org.vn/upload/533/20171222/EN_VEPR%20WP%2018.pdf (last access: 20 January 2025), 2017.
Tsinda, A., Kind, C., Hess, J. S., Mugsiha, R., and Bizoza, A. R.: Estimating damage costs of flooding on small- and medium-sized enterprises in Kigali, Rwanda, Jàmbá Journal of Disaster Risk Studies, 11, a755, https://doi.org/10.4102/jamba.v11i1.755, 2019.
US Geological Survey: Earth Explorer, https://earthexplorer.usgs.gov/, last access: 20 January 2025.
Vishwanath Harish, T., Sairam, N., Yang, L. E., Garschagen, M., and Kreibich, H.: Identifying the drivers of private flood precautionary measures in Ho Chi Minh City, Vietnam, Nat. Hazards Earth Syst. Sci., 23, 1125–1138, https://doi.org/10.5194/nhess-23-1125-2023, 2023.
Vogel, K., Riggelsen, C., Scherbaum, F., Schröter, K., Kreibich, H., and Merz, B.: Challenges for Bayesian network learning in a flood damage assessment application, in: Safety, Reliability, Risk and Life-Cycle Performance of Structures and Infrastructures, edited by: Deodatis, G., Ellingwood, B. R., Frangopol, and Dan M, D. M., CRC Press, 3123–3130, https://doi.org/10.1201/b16387-452, 2014.
Vogel, K., Weise, L., Schröter, K., and Thieken, A. H.: Identifying Driving Factors in Flood-Damaging Processes Using Graphical Models, Water Resour. Res., 54, 8864–8889, https://doi.org/10.1029/2018wr022858, 2018.
Wagenaar, D., Lüdtke, S., Schröter, K., Bouwer, L. M., and Kreibich, H.: Regional and Temporal Transferability of Multivariable Flood Damage Models, Water Resour. Res., 54, 3688–3703, https://doi.org/10.1029/2017wr022233, 2018.
Wijayanti, P., Zhu, X., Hellegers, P., Budiyono, Y., and Van Ierland, E. C.: Estimation of river flood damages in Jakarta, Indonesia, Nat. Hazards, 86, 1059–1079, https://doi.org/10.1007/s11069-016-2730-1, 2017.
Yang, L., Kajitani, Y., Tatano, H., and Jiang, X.: A methodology for estimating business interruption loss caused by flood disasters: insights from business surveys after Tokai Heavy Rain in Japan, Nat. Hazards, 84, 411–430, https://doi.org/10.1007/s11069-016-2534-3, 2016.