the Creative Commons Attribution 4.0 License.
the Creative Commons Attribution 4.0 License.
 | 17 Jul 2025
Semi-empirical forecast modelling of rip-current and shore-break wave hazards
Bruno Castelle
Jeoffrey Dehez
Jean-Philippe Savy
Sylvain Liquet
David Carayon
Sandy beaches are highly attractive but also potentially dangerous environments for those entering the water as they can be exposed to physical hazards in the surf zone. The most severe and widespread natural bathing hazards on beaches are rip currents and shore-break waves, which form under different wave, tide, and morphological conditions. This paper introduces two new, simple semi-empirical rip-current and shore-break wave hazard forecast models. These physics-informed models, which depend on a limited number of free parameters, can be used to compute the time evolution of the rip-current flow speed V and shore-break wave energy Esb. These models are applied to a high-energy mesotidal–macrotidal beach, La Lette Blanche, in southwest France, where intense rip-currents and shore-break wave hazards co-exist. Hourly lifeguard-perceived hazards collected during patrolling hours (from 11:00 to 07:00 LT (UTC+2)) during July and August of 2022 are used to calibrate the two models. These data are also used to transform V and Esb into a five-level scale from 0 (no hazard) to 4 (hazard maximised). The model accurately predicts rip-current and shore-break wave hazard levels, including their modulation by tide elevation and incident wave conditions, opening new perspectives for forecasting multiple surf-zone hazards on sandy beaches. In addition, daily-mean hazard forecasts demonstrate even greater predictive skill, which is important for conveying straightforward messages to the general public and lifeguard managers. The approach presented here only requires a limited number of beach morphology metrics and allows for the prediction of surf-zone hazards on beaches where wave and tide forecasts are available.
- Article
(6778 KB) - Full-text XML
- BibTeX
- EndNote


Predicting natural hazards, such as flash floods, wildfires, and hurricanes, and disseminating warnings based on those predictions are crucial not only to protect property and natural resources, but also to protect people from injury and death (National Research Council, 1991; Merz et al., 2020; Bates et al., 2021). Over the last few decades, prediction capabilities of atmospheric and hydrologic hazards, often referred to as weather-related natural hazards, have greatly increased (e.g. Brunner et al., 2021). While a lot of scientific effort and media coverage involve hurricanes (Gall et al., 2013), coastal flooding (Stockdon et al., 2023), and flash floods (Corral et al., 2019), less attention has been paid to surf-zone hazards beachgoers are exposed to. However, in the USA, rip currents on surf beaches were the third-leading cause of weather-related deaths from 2012 to 2021 according to the National Weather Service (U.S. Department of Commerce, 2025), not far behind heat waves and flooding. Contrary to most of these other weather-related natural hazards (e.g. Zscheischler et al., 2020), surf-zone hazards are not necessarily related to extreme events as fatal drowning and severe injuries at the beach predominantly occur during fair-weather conditions, i.e. typically during warm, sunny, and light-wind days (Dwight et al., 2007; Ibarra, 2011; Coombes et al., 2009; de Korte et al., 2021; Castelle et al., 2024). Therefore, improving our predictive capacity of surf-zone hazards on beaches is critical to reducing the burden of fatal drownings (Dusek and Seim, 2013) and that of other types of injuries.
Sandy beaches offer abundant recreational opportunities, tourism potential, and valuable ecosystem services (Ghermandi and Nunes, 2013; Hall and Page, 2014; Bujosa et al., 2015; West, 2019), including activities such as bathing and wading (Britton et al., 2018; Wood et al., 2022; Dehez and Lyser, 2024). However, beachgoers may face physical hazards within the surf zone. Among the most significant and widespread natural hazards leading to surf-zone injuries (SZIs), including drowning incidents, are rip currents (MacMahan et al., 2006; Dalrymple et al., 2011; Castelle et al., 2016b; Houser et al., 2020) and shore-break waves (Chang et al., 2006). Rip currents are narrow, seaward-flowing currents that originate in the surf zone, often near the waterline, extending through the breakers and sometimes beyond. These currents are a primary cause of unintentional drownings on many surf beaches worldwide (e.g. Brighton et al., 2013; Arozarena et al., 2015; Barlas and Beji, 2016; Li, 2016; Castelle et al., 2018; Brewster et al., 2019), as they can carry bathers offshore into deeper water, leading to drowning through exhaustion or panic (Brander and Short, 2001; Drozdzewski et al., 2012). Rip currents are driven by depth-induced breaking wave energy dissipation, although their formation mechanisms can vary (Castelle et al., 2016b). The most common rip type on intermediate beaches (Wright and Short, 1984; Castelle and Masselink, 2023) flows through channels carved into nearshore sandbars (e.g. Houser et al., 2013). These channel rips are caused by alongshore variations in breaking wave energy dissipation due to alongshore-variable sandbar depths (Bowen, 1969; Haller et al., 2002; Bruneau et al., 2011). Rip-current activity typically increases with a shore-normal wave incidence, higher wave height, longer wave period (e.g. Austin et al., 2010; Drønen et al., 2002; Bruneau et al., 2011; Winter et al., 2014; MacMahan et al., 2006), and lower tide level (Aagaard et al., 1997; MacMahan et al., 2005; Brander and Short, 2001; Houser et al., 2013).
Shore-break waves, in contrast, are plunging or dumping waves that break close to the shore on steep beach faces, causing a wide range of injuries, including severe spinal injuries (Chang et al., 2006; Robbles, 2006; Puleo et al., 2016; Castelle et al., 2018; Griepp et al., 2022). Most injuries associated with shore-break waves result from wave-induced impacts, followed by shallow-water diving incidents, with the latter often involving surfers (Thom et al., 2022). Unlike rip currents, research on shore-break waves is limited, mostly due to the challenges of quantifying their energy and impact forces on the human body. Castelle et al. (2024) observed that lifeguards in southwest France perceive shore-break wave hazards to be greater during long-period, near-shore-normal waves and higher tides. Furthermore, prior studies have indicated that the occurrence of spinal injuries from shore-break waves increases with long-period waves and higher water levels as waves typically break on the steepest sections of the beach (Castelle et al., 2019).
Despite our increased understanding of rip-current dynamics, a limited number of rip-current hazard forecast systems have been developed over the last decade. The approaches include, for instance, process-based modelling (Austin et al., 2013; Stokes et al., 2024), which requires detailed information of the beach morphology; statistical modelling of the likelihood of hazardous rip currents using either lifeguard estimation of rip-flow speed (Dusek and Seim, 2012, 2013) or measured rip-flow speed (Moulton et al., 2017a); physics-based parameterisation of channel rip-flow speed (Casper et al., 2024); and hazard levels based on thresholds of tide elevation, wave height, and wave period, relying on lifeguard incident data (Scott et al., 2014, 2022). While some of these models skilfully predict rip-current hazard levels, they have been validated on a limited number of beaches. Additional rip-flow speed, lifeguard-perceived, and/or topobathymetric datasets therefore need to be collected. In addition, these surf-zone hazard models only consider rip currents, while on some beaches the most threatening hazard is shore-break waves (e.g. Puleo et al., 2016). This calls for more generic surf-zone hazard models to be applied to a wide range of sandy beaches.
In this contribution, we present two simple semi-empirical rip-current and shore-break wave hazard forecast models which are validated at a high-energy sandy beach in southwest France, where strong channel rip currents and hazardous shore-break waves co-exist (Castelle et al., 2024) and are largely the most important cause of SZIs (Castelle et al., 2018). In Sect. 2 the field site and the 2-month dataset of environmental conditions and lifeguard-perceived hazard data used for model calibration are presented. Section 3 explains the development of the rip-current and shore-break wave hazard models. Results are given in Sect. 4, which are further discussed in Sect. 5. We show that the two models skilfully predict the lifeguard-perceived rip-current and shore-break wave hazards, including their complex modulation by tidal elevation, incident wave energy, and neap–spring tide cycles. These simple semi-empirical models, which provide quantitative estimates of rip-flow speed and shore-break wave energy and an associated five-level-scale hazard rating, only require a limited number of time-invariant free parameters related to beach morphology and wave breaking onset. These parameters can be given either based on some knowledge of the beach morphology or through calibration using lifeguard-perceived hazard data. The proposed framework, here applied to a single beach in southwest France, offers new opportunities for forecasting rip-current and shore-break wave hazards at surf beaches with available wave and tide predictions.
2.1 La Lette Blanche beach
La Lette Blanche beach (Fig. 1b) is representative of the majority of open-coast beaches in southwest France. Its typical beach state is intermediate and double-barred, with crescentic patterns on the inner intertidal bar and a transverse bar and rip morphology on the outer subtidal bar. The spacing between inner-bar rip channels is on average approximately 400 m. It is a mesotidal–macrotidal environment, with an average tidal range of 2.6 m and a maximum tidal range of 4.4 m. It is exposed to high-energy ocean waves generated in the North Atlantic, with a summer-mean (July–August) significant wave height Hs of about 1.1 m and a peak wave period Tp of 9 s. Like other open beaches in the region, rip currents are ubiquitous (Fig. 1c), with strong channel rips flowing through the inner-bar rip channels (Bruneau et al., 2009). Rip-current activity peaks around mean low tide level under energetic, shore-normal wave conditions (e.g. Bruneau et al., 2011), which coincide with a higher occurrence of drowning incidents and rescues in southwest France (Castelle et al., 2019, 2024; de Korte et al., 2021). Additionally, a significant number of mild to severe injuries in the surf zone are caused by shore-break waves (Fig. 1c, Castelle et al., 2018). Research has shown that these injuries are more frequent during higher water levels and large tidal ranges when waves break over the steepest sections of the beach profile (Castelle et al., 2019, 2024).
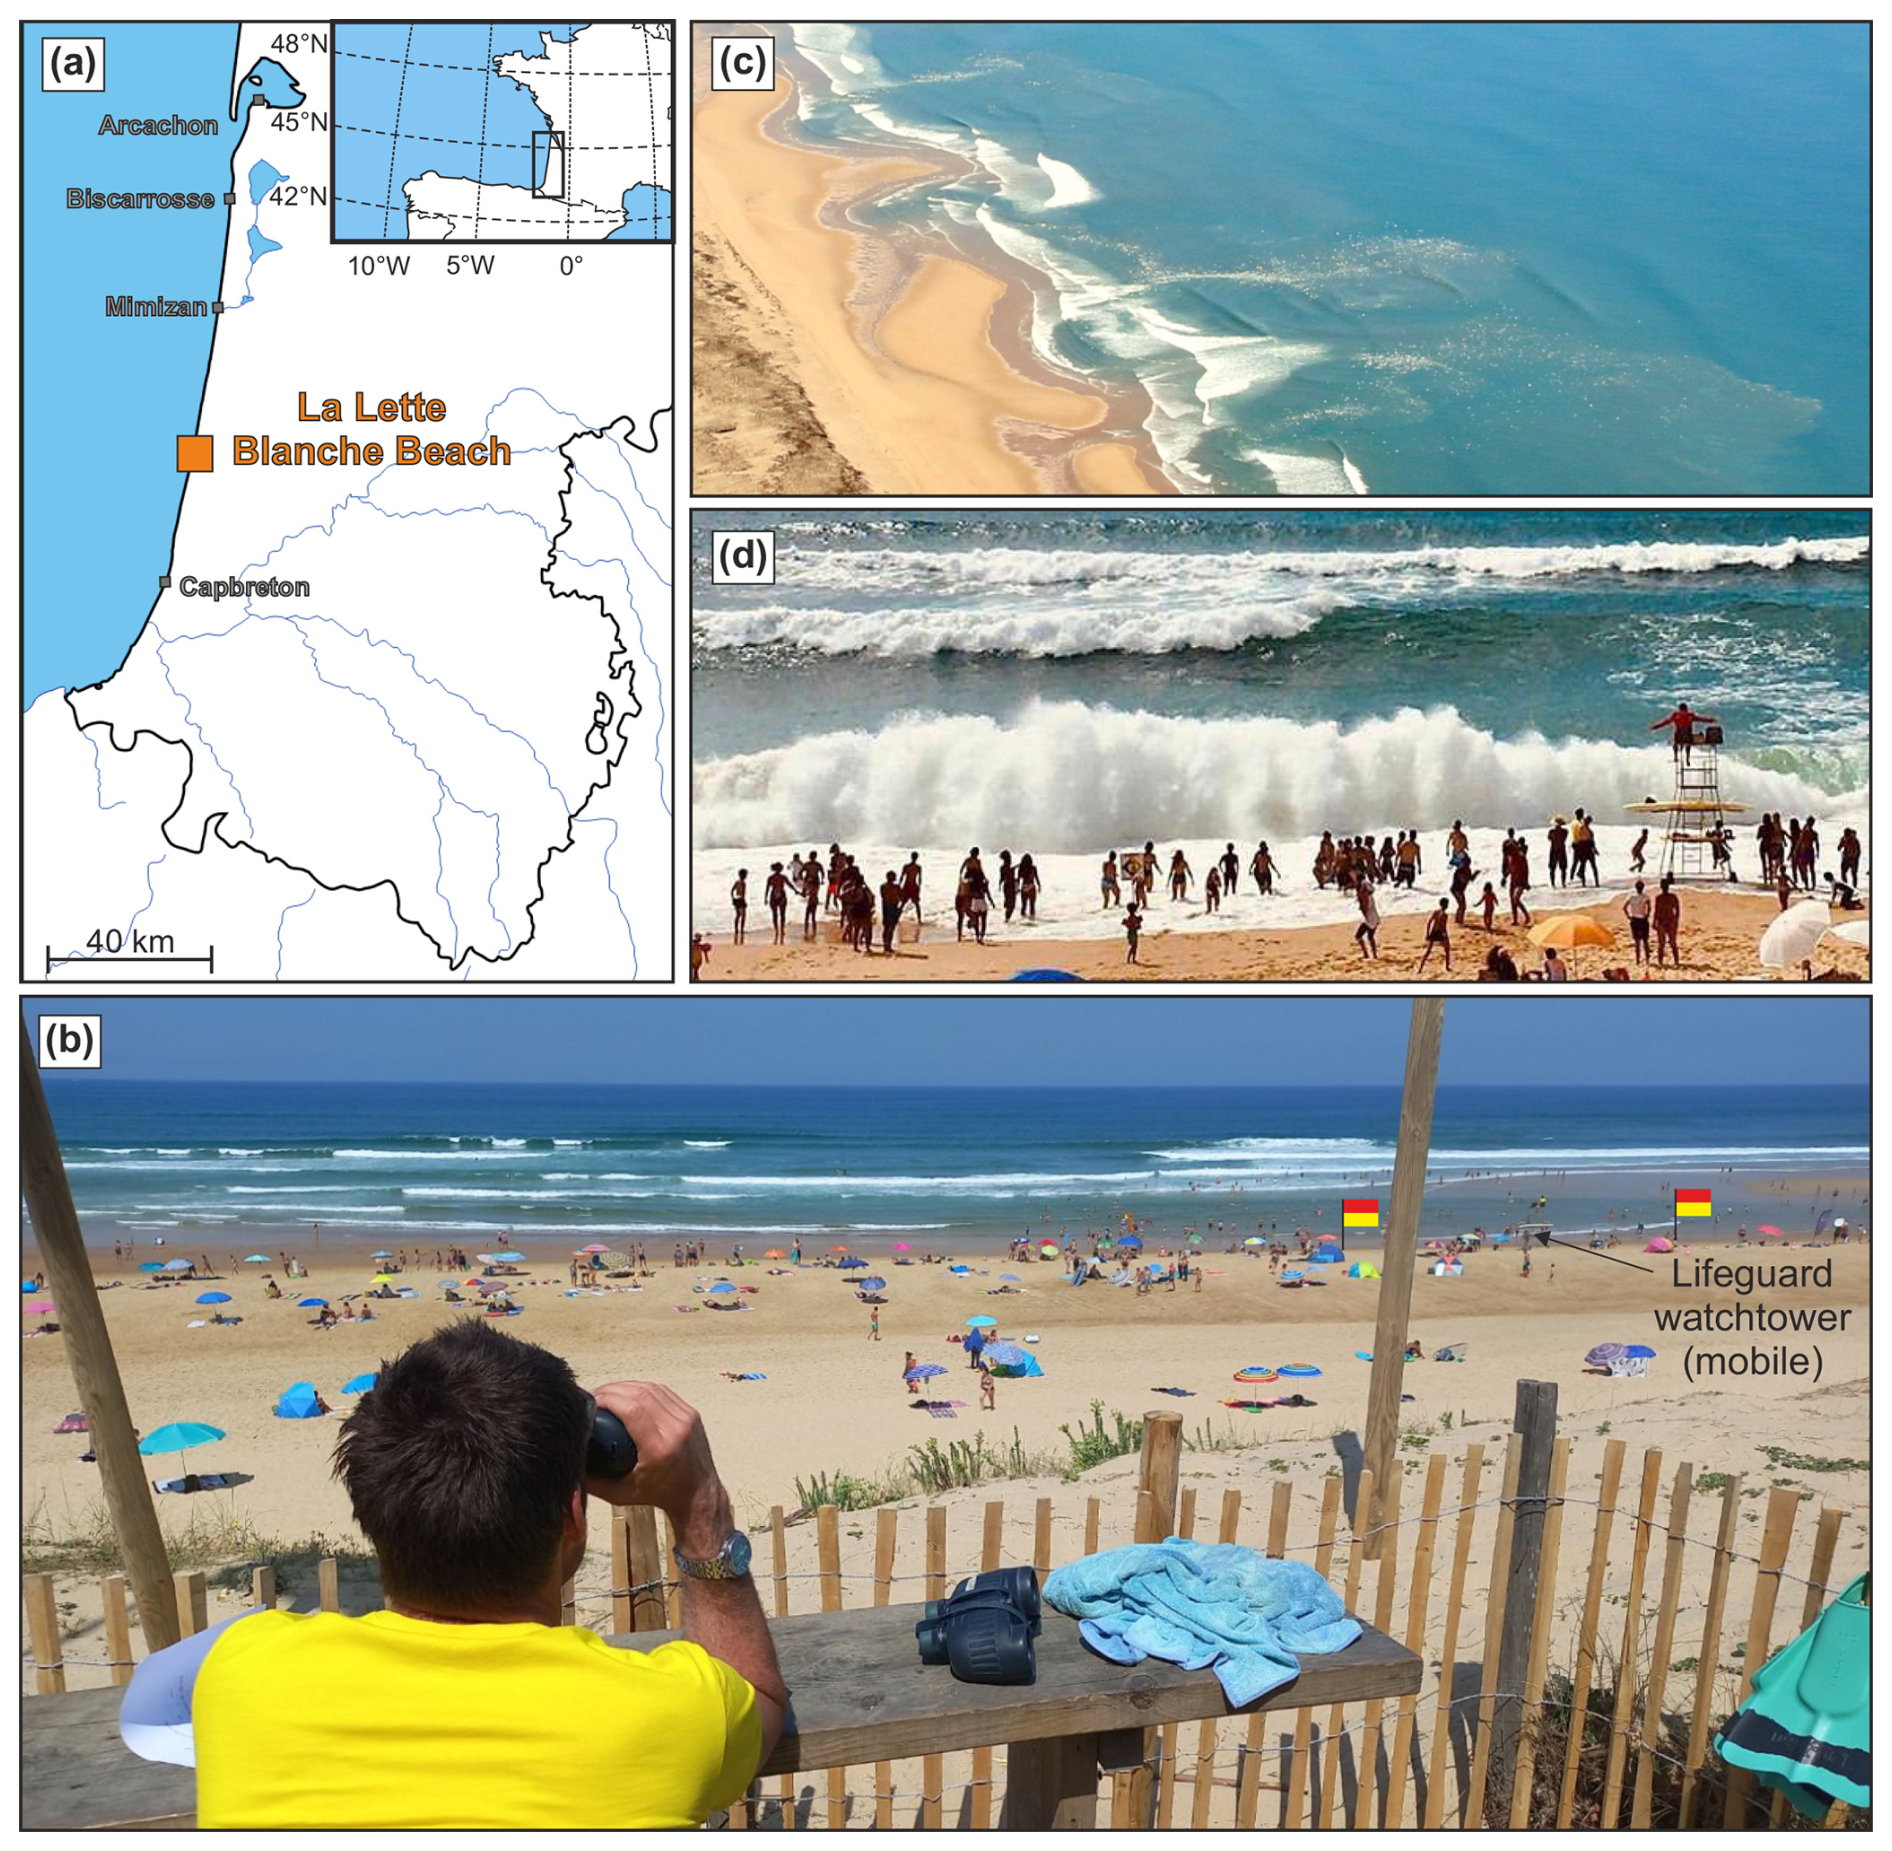
Figure 1(a) Map of La Lette Blanche beach, southwest France, and (b) view from the lifeguard station on the top of the dune on 14 July 2022 at 12:00 LT (photo: Bruno Castelle). Photographs in southwest France of the two major surf-zone hazards with (c) rip currents (photo: Observatoire de la Côte de Nouvelle-Aquitaine, OCNA) and (d) shore-break waves (photo: Syndicat Mixte de Gestion des Baignades Landaises, SMGBL).
La Lette Blanche beach is monitored by lifeguards during the summer months (July and August) between 11:00 –07:00 LT (UTC+2). During these hours, a supervised bathing zone, typically less than 100 m wide, is established between two red and yellow flags (Fig. 1b). This zone is strategically located away from potential rip currents. Due to the large tidal range, which causes rapid changes in the location, intensity, and nature of surf-zone hazards, lifeguards may relocate the supervised bathing zone multiple times throughout the day. To communicate surf-zone hazards, lifeguards use a colour-coded flag system that reflects their assessment of conditions, including rip currents and shore-break waves: (1) a green flag indicates supervised bathing with no significant physical hazard, (2) a yellow-orange flag signifies dangerous but supervised bathing, and (3) a red flag means bathing is prohibited.
2.2 Summer 2022 field experiment
During the boreal summer of 2022, from 1 July to 31 August, a beach safety field experiment was carried out at La Lette Blanche beach. This study generated a unique multidisciplinary database encompassing various aspects, such as beachgoer surveys, surf-zone drifter measurements, topographic surveys, lifeguard assessments of surf-zone hazards and beach crowds, and monitoring of environmental conditions. For further details on these datasets, refer to Dehez et al. (2024) and Castelle et al. (2024).
In the present contribution, we use only lifeguard-perceived surf-zone hazards and wave and tide conditions. Given that the aim of the present contribution is to eventually operate surf-zone hazard forecasts, in contrast with Castelle et al. (2024), we used a numerical wave hindcast instead of in situ offshore wave measurements. The Météo-France wave model (MFWAM), based on the spectral wave model (WAM) (WamdiGroup, 1988), is the French version of the European Centre for Medium-Range Weather Forecasts (ECMWF) WAM used by Météo-France for operational sea state forecasting, with a 0.1° grid resolution in the northeast Atlantic. It forces a high-resolution WaveWatch 3 wave model (Tolman et al., 2002), forced by winds from the ARPEGE model of Météo-France. The model uses an unstructured grid (Roland and Ardhuin, 2014), allowing the French Atlantic coast to be described with a resolution of approximately 200 m, with mesh size increasing to approximately 10 km at the boundary of the model a few hundred kilometres offshore. Different coastal processes are represented in this model, such as unified parameterisation of wave breaking from offshore to the coast, wave reflection at the coast, refraction due to currents and bathymetry, and bottom friction. Modelled wave conditions were extracted at approximately 10 m depth in front of La Lette Blanche beach to estimate the wave conditions outside of the surf zone. The data were further compared with the wave measurements at the directional wave buoy located approximately 80 km further north at 50 m depth, which in previous work was assumed to be representative of the wave conditions given the overall open and straight nature of the coast. Over the period from 1 July to 31 August 2022, results show a root mean square error (RMSE), coefficient of determination (r2), and bias of 0.17, 0.91, and −0.03 m. These metrics give confidence to both the model skill and the relevance of the wave buoy measurements used in previous work. In addition, tide conditions at the beach were estimated using the TPXO9 (version 5) ° resolution atlas (Egbert and Erofeeva, 2002) at the grid point closest to La Lette Blanche beach. Figure 2a–d display the wave and tide conditions during the 2022 experiment, showing significant wave height Hs0 (peak wave period Tp) ranging from 0.30 to 2.19 m (3.85–19.38 s) with a mean of 0.96 m (9.21 s). Waves were predominantly from the west-northwest, with an average angle of wave incidence with respect to the shore normal of 23.39°. Nearly 2.5 neap–spring tide cycles were covered (Fig. 2d), with a daily tide range (TR) between 1.39–4.06 m with a mean of 2.73 m.
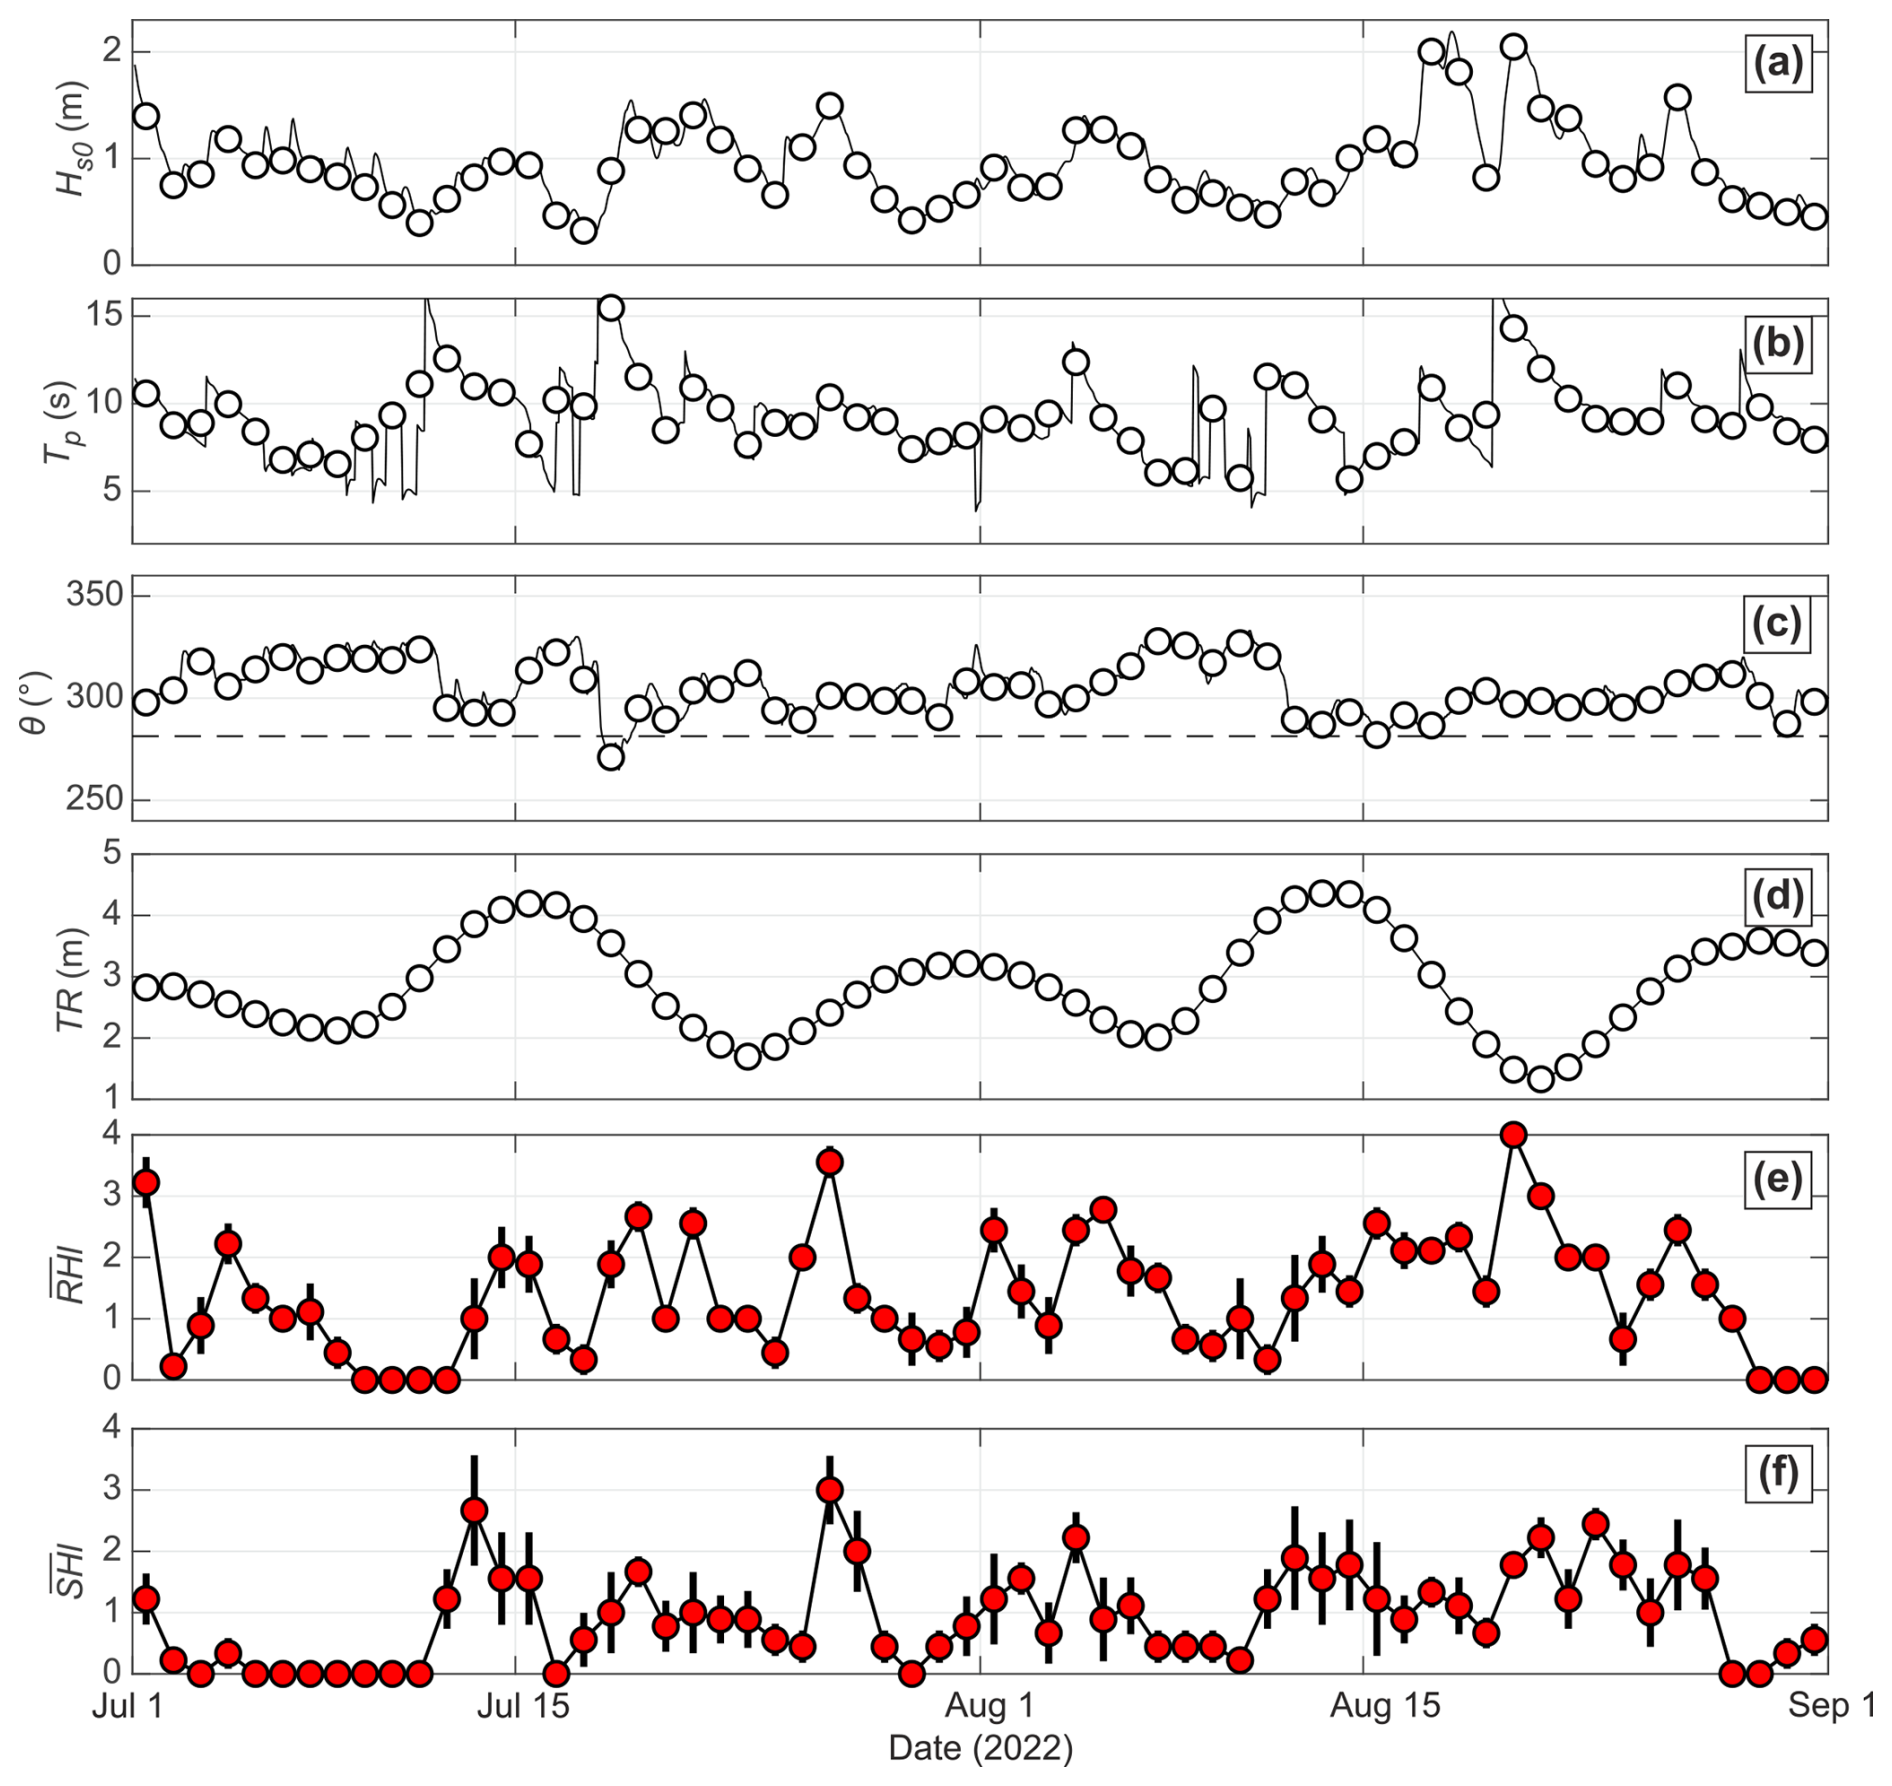
Figure 2Time series of environmental conditions at nearly 10 m depth offshore of the study site and lifeguard-estimated surf-zone hazards during patrolling hours (11:00 –07:00 LT). (a) Significant wave height Hs0 at 10 m depth, (b) peak wave period Tp, (c) angle of wave incidence θ, (d) tide range TR, (e) daily-mean lifeguard-perceived rip-current hazard , and (f) daily-mean lifeguard-perceived shore-break wave hazard . In all panels the circles indicate the daily mean, and in (e, f) the vertical lines indicate the daily standard deviation.
During each patrolled day of the summer 2022 beach safety experiment, the chief lifeguard (or the co-chief on the chief lifeguard's days off, 2 d a week) provided hourly estimates of rip-current hazard (RHl) and shore-break wave hazard (HSl). These hazards were rated on a five-level scale ranging from 0 (no hazard) to 4 (maximum hazard). Lifeguards were instructed to assess the environmental hazard level rather than the risk, meaning the focus was on the inherent hazard conditions rather than the likelihood of water users being exposed to rip currents or shore-break waves. Figure 2e and f illustrate the time series of daily-mean lifeguard-estimated rip-current hazard () and shore-break wave hazard (). The data indicate that the daily-average rip-current hazard generally increases with larger waves, longer-period waves, and near-shore-normal waves. In contrast, the shore-break wave hazard is heightened under conditions of long-period, near-shore-normal waves and large tidal ranges (Castelle et al., 2024).
3.1 Rip current
Rip-current hazard can be estimated through the rip-flow speed. Here we consider an idealised rip-channelled beach on which breaking waves drive a rip current through the deeper channels (Fig. 3). Channel rips are essentially driven by the alongshore variation in breaking wave energy dissipation due to the alongshore variability in depth between the sandbars and intervening drainage channels. This can be simplified as the alongshore pressure gradients in the surf zone, , with x being the longshore coordinate and the wave set-up, i.e. the increase in mean water level driven by wave breaking. These alongshore pressure gradients drive feeder currents that converge at the channels and turn offshore as rip currents (Haller et al., 2002). There is a wealth of empirical formulas derived from field and laboratory measurements to estimate wave set-up (Gomes da Silva et al., 2020). A popular, simple formula gives the wave set-up at the shoreline as a function of the significant wave height upon breaking Hs only (Guza and Thornton, 1981; Raubenheimer et al., 2001; Atkinson et al., 2017):
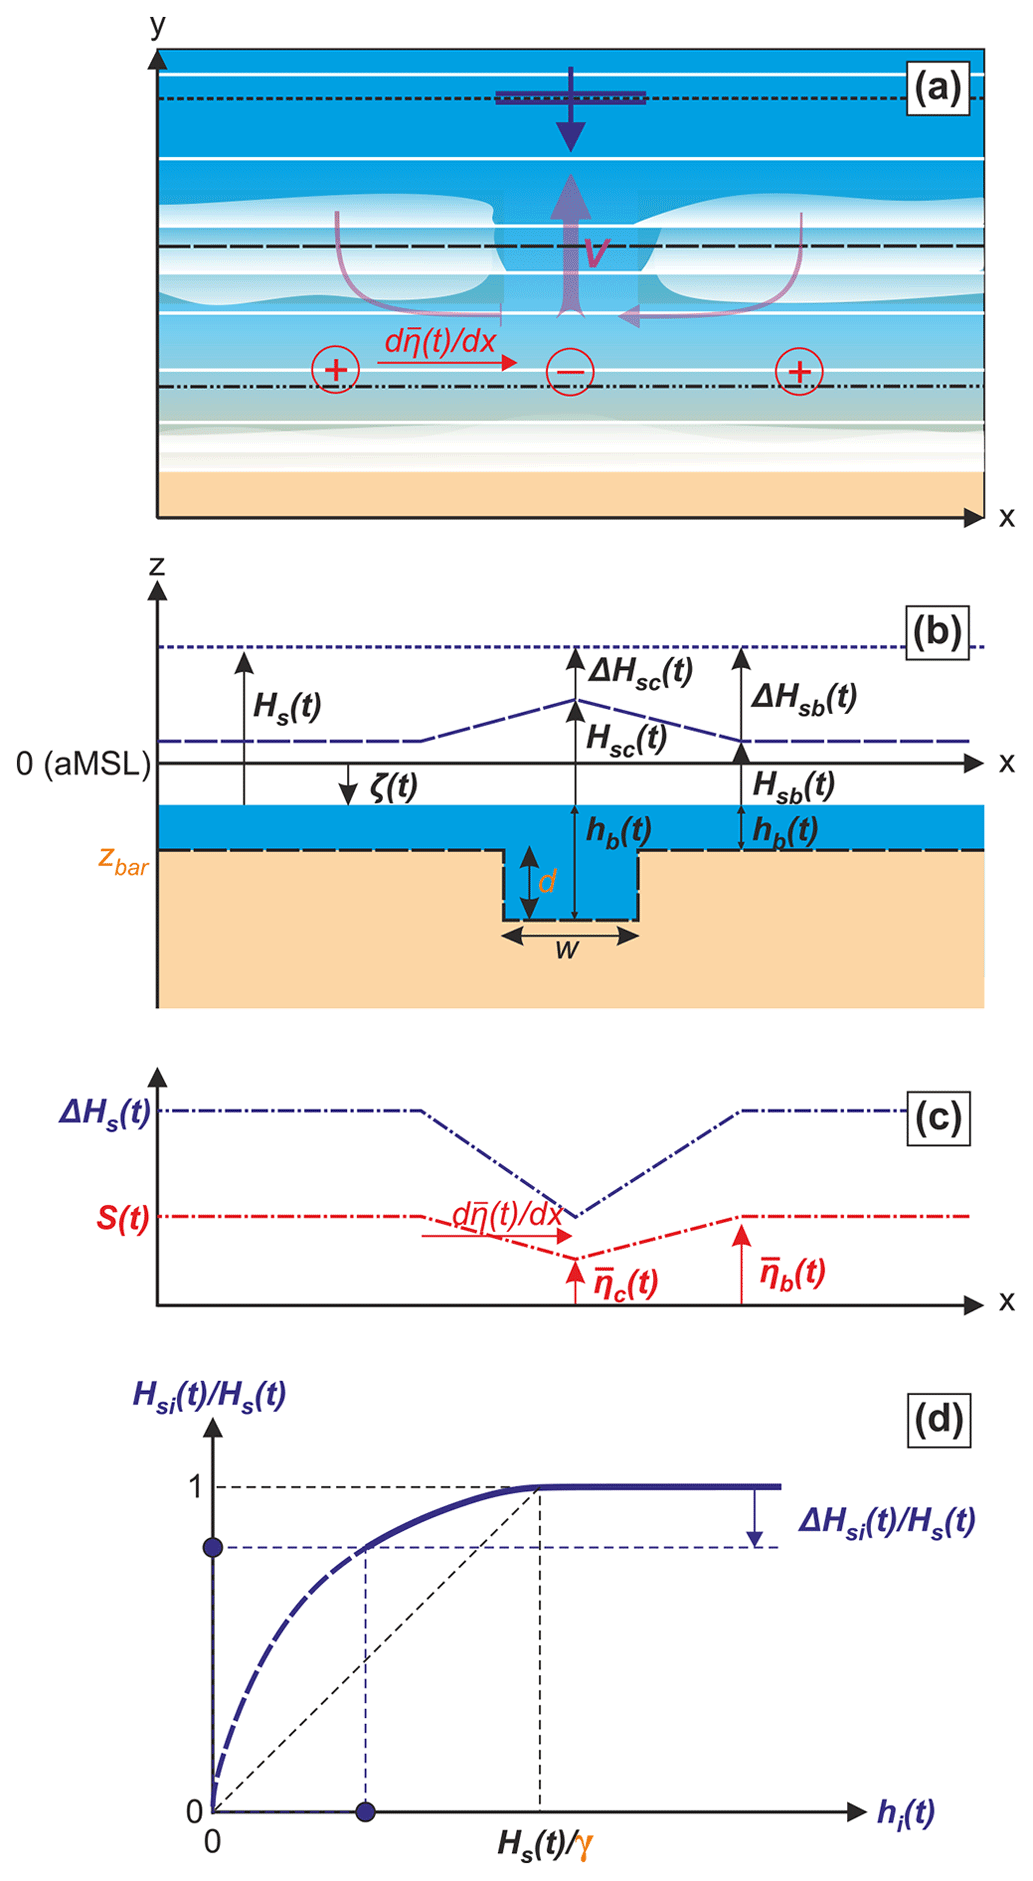
Figure 3Schematics of the semi-empirical rip-current flow model. (a) Top-view schematics of a rip-channelled beach with a rip current flowing through the deeper channel driven by the depth-induced wave breaking alongshore pressure gradients ; (b) alongshore section with significant wave height at breaking Hs, across the bar Hsb and across the channel Hsc, and their corresponding decrease with respect to breaking ΔHsb and ΔHsc; (c) corresponding alongshore-variable wave set-up across the bar and across the channel and resulting alongshore pressure gradient ; (d) idealised, physics-informed significant wave height decay model ΔHsi, with subscript i referring to the bar (i=b) or the channel (i=c), for a given significant wave height at breaking Hs, where hi is the water depth and γ is the breaker parameter. In all panels, the time-invariant free model parameters are indicated in orange.
The rip-current flow is controlled by the alongshore pressure gradient between the wave set-up immediately onshore of the bar–rip system in the alignment of the bar and the channel (Fig. 3c). Considering Eq. (1) but looking immediately onshore of the bar–rip system instead of at the waterline, where the entire incident wave energy has been dissipated, and further ignoring set-down, wave refraction, and wave–current interaction, we can make a first-pass assumption that the wave set-up immediately onshore of the bar–rip system is controlled by the change in wave height due to depth-induced breaking across the bar and/or the channel. We can therefore assume and , where ΔHsb and ΔHsc are the decreases in wave height due to depth-induced breaking across the bar and the channel, respectively (Fig. 3b). Note that in the present work, the significant wave height Hs0 at 10 m depth was transformed into significant wave height at breaking Hs using the direct formula of Larson et al. (2010). This formula allows us to compute the incipient breaking wave properties based on a simplified solution of the wave energy flux conservation equation combined with Snell's law, assuming shore-parallel depth isocontours.
Critical to both ΔHsb and ΔHsc is the depth-induced breaking wave height decay law. Unlike regular waves, there is no simple method to estimate irregular wave heights in the surf zone, even on planar beaches. Previous studies (Dally, 1990) have shown that the root mean square wave height distribution in the surf zone on planar beaches depends on various factors, including beach slope and wave steepness. However, by neglecting wave shoaling effects and for the sake of simplicity, a physics-informed (Dally, 1990) estimation of the depth-induced breaking significant wave height decay, ΔHs, for irregular waves (Fig. 3d), can be expressed as
for hi>0 and Hs>γhi (broken waves), where hi is the local water depth with subscript i referring to the bar (i=b) or the channel (i=c), γ is the breaker parameter for random waves, and Hs is the significant wave height at breaking (after transformation through Larson et al., 2010). The depth-induced breaking significant wave height decay over the sandbar ΔHsb (the channel ΔHsc) is given by
where ζ is the tide elevation, zbar is the elevation of the sandbar, and d is the channel depth (Fig. 3b).
Following Moulton et al. (2017b), we assume that the ratio of bottom stress to the advection term is small and that the balance of pressure gradients and advection along a streamline can be approximated using the Bernoulli equation. By further neglecting the effects of inertia in a longshore current driven by obliquely incident breaking waves, the rip-flow velocity V can be approximated as
where and are the wave set-ups onshore of the bar and the channel, respectively. Note that, because of the irregular wave height decay law (Eq. 2), the alongshore gradient in wave set-up and thus rip-flow speed V depend on d, zbar, and Hs, whereas assuming regular waves, it would be independent of Hs when depth-induced breaking occurs over both the channel and the sandbar.
This simple rip-flow model proceeds as follows: at each time step t, rip-flow speed V(t) is computed as a function of and , based on the significant wave height at breaking Hs(t) and the local water depth across the bar (channel) (), where ζ(t) is the tide elevation, zbar is the elevation of the sandbar, and d is the channel depth (Fig. 3b). The rip-flow model V includes only three time-invariant free parameters that need to be calibrated and/or inferred from field data: the breaker index for random waves γ, the sandbar elevation zbar, and the channel depth d.
3.2 Shore-break wave
We used a similar, simple semi-empirical approach to estimate shore-break wave hazard. Contrary to rip-flow speed, there is no theoretical framework to estimate a measure of the shore-break wave energy. The presence of shore-break waves can be estimated through the dimensionless Iribarren parameter Ir, which is a proxy for breaker type (Battjes, 1974):
where is the deep-water wavelength, tan β is the local beach slope, and Hsb is the significant wave height at the sandbar, i.e. upon shore breaking. While breaking goes from spilling to collapsing to plunging as Ir increases, it does not provide information on the power of the breaking waves. Therefore, we introduce a shore-break wave energy parameter , assuming no change in peak wave period as the waves pass over the sandbar(s) before reaching the shore, which therefore reads
In order to compute Esb, a beach profile and a wave height model are required. Here we consider an idealised Dean-like profile given by , which, together with the tide elevation, is used to compute the beach slope tan β(ζ) (Fig. 4a). Note that here we did not consider a Dean profile () because we are interested in the intertidal, potentially bermed part of the beach profile. Critical to Esb is the shore-break wave height Hsb. Similar to all intermediate beaches, the beaches in southwest France are barred, with depth-induced breaking wave energy dissipation across the offshore sandbar limiting the breaking wave height at the shore, especially for lower tides. The sandbar was mimicked by assuming a terrace with a given elevation zbar (Fig. 4a) where waves may dissipate before reaching the shore. Therefore, consistent with the rip-current model, the wave height decay was determined through the same simple wave height decay law (Fig. 4b).
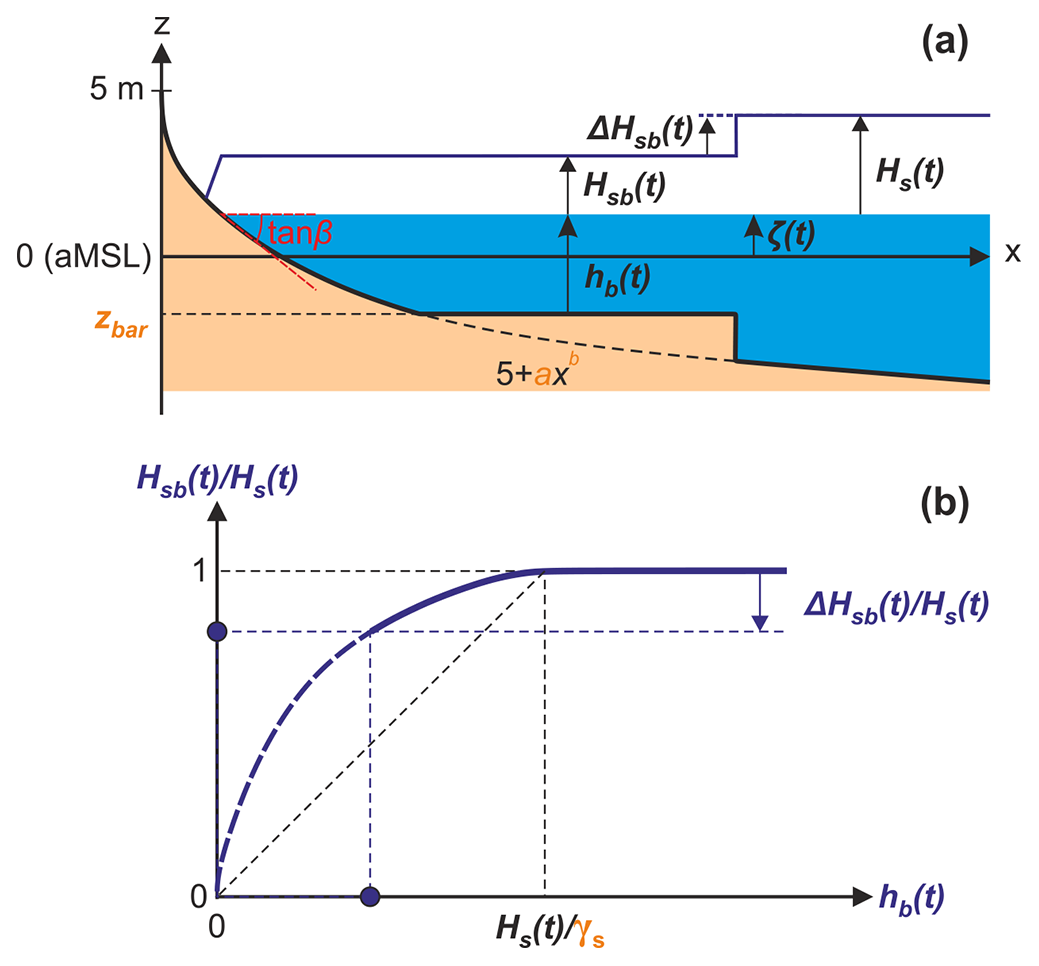
Figure 4Schematics of the semi-empirical shore-break wave energy model. (a) Idealised beach profile based on a Dean-like profile and a superimposed bar at z=zbar, resulting in the shore-break significant wave height Hsb that depends on (b) the idealised, physics-informed significant wave height decay model ΔHsb for a given significant wave height at breaking Hs and water depth with γs, which is the breaker parameter for random waves of the shore-break energy model. In all panels, the time-invariant free model parameters are indicated in orange.
This simple shore-break wave energy model proceeds as follows: at each time step, the beach slope tan β(ζ(t)) and the shore-break wave height Hsb(t) are computed. If ζ(t)<zbar during the lower tides, the sandbar emerges and all the wave energy is dissipated offshore, meaning Hsb(t)=0. At the other end of the spectrum, if , where γs is the breaker parameter for random waves of the shore-break model, there is no wave breaking across the terrace and Hsb(t)=Hs(t). In between, offshore wave breaking occurs, resulting in a decreased shore-break significant wave height by ΔHs (Fig. 4b), following the same depth-induced breaking irregular wave height decay law as for the rip-current model, resulting in
The shore-break wave energy model includes four time-invariant free model parameters: a and b, describing the beach profile shape; γs, the breaker parameter for random waves; and zbar, the terrace/sandbar elevation.
3.3 Model calibration and transformation into a five-level-scale hazard
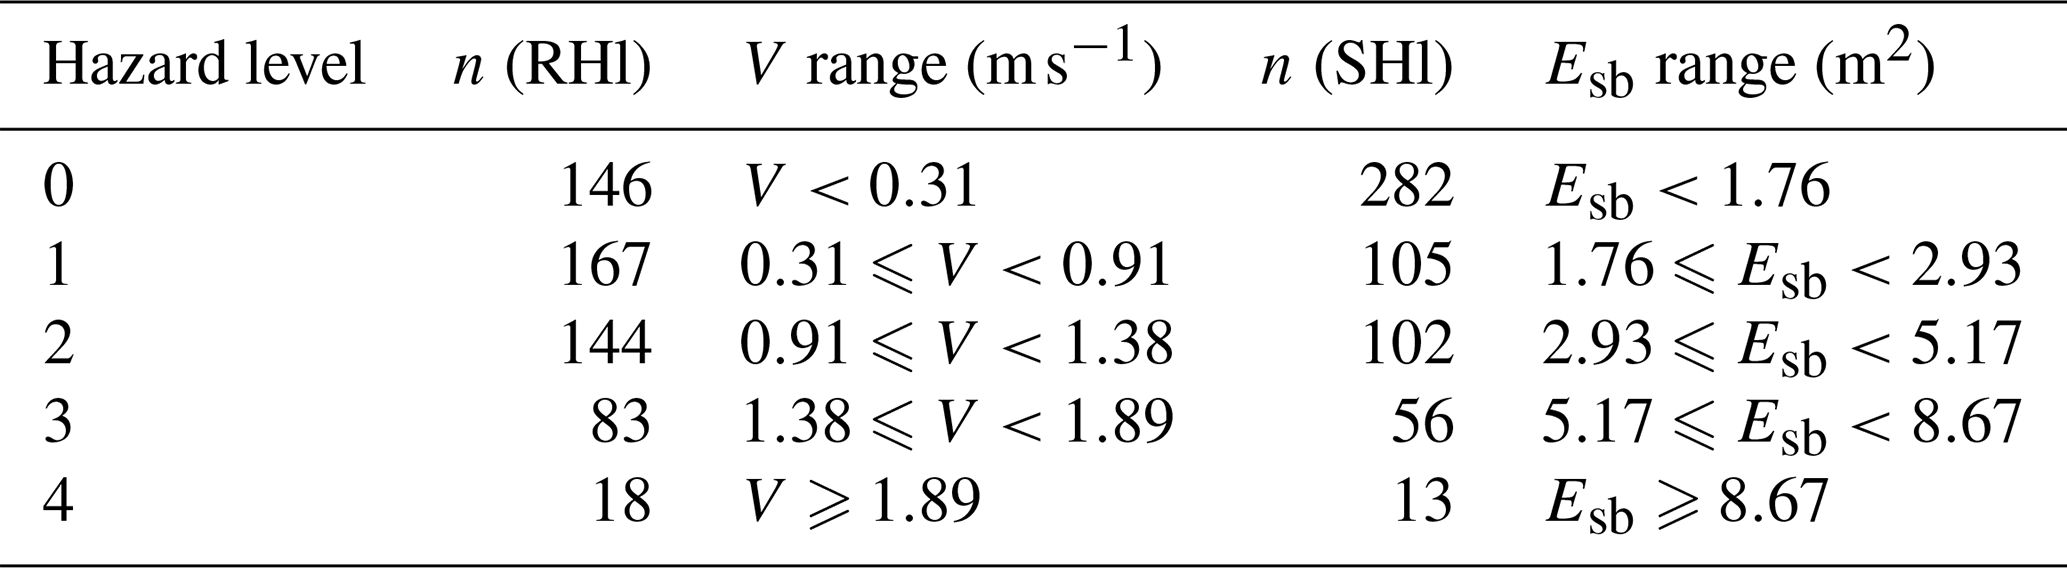
A two-step approach was used, with both steps using the lifeguard-perceived surf-zone hazard data RHl (rip current) and SHl (shore-break wave): (1) calibration of the free parameters of V and Esb and (2) a quantile–quantile approach to transform V and Esb into a five-level-scale hazard. First, a large set of simulations was run for a wide range of free parameters. The optimal parameters were found by maximising the coefficient of determination r2 between V (Esb) and RHl (SHl) during patrolling hours from 11 to 7 during the entire summer of 2022. Second, the values of V and Esb, concurrent to lifeguard observations, were sorted, and thresholds were computed in order to obtain the same number of modelled hazard levels (Table 1). Based on these thresholds in V and Esb, the complete time series of V and Esb were transformed into modelled rip-current (RHm) and shore-break wave (SHm) hazards on the same five-level scale as for lifeguard observations. The accuracy of these predictors was further addressed through confusion matrices. In addition, the modelled daily-mean rip-flow speed V (shore-break wave energy Esb) and the modelled daily-mean rip-current hazard (shore-break wave hazard ) were also compared with daily-mean lifeguard-perceived rip-current hazard (shore-break wave hazard ) in order to address the ability of the two models to predict high-hazard days.
Table 1Number of hourly lifeguard-perceived hazard observations n (rip current – RHl, shore-break wave – SHl) discriminated by level (from 0 to 4) over a total of 558 hourly observations, together with the corresponding range of V and Esb.
4.1 Rip-current hazard modelling
The best Pearson correlation (R=0.77) between the modelled rip-flow speed V and the hourly lifeguard-perceived rip-current hazard RHl was obtained for γ=0.23, m, and d=6.5 m. Figure 5a shows the corresponding V against RHl. It shows that RHl increases with increasing V and that the values are nearly normally distributed for all hazard levels, except for RHm=0, which is clearly biased towards V=0. The corresponding confusion matrix (Fig. 5b) indicates that of the 558 hourly lifeguard-perceived hazard observations, 308 are correctly classified by the model. In line with the quantile approach used, the confusion matrix is symmetric, with a resulting accuracy of 0.55. However, by merging into low-hazard hours and into moderate- to high-hazard hours (Fig. 5c), the accuracy increases to 0.84, with an F score of 0.82, meaning that the model accurately predicts moderate- to high-rip-current-hazard hours.
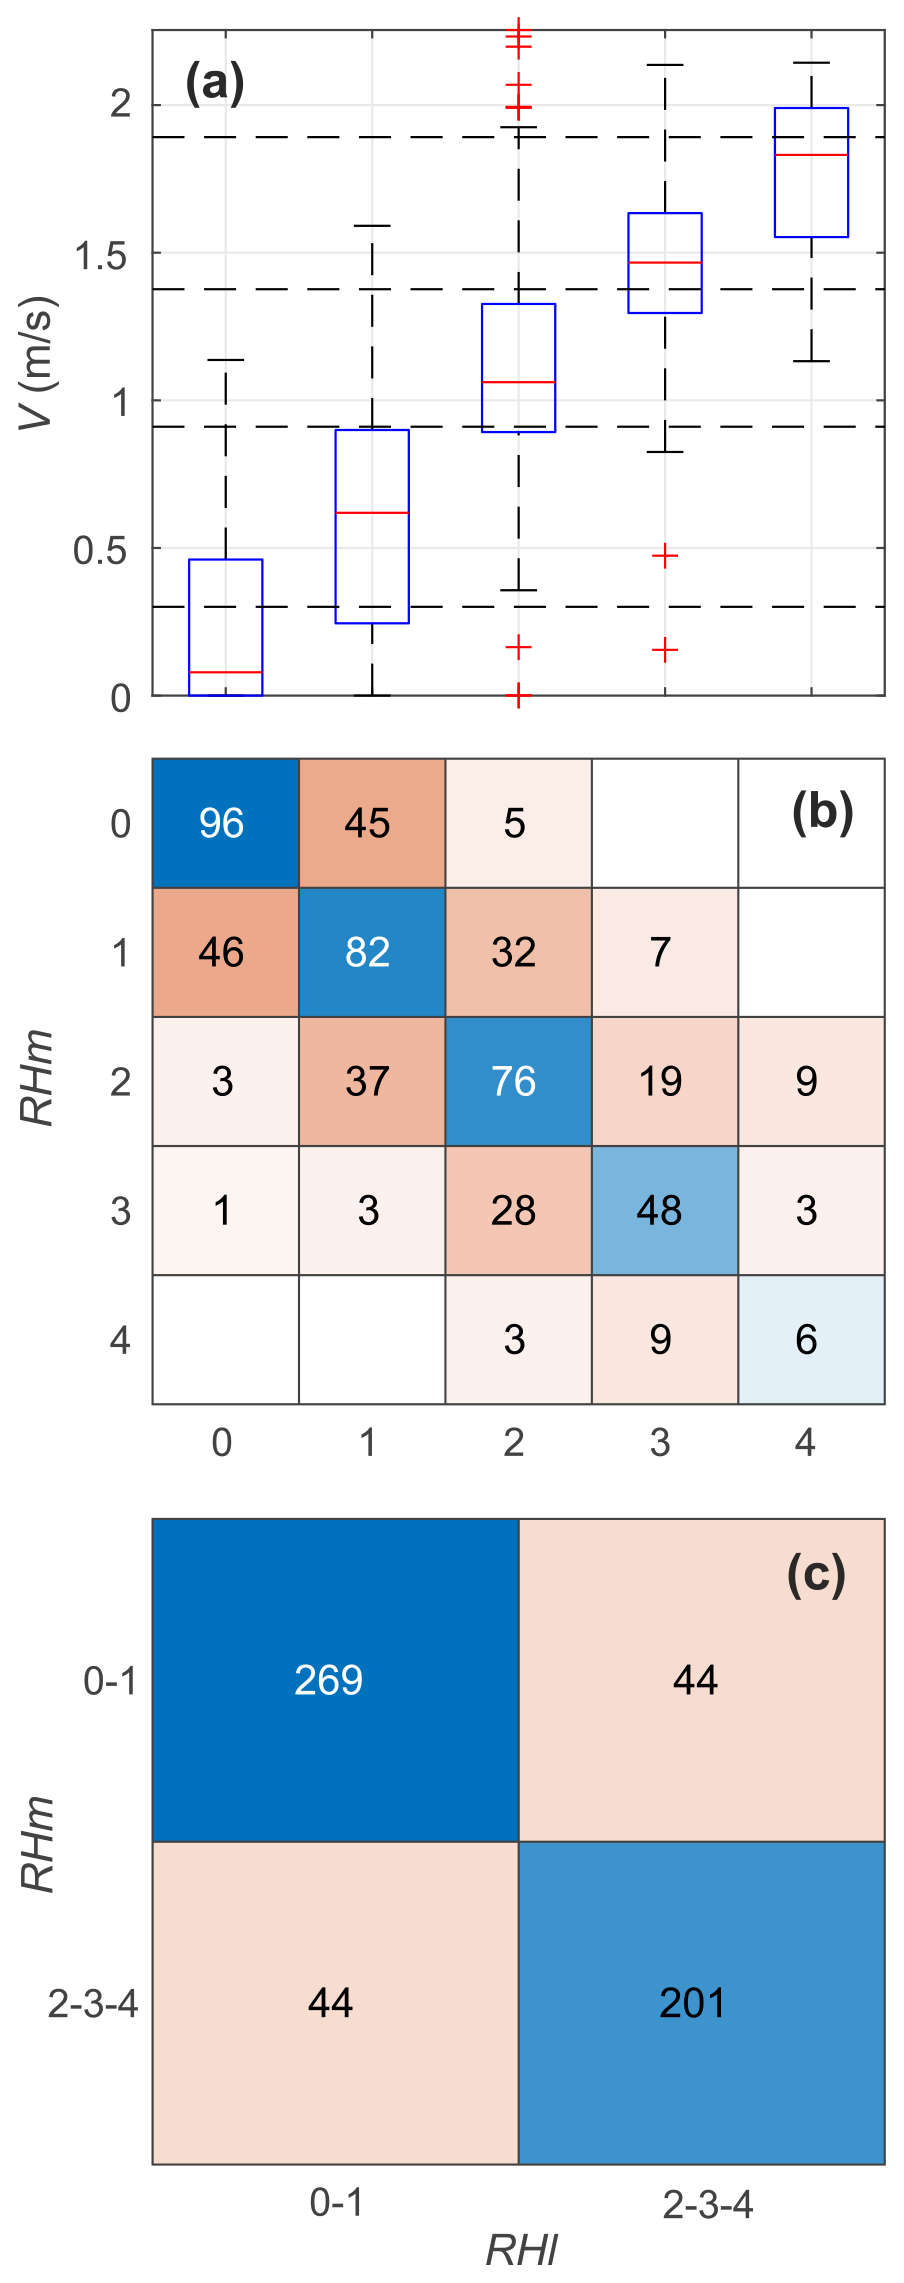
Figure 5(a) Box plot of the modelled hourly rip-flow speed V vs. hourly lifeguard-perceived rip-current hazard RHl on a five-level scale. The central horizontal red marks indicate the median; the bottom and top edges of the box indicate the 25th and 75th percentiles, respectively; the whisker length indicates 1.5 times the interquantile range; and the crosses are the outliers. The horizontal dashed lines represent the limits between each hazard-perceived scale using a quantile–quantile approach. A corresponding confusion matrix of (b) hourly modelled (SHm) and lifeguard-perceived (RHl) rip-current hazard on the five-level scale and (c) further discriminating low- () and moderate- to high-rip-current-hazard () hours.
Figure 6 shows the time series of wave and tide conditions, the modelled rip-flow speed V, the hourly modelled rip-current hazard level RHm, and the hourly lifeguard-perceived rip-current hazard level RHl. Results show that V is strongly modulated by tidal elevation η, with increased rip-current hazard for lower tidal elevations. On longer timescales, modelled rip-current hazard is also modulated by the incident wave energy, with modelled hazard increasing with increasing wave height and wave period. Figure 6d, f, and h further detail a moderate-energy, average tide range, with a 5 d window showing that the tidal modulation of the lifeguard-perceived rip-current hazard is very well captured by the model (Fig. 6h). During a 5 d period marking the onset of a high-energy wave event, with Hs exceeding 2 m, the model also captures the rip-current hazard well, which is maximised throughout 20 August (Fig. 6e, g, and h) – the only day of the summer of 2022 when the red flag was hoisted at La Lette Blanche beach, with lifeguard-perceived rip-current hazard maximised throughout the day.
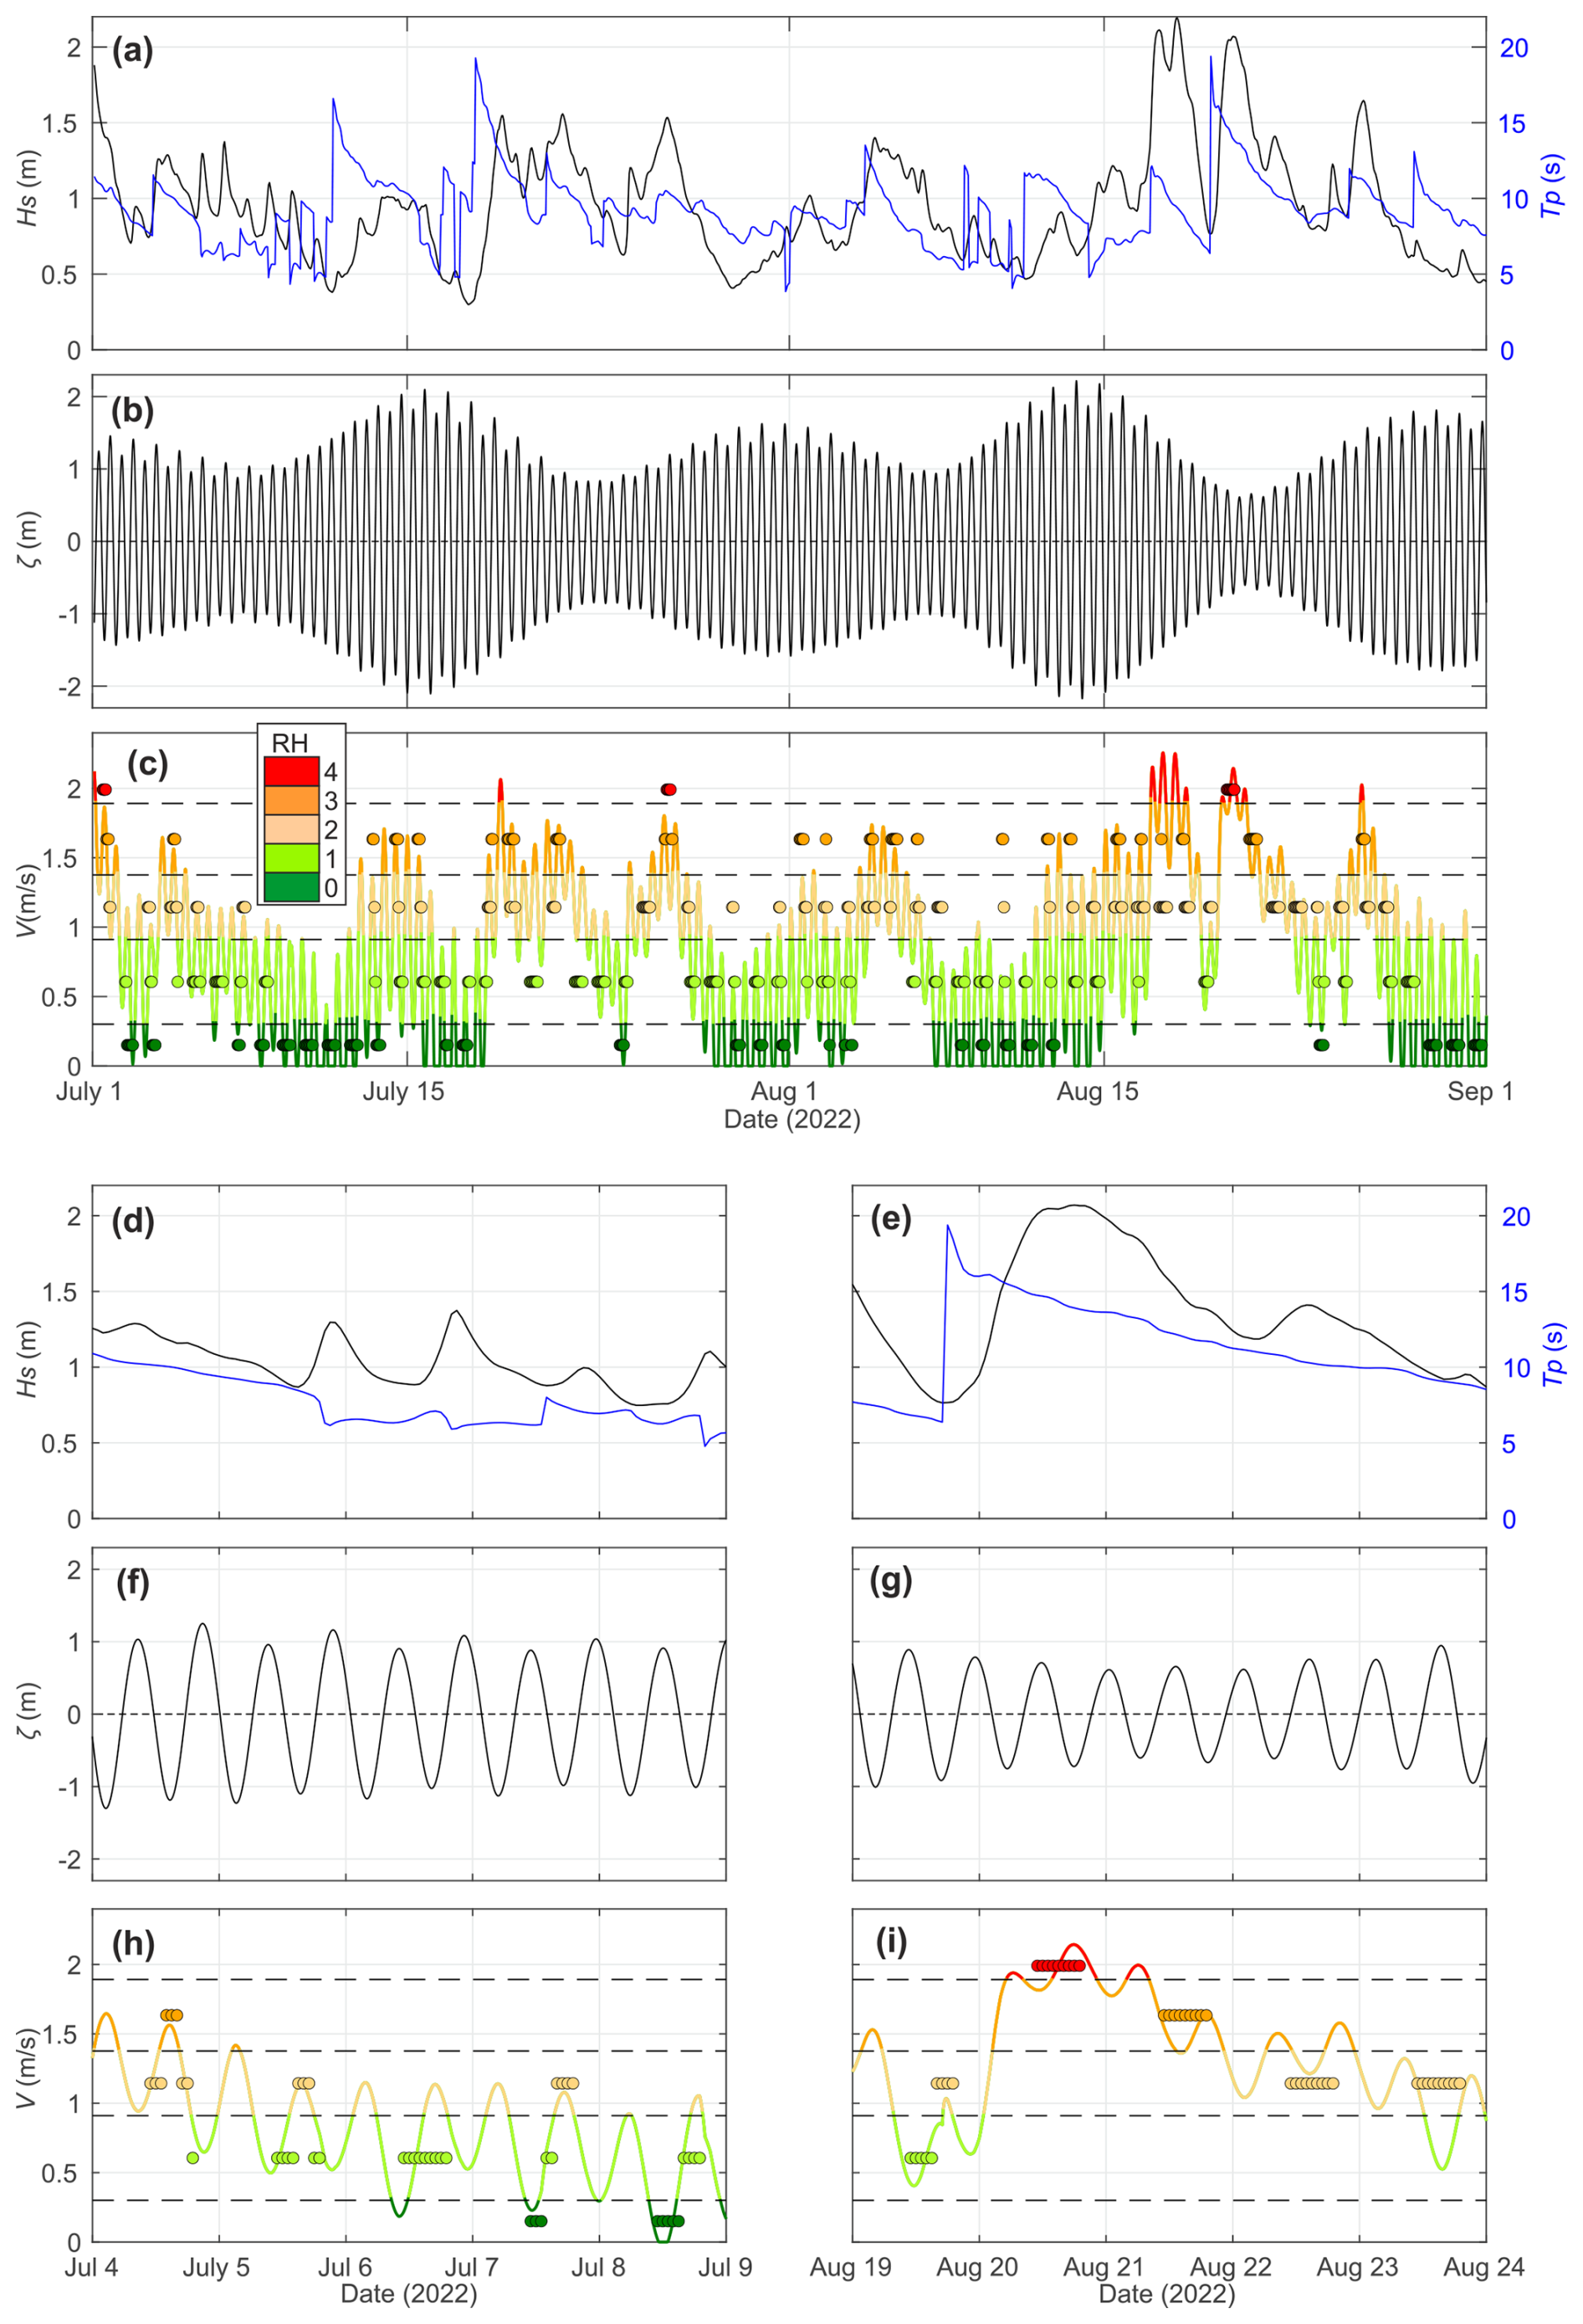
Figure 6Time series of (a) significant wave height at 10 m depth Hs0 and peak wave period Tp; (b) astronomical tide level ζ; and (c) modelled rip-current flow speed V and its corresponding hazard level RHm (coloured lines) and lifeguard-perceived rip-current hazard RHl (coloured circles), which are further zoomed-in to a 5 d period of (d, f, h) moderate-energy waves and average tide ranges and (e, g, i) high-energy waves and neap tides.
Figure 7 also shows that the model accurately predicts daily-mean rip-current hazards. The Pearson correlation between the daily-mean modelled RHm and lifeguard-perceived RHl hazards reaches R=0.83. The model captures most of the high-hazard days well, although some are overestimated (e.g. 17 August) or underestimated (28 July). The model also tends to overestimate the daily-mean hazard slightly during days when lifeguards perceived no rip-current hazard throughout the patrolling hours.
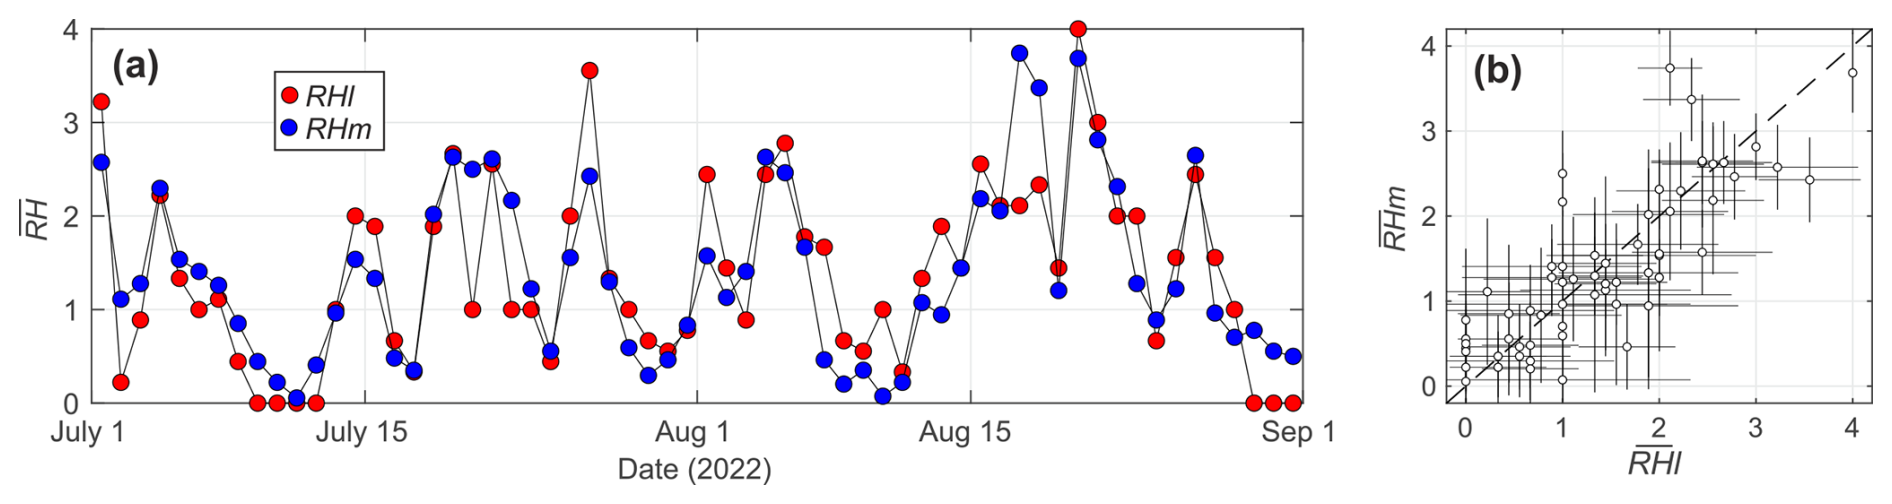
Figure 7(a) Time series of daily-mean modelled (blue, ) and lifeguard-perceived (red, ) rip-current hazards on a five-level scale. (b) Corresponding plot of vs. , with the horizontal and vertical lines indicating their daily standard deviation.
4.2 Shore-break wave hazard modelling
The best Pearson correlation (R=0.70) between the modelled shore-break wave energy Esb and the hourly lifeguard-perceived shore-break wave hazard SHl was obtained for , b=0.3, γs=0.4, and m. Figure 8a shows that SHl increases with increasing Esb with, for all hazard levels, values nearly normally distributed. In contrast with rip-current hazard results, which showed a limited number of outliers (Fig. 5a), outliers are found for all lifeguard-perceived shore-break wave hazard levels (SHl), except for SHl=1. The corresponding confusion matrix (Fig. 5b) shows that of the 558 hourly lifeguard-perceived hazard observations, 302 are correctly classified by the model, resulting in an accuracy of 0.54. However, and in line with what was found for rip-current hazard, by merging into low-hazard hours and into moderate- to high-hazard hours (Fig. 5c), the accuracy increases to 0.83, with an F score of 0.73, meaning that the model skilfully predicts the hours with a moderate to high shore-break wave hazard.
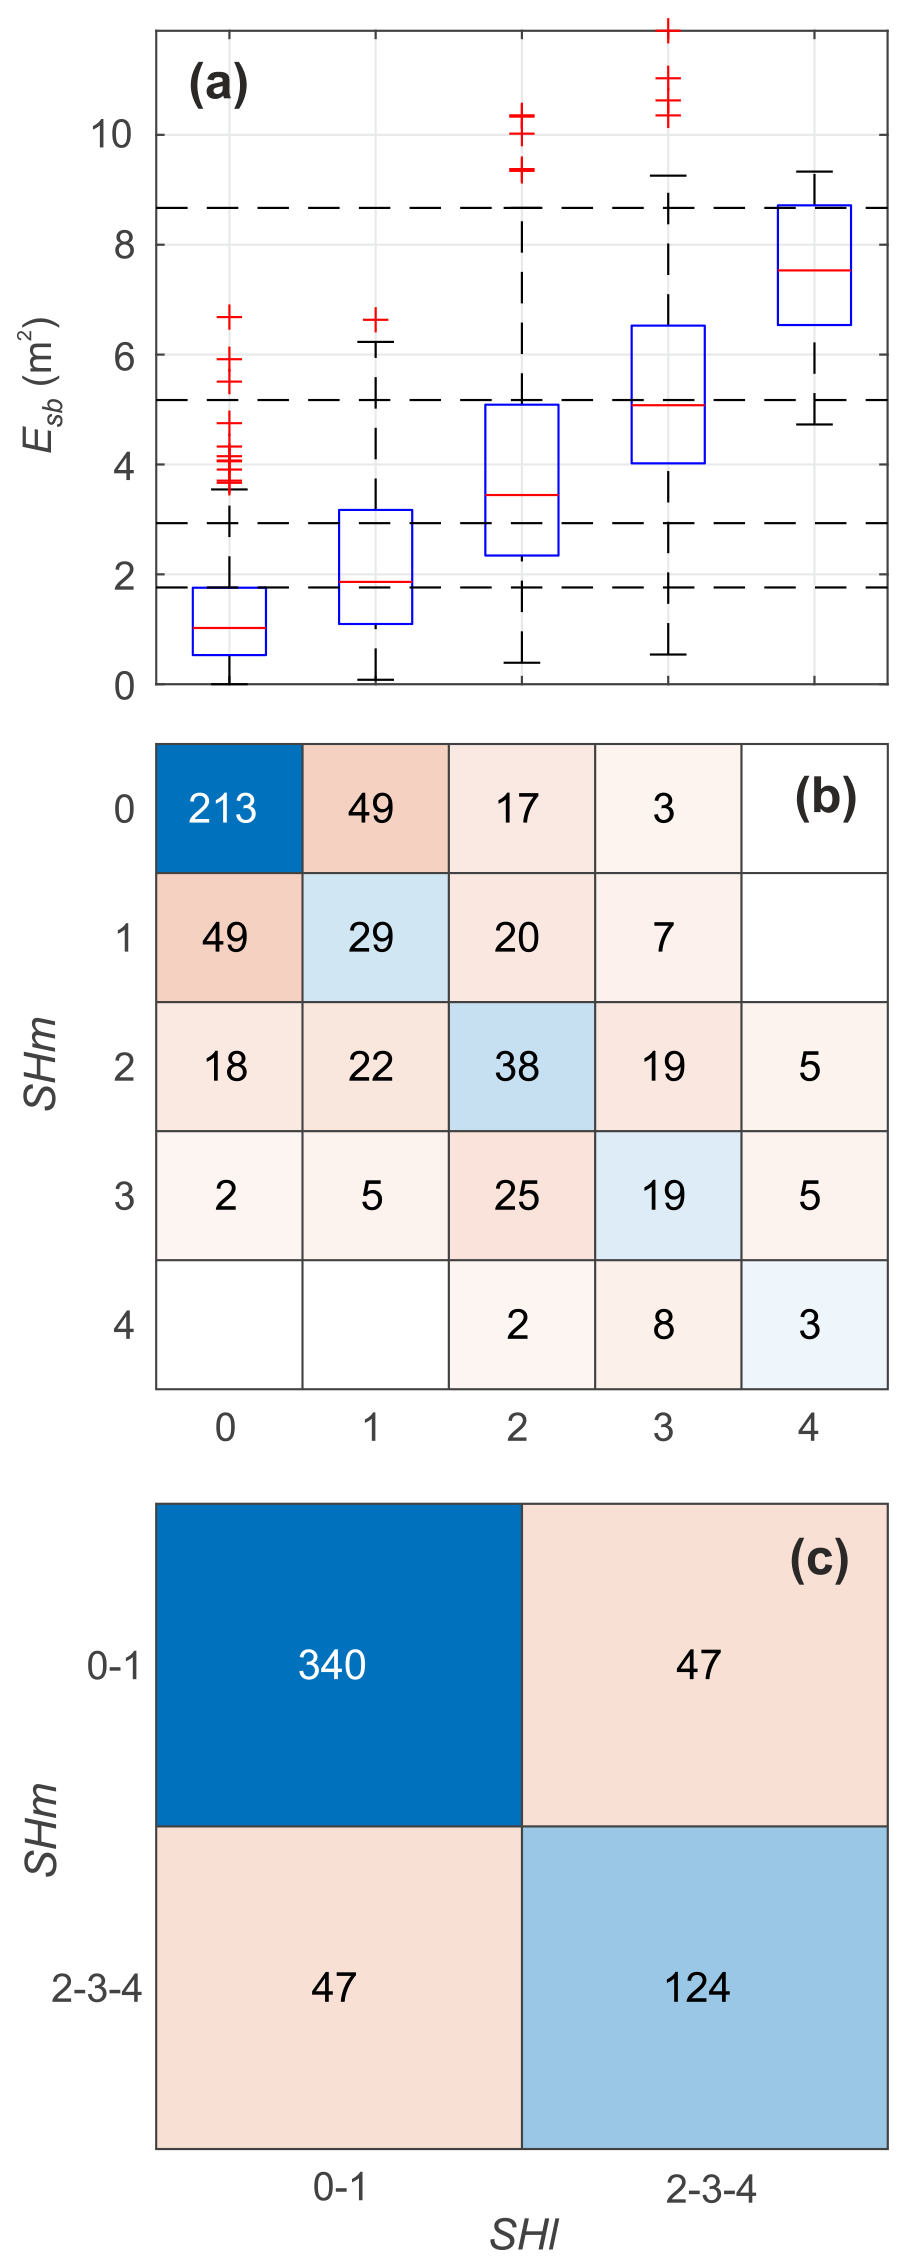
Figure 8(a) Box plot of the hourly modelled shore-break wave energy Esb vs. hourly lifeguard-perceived shore-break wave hazard SHl on a five-level scale. The central horizontal red marks indicate the median; the bottom and top edges of the box indicate the 25th and 75th percentiles, respectively; the whisker length indicates 1.5 times the interquantile range; and the crosses are the outliers. The horizontal dashed lines represent the limits between each hazard-perceived scale using a quantile–quantile approach. Corresponding confusion matrix of (b) hourly modelled (SHm) and lifeguard-perceived (SHl) shore-break wave hazards on the five-level scale and (c) further discriminating hours with low () and moderate to high shore-break wave hazards ().
Figure 9 shows the time series of wave and tide conditions, the modelled shore-break wave energy Esb and hazard level SHm, and the hourly lifeguard-perceived shore-break wave hazard SHl. Results show that Esb is strongly modulated by the tidal elevation ζ with, in contrast to rip-current hazard, shore-break wave hazard maximised during the higher stage of the tide. In line with rip-current hazard, on longer timescales shore-break wave hazard increases with increased incident wave energy. Figure 9d, f, and h further detail a moderate-energy 5 d period moving from moderate to spring tides, showing that the tidal modulation of the lifeguard-perceived shore-break wave hazard SHl and the increased hazard with increased tide range are well captured by the model (Fig. 9h). During a 5 d period comprising the progressive decay in incident wave energy during nearly steady neap–moderate tides, the model also captures the progressive decrease in shore-break wave hazards at high tides well.
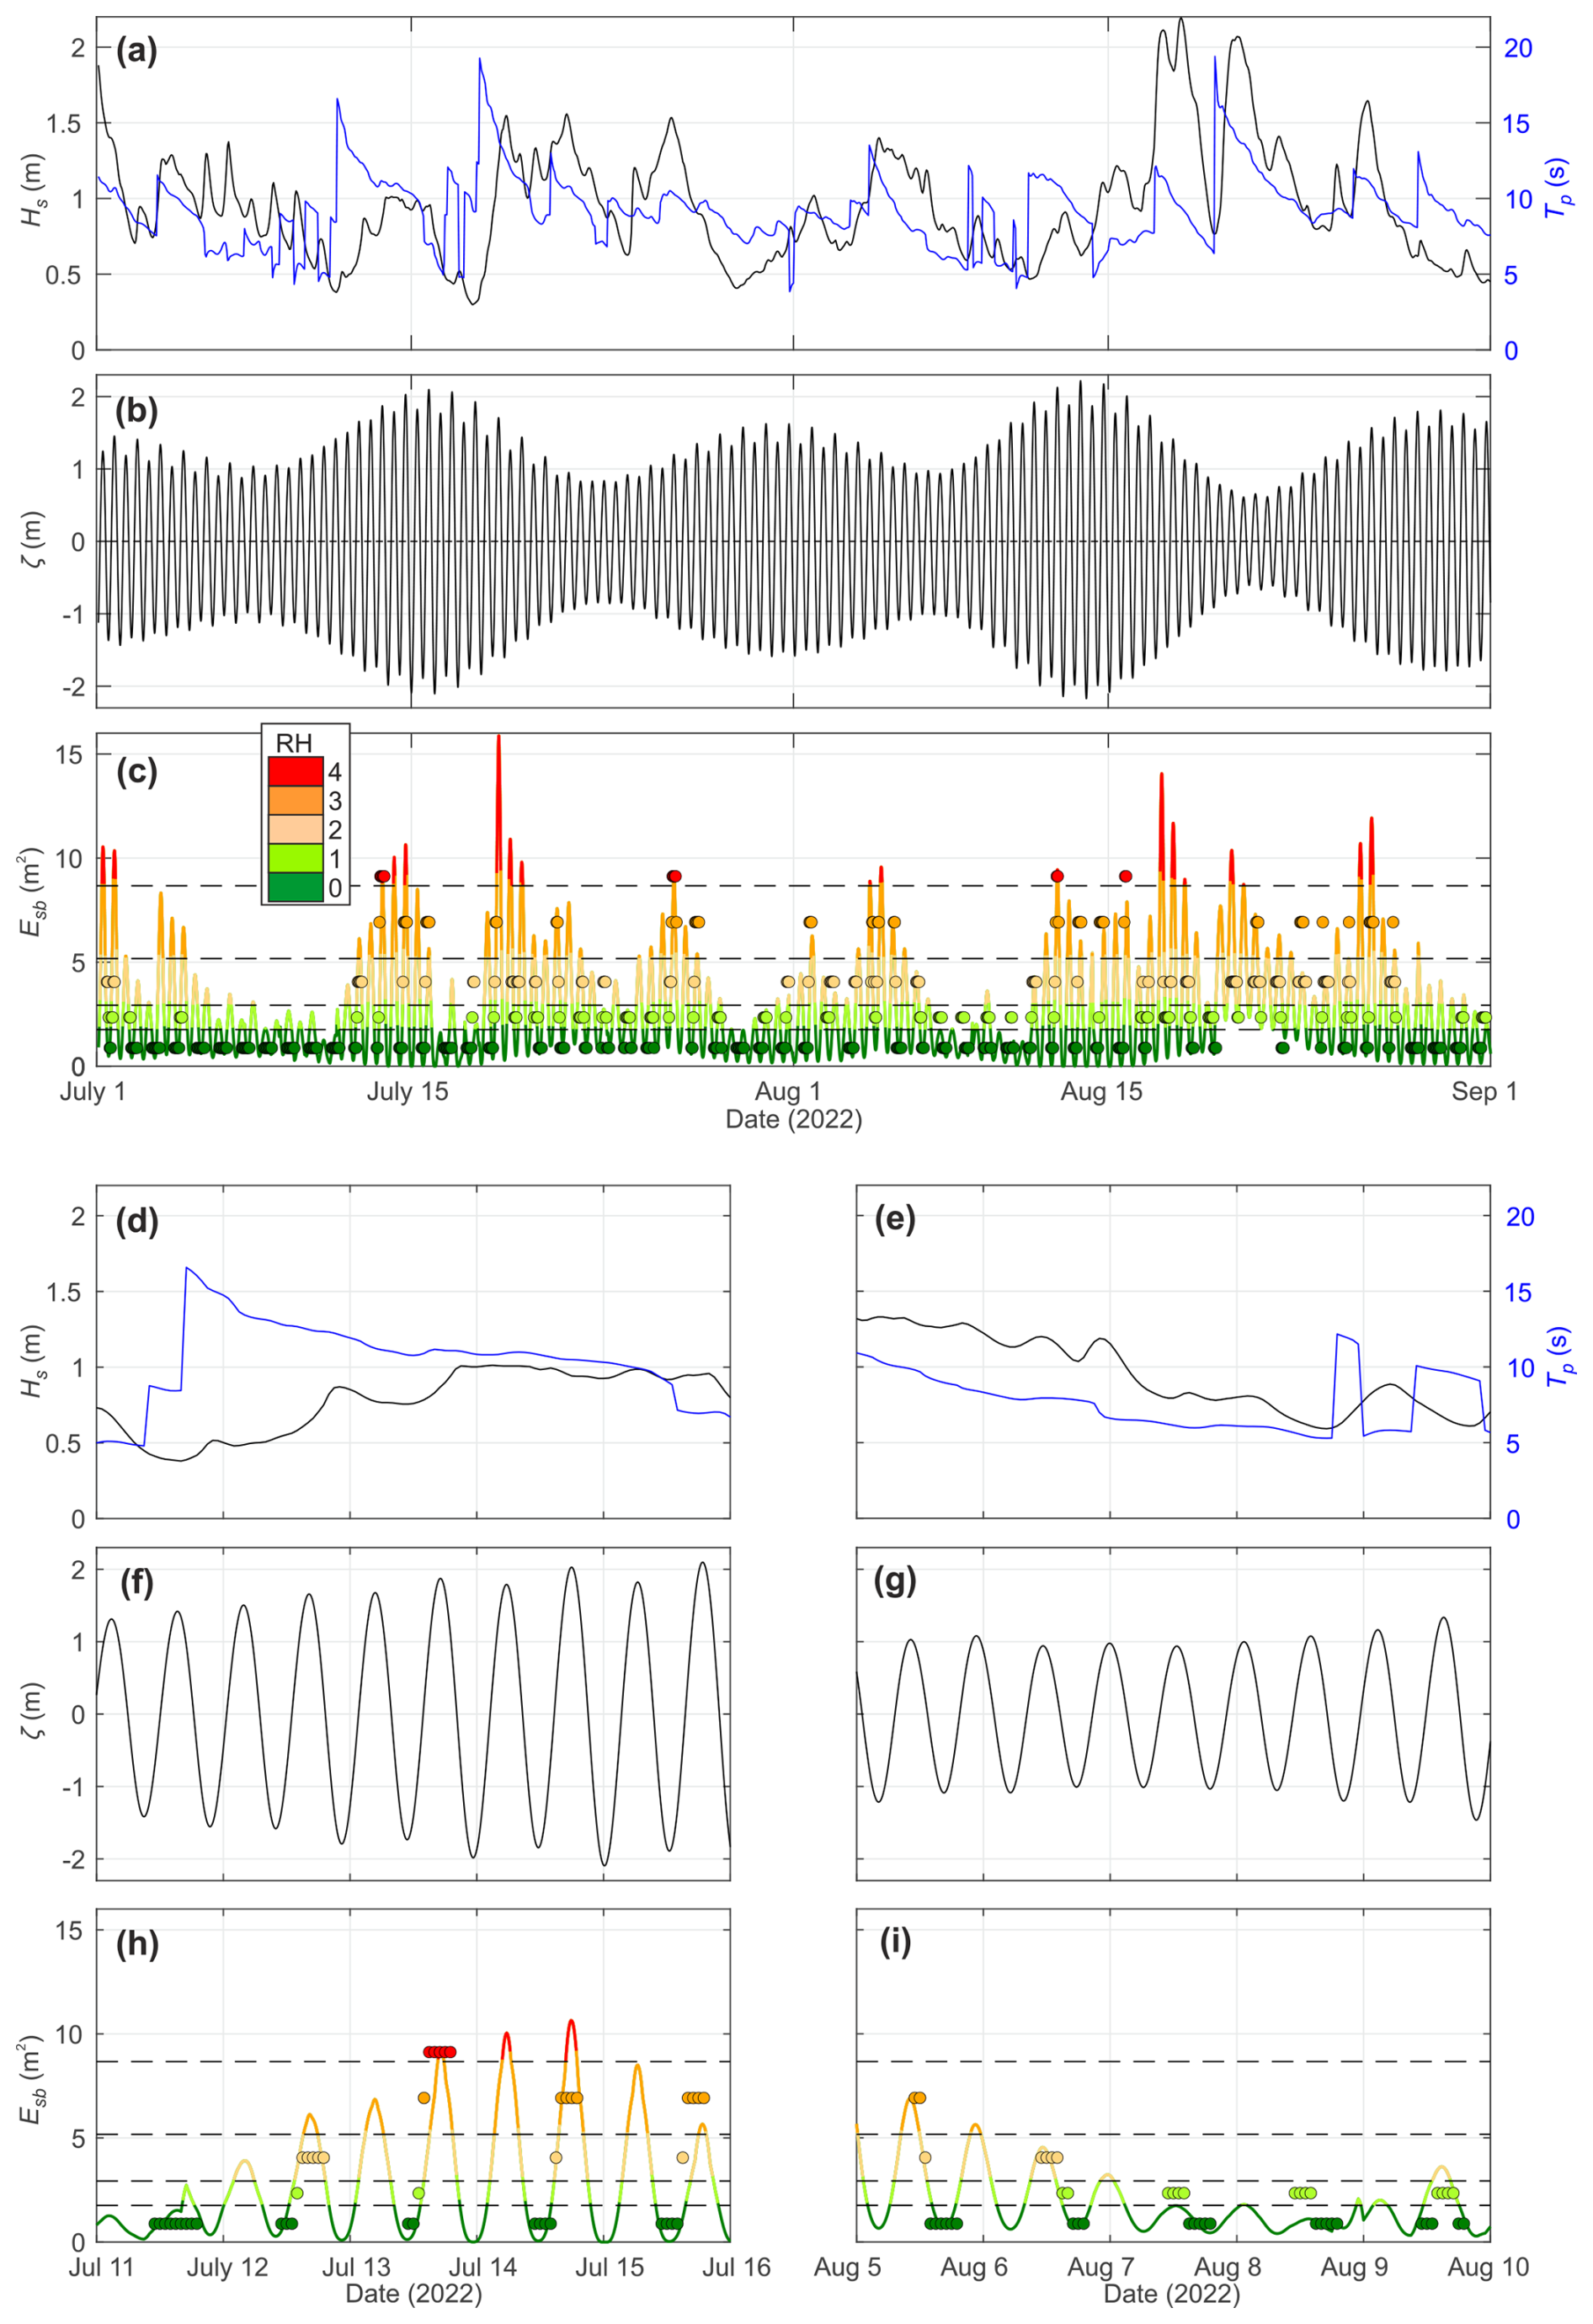
Figure 9Time series of (a) significant wave height at 10 m depth Hs0 and peak wave period Tp; (b) astronomical tide level ζ; and (c) modelled shore-break wave energy Esb and its corresponding hazard level (coloured and circles), which are further zoomed-in to a 5 d period of (d, f, h) moderate-energy waves and spring tides and (e, g, i) decreasing energy waves and neap tides.
Figure 10 also shows that, although the largest lifeguard-perceived hazard days are underestimated by the model, the model predicts daily-mean shore-break wave hazards fairly well. The Pearson correlation r between daily-mean modelled shore-break wave hazard SHm and daily-mean lifeguard-perceived shore-break wave hazard SHl is 0.71. The model captures most of the high-hazard days well, although the 2 d with the highest lifeguard-perceived shore-break wave hazard (13 and 26 July) are slightly underestimated by the model.
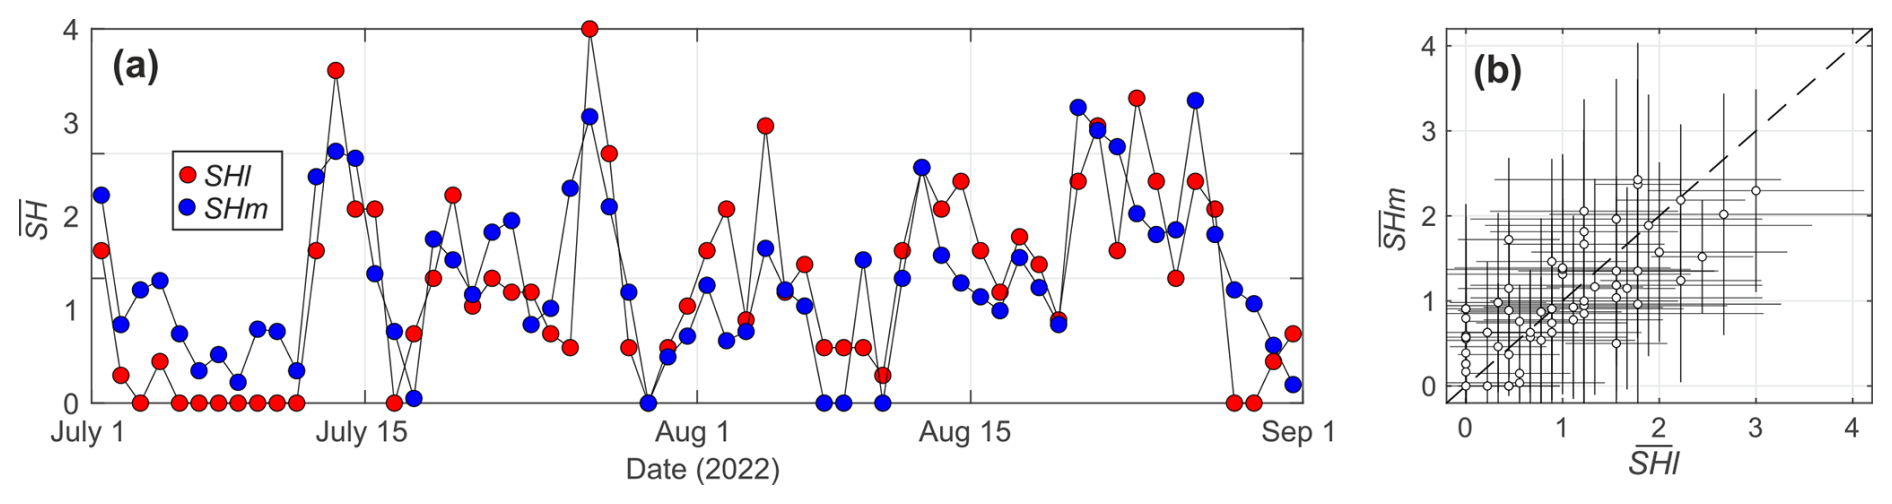
Figure 10(a) Time series of daily-mean modelled (blue, ) and lifeguard-perceived (red, ) shore-break wave hazard on a five-level scale. (b) Corresponding plot of vs. , with the horizontal and vertical lines indicating their daily standard deviation.
Two simple semi-empirical rip-current and shore-break wave hazard models were developed and further calibrated and tested on a high-energy meso- and macrotidal beach where two surf-zone hazards co-exist. Previous beach hazard predictors have primarily focused on rip currents, with, to the best of our knowledge, only Casper et al. (2024) proposing a physics-based formulation. Their approach, based on the pioneering work of Moulton et al. (2017b), is consistent with the rip-flow model proposed here as it considers an idealised bar–rip morphology and the alongshore gradient in breaking-wave-driven setups as the driving mechanism for rip-current flow. In contrast with Moulton et al. (2017b) and Casper et al. (2024), our rip-flow model (1) is more simple as it does not discriminate between different surf-zone conditions (shore break, bar break, or saturated in Moulton et al., 2017b) as we consider a simple physics-informed random wave height decay law, and it (2) has a smaller number of free parameters. Given that our model appears to overestimate rip-flow speed, comparison with field data should be performed in the future for calibration purpose. A detailed comparison between our model and that of Moulton et al. (2017b) and Casper et al. (2024) should be conducted on different beaches to determine the types of morphological, tide, and wave conditions under which each model performs better or worse. In addition, in this study, based on lifeguard-perceived hazard on a five-level scale, modelled rip-flow speed V was transformed into a similar hazard scale, showing very good skill (accuracy and F score exceeding 0.8) in predicting moderate- to high-hazard hours (). The computed accuracy and F score are very good, and trying to further improve these metrics by complexifying the model may not be relevant. Indeed, as beach safety professionals, lifeguards are supposed to develop a more robust hazard perception than laypersons (Sandman et al., 1987; Slovic, 1999). However, according to Rowe and Wright (2001), it can also be argued that lifeguards remain human beings whose hazard perception can be influenced by personal factors (experience, gender, etc.). Using average lifeguard-perceived hazard data from all lifeguards on duty, instead of the chief lifeguard only, could provide more robust data to calibrate the model. The validation approach proposed here can be applied anywhere provided lifeguard hazard assessment can be performed. If such lifeguard data cannot be collected, a first-pass approach is to base the hazard level scales on the threshold values computed in southwest France (Table 1). As mentioned previously, such model application together with lifeguard-perceived hazard should be tested elsewhere to address the influence of beach state, modal wave climate, and lifeguard perception on these threshold values. Since collecting consistent hourly lifeguard-perceived hazard data over a few weeks and under varying tide and wave conditions may not be feasible at many locations, an alternative approach is to use lifeguard-reported incidents (see, for instance, Scott et al., 2014). While such data also incorporate the exposure component of risk (Stokes et al., 2017), they are more widely available and can be highly valuable, particularly for assessing whether the model can identify mass-rescue days.
Given that shore-break waves cause a large proportion of SZIs in southwest France (Castelle et al., 2018, 2024; de Korte et al., 2021), we also proposed a shore-break wave hazard forecast model following a similar physics-informed approach. Combined, these two surf-zone hazard forecasts can provide detailed insights into surf-zone hazard evolution. This is illustrated in Fig. 11, which shows the time series of rip-current velocity V, hazard RHm, shore-break wave energy Esb, and hazard SHm (Fig. 11c and d) for an idealised time series of wave (Fig. 11a) and tide (Fig. 11b) conditions. For instance, this synthetic test case shows that rip-current flow and shore-break wave energy exhibit an out-of-phase behaviour with high rip-flow velocities sustained throughout the day (V>1.4 m s−1) under high-energy conditions (days 3 and 4). In contrast, even under high-energy waves, shore-break wave energy only peaks during the highest stage of the tide. Therefore, if rip-current hazard gradually increases with increasing wave energy, still with higher hazard for low tide levels, shore-break wave hazard is more strongly modulated by tide, with shore-break wave hazard systematically absent at the lowest stage of the tide, even under high-energy waves (day 3 in Fig. 11d).
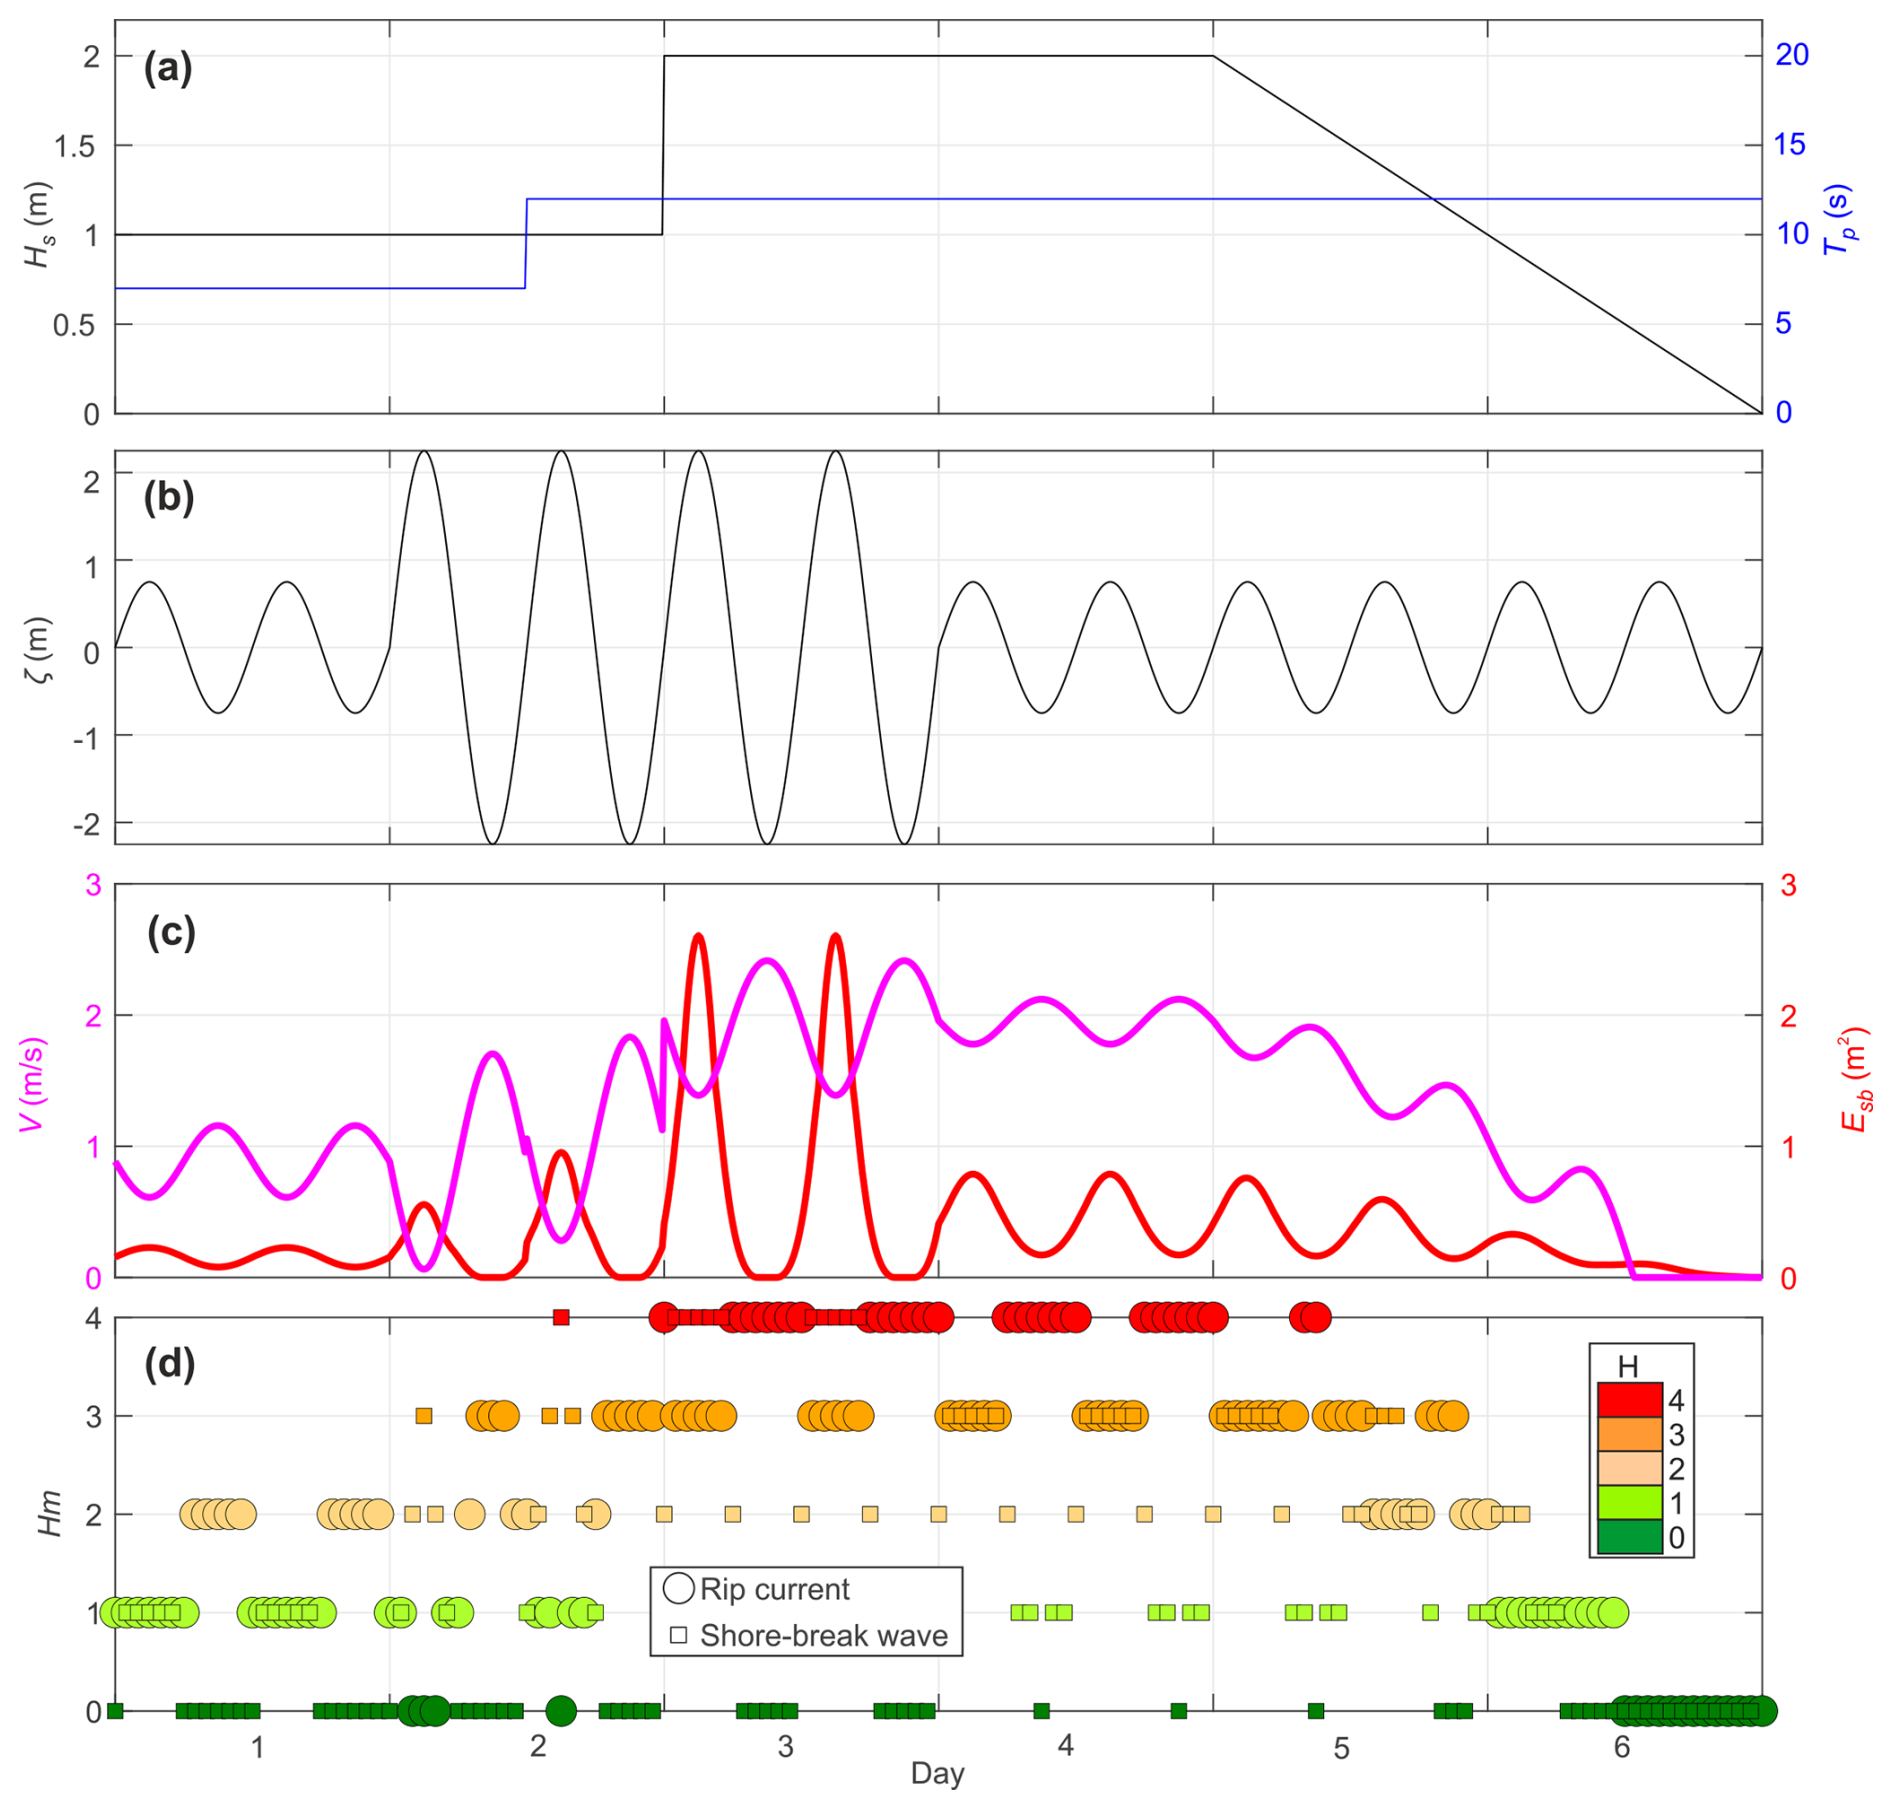
Figure 11Synthetic time series of (a) offshore significant wave height Hs0 and peak wave period Tp, (b) astronomical tide level η, (c) modelled rip-flow speed V and shore-break wave energy Esb, and (d) their hazard level (coloured).
In addition to e.g. the 10 min or hourly rip-current and shore-break wave hazard forecasts, daily-mean hazard levels also showed very good skill, with a Pearson correlation with daily-mean lifeguard-perceived hazards of R=0.83 and 0.71 for rip currents and shore-break waves, respectively. However, daily-mean hazard can be predicted with an even simpler approach, i.e. based on the wave factor defined as (with the notation indicating the summer mean). By using this number introduced by Scott et al. (2014) to address rip-current rescues in the UK, Castelle et al. (2019, 2024) showed that days with large Wf values were associated with a disproportionate number of both rip-current-related drowning and shore-break-wave-related injuries. During the summer of 2022, the correlation between daily-mean Wf and daily-mean lifeguard-perceived hazards reaches R=0.91, which outperforms (R=0.82). Such an improvement is not found with shore-break waves, mostly because daily-mean shore-break wave hazard is much more affected by tidal range than daily-mean rip-current hazard (Castelle et al., 2019, 2024). The daily-mean rip-current hazard forecast is important for providing a straightforward message to the general public and can also assist lifeguard managers in scheduling lifeguards in advance, ensuring they are deployed to beaches where they will be most needed. In this context, the daily-mean wave factor (Wf) appears to be a simple yet powerful tool for predicting and communicating high-rip-current-hazard days. It is also important to note that the correlation between the hourly lifeguard-perceived rip-current hazard (RHl) and the hourly wave factor (Wf) remains relatively high (R=0.65). This indicates that, although Wf alone does not account for tidal modulation, it still explains more than 40 % of the observed variability in lifeguard-perceived rip-current hazard. Overall, predicting daily-mean Wf complements the higher-frequency, hourly rip-current hazard prediction provided by our semi-empirical model throughout the day, as well as the shore-break hazard model, which can be used for both daily-mean and hourly predictions.
Instead of using field data, here the models were calibrated based on lifeguard-perceived surf-zone hazard levels. The primary reason was that the bathymetry of La Lette Blanche beach was not surveyed during the summer of 2022, limiting the ability to estimate the bar–rip morphology metrics used in the rip-flow model. Instead, these metrics were found by maximising the correlation between the modelled rip-flow speed V and lifeguard-perceived rip-current hazard RHl. The best model skill was found for bar crest elevation m and channel depth d=6.5 m. These numbers are in line with those of previous detailed surveys of some bar–rip morphology in southwest France (Sénéchal et al., 2011; Castelle et al., 2018). It must be noted that, while the modelled rip-flow velocity is quite sensitive to the choice of the model free parameters, good skill is also found when using values significantly different from the optimal ones. For instance, the correlation between V and RHl decreased slightly from 0.77 to 0.75 () when assuming a higher bar crest ( m instead of −3 m) or a much shallower channel (d=2 m instead of 6.5 m), which are closer to average values in southwest France. This suggests that decent model skill can be achieved with a rough estimate of the bar–rip morphology, further implying that temporal variability in beach morphology can be neglected in the model. Similar confusion matrix accuracy was also obtained as the thresholds (Table 1) are modified based on the quantile–quantile approach. The optimal breaker indices (γ=0.23, γs=0.4) for random waves, sometimes referred to as the incipient breaker index, are different from the typical empirical breaker index used (equivalent to , with H being the individual wave height), for instance, in the parametric random wave models, which typically range from 0.6 to 0.8. In line with previous fieldwork (e.g. Raubenheimer et al., 1996; Power et al., 2010), our breaker indices for random waves are significantly smaller than 0.6–0.8.
For the sake of consistency, the free morphological parameters of the shore-break wave model were also found by maximising the Pearson correlation between shore-break wave energy Esb and lifeguard-perceived shore-break wave hazard SHl. When compared to the alongshore-averaged beach topography measured on 12 July 2022 at La Lette Blanche (Fig. 12), the Dean-like profile (solid blue line in Fig. 12b) is much steeper than the alongshore-averaged profile. However, by changing into , which is in much better agreement with the measured profile (dotted blue line in Fig. 12b), the correlation between Esb and SHl is approximately the same (R=0.70, with a marginal decrease by using the dotted blue line profile in Fig. 12b). This once again shows that beach surveys can be used instead of a Dean-like profile calibrated with lifeguard-perceived hazards. The shore-break wave model was more sensitive to the shore-break wave height Hsb, i.e. to the terrace/sandbar elevation zbar and breaker index γs. Overall, both the rip-current and the shore-break wave hazard forecast models can be used based on some knowledge of the beach morphology. However, while parameters such as bar crest depth and channel depth are relatively simple, obtaining them remains challenging due to the difficulty of surveying the surf zone, which is not routinely monitored at most locations. This raises important considerations for the large-scale transferability of the models. Future applications will need to determine how these parameters can be feasibly obtained, whether through direct surveying, remote sensing, or empirical estimations based on regional morphology. Additionally, while the calibrated values used in this study may serve as a reference, their applicability to other sites remains uncertain, and further research is needed to assess whether re-calibration against lifeguard observations or other validation datasets is necessary at each new location.
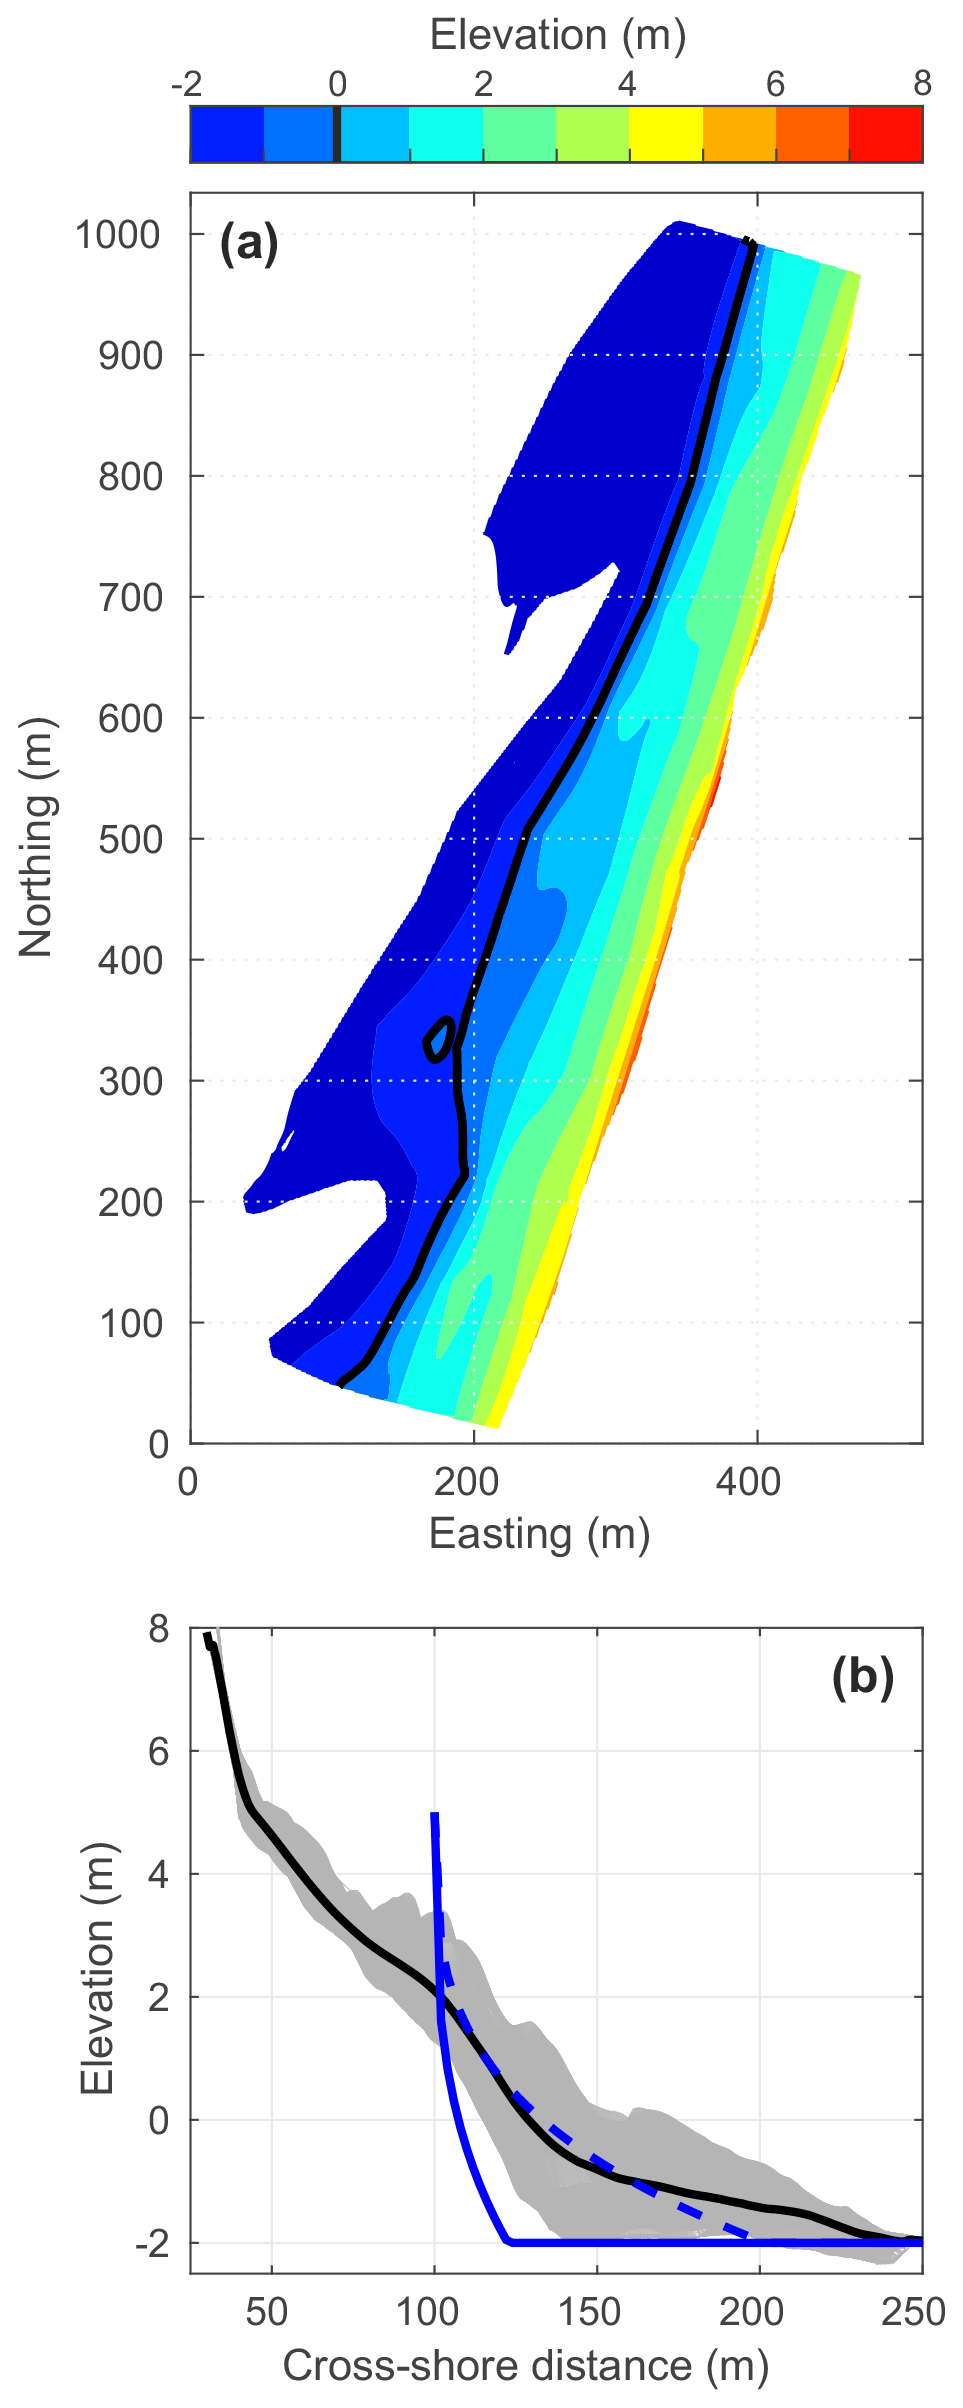
Figure 12Topographic survey of La Lette Blanche beach performed at low tide on 12 July 2022 with (a) a digital elevation model with elevation relative to mean sea level (coloured) and (b) all cross-shore- (light grey) and alongshore-averaged (thick black) profiles, with the solid (dashed) blue lines depicting the Dean-like profile for and b=0.3 ( and b=0.3).
In line with Moulton et al. (2017b), the rip-flow model does not seem to consider the wave period Tp. However, rip-flow speed is known to increase with increasing wave period, and we also show that wave period is key to the wave factor Wf, which outperforms daily-mean V in explaining variance. Surprisingly, including in Eq. (5) did not increase model skill (the best correlation was obtained for n=0). However, Tp is indirectly considered here in our model as the shoaled significant wave height Hs is considered through the formulation of Larson et al. (2010), resulting in a larger breaking wave height for a larger period. This is why in Fig. 11c the rip-flow speed increases by 7 % (from 1.71 to 1.83 m s−1 at spring low tide) during day 2 as Tp increases from 7 to 12 s. Replacing the shoaled significant wave height at breaking (Hs) with the significant wave height from the Météo-France wave model at nearly 10 m depth (Hs0) slightly decreased the correlation between V and RHl from 0.77 to 0.76, showing the weak but positive influence of wave period (Tp) on rip-flow speed. In addition, under increasingly obliquely incident waves, rip currents tend to progressively change from a symmetric seaward-flowing jet to an undulating longshore current (MacMahan et al., 2010). The influence of the presence of a longshore current component on the decay of rip flow was tested using the same approach as in Moulton et al. (2017a) and Casper et al. (2024). However, inclusion of the longshore current did not improve model skill. This is in agreement with Moulton et al. (2017b), who suggested that for deeper rip channels, like those along southwest France's open beaches, rip-flow speed is not suppressed under obliquely incident waves. Including the effect of longshore current on rip-flow speed is, however, strongly encouraged when applying the model on beaches with shallow rip channels (MacMahan et al., 2008). It must also be acknowledged that the rip-current hazard in this study was estimated based solely on rip-flow speed. However, other flow characteristics can also influence the physical hazard, such as the rip-current circulation regime, which plays an important role in determining the optimal rip-current escape strategy (McCarroll et al., 2014a). Surf-zone rip currents have long been perceived as narrow flows extending well beyond the breakers, rapidly flushing water out of the surf zone in what is known as the “exit-flow” circulation regime. However, studies using Lagrangian drifter measurements to compute surf-zone exit rates (e.g. MacMahan et al., 2010; McCarroll et al., 2014b) have shown that rip-flow patterns can also form quasi-steady, semi-enclosed vortices that retain most floating material within the surf zone, referred to as the “circulatory flow” circulation regime. Unlike the exit-flow regime, the circulatory regime increases the likelihood that a swimmer caught in a rip current will be carried back to shallower, safer waters within a few minutes (McCarroll et al., 2015; Castelle et al., 2016a). Although observed and modelled exit rates in channel rips show considerable natural variability, the highest exit rates are generally associated with the lowest incident wave energy and, consequently, the lowest rip-flow speeds (see review in Castelle et al., 2016b). This study focused on channel rip currents, the most common rip type on intermediate beaches, although other types of rip currents exist (see Dalrymple et al., 2011; Castelle et al., 2016b; Houser et al., 2020). With the notable exception of Casper et al. (2024), who explored the potential for forecasting flash rip hazards at a Californian beach, hazard forecasting for other rip-current types has never been tested. Our model is therefore mostly adapted to intermediate, high-energy sandy beaches.
The predicted natural hazard level is critical to communicate to the general public as, by definition, it provides direct information on the level of threat of a naturally occurring event, here intense rip currents and powerful shore-break waves. However, the number of rescues and SZIs, which is of strong interest for lifeguard institutions and emergency units as it is a proxy for the volume of activity and thus workforce requirement, also depends on the number of people exposed to physical hazards (the exposure component described in Stokes et al., 2017). An option to predict beach risk is to fit a logistic regression model with SZI data based on wave, tide, and weather forecasts (Tellier et al., 2022). However, model skill strongly depends on the SZI dataset's size and quality, and such models fail to identify the respective contributions of exposure and hazard components to the overall risk. The exposure component can be determined through beach attendance, which can be computed with different techniques using e.g. video systems (Boominathan et al., 2016; Guillén et al., 2008). Given that beach attendance is largely governed by weather conditions (e.g. Dwight et al., 2007; Moreno et al., 2008; Ibarra, 2011; Coombes et al., 2009), as well as weekday and holiday periods (Kane et al., 2021; Tellier et al., 2022), machine learning techniques (e.g. Mahesh, 2020; Domingo, 2021) can be used to predict beach crowds, as recently shown in Castelle et al. (2025). In order to robustly link beach crowds with the number of people entering the water, which is exposure, the bathing rate will need to be determined. Dwight et al. (2007) have estimated that, on average, only 45 % of individuals arriving at the beach have physical contact with water on southern Californian beaches. Such a proportion decreases during the colder winter months (26 %) and increases in summer during warmer days (54 %). Wave conditions can also influence the rate of bathing. For instance, de Korte et al. (2021) found that large shore-break waves (Hs>2.5 m) can deter beachgoers from entering the water. Similarly, Dehez et al. (2024) demonstrated that weather and ocean conditions significantly impact beachgoers' risk perception and, consequently, their likelihood of entering the water. While further research is needed to improve predictions of exposure, the present work already provides valuable forecasts of the underlying hazard level. Since hazard itself is the primary concern for both the public and lifeguard services, these predictions can be highly useful even without explicitly accounting for exposure.
This paper introduces two new, simple semi-empirical rip-current and shore-break wave hazard forecast models. These models, which depend on a limited number of free parameters, allow us to estimate the time evolution of the rip-current flow speed V and shore-break wave energy Esb. Using hourly lifeguard-perceived hazards collected over a 2-month period, a quantile–quantile approach was used to transform V and Esb into a five-level scale from 0 (no hazard) to 4 (hazard maximised). The forecast models accurately predict rip-current and shore-break wave hazard levels, including their modulation by tide elevation and incident wave conditions, opening new perspectives for forecasting multiple surf-zone hazards on sandy beaches. The approach presented requires only a few beach morphology metrics, enabling surf-zone hazard prediction on beaches with wave forecasts. Combined with global beach safety research, this effort supports the development and communication of surf-zone hazard forecasts to help reduce drownings and surf-zone injuries.
The wave, tide, and lifeguard-perceived rip-current and shore-break wave hazard datasets are available at https://doi.org/10.17605/OSF.IO/TZQAX (Castelle, 2024).
BC conceptualised the idea, curated the data, conducted formal analysis, developed the model, visualised the results, and wrote the original draft; JPS collected lifeguard data; SL produced the wave data. Model validation was done by BC with the guidance of DC. All authors reviewed and edited the draft. Project administration and the acquisition of funding were done by BC and JD.
The contact author has declared that none of the authors has any competing interests.
Publisher's note: Copernicus Publications remains neutral with regard to jurisdictional claims made in the text, published maps, institutional affiliations, or any other geographical representation in this paper. While Copernicus Publications makes every effort to include appropriate place names, the final responsibility lies with the authors.
We warmly thank the Syndicat Mixte de Gestion des Baignades Landaise (SMGBL) and, in particular, Stéphanie Barneix and the La Lette Blanche lifeguards who were on duty during the summer of 2022. We are also thankful to the Vielle-Saint-Girons council for providing technical support and access to the lifeguard facilities. We warmly thank the two anonymous reviewers for their insightful comments and constructive criticism, which helped us to strengthen the paper.
This study received financial support from the Surf zone hazards, recreational beach use and Water safetY Management in a changing climate (SWYM) project, funded by Région Nouvelle-Aquitaine, and from the Government of France under the framework of the University of Bordeaux's Investments for the Future (IdEx) programme/RRI Tackling Global Change. Additional funding was provided by project IRICOT (PEPR IRIMA), managed by Agence National de la Recherche (ANR), France 2030, ANR-22-EXIR-0004, and by Région Nouvelle-Aquitaine (PSGAR CORALi).
This paper was edited by Rachid Omira and reviewed by two anonymous referees.
Aagaard, T., Greenwood, B., and Nielsen, J.: Mean currents and sediment transport in a rip channel, Mar. Geol., 140, 25–45, https://doi.org/10.1016/S0025-3227(97)00025-X, 1997. a
Arozarena, I., Houser, C., Echeverria, A., and Brannstrom, C.: The rip current hazard in Costa Rica, Nat. Hazards, 77, 753–768, https://doi.org/10.1007/s11069-015-1626-9, 2015. a
Atkinson, A. L., Power, H. E., Moura, T., Hammond, T., Callaghan, D. P., and Baldock, T. E.: Assessment of runup predictions by empirical models on non-truncated beaches on the south-east Australian coast, Coast. Eng., 119, 15–31, https://doi.org/10.1016/j.coastaleng.2016.10.001, 2017. a
Austin, M., Scott, T. M., Brown, J. W., Brown, J. A., MacMahan, J. H., Masselink, G., and Russell, P.: Temporal observations of rip current circulation on a macro-tidal beach, Cont. Shelf. Res., 30, 1149–1165, https://doi.org/10.1016/j.csr.2010.03.005, 2010. a
Austin, M., Scott, T. M., Russell, P. E., and Masselink, G.: Rip current prediction: development, validation and evaluation of an operational tool, J. Coast. Res., 29, 283–300, https://doi.org/10.2112/JCOASTRES-D-12-00093.1, 2013. a
Barlas, B. and Beji, S.: Rip current fatalities on the Black Sea beaches of Istanbul and effects of cultural aspects in shaping the incidents, Nat. Hazards, 80, 811–821, https://doi.org/10.1007/s11069-015-1998-x, 2016. a
Bates, P. D., Quinn, N., Sampson, C., Smith, A., Wing, O., Sosa, J., Savage, J., Olcese, G., Neal, J., Schumann, G., Giustarini, L., Coxon, G., Porter, J. R., Amodeo, M. F., Chu, Z., Lewis-Gruss, S., Freeman, N. B., Houser, T., Delgado, M., Hamidi, A., Bolliger, I., E. McCusker, K., Emanuel, K., Ferreira, C. M., Khalid, A., Haigh, I. D., Couasnon, A., E. Kopp, R., Hsiang, S., and Krajewski, W. F.: Combined modeling of US fluvial, pluvial, and coastal flood hazard under current and future climates, Water Resour. Res., 57, e2020WR028673, https://doi.org/10.1029/2020WR028673, 2021. a
Battjes, J. A.: Surf similarity, in: 14th Int. Conf. on Coastal Eng., ASCE, Copenhagen, Denmark, 24–28 June 1974, 466–480, https://doi.org/10.1061/9780872621138.029, 1974. a
Boominathan, L., Kruthiventi, S., and Venkatesh Babu, R.: CrowdNet: A deep convolutional network for dense crowd counting, in: MM 2016 – Proceedings of the 2016 ACM Multimedia Conference, Amsterdam, the Netherlands, 15–19 October 2016, 640–644, https://doi.org/10.1145/2964284.2967300, 2016. a
Bowen, A. J.: Rip currents: 1. Theoretical investigations, J. Geophys. Res., 74, 5467–5478, https://doi.org/10.1029/JC074i023p05467, 1969. a
Brander, R. W. and Short, A. D.: Flow kinematics of low-energy rip current systems, J. Coast. Res., 17, 468–481, 2001. a, b
Brewster, B. C., Gould, R. E., and Brander, R. W.: Estimations of rip current rescues and drowning in the United States, Nat. Hazards Earth Syst. Sci., 19, 389–397, https://doi.org/10.5194/nhess-19-389-2019, 2019. a
Brighton, B., Sherker, S., Brander, R., Thompson, M., and Bradstreet, A.: Rip current related drowning deaths and rescues in Australia 2004–2011, Nat. Hazards Earth Syst. Sci., 13, 1069–1075, https://doi.org/10.5194/nhess-13-1069-2013, 2013. a
Britton, E., Kindermann, G., Domegan, C. T., and Carlin, C. M.: Blue care: a systematic review of blue space interventions for health and wellbeing, Health Promot. Int., 35, 50–69, 2018. a
Bruneau, N., Castelle, B., Bonneton, P., Pedreros, R., Almar, R., Bonneton, N., Bretel, P., Parisot, J.-P., and Sénéchal, N.: Field observations of an evolving rip current on a meso-macrotidal well-developed inner bar and rip morphology, Cont. Shelf Res., 29, 1650–1662, https://doi.org/10.1016/j.csr.2009.05.005, 2009. a
Bruneau, N., Bonneton, P., Castelle, B., and Pedreros, R.: Modeling rip current circulations and vorticity in a high-energy mesotidal-macrotidal environment, J. Geophys. Res.-Oceans, 116, C07026, https://doi.org/10.1029/2010JC006693, 2011. a, b, c
Brunner, M. I., Slater, L., Tallaksen, L. M., and Clark, M.: Challenges in modeling and predicting floods and droughts: a review, WIREs Water, 8, e1520, https://doi.org/10.1002/wat2.1520, 2021. a
Bujosa, A., Riera, A., and Pons, P. J.: Sun-and-beach tourism and the importance of intra-destination movements in mature destinations, Tourism Geographies, 17, 780–794, https://doi.org/10.1080/14616688.2015.1093538, 2015. a
Casper, A., Nuss, E. S., Baker, C. M., Moulton, M., and Dusek, G.: Assessing NOAA rip-current hazard likelihood predictions: comparison with lifeguard observations and parameterizations of bathymetric and transient rip-current types, Weather Forecast., 39, 1045–1063, https://doi.org/10.1175/WAF-D-23-0181.1, 2024. a, b, c, d, e, f
Castelle, B.: Lifeguard-perceived rip-current and shore-break wave hazard with wave and tide conditions, OSF [data set], https://doi.org/10.17605/OSF.IO/TZQAX, 2024. a
Castelle, B. and Masselink, G.: Morphodynamics of wave-dominated beaches, Cambridge Prisms: Coastal Futures, 1, e1, https://doi.org/10.1017/cft.2022.2, 2023. a
Castelle, B., McCarroll, R. J., Brander, R. W., Scott, T., and Dubarbier, B.: Modelling the alongshore variability of optimum rip current escape strategies on a multiple rip-channelled beach, Nat. Hazards, 81, 663–686, 2016a. a
Castelle, B., Scott, T., Brander, R., and McCarroll, R.: Rip current types, circulation and hazard, Earth Sci. Rev., 163, 1–21, https://doi.org/10.1016/j.earscirev.2016.09.008, 2016b. a, b, c, d
Castelle, B., Brander, R., Tellier, E., Simonnet, B., Scott, T., McCarroll, J., Campagne, J.-M., Cavailhes, T., and Lechevrel, P.: Surf zone hazards and injuries on beaches in SW France, Nat. Hazards, 93, 1317–1335, https://doi.org/10.1007/s11069-018-3354-4, 2018. a, b, c, d, e, f
Castelle, B., Scott, T., Brander, R., McCarroll, J., Robinet, A., Tellier, E., de Korte, E., Simonnet, B., and Salmi, L.-R.: Environmental controls on surf zone injuries on high-energy beaches, Nat. Hazards Earth Syst. Sci., 19, 2183–2205, https://doi.org/10.5194/nhess-19-2183-2019, 2019. a, b, c, d, e
Castelle, B., Dehez, J., Savy, J.-P., Marieu, V., Lyser, S., Bujan, S., Carayon, D., and Brander, R.: Environmental controls on lifeguard-estimated surf-zone hazards, beach crowds, and resulting life risk at a high-energy sandy beach in southwest France, Nat. Hazards, 120, 1557–1576, https://doi.org/10.1007/s11069-023-06250-0, 2024. a, b, c, d, e, f, g, h, i, j, k
Castelle, B., Carayon, D., Dehez, J., Liquet, S., Marieu, V., Sénéchal, N., Lyser, S., Savy, J.-P., and Barneix, S.: Machine Learning Beach Attendance Forecast Modelling from Automatic Video-Derived Counting, J. Mar. Sci. Eng., 13, 1181, https://doi.org/10.3390/jmse13061181, 2025. a
Chang, S. K. Y., Tominaga, G. T., Wong, J. H., Weldon, E. J., and Kaan, K. T.: Risk factors for water sports-related cervical spine injuries, J. Traum., 60 5, 1041–1046, 2006. a, b
Coombes, E., Jones, A. P., Bateman, I., Tratalos, J., Gill, J., Showler, D., Watkinson, A., and Sutherland, W.: Spatial and temporal modeling of beach use: a case study of east Anglia, UK, Coast. Manage., 37, 94–115, https://doi.org/10.1080/08920750802527127, 2009. a, b
Corral, C., Berenguer, M., Sempere-Torres, D., Poletti, L., Silvestro, F., and Rebora, N.: Comparison of two early warning systems for regional flash flood hazard forecasting, J. Hydrol., 572, 603–619, https://doi.org/10.1016/j.jhydrol.2019.03.026, 2019. a
Dally, W. R.: Random breaking waves: a closed-form solution for planar beaches, Coast. Eng., 14, 233–263, https://doi.org/10.1016/0378-3839(90)90026-S, 1990. a, b
Dalrymple, R. A., MacMahan, J. H., Reniers, A. J., and Nelko, V.: Rip currents, Annu. Rev. Fluid Mech., 43, 551–581, https://doi.org/10.1146/annurev-fluid-122109-160733, 2011. a, b
de Korte, E., Castelle, B., and Tellier, E.: A Bayesian network approach to modelling rip-current drownings and shore-break wave injuries, Nat. Hazards Earth Syst. Sci., 21, 2075–2091, https://doi.org/10.5194/nhess-21-2075-2021, 2021. a, b, c, d
Dehez, J. and Lyser, S.: How ocean beach recreational quality fits with safety issues? An analysis of risky behaviours in France, Journal of Outdoor Recreation and Tourism, 45, 100711, https://doi.org/10.1016/j.jort.2023.100711, 2024. a
Dehez, J., Lyser, S., Castelle, B., Brander, R. W., Peden, A. E., and Savy, J. P.: Investigating beachgoer's perception of coastal bathing risks in southwest France, Nat. Hazards, 120, 13209–13230, https://doi.org/10.1007/s11069-024-06715-w, 2024. a, b
Domingo, M. C.: Deep learning and internet of things for beach monitoring: an experimental study of beach attendance prediction at Castelldefels Beach, Appl. Sci., 11, 10735, https://doi.org/10.3390/app112210735, 2021. a
Drozdzewski, D., Shaw, W., Dominey-Howes, D., Brander, R., Walton, T., Gero, A., Sherker, S., Goff, J., and Edwick, B.: Surveying rip current survivors: preliminary insights into the experiences of being caught in rip currents, Nat. Hazards Earth Syst. Sci., 12, 1201–1211, https://doi.org/10.5194/nhess-12-1201-2012, 2012. a
Drønen, N., Karunarathna, H., Fredsøe, J., Mutlu Sumer, B., and Deigaard, R.: An experimental study of rip channel flow, Coast. Eng., 45, 223–238, https://doi.org/10.1016/S0378-3839(02)00035-2, 2002. a
Dusek, G. and Seim, H.: Rip current intensity estimates from lifeguard observations, J. Coast. Res., 29, 505–518, https://doi.org/10.2112/JCOASTRES-D-12-00117.1, 2012. a
Dusek, G. and Seim, H.: A probabilistic rip current forecast model, J. Coast. Res., 29, 909–925, https://doi.org/10.2112/JCOASTRES-D-12-00118.1, 2013. a, b
Dwight, R. H., Brinks, M. V., SharavanaKumar, G., and Semenza, J. C.: Beach attendance and bathing rates for Southern California beaches, Ocean Coast. Manage., 50, 847–858, https://doi.org/10.1016/j.ocecoaman.2007.04.002, 2007. a, b, c
Egbert, G. D. and Erofeeva, S. Y.: Efficient inverse modeling of barotropic ocean tides, J. Atmos. Ocean. Tech., 19, 183–204, https://doi.org/10.1175/1520-0426(2002)019<0183:EIMOBO>2.0.CO;2, 2002. a
Gall, R. L., Franklin, J. L., Marks, F., Rappaport, E. N., and Toepfer, F.: The hurricane forecast improvement project, B. Am. Meteorol. Soc., 94, 329–343, 2013. a
Ghermandi, A. and Nunes, P. A.: A global map of coastal recreation values: results from a spatially explicit meta-analysis, Ecol. Econ., 86, 1–15, https://doi.org/10.1016/j.ecolecon.2012.11.006, 2013. a
Gomes da Silva, P., Coco, G., Garnier, R., and Klein, A. H.: On the prediction of runup, setup and swash on beaches, Earth-Sci. Rev., 204, 103148, https://doi.org/10.1016/j.earscirev.2020.103148, 2020. a
Griepp, D. W., de la Garza Ramos, R., Lee, J., Miller, A., Prasad, M., Gelfand, Y., Cardozo-Stolberg, S., and Murthy, S.: Beach breaking waves and related cervical spine injuries: a level one trauma center experience and systematic review, World Neurosurg., 160, e471–e480, https://doi.org/10.1016/j.wneu.2022.01.055, 2022. a
Guillén, J., García-Olivares, A., Ojeda, E., Osorio, A., Chic, O., and González, R.: Long-term quantification of beach users using video monitoring, J. Coast. Res., 24, 1612–1619, https://doi.org/10.2112/07-0886.1, 2008. a
Guza, R. T. and Thornton, E. B.: Wave set-up on a natural beach, J. Geophys. Res.-Oceans, 86, 4133–4137, https://doi.org/10.1029/JC086iC05p04133, 1981. a
Hall, C. M. and Page, S. J.: The Geography of Tourism and Recreation: Environment, Place and Space, American Geophysical Union (AGU), https://doi.org/10.4324/9780203796092, 2014. a
Haller, M. C., Dalrymple, R. A., and Svendsen, I. A.: Experimental study of nearshore dynamics on a barred beach with rip channels, J. Geophys. Res.-Oceans, 107, 14-1–14-21, https://doi.org/10.1029/2001JC000955, 2002. a, b
Houser, C., Arnott, R., Ulzhofer, S., and Barrett, G.: Nearshore circulation over transverse bar and rip morphology with oblique wave forcing, Earth Surf. Proc. Land., 38, 1269–1279, https://doi.org/10.1002/esp.3413, 2013. a, b
Houser, C., Wernette, P., Trimble, S., and Locknick, S.: 11 – Rip currents, in: Sandy Beach Morphodynamics, edited by: Jackson, D. W. and Short, A. D., Elsevier, https://doi.org/10.1016/B978-0-08-102927-5.00011-4, 255–276, 2020. a, b
Ibarra, E.: The use of webcam images to determine tourist-climate aptitude: favourable weather types for sun and beach tourism on the Alicante coast (Spain), Int. J. Biometeorol., 55, 373–385, https://doi.org/10.1007/s00484-010-0347-8, 2011. a, b
Kane, B., Zajchowski, C. A., Allen, T. R., McLeod, G., and Allen, N. H.: Is it safer at the beach? Spatial and temporal analyses of beachgoer behaviors during the COVID-19 pandemic, Ocean Coast. Manage., 205, 105533, https://doi.org/10.1016/j.ocecoaman.2021.105533, 2021. a
Larson, M., Hoan, L. X., and Hanson, H.: Direct formula to compute wave height and angle at incipient breaking, J. Waterw. Port C.-ASCE, 136, 119–122, 2010. a, b, c
Li, Z.: Rip current hazards in South China headland beaches, Ocean Coast. Manage., 121, 23–32, https://doi.org/10.1016/j.ocecoaman.2015.12.005, 2016. a
MacMahan, J., Brown, J., Brown, J., Thornton, E., Reniers, A., Stanton, T., Henriquez, M., Gallagher, E., Morrison, J., Austin, M. J., Scott, T. M., and Senechal, N.: Mean Lagrangian flow behavior on an open coast rip-channeled beach: a new perspective, Mar. Geol., 268, 1–15, https://doi.org/10.1016/j.margeo.2009.09.011, 2010. a, b
MacMahan, J. H., Thornton, E. B., Stanton, T. P., and Reniers, A. J. H. M.: RIPEX-observations of a rip current system, Mar. Geol., 218, 113–134, https://doi.org/10.1016/j.margeo.2005.03.019, 2005. a
MacMahan, J. H., Thornton, E. B., and Reniers, A. J. H. M.: Rip current review, Coast. Eng., 53, 191–208, https://doi.org/10.1016/j.coastaleng.2005.10.009, 2006. a, b
MacMahan, J. H., Thornton, E. B., Reniers, A. J., Stanton, T. P., and Symonds, G.: Low-energy rip currents associated with small bathymetric variations, Mar. Geol., 255, 156–164, https://doi.org/10.1016/j.margeo.2008.08.006, 2008. a
Mahesh, B.: Machine learning algorithms-a review, International Journal of Science and Research, 9, 381–386, 2020. a
McCarroll, R. J., Brander, R. W., MacMahan, J. H., Turner, I. L., Reniers, A. J. H. M., Brown, J. A., Bradstreet, A., and Sherker, S.: Evaluation of swimmer-based rip current escape strategies, Nat. Hazards, 71, 1821–1846, https://doi.org/10.1007/s11069-013-0979-1, 2014a. a
McCarroll, R. J., Brander, R. W., Turner, I. L., Power, H. E., and Mortlock, T. R.: Lagrangian observations of circulation on an embayed beach with headland rip currents, Mar. Geol., 355, 173–188, https://doi.org/10.1016/j.margeo.2014.05.020, 2014b. a
McCarroll, R. J., Castelle, B., Brander, R. W., and Scott, T.: Modelling rip current flow and bather escape strategies across a transverse bar and rip channel morphology, Geomorphology, 246, 502–518, https://doi.org/10.1016/j.geomorph.2015.06.041, 2015. a
Merz, B., Kuhlicke, C., Kunz, M., Pittore, M., Babeyko, A., Bresch, D. N., Domeisen, D. I. V., Feser, F., Koszalka, I., Kreibich, H., Pantillon, F., Parolai, S., Pinto, J. G., Punge, H. J., Rivalta, E., Schröter, K., Strehlow, K., Weisse, R., and Wurpts, A.: Impact forecasting to support emergency management of natural hazards, Rev. Geophys., 58, e2020RG000704, https://doi.org/10.1029/2020RG000704, 2020. a
Moreno, Á., Amelung, B., and Santamarta, L.: Linking beach recreation to weather conditions: a case study in Zandvoort, Netherlands, Tourism in Marine Environments, 5, 111–119, 2008. a
Moulton, M., Dusek, G., Elgar, S., and Raubenheimer, B.: Comparison of rip current hazard likelihood forecasts with observed rip current speeds, Weather Forecast., 32, 1659–1666, 2017a. a, b
Moulton, M., Elgar, S., Raubenheimer, B., Warner, J. C., and Kumar, N.: Rip currents and alongshore flows in single channels dredged in the surf zone, J. Geophys. Res.-Oceans, 122, 3799–3816, https://doi.org/10.1002/2016JC012222, 2017b. a, b, c, d, e, f, g
National Research Council: A Safer Future: Reducing the Impacts of Natural Disasters, The National Academies Press, Washington, DC, https://doi.org/10.17226/1840, 1991. a
Power, H. E., Hughes, M. G., Aagaard, T., and Baldock, T. E.: Nearshore wave height variation in unsaturated surf, J. Geophys. Res.-Oceans, 115, C08030, https://doi.org/10.1029/2009JC005758, 2010. a
Puleo, J., Hutschenreuter, K., Cowan, P., Carey, W., Arford-Granholm, M., and McKenna, K.: Delaware surf zone injuries and associated environmental conditions, Nat. Hazards, 81, 845–867, https://doi.org/10.1007/s11069-015-2108-9, 2016. a, b
Raubenheimer, B., Guza, R. T., and Elgar, S.: Wave transformation across the inner surf zone, J. Geophys. Res.-Oceans, 101, 25589–25597, https://doi.org/10.1029/96JC02433, 1996. a
Raubenheimer, B., Guza, R. T., and Elgar, S.: Field observations of wave-driven setdown and setup, J. Geophys. Res.-Oceans, 106, 4629–4638, https://doi.org/10.1029/2000JC000572, 2001. a
Robbles, L.: Cervical spine injuries in ocean bathers: wave-related accidents, Neurosurgery, 58, 920–923, https://doi.org/10.1227/01.NEU.0000209941.18102.35, 2006. a
Roland, A. and Ardhuin, F.: On the developments of spectral wave models: numerics and parameterizations for the coastal ocean, Ocean Dynam., 64, 833–846, 2014. a
Rowe, G. and Wright, G.: Differences in expert and lay judgments of risk: myth or reality?, Risk Anal., 21, 341–356, https://doi.org/10.1111/0272-4332.212116, 2001. a
Sandman, P. M., Weinstein, N. D., and Klotz, M. L.: Public response to the risk from geological radon, J. Commun., 37, 93–108, https://doi.org/10.1111/j.1460-2466.1987.tb00997.x, 1987. a
Scott, T., Masselink, G., Austin, M. J., and Russell, P.: Controls on macrotidal rip current circulation and hazard, Geomorphology, 214, 198–215, https://doi.org/10.1016/j.geomorph.2014.02.005, 2014. a, b, c
Scott, T., Masselink, G., Stokes, C., Poate, T., Wooler, A., and Instance, S.: A 15-year partnership between UK coastal scientists and the international beach lifeguard community, Cont. Shelf Res., 241, 104732, https://doi.org/10.1016/j.csr.2022.104732, 2022. a
Sénéchal, N., Abadie, S., Gallagher, E., MacMahan, J. H., Masselink, G., Michallet, H., Reniers, A. J., Ruessink, G., Russell, P. E., Sous, D., Turner, I. M., Ardhuin, F., Bonneton, P., Bujan, S., Capo, S., Certain, R., Pedreros, R., and Garlan, T.: The ECORS-Truc Vert'08 nearshore field experiment: presentation of a three-dimensional morphologic system in a macro-tidal environment during consecutive extreme storm conditions, Ocean Dynam., 61, 2073–2098, 2011. a
Slovic, P.: Trust, emotion, sex, politics, and science: surveying the risk-assessment Battlefield, Risk Anal., 19, 689–701, https://doi.org/10.1111/j.1539-6924.1999.tb00439.x, 1999. a
Stockdon, H. F., Long, J. W., Palmsten, M. L., van der Westhuysen, A. J., Doran, K. S., and Snell, R. J.: Operational forecasts of wave-driven water levels and coastal hazards for US Gulf and Atlantic coasts, Commun. Earth Environ., 4, 169, https://doi.org/10.1038/s43247-023-00817-2, 2023. a
Stokes, C., Masselink, G., Revie, M., Scott, T., Purves, D., and Walters, T.: Application of multiple linear regression and Bayesian belief network approaches to model life risk to beach users in the UK, Ocean Coast. Manage., 139, 12–23, https://doi.org/10.1016/j.ocecoaman.2017.01.025, 2017. a, b
Stokes, C., Poate, T., Masselink, G., Scott, T., and Instance, S.: New insights into combined surfzone, embayment, and estuarine bathing hazards, Nat. Hazards Earth Syst. Sci., 24, 4049–4074, https://doi.org/10.5194/nhess-24-4049-2024, 2024. a
Tellier, E., Simonnet, B., Gil-Jardiné, C., Lerouge-Bailhache, M., Castelle, B., and Salmi, R.: Predicting drowning from sea and weather forecasts: Development and validation of a model on surf beaches of southwestern France, Inj. Prev., 28, 16–22, https://doi.org/10.1136/injuryprev-2020-044092, 2022. a, b
Thom, O., Roberts, K., Leggat, P. A., Devine, S., Peden, A. E., and Franklin, R. C.: Cervical spine injuries occurring at the beach: epidemiology, mechanism of injury and risk factors, BMC Public Health, 22, 1404, https://doi.org/10.1186/s12889-022-13810-9, 2022. a
Tolman, H. L., Balasubramaniyan, B., Burroughs, L. D., Chalikov, D., Chao, Y. Y., Chen, H. S., and Gerald, V. M.: Development and implementation of wind-generated ocean surface wave modelsat NCEP, Weather Forecast., 17, 311–333, 2002. a
U.S. Department of Commerce, National Oceanic and Atmospheric Administration, National Weather Service, Office of Climate, Water, and Weather Services: Weather related fatality and injury statistics, https://www.weather.gov/hazstat/ (1 September 2024), 2025. a
WamdiGroup: The WAM model – a third generation ocean wave prediction model, J. Phys. Oceanogr., 18, 1775–1810, https://doi.org/10.1175/1520-0485(1988)018<1775:TWMTGO>2.0.CO;2, 1988. a
West, N.: Beach Use and Behaviors, Springer International Publishing, https://doi.org/10.1007/978-3-319-93806-6_43, 307–311, 2019. a
Winter, G., van Dongeren, A., de Schipper, M., and van Thiel de Vries, J.: Rip currents under obliquely incident wind waves and tidal longshore currents, Coast. Eng., 89, 106–119, https://doi.org/10.1016/j.coastaleng.2014.04.001, 2014. a
Wood, L. E., Vimercati, G., Ferrini, S., and Shackleton, R. T.: Perceptions of ecosystem services and disservices associated with open water swimming, Journal of Outdoor Recreation and Tourism, 37, 100491, https://doi.org/10.1016/j.jort.2022.100491, 2022. a
Wright, L. D. and Short, A. D.: Morphodynamic variability of surf zones and beaches: a synthesis, Mar. Geol., 56, 93–118, 1984. a
Zscheischler, J., Martius, O., Westra, S., Bevacqua, E., Raymond, C., Horton, R. M., van den Hurk, B., Aghakouchak, A., Jézéquel, A., Mahecha, M. D., Maraun, D., Ramos, A. M., Ridder, N. N., Thiery, W., and Vignotto, E.: A typology of compound weather and climate events, Nature Reviews Earth and Environment, 1, 333–347, 2020. a