the Creative Commons Attribution 4.0 License.
the Creative Commons Attribution 4.0 License.
 | 15 Jul 2025
Tracing online flood conversations across borders: a watershed-level analysis of geo-social media topics during the 2021 European flood
Sébastien Dujardin
Dorian Arifi
Sebastian Schmidt
Catherine Linard
Bernd Resch
In the face of rapid population growth, urbanisation, and accelerating climate change, rapid and accurate disaster detection has become critical to minimise human and material losses. In this context, geo-social media (referring to georeferenced social media posts) data have proven to be a sensible data source for tracing disaster-related conversations, especially during flood events. However, current research often neglects the relationship between information from social media posts and their corresponding geographical context. In this paper, we examine the emergence of disaster-related social media topics in relation to hydrological and socio-environmental features at the watershed level during the 2021 western European flood, while focusing on transboundary river basins. Building on an advanced machine-learning-based topic modelling approach, we show the emergence of flood-related geo-social media topics in both river-basin-specific and cross-basin contexts. Our analysis reveals distinct spatio-temporal dynamics in the public discourse, showing that timely topics describing heavy rainfall or flood damage were closely tied to immediate environmental conditions in upstream areas, while post-disaster topics about helping victims or volunteering were more prevalent in less affected areas located in both upstream and downstream areas. These findings highlight how social media responses to disasters differ spatially across watersheds and underscore the importance of integrating geo-social media analysis into disaster coordination efforts, opening new opportunities for transboundary collaborations and the coordination of emergency response along border-crossing rivers.
- Article
(9096 KB) - Full-text XML
-
Supplement
(874 KB) - BibTeX
- EndNote


Rapid climate change is altering precipitation patterns, leading to more intense and frequent climate-related disasters. The increasing number and severity of flood events can be attributed to both climate- and non-climate-related drivers (Clarke et al., 2022), including urbanisation in areas exposed to flood hazards (Ionita and Nagavciuc, 2021; UNISDR, 2015). In this context, effective flood risk management requires understanding how communities respond to flood events, especially in transboundary river basins, i.e. basins that cross political and administrative jurisdiction borders between countries, provinces, or cities (Rahayu et al., 2024). However, upstream and downstream areas are often managed by different governance structures and authorities, each with its own policies, priorities, and response frameworks, which makes it difficult to align coordination efforts and resources across borders (Clegg et al., 2023). This paper contributes to addressing this issue by examining the role of social media data as a tool for capturing and analysing the responses of communities within transboundary river basins during flood events.
Recent advances in social media analytics offer new tools for monitoring and analysing public responses to disasters (Kryvasheyeu et al., 2016; Resch et al., 2018; Wang and Ye, 2018; Florath et al., 2024; Fohringer et al., 2015). Platforms such as Twitter (currently X) or Weibo provide user-generated content that can be analysed to reveal public perceptions, behaviours, and sentiments during and after disasters (Beigi et al., 2016; Karmegam and Mappillairaju, 2020). Numerous studies have demonstrated the value of social media data for disaster management (Acikara et al., 2023; Yu et al., 2018), improving situational awareness (Yin et al., 2012), facilitating emergency response (Huang and Xiao, 2015), improving damage estimates (Zou et al., 2018), and even predicting the impacts on flooded areas (Bruneau et al., 2021). Specifically, the analysis of georeferenced social media posts (hereafter: geo-social media posts) enables the mapping of online information onto geographic spaces, making it particularly useful for early detection and damage classification during flood events (Tan and Schultz, 2021).
One of the most devastating recent flood events in transboundary river basins occurred in western Europe during the summer of 2021, triggered by cyclone Bernd, which brought long-lasting precipitation over the Eifel Mountains due to orographic effects and dynamic uplift (Junghänel et al., 2021). This event caused severe flooding across Germany, Belgium, Luxembourg, France, and the Netherlands, resulting in over 200 fatalities and significant material damage (Kahle et al., 2022; Fekete and Sandholz, 2021; Schüttrumpf et al., 2022). Despite severe-weather warnings, communication deficiencies hindered effective disaster response (Fekete and Sandholz, 2021). In this regard, effective, swift communication remains a challenge for situational awareness across borders. Geo-social media data could help address these issues, but few studies have examined how digital traces reflect the interconnectedness of upstream and downstream communities in transboundary river basins during flood events.
While several studies have applied social media and natural language processing (NLP) methods to analyse the 2021 European floods (Blomeier et al., 2024; Hanny and Resch, 2024; Moghadas et al., 2023), they primarily focused on specific regions, such as the Ahr Valley, and did not provide a comprehensive semantic analysis of how online conversations emerged across borders and along the main river basins that were impacted. Moreover, most studies examining floods through social media data have focused on urban or regional scales (e.g. Wang et al., 2018; Tan and Shultz, 2021) without considering the specificities of the river basins crossing these areas. A watershed approach is particularly relevant for transboundary flood risk management because it accounts for the interconnectedness of upstream and downstream communities, which often span national boundaries (UNECE, 2009). Flooding in one part of a river basin can have complex spatial and temporal cause–effect relationships depending on both hydrographic (Gunnell et al., 2019) and socio-environmental characteristics (Lorenz et al., 2001), which require a comprehensive view of upstream and downstream response efforts for effective disaster management.
Despite the clear importance of this approach, there is limited evidence in the context of transboundary river basins, where international collaboration is often necessary but challenging due to differences in language, governance, and disaster management practices (Polese et al., 2024; Mehta and Warner, 2022). Although transboundary water management in European river basins, such as the Rhine, Danube, and Iberian rivers, has a long-established history (UNECE, 2009), effective cooperation among riparian countries still remains complex (Rahayu et al., 2024; Aall et al., 2023). Achieving successful collaboration therefore requires a deeper understanding of the natural and social processes driving these shared risks.
In this paper, we seek to identify geo-social media users' responses to heavy rainfall and subsequent flooding events in a transboundary river basin context. Specifically, our analysis aims to identify the emergence of different online topics throughout the flood event, with a particular focus on the identification of topics that dominate online conversations across the upstream and downstream areas of river basins. To our knowledge, such a watershed-based analysis of up- and downstream differences in flood-related geo-social media topic emergence has not been considered in previous studies. Therefore, we aim to answer the following two research questions:
- 1.
Which geo-social media topics can be observed before, during, and after flood disasters in a transboundary river basin?
- 2.
Which differences can be observed in the emergence of flood-related geo-social media topics across upstream and downstream areas within a river basin?
The following sections describe the research area, data, and methodological steps taken for our analysis in detail.
2.1 Research area
Our study area includes regions in France, Belgium, the Netherlands, Germany, and Luxembourg (see Fig. 1). Within these regions are the Ardennes and the Eifel Mountains, which comprise a low mountain range incised by several fluvial valleys (Dietze et al., 2022) that are part of the catchment areas of the Lower Meuse and Lower Rhine rivers. The most important cities crossed by the Meuse River are Namur, Liège, Maastricht, and Hertogenbosch. In Germany, the Rhine River flows through the main cities of Bonn, Cologne, and Düsseldorf. In the northeastern part of this study area is the Escaut River, which reaches the sea near the city of Antwerp.
The time frame of this study is the 3 weeks from 11 to 31 July 2021, covering the precipitation peak on 14 July with 1 week prior and 2 weeks after. This time frame was selected in line with the disaster phases commonly recognised in the literature (e.g. Kruspe et al., 2021; Zou et al., 2018), Also, it allowed us to capture sufficient time both before and after the flood event to capture notable changes in precipitation patterns and online discussions.
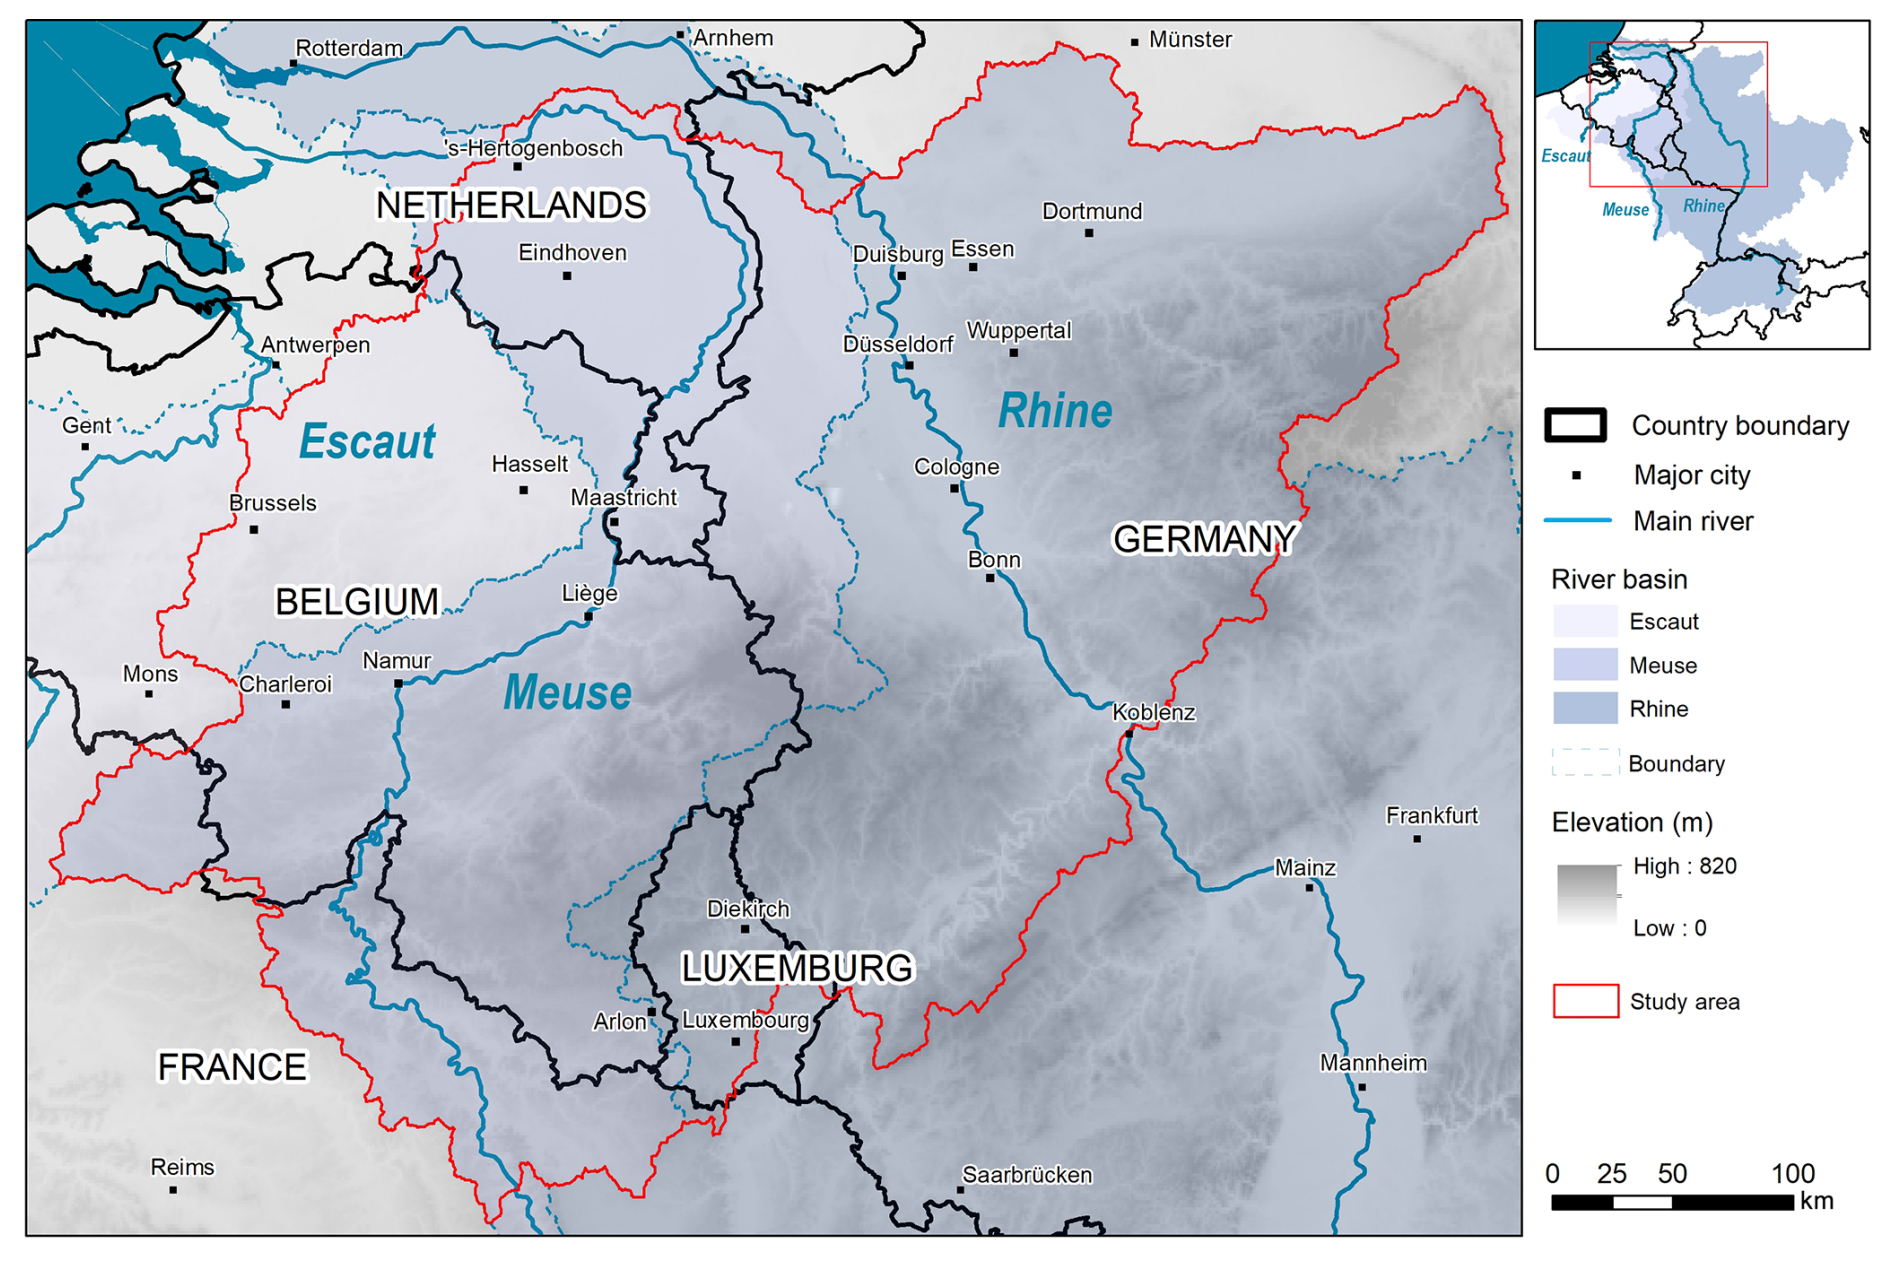
Figure 1Study area map showing the main river streams (Escaut, Meuse, Rhine) and their corresponding transboundary river basins (shaded in blue). The main river sections examined in this study (in red) span five western European countries: France, Belgium, the Netherlands, Germany, and Luxembourg.
2.2 Data
2.2.1 Precipitation and flood data
The first dataset selected to delineate the spatial extent of our study area is precipitation data generated using MAR (Modèle Atmosphérique Régional) (Wyard et al., 2021). MAR consists of simulated precipitation forced by ERA5 reanalyses, i.e. the fifth-generation atmospheric reanalysis of the global climate carried out by the European Centre for Medium-Range Weather Forecasts (ECMWF). Data were provided at a 5 km spatial resolution and a 60 min temporal resolution for the period of 14 June to 30 September 2021. It contained total precipitation in millimetres and latitude–longitude variables in NetCDF format. This type of regional model allows for the downscaling of global models to finer temporal and spatial scales, providing reliable meteorological data to map summer rainfall at the regional level (Doutreloup et al., 2022).
To further identify the most impacted watersheds, we used two complementary layers of information. The first layer contained the sections of the river network monitored by the European Flood Awareness System (EFAS), where 6 h averaged simulated river discharge exceeded the 20-year flood return period thresholds from 11 to 31 July 2021. This information was produced by the Copernicus Emergency Mapping Service (EMS) model-derived river discharge and was made readily available on the Copernicus EMS website (CEMS, 2021b).
A second layer of information was used to identify the extent of the flooded zones across our study area. It was retrieved from the mapping portal of the Copernicus EMS (Wania et al., 2021). Activated upon request from the German, Belgian, and Dutch authorities, the service provided mapping outputs (the EMSR517, EMSR518, and EMSR520 datasets) that contain remote-sensing-based information regarding the flooding extent over these countries (CEMS, 2021a). We selected the vector packages of the flood delineation products across the period from 14 to 16 July 2021 and merged the different layers to delineate the extent of flooded areas along the Meuse and the Rhine rivers.
2.2.2 Hydrographic and socio-environmental data
The main data source used to describe the hydrographic component of river basins was the HydroBASIN database from HydroSHEDS (Hydrological data and maps based on SHuttle Elevation Derivatives at multiple Scales), a global dataset that provides high-resolution digital data on river networks and watersheds (Lehner et al., 2008). Building upon NASA's Shuttle Radar Topography Mission (SRTM) elevation data, HydroBASIN offers a series of vectorised polygon layers that depict sub-basin boundaries at a global scale (Lehner and Grill, 2013). The data are organised into 12 hierarchically nested sub-basin breakdowns globally, allowing for the analysis of river basins at various scales, from small streams to large river systems. This standardised dataset allowed us to run a consistent analysis across the five countries studied.
The HydroBASIN database also contains relevant hydrographic attributes that we used to describe the size of the catchment area (in km2) and the distance to the sink (in km). The former is a metric that describes the potential quantity of water that can be drained into the watershed (Lehner and Grill, 2013). The latter provides an indication of the distance from the watershed outlet to the outlet of the main river basin (i.e. the North Sea) along the river network.
Three complementary datasets were used to describe additional watershed characteristics. First, we used a digital elevation model (DEM) from the Shuttle Radar Topography Mission (SRTM) (Rabus et al., 2003) with a resolution of 1 arcsec (∼ 30 m) to describe the average altitude of each watershed polygon. Second, we used a 1 km2 population grid from EUROSTAT derived from the 2021 population and housing census (EUROSTAT, 2021). Third, we used the “degree of urbanisation” layer from EUROSTAT, which categorises local administrative units as cities, towns, and suburbs or rural areas based on a combination of geographical continuity and population density (EUROSTAT, 2019). The dataset selected dated from 2020 and had a scale resolution of 1 m (EUROSTAT, 2020).
2.2.3 Twitter data
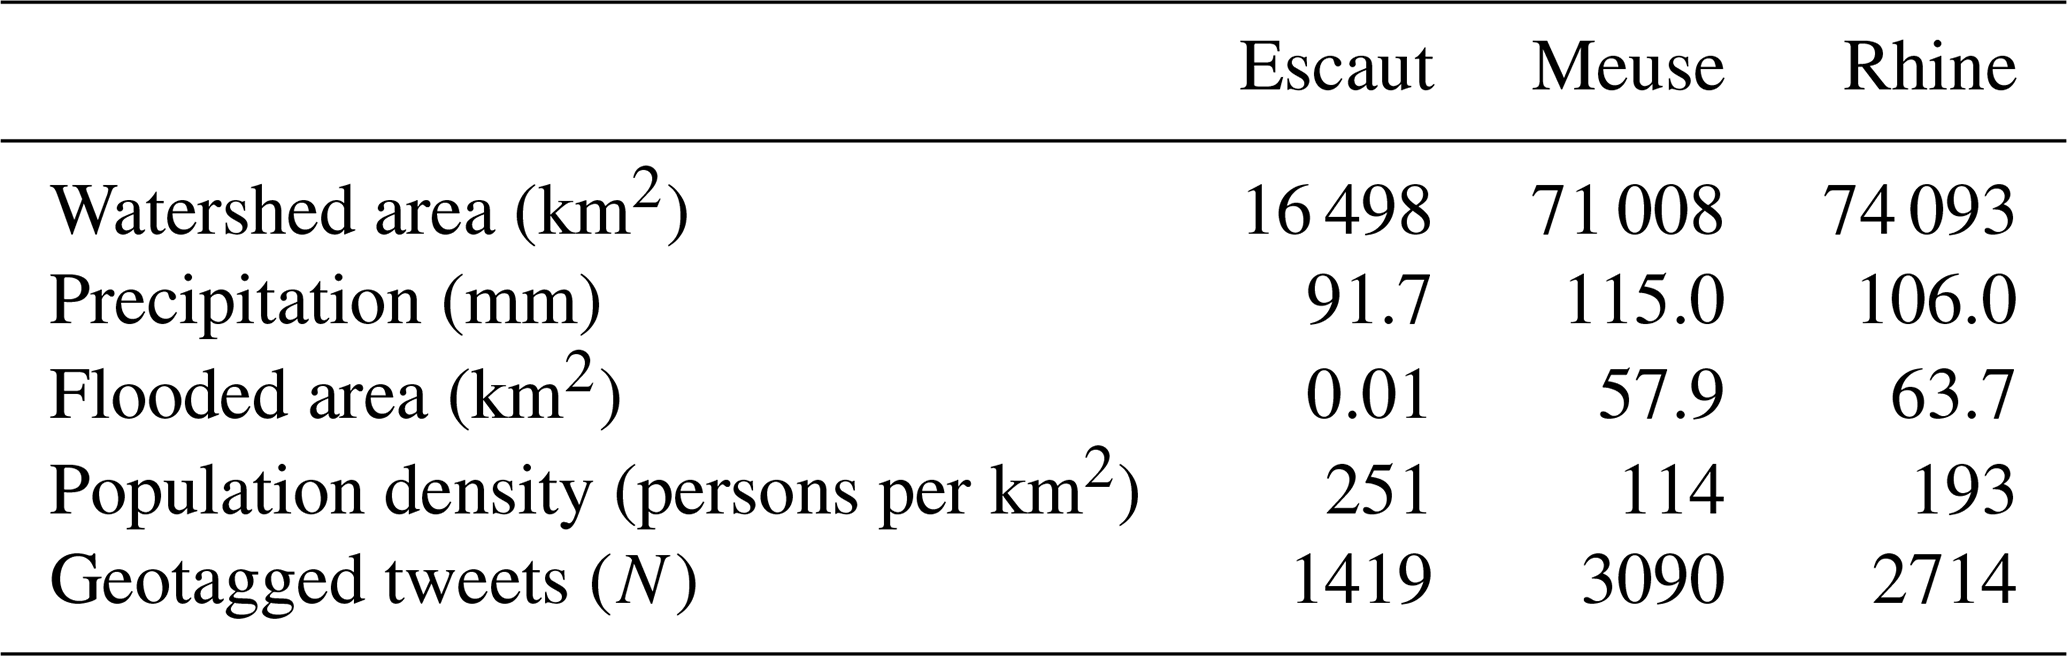
Throughout this study, we refer to user-generated geo-social media posts from the platform formerly known as Twitter (now X) as “tweets”, and for consistency with our dataset, we continue to refer to the platform as Twitter. This choice of terminology better reflects the historical context of the data collection process, including specific content moderation practices and data accessibility, which set the original dataset apart from the data available on X today. The georeferenced posts from Twitter were gathered following previous methods (Havas and Resch, 2021; Schmidt et al., 2023) through the official application programming interface (API) of the social media network. For each tweet, we extracted the text, the timestamp at which it was posted, and its geo-location. This geo-location can be manually set by the user and is provided in the form of coordinates or a bounding box referring to a “place”. Extracting the dataset for our time frame and area of interest yielded a total of 14 423 tweets to which we applied a disaster-related classification, which finally left us with 7223 tweets for the subsequent analysis steps. A summary of the study area characteristics according to the main basin can be found in Table 1.
Table 1Summary of study area characteristics in each main basin.
2.3 Methodology
Our methodology consisted of several steps, including the semantic analysis of Twitter data and the identification of spatio-temporal patterns. Figure 2 provides an overview of our workflow.
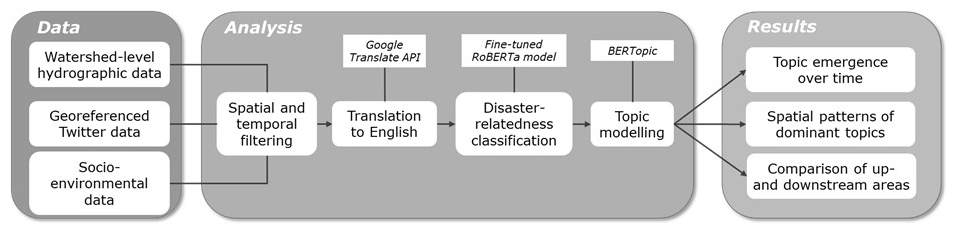
Figure 2Workflow implemented in this study to extract disaster-related tweets, identify flood-related topics at the watershed level, and highlight patterns of dominant topic occurrence across up- and downstream watersheds.
2.3.1 Delineation of main river basins and daily precipitation per watershed
The most important river catchment areas affected by flooding were delineated using a precipitation dataset in a two-stage process. First, we calculated the total precipitation for the entire study area over the period from 7 to 27 July 2021 using the MAR dataset, which provides a 5 km spatial resolution and an hourly temporal resolution. This allowed us to map overall precipitation patterns across the region using a quantile classification. Next, we manually selected the sections of the main river basins that contained areas with more than 100 mm of rain. The delineation of sections from the main river basins was performed using the HydroBASIN delineation at level 7, which represents an intermediate watershed size. This level of detail was ideal to capture sub-regional hydrographic basins, effectively reflecting precipitation patterns at both regional and country scales. To identify smaller river basins and detect more localised variations in precipitation, we utilised the HydroBASIN delineation level 12, which served as our smallest spatial unit of analysis, referred to hereafter as the “watershed”. This level was used to aggregate Twitter and precipitation data to provide detailed spatial insights. Daily precipitation values were then aggregated at the watershed level using a zonal statistics approach. Daily precipitation data were aggregated at the watershed level using a zonal statistics method. We employed a coverage fraction technique (weighted sum) to summarise the raster precipitation values within each watershed polygon. We chose the weighted sum method that multiplies the precipitation amount of each grid cell by the fraction of the cell contained within the watershed, thereby refining sub-estimates of total precipitation per watershed. All data processing except for the topic modelling was conducted using the dplyr, stars, sf, and exactextractr packages in R (v 4.3.1) and R Studio (v 2024.04.2).
2.3.2 Semantic classification of social media data
To identify flood-related tweets and topics, we first translated all tweets from different languages to English using the Google Translate API. This was done to prevent later topic formation from being mainly influenced by different language characteristics and not the actual contents of the tweets. Furthermore, we relied on the Google Translate API due to its extensive language support, including regional dialects, which reflect geo-social media discussions across diverse communities. This also offers a higher likelihood that languages beyond official national tongues, such as Turkish or Arabic variants, are included, minimising the risk of excluding or misrepresenting sub-community discussions. Second, we employed a fine-tuned Twitter-XLM-RoBERTa base model developed by Hanny et al. (2024) to identify tweets that were disaster-related, i.e. with content that refers to the occurrence or consequences of both natural and human-induced hazards. It classifies tweets based on their text into the categories “unrelated” and “related” with regard to any type of disaster event.
In a third step, we identified different topics in the disaster-related tweets, utilising the state-of-the-art machine learning model BERTopic (Grootendorst, 2022), which consists of five main steps to identify topics in the textual input data. First, it converted the text of individual tweets into numerical representations by creating embeddings using a BERT-based algorithm (in our case, multi-qa-distilbert-cos-v1), which maps words into a vector space designed to preserve semantic relationships. Second, the algorithm reduced these embeddings from a 768-dimensional space into a 5-dimensional space. For this, we used the UMAP (Uniform Manifold Approximation and Projection) dimensionality reduction algorithm with five components. In this lower-dimensional space, a clustering algorithm identified texts with similar embeddings. We achieved the best results in terms of topic coherence by utilising a k-means clustering algorithm, where the number of topics identified corresponds to the predetermined number of clusters. In the fourth step, we used CountVectorizer from Scikit-learn to transform a list of stop words into word vectors, explicitly excluding them to allow for more meaningful topic formation. In the last step, the most relevant words per cluster were identified with the help of a class-based term frequency–inverse document frequency (c-TF-IDF) method. More detailed descriptions for each step can be found in Grootendorst (2022).
Furthermore, we limited the number of topics to 30, of which we found 19 topics to be flood related. We further aggregated these 19 topics into 11 main topics that shared similar overarching themes. To cope with randomness in the topic formation due to random starting points in the dimensionality and clustering algorithms, we also performed a topic stability analysis across several topic modelling iterations. For this, we reran the BERTopic algorithm 20 times and compared the topics that were replicated across most model iterations, i.e. the most stable ones. To compare how frequently a specific topic appeared across iterations, we sought to identify a threshold for the maximum allowable difference between topics. The reasoning behind this is that the keywords defining topic A in iteration 1 can be split across several different topics in other iterations. Hence, topic A in iteration 1 could, in theory, match several to almost all topics in iteration 2. As a result, some matches will be very weak or even misaligned, especially if we also allow for the characters of words to change slightly. Thus, to mitigate the likelihood of mismatches, we defined an upper-bound threshold for the number of changes allowed between topics in different iterations before they are classified as a match. We found that a 17 % difference provided such an upper bound, accounting for slight changes in defining words while ensuring that one topic was only matched to one other topic per iteration. To assess differences between the keywords defining each topic, we employed the string edit distance. Finally, we chose the topic model iteration that exhibited the most stable topics for our subsequent analysis (see Fig. S1 in the Supplement for more details).
2.3.3 Identification of daily dominant topics per watershed
Once we classified the tweets into 11 main flood-related topic categories, we further analysed the topic that was most frequently discussed daily within each watershed. First, we associated the tweets with their corresponding watersheds based on the x–y coordinates of social media posts using a spatial join method. Next, we identified the most frequently discussed topics using a heuristic approach that was able to track the evolution of online conversations and trace their dominant character over time. The first rule consisted of counting the number of tweets belonging to a given topic per day and watershed and selecting the topic category with the maximum tweet occurrence. This was calculated following Eq. (1):
where topic_max represents the daily dominant topic per watershed, and topic_count refers to the number of times a particular topic appeared in the conversation for a specific watershed (HYBAS) and date (date). The second rule consisted of discarding topic categories with the same maximum occurrence. If two different topics or more had the same maximum value, we removed them from the analysis because we considered those topics to be equally discussed and thus not representative of the most important conversation taking place in the watershed. While an exact solution (e.g. weighted averages of topics) would have been more difficult to interpret, this approach allowed the selection of topics that stood out from online conversations. It also helped to reduce the bias of over-representation affecting areas with higher social media activity because a dominant topic was systematically extracted regardless of whether the number of tweets generated was low or high.
2.3.4 Comparison of topic locations with flood and watershed characteristics
We assessed the relationship between dominant flood-related topics and their locations across river basins by computing several key variables describing the flood and watershed characteristics. First, we identified two variables to analyse whether topics emerged in areas affected by the flood. We summarised precipitation values according to the watershed by computing the average amount of total daily precipitation from the MAR dataset over the period from 7 to 27 July 2021. The percentage of flooded areas per watershed was assessed by dividing the extent of flooded areas delineated using the Copernicus Emergency Mapping Service by the total area of the watershed. Second, we employed five main watershed characteristics to identify co-occurrences of flood-related online conversation and hydrographic and socio-environmental characteristics. These characteristics included the size of the catchment area, the sink proximity, the elevation, the population density, and the degree of urbanisation at the watershed level (see maps in Fig. S2). The catchment area and sink proximity values were built on the HydroBASIN database. A low catchment area indicates a low drainage surface and thus is associated with small river streams, while a high catchment area means greater drainage surface and larger river streams (Chorley, 2019). The sink proximity was computed using the inverse value of distance to sink provided in the HydroBASIN database. A low value means a long distance between the source and the sea outlet, while a high score indicates proximity to the sea. The average elevation value per watershed was computed based on the 30 m resolution SRTM elevation data. We also used the inverted value and labelled this variable “low elevation” to associate high scores with lowlands and low scores with uplands. Using the inverted value for these two variables facilitated the readability and interpretability of the plots. The population density was computed by averaging the 1 km EUROSTAT population grid cell value per watershed polygon. The degree of urbanisation was computed by selecting the local administrative units (LAUs) of the category “cities”. While these represented large cities mainly located in the riparian zones of main rivers, we measured the coverage fraction of this layer to provide a percentage of the city class per watershed. The scores describing watershed characteristics were graded from low to high, in line with an overall intuitive upstream–downstream logic. This association was supported by a close inspection of variable maps showing urban and densely populated watersheds concentrated close to the sea, where the elevation is lower and the size of catchment areas is larger.
Ridgeline plot is a data visualisation technique that we used next to display the distribution of the different topics across the continuous variable attributes. Ridgeline plots rely upon a kernel density function that estimates the probability density of a variable by smoothing out the distribution using a kernel, which is a continuous and symmetric function (Wilke, 2019). To visualise the spatial variability in dominant topics, we classified watersheds based on their attribute values by creating 100 quantiles and counted the number of times a given topic dominated the conversations over the period from 7 to 27 July. Each distribution plot thus represents the occurrence of a given dominant topic (y axis) based on the variable attribute calculated at the watershed level (x axis). Variable attributes were normalised to a 0–100 scale for comparability. Ridgeline plots were created in R (ggridges package; Wilke, 2024), and separate plots were created for each topic and variable to compare central tendencies and variability across upstream and downstream areas. For variables describing watershed characteristics, a single peak in the middle (unimodal pattern) suggests that the topic occurrence is most frequent in areas corresponding to midstream river sections. Two peaks on the left and right (bimodal distribution) indicate that the topic is more often dominant at both extremes of the basin, with a low occurrence in mid-basin areas. A peak on the right or left suggests that the topic is most relevant in areas associated with downstream or upstream areas. Finally, a flat or even distribution indicates that the topic is equally relevant across the entire basin and consistent across the different parts of the river. The median value was indicated for each distribution to show the extent to which a topic falls into either downstream or upstream locations. A delineation was also drawn for each watershed characteristic at a score of 50 to mark the separation between upstream and downstream locations.
3.1 Precipitation patterns across the main river basins
The total amount of precipitation across our study area during the period from 7 to 27 July ranged from 30 to 199 mm (Fig. 3). The Meuse River basin recorded abundant and widespread rainfall, particularly in watersheds connected to the Lesse, Ourthe, Amblève, Vesdre, and Rur rivers, with amounts of precipitation greater than 130 mm. In the Rhine basin, while the extent of the high cumulative precipitation was less widespread, significant rainfall was observed in watersheds along the Moselle, Ahr, Erft, and Ruhr rivers. Lastly, in the Escaut river basin, higher precipitation levels were observed in the eastern region, with a lower maximum of 129 mm recorded over the Dyle River. The portions of the main river basins and the watersheds that covered the best areas with high precipitation levels consisted of a total of 479 watersheds covering an area of 6000, 28 000, and 29 000 km2 for the Escaut, Meuse, and Rhine rivers, respectively. Watersheds presented an average size of 131.8, 135.0, and 135.9 km2, respectively, providing a comparable unit of analysis across the three main river basins.
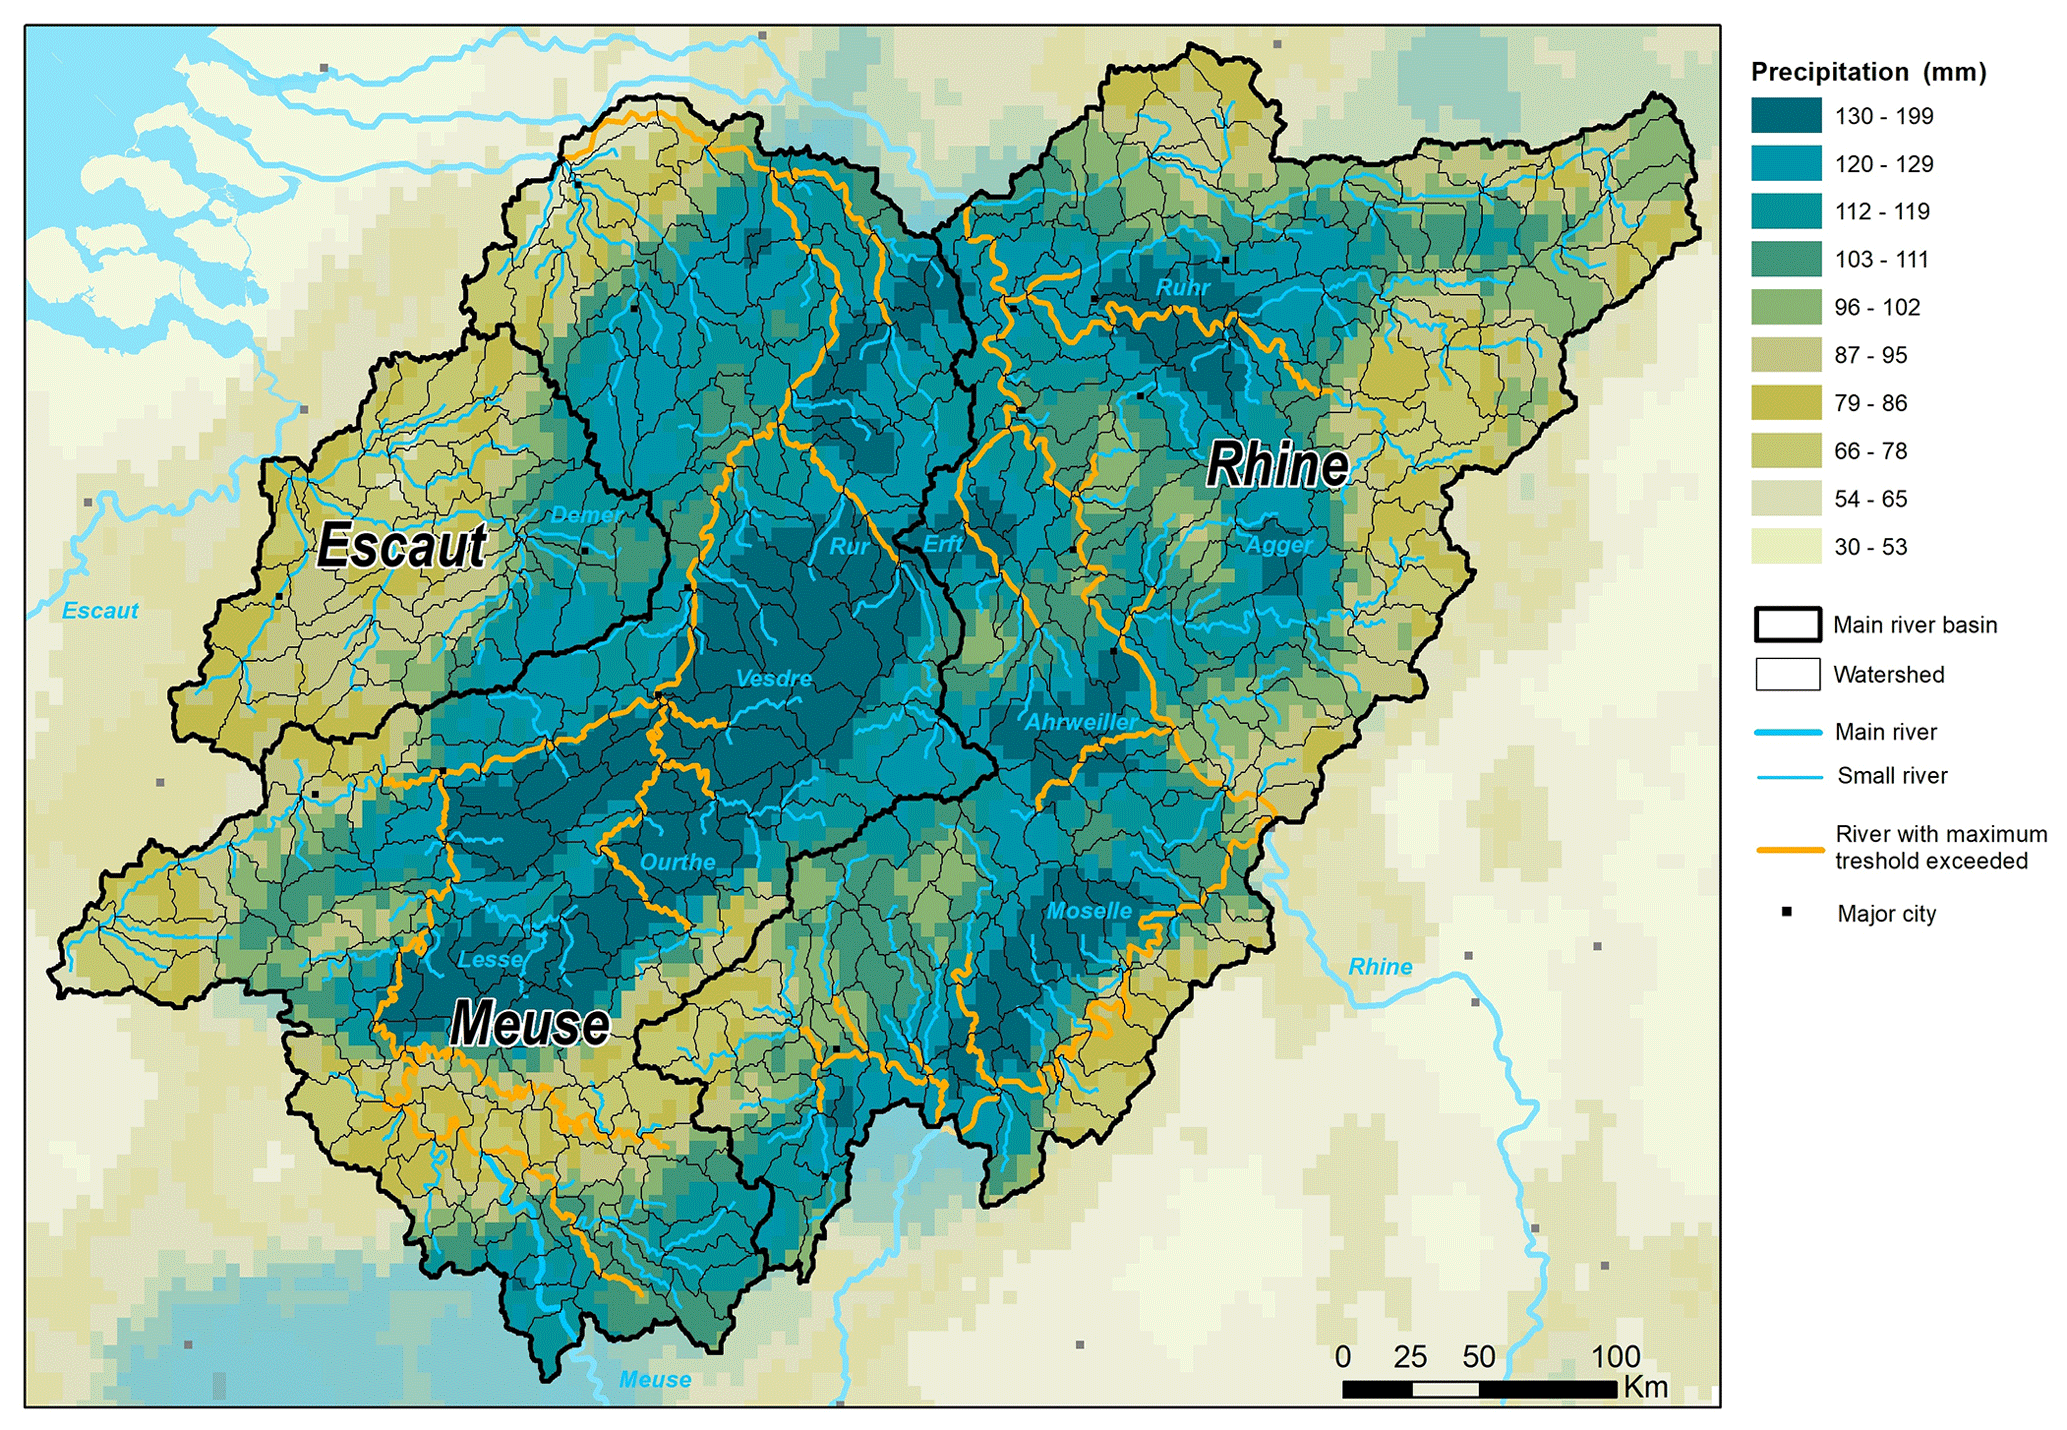
Figure 3Map showing the study area delineation based on the total precipitation computed at a 5 km resolution for the period from 7 to 27 July 2021. The selected portions of the main river basins (HydroBASIN delineation level 7) contain lower-size watersheds (HydroBASIN delineation level 12) covering smaller rivers and their tributaries. Rivers where the maximum water threshold was exceeded in the period from 11 to 31 July 2021 and with drainage areas larger than 500 km2 identified by CEMS (2021b) are overlaid with thick orange. These are the rivers most impacted by the precipitation.
3.2 Geo-social media topics
Table 2 illustrates the flood-related topics identified in our geo-social media data and the corresponding number of tweets per topic. Each topic was manually assigned a short abbreviation for subsequent analysis. The most straightforward flood-related topics included the heavy rain topic (540 tweets), which focused primarily on precipitation events, and the help to victims topic (594 tweets), which discussed support for those affected. The volunteering and donations topic (245 tweets) highlighted community assistance during the flood. Other topics related to traffic disruptions due to heavy rain and flooding appeared to be closely related in space and content. These were thus aggregated into a single roads blocked topic (617 tweets). Since topics 2 (Belgian flood) and 13 (Limburg flood) both focused on the same flooded areas, they were merged into the Meuse flood topic, comprising a total of 1108 tweets. Similarly, the Rhine flood topic, with 905 tweets, incorporated topics 25 and 9, which covered overlapping areas within the Rhine River basin. The damage topic (440 tweets) also reflected the immediate impacts of heavy rain and flooding and comprised two subtopics about water damage and power outages. The last aggregated topic was the compassion topic (576 tweets), both subtopics of which were concerned with expressing compassion for the victims. Beyond these, we also found three more politically loaded topics. The mourning victims topic (358 tweets) corresponded to a national victim day in Belgium, acknowledging the human cost of the floods. The German politics topic (190 tweets) focused on the discussion surrounding politicians' management or mismanagement of the flood response in Germany. The climate crisis topic (231 tweets) captured discussions on climate change as a contributing factor to the flooding and presented a call to action to limit its impacts. Overall, these topics provided a comprehensive view of the public discourse during the flooding event, highlighting both immediate flood-related concerns and broader socio-political debates (see Table 2). A complete list of all topics and their dominant words can be found in Table S1 in the Supplement.
Table 2Topic overview and the most important words.
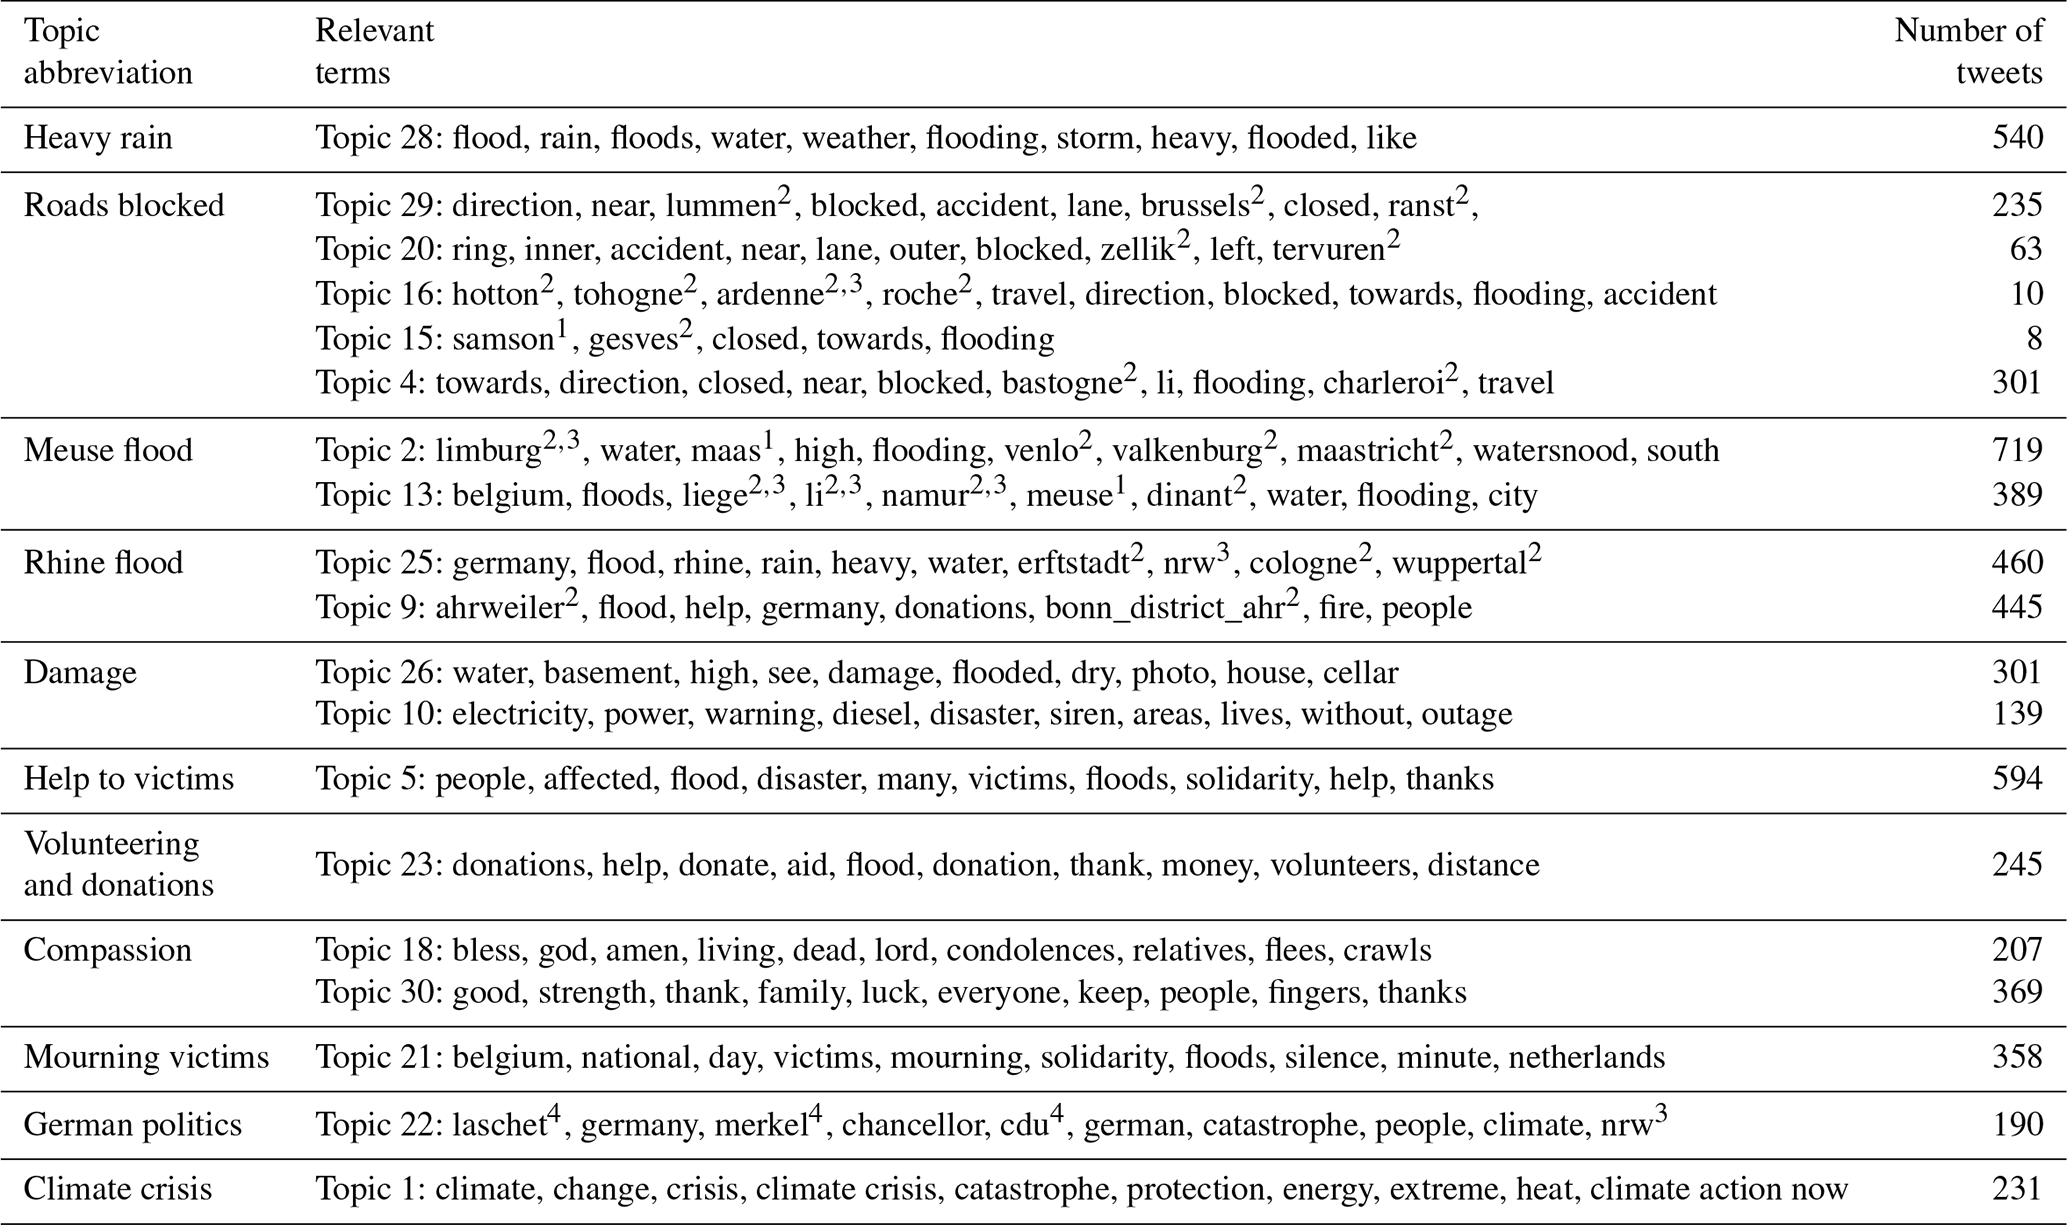
1 River. 2 City or municipality. 3 Province or region. 4 Politician or political party, with nrw: North Rhine-Westphalia and CDU: Christlich Demokratische Union Deutschlands.
3.3 Emergence of flood-related topics per main river basin
Figure 4 shows stacked bar plots for each river basin, which depict the percentage of daily flood-related tweet counts per topic over all tweets, revealing three key findings: first, topics were either river basin-specific (Meuse flood, Rhine flood, roads blocked, mourning victims, German politics) or stretched across basins (heavy rain, damage, help to victims, volunteering and donations, compassion, climate crisis). Second, the timing of the topic emergence varied compared to the timing of the precipitation peak. Some topics, such as heavy rain, Meuse flood, Rhine flood, and damage, peaked during or shortly after the precipitation maximum in their respective basins, while others, including roads blocked, volunteering and donations, mourning victims, and German politics, reached their highest activity levels a few days later. Third, the relative importance of certain topics varied significantly across river basins. For instance, the help to victims and mourning victims topics were more prominent in the Escaut river basin. In contrast, in the Meuse and Rhine River basins, the dominant topics were Meuse flood and Rhine flood, respectively, coinciding with the more severe flooding conditions in these areas.
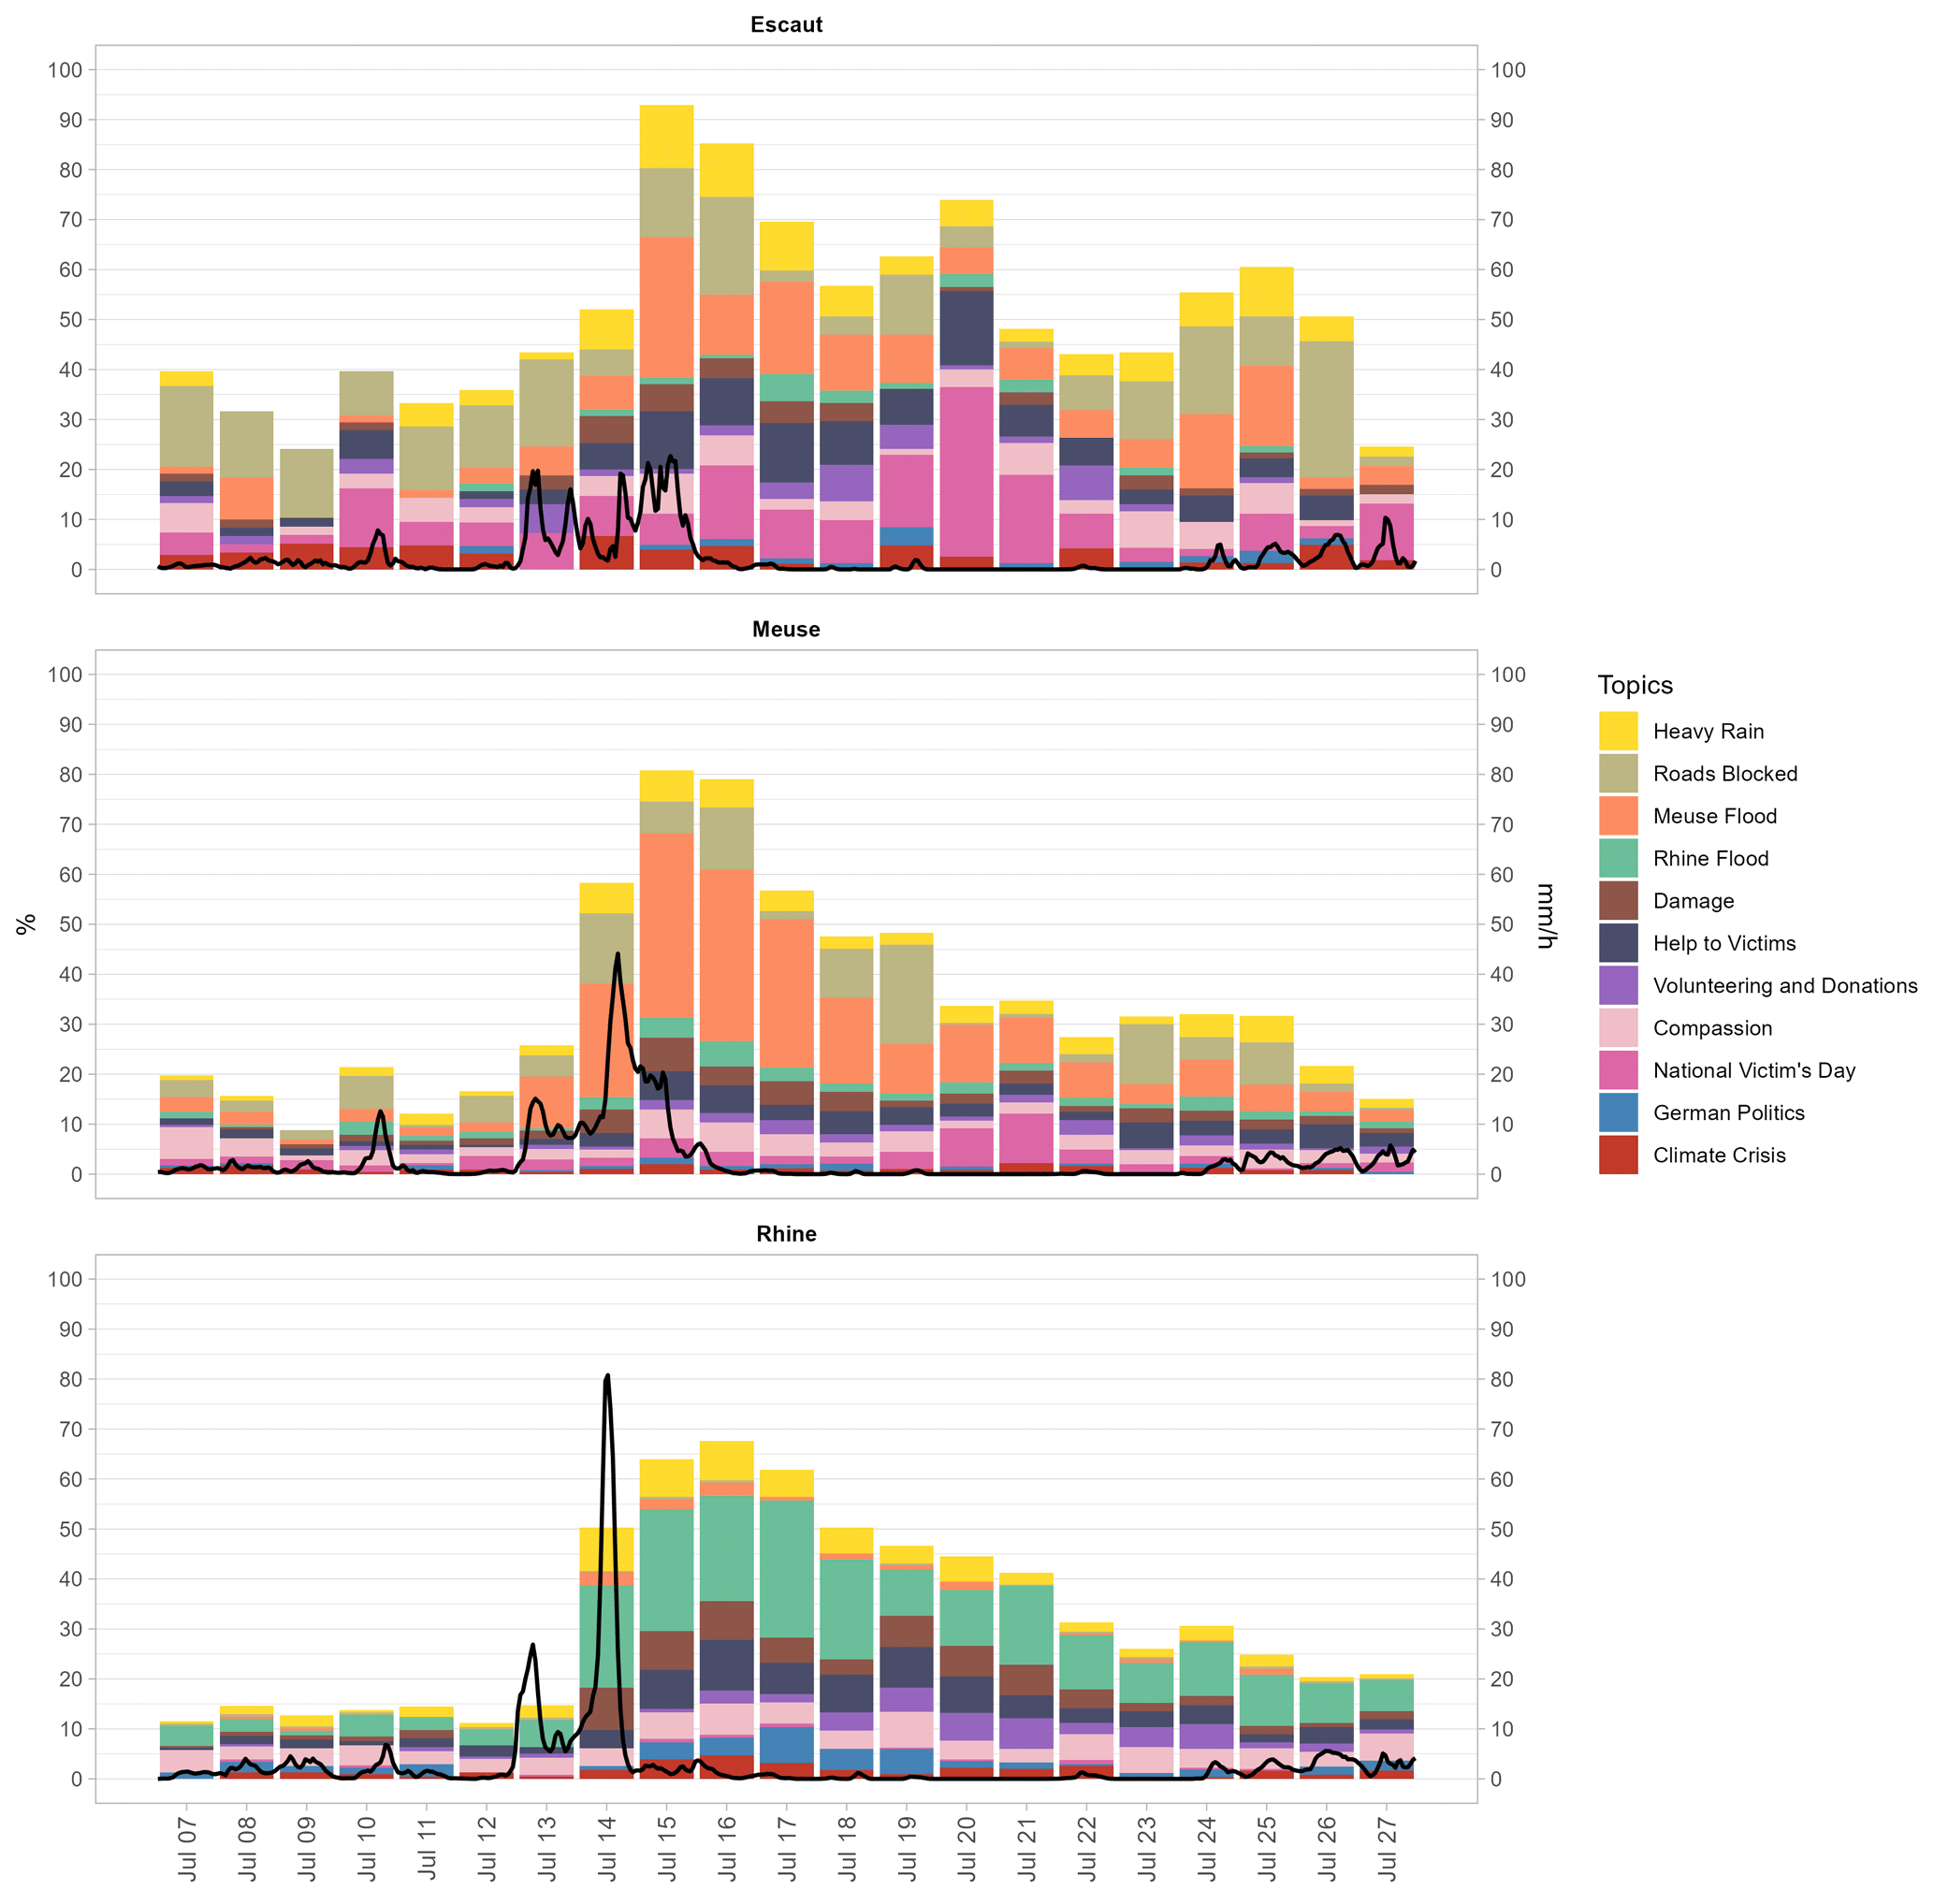
Figure 4Bar chart reporting the percentage of daily flood-related tweet counts per topic and the main river basin identified by BERTopic. The remaining percentage represents the share of tweets unrelated to flooding. Hourly precipitation rates (mm h−1) averaged per main basin (black line) show variations in precipitation intensity and peak time.
3.4 Spatial distribution of dominant geo-social media topics
To assess the spatial distribution and temporal dominance of flood-related geo-social media topics, we analysed the number of days each topic was dominant (i.e. had the highest number of tweets) within different watersheds for the period from 7 to 27 July 2021 (see Fig. 5). This analysis identified places of sustained topic dominance, i.e. where certain topics were central to online conversations over an extended period. Results showed several cross-basin topics, such as heavy rain, damage, help to victims, volunteering and donations, compassion, and climate crisis, which were relatively evenly distributed across river basins. These topics had a low maximum number of dominant days, ranging from 3 to 4 d, with the exception being the compassion topic, which remained dominant for 10 d. In contrast, river-basin-specific topics, such as Meuse flood and Rhine flood, were concentrated along the main river courses and transcended national boundaries. They dominated online conversations for the longest periods, with sustained dominance reaching up to 10 d in areas such as Maastricht and Bonn. The roads blocked topic was notably concentrated in the Meuse and Escaut River basins, where it maintained dominance across large portions of the river basins and, in some watersheds, lasted up to 8 d. Similarly, the mourning victims topic, which also spanned the Meuse and Escaut River basins, had its longest duration of dominance in Brussels, where it remained central for 6 d. The German politics topic was particularly relevant in major German cities along the Rhine River but had a shorter dominance period, lasting no more than 3 d. Finally, the N/A topic highlights areas with no geo-social media posts, showing a lack of data from the watersheds on the outskirts of our study area. These regions, primarily in the southern and eastern parts of our study area, are more remote and less urbanised compared to the northwestern areas, which had higher levels of online engagement.
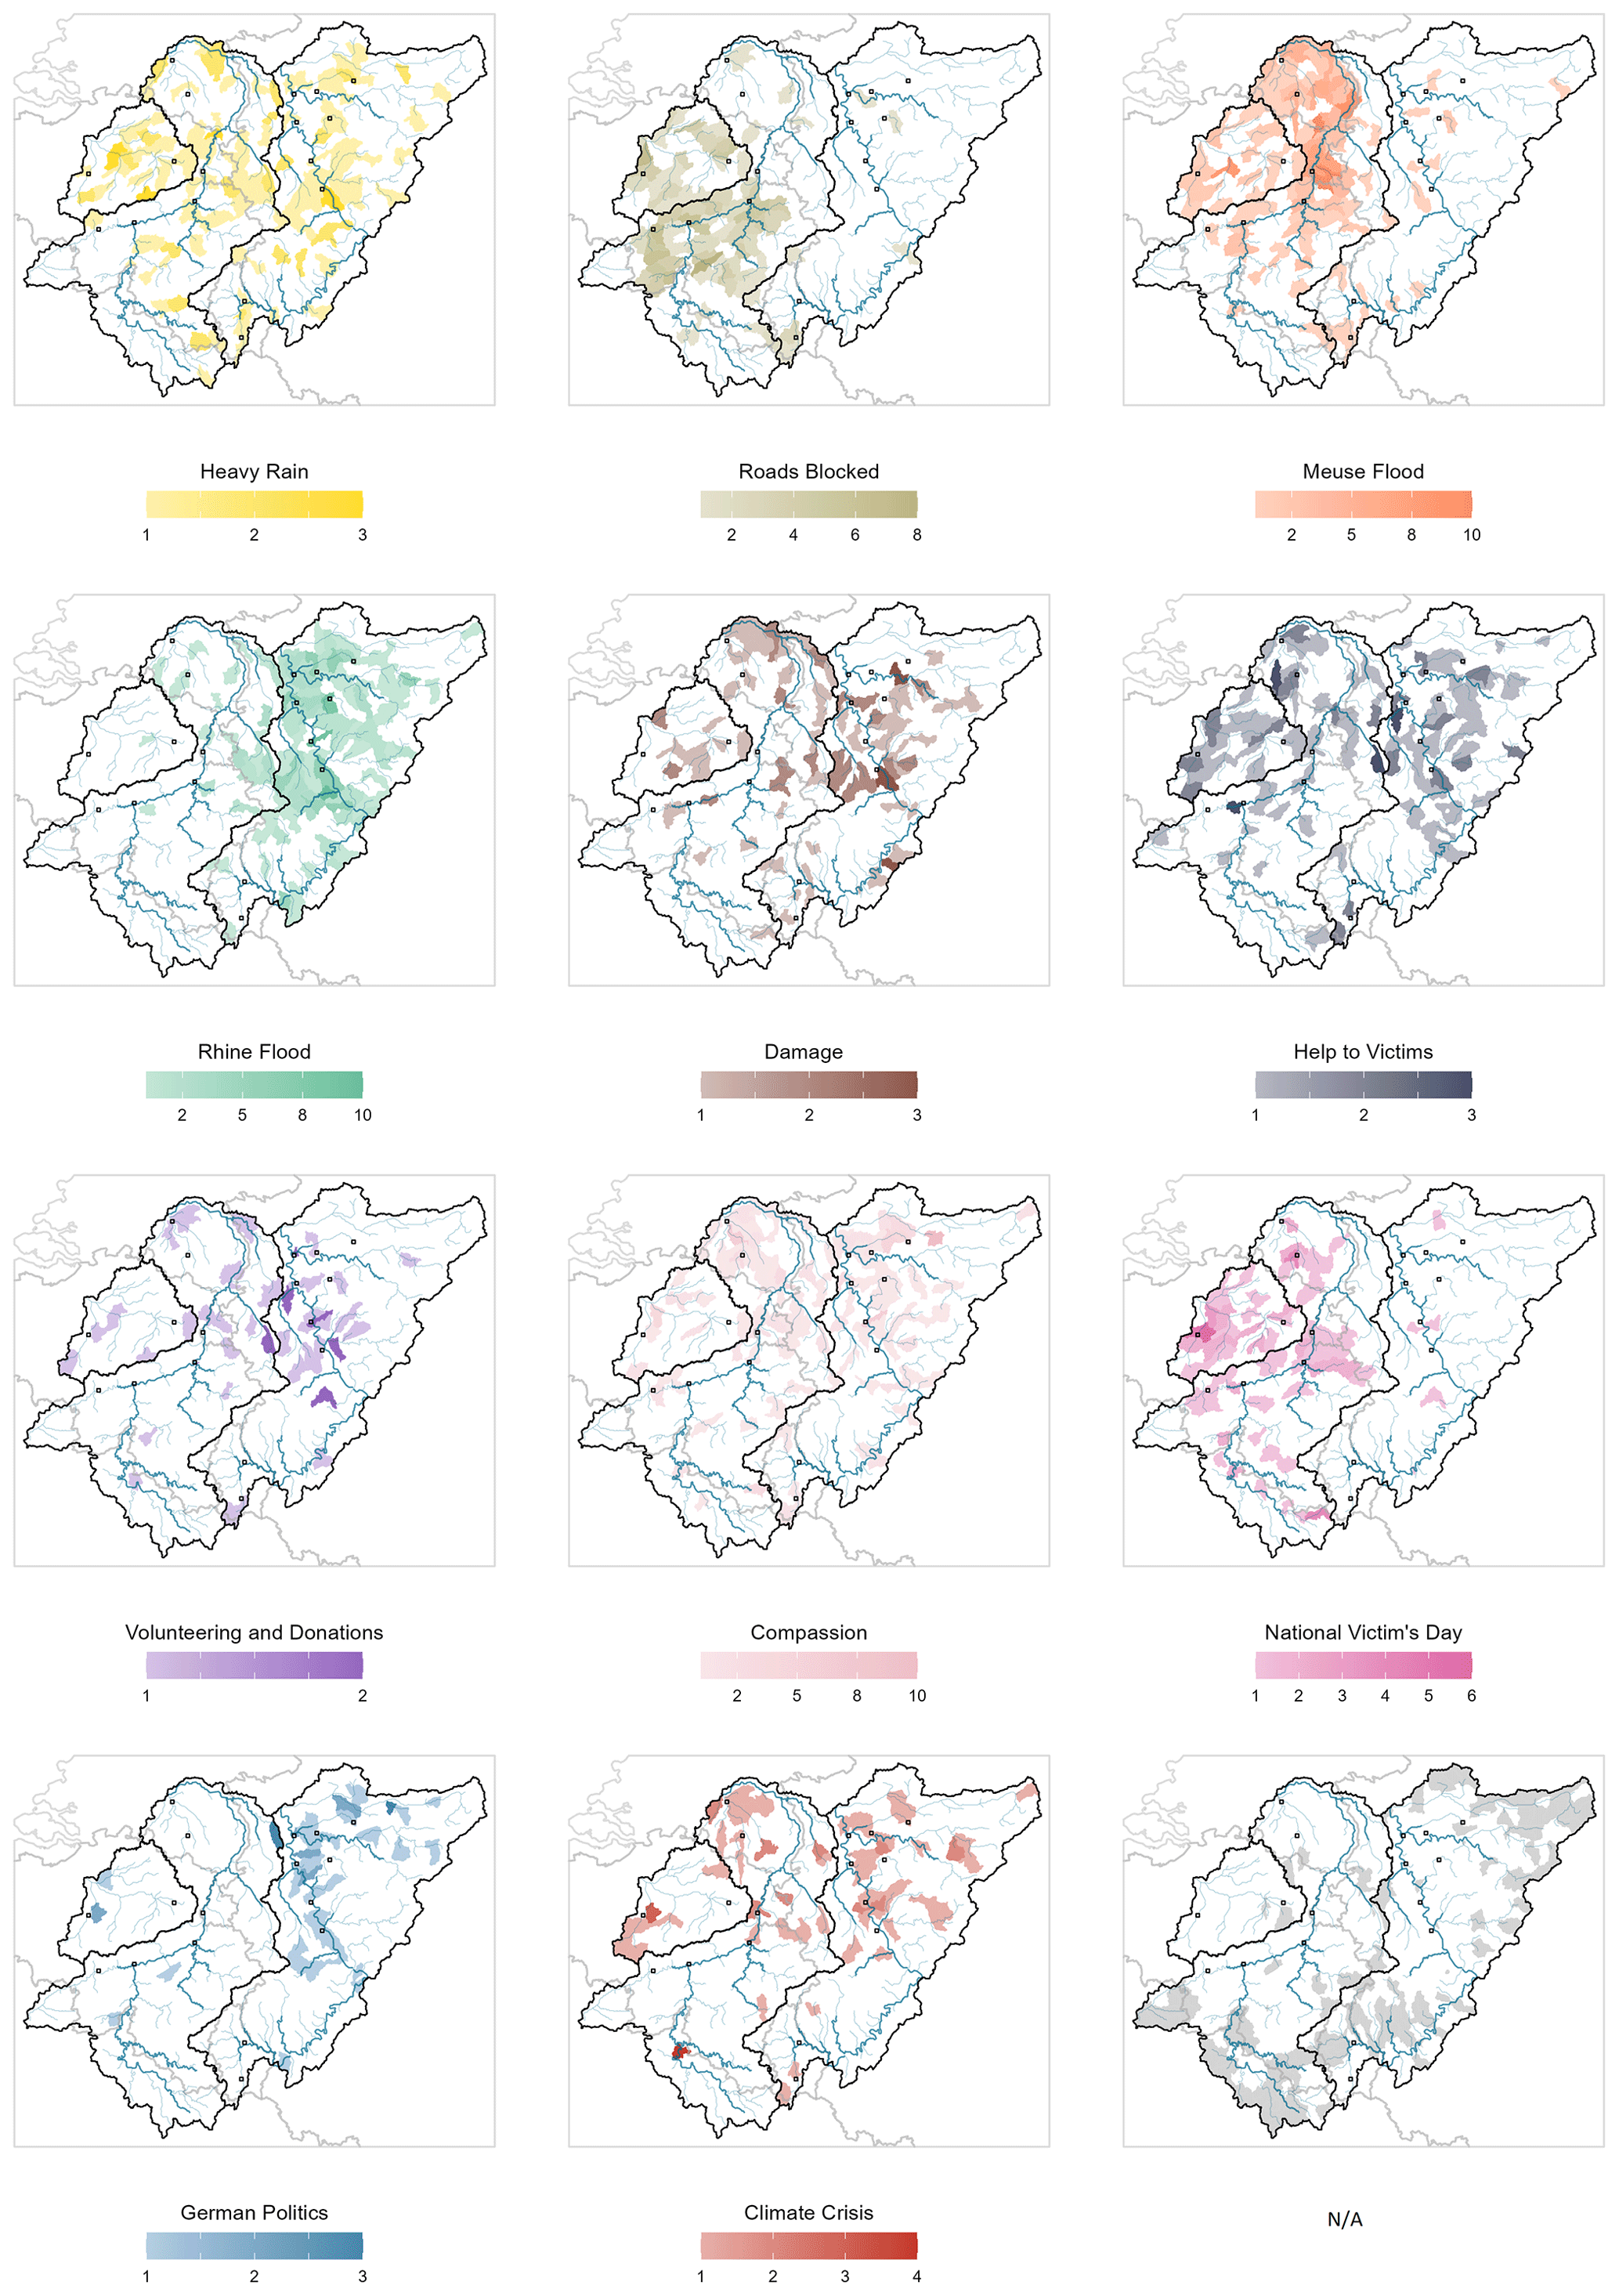
Figure 5Number of days a topic dominates flood-related conversations in a watershed during the period from 7 to 27 July 2021. Large rivers in which the maximum threshold was exceeded are represented by thick blue lines.
Figure 6 summarises the most dominant topic per watershed over the entire study period, highlighting a distinction between river-basin-specific topics that sustained prolonged dominance in areas severely affected by flooding and cross-basin topics that were broadly distributed but short-lived. In particular, the Rhine flood and Meuse flood topics were most dominant along their respective river courses, spanning multiple countries: France, Luxembourg, Belgium, and the Netherlands for the Meuse River and Germany and the Netherlands for the Rhine River. In contrast, cross-basin topics such as heavy rain, damage, and compassion were more ephemeral and mainly dominated peripheral areas outside the main river courses. Specifically, the heavy rain topic was dominant in the headwaters of river basins, while the damage topic was more prevalent in watersheds associated with secondary rivers, mainly in the Rhine and Meuse basins. The compassion topic also dominated secondary river areas but was primarily dominant in regions with lower precipitation levels.
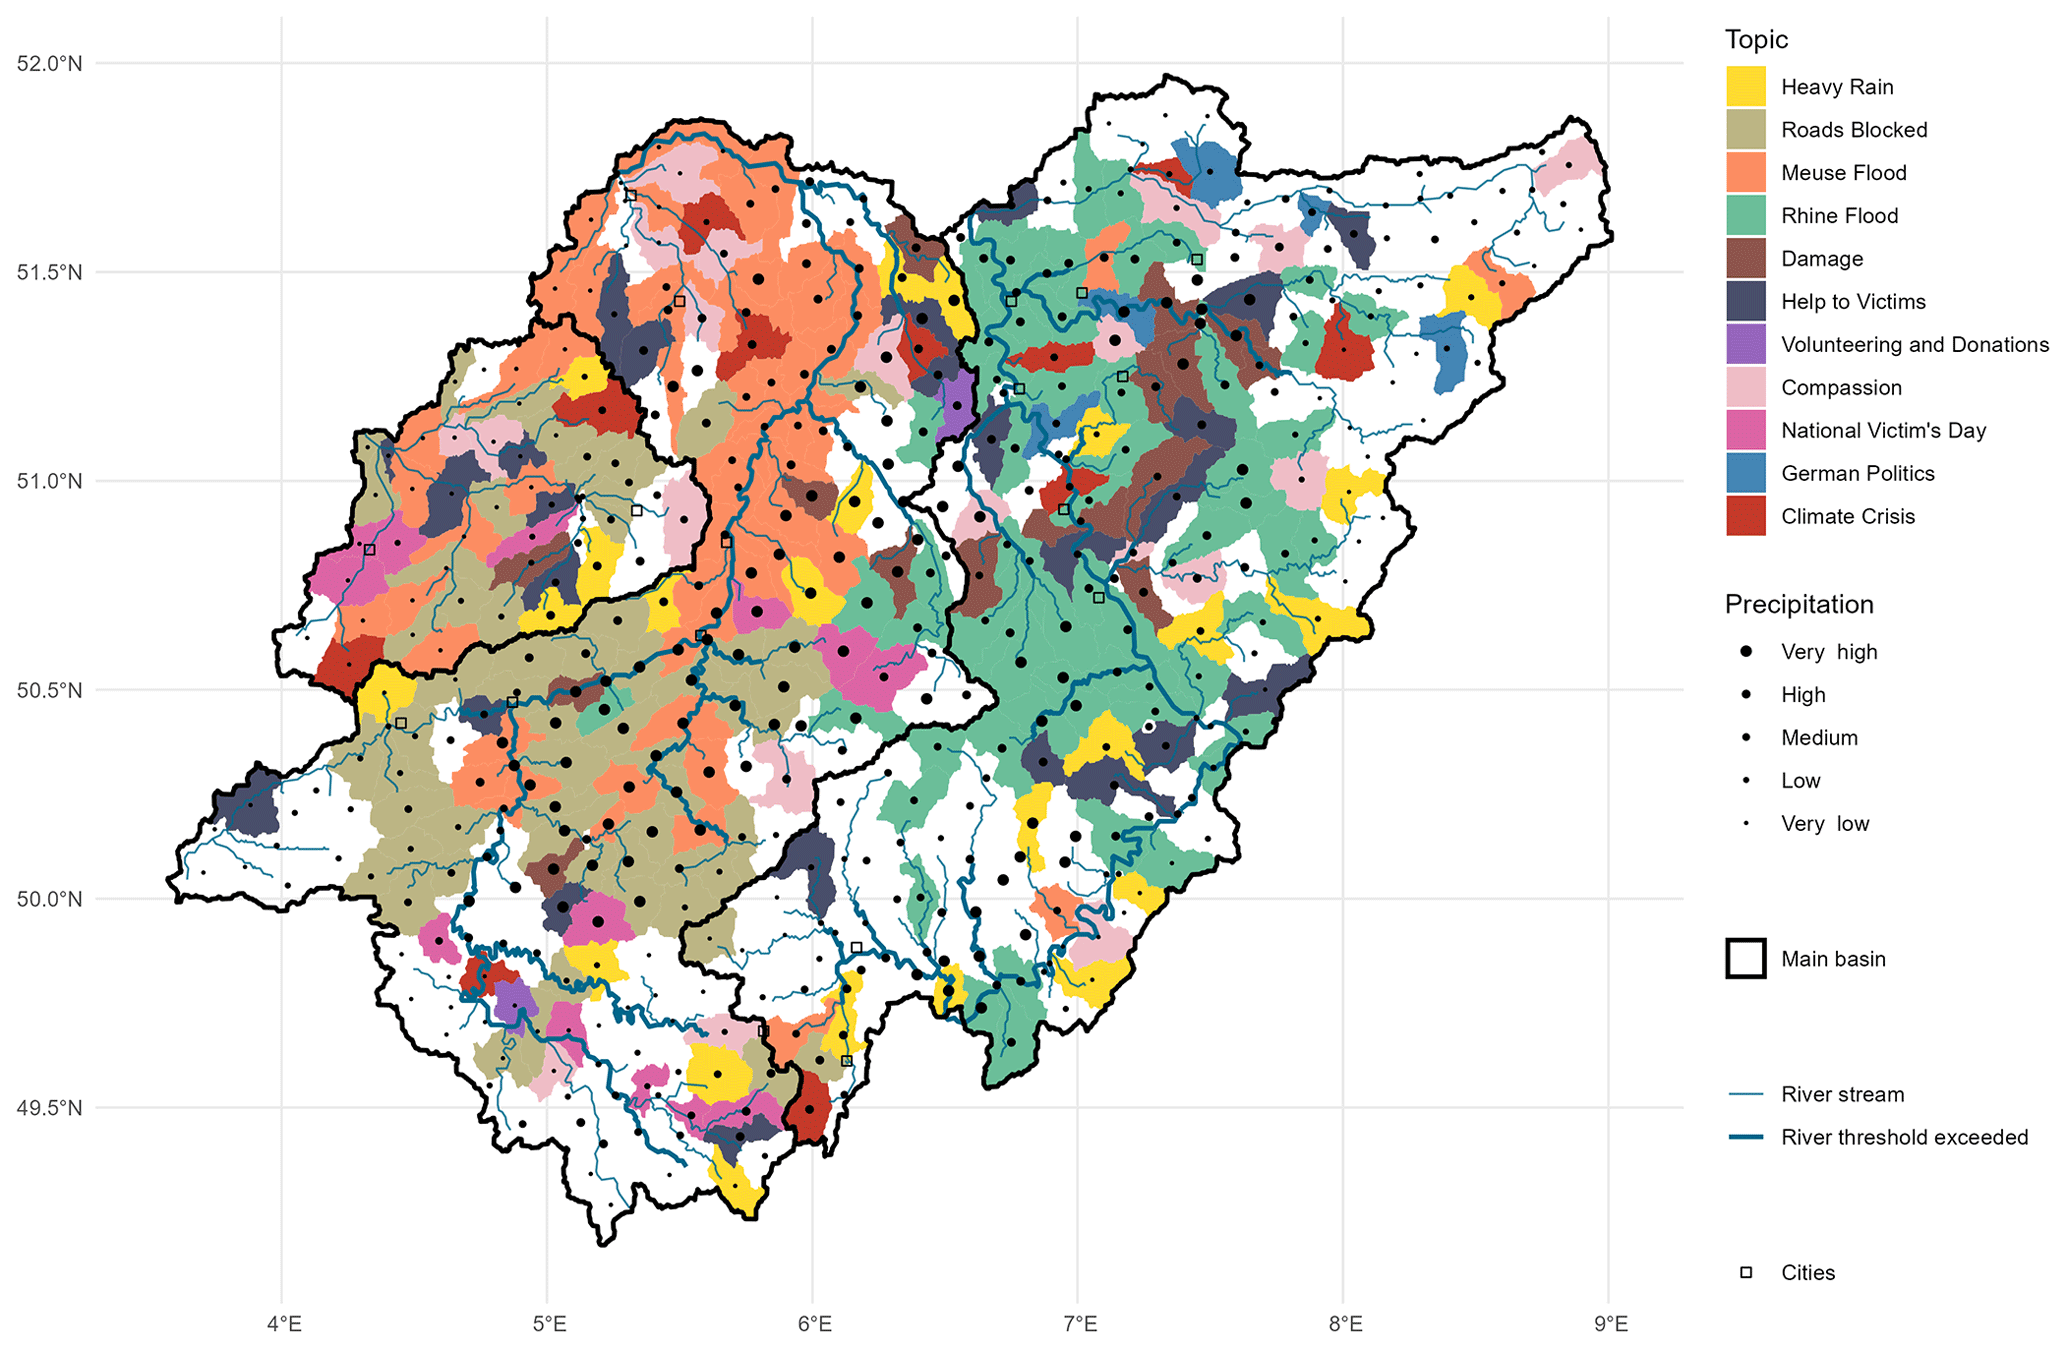
Figure 6Map showing the overall dominant geo-social media topics per watershed during the period from 7 to 27 July 2021. Dots represent mean precipitation per watershed (5 quantile classes). Large rivers in which the maximum threshold was exceeded between 11 to 31 July 2021 are represented by thick blue lines.
3.5 Comparison of topic occurrence across upstream and downstream areas
To further assess whether dominant topics emerged at specific locations across upstream and downstream areas of the river basins, we examined the spatial distribution of topic occurrence in light of the flood and watershed characteristics (Fig. 7). The goal of this analysis was to determine whether some topics were more prevalent in specific areas within the river basins depending on the varying precipitation, flood extent, catchment size, elevation, population density, and urbanisation levels of the watersheds.
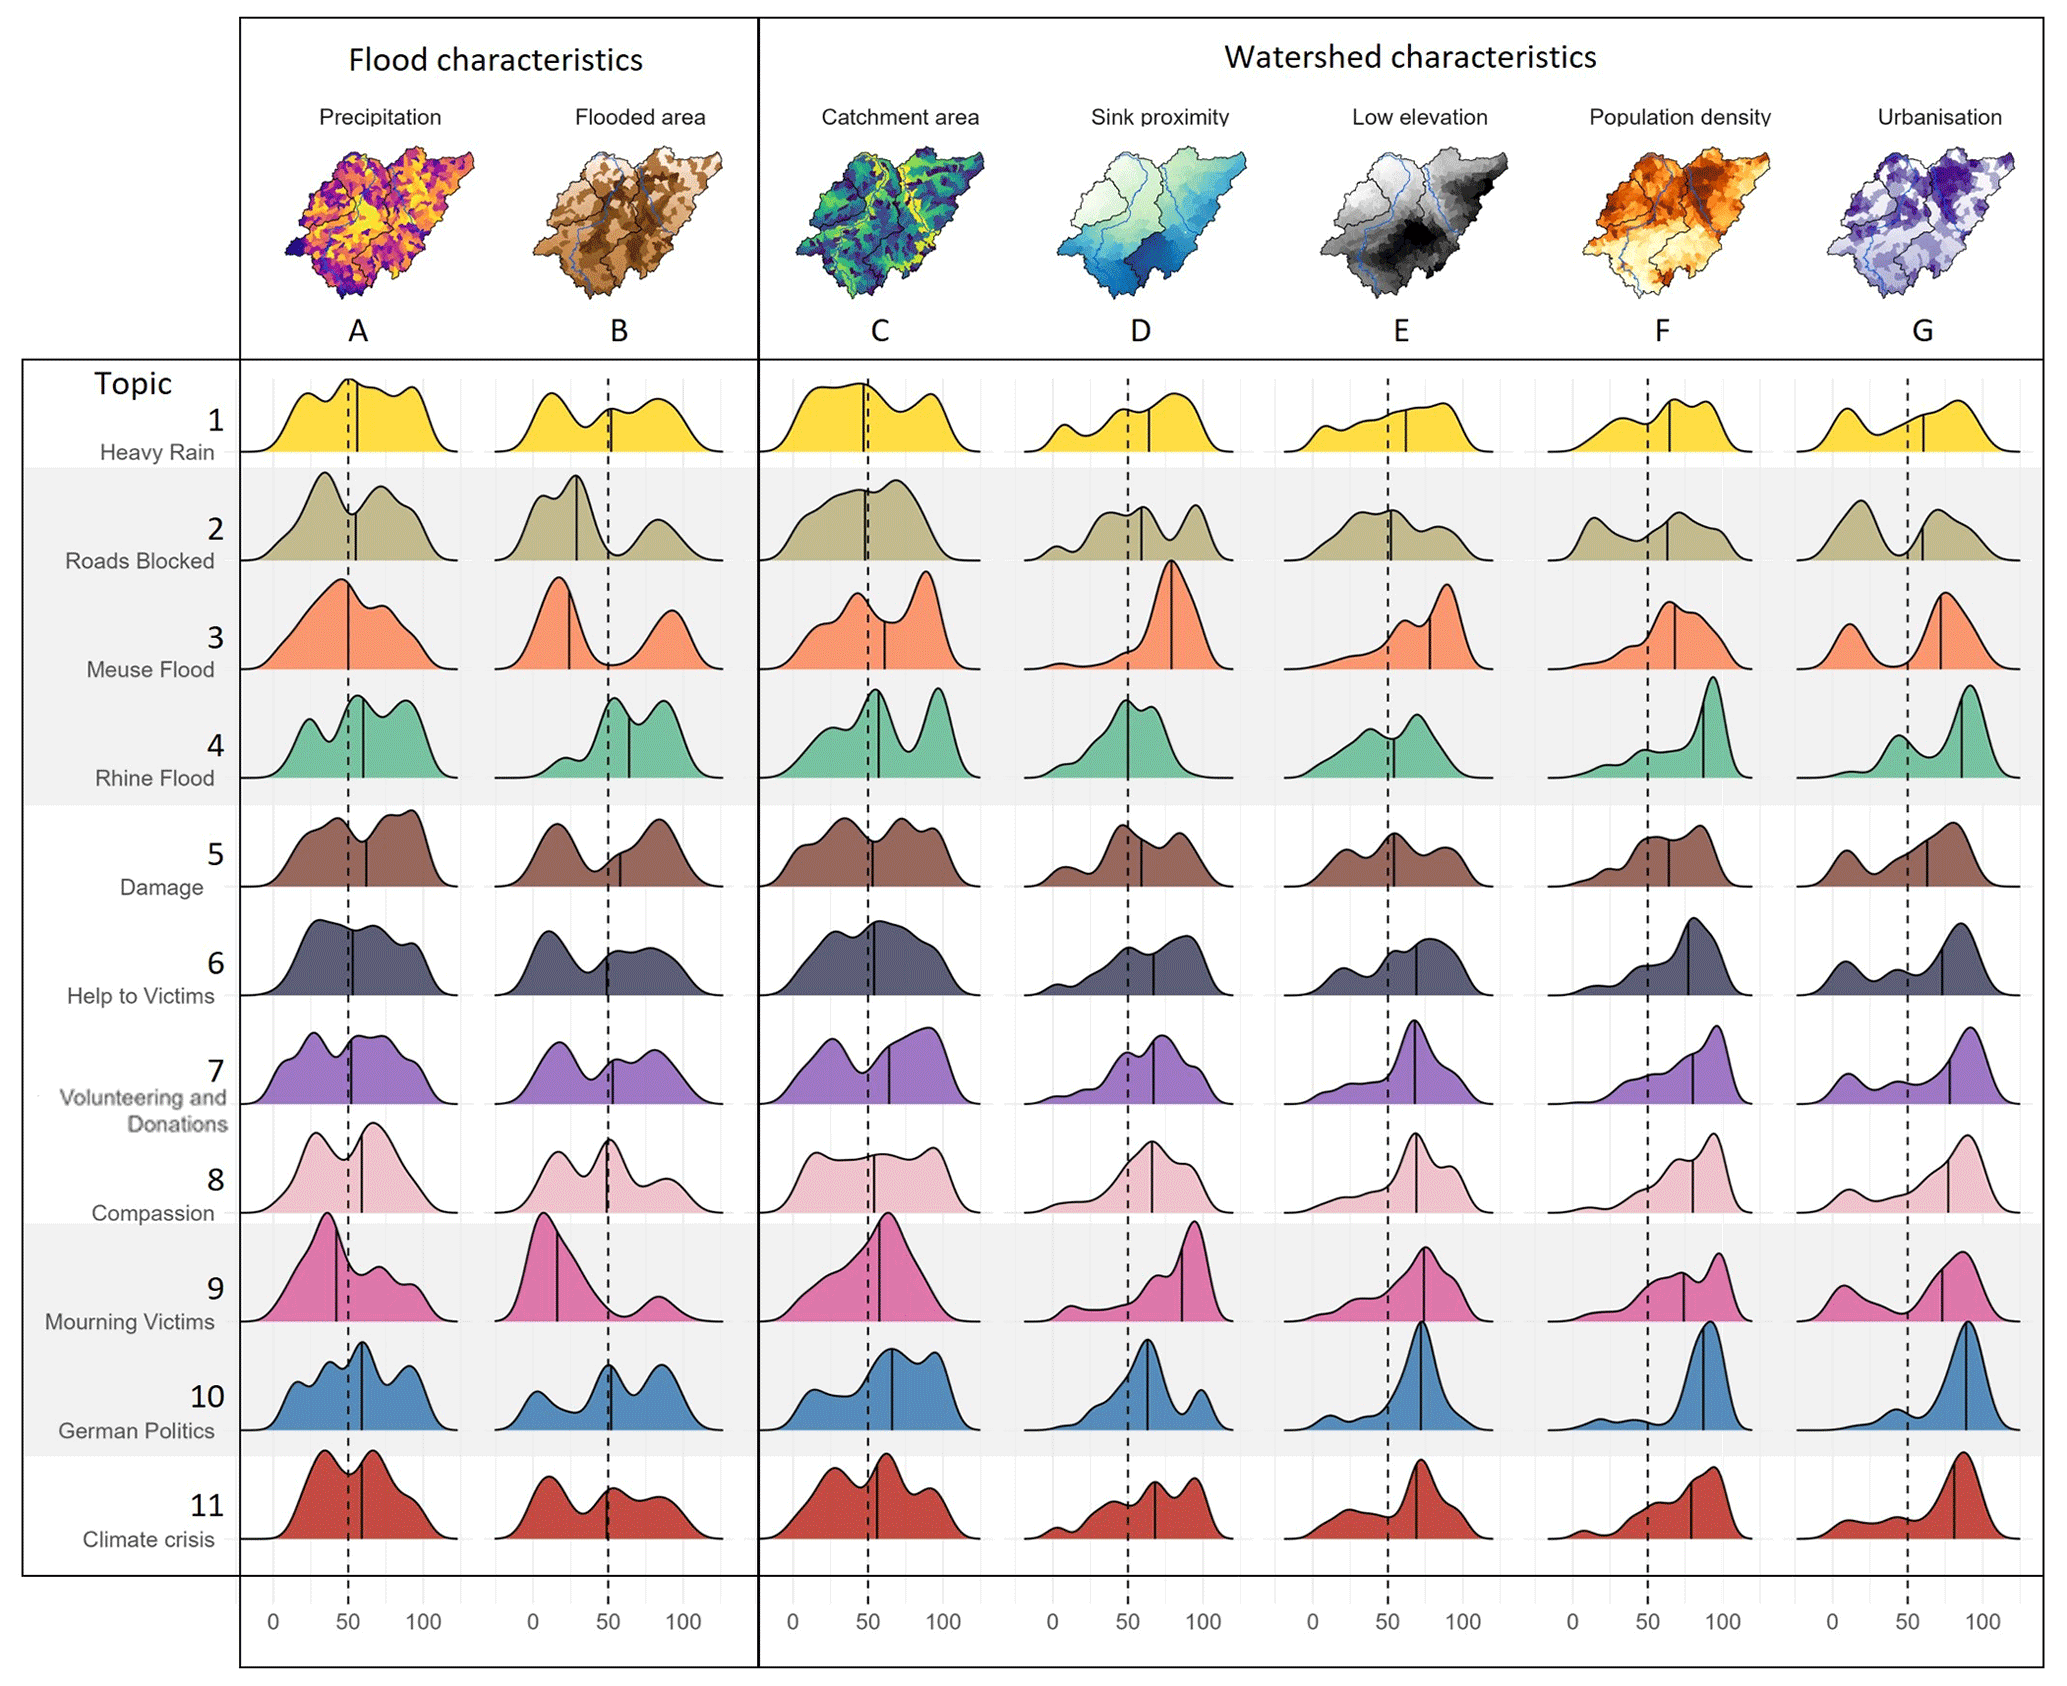
Figure 7Distribution plots of dominant topic occurrences across the study area based on flood characteristics (A, B: precipitation and flooded area) and five watershed characteristics (C–G: catchment area, sink proximity, elevation, population density, and degree of urbanisation). The x axis represents the variables' low (0) to high (100) values. The y axis shows the estimated kernel density, reflecting how often a topic dominated discussions over the period from 7 to 27 July 2021. The black line indicates the median of each distribution, while the dashed line marks the separation between upstream and downstream locations. River-basin-specific topics are highlighted with a grey background.
Our results revealed distinct patterns in topic occurrence across different socio-environmental conditions. The heavy rain topic was most frequent in regions with medium to high precipitation levels (A1) and in watersheds characterised by less flooded areas (B1) and smaller catchments (C1), suggesting that this topic was driven more by rainfall events than by the flood extent. In contrast, the roads blocked topic showed more nuanced distributions, appearing in both high- and low-precipitation areas (A2) but peaking in less flooded regions (B2) and midstream sections with medium-sized catchments and elevations (C2). This topic was also present across areas with varying population densities (F2) and levels of urbanisation (G2), indicating its broader relevance across urban and rural environments.
The Meuse flood topic was mainly dominant in watersheds that recorded medium precipitation levels (A3). Interestingly, this topic was prominent across two distinct ranges of flooded areas (B3), catchment sizes (C3), and urbanisation levels (G3), underscoring its importance in both urban and rural environments located upstream and downstream of the river basin. The Rhine flood topic followed a similar trend except that it was more frequently discussed in places with high precipitation (A4) and flooded areas (B4), reflecting the differences in flood characteristics between the two basins.
The topic reporting damage exhibited a bimodal distribution. It mainly emerged in both low- and high-precipitation areas (A5) and across both flooded and non-flooded regions (B5). Concerning the river basin's characteristics, the damage topic distribution showed important similarities with the Rhine flood and Meuse flood topics (e.g. C3–4–5), but peaks of topic occurrence did not appear at the same locations. The damage topic often emerged in different parts of the river basins, including smaller catchment areas (C5), higher elevations (E5), and areas with further distances from the sink (D5), suggesting a greater occurrence in smaller rivers in upstream areas where runoff flooding occurred.
Topics about help to victims and volunteering dominated areas that recorded medium to low precipitation levels (6A, 7A). Likewise, the distribution of these topics showed a demarcated peak in areas with low flooded areas (B6, B7). These topics were mainly located in downstream areas with similar sink proximity (D6, D7), elevation (6E, 7E), population density (6F, 7F), and urbanisation level (G6, G7), suggesting that these discussions stemmed from less affected regions. Similar patterns were observed for the compassion topic, although this topic showed no significant peak across catchment areas (C8), with an even distribution and no clear trend in favour of either upstream or downstream areas.
Finally, the mourning victims topic was concentrated in low-precipitation (A9) and less flooded (B9) regions but with a marked downstream bias (D9, E9), indicating that this topic mainly appeared in the downstream portion of the river basins in highly populated (F9) and urbanised areas (G9). Both the German politics and climate change topics showed no marked peaks aligned with precipitation (A10, A11) or flooded area (B10, B11) but were predominantly discussed in low-elevation (E10, E11), densely populated (F10, F11), and highly urbanised regions (G10, G11), indicating that these conversations were more tied to socio-political factors than to direct environmental conditions.
The results of our study revealed distinct spatio-temporal and semantic patterns in social media responses to flood events in transboundary river basins. Key findings show that cross-basin topics generated prior to and during the precipitation peaks – such as heavy rain and damage – were short-lived and closely spatio-temporally associated with precipitation levels and flood impacts. This suggests that these online conversations were mainly driven by social media users' immediate responses to changing environmental conditions in their respective watersheds. In contrast, river-basin-specific topics such as the Meuse flood and Rhine flood demonstrated sustained prominence along the respective river courses throughout the flood event, reflecting the long-lasting impact of flooding on social media user activity in these areas. Specific topics such as the roads blocked topic highlighted disruptions in infrastructure, with a nuanced presence outside the main river streams. Post-disaster topics such as help to victims and volunteering were concentrated in less severely affected areas either upstream or downstream, suggesting a larger focus on the emergency and needs of the affected areas located nearby. Overall, our analysis indicated that the nature and focus of online conversations varied significantly depending on user locations in the watershed and the severity of flood impacts. This provides new insights into how social media user communities engage with flood-related discussions in both upstream and downstream parts of a transboundary river basin.
4.1 The contribution of a watershed-based approach to tracing flood conversations
The watershed-based approach implemented in this research highlighted the relevance of using geo-social media information at the watershed scale, especially along transboundary rivers. While previous studies showed the relevance of social media data in providing timely information at the national or regional scales (Tan and Schultz, 2021; Wang and Ye, 2018), our findings demonstrate that similar flood-related topics can emerge in neighbouring countries, providing a broader transboundary perspective on flood-related discussions.
Further, we found that flood-related conversations can be associated with specific major river basins. Specifically, our results showed a clear distinction between broadly distributed cross-basin topics and river-basin-specific topics in regions heavily affected by flooding. This was especially apparent for the river-basin-specific topics Meuse flood and Rhine flood. Interestingly, these two main topics displayed a bimodal pattern when looking at their frequency distributions across the river basin characteristics (Fig. 7). This indicates that these flood-related topics were occurring across countries at two distinct levels of the respective river profile, suggesting that the nature and location of flood reports online can vary depending on the hydrographic context.
Indeed, a manual inspection of sample tweets of the Meuse flood and the Rhine flood topics showed that upstream topics described severe flooding in specific regions, like the Vesdre (Belgium) and Ahr (Germany) watersheds. However, topics were also numerous downstream, but in contrast, these were mainly focused on either reporting the flood occurring upstream or providing water-level updates regarding the lower section of the Meuse River, where flood defences were not breached (Koelewijn et al., 2023). This underlines the value of a watershed-based approach but also shows that geo-social media posts emerging in different hydrographic contexts can reflect different realities – one where the flood's impact is real and another where the flood is only discussed remotely and anticipatively.
Aside from this, a high level of social media activity may also indicate that the flood impact was less severe or that the most critical phase of the event has already passed. This was confirmed by the important number of topics about help to victims and volunteering, topics that dominated areas located in less affected regions. This type of evidence therefore highlights the importance of being cautious when interpreting peaks of flood-related topics as indicators of an actual flood-related response and suggests that information generated from social media should always be used as a complementary source alongside verified traditional sources of information to provide a comprehensive assessment of situational awareness along the river profiles.
The topics detected using a watershed-based approach contribute to the existing literature on the potential of geo-social media as a valuable tool for monitoring and understanding public responses during disasters (Kryvasheyeu et al., 2016; Silver and Andrey, 2019; Zou et al., 2018; Resch et al., 2018; Fohringer et al., 2015) and for supporting emergency management and reconstruction efforts (Tan and Schultz, 2021; Shan et al., 2023). We advance this body of work by showing that multiple online discussions can be detected, as shown by the variety of flood-related topics identified (Table 2). This type of topic extraction aligns with some recent research, such as the work of Zander et al. (2023) in Germany, who also identified similar topics. However, through the use of a transformer-based topic modelling approach (BERTopic), we leveraged word embeddings, allowing us to extract even more nuanced and fine-grained topics specific to each river basin and relevant across the five countries studied.
4.2 Social media data biases and study limitations
4.2.1 Selection bias
One important limitation is the selection bias inherent to social media data, which means that our results do not fully capture the broader diversity of public responses across different socio-demographic groups (Petutschnig et al., 2021; Jiang et al., 2019). Twitter data represent a non-uniform sample of the population (Mislove et al., 2011); exhibit significant biases towards specific age groups, often male and urban populations (Malik et al., 2015); and are influenced by various factors including user behaviours (Rzeszewski and Beluch, 2017). Besides, considering the fact that our study area included several countries and languages, cultural differences in the use of social media were expected. In fact, our results reflected semantic differences across countries in geo-social media topics that sometimes appeared to be mainly bound to the language spoken within country and regional boundaries (e.g. the Meuse flood topic was more frequent in the Dutch-speaking region of Flanders in Belgium and the province of Limburg in the Netherlands). Social media activity also tends to concentrate in highly urbanised and populated areas (Fan et al., 2020), leading to the underrepresentation of remote and more vulnerable regions (Karimiziarani et al., 2022; Forati and Ghose, 2022; Xiao et al., 2015). This limitation was verified in our analysis, with multiple dominant topics being the most frequent in densely populated and urbanised watersheds (Figs. 7, F1–11, and G1–11).
This type of underrepresentation of rural areas in social media data can affect the interpretation of flood impacts. For instance, rural towns such as Schuld (BBC, 2021) and Pepinster (DW, 2021) were severely devastated by the floods, resulting in a high proportion of casualties per capita. Residents in these areas might have been less likely to tweet updates due to power outages (Reuters, 2021), mobile network failure (Koks et al., 2022), or simply because of lower digital engagement rates. Therefore, the implications for emergency response are that an overreliance on social media signals could lead emergency responders to underestimate the severity of flooding in low-social-media-usage regions and prioritise urban relief efforts over rural recovery needs. To address this drawback, future studies could triangulate additional types of data sources (when available across countries), including remote-sensing-based data and questionnaire field surveys for detailed damage assessments or official news media sources from press articles for verified ground-level information (Vicari et al., 2019). An information fusion approach (Wieland et al., 2025) would also help to identify disaster hotspots and evaluate potential cross-border biases in geo-social media data during crisis management situations.
4.2.2 Geolocation limitations
Another limitation of this study is the potential spatial bias in crowdsourced data. Our watershed-based approach relied on accurately extracting geo-tagged tweets within watershed boundaries. In our dataset, most tweet locations were provided as polygons (81 %), with an average polygon size of 185 km2 (median size of 119 km2). However, this polygon size corresponds to the scale of European cities such as Brussels (161 km2) or Düsseldorf (217 km2), and additional visual analysis indicated that most of these polygons were concentrated around major urban centres. Consequently, we assumed that most tweets with polygon locations within a city's watershed area originated from these cities. Nevertheless, this spatial discrepancy should be considered when interpreting sustained topic dominance in watersheds that encompass large urban areas. To mitigate this issue, future research could incorporate a higher proportion of precisely geotagged tweets when available and refine watershed boundary delineations by integrating the spatial extent of urban areas.
4.2.3 Topic stability
An additional consideration in our analysis was the inherent variability in the semantic modelling algorithm (BERTopic) (Grootendorst, 2022), which is not entirely deterministic and depends on randomness in identifying topic clusters. To mitigate this issue, we ran the algorithm 20 times to assess the topic stability, distinguishing between stable and unstable clusters. We found that the keyword sets defining topic 26 and topic 10 from the damage topic only occurred across 20 % and 30 % of the iterations when allowing for a maximal difference of 17 %. Similarly, topic 18, which was aggregated into the compassion topic, was identified in only five iterations (25 %), and the help to victims topic was stable across nine iterations (45 %). This is because we applied a highly restrictive maximal difference threshold of just 17 % between topics across iterations, which, in some cases, corresponded to a difference of fewer than eight characters. Therefore, this does not imply that other iterations lacked topics related to damage, victim assistance, or compassion. Instead, it means that the defining keywords for these topics changed by more than 17 %, exceeding our threshold and resulting in their classification as distinct topics when comparing across iterations. This variability in keywords needs to be considered when interpreting these less stable topics. However, future studies could enhance topic stability analysis by incorporating ensemble approaches that combine results from multiple iterations to form a consensus topic structure or by exploring more sophisticated embedding-based similarity comparisons, which allow for the capture of the underlying meaning of keywords.
4.2.4 Dominant topic selection
Instead of computing the relative importance of each topic, our method assigned the topic name that was most discussed per watershed on a given day based on two main heuristic rules: selecting the most discussed topic and removing topics with the same number of maximum occurrences. A detailed analysis of this dominant topic selection process revealed that this method proved to be robust when selecting the most relevant topics. Indeed, the less frequently discussed topics were primarily affected by the filtering process (see Table S2). For instance, 61 % of topics mentioned only once on a given day and watershed were discarded. In contrast, none of the most frequently discussed topics (i.e. those occurring between 11 and 35 times) were removed from the analysis. Visually, we also observed that these smaller topics corresponded to more peripheral places located outside the most impacted areas, thus carrying some noise that was removed thanks to this method. Topic-wise, the filtering process impacted each topic category to a relatively similar degree, with the proportion of discarded topics ranging from 40 % to 70 %, except for the roads blocked topic, for which only 24.8 % of occurrences were filtered out (see Table S3). We found that this topic was atypical, as tweets were mainly generated from the Touring Mobilis Twitter account, a traffic information service active in Belgium and the Netherlands that provides real-time updates on road conditions. It described widespread rain- or flood-induced traffic problems occurring throughout our study area, which can explain why it was less frequently in conflict with other topics located closer to the flooded areas.
4.3 Implications for transboundary flood risk management
Despite these limitations, our findings provide meaningful implications for transboundary flood risk management. We show that social media analytics can support the detection, monitoring, and prediction of human responses to floods by sharing information with stakeholders and action forces across interconnected regions and countries. This potential of georeferenced social media data for early-warning purposes contributes to a variety of previous studies in the field of disaster risk reduction (Havas and Resch, 2021; Rossi et al., 2018; Schmidt et al., 2025; Stollberg and de Groeve, 2012).
First, topics dealing with heavy rainfall can indicate problematic precipitation in upstream areas and thereby help to anticipate dangerous water flows in upstream areas or overflow flooding in downstream areas. Another topic that has potential for disaster early warning is the one informing about blocked roads. This topic could be used to identify increases in road traffic issues, especially in remote, rural environments located in the upper parts of the watershed, thereby allowing for the improvement of emergency resource allocation. In both cases, this type of information complements traditional meteorological information from radar images and other satellite-based flood signals (Jongman et al., 2015) because it can inform about the on-site, problematic impact of heavy precipitation on human activities.
Second, river-basin-specific topics might allow for the identification of the sections of the main river basins affected by overflow flooding and show the extent to which water levels are unusually high during disaster events. This becomes helpful for policymakers and emergency responders when it comes to targeting interventions at the lower parts of the river where people are at the most risk of stream overflow, enabling the organisation of timely emergency assistance where needed. In this regard, Restrepo-Estrada et al. (2018) similarly emphasised the ability of geo-social media data to improve streamflow estimation. Damage-related topics, on the other hand, may be used for rapid damage assessment of run-off flooding. This topic might also help us to detect smaller and more indirect effects of the flood, such as flooded basements and power failures, which dominated conversations in different parts of the main river sections affected by the flood.
Third, post-disaster response topics focused on helping victims and volunteering initiatives and can be used further to identify where help is either called for or coming from in a transboundary river basin during the recovery phase. Once the location associated with the tweet has been verified, it can be leveraged to trigger faster emergency relief operations across regional or national borders. Finally, topics related to mourning victims, politics, or climate change enable a deeper understanding of the concerns of those living outside the impacted areas and thereby provide a remote perspective on the causes and potential mismanagement of the flood disaster.
Future research could explore how different countries within a shared river basin can use such information to better communicate and coordinate emergency responses in the face of a transboundary flood. This, however, must also be developed in parallel with the creation of standardised technical and legal frameworks for international disaster management (Gilga et al., 2024). Since the ex-post analysis provided here has not been tested in real-time to address emergency situations, studies in the field should therefore focus on developing methods able to identify dominant topics in near real-time and over shorter time windows. To meet this challenge, we emphasise the critical need for social media data providers to allow API access in emergency situations triggered by disaster events.
Our study provides a novel perspective on flood-related discussions on social media by adopting a watershed-based approach to analyse the emergence of topics and their distributions in transboundary river basins. Our findings reveal distinct spatio-temporal dynamics in the public discourse, showing how timely topics describing heavy rains or flood damage were closely tied to the immediate environmental conditions in the upstream areas, while post-disaster topics about helping victims or volunteering were more prevalent in areas less affected by flooding located both upstream and downstream. This understanding of how social media conversations evolve in relation to flood severity and watersheds' socio-environmental characteristics offers new opportunities for integrating geo-social media analytics into transboundary flood risk management. By enhancing the understanding of how social media users engage with flood-related information along river streams, this approach provides a framework for future studies to explore the interplay between environmental conditions, social media engagement, and transboundary collaboration in disaster contexts. Ultimately, by incorporating insights from social media into traditional disaster management strategies and tools – such as early-warning and monitoring services – future research and policy initiatives can enhance transboundary coordination in flood response and recovery efforts while more effectively addressing the needs of populations that are increasingly exposed to climate risks.
The code to reproduce the tweet translation, the topic modelling, and the topic coherence analysis can be found in the corresponding GitHub repository: https://github.com/DorianZGIS/Tracing-online-flood-conversations-across-borders.git (Dorian, 2025).
The datasets supporting the description watershed characteristics – including catchment areas, sink proximity, elevation – are freely available from Lehner et al. (2008). The 1 km2 population grid is also freely accessible (EUROSTAT, 2021) along with the degree of urbanisation layers (EUROSTAT, 2019). The dataset describing the extent of flooded zones can be found from the Copernicus EMS website (https://climate.copernicus.eu/esotc/2021/flooding-july, CEMS, 2021a). Precipitation data derived from the MAR model can be obtained upon request from the Climate Lab at the Department of Geography, University of Liège. Due to commercial restrictions and company policies, we are unable to make the Twitter (now X) data publicly available. Researchers interested in accessing the Twitter data for collaborative and/or non-profit scientific purposes are encouraged to contact us directly.
The supplement related to this article is available online at https://doi.org/10.5194/nhess-25-2351-2025-supplement.
Conceptualisation, SD, DA, SS, CL, and BR; methodology, SD and DA; software, SD and DA; validation, SD and DA; formal analysis, SD, DA, and SS; investigation, SD and SS; resources, BR; data curation, DA, SS, and SD; writing – original draft preparation, SD, DA, and SS; writing – review and editing, SD, DA, SS, CL, and BR; visualisation, SD and DA; supervision, CL and BR; project administration, SD and BR; funding acquisition, SD and BR. All authors have read and agreed to the published version of the paper.
The contact author has declared that none of the authors has any competing interests.
Publisher’s note: Copernicus Publications remains neutral with regard to jurisdictional claims made in the text, published maps, institutional affiliations, or any other geographical representation in this paper. While Copernicus Publications makes every effort to include appropriate place names, the final responsibility lies with the authors. Views and opinions expressed are those of the author(s) only and do not necessarily reflect those of the European Union–European Commission. Neither the European Commission nor the European Union can be held responsible for them.
We would like to warmly thank Xavier Fettweis and Sébastien Doutreloup from the Climate Lab at the Department of Geography, University of Liège, for providing customised precipitation data tailored to our study area. This work was funded by the Belgian Fonds de la Recherche Scientifique (FNRS) under Sébastien Dujardin's postdoctoral fellowship 2020-23 and was approved by the UNamur's Comité d'Ethique en Sciences Humaines (2020/05).
This research has been supported by the Fonds De La Recherche Scientifique (FNRS; grant no. Chargé de Recherche 2020-23, Sébastien Dujardin). In addition, this project has received funding from the European Commission – European Union under HORIZON EUROPE (HORIZON Research and Innovation Actions), grant agreement no. 101093003 (HORIZON-CL4-2022-DATA-01-01).
This paper was edited by Daniele Giordan and reviewed by Samar Momin and one anonymous referee.
Aall, C., Holm, T. B., Cauchy, A., Rudolf, F., Harris, K., Jansen, M. K., Gobert, J., Lager, F., Arvis, B., and Bour, M.: Think global–act local: the challenge of producing actionable knowledge on transboundary climate risks at the sub-national level of governance, Frontiers in Climate, 5, 1170142, https://doi.org/10.3389/fclim.2023.1170142, 2023.
Acikara, T., Xia, B., Yigitcanlar, T., Hon, C., Acikara, T., Xia, B., Yigitcanlar, T., and Hon, C.: Contribution of Social Media Analytics to Disaster Response Effectiveness: A Systematic Review of the Literature, Sustainability, 15, 8860, https://doi.org/10.3390/su15118860, 2023.
BBC: In pictures: Floods kill dozens in Germany and Belgium, https://www.bbc.com/news/world-europe-57858826?utm (last access: 11 March 2025), 16 July 2021.
Beigi, G., Hu, X., Maciejewski, R., and Liu, H.: An Overview of Sentiment Analysis in Social Media and Its Applications in Disaster Relief, in: Sentiment Analysis and Ontology Engineering, edited by: Pedrycz, W. and Chen, S., Studies in Computational Intelligence, Springer, Cham, 639, 313–340, https://doi.org/10.1007/978-3-319-30319-2_13, 2016.
Blomeier, E., Schmidt, S., and Resch, B.: Drowning in the Information Flood: Machine-Learning-Based Relevance Classification of Flood-Related Tweets for Disaster Management, Information, 15, 149, https://doi.org/10.3390/info15030149, 2024.
Bruneau, P., Brangbour, E., Marchand-Maillet, S., Hostache, R., Chini, M., Pelich, R.-M., Matgen, P., and Tamisier, T.: Measuring the impact of natural hazards with citizen science: The case of flooded area estimation using Twitter, Remote Sensing, 13, 1153, https://doi.org/10.3390/rs13061153, 2021.
CEMS: Flooding in Europe, https://climate.copernicus.eu/esotc/2021/flooding-july, last access: 4 October 2024), 2021a.
CEMS: The Copernicus Emergency Management Service forecasts, notifies, and monitors devastating floods in Germany, Netherlands, Belgium and Switzerland, https://emergency.copernicus.eu/mapping/ems/copernicus- emergency-management-service-forecasts-notifies-and-monitors-devastating-floods (last access: 4 October 2024b), 2021b.
Chorley, R. J.: Introduction to physical hydrology, Routledge, New-York, 205 pp., ISBN 978-0-367-22111-9, 2019.
Clarke, B., Otto, F., Stuart-Smith, R., Harrington, L., Clarke, B., Otto, F., Stuart-Smith, R., and Harrington, L.: Extreme weather impacts of climate change: an attribution perspective, Environmental Research: Climate, 1, 012001, https://doi.org/10.1088/2752-5295/ac6e7d, 2022.
Clegg, G., Haigh, R., Amaratunga, D., and Rahayu, H. P.: Coordination Challenges Facing Effective Flood Governance in the Ciliwung River Basin, Environ. Policy, 313–327, https://doi.org/10.1007/978-3-031-15904-6_17, 2023.
Dietze, M., Bell, R., Ozturk, U., Cook, K. L., Andermann, C., Beer, A. R., Damm, B., Lucia, A., Fauer, F. S., Nissen, K. M., Sieg, T., and Thieken, A. H.: More than heavy rain turning into fast-flowing water – a landscape perspective on the 2021 Eifel floods, Nat. Hazards Earth Syst. Sci., 22, 1845–1856, https://doi.org/10.5194/nhess-22-1845-2022, 2022.
Dorian, Z.: Tracing-online-flood-conversations-across-borders, GitHub [code], https://github.com/DorianZGIS/Tracing-online-flood-conversations-across-borders (last access: 11 July 2025), 2025.
Doutreloup, S., Bois, B., Pohl, B., Zito, S., and Richard, Y.: Climatic comparison between Belgium, Champagne, Alsace, Jura and Bourgogne for wine production using the regional model MAR, OENO One, 56, 1–17, https://doi.org/10.20870/oeno-one.2022.56.3.5356, 2022.
DW: Belgians pick up the pieces after deadly floods, https://www.dw.com/en/belgians-pick-up-the-pieces-after-deadly-floods/a-58302386, last access: 11 March 2025), 17 July 2021.
EUROSTAT: Methodological manual on territorial typologies, 2018th edn., European Commission Publications Office, 132 pp., https://doi.org/10.2785/930137, 2019.
EUROSTAT: Degree of urbanisation, https://ec.europa.eu/eurostat/web/gisco/geodata/population-distribution/degree-urbanisation (last access: 4 October 2024), 2020.
EUROSTAT: GEOSTAT 1 km2 population grid, https://ec.europa.eu/eurostat/web/gisco/geodata/population-distribution/geostat (last access: 4 October 2024), 2021.
Fan, C., Esparza, M., Dargin, J., Wu, F., Oztekin, B., and Mostafavi, A.: Spatial biases in crowdsourced data: Social media content attention concentrates on populous areas in disasters, Comput. Environ. Urban, 83, 101514, https://doi.org/10.1016/j.compenvurbsys.2020.101514, 2020.
Fekete, A. and Sandholz, S.: Here comes the flood, but not failure? Lessons to learn after the heavy rain and pluvial floods in Germany 2021, Water, 13, 3016, https://doi.org/10.3390/w13213016, 2021.
Florath, J., Chanussot, J., and Keller, S.: Rapid natural hazard extent estimation from twitter data: investigation for hurricane impact areas, Nat. Hazards, 120, 6775–6796, https://doi.org/10.1007/s11069-024-06488-2, 2024.
Fohringer, J., Dransch, D., Kreibich, H., and Schröter, K.: Social media as an information source for rapid flood inundation mapping, Nat. Hazards Earth Syst. Sci., 15, 2725–2738, https://doi.org/10.5194/nhess-15-2725-2015, 2015.
Forati, A. M. and Ghose, R.: Examining community vulnerabilities through multi-scale geospatial analysis of social media activity during hurricane Irma, Int. J. Disast. Risk Re., 68, 102701, https://doi.org/10.1016/j.ijdrr.2021.102701, 2022.
Gilga, C., Hochwarter, C., Knoche, L., Schmidt, S., Ringler, G., Wieland, M., and Resch, B.: Legal and ethical considerations for demand-driven data collection and AI-based analysis in flood response, Int. J. Disast. Risk Re., 122, 105441, https://doi.org/10.1016/j.ijdrr.2025.105441, 2024.
Grootendorst, M.: BERTopic: Neural topic modeling with a class-based TF-IDF procedure, arXiv [preprint], https://doi.org/10.48550/arXiv.2203.05794, 11 March 2022.
Gunnell, K., Mulligan, M., Francis, R. A., and Hole, D. G.: Evaluating natural infrastructure for flood management within the watersheds of selected global cities, Sci. Total Environ., 670, 411–424, https://doi.org/10.1016/j.scitotenv.2019.03.212, 2019.
Hanny, D. and Resch, B.: Multimodal Geo-Information Extraction from Social Media for Supporting Decision-Making in Disaster Management, AGILE GIScience Ser., 5, 28, https://doi.org/10.5194/agile-giss-5-28-2024, 2024.
Hanny, D., Schmidt, S., and Resch, B.: Active Learning for Identifying Disaster-Related Tweets: A Comparison with Keyword Filtering and Generic Fine-Tuning, in: Intelligent Systems and Applications, edited by: Arai, K., IntelliSys 2024, Lecture Notes in Networks and Systems, vol. 1066, Springer, Cham, https://doi.org/10.1007/978-3-031-66428-1_8, 2024.
Havas, C. and Resch, B.: Portability of semantic and spatial–temporal machine learning methods to analyse social media for near-real-time disaster monitoring, Nat. Hazards, 108, 2939–2969, https://doi.org/10.1007/s11069-021-04808-4, 2021.
Huang, Q. and Xiao, Y.: Geographic Situational Awareness: Mining Tweets for Disaster Preparedness, Emergency Response, Impact, and Recovery, ISPRS Int. J. Geo-Inf., 4, 1549–1568, https://doi.org/10.3390/ijgi4031549, 2015.
Ionita, M. and Nagavciuc, V.: Extreme floods in the Eastern part of Europe: Large-scale drivers and associated impacts, Water, 13, 1122, https://doi.org/10.3390/w13081122, 2021.
Jiang, Y., Li, Z., and Ye, X.: Understanding demographic and socioeconomic biases of geotagged Twitter users at the county level, Cartogr. Geogr. Inf. Sc., 46, 228–242, https://doi.org/10.1080/15230406.2018.1434834, 2019.
Jongman, B., Wagemaker, J., Romero, B. R., and De Perez, E. C.: Early Flood Detection for Rapid Humanitarian Response: Harnessing Near Real-Time Satellite and Twitter Signals, ISPRS Int. J. Geo-Inf., 4, 2246–2266, https://doi.org/10.3390/ijgi4042246, 2015.
Junghänel, T., Bissolli, P., Daßler, J., Fleckenstein, R., Imbery, F., Janssen, W., Kaspar, F., Lengfeld, K., Leppelt, T., Rauthe, M., Rauthe-Schöch, A., Rocek, M., Walawender, E., and Weigl, E.: Hydro-klimatologische Einordnung der Stark- und Dauerniederschläge in Teilen Deutschlands im Zusammenhang mit dem Tiefdruckgebiet Bernd vom 12. bis 19. Juli 2021, 2021.
Kahle, M., Kempf, M., Martin, B., and Glaser, R.: Classifying the 2021 “Ahrtal” flood event using hermeneutic interpretation, natural language processing, and instrumental data analyses, Environmental Research Communications, 4, 051002, https://doi.org/10.1088/2515-7620/ac6657, 2022.
Karimiziarani, M., Jafarzadegan, K., Abbaszadeh, P., Shao, W., and Moradkhani, H.: Hazard risk awareness and disaster management: Extracting the information content of twitter data, Sustain. Cities Soc., 77, 103577, https://doi.org/10.1016/j.scs.2021.103577, 2022.
Karmegam, D. and Mappillairaju, B.: Spatio-temporal distribution of negative emotions on Twitter during floods in Chennai, India, in 2015: a post hoc analysis, Int. J. Health Geogr., 19, 19, https://doi.org/10.1186/s12942-020-00214-4, 2020.
Koelewijn, A., Pol, J., and Schaijk, M. v.: Performance of flood defences in the Netherlands during the 2021 summer floods, Journal of Coastal and Riverine Flood Risk, 2, 7, https://doi.org/10.59490/jcrfr.2023.0007, 2023.
Koks, E. E., van Ginkel, K. C. H., van Marle, M. J. E., and Lemnitzer, A.: Brief communication: Critical infrastructure impacts of the 2021 mid-July western European flood event, Nat. Hazards Earth Syst. Sci., 22, 3831–3838, https://doi.org/10.5194/nhess-22-3831-2022, 2022.
Kruspe, A., Kersten, J., and Klan, F.: Review article: Detection of actionable tweets in crisis events, Nat. Hazards Earth Syst. Sci., 21, 1825–1845, https://doi.org/10.5194/nhess-21-1825-2021, 2021.
Kryvasheyeu, Y., Chen, H., Obradovich, N., Moro, E., Hentenryck, P. V., Fowler, J., and Cebrian, M.: Rapid assessment of disaster damage using social media activity, Science Advances, 2, e1500779, https://doi.org/10.1126/sciadv.1500779, 2016.
Lehner, B. and Grill, G.: Global river hydrography and network routing: baseline data and new approaches to study the world's large river systems, Hydrol. Process., 27, 2171–2186, https://doi.org/10.1002/hyp.9740, 2013.
Lehner, B., Verdin, K., and Jarvis, A.: New Global Hydrography Derived From Spaceborne Elevation Data, Eos Trans. AGU, 89, 93–94, https://doi.org/10.1029/2008EO100001, 2008.
Lorenz, C., Gilbert, A., Vellinga, P., Lorenz, C., Gilbert, A., and Vellinga, P.: Sustainable management of transboundary river basins: a line of reasoning, Reg. Environ. Change, 2, 38–53, https://doi.org/10.1007/s101130100023, 2001.
Malik, M., Lamba, H., Nakos, C., and Pfeffer, J.: Population bias in geotagged tweets, Proceedings of the International AAAI Conference on Web and Social Media, 9, 18–27, https://doi.org/10.1609/icwsm.v9i4.14688, 2015.
Mehta, A. S. and Warner, J. F.: Multi-level hegemony in transboundary Flood Risk Management: A downstream perspective on the Maritsa Basin, Environ. Sci. Policy, 129, 126–136, https://doi.org/10.1016/j.envsci.2021.12.014, 2022.
Mislove, A., Lehmann, S., Ahn, Y.-Y., Onnela, J.-P., and Rosenquist, J.: Understanding the demographics of Twitter users, Proceedings of the International AAAI Conference on Web and Social Media, 5, 554–557, https://doi.org/10.1609/icwsm.v5i1.14168, 2011.
Moghadas, M., Fekete, A., Rajabifard, A., and Kötter, T.: The wisdom of crowds for improved disaster resilience: a near-real-time analysis of crowdsourced social media data on the 2021 flood in Germany, GeoJournal, 88, 4215–4241, https://doi.org/10.1007/s10708-023-10858-x, 2023.
Petutschnig, A., Resch, B., Lang, S., and Havas, C.: Evaluating the Representativeness of Socio-Demographic Variables over Time for Geo-Social Media Data, ISPRS Int. J. Geo-Inf., 10, 323, https://doi.org/10.3390/ijgi10050323, 2021.
Polese, M., Tocchi, G., Babič, A., Dolšek, M., Faravelli, M., Quaroni, D., Borzi, B., Rebora, N., Ottonelli, D., Wernhart, S., Pejovic, J., Serdar, N., Lebar, K., Rusjan, S., Masi, R., Resch, C., Kern, H., Cipranić, I., Ostojic, M., and Prota, A.: Multi-risk assessment in transboundary areas: A framework for harmonized evaluation considering seismic and flood risks, Int. J. Disast. Risk Re., 101, 104275, https://doi.org/10.1016/j.ijdrr.2024.104275, 2024.
Rabus, B., Eineder, M., Roth, A., and Bamler, R.: The shuttle radar topography mission–a new class of digital elevation models acquired by spaceborne radar, ISPRS J. Photogramm., 57, 241–262, https://doi.org/10.1016/S0924-2716(02)00124-7, 2003.
Rahayu, H. P., Zulfa, K. I., Nurhasanah, D., Haigh, R., Amaratunga, D., and Wahdiny, I. I.: Unveiling transboundary challenges in river flood risk management: learning from the Ciliwung River basin, Nat. Hazards Earth Syst. Sci., 24, 2045–2064, https://doi.org/10.5194/nhess-24-2045-2024, 2024.
Resch, B., Usländer, F., and Havas, C.: Combining machine-learning topic models and spatiotemporal analysis of social media data for disaster footprint and damage assessment, Cartogr. Geogr. Inf. Sc., 45, 362–376, https://doi.org/10.1080/15230406.2017.1356242, 2018.
Restrepo-Estrada, C., de Andrade, S. C., Abe, N., Fava, M. C., Mendiondo, E. M., and de Albuquerque, J. P.: Geo-social media as a proxy for hydrometeorological data for streamflow estimation and to improve flood monitoring, Comput. Geosci., 111, 148–158, https://doi.org/10.1016/j.cageo.2017.10.010, 2018.
Reuters: Floods cut power to 200,000 households in western Germany: https://www.reuters.com/business/environment/floods- cut-power-200000-households-western-germany-2021-07-15/ (last access: 11 March 2025), 15 July 2021.
Rossi, C., Acerbo, F. S., Ylinen, K., Juga, I., Nurmi, P., Bosca, A., Tarasconi, F., Cristoforetti, M., and Alikadic, A.: Early detection and information extraction for weather-induced floods using social media streams, Int. J. Disast. Risk Re., 30, 145–157, https://doi.org/10.1016/j.ijdrr.2018.03.002, 2018.
Rzeszewski, M. and Beluch, L.: Spatial Characteristics of Twitter Users–Toward the Understanding of Geosocial Media Production, ISPRS Int. J. Geo-Inf., 6, 236, https://doi.org/10.3390/ijgi6080236, 2017.
Schmidt, S., Zorenböhmer, C., Arifi, D., Resch, B., Schmidt, S., Zorenböhmer, C., Arifi, D., and Resch, B.: Polarity-Based Sentiment Analysis of Georeferenced Tweets Related to the 2022 Twitter Acquisition, Information, 14, 71, https://doi.org/10.3390/info14020071, 2023.
Schmidt, S., Friedemann, M., Hanny, D., Resch, B., Riedlinger, T., and Mühlbauer, M.: Enhancing satellite-based emergency mapping: Identifying wildfires through geo-social media analysis, Big Earth Data, 1–23, https://doi.org/10.1080/20964471.2025.2454526, 2025.
Schüttrumpf, H., Birkmann, J., Brüll, C., Burghardt, L., Johann, G., Klopries, E., Lehmkuhl, F., Schütttrumpf, A., and Wolf, S.: Herausforderungen an den Wiederaufbau nach dem Katastrophenhochwasser 2021 in der Eifel, Nachhaltigkeit im Wasserbau – Umwelt, Transport, Energie, Dresdner Wasserbauliche Mitteilungen 68, 5–16, 2022.
Shan, S., Zhao, F., Shan, S., and Zhao, F.: Social media-based urban disaster recovery and resilience analysis of the Henan deluge, Nat. Hazards, 118, 377–405, https://doi.org/10.1007/s11069-023-06010-0, 2023.
Silver, A. and Andrey, J.: Public attention to extreme weather as reflected by social media activity, J. Conting. Crisis Man., 27, 346–358, https://doi.org/10.1111/1468-5973.12265, 2019.
Stollberg, B. and de Groeve, T.: The use of social media within the global disaster alert and coordination system (GDACS), in: Proceedings of the 21st International Conference on World Wide Web, Lyon, France, 16–20 April 2012, Association for Computing Machinery, New York, NY, USA, 703–706, https://doi.org/10.1145/2187980.2188185, 2012.
Tan, L. and Schultz, D. M.: Damage classification and recovery analysis of the Chongqing, China, floods of August 2020 based on social-media data, J. Clean. Prod., 313, 127882, https://doi.org/10.1016/j.jclepro.2021.127882, 2021.
UNECE: Transboundary flood risk management: experiences from the UNECE region, United Nations, New York, Geneva, ISBN 9789211170115, 2009.
UNISDR: The human cost of weather related disasters 1995–2015, United Nations, https://www.preventionweb.net/files/46796_cop21weatherdisastersreport2015.pdf (last access: 10 July 2025), 2015.
Vicari, R., Tchiguirinskaia, I., Tisserand, B., and Schertzer, D.: Climate risks, digital media, and big data: following communication trails to investigate urban communities' resilience, Nat. Hazards Earth Syst. Sci., 19, 1485–1498, https://doi.org/10.5194/nhess-19-1485-2019, 2019.
Wang, R.-Q., Mao, H., Wang, Y., Rae, C., and Shaw, W.: Hyper-resolution monitoring of urban flooding with social media and crowdsourcing data, Comput. Geosci., 111, 139–147, https://doi.org/10.1016/j.cageo.2017.11.008, 2018.
Wang, Z. and Ye, X.: Social media analytics for natural disaster management, Int. J. Geogr. Inf. Sci., 32, 49–72, https://doi.org/10.1080/13658816.2017.1367003, 2018.
Wania, A., Joubert-Boitat, I., Dottori, F., Kalas, M., Salamon, P., Wania, A., Joubert-Boitat, I., Dottori, F., Kalas, M., and Salamon, P.: Increasing Timeliness of Satellite-Based Flood Mapping Using Early Warning Systems in the Copernicus Emergency Management Service, Remote Sensing, 13, 2114, https://doi.org/10.3390/rs13112114, 2021.
Wieland, M., Schmidt, S., Resch, B., Abecker, A., and Martinis, S.: Fusion of geospatial information from remote sensing and social media to prioritise rapid response actions in case of floods, Nat. Hazards, 121, 8061–8088, https://doi.org/10.1007/s11069-025-07120-7, 2025.
Wilke, C. O.: Fundamentals of data visualization: a primer on making informative and compelling figures, O'Reilly Media, Sebastopol, USA, 59 pp., https://clauswilke.com/dataviz/ (last access: 10 July 2025), 2019.
Wilke, C. O.: ggridges: Ridgeline Plots in 'ggplot2', GitHub [code], https://github.com/wilkelab/ggridges, 2024.
Wyard, C., Scholzen, C., Doutreloup, S., Hallot, É., and Fettweis, X.: Future evolution of the hydroclimatic conditions favouring floods in the south-east of Belgium by 2100 using a regional climate model, Int. J. Climatol., 41, 647–662, https://doi.org/10.1002/joc.6642, 2021.
Xiao, Y., Huang, Q., and Wu, K.: Understanding social media data for disaster management, Nat. Hazards, 79, 1663–1679, https://doi.org/10.1007/s11069-015-1918-0, 2015.
Yin, J., Lampert, A., Cameron, M., Robinson, B., and Power, R.: Using social media to enhance emergency situation awareness, IEEE Intelligent Systems, 27, 52–59, 2012.
Yu, M., Yang, C., and Li, Y.: Big data in natural disaster management: a review, Geosciences, 8, 165, https://doi.org/10.3390/geosciences8050165, 2018.
Zander, K. K., Nguyen, D., Mirbabaie, M., and Garnett, S. T.: Aware but not prepared: understanding situational awareness during the century flood in Germany in 2021, Int. J. Disast. Risk Re., 96, 103936, https://doi.org/10.1016/j.ijdrr.2023.103936, 2023.
Zou, L., Lam, N. S. N., Cai, H., and Qiang, Y.: Mining Twitter Data for Improved Understanding of Disaster Resilience, Ann. Am. Assoc. Geogr., 108, 1422–1441, https://doi.org/10.1080/24694452.2017.1421897, 2018.