the Creative Commons Attribution 4.0 License.
the Creative Commons Attribution 4.0 License.
 | 08 Jul 2025
Super typhoons Mangkhut (2018) and Saola (2023) during landfall: comparison and insights for wind engineering practice
Yujie Liu
Pakwai Chan
Aiming Liu
Qijun Gao
Offshore wind turbines are very sensitive to wind effects, and wind information about tropical cyclone (TCs) lays the foundation for their wind-resistant design and anti-TC operation, especially in TC-prone areas. While the statistical characteristics of TCs have drawn continuous attention, the specific features of some typical TC events, which are of practical importance for the daily operation of marine turbines, receive less attention in the wind engineering community. Super typhoons Mangkhut and Saola are two of the strongest TCs that have ever impacted south China. Notably, although Saola was reported to be more intense than Mangkhut, it resulted in much less severe impact and damage. This article presents a comparison study of these two TCs based on comprehensive usage of field records. Results suggest that both Mangkhut and Saola exhibited a concentric eyewall structure during development, but Saola completed the eyewall replacement before landfall, whilst Mangkhut failed to do so. Consequently, Saola evolved into a more intense and compact storm. In contrast, Mangkhut decayed consistently but still exerted an extensive impact over a wider area. Consistent with these features, the wind characteristics of Mangkhut and Saola also demonstrated noteworthy discrepancies. These findings provide useful insights for operation and maintenance strategies of coastal and offshore wind turbines.
- Article
(10532 KB) - Full-text XML
- BibTeX
- EndNote


Wind energy, as a clean and renewable resource, holds a key place in the global strategies for energy transition and climate change response (Martinez et al., 2023; Patel et al., 2022). With advancements in technology and reduced costs, wind power has become one of the most competitive electricity sources. As the demand for higher wind velocities and enhanced wind consistency grows, wind farm expansion has shifted towards more distant locations (Bento and Fontes, 2019; Díaz and Guedes Soares, 2020).
As a part of this trend, wind turbines also face increasingly stringent and complex natural environmental conditions (Qian et al., 2024). The impact of tropical cyclones (TCs) is especially noteworthy (Matsui et al., 2002). In the open seas further from land, TCs encounter less interference caused by terrain, leading to stronger winds that can result in aerodynamic failure in turbine blades (Dong et al., 2018; Yang et al., 2020), distortion of tower structures, or the trigger other catastrophic incidents such as the collapse of wind turbines (Sun et al., 2023). Concurrently, the massive waves and storm surges can inflict damage on the foundations of wind turbines, jeopardizing the normal operational integrity and power transmission at the wind farm site. If significant damage ensues, the post-TC repair work at the wind farm will face complicated working conditions and exorbitant costs. In summary, the extreme wind velocities and wave-induced impacts caused by TCs present a rigorous test of the structural stability, durability, and safety of wind turbines. These conditions also impose heightened requirements on the TC-resilience capabilities of offshore wind farms during both construction and operational maintenance phases (Kaldellis et al., 2016).
In the design of the anti-TC phase for wind turbines, extreme wind velocities are a critical consideration (Liu et al., 2019; Sheng and Hong, 2021). Guided by design principles centered around extreme wind speeds, researchers have extensively investigated the environmental loads and dynamic responses of turbines under extreme conditions (Gong et al., 2024; Li et al., 2019a; Chen et al., 2020). These findings have significantly informed the design of TC-resistant turbines in coastal and offshore areas. The design process typically begins with an initial estimation of TC risk, defined by design wind speeds corresponding to various return periods, which is then used to assess wind loads and wind-induced responses for the ultimate limit states of the turbine (e.g., IEC, 2019).
However, alongside focusing on extreme wind velocities, gaining a deep understanding of the internal structure and evolution of typhoons is equally important to enhance the safety of wind turbines. As a complex weather system, typhoons contain a wealth of meteorological elements such as temperature, humidity, pressure fields, and vertical and horizontal wind speed components. These elements interact with each other, collectively determining the intensity and path changes of the typhoon. For instance, the axial asymmetry of the TC pressure field can significantly influence local wind speed distributions, adding complexity to the prediction of typhoon behavior (He et al., 2020a). Due to the high variability exhibited by typhoons during their spatiotemporal evolution, accurately assessing their impact on wind turbines poses a significant challenge (Ren et al., 2022). Therefore, evaluating the specific effects of individual typhoons on wind turbines becomes crucial during the operational maintenance phase.
It is true that the meteorological community has gained plentiful achievements related to TCs' thermodynamic and kinetic structures as well as the mechanisms behind them, but there is still an evident gap between meteorology and wind engineering, and much insightful knowledge and wisdom in meteorology has not attracted wind engineers' timely attention, let alone be used to guide wind engineering practices (He et al., 2023).
In summation, focusing on some typical TC events and exploring their features is of great importance to provide insights for the advancement and refinement of theories in wind engineering and practices in turbine technologies.
Super Typhoon Mangkhut in 2018 (Zheng et al., 2024) and Super Typhoon Saola in 2023 (Lo et al., 2024) are the two strongest TC events that have attacked south China during the past several years. During the landfall of the two special TCs, various meteorological instruments, including meteorological satellites, weather radar, and wind profilers, worked effectively and offered a valuable opportunity to explore these TCs from a comprehensive and global perspective. It is also noticeable that although Saola was reported to be more intense than Mangkhut, it resulted in much less severe wind-induced impact and damage.
To this end, this article presents a comparison study on Mangkhut and Saola, with the primary aim of providing in situ evidence for better understanding the above discrepancy and drawing relevant insights for wind engineering. The rest of this article is organized as follows. In Sect. 2, the two typhoons and main devices and datasets adopted are presented. Section 3 discusses the discrepancies between the two typhoons' intensities and influence areas as well as the potential reasons, while Sect. 4 presents typical results of the TC wind. The main findings are summarized in Sect. 5.
2.1 Super typhoons Mangkhut and Saola
Typhoon Mangkhut is the 22nd numbered TC event (no. 1822) in the 2018 typhoon season over the Northwestern Pacific Basin (NPB). It originated around the middle part of the NPB on 7 September and developed into a super typhoon and reached its peak intensity prior to making landfall in Luzon on 14 September, with the maximum sustained surface wind estimated at 70 m s−1 (He et al., 2020a). Mangkhut made landfall near Zhuhai city in China as a strong typhoon on 16 September and penetrated 780 km into mainland China before dissipating. During the typhoon's passage around Hong Kong SAR (hereafter HK), Hong Kong Observatory (HKO) issued Hurricane Signal no. 10 (which represents the highest warning level in this region and indicates that sustained surface winds of 33 m s−1 or greater have been observed) for 10 h, which is the second longest since record-keeping began in 1949. Mangkhut caused extensive and severe wind and flood damage in China, affecting over 4 million people across six provinces. The storm resulted in the collapse or damage of more than 14 000 houses, with the direct economic losses exceeding RMB 14 billion (Li et al., 2022).
Typhoon Saola is the ninth numbered TC event (no. 2309) in the 2023 TC season over the NPB. It originated as a tropical depression on 24 August and gained iconic status as it surpassed Mangkhut in strength. On 30 August, Saola passed over the Babuyan Islands in the northernmost part of the Philippines as a super typhoon. At 22:00 LT on 1 September, the storm traversed Hong Kong SAR, with the central maximum winds reaching 58 m s−1, and prompted the issuance of the highest-level typhoon red warning signal by the China Meteorological Administration (CMA) (Li et al., 2024). Subsequently, Saola continued its westward movement along the coast and eventually made landfall on Leizhou Peninsula in Guangdong province, China. Saola mainly exerted its influence through heavy rains and severe floods. Reportedly, about 1.0 million individuals were evacuated in four Chinese provinces.
Figure 1 exhibits the evolution of the TC track and intensity for Mangkhut and Saola when they moved close to HK based on the best-track data issued by the CMA, HKO, Joint Typhoon Warning Center (JTWC), and Tokyo Climate Center (TCC). Note that the best-track data issued by different meteorological institutes may vary noticeably, especially for TC intensity. Despite such discrepancies, it was observed that (1) Mangkhut moved faster (with a translational speed varying in the range of 29–36 km h−1) than Saola (11–16 km h−1); (2) unlike Mangkhut, the path of Saola stayed closer to the southeastern coastline of China before finally making landfall. with the nearest distance between HK and the TC's center track being ∼30 km for Saola and ∼100 km for Mangkhut; (3) Saola remained a super typhoon when it got closest to HK and Shenzhen, which was more intense than the severe typhoon level for Mangkhut. Actually, from Fig. 1b, Saola was reported to be distinctly stronger than Mangkhut during the landfall period.
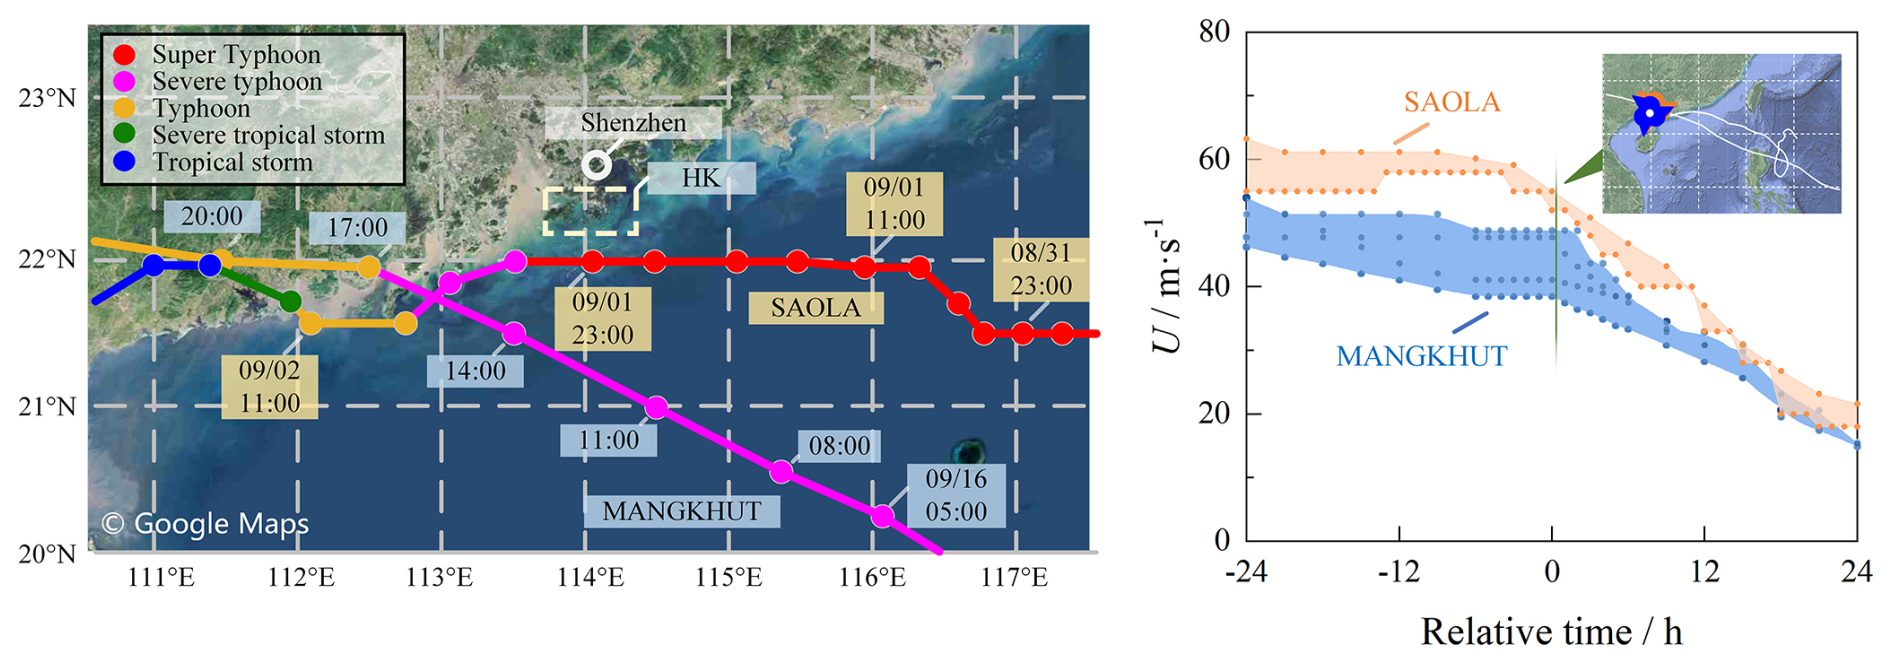
Figure 1Evolution of the track and intensity of Mangkhut and Saola (image © Google Maps). (a) The center track is from CMA. (b) TC intensity in the form of envelopes based on the best-track data issued by the CMA, HKO, TCC, and JTWC. Relative time=0 (from © Google Maps) in (b) denotes the moment when the storms moved closest to HK, i.e., at 14:00 LT on 16 September 2018 for Mangkhut and at 22:00 LT on 1 September 2023 for Saola.
2.2 Devices and datasets
The data adopted in this study include the remote sensing observations via satellites and the field measurements obtained via various ground-based devices that are located in HK and Guangdong province, as shown in Fig. 2. The infrared satellite imagery is sourced from the CIMSS (Cooperative Institute for Meteorological Satellite Studies) database (https://tropic.ssec.wisc.edu/archive/index.php, last access: November 2024), which is procured by Himawari satellite series of Japan. These infrared satellite images offer a resolution between 1.0 and 2.0 km, providing temperature measurements across a wide spectrum from 180 to 310 K at 3 h intervals.
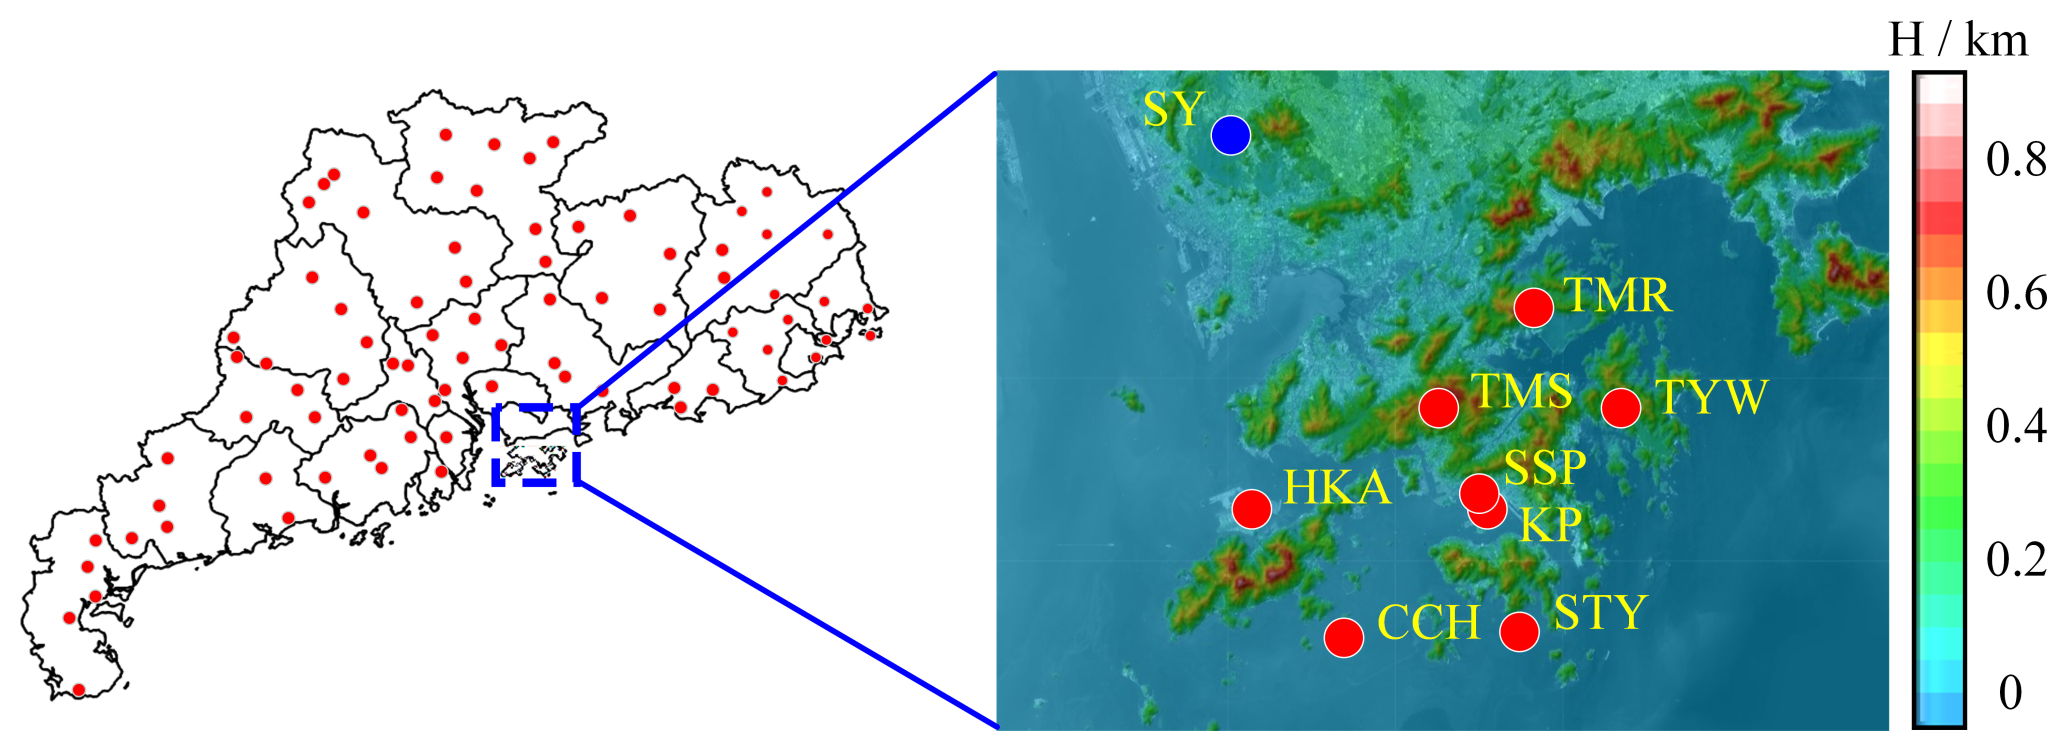
Figure 2Layout of metrological sites in HK and in Guangdong province: the red dots in the left picture correspond to the 86 natural meteorological stations (image © Google Maps).
There are 86 national meteorological stations located in the Guangdong province of China and each of them can provide synchronous records that are updated every 2 min of wind (in terms of horizontal speed and direction), ambient pressure, temperature, and humidity at near ground level. These records are mainly used to quantify the TC pressure field in this study.
There are also dozens of weather stations established in HK and Shenzhen, and this study selects six of them (Fig. 2) to analyze the thermodynamic features and wind characteristics of the two typhoons. Among these stations, SY is located around a suburb terrain in Shenzhen whose periphery is dominated by a long fetch of high-rise buildings; SSP and KP are located in the Kowloon district of HK, which is characterized by built-up terrain; and TMS, CCH, and WGL are situated at the zenith of the Tai Mo Shan mountain (955.2 m above ground level), Cheung Chau Island (71.9 m), and Waglan Island (55.8 m), respectively, in HK. All of the above stations in HK except SSH can provide minute-to-minute updated records of wind (in terms of 1 min mean speed and direction as well as 3 s peak gust within each 1 min period), pressure, and humidity at a near-ground level, while SY and SSP are equipped with Doppler radar wind profilers whose detection range spans from 315 to 9223 m with 202.5 m gate intervals at SSP and from 100 to 5790 m with 60 m (below 2560 m) or 120 m (above 2560 m) gate intervals at SY. The wind profiler records at SSP and SY are updated every 10 and 30 min, respectively. All the collected data were subjected to quality control (QC) procedures before being automatically recorded in accordance with the built-in modules. Meanwhile, additional QC measures were also conducted annually to further improve the credibility and quality of the datasets utilized for the following analysis, in a way consistent with that documented in our previous studies (He et al., 2018). Detailed descriptions of the devices and QC techniques are referred to in He et al. (2016).
Besides the above devices, this study also employs a high-performance Doppler weather radar system to provide ground-based radar echoes during the landfall periods of Mangkhut and Saola (http://www.nmc.cn/publish/radar/guang-dong/guang-zhou.htm, last access: November 2024). The radar system offers a coverage radius of approximately 460 km at about a 10 km height and updates remote sensing records at 6 min intervals. It boasts a fundamental reflectivity detection range from 0 to 75 dBZ coupled with a horizontal image resolution of 1.0 km.
3.1 From a primary-circulation perspective
The primary-circulation structure for a mature typhoon in the horizontal plane has long been known: a calm and cloudless TC eye normally in a circular or an elliptic shape is located around the center of the storm, which is surrounded by a ring of outward-tilting cloud wall (i.e., TC eyewall) where the strongest wind and heaviest rain exists, while rainbands meander outside and continuously transport moisture as well as kinetic energy from peripheral regions to the inner core. The morphological characteristics of each of the TC's primary-circulation components and their interactions may influence the intensity and impact area significantly. Typically, a stronger TC tends to possess a smaller eye and eyewall (He et al., 2020b).
Figure 3 shows infrared satellite snapshots taken at four moments during the landfall periods for Mangkhut and Saola. The grayscale values in the image represent the temperature radiation in the detection area, with darker shades indicating higher temperatures and white denoting the surface with the lowest temperature. As clouds at higher altitudes in the troposphere generally exhibit colder temperatures, lighter-gray values (i.e., brighter clouds) in the images can be interpreted as an indicator of higher-altitude clouds with more intense convection. Note that as the top of a mature TC is usually capped by a shield of dense cloud that is formed by the ice crystals flowing out from the eyewall, one may not be able to observe the detailed primary-circulation structure from the infrared satellite image.
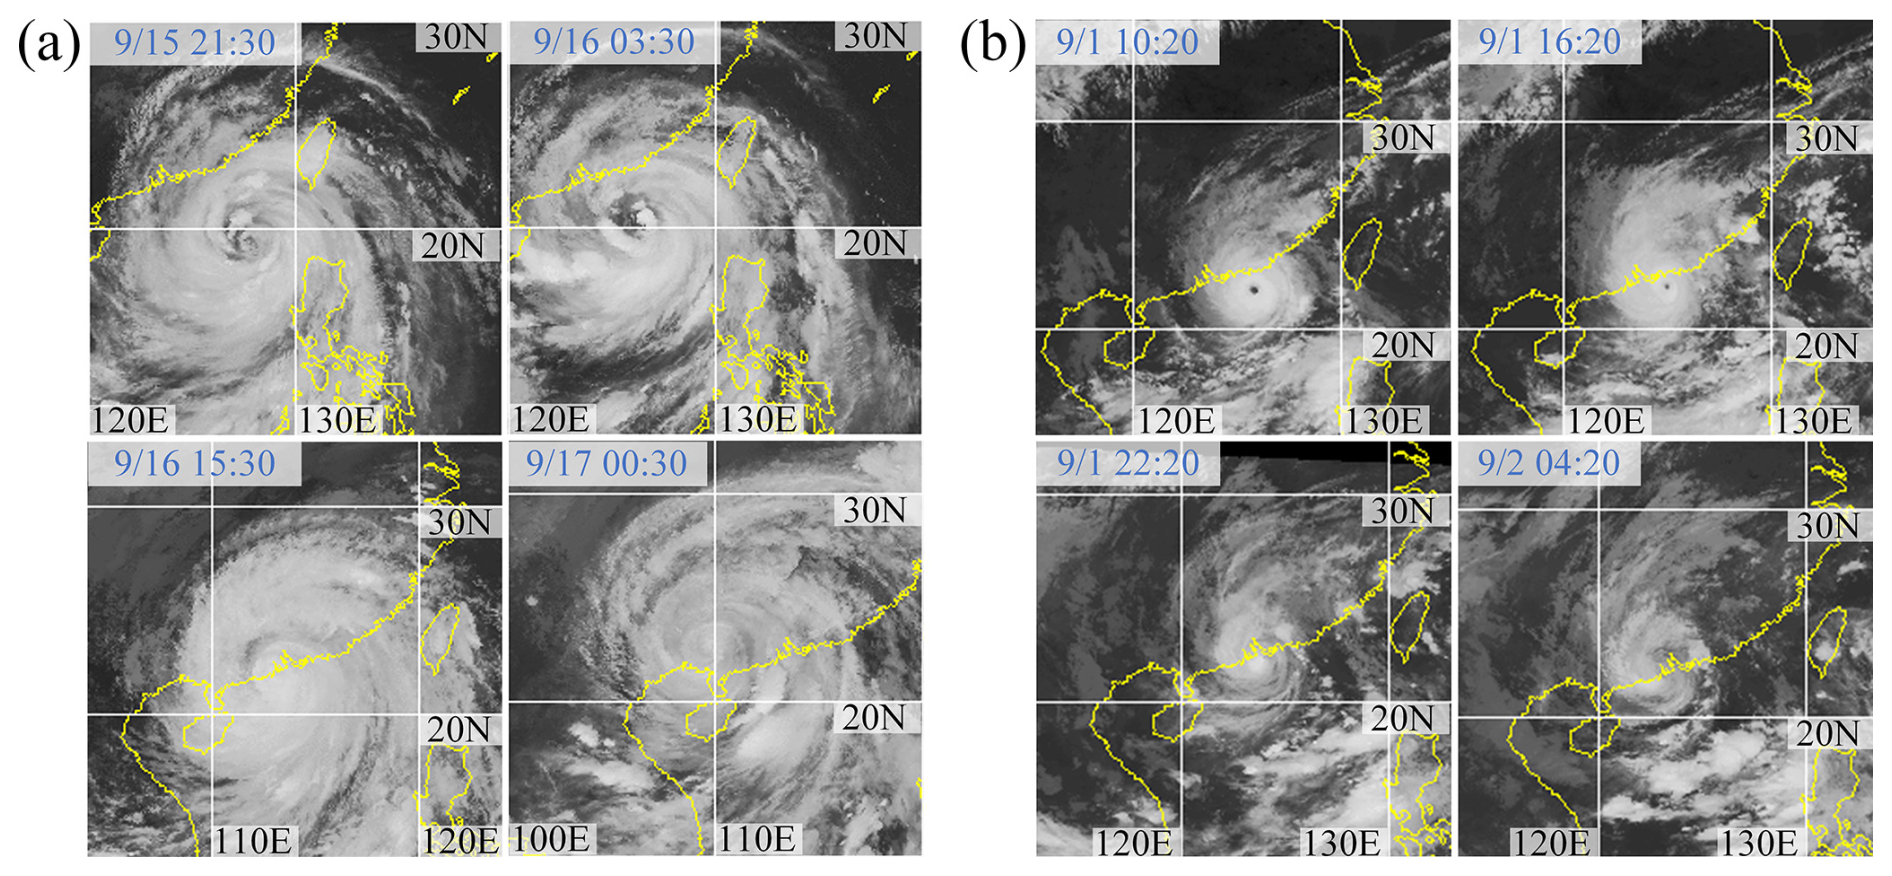
Figure 3Infrared satellite snapshots of Mangkhut (a) and Saola (b) at four selected moments during landfall. Each photo spans an area of 20°×20° or about 2200 km×2200 km (image © CIMSS 2018).
Comparing Fig. 3a and b reveals that (1) the cloud system of Mangkhut was distinctly larger (with a diameter of 15°) than that of Saola (5°), which is consistent with the much wider impact area for Mangkhut; (2) there was an evident typhoon eye (with a diameter of 25 km) surrounded by a ring of a convective tower (corresponding to the eyewall) for Saola before landfall, which indicates the storm's high-level intensity. In contrast, no such typical TC eye and convective tower were observed for Mangkhut. Instead, the central area before landfall was occupied by an irregular region of loose or flimsy cloud that carried some characteristics of the TC eye.
To detail the primary-circulation (in particular the rainband) structure of the two typhoons beneath the cloud shield, Fig. 4 exhibits the echograms from the ground-based weather radar. The reflectance values in each gram indicate the density of cloud/precipitation, with warmer colors corresponding to the stratified rainband complex or the eyewall. As demonstrated, the echograms of Mangkhut were dominated by a large-reflectance-featured stratified rainband complex that spans an area of ∼800 km in diameter, and the maximum reflectance values were dispersed in such a rainband complex. In contrast, the rainbands of Saola were much smaller (∼400 km), and their periphery was dominated by small-reflectance-featured convective cloud cells, while the maximum reflectance values only appeared in the inner core (corresponding to the eyewall). These findings again suggest that Saola was an intense and compact typhoon, while Mangkhut exerted a severe impact in a much wider area.
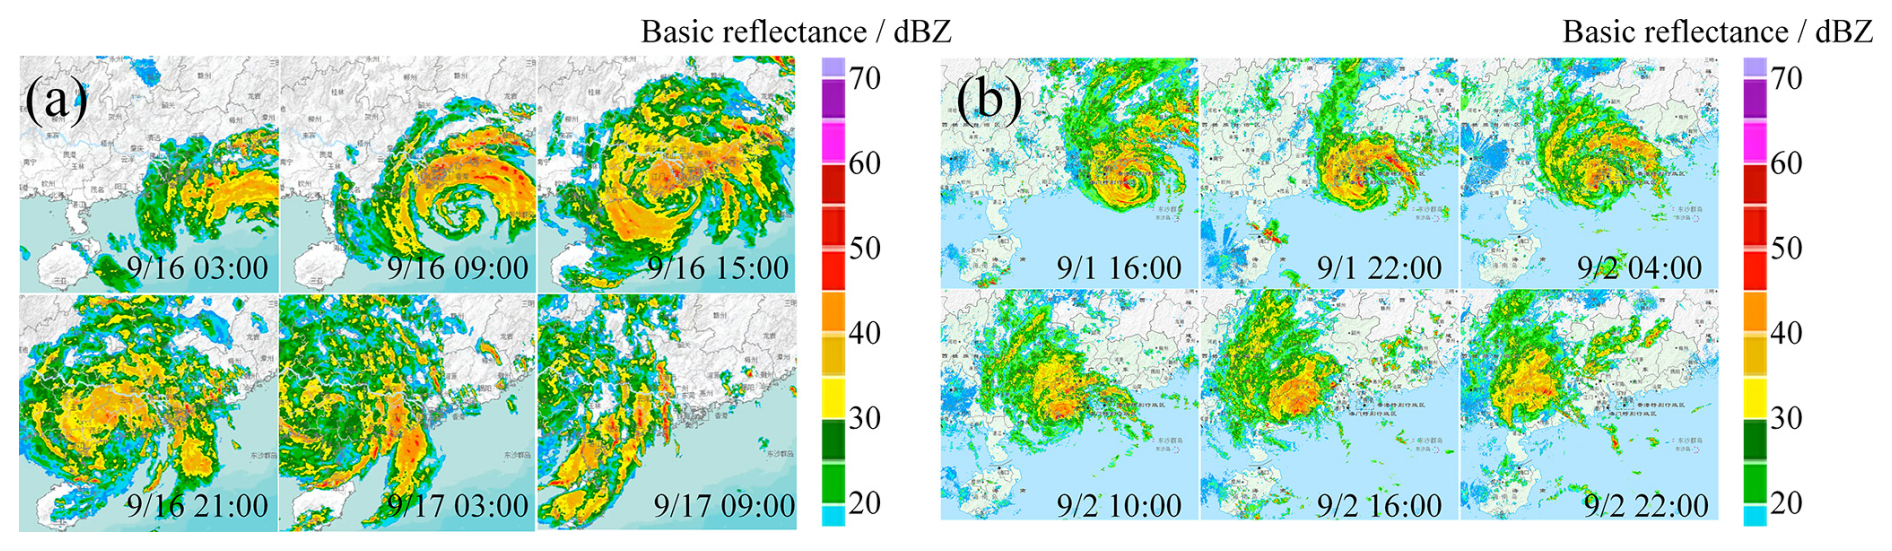
Figure 4Echograms from ground-based weather radar for Mangkhut (a) and Saola (b) (image © CMA). All grams correspond to a geographical area of 1000 km×1000 km (from 108–119° E to 18–27° N).
3.2 From a secondary-circulation perspective
The secondary circulation of TCs can be briefly described as an in-up-out-down overturning movement of flows in the vertical plane (Wu et al., 2021). The inflow layer occupies the lowest several kilometers where the air gains moisture and energy from the sea surface as it flows inward. When the inflows reach the eyewall, they begin to rise and meanwhile release latent heat so that the inner core can sustain a hot tower. When the rising flows approach the TC's top, they begin to go outward. The outflowing air then begins to descend as it reaches the storm's peripheral areas, making the weather at the near surface distinctly hot and dry.
Figure 5 depicts the radial distribution of dry-bulb temperature (Tair) and relative humidity (RH) recorded at three meteorological stations in HK (refer to Fig. 2) during the landfalls of Mangkhut and Saola, where from this point in the article on, negative (positive) values of radial distance mean that the storm was approaching (moving away from) the study sites. Note that as the two TCs did not directly pass through HK, there is an absence of records at the TCs' innermost regions.
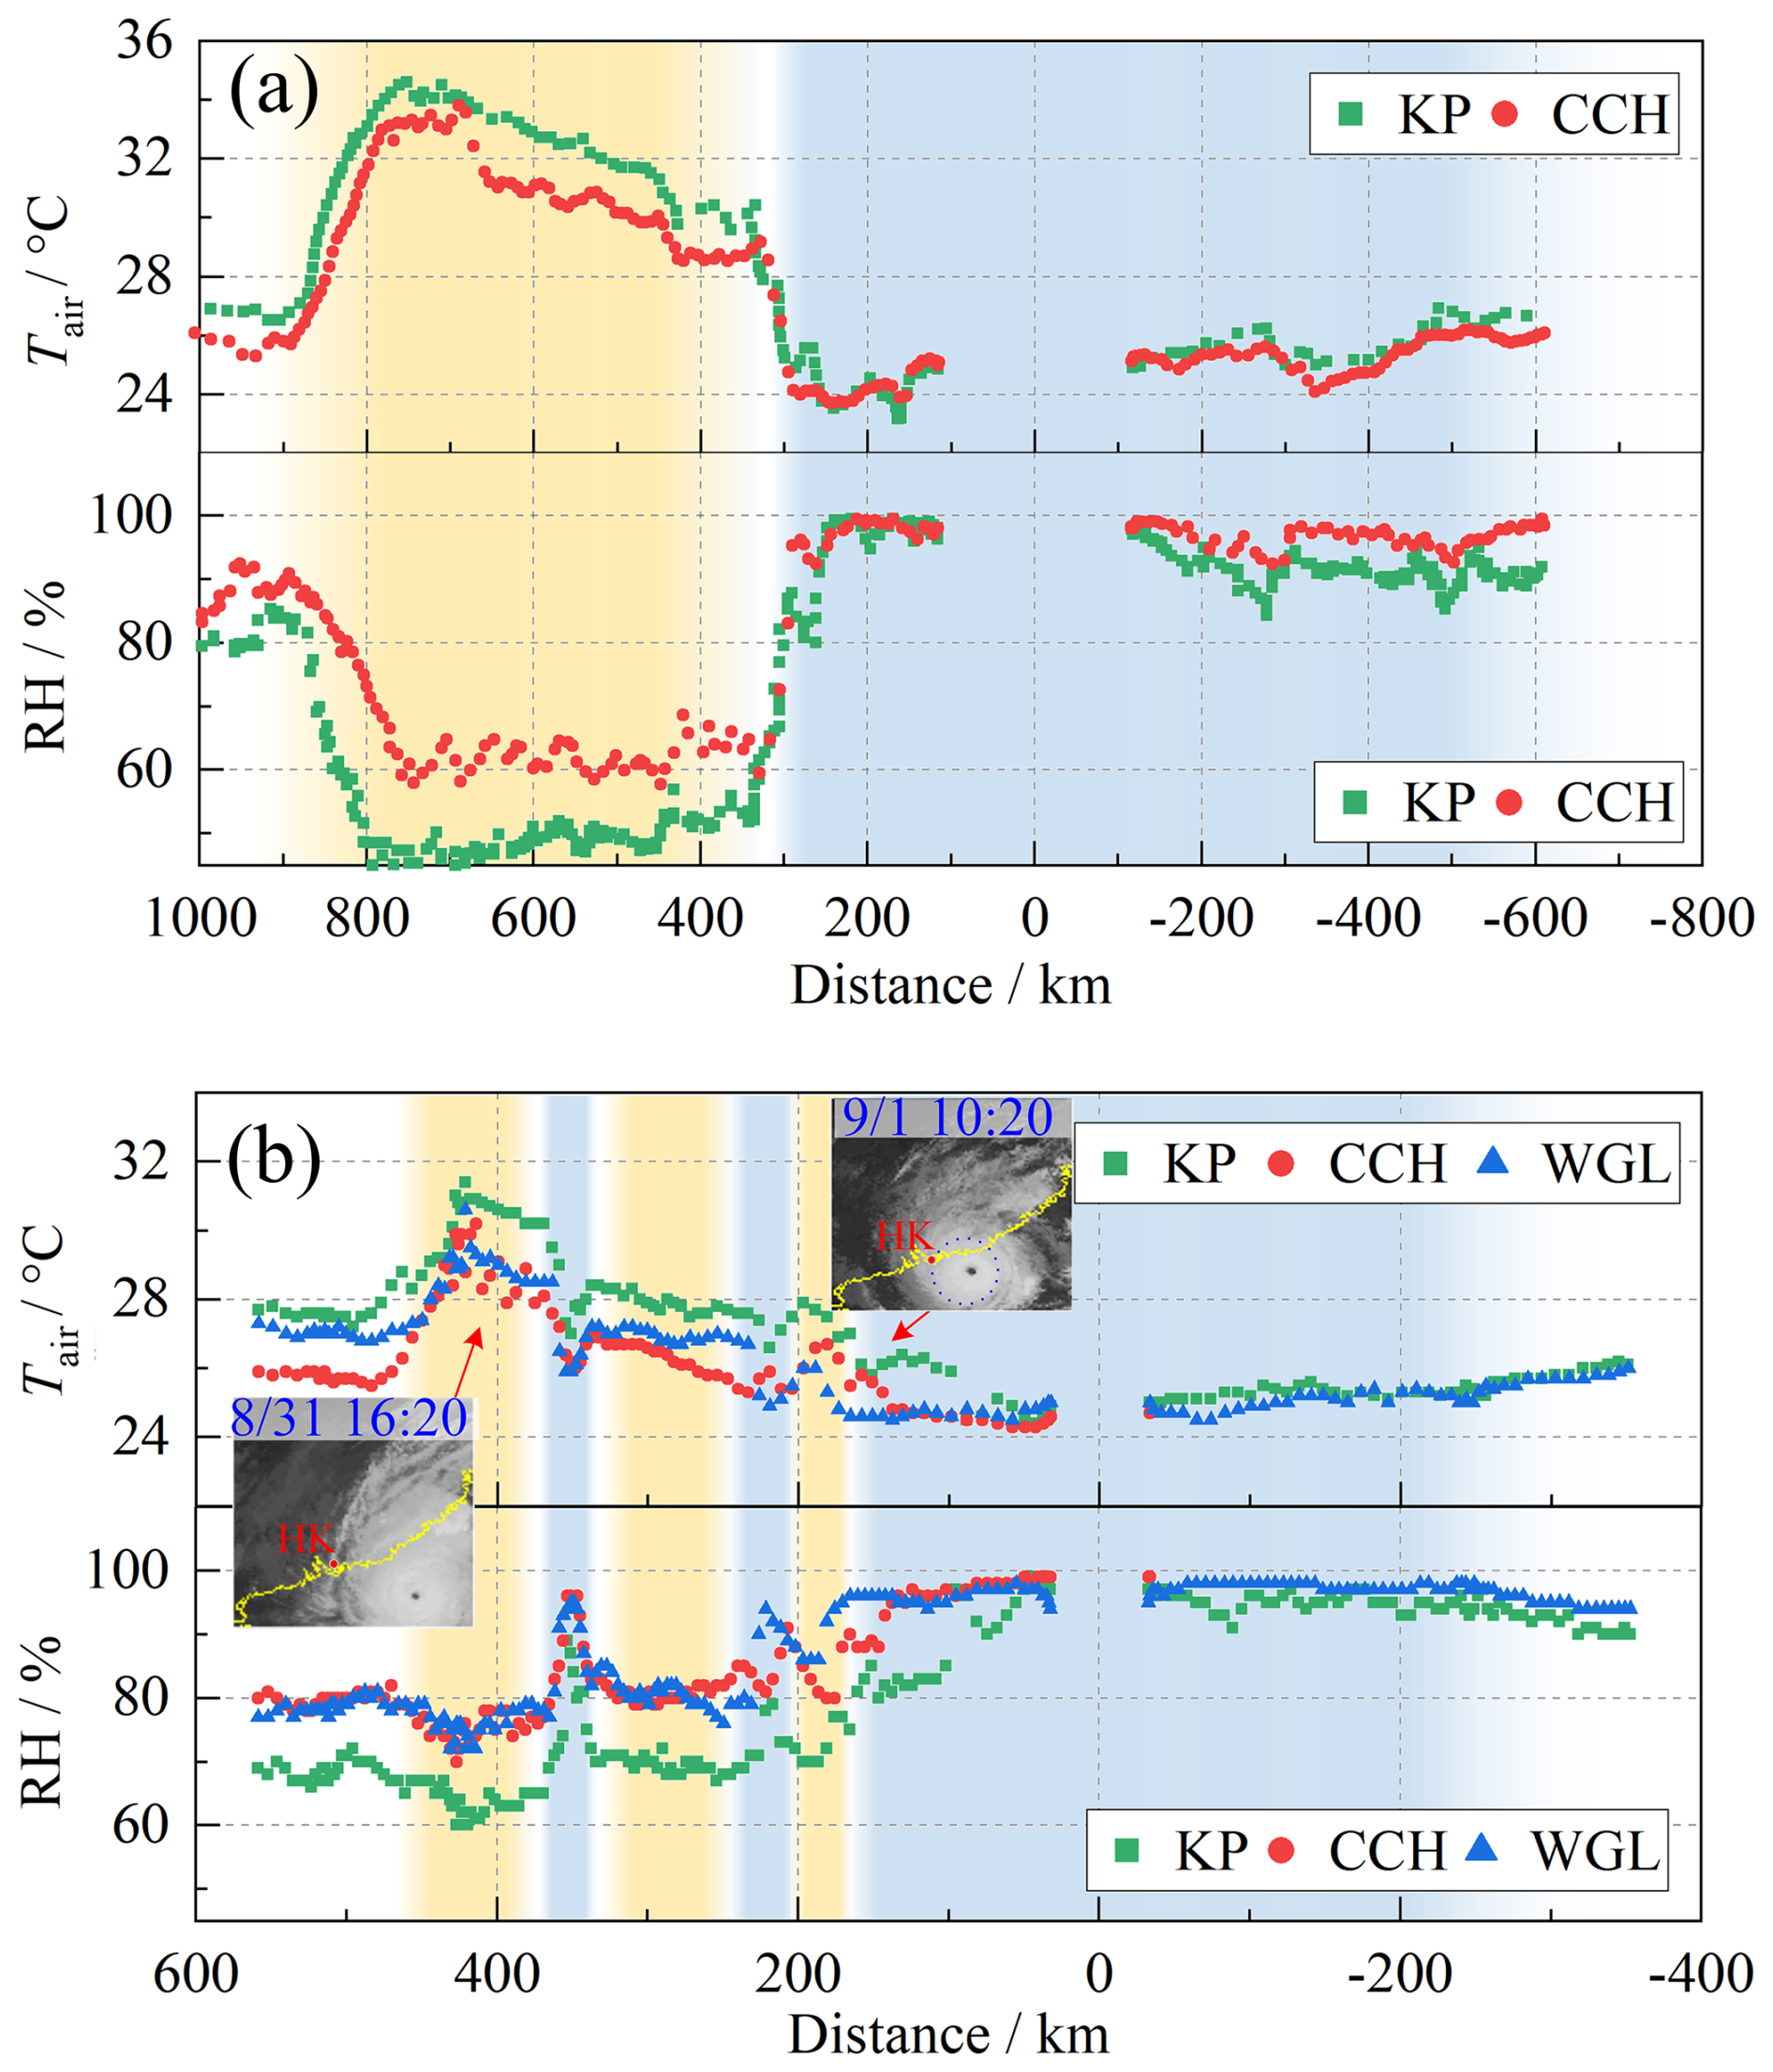
Figure 5Radial distribution of dry-bulb temperature (Tair) and relative humidity (RH) at three sites in HK during the landfall of Mangkhut (a) and Saola (b).
From Fig. 5a, when Mangkhut was 900 km away from the study sites, the measured Tair increased whilst RH dropped sharply, reflecting the fact that the subsidence flows from the storm's periphery started to influence HK. The hot and dry subsidence flows (yellow area in Fig. 5) became most evident when the radial distance was about 750 km, with the maximum change in Tair and RH equal to 8 °C and −30 %, while they minimized when the distance was 300 km, after which the study sites were influenced by stratified rainbands, and the atmosphere became saturated (blue area). Thus, the subsidence flows spanned a radial distance of ∼600 km before Mangkhut's landfall. However, no typical evidence of such subsidence flows was observed after the storm's landfall.
Results for Saola demonstrate some similar features, including the evident increase in Tair and noticeable decrease in RH when the storm's periphery moved close to HK before landfall. The TC air then tended to become saturated as the storm's inner core got close to the study sites. The typical difference between the two typhoons lies in the fact that the observed subsidence effects were much weaker for Saola, from the perspective of not only the much smaller maximum change in Tair and RH but also the considerably limited span of radial distance associated with the subsidence flows. Meanwhile, there were also two episodes before Saola's landfall (with the central radial distances equal to 350 and 225 km) in which Tair decreased and RH increased abnormally. These two episodes are believed to have been caused by the spiral rainbands that impacted the study sites intermittently. In sum, Fig. 6 provides further evidence for the much larger impact area of Mangkhut than of Saola.
3.3 Quantification of the wind-impact area
The impact area of TC wind can be quantified in terms of the radius of maximum wind (RMW), which can be determined via the radial profile model of TC pressure, e.g., proposed by Holland (1980):
where P(r) denotes the mean-sea-level pressure at radial distance r; P0 denotes the pressure at the TC center, ambient pressure; ΔP0 is the difference between the ambient pressure and P0 (or the central pressure deficit); and B is a non-dimensional coefficient that governs the shape of the radial profile.
Figure 6 shows the calculated results of the pressure fields for Mangkhut and Saola via the above profile model based on the thermo-hydro-baro measurements at the 86 national meteorological stations in Guangdong (Fig. 2). From Fig. 7a, the pressure field of Saola varied significantly for r<50 km, beyond which the radial profile tended to level off, reflecting the fact that the large pressure gradient existed only within a limited inner region of the storm; however for Mangkhut, the pressure varied gradually in a much larger radial range. The above observations suggest that strong winds only existed within a limited inner region of Saola, but they were able to remain in a much wider radial range in Mangkhut. Figure 6b shows the time histories of RMW and B around the storms' landfall. As expected, the values of RMW for Mangkhut (on the order of 100 km) were considerably larger than those for Saola (on the order of 10 km) and so were the conditions for B. These findings provide further evidence to support the theory that Mangkhut exerted wind impact in a much wider area.
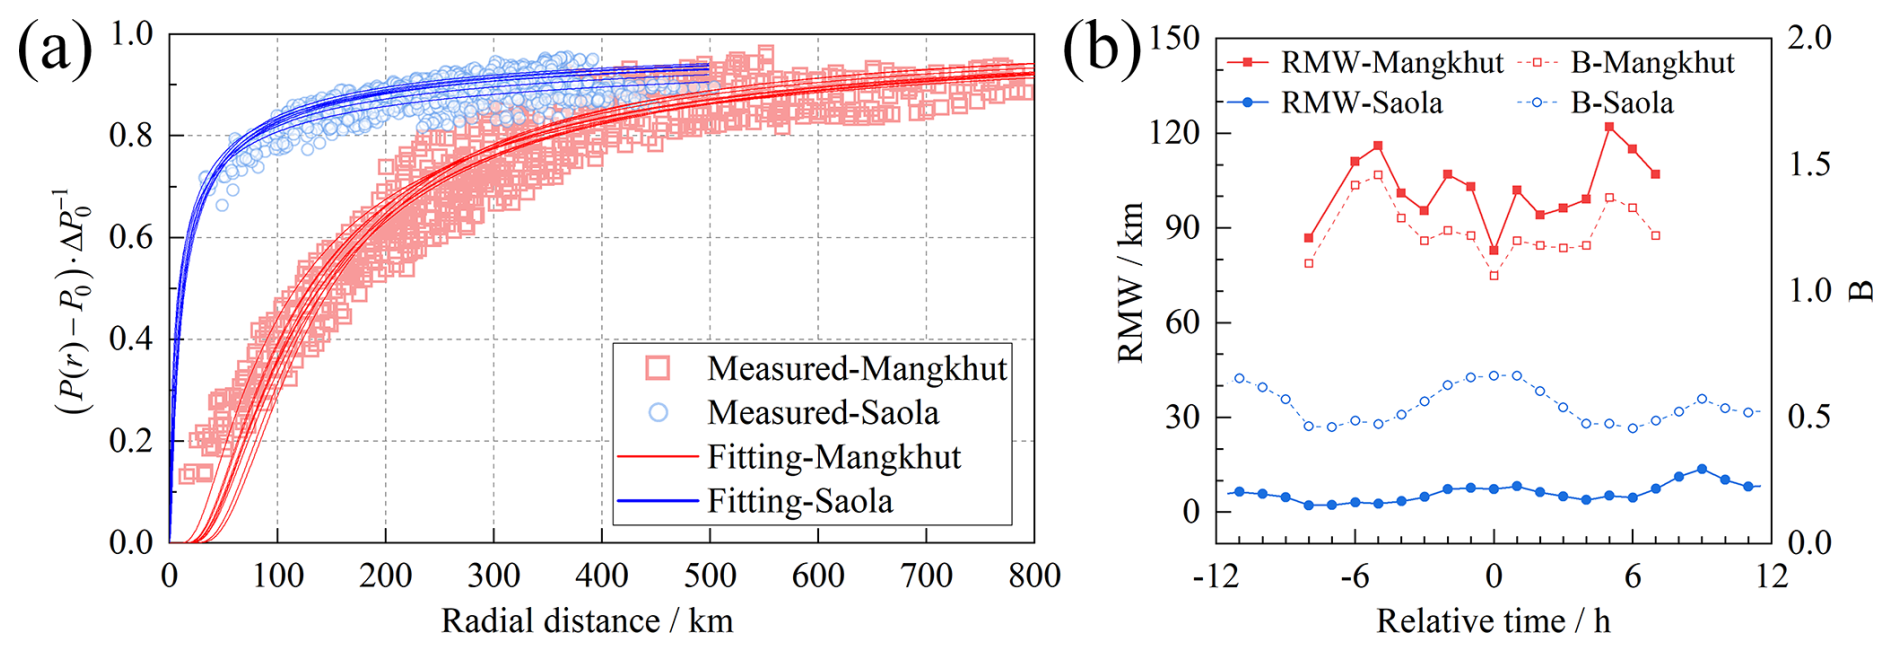
Figure 6Calculated results of the TC pressure fields for Mangkhut and Saola: (a) normalized radial profiles and (b) RMW and B (0 h marks the time when the storm just made landfall).
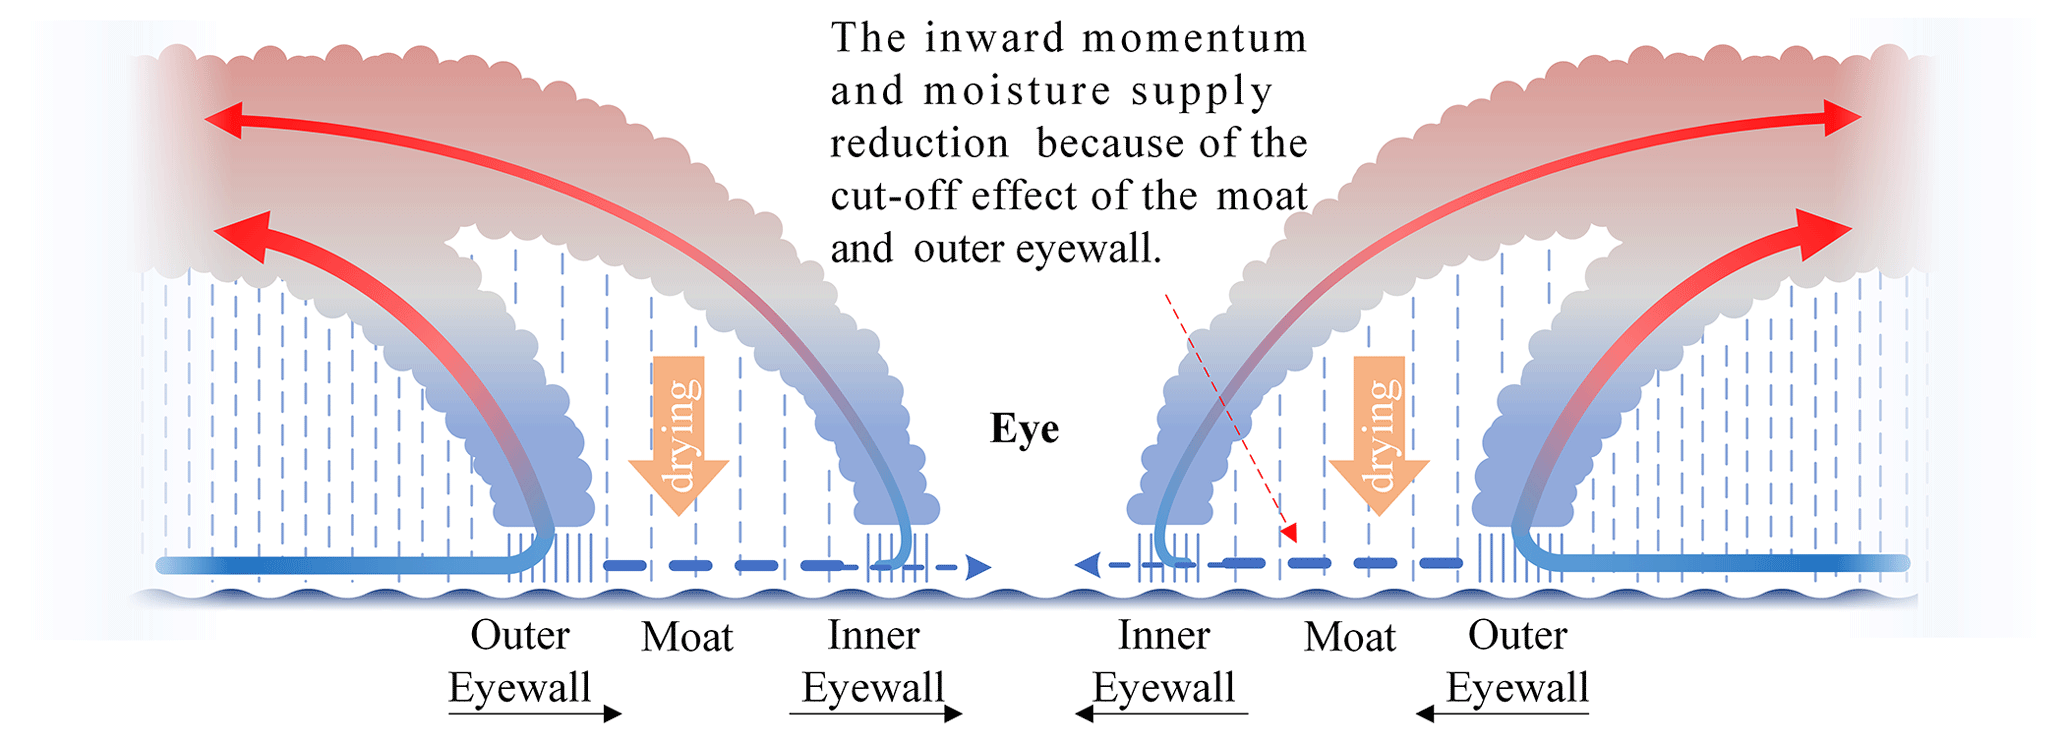
Figure 7Schematic diagram of the concentric eyewall structure and ER. The density of rain lines corresponds to the relative rainfall. Thick arrows indicate the potential flow of water vapor and energy being carried, while thinning, dashed arrows signify that the flow has been obstructed and weakened. Black arrows show the inner and outer eyewalls progressing towards the TC center during the ER cycle. To provide clearer details, the near-surface portion of the eyewall has been enlarged (Houze et al., 2007).
From the above discussions, it is of great importance to quantify the wind-impact area for anti-TC practices. Unfortunately, such information has not been covered in the TC best-track data (which only include the TC center and TC intensity in terms of central pressure and maximum sustained surface wind). Although RMW has been utilized in wind engineering to assess TC hazards, the database of RMW is badly lacking. The values of RMW for TCs over many regions can only be estimated roughly via some empirical formulas that have been established on the basis of TCs over some studied regions. Meanwhile, the RMW is conventionally regarded as exhibiting a negative correlation with central pressure, signifying that the more intense a TC becomes, the smaller the RMW tends to be: a finding consistent with the observations derived from this study.
3.4 Potential reasons for observed discrepancies
In this study, the discrepancies between the two typhoons in terms of intensity and impact area are primarily attributed to the different evolutions of the eyewalls during their development. It is well known that for intense TCs over deep seawater, an outer eyewall may form outside the initial (or inner) eyewall, and the storm demonstrates a concentric eyewall structure (Houze et al., 2007). As illustrated in Fig. 7, between the two rings of eyewall, a moat exists, which plays a role similar to that of the TC eye. The presence of the moat and outer eyewall prevents the influx of water vapor and energy in outer regions from being transferred to the inner eyewall, making the inner eyewall decay. Meanwhile, the outer eyewall tends to shrink and gradually replace the inner eyewall. The above process is termed the eyewall replacement (ER), which has been observed in the evolution of many super typhoons (Wang et al., 2024; Ling et al., 2024). Previous studies have shown that the ER process can affect the TC intensity significantly. Usually, the storm first decays, then recovers, and finally becomes even stronger than its initial status.
Figure 8 presents the ER process of Mangkhut and Saola. From Fig. 8a, Mangkhut exhibited an evident con-centric eyewall structure around 21:30 LT on 14 September when it was to make landfall in Luzon in Philippine.
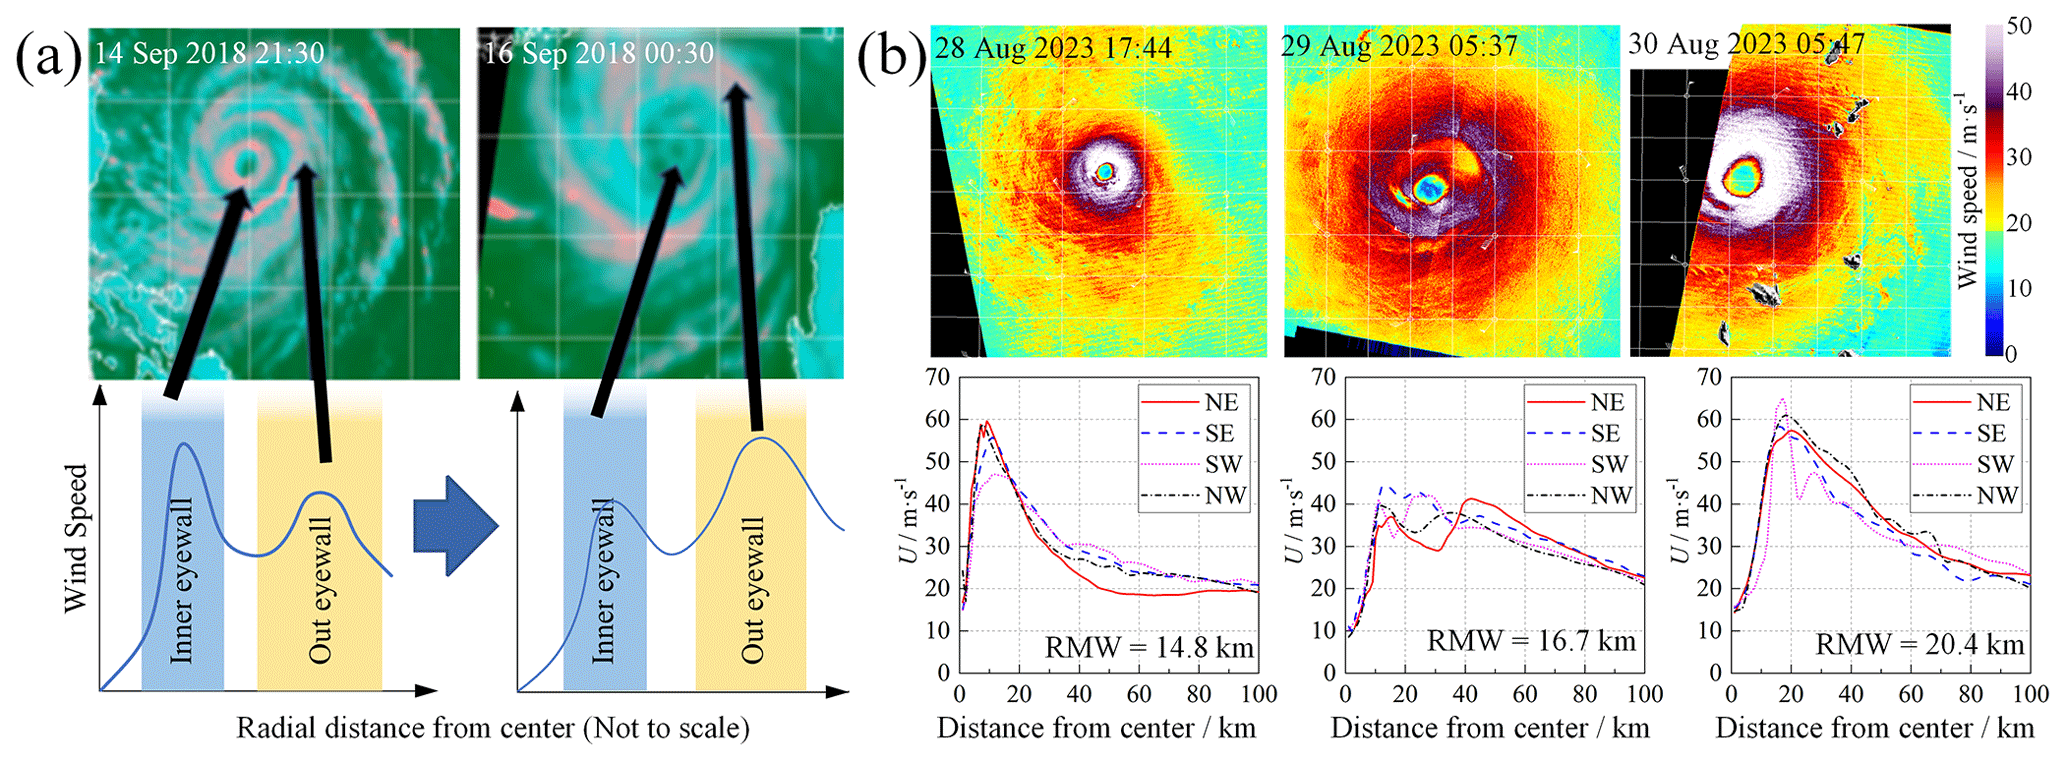
Figure 8ER cycles for Mangkhut (a) and Saola (b) (from https://www.weather.gov.hk/informtc/Mangkhut18/windstructure.htm, last access: November 2024). The cloud image represents radial wind profiles obtained through the conversion of cross-polarized normalized radar cross-section backscatter (from https://www.star.nesdis.noaa.gov/socd/mecb/sar, last access: November 2024).
However, the storm failed to finish the ER cycle, as (a) it first made landfall in Luzon, which destroyed its inner structure (He et al., 2020a), and (b) after the first landfall, Mangkhut moved to the South China Sea and approached the southeast coastline of China where the ambient conditions became unfavorable for further development. Consequently, the inner eyewall tended to dissipate, but the outer eyewall stopped shrinking and finally disintegrated into a pair of rainband complexes. In accordance with the incomplete ER, the maximum TC wind first existed around the inner eyewall and then evolved to appear in a much wider range of the disintegrated outer eyewall. Overall, Mangkhut was weakened, but it exerted wind impact in a much wider area after the incomplete ER process.
For Saola, the detection results from synthetic aperture radar (SAR) reveal a complete ER cycle before the storm's landfall. As demonstrated in Fig. 8b, there was a single eyewall at 17:44 LT on 28 August 2023 at a distance of ∼10 km from the TC center, and the maximum wind was estimated to be 60 km s−1. On 29 August, the concentric eyewall structure appeared, and there were two peaks in the radial profiles of TC wind at 10 and 40 km, which corresponded to the inner eyewall and outer eyewall, respectively. The maximum wind was estimated to be 43 m s−1, which is markedly lower than that on 28 August. The ER cycle ended on 30 August, when there was only one peak in the radial wind profile at a distance of less than 20 km, which corresponded to the outer eyewall that had already replaced the initial inner eyewall. The maximum TC wind was estimated to be 64 m s−1, which is a bit stronger than that (60 m s−1) at the beginning of the ER process. Overall, the successful completion of the ER process enhanced Saola's intensity.
The varied statuses of the two typhoons after the aforementioned ER processes can be also seen from the satellite images shown in Fig. 3. For Saola, the compact TC eye existed almost until the storm made landfall. However, for Mangkhut, the central area before landfall was occupied by an irregular but much larger region of loose or flimsy cloud, which should correspond to the eye and decayed inner eyewall.
There are also some other potential reasons for the discrepancies between the two typhoons. One may be correlated with the TC track. As illustrated in Fig. 1a, the track of Saola was much closer to the coastline of China before it made landfall than that of Mangkhut. As the drag effect was distinctly larger over land than over seawater, the parts of Saola outside of the inner core tended to be more severely weakened. Meanwhile, as discussed previously, when Mangkhut passed through the Philippines, the inner structure disintegrated in a much wider region. In contrast, Saola was not influenced by such effects, which allowed the storm to remain compact. Another influence factor is the TC translational speed, which has been shown to be able to influence the TC intensity noticeably. An appropriate translational speed allows a TC to absorb energy and water vapor from the sea surface, whilst either a too large or a too small translational speed goes against it. As introduced previously, the translational speeds of the two typhoons before landfall varied in a range of 29–36 km h−1 (Mangkhut) and 11–16 km h−1 (Saola). The one for Mangkhut was a bit too large for the storm to recover in strength.
4.1 Mean vertical profile
The vertical profiles of TC wind during the landfalls of Mangkhut and Saola are examined based on the remote sensing detection from the Doppler radar wind profilers (DRWPs) at SSP (in HK) and SY (in Shenzhen). Figures 9 and 10 present the evolution of the 30 min mean horizontal wind speed U (Fig. 10) and direction θ (Fig. 11) with respect to the radial distance (r) between the study site and the contemporaneous TC center. The radial distances of ±115, ±141, ±40, and ±65 km in figures denote the closest distances between the TC tracks and the study sites.
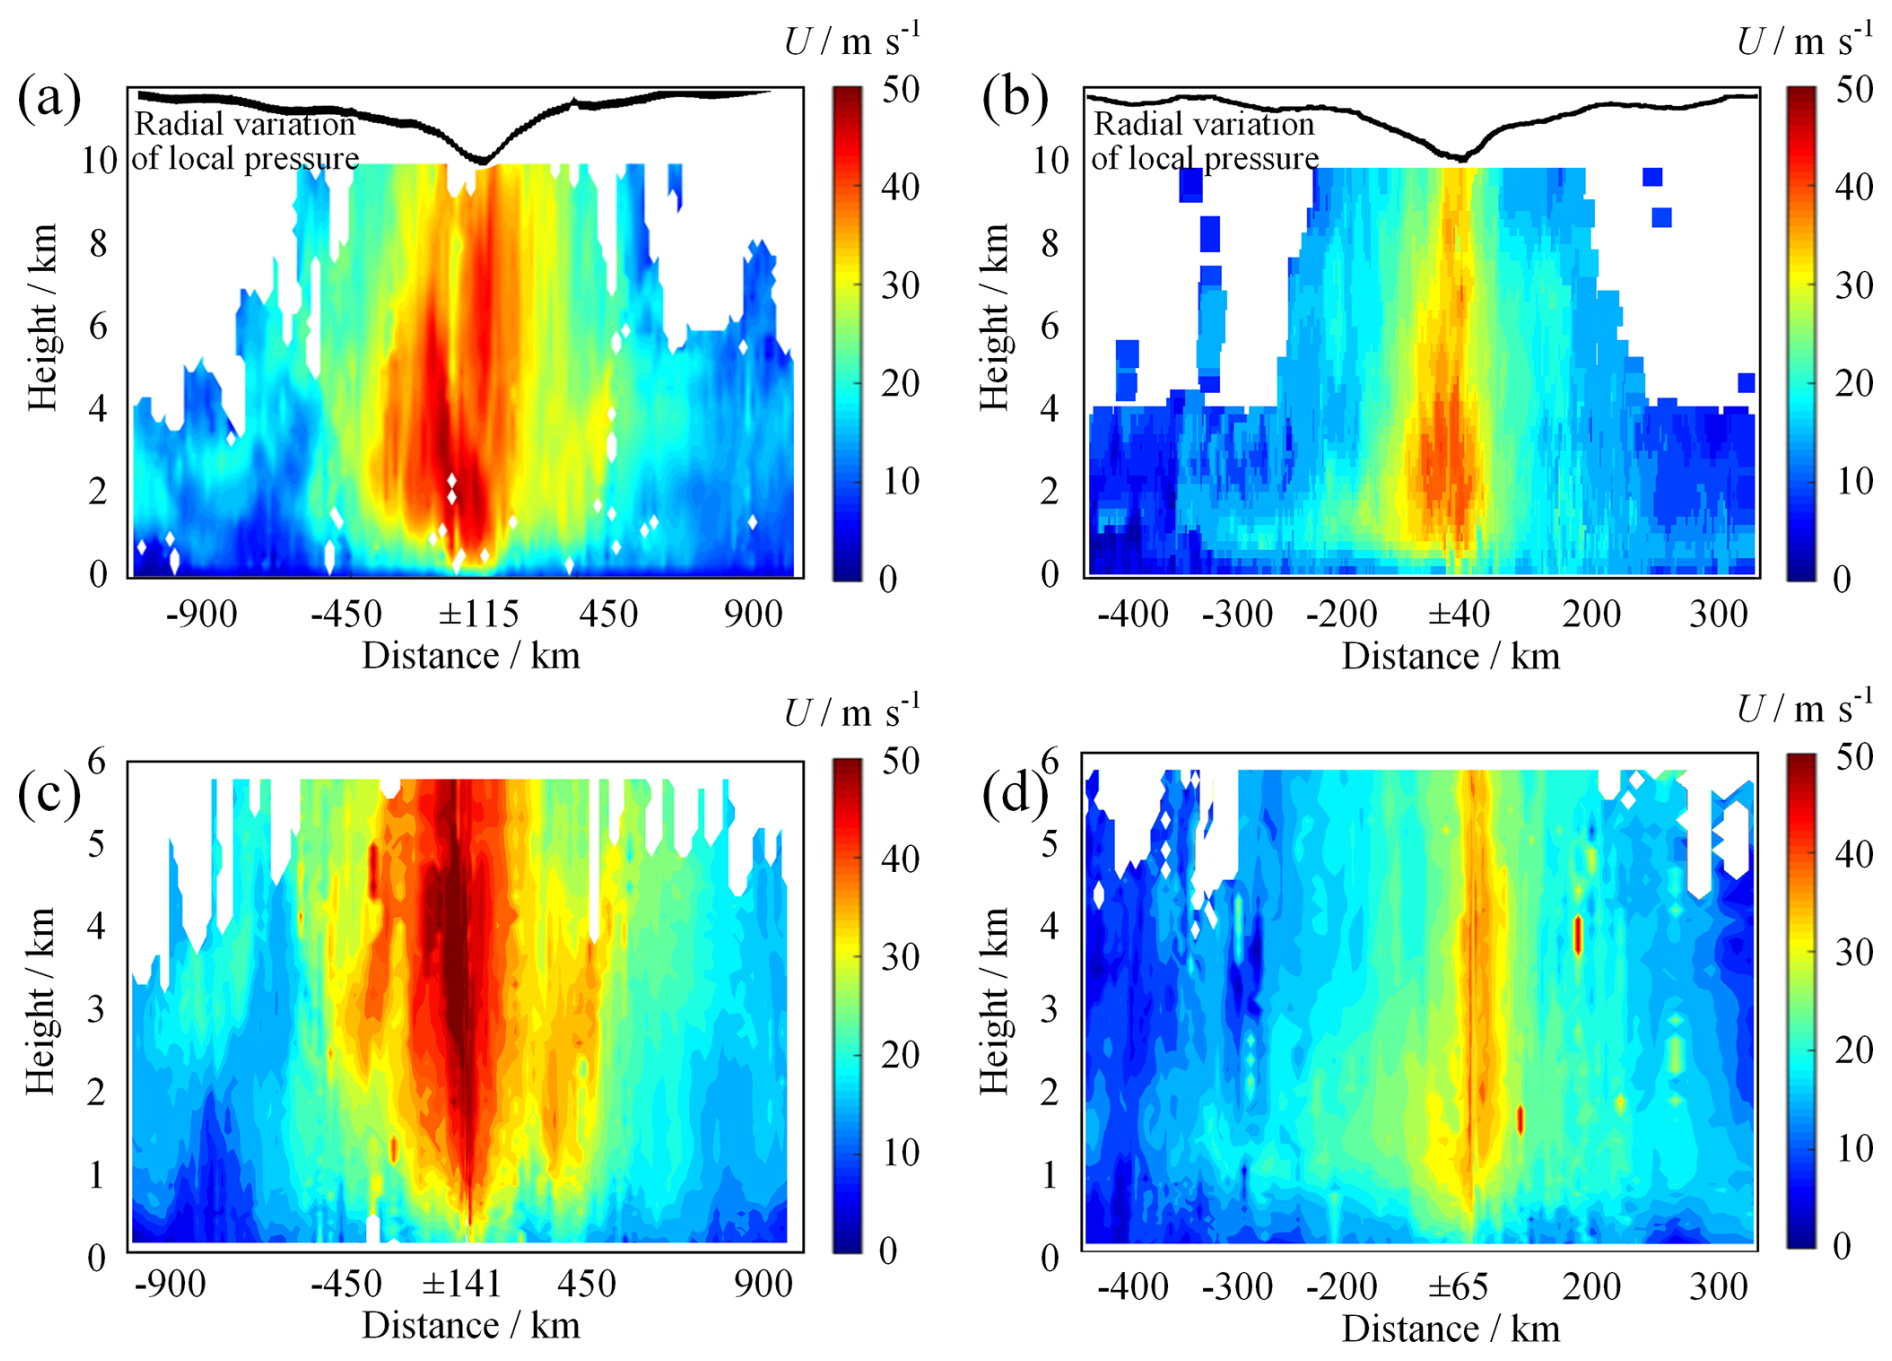
Figure 9Vertical profiles of 30 min mean horizontal wind speed as a function of radial distance – (a) Mangkhut at SSP, (b) Saola at SSP, (c) Mangkhut at SY, and (d) Saola at SY.
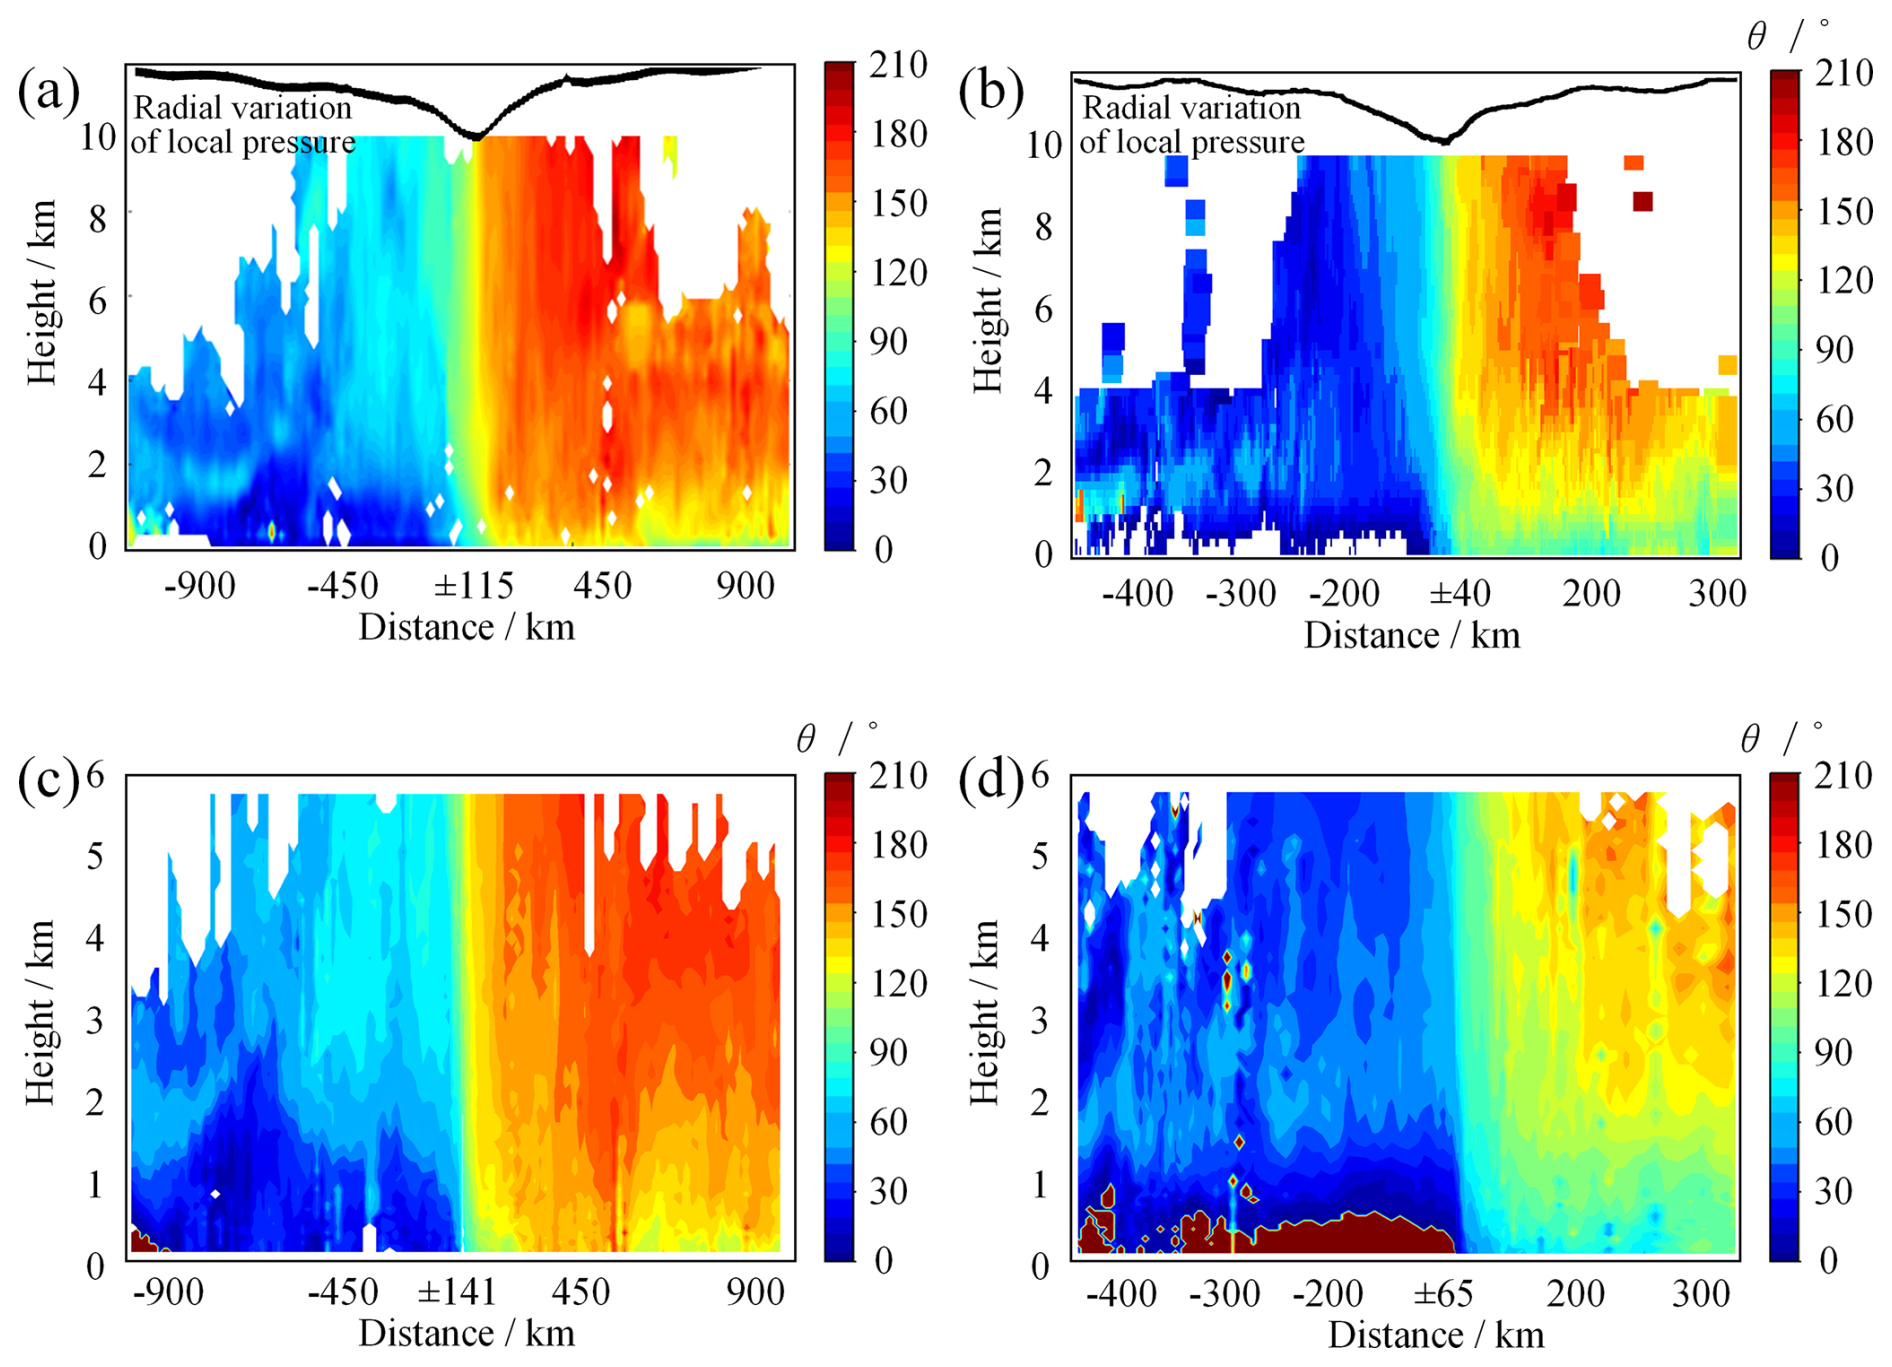
Figure 10The same as Fig. 9 but for wind direction (θ) – (a) Mangkhut at SSP, (b) Saola at SSP, (c) Mangkhut at SY, and (d) Saola at SY.
Figure 11 depicts the results of nominal vertical speed W and the associated signal-to-noise ratio (SNR-W). Note that the values of W from a DRWP under rainy conditions should be interpreted as the falling speed (or roughly the intensity) of raindrops. It is also noted that SNR-W can be utilized to determine the depth of the mixing layer (which serves as a characteristic length of the depth of the atmospheric boundary layer) and the location of the melting layer (He et al., 2020b).
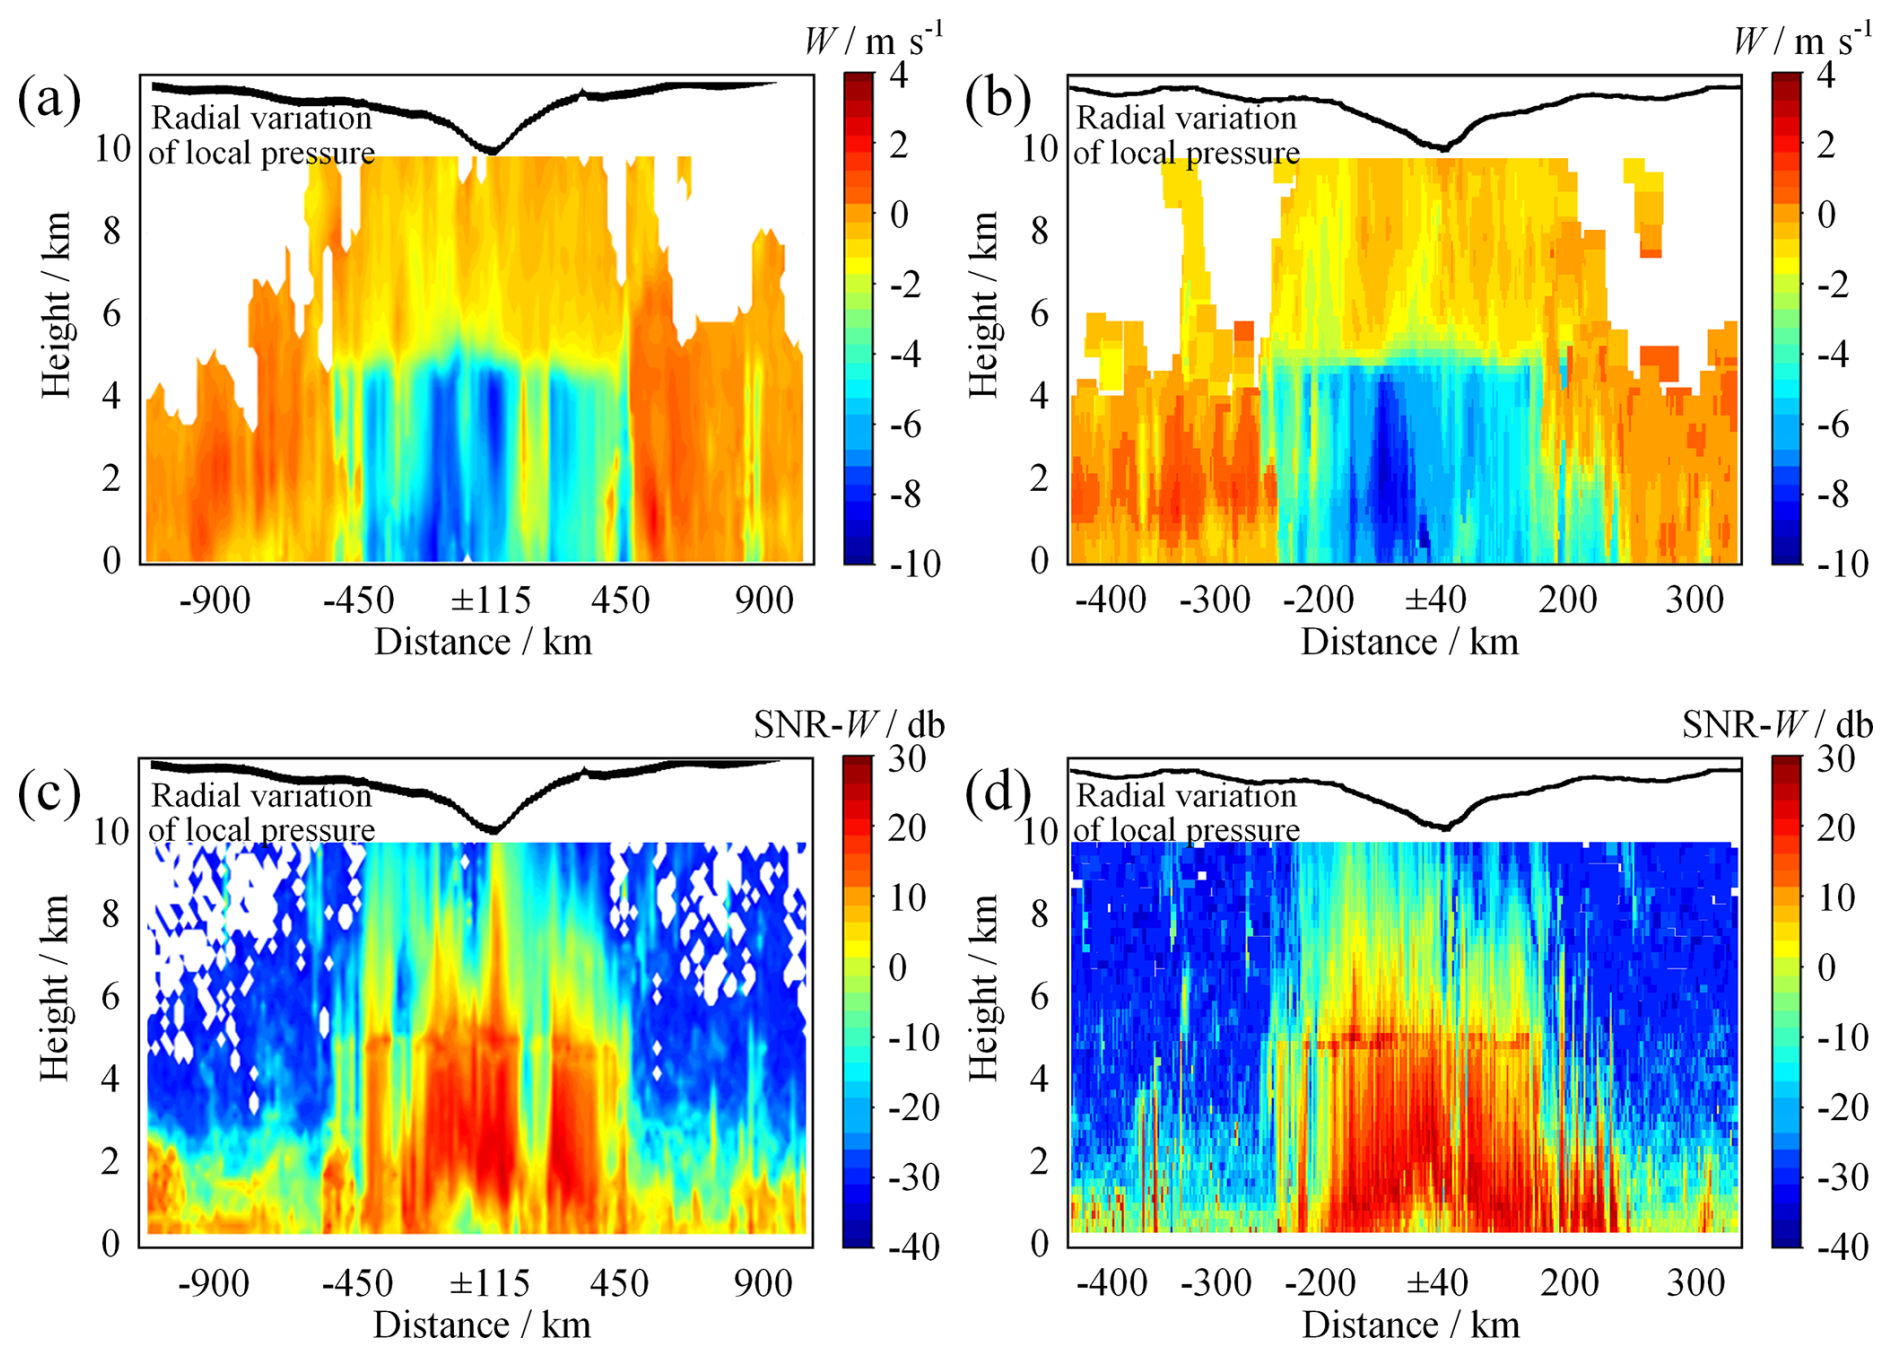
Figure 11Vertical profiles of nominal vertical wind speed (W) and the associated signal-to-noise ratio (SNR) at SSP – (a) W for Mangkhut, (b) W for Saola, (c) SNR for Mangkhut, and (d) SNR for Saola.
Results shown in Fig. 11 suggest the existence of a melting layer at ∼5 km. The precipitation below this layer was dominated by fast-falling raindrops, whilst that above it was dominated by slowly falling ice crystals. The radial area with respect to the TC center at the study site below 5 km can be basically divided into three portions according to W: the inner portion dominated by torrential rain (about for Mangkhut and for Saola), the outer portion with light or no rain (outside about for Mangkhut and outside about for Saola, corresponding to the TC periphery that was governed by convective cloud cells), and the middle portion governed by intermittent strong-to-moderate rainfall. Each of the portions for Mangkhut was considerably larger than the portions for Saola, which reflects the much wider impact area of Mangkhut. It is important to note that while this method of zonation carries a degree of subjectivity, it remains representative of our understanding of the horizontal structure of the two typhoons. It can be also seen from Fig. 11c and d that the depth of the mixing layer in the outer portion for Mangkhut was on the order of 3 km compared to 2 km for Saola. The larger mixing layer depth of Mangkhut can be reasonably explained by the stronger secondary circulation, especially in terms of subsidence flows for this typhoon, as discussed in Fig. 5.
Scrutinizing Figs. 9a, b, and 10a, b in conjunction with Fig. 11 reveals that the inner portion contained the strongest wind, and the wind direction within this portion changed significantly (exceeding 100°), with the wind before and after the TC passage dominated by north and southeast flows, respectively. In contrast, the wind in the outer portion was quite weak, although the wind for Mangkhut was relatively stronger than that for Saola owing to its more remarkable subsidence flows. Overall, as Saola was more compact and intense than Mangkhut, the TC wind during the passage of Saola changed more sharply with respect to radial distance.
It is interesting to find from Fig. 9 that the TC wind in the inner portion for Mangkhut at SY was stronger than that at SSP, whilst the wind for Saola at SY turned out to be smaller than that at SSP despite the fact that SY was located consistently farther away from both typhoons (about 25 km). As discussed previously, the incomplete ER process resulted in a much larger RMW for Mangkhut. We speculate that although SSP was located closer to the TC center, SY should be closer to the maximum wind of the storm. However, as Saola finished the ER cycle, it became considerably compacter, and both stations were located well outside of Saola's maximum wind. Since SY was farther away from the TC center, the wind there should be weaker.
To detail the TC wind field, Fig. 12 presents the vertical profiles of 2 h mean horizontal wind speed measured by the DRWPs. Figure 12a and b correspond to the results at SSP during the passages of Mangkhut and Saola, respectively. Figure 12c and d compare the measured profiles against the stipulations in the national wind load code of China (GB 50009-2012, 2012) associated with four categories of terrain conditions. For both typhoons, the vertical profiles demonstrate a low-level-jet (LLJ) structure. The LLJ is a band of strong winds frequently observed in tropical cyclones, typically occurring in the near-surface layer (Li et al., 2019b). This feature differs significantly from the traditional depiction of wind profiles, which assumes unchanged winds above the gradient height. Meanwhile, the LLJ height where the maximum wind appears evolved noticeably during the landfall period. The value is found to vary from 1.5 km to over 3 km, which is distinctly larger than the gradient height recommended in the wind load code (300–550 m according to the terrain category). From Fig. 12c and d, a remarkable difference exists between the measured profiles and code stipulations. Apparently, using such wind codes for anti-TC design or resilience assessment of buildings (especially high-rise buildings) may result in significant estimation errors.
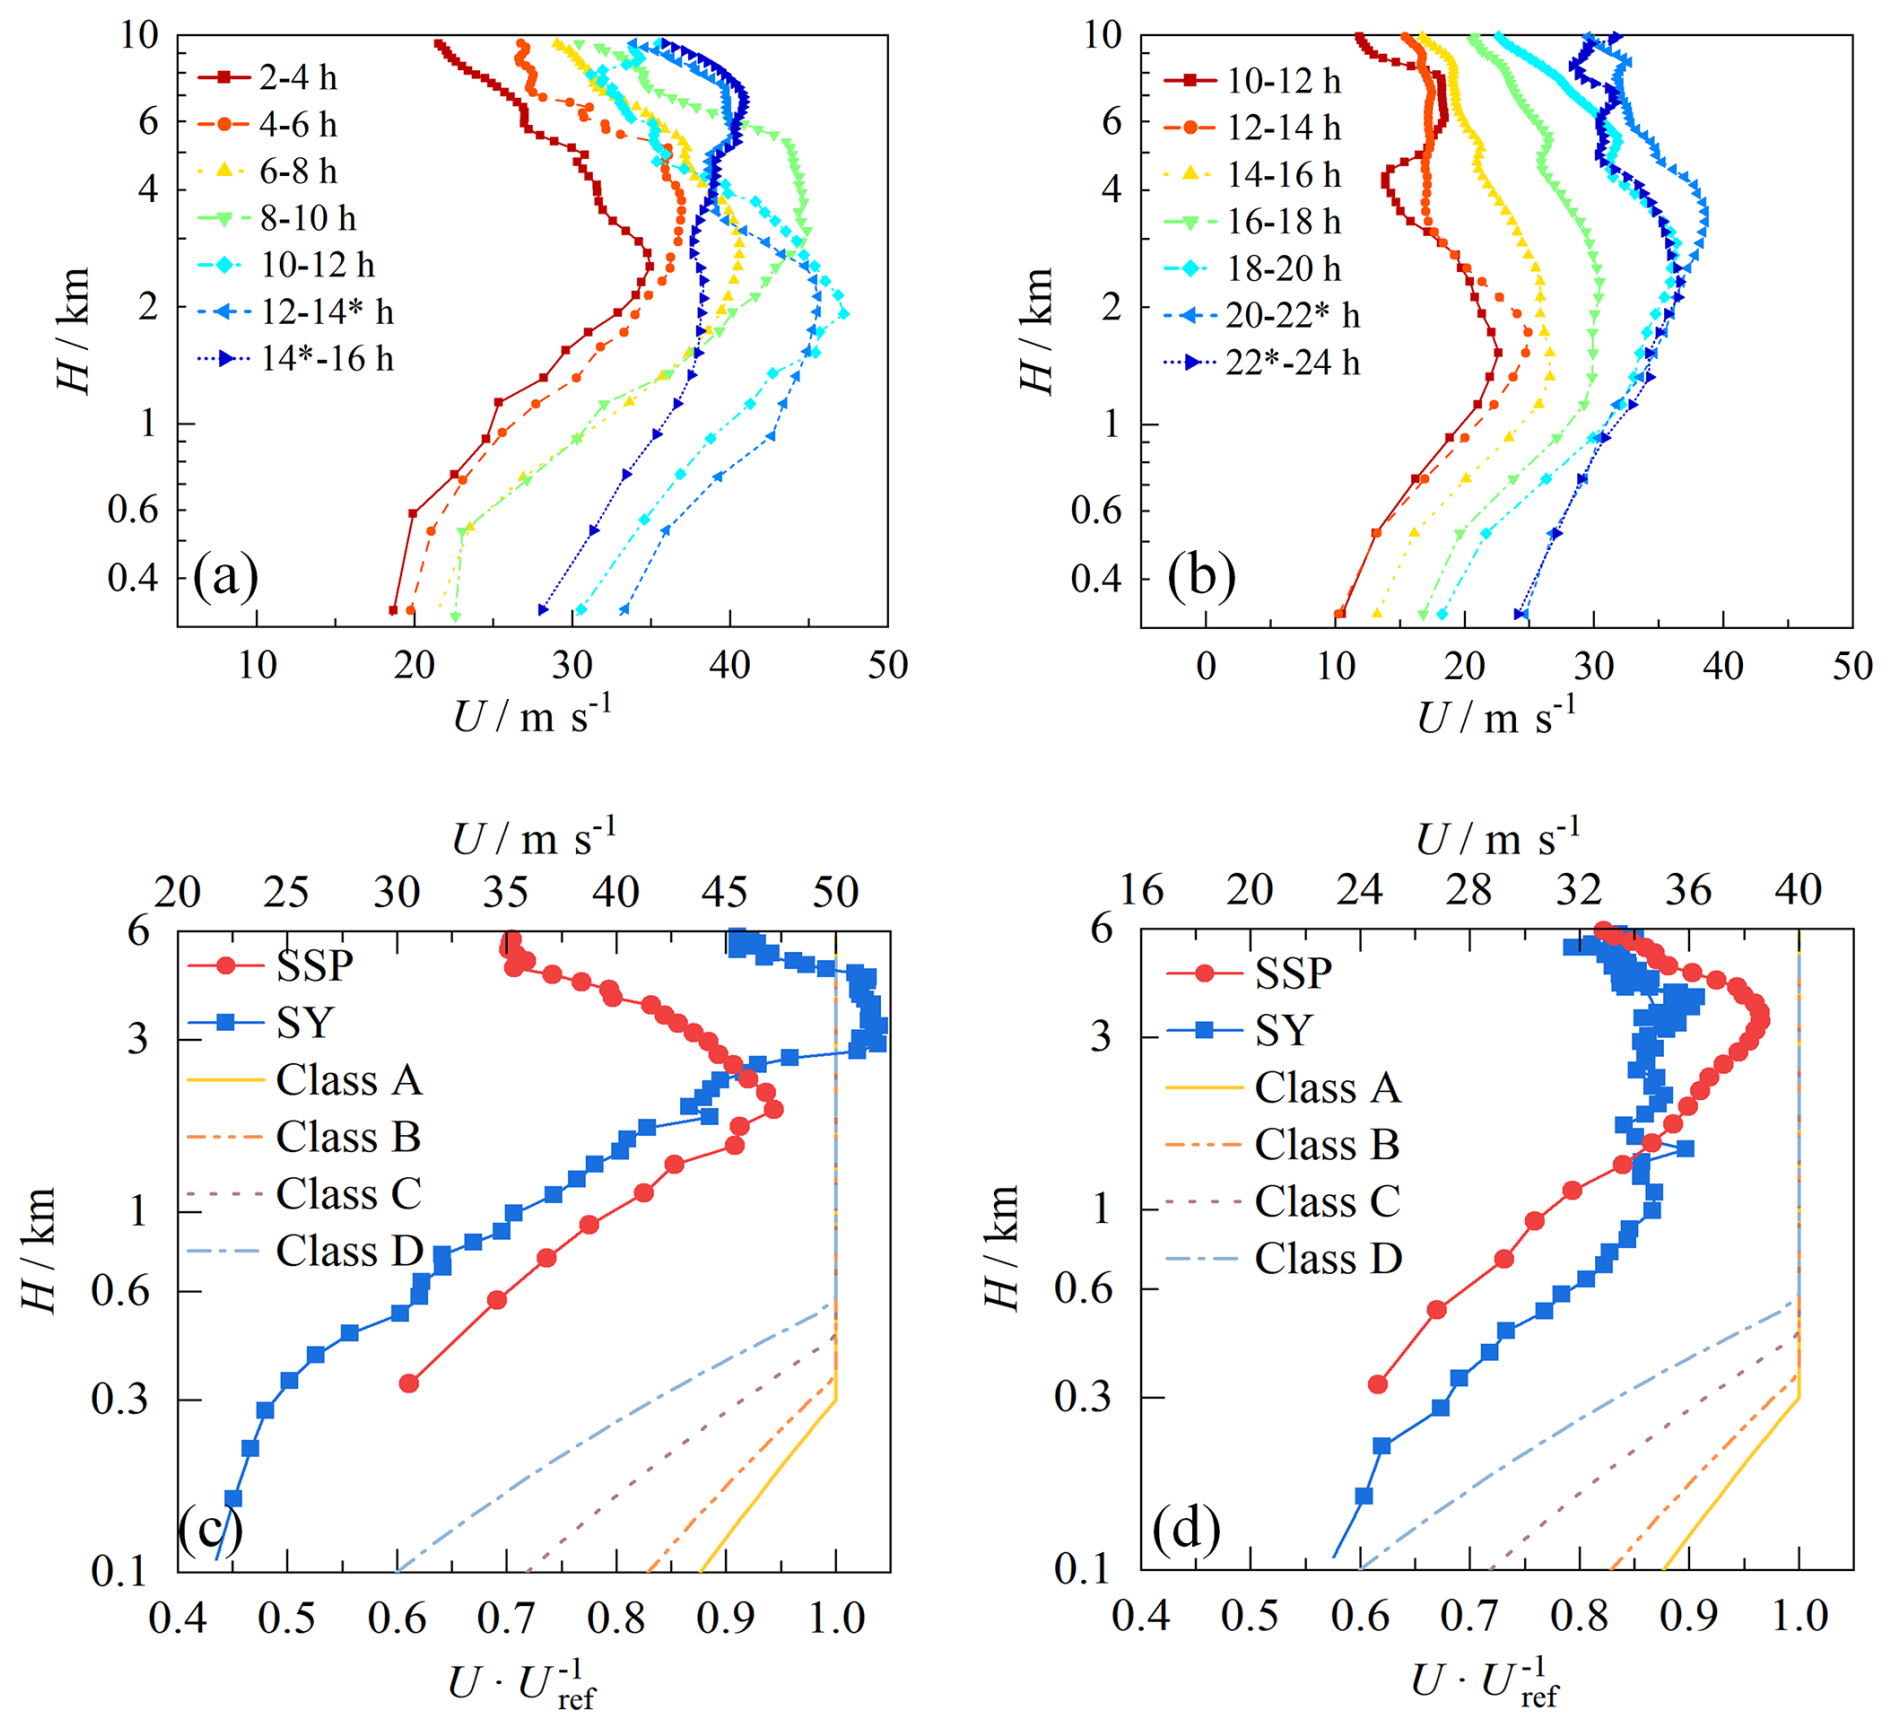
Figure 12Vertical profiles of 2 h mean wind speed — (a) the results at SSP for Mangkhut, (b) the results at SSP for Saola, (c) profiles containing the maximum wind at SSP and SY during Mangkhut compared to stipulations in the wind load code of China, and (d) similar to (c) but for Saola. The numbers 14* and 22* in panels (a) and (b) indicate the landfall moments of Mangkhut (14:00 LT) and Saola (22:00 LT).
4.2 Gradient wind
Gradient wind is very important for analyzing boundary layer wind. In practice, one can first calculate the gradient wind field as it is simpler and more deterministic and then deduce boundary layer wind based on the results of the gradient wind (Meng and David, 1997). Thus, the estimation accuracy of the TC gradient wind directly affects the computational accuracy of the TC boundary layer wind.
Gradient wind is also frequently used to convert between boundary layer winds in various terrain categories, where the gradient wind above different terrain setups is usually assumed to be unchanged. Based on the assumption of unchanged gradient wind, He et al. (2014) developed a standardization method to convert the measured surface wind into its counterparts under a reference condition (i.e., mean wind speed at 10 m above the terrain with a roughness length of z0=0.03 m). The validity of the standardization method has been verified under strong monsoon conditions, but its effectiveness in TC situations remains to be further examined.
Given the pressure field quantified by Eq. (1), the TC gradient wind can be computed as follows:
where Vg signifies the gradient wind speed with respect to the TC direction offset angle α and the radial distance r, UT denotes the TC translational speed, f represents the Coriolis coefficient (f=2Ωsin (ϕ), symbolizes the Earth's angular velocity of rotation, and φ denotes latitude), and ρ indicates air density. It is important to note that since this study does not focus on near-surface conditions, the formula does not consider frictional effects due to turbulence.
The results calculated via the above model are compared against the measured gradient winds, which are recognized as the maximum U below 3 km in each mean vertical profile from the DRWPs, as shown in Fig. 13a; Umax represents the measured maximum wind speed, which means the gradient wind speed. The measured gradient winds are also compared with their counterparts obtained via the standardization method developed by He et al. (2014), as shown in Fig. 13b, where Ustand represents the normalized gradient wind speed and UDRWP denotes the measured results. It is important to note that owing to the influence of super-gradient winds, the measured wind velocities frequently surpass the true gradient winds (Kepert, 2001a). The investigative outcomes presented by Kepert and Wang (2001) suggest that this disparity might potentially exceed a magnitude of 10 %.
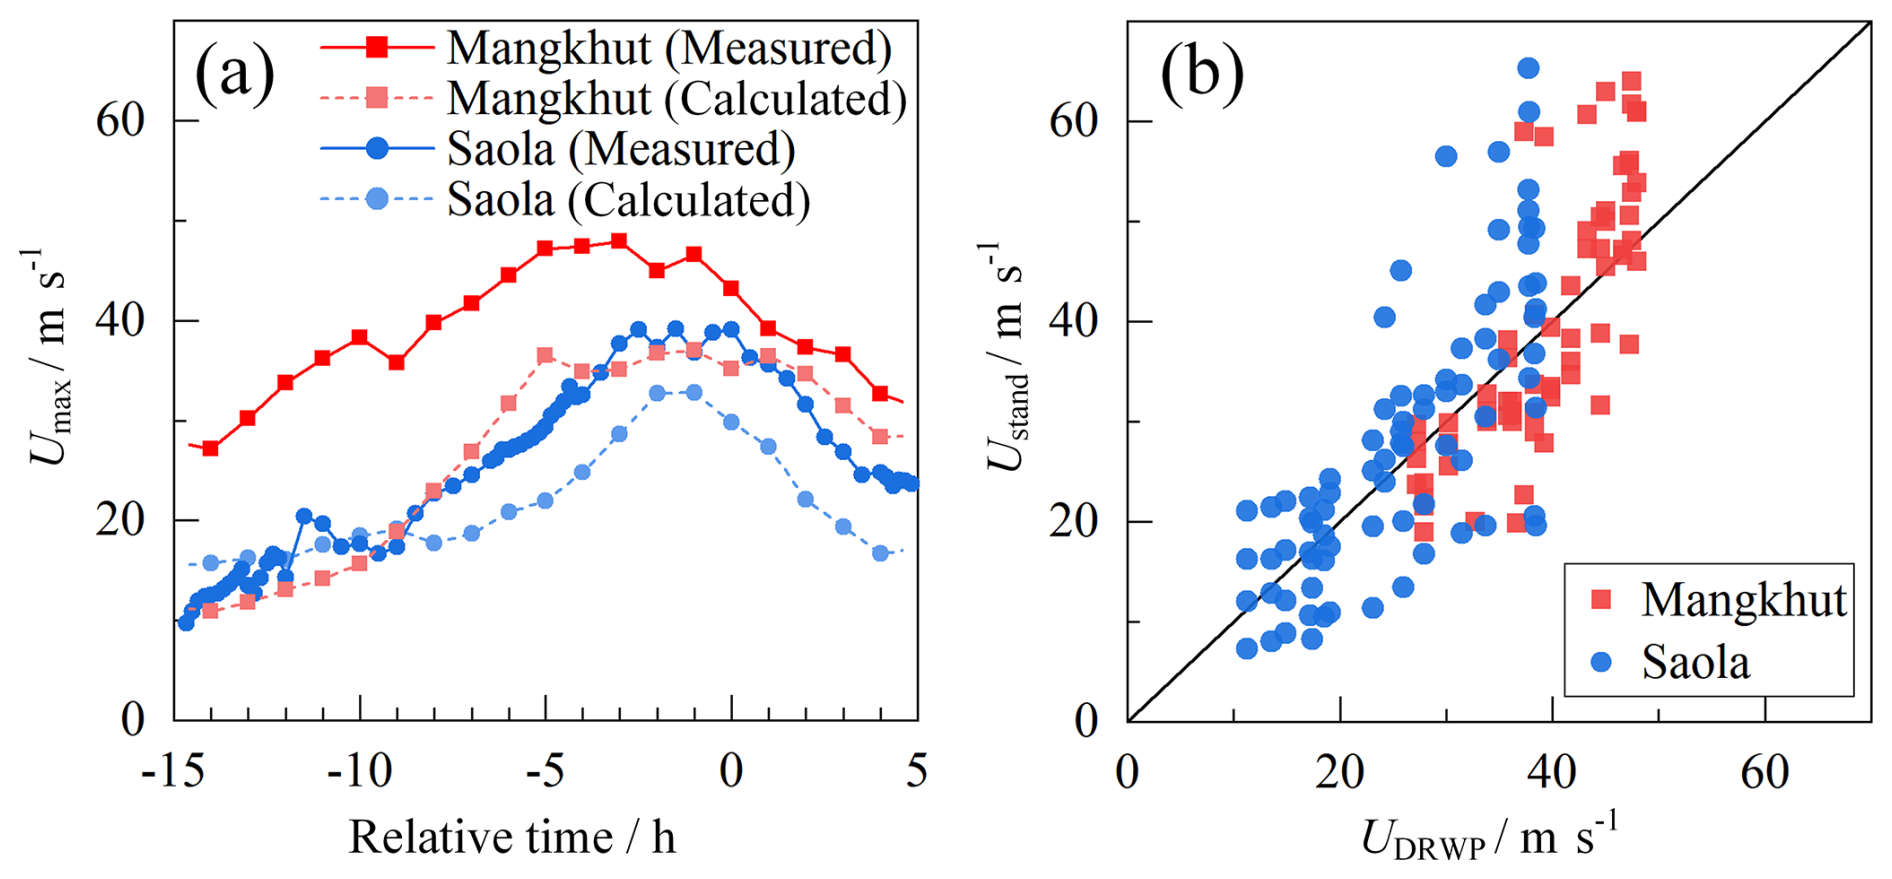
Figure 13TC gradient wind measured by DRWPs compared to calculated results (a) and those deduced via the standardization method (b).
As illustrated in Fig. 13a, the calculated results agree better with the measured gradient winds for Saola than with those for Mangkhut. Note that super-gradient wind exists widely in the eyewall and rainband regions of TCs, which manifest as a LLJ in the TC vertical wind profile (Kepert, 2010). While the low-level jet within a typhoon is not directly induced by super-gradient winds, the latter significantly enhances local momentum transport and increases turbulent mixing within the wind field, leading to a further enhancement of the low-level jet. This phenomenon partially accounts for the discrepancies between the calculated results and the measurements shown in Fig. 13a. Super-gradient winds are characterized by actual wind speeds that exceed those predicted by geostrophic balance theory and are typically observed in the eyewall and rainband regions of tropical cyclones (Kepert, 2010). In this context, the LLJ (low-level jet) manifests as an intense wind band in the lower atmosphere. Notably, the vertical wind component (W) plays a critical role in tropical cyclones by influencing thermal structure, momentum transport, and inertial centrifugal force, indirectly promoting the formation of super-gradient winds. Therefore, Eq. (2), which does not account for the vertical wind component (W), may contribute to the model's inability to fully reproduce the observed characteristics of super-gradient winds. However, the measured results for Mangkhut are too large compared to the calculated values, and considerable errors should exist in the calculated gradient wind. On the one hand, the effects of the concentric eyewall or ER may not be neglected for this typhoon during the study period, but Eq. (1) does not account for such effects. On the other hand, as highlighted in the investigative outcomes presented by He et al. (2021), the pressure field of Mangkhut demonstrated asymmetric features when the storm came close to the coastline of China, which cannot be depicted by Eq. (1). Overall, the calculation errors are largely attributed to the inaccurate reproduction of the TC pressure field using Eq. (1), except for the super-gradient effect.
From Fig. 13b, the results of the gradient wind deduced via the standardization method basically agree with the measured gradient winds for wind below , which reflects the applicability of the assumption of unchanged gradient wind (or the standardization method developed) in such situations. However, under even stronger wind conditions, the two kinds of results start to differ markedly, suggesting that the assumption of unchanged gradient wind and therefore also the standardization method become inappropriate. Actually, the standardized gradient wind here is calculated by multiplying the measured surface wind by a corresponding correction factor (i.e., K2, as reported in He et al., 2014), but the standardization results (including the values of K2) presented in He et al. (2014) were computed on the basis of field measurements collected during strong monsoons. As discussed previously, TC winds differ from monsoon winds, especially in the TC's inner region where the LLJ feature as well as the gradient of TC wind field along radial distance become evident. Thus from an engineering standpoint, one should take great care when assuming unchanged gradient wind and converting between TC surface winds with varied terrain setups in a way similar to the method for monsoons.
Based on field measurements collected from a variety of devices, this study compares the structural features and wind characteristics of two intense typhoons, with a highlight focused on the intuitively abnormal correlations between the TC intensity and the associated impact area. Potential reasons for the abnormal correlations have been presented, and some useful insights for engineering practices for floating offshore wind turbines (FOWTs) have been drawn. The main findings and conclusions are summarized below.
- 1.
Saola was more intense but more compact than Mangkhut. During the landfall period, the maximum TC strength of Saola exceeded 60 m s−1, compared to for Mangkhut. However, Mangkhut exerted its impact over a much larger area from both the primary-circulation and secondary-circulation perspectives. Specifically, Mangkhut had a huge cloud system whose diameter exceeded 1500 km, and the stratified rainband complex spanned ∼800 km. In contrast, the diameter of Saola's cloud system was about 500 km, and the rainbands occupied an area of ∼400 km, the primary portion of which was constrained within an even narrower inner region. Meanwhile, Mangkhut resulted in considerably stronger (in terms of radial span and the maximum change in Tair and RH) subsidence flows at the study site than Saola did, which again reveals its intense impact in a distinctly wider area. Results of the RMW provide further evidence to quantitatively compare the wind-impact areas for these two typhoons. It was found that the RMW of Mangkhut exceeded 100 km, which was 1 order of magnitude larger than that of Saola.
- 2.
The aforementioned discrepancies were primarily attributed to the varied eyewall replacement (ER) processes of the two typhoons. Both Mangkhut and Saola demonstrated a concentric eyewall structure during the development stage. Once the outer eyewall formed, the inner eyewall tended to decay owing to the cutoff of energy and water vapor transferred from the TCs' peripheral areas. For Saola, as the inner eyewall decayed, the outer eyewall shrank and gradually replaced the inner eyewall. During this process, the TC strength first decreased, then recovered, and finally became a bit stronger than the initial status was. In contrast, Mangkhut failed to finish the ER cycle. The outer eyewall did not shrink; instead, it disintegrated into a pair of rainband complexes in a considerably larger region. When the storms approached the study sites, Saola became more intense and compact, whilst Mangkhut weakened and exerted an impact on a much wider area. Other potential reasons were also presented, including the discrepancies in the TC tracks.
- 3.
In accordance with the TC structural features, the wind characteristics of Mangkhut and Saola at the study sites also demonstrated some noteworthy discrepancies. The radial area with respect to the TC center below the melting layer can be basically divided into three portions: the inner portion dominated by torrential rain and the strongest wind, the outer portion with light or no rain as well as the weakest wind, and the middle portion governed by intermittent moderate-to-strong rainfall and wind. Each of the portions for Mangkhut was considerably larger than that for Saola. In the outer portion, due to the more intense subsidence flows, the mixing layer depth for Mangkhut was noticeably larger (3 km) than that (2 km) for Saola. In the inner portion, the wind of Mangkhut was stronger at SY than at SSP, whilst Saola's wind turned out to be smaller at SY than at SSP despite the fact that SY was located consistently farther away from both TCs' tracks. Results of the TC gradient wind suggest that there were noticeable modeling errors for Mangkhut, possibly due to the combined effects of super-gradient wind and inaccurate reproduction of the TC wind field. Meanwhile, as the gradient wind changed rapidly with radial distance around the TC's inner region, the assumption of unchanged gradient wind may not have been exploited appropriately, e.g., for converting between boundary layer winds with varied terrain setups.
In sum, TCs possess complex structural features and wind characteristics, which may evolve spatiotemporally, and are difficult for most widely utilized engineering models to depict. As the scale of coastal and offshore wind turbines increases, there is a need for the wind engineering community to focus more on individual TCs, especially during the phase when they are situated within the nearshore zone. The observations presented in this study suggest the importance of quantifying both the TC strength and the impact area to assess TC hazards. Meanwhile, detailed evolving features of TCs, e.g., the concentric eyewall and ER process, should also be taken into account for some special TCs so as to better understand their wind characteristics and wind-induced impact.
All publicly available data used in this study are clearly cited. Infrared satellite imagery was obtained from the CIMSS database via the Himawari satellite series (https://tropic.ssec.wisc.edu/archive/index.php, University of Wisconsin-Madison, 2025). Doppler radar data during typhoon landfalls were provided by the National Meteorological Center of China (http://www.nmc.cn/publish/radar/guang-dong/guang-zhou.htm, NMC, 2025). The ER cycle diagrams in Fig. 8 were adapted from the Hong Kong Observatory data (https://www.weather.gov.hk/informtc/Mangkhut18/windstructure.htm, Hong Kong Observatory, 2025) and NOAA STAR data (https://www.star.nesdis.noaa.gov/socd/mecb/sar, NOAA, 2025). For non-public materials, please contact the corresponding author.
YL – formal analysis, investigation, validation, and writing (original draft preparation); YH – funding acquisition, project administration, supervision, and writing (review and editing); PC – resources; AL – resources; QG – resources.
The contact author has declared that none of the authors has any competing interests.
Publisher's note: Copernicus Publications remains neutral with regard to jurisdictional claims made in the text, published maps, institutional affiliations, or any other geographical representation in this paper. While Copernicus Publications makes every effort to include appropriate place names, the final responsibility lies with the authors.
The research has been supported by the National Natural Science Foundation of China (grant no. 52178465); the Natural Science Foundation of Guangdong province, China (grant no. 2023B1515020117); and the 111 Project of China (grant no. D21021).
This research has been supported by the National Natural Science Foundation of China (grant no. 52178465), the Science Fund for Distinguished Young Scholars of Guangdong Province (grant no. 2023B1515020117), and the Higher Education Discipline Innovation Project (grant no. D21021).
This paper was edited by Dan Li and reviewed by two anonymous referees.
Bento, N. and Fontes, M.: Emergence of floating offshore wind energy: Technology and industry, Renew. Sust. Energ. Rev., 99, 66–82, https://doi.org/10.31230/osf.io/ma7ku, 2019.
Chen, X. L., Jiang, Z. Y., Li, Q. Y., Li, Y., and Ren. N. X.: Extended environmental contour methods for long-term extreme response analysis of offshore wind turbines, J. Offshore Mech. Arct., 142, 052003, https://doi.org/10.1115/1.4046772, 2020.
Díaz, H. and Guedes Soares, C.: Review of the current status, technology and future trends of offshore wind farms, Ocean Eng., 209, 107381, https://doi.org/10.1115/1.4046772, 2020.
Dong, X. F., Lian, J. J., Wang, H. J., Yu, T. S., and Zhao, Y.: Structural vibration monitoring and operational modal analysis of offshore wind turbine structure, Ocean Eng. 150, 280–297, https://doi.org/10.1002/we.2849/v1/review1, 2018.
GB 50009-2012: Load Code for the Design of Building Structures, China Architecture and Building Press, Beijing, China.
Gong, Y. J., Dong, S., and Wang, Z. F.: A novel method to estimate the typhoon-affected multi-dimensional environmental design parameters for floating offshore wind turbines, Sustain. Energy Technol. Assess., 69, 103889, https://doi.org/10.2139/ssrn.4805169, 2024.
He, J. Y., He, Y. C., Li, Q. S., Chen, P. W., Zhang, L., Yang, H. L., and Li, L.: Observational study of wind characteristics, wind speed and turbulence profiles during Super Typhoon Mangkhut, J. Wind Eng. Ind. Aerod., 206, 105362, https://doi.org/10.1016/j.jweia.2020.104362, 2020a.
He, Y. C., Chan, P. W., and Li, Q. S.: Standardization of raw wind speed data under complex terrain conditions: a data-driven scheme, J. Wind Eng. Ind. Aerod., 131, 12–30, https://doi.org/10.1016/j.jweia.2014.05.002, 2014.
He, Y. C., Chan, P. W., and Li, Q. S.: Observations of vertical wind profiles of tropical cyclones at coastal areas, J. Wind Eng. Ind. Aerod., 152, 1–4, https://doi.org/10.1016/j.jweia.2016.01.009, 2016.
He, Y. C., Chan, P. W., and Li, Q. S.: Observational study on thermodynamic and kinematic structures of Typhoon Vicente (2012) at landfall, J. Wind Eng. Ind. Aerod., 172, 280–297, https://doi.org/10.1016/j.jweia.2017.11.008, 2018.
He, Y. C., He, J. Y., Chen, W. C., Chan, P. W., Fu, J. Y., and Li, Q. S.: Insights from Super-typhoon Mangkhut (1822) for wind engineering practices, J. Wind Eng. Ind. Aerod., 203, 104238, https://doi.org/10.1016/j.jweia.2020.104238, 2020.
He, Y. C., Fu, J. Y., Chan, P. W., Li, Q. S., Shu, Z. R., and Zhou, K.: Reduced Sea-Surface Roughness Length at a Coastal Site, Atmosphere, 12, 991, https://doi.org/10.3390/atmos12080991, 2021.
He, Y. H., Liu, Y. J., Wu, M., Fu, J. Y., and He, Y. C.: Amplitude dependence of natural frequency and damping ratio for 5 supertall buildings with moderate-to-strong typhoon-induced vibrations, J. Build. Eng., 78, 107589, https://doi.org/10.1016/j.jobe.2023.107589, 2023.
Holland, G. J.: An analytic model of the wind and pressure profiles in hurricanes, Mon. Weather Rev., 108, 1212–1218, 1980.
Hong Kong Observatory: Current Weather, https://www.weather.gov.hk/informtc/Mangkhut18/windstructure.htm (last access: 16 November 2024), 2025.
Houze, R. A. J., Chen, S. Y. S., Smull, B. F., Lee, W. C., and Bell, M. M.: Hurricane Intensity and Eyewall Replacement, Science, 315, 1235–1239, https://doi.org/10.1175/1520-0493(1980)108<1212:aamotw>2.0.co;2, 2007.
IEC: Wind energy generation systems-Part 1: Design requirements (4th edn.), IEC International Standard: 61400-1, International Electrotechnical Commision (IEC), Switzerland, 2019.
Kaldellis, J. K., Apostolou, D., Kapsali, M., and Kondili, E.: Environmental and social footprint of offshore wind energy. Comparison with onshore counterpart, Renew. Energ., 92, 543–556, https://doi.org/10.1016/j.renene.2016.02.018, 2016.
Kepert, J. D.: The Dynamics of Boundary Layer Jets within the Tropical Cyclone Core. Part I: Linear Theory, J. Atmos. Sci., 58, 2469–2484, https://doi.org/10.1175/1520-0469(2001)058<2469:tdoblj>2.0.co;2, 2001.
Kepert, J. D.: Tropical Cyclone Structure and Dynamics. Global Perspectives on Tropical Cyclones-from Science to Mitigation, World Scientific, 27, 3–53, 2010.
Kepert, J. D. and Wang, Y. Q.: The Dynamics of Boundary Layer Jets within the Tropical Cyclone Core. Part II: Nonlinear Enhancement, J. Atmos. Sci., 58, 2485–2501, https://doi.org/10.1175/1520-0469(2001)058<2485:tdoblj>2.0.co;2, 2001.
Li, F. Q., Xie, Z. N., Yu, X. F., and Yang, Y.: Investigation of the evolution of urban wind fields during typhoons using a wind LiDAR network: A case study of Super Typhoon Saola (2309), Atmos. Res., 307, 107489, https://doi.org/10.1016/j.atmosres.2024.107489, 2024.
Li, L., Yuan, Z. M., Gao, Y., Zhang, X. S., and Tezdogan, T.: Investigation on long-term extreme response of an integrated offshore renewable energy device with a modified environmental contour method, Renew. Energ. 132, 33–42, https://doi.org/10.1016/j.renene.2018.07.138, 2019a.
Li, L. X., Kareem, A., Hunt, J., Hunt, J. L., Xing, F., Chan, P. W., Xiao, Y. Q., and Li, C.: Observed sub-hectometer-scale low level jets in surface-layer velocity profiles of landfalling typhoons, J. Wind Eng. Ind. Aerod., 190, 151–165, https://doi.org/10.1016/j.jweia.2019.04.016, 2019b.
Li, Y., Wu, J. D., Tang, R. M., Wu, K. J., Nie, J., Shi, P. J., Li, N., and Liu, L. Y.: Vulnerability to typhoons: A comparison of consequence and driving factors between Typhoon Hato (2017) and Typhoon Mangkhut (2018), Sci. Total Environ., 838, 156476, https://doi.org/10.2139/ssrn.4034511, 2022.
Ling, J. W., Ge, X. Y., Peng, M., and Huang, Q. J.: Thermodynamical impacts on the boundary layer imbalance during secondary eyewall formation, Atmos. Res., 310, 107610, https://doi.org/10.1016/j.atmosres.2024.107610, 2024.
Liu, Y. C., Li, S. W., Chan, P. W., and Chen, D. Y.: On the failure probability of offshore wind turbines in the China coastal waters due to typhoons: A case study using the OC4 DeepCwind semisubmersible, IEEE T. Sustain. Energ., 10, 522–32, https://doi.org/10.1109/tste.2018.2834471, 2019.
Lo, K. W., Chan, P. W., Lao, K. K., Lau, S. P. W., and Zhao, Z. H.: Case studies of the winds in the urban area of Hong Kong-Microclimate station observations and high resolution numerical simulations, Heliyon, 10, e37865, https://doi.org/10.1016/j.heliyon.2024.e37865, 2024.
Martinez, A., Murphy, L., and Iglesias, G.: Evolution of offshore wind resources in Northern Europe under climate change, Energy, 269, 126655, https://doi.org/10.1016/j.energy.2023.126655, 2023.
Matsui, M., Ishihara, T., and Hibi, K.: Directional characteristics of probability distribution of extreme wind speeds by typhoon simulation, J. Wind Eng. Ind. Aerod., 90, 1541–1553, https://doi.org/10.1016/s0167-6105(02)00269-6, 2002.
Meng, X. L. and David, V. D.: The EM Algorithm – An Old Folk-Song Sung to a Fast New Tune, J. R. Stat. Soc. B, 59, 511–67, https://doi.org/10.1111/1467-9868.00082, 1997.
NMC: Weather Fact, NMC, http://www.nmc.cn/publish/radar/guang-dong/guang-zhou.htm (last access: 12 November 2024), 2025.
NOAA: STAR SOCD Water Surface Conditions/Synthetic Aperture Radar (SAR) Products, https://www.star.nesdis.noaa.gov/socd/mecb/sar (last access: 21 November 2024), 2025.
Patel, R. P., Nagababu, G., Singh Kachhwaha, S., and Arun Kumar Surisetty, V. V.: A revised offshore wind resource assessment and site selection along the Indian coast using ERA5 near-hub-height wind products, Ocean Eng., 254, 111341, https://doi.org/10.1016/j.oceaneng.2022.111341, 2022.
Qian, X. H., Zhang, B. X., Gao, Z. T., Wang, T. G., Zhang, L. J., and Li, Y.: Flutter limit optimization of offshore wind turbine blades considering different control and structural parameters, Ocean Eng., 310, 118558, https://doi.org/10.1016/j.oceaneng.2024.118558 2024.
Ren, H. H., Ke, S. T., Dudhia, J., and Li, H.: Wind disaster assessment of landfalling typhoons in different regions of China over 2004–2020, J. Wind Eng. Ind. Aerod., 228, 105084, https://doi.org/10.1016/j.oceaneng.2024.118558, 2022.
Sheng, C. and Hong, H. P.: Reliability and fragility assessment of offshore floating wind turbine subjected to tropical cyclone, Struct. Saf., 93, 102138, https://doi.org/10.1016/j.strusafe.2021.102138, 2021.
Sun, Y., Li, H., Sun, L. P., and Guedes Soares, C.: Failure Analysis of Floating Offshore Wind Turbines with Correlated Failures, Reliab. Eng. Syst. Safe., 238, 109485, https://doi.org/10.1016/j.ress.2023.109485, 2023.
University of Wisconsin-Madison: CIMSS Tropical Cyclones, Data Archive Request, https://tropic.ssec.wisc.edu/archive/index.php (last access: 24 November 2024), 2025.
Wu, Z. H., Huang, Y. B., Zhang, Y., Zhang, L. F., Lei, H. C., and Zheng, H. P.: Precipitation characteristics of typhoon Lekima (2019) at landfall revealed by joint observations from GPM satellite and S-band radar, Atmos. Res., 260, 105714, https://doi.org/10.1016/j.atmosres.2021.105714, 2021.
Wang, Q., Zhao, D. J., Duan, Y. H., Duan, Y, H., Wang, H., Sun, Z. Y., and Xu, Y. L.: Observational fine-scale evolutionary characteristics of concentric eyewall Typhoon Doksuri (2023), Atmos. Res., 310, 107630, https://doi.org/10.5194/ems2024-43, 2024.
Yang, Y., Bashir, M., Wang, J., Michailides, C., Loughney, S., Armin, M., Hernández, S., Urbano, J., and Li. C.: Wind-wave coupling effects on the fatigue damage of tendons for a 10 MW multi-body floating wind turbine, Ocean Eng., 217, 107909, https://doi.org/10.1016/j.oceaneng.2020.107909, 2020.
Zheng, Y. T., Huang, J. Y., Li, S., Nie, J., Chen, H., and Han, G. Y.: Socioeconomic impacts on damage risk from typhoons in mega-urban regions in China: A case study using Typhoons Mangkhut and Lekima, Int. J. Disast. Risk Re., 101, 104210, https://doi.org/10.2139/ssrn.4554723, 2024.