the Creative Commons Attribution 4.0 License.
the Creative Commons Attribution 4.0 License.
 | 14 May 2025
Rapid high-resolution impact-based flood early warning is possible with RIM2D: a showcase for the 2023 pluvial flood in Braunschweig
Shahin Khosh Bin Ghomash
Heiko Apel
Kai Schröter
Max Steinhausen
In recent years, urban areas have been increasingly affected by more frequent and severe pluvial floods, attributed to climate change and urbanization. This trend is expected to continue in the future, underscoring the critical importance of flood warning and disaster management. However, pluvial flood forecasts on a communal level do not exist in practice, mainly due to the high computational runtimes of high-resolution flood simulation models. Here, we showcase the capability of the hydrodynamic model RIM2D (Rapid Inundation Model 2D) to deliver highly detailed and localized insights into expected flood extent and impacts in very short computational processing times, enabling operational flood warnings. We demonstrate these capabilities using the case of the June 2023 torrential rain and resulting flood event in the city of Braunschweig, located in Lower Saxony, Germany. During this event, the city experienced intense rainfall of 60 L m−2 within a short time frame, resulting in widespread inundation, significant disruption to the residents' daily life, and substantial economic costs to the city. This study serves as a clear indication that different dimensions of flood consequences can be simulated at very high resolutions in extremely short computational times and that models such as RIM2D, along with the necessary hardware for their operation, have reached a level of maturity suitable for integration into operational early warning systems and impact-based forecasting systems for such floods.
- Article
(5277 KB) - Full-text XML
- BibTeX
- EndNote


Urban pluvial flooding presents a significant threat to many cities worldwide, and this threat is anticipated to increase due to the impacts of climate change and urbanization (Skougaard Kaspersen et al., 2017). During such events, precise flood information is crucial for emergency management decisions by local decision-makers, disaster managers, and potentially affected citizens (Kreibich et al., 2021). Early forecasting systems play a crucial role in mitigating the loss of life and property during such occurrences, enabling the implementation of preventive measures ahead of time (Šakić Trogrlić et al., 2022). Computational hydrodynamic models serve as essential tools in such systems, enabling the simulation and prediction of detailed flooding information under varying conditions.
Impact-based flood forecasting has recently gained attention within disaster risk research (e.g., Merz et al., 2020; Apel et al., 2022). This approach aims not only to focus on metrics such as flood inundation area and water depths, but also to expand forecasts to encompass additional and arguably more comprehensible dimensions of impacts, such as flow velocity, the number and locations of affected individuals and buildings, damage to structures and infrastructure, or disruptions to services. It is suggested that when such distinct and spatially detailed information in addition to behavioral instructions is disseminated to the public, individuals are more likely to heed warnings and respond in a more effective manner before or during a flood event (Kreibich et al., 2021). Moreover, flood disaster management profits largely from these detailed impact forecasts because flood protection measures and the distribution of resources can be planned much better (Merz et al., 2020). Typically, determining such impacts necessitates the use of distributed water depth data from the flooding, alongside potential additional factors such as velocity, duration, precautionary measures, and warning times (Merz et al., 2010). Physically based distributed models allow for the simulation of such parameters, thereby enabling the calculation of flood impacts at the desired level of detail.
Physically based hydrodynamic models, typically based on the two-dimensional shallow-water equations, have a long-standing history in flood modeling, with various applications showcased under different scenarios (e.g., Pasculli et al., 2021; Khosh Bin Ghomash et al., 2022; Apel et al., 2024). They hold promise in improving the accuracy and efficiency of early forecasting systems (Apel et al., 2022; Costabile et al., 2023). However, the practical integration of such models into early warning systems has, until recently, been significantly limited due to challenges associated with computational capacities, data assimilation, and real-time decision-making (de Almeida and Bates, 2013). Yet, this is evolving due to advancements in high-performance parallel-computing (HPC) systems in recent years. These systems have facilitated physically based flood modeling with an unprecedented level of detail, all while requiring reasonably short computation times (Caviedes-Voullième et al., 2023). RIM2D (Rapid Inundation Model 2D) is a graphics processing unit (GPU)-accelerated 2D hydraulic simulation model, written in CUDA Fortran and capable of extensive parallelization on HPC systems equipped with CUDA-enabled NVIDIA GPUs. It solves a simplified version of the shallow-water equations (Bates et al., 2010) and has been effectively employed for simulating floods across various scenarios (e.g., Apel et al., 2022, 2024; Khosh Bin Ghomash et al., 2024).
The question that naturally follows is, can high-performance computing-enabled shallow-water solvers such as RIM2D attain adequate accuracy and lead times to enhance early flood warning systems for the more effective management of events? In this study, we present the workflow for simulating various dimensions of flood impacts using RIM2D and seek to answer if computational times are sufficiently short for the use of such models in impact-based operational early flood warnings. We showcase this for the 2023 pluvial flooding in Braunschweig, a city in Lower Saxony, Germany. In June 2023, Braunschweig experienced a notable instance of pluvial flooding, during which 60 L m−2 of rainfall occurred within a brief time frame. This amount surpassed the capacity of the city's sewer system, resulting in widespread inundation across the urban area. The city area comprises densely populated urban zones, encompassing residential neighborhoods, industrial sectors, and critical infrastructure, which significantly heighten susceptibility to such urban pluvial flooding within the city. In this study, we showcase RIM2D's capability to simulate the 2023 flood event and its subsequent impacts on residential buildings and impacted people. Model validation is performed with the use of volunteered geographic information (VGI) (Drews et al., 2023), and the resulting model runtimes are evaluated for their suitability of use in an operational pluvial flood forecasting system. Furthermore, flood impacts in terms of monetary damage and affected people were derived in order to illustrate the benefits of spatially explicit flood impact forecasts.
2.1 Study case
The study focuses on Braunschweig, a city in Lower Saxony, Germany, covering an area of 192.1 km2. As of 2024, the city’s population stood at approximately 272 000, resulting in a population density of around 1416 people km−2. Thus, Braunschweig is representative of the many medium-sized cities in Germany in terms of spatial extent and population. Braunschweig's urban landscape features a mix of densely populated residential areas, industrial zones, and critical infrastructure including transportation hubs and hospitals. The city's predominantly flat terrain exacerbates the challenges of managing pluvial flooding, as it limits natural drainage and increases surface water runoff during heavy rainfall. This flat topography, combined with extensive impervious surfaces like roads and buildings, reduces infiltration into the soil, leading to water accumulation in depressions. Such conditions make the city particularly vulnerable to localized flooding, especially during intense rainfall events, as stormwater cannot be drained efficiently.
The city has a temperate oceanic climate, with average annual precipitation of about 700 mm. However, extreme rainfall events, such as the pluvial flood of June 2023, can overwhelm the urban drainage system, leading to significant surface water flooding. Braunschweig’s drainage network primarily features a combined sewer system, which is adequate for moderate rainfall but insufficient during extreme weather events, leading to surface water flooding. Flood mitigation efforts in Braunschweig are largely reliant on structural measures, with limited adoption of non-structural strategies to address pluvial flood risks.
2.2 Hydrodynamic model: RIM2D
RIM2D is a 2D raster-based hydrodynamic model developed by Section Hydrology at the German Research Centre for Geoscience (GFZ) in Potsdam, Germany. RIM2D is designed to solve the local inertia approximation of the shallow-water equations (Bates et al., 2010), demonstrated to be effective for flood inundation modeling (e.g., Apel et al., 2022, 2024). The local inertia formulation offers a more accurate representation of the issue compared to simpler versions of the shallow-water equations, such as the diffusive wave model (de Almeida and Bates, 2013). It introduces an additional term to account for the rate of change of local fluid momentum, influencing how the fluid's momentum evolves from one time step to the next. In practical terms, this means that the fluid's momentum at a given time step informs its behavior in the subsequent step, necessitating an acceleration of flow from its previous state. Thus, in the realm of describing shallow-water flows, the local inertia formulation bridges the gap between the diffusive wave approximation and the more comprehensive full dynamic equations.
While the original explicit numerical solution proposed by Bates et al. (2010) can be prone to instabilities under conditions of near-critical to super-critical flow and for small grid cell sizes (de Almeida and Bates, 2013), RIM2D has integrated the numerical diffusion method put forth by de Almeida et al. (2012) to address these challenges.
RIM2D is implemented in Fortran and has been adapted for use with GPUs through CUDA Fortran libraries. At the time of the study, RIM2D supports computations on a single GPU. Since the end of 2024, multi-GPU computing for increased computational efficiency has also been available.
2.3 Data and model setup
The digital elevation model (DEM) utilized for the model setup was the DGM1 product, provided by the Braunschweig city administration and generated by the Federal Agency for Cartography and Geodesy (BKG) of Germany. This DEM, with a cell resolution of 1 m, was produced using lidar mapping data from 2016 covering the city area (192.1 km2). To explore the efficiency of RIM2D under different resolutions and to lessen the computational load of the simulations, the DGM1 dataset was resampled to resolutions of dx = 2, 5, and 10 m using the averaging method. This resulted in raster comprising approximately 75 million cells for a resolution of dx = 2 m, 12 million cells for dx = 5 m, and 3 million cells for dx = 10 m within the study domain. Additionally, building outlines sourced from OpenStreetMap were used to remove building footprints from all three DEMs. As a result, the surfaces of the buildings served as closed reflective boundaries within the simulations. While buildings are treated as reflective boundaries, other non-permanent urban features such as street furniture and parked vehicles, which may influence flow dynamics, are not explicitly modeled. This is mainly due to the lack of data and the constantly changing nature of these features, which make them difficult to incorporate into hydraulic modeling.
Manning roughness values were assigned to the study domain based on the 2020 Germany land cover classification, derived from Sentinel-2 data (Riembauer et al., 2021). This classification is based on atmospherically corrected Sentinel-2 satellite imagery processed with the MAJA algorithm, with data provided by the EOC Geoservice of the German Aerospace Center (DLR). Additionally, training data from other reference sources such as OpenStreetMap, as well as the Sentinel-2 scenes themselves, were used in the classification process. This specific land cover dataset was selected for the study due to its relatively high-resolution land-use classification of 10 m. Manning values of 0.04, 0.03, 0.1, 0.025, 0.035, and 0.035 m s−1 were assigned to the mapped classes of vegetation, waterbodies, forest, built-up, bare soil, and agriculture land, respectively.
For the model's precipitation boundary for the 2023 flood event, the rainfall radar data “RADOLAN” provided by the German Weather Service (DWD) were used. RADOLAN, an operational open-source product of the DWD, is accessible at the Climate Data Center (CDC) of the DWD. These data, available at hourly intervals (representing the accumulated precipitation from the previous hour estimated using radar images), cover all of Germany at a spatial resolution of 1000 × 1000 m. A total of 48 sequences of hourly RADOLAN images, corresponding to the days of 22 and 23 June 2023 and covering the extent of our study domain, were used as boundary conditions for the model. It has to be noted that the hourly resolution can underestimate sub-hourly precipitation intensities. DWD also provides reprocessed 5 min resolution RADOLAN products, but these are available with a latency of about 1 year and are thus not available for this study.
Infiltration rates for the domain surface were determined through the combination of two distinct datasets. Initially, the soil type within the study area was classified using the BK50 soil map (Evertsbusch et al., 2020) (with a resolution of dx = 50 m) provided by the State Agency for Mining, Energy and Geology of Lower Saxony, Germany. Saturated hydraulic conductivity values suitable for each soil category in the BK50 raster were assigned following a comprehensive literature review. Subsequently, the imperviousness density percentage raster, sourced from the Earth observation component of the European Union's space program (Copernicus) at a resolution of dx = 10 m, was utilized to compute the surface perviousness across the study domain. The final infiltration rates integrated into the model were derived by multiplying the saturated hydraulic conductivity of each cell based on the BK50 product with the surface pervious percentage of that cell. RIM2D also enables the consideration of the urban sewer drainage system, utilizing a capacity-based approach analogously to the infiltration. This approach has been proven to provide reliable simulation of drainage volumes and thus of the impact of the sewer drainage on the surface inundation (Apel et al., 2024). However in this study the sewer capacity was not considered in order to make the simulations comparable with the available city flood hazard maps, which were derived neglecting the urban drainage. In an operational flood forecast setting, the drainage capacity needs to be considered to obtain realistic inundation simulations. Apel et al. (2024) outline a methodology for the drainage capacity can be estimated based on design rainfalls in case the actual capacity is not known.
2.4 Impact calculation
We use the loss estimation model developed by Rözer et al. (2019) derived from empirical surveys conducted via computer-aided telephone interviews in five German cities following pluvial flood events from 2005 to 2014. This model expresses loss as relative loss (rloss) between 0, meaning no damage to the building, and 1, meaning complete destruction of the building. Relative loss is then multiplied by the building's asset value to calculate monetary losses. The model is only trained to predict losses for residential buildings. To predict a building's relative loss due to pluvial flooding, the model employs Bayesian zero-inflated beta regression (Ospina and Ferrari, 2010), considering factors such as water depth, duration, contamination, presence of a basement, and household size as influences on damage. The model is implemented in R using the RStan package (Stan Development Team, 2024) with Markov chain Monte Carlo (MCMC) sampling.
For the case of Braunschweig, the damage calculation is based on maximum water depth values and the inundation duration, which is the duration for which each cell in the area was flooded with a minimum water depth of 1 cm. To estimate losses in Braunschweig, OpenStreetMap (OSM) data for building footprints are used. Several filters were applied to the raw OSM dataset to ensure that only residential buildings are included in the damage estimation. Buildings that meet the following criteria were assumed to be residential and therefore included in the loss estimation:
-
buildings without a name tag, as the assumption is that only prominent non-residential buildings are commonly tagged with names by OSM contributors;
-
buildings without a type tag, since most buildings, 80 %, do not have a specific type assigned;
-
buildings with the type tags of “residential”, “detached”, “apartments”, “house”, “villa”, “terrace”, “bungalow”, “semidetached-house”, “allotment-house”, “apartments;yes”, “winter-garden”, or “prefabricated”;
-
buildings with a footprint size smaller than 3000 m2, as it is assumed that buildings larger than this are likely industrial or commercial rather than residential in the area of interest.
Monetary asset values for residential buildings are based on HANZE data (Paprotny et al., 2018). These data were derived by distributing the national stock of dwellings to regions (NUTS-3 level) based on the regional gross domestic product (GDP). Further, the estimated regional stock was disaggregated proportionally to the population per grid cell (Steinhausen et al., 2022) and then adjusted based on the OSM footprint areas. These asset values are adjusted to 2023 prices and should be interpreted as reconstruction costs.
In addition to assessing damages, for illustrative purposes, we also compute the number of individuals affected during the flood event. Those considered “affected” include all individuals residing within areas impacted by flooding (“people who get wet feet”). The potential impact is determined by the population density [person m−2] corresponding to each cell within a raster that delineates the modeling area. Vulnerability is defined by the level of impact, which is determined by the maximum water depth [m]. To mitigate uncertainties associated with very low water depths, we establish a threshold of 10 cm for this calculation, meaning that if the water depth falls below 0.1 m, no individuals within the cell are considered affected; on the other hand, if the water depth exceeds 0.1 m, all individuals within the cell are assumed affected. For this calculation, we make use of the latest WorldPop population density map (Tatem, 2017) for Germany for the year 2020, with a resolution of dx = 100 m.
2.5 Model validation
Field observations relevant to urban pluvial floods, such as water level measurements, are rarely accessible or, at best, extremely sparse (Drews et al., 2023). This scarcity stems from the brief duration and localized nature of intense rainfall and the following pluvial flooding, which reduce the chances of mapping these events by operational remote sensing platforms. And even if remote sensing platforms observe the flood event, problems mapping the flood arise from cloud cover (optical sensors) or reflections from buildings (radar sensors). The infrequent occurrence of heavy-precipitation events is an additional obstacle in obtaining pluvial flood maps for model validation. Consequently, there are typically a very limited number of observational data with limited quality from real-world pluvial flood events available for validating advanced urban flood models. In fact, in numerous locations that are theoretically at high risk of pluvial flooding, there are no historical records whatsoever. While the hydrodynamic model RIM2D has been validated across various flooding scenarios, including both pluvial (e.g., Apel et al., 2024) and fluvial cases (e.g., Khosh Bin Ghomash et al., 2024), this study intentionally conducts simulations in a blind manner, without parameter calibration such as roughness coefficients. This approach is chosen primarily because of the limited availability of data from the city and the specific nature of these floods but also to assess the feasibility of using solvers like RIM2D for early warning, recognizing that comprehensive calibration may not always be feasible for every city covered by the early warning system. Therefore, relying on available spatial data and standard parameterizations is often the only practical option. While calibration would be ideal, the typical absence of calibration data (such as flood mapping) and the occasional need for rapid model deployment in operational scenarios mean that using an uncalibrated model is common practice. Thus, this study presents uncalibrated simulation results without delving into extensive model calibration efforts.
As there were no systematic observations from the 2023 flood event in Braunschweig, the only data that could be used for model validation were VGI data, such as pictures and videos captured by the residents of Braunschweig during the flood event. Recordings of the flood in 164 different locations within the city were provided by the city administration. Studies such as those of Assumpção et al. (2018) and See (2019) indicate that although the quantity of data gathered in most VGI case studies may not be extensive, the data can still offer an effective means of validating pluvial flood models at urban scales. In this paper, we utilize these recordings as references, employing them to qualitatively validate the flood extent and inundation depths of the RIM2D model for the simulation of the 2023 flood. To further validate our model, we utilize the city's official flood hazard maps, which are provided by the city administration and cover events with return periods of 30, 100, and 1000 years. These maps, derived from hydrodynamic simulations, have undergone rigorous verification and validation by experts knowledgeable about the city and its historical flood events. A comparison of our model results with these city maps is thus presented as additional model validation (Appendix A).
3.1 Flood impacts
Next, we turn to the simulation of the 2023 flood event. Figure 1 illustrates the maximum water depth (a), maximum water velocities (b), the number of affected people in the domain (c), and the resulting flood damages in relation to residential buildings (d). These results are based on the dx = 5 m configuration. This figure showcases RIM2D's ability to generate impact-based consequences of the 2023 flood in a spatially distributed manner. Concerning each map, from Fig. 1a it can be seen that high water depths (over 50 cm) are noticeable both in the city center, characterized by densely packed urban areas and a significant population concentration, and in the surrounding areas. With regard to flow velocity (Fig. 1b), relatively low velocities are observed across the entire domain, something which is common in the case of pluvial floods on rather flat terrain such as Braunschweig. A higher concentration of affected individuals (light green) is observed in the central part of the city (Fig. 1c) in comparison to the outskirts of Braunschweig, which is mainly due to the high population density in the city center. Similarly, residential building losses predominantly occur in the city center (seen in Fig. 1d), particularly in highly urbanized areas. Maps, as presented here, enhance flood forecast information to include additional and more comprehensible dimensions of impacts.
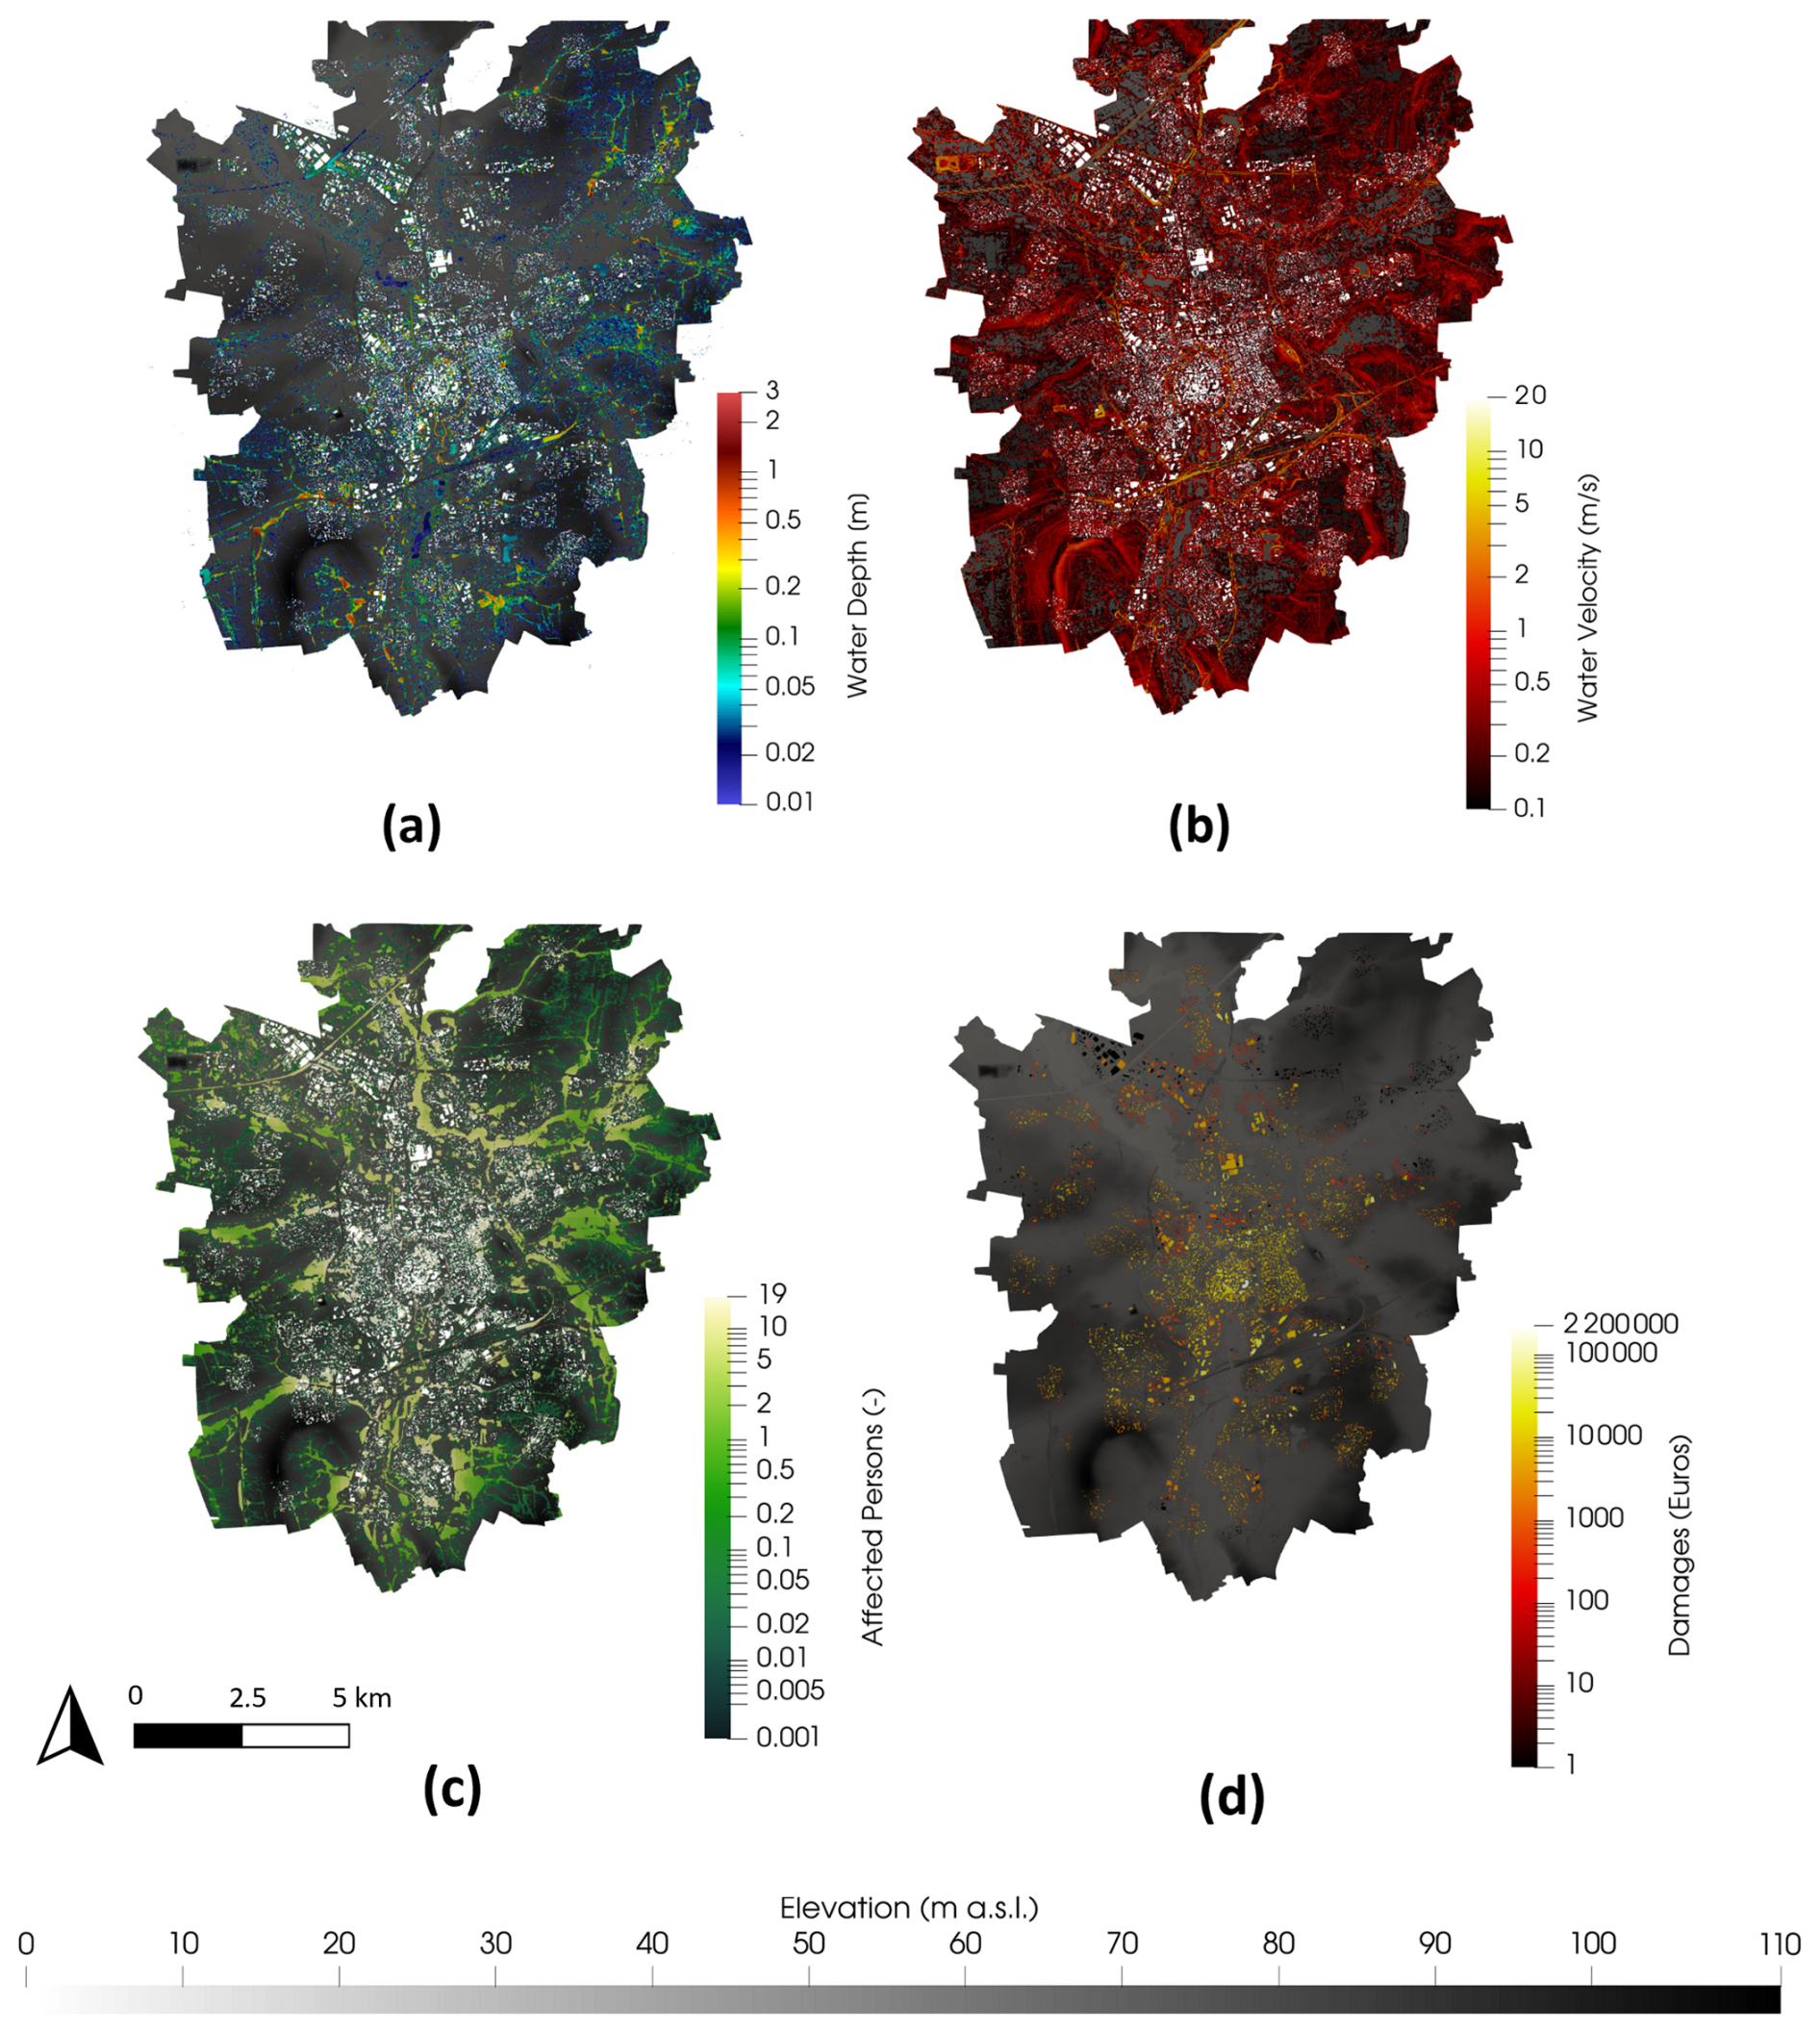
Figure 1(a) Simulated max water depths [m], (b) max velocities [m s−1], (c) affected population [number of persons], and (d) loss incurred in relation to residential buildings [EUR] for the 2023 flood event at dx = 5 m.
In the model validation with the VGI data, we compare mainly flood extent but also water depth where possible. Figure 2 presents the 164 locations where photo and videos were available and two examples of this comparison. RIM2D results are visualized in Google Earth to facilitate the assessment. The lower comparison figure showcases flooding in Willy-Brandt-Platz in front of the city's main train station (Braunschweig Hauptbahnhof), while the upper figure depicts flooding on the Bohlweg street within the city center. Some further examples of visualized comparisons are presented in Fig. B1 in Appendix B. Furthermore, 30 out of the 164 locations, which were the most understandable and measurable in terms of flood water depth, were identified. Reference objects such as street poles, house corners, or curb stones seen in the photos and videos were then manually measured with a DGPS (differential global positioning system) in the city, and water depths were estimated accordingly. Figure B2 in Appendix B presents a comparison between these estimated water depths and the simulated depths using RIM2D. Although it is observed that RIM2D occasionally overestimates the water depth, this can be attributed to several factors, like ground elevation uncertainty caused by the DEM aggregation and the exclusion of the sewer system in the model. Incorporating the sewer system could potentially improve the accuracy of the results. Overall, in almost all compared instances, RIM2D results are closely aligned, in terms of both flooded areas and water depth (where comparison was possible), with the observations depicted in the photos and videos. This indicates that it was possible to predict the potential flooded areas of the event using RIM2D, highlighting the effectiveness of RIM2D as a valuable early warning tool. It is also worth emphasizing that incorporating more quantitative validation methods, such as calculating the ratio of coherent to incoherent grids, similar to a confusion matrix analysis, could offer a valuable framework for enhancing the validation process in future studies, especially when sufficient systematic data from the event are available.

Figure 2Red line represents Braunschweig city administrative boundary, and yellow dots show the 164 locations where photos and videos from the 2023 flood were available. Two examples of comparisons between the dx = 5 m RIM2D simulation results and social media posts are presented. Visualization of the RIM2D results and the background imagery are performed with and provided by Google Earth. Satellite imagery: © Google Earth 2024.
3.2 Computational performance and runtime
We continue by examining computational performance, as runtime and computational resources are critical factors in determining the applicability of this technology for flood forecasting and early warning systems. Figure 3 illustrates the absolute simulation runtimes (a) and the ratio of the simulated period to the simulation runtime (b) for simulations at dx = 10, 5, and 2 m. The red line represents the values for the 2023 flood event (48 h simulation period), while the blue line represents the values for the 100-year event (2 h simulation period). As the simulation resolution increases, the runtime also rises significantly, with the dx = 2 m simulation requiring more than 33 times the computational time compared to dx = 10 m.
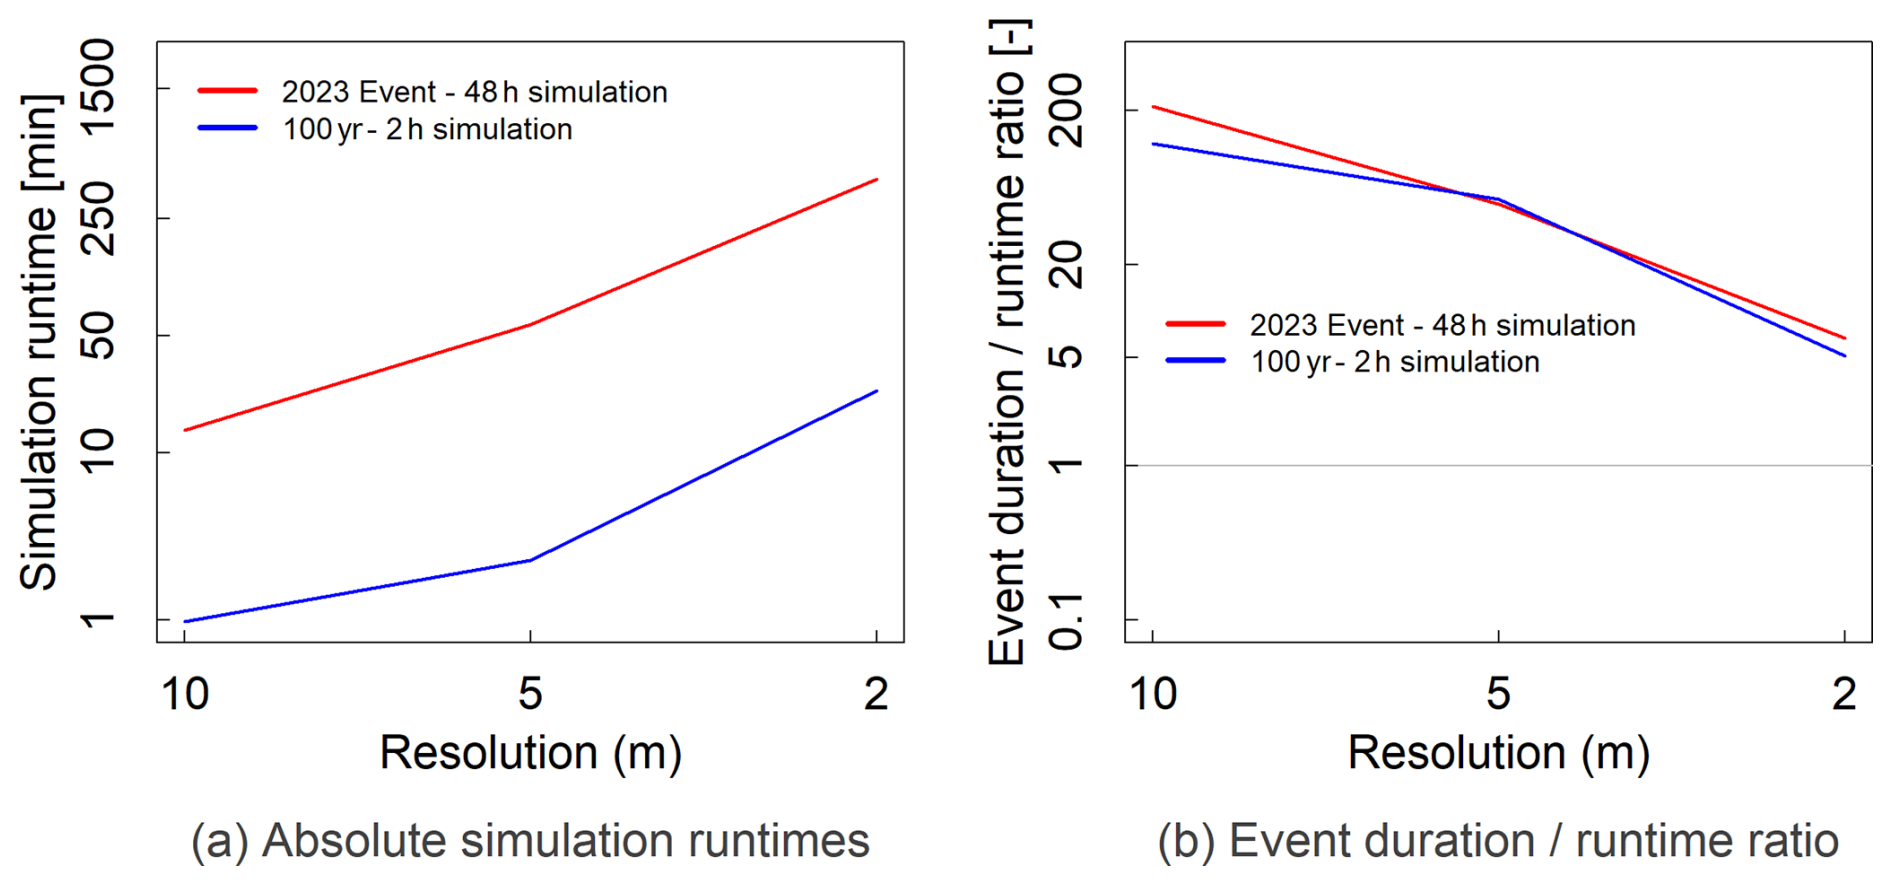
Figure 3The absolute simulation runtimes (a) and the ratio of the simulation duration to the simulation runtimes (b) for the dx = 10, 5, and 2 m simulations. The red line indicates the values for the 2023 flood event (48 h of simulation), and the blue line represents the values for the 100-year event (2 h of simulation).
Nevertheless, even at the finest resolutions, RIM2D proves to be suitable for integration into early warning systems. For the 2023 flood event at dx = 10 m, RIM2D operates more than 211 times faster than the real-time event. Even at the extremely fine dx = 2 m resolution, comprising 75 million cells, simulations can still be conducted more than 6.5 times faster than the actual event. This high level of efficiency makes RIM2D ideal for improving current operational flood forecast systems while maintaining operationally suitable forecast lead times. With the newly available multi-GPU implementation the model, runtimes can be reduced even further, potentially enabling even higher resolution modeling. Consequently, this capability enables detailed flood impact forecasting and effective responses. It should also be noted that estimating other impact dimensions such as losses and determining the affected population, via for example the risk of floating cars, affected critical infrastructure, or disrupted transportation networks, require computation times within seconds, alleviating any additional computational burden on the calculations. In an actual operational forecasting and warning system, updating the simulations would involve simply adjusting the rainfall boundary to the latest rainfall images to generate a forecast. Subsequently, impact calculation results would be derived from these updated data.
The June 2023 pluvial flood in Braunschweig demonstrates the potential for integrating RIM2D into early warning systems. While specific data on the lag time between rainfall onset and flood impacts are unavailable for this event, the operational efficiency of RIM2D ensures that timely predictions can be made once rainfall forecasts are available. The integration of numerical weather prediction (NWP) systems, such as ICON-D2-EPS, has shown promise in providing high-resolution precipitation forecasts with lead times of up to 17 h for extreme rainfall events (Najafi et al., 2024). Additionally, the German Weather Service (DWD) offers RADOLAN radar-based nowcasts with lead times of up to 2 h. While this provides a shorter lead time, it offers greater reliability and higher spatial resolution. The presented runtimes of RIM2D would still be short enough to use RIM2D in a forecast system based on the rainfall nowcast products. By coupling such products with RIM2D, flood impact predictions can be generated and disseminated to stakeholders well before peak inundation occurs. This integration enables timely alerts for evacuations and infrastructure protection, underscoring the potential of RIM2D as an essential component of modern impact-based early warning systems.
It is important to note that no specific optimization of the models was conducted to maximize performance for this particular scenario. Such optimization would be necessary for operational purposes, potentially enhancing performance to some extent. Furthermore, recent advancements in solver implementations, such as introducing a multi-GPU solver for RIM2D, enhance computational efficiency even further. Using four GPUs, the simulation runtimes for the 48 h event can be further reduced to 7 and 29 min for dx = 10 and 5 m, respectively.
3.3 Uncertainties
Like all model simulations, there can be inherent uncertainties in the results. The uncalibrated hydrodynamic model presented here will of course add to the existing uncertainties in the meteorological forecasts. However, hydrodynamic modeling is known to introduce the least amount of uncertainty compared to other sources (de Moel and Aerts, 2011). This uncertainty could be further minimized by avoiding ad hoc setups and uncalibrated runs, as seen in this feasibility study, and instead opting for more detailed implementation that includes calibration or validation against historical flood events or other sources such as volunteered geographic information (VGI) (Drews et al., 2023). Achieving such an improved model implementation would be feasible with the knowledge and cooperation of the city's responsible authorities. When implementing RIM2D in an operational context, it is recommended to include uncertainty maps generated from an ensemble of meteorological forecasts. This approach helps to visualize the inherent uncertainties. Leveraging the computational efficiency of RIM2D, these meteorological forecast ensembles can then be transformed into inundation maps with uncertainty information associated with the flood forecast (Alfonso et al., 2016). These maps can then illustrate the potential outcomes of uncertainties in the meteorological forecasts, thereby representing the uncertainty within the inundation forecast.
This study utilizes the recent 2023 pluvial flood event in Braunschweig, Germany, to showcase the capabilities of the hydrodynamic model RIM2D for flood impact forecasting and the potential advantages of such forecasts. We demonstrate that RIM2D provides credible simulations of inundation areas, depths, and flow velocities within efficient runtimes, enabling timely forecasts and early warnings. Additionally, we can derive supplementary impact indicators that pinpoint hazardous areas, such as those with expected damage or affected populations. These detailed, site-specific data on expected impacts are immensely useful for precise and focused flood disaster management. They provide the potential for more informative public alerts than traditional flood depth maps, potentially resulting in significant improvements to current disaster response and warning systems.
The use of graphics processor units (GPUs) optimized for massive parallel computing enables RIM2D simulations to achieve runtimes compatible with integration into operational flood early warning systems. We show that for this particular event, it is currently possible to generate flood forecasts that are 211 times faster than real time at 10 m resolution, 50 times faster than real time at 5 m resolution, and 6.5 times faster than real time at 2 m resolution with a single scientific-grade GPU. In particular, the dx = 5 and 10 m setups can complete their runs in 13 and 58 min, respectively, for a simulation period of 48 h, meaning completion within the span of an hour. This holds particular significance in the case of floods, where the types and timing of flood warnings are determining factors in the extent of the damage and casualties caused by such events. Historically, numerous regions depend on early warning systems which typically lack spatial detail, are issued on a district or municipal level, and primarily only utilize rainfall data for communication. Nevertheless, instances like the flood in Braunschweig underscore the possible drawbacks of such systems, particularly in situations where details about water levels and affected areas are crucial for efficient response and decision-making. The model employed in this study demonstrates the capability to simulate water levels and flooded areas with a high degree of detail.
As mentioned, the RIM2D model is specifically designed to deliver rapid and accurate flood inundation predictions, making it well-suited for integration into operational early warning systems. The primary goals of such a system include real-time flood monitoring, the provision of high-resolution impact maps for emergency planning and response, and the delivery of timely warnings to safeguard vulnerable populations and critical infrastructure. The configuration demonstrated in this work is based on hourly, spatially distributed RADALON radar precipitation data. In the future, integrating other rainfall products, such as those provided by systems like ICON-D2-EPS, can further enhance lead times, with high-resolution ensemble forecasts offering precipitation predictions up to 17 h in advance (Najafi et al., 2024), thus strengthening early warning capabilities when combined with RIM2D's rapid computations. As shown in Najafi et al. (2024), RIM2D needs to be complemented with a hydrological model, depending on the spatial scale of the application and the nature of the flood. Further, the German Weather Service (DWD) product RADALON also provides radar-based nowcasts with a lead time of up to 2 h which can also be combined with RIM2D for early warning. In terms of real-time operation, radar and nowcasting data can be processed almost instantly to generate boundary conditions, after which RIM2D simulates the flood inundation in 2D in sufficiently short times. The outputs, including inundation extents, depths, and flow velocities, can be immediately analyzed and shared with decision-makers through interactive platforms such as web or GIS applications. By combining ensemble precipitation forecasts with RIM2D’s computational efficiency, the system can provide actionable insights with sufficient lead times to enable emergency measures. Warnings can be issued in a timely manner before peak inundation, depending on the event’s characteristics and available data. These capabilities demonstrate that RIM2D, when integrated into a comprehensive forecasting chain, aligns with the mission goals of early warning systems, enabling effective flood risk management and population protection.
With its straightforward model setup and the widespread availability of the required input data in many countries, RIM2D shows promise for widespread adoption and utilization. Additionally, the hardware required for running these simulations is cost-effective, especially in comparison to large-scale computational clusters. This affordability facilitates the implementation of the model at flood forecast centers without requiring substantial investments in complex IT infrastructure. Moreover, as most of the existing cloud-based HPC systems like Google, Amazon, and Deutsche Telekom host GPU computing services, the technical infrastructure can also be outsourced at comparatively low costs.
Considering the validity of the simulations, the ease of implementing hydraulic forecast models, and the speed of the simulations, we propose extending current forecast practices by incorporating impact forecast models, such as the one presented here. This expansion could enhance the effectiveness of flood warnings and management. The scientific foundation, methodologies, and models for these impact forecasts are well-developed and ready for implementation within operational forecast systems.
In conclusion, the primary result of this study is evidence that this technology has reached a level of maturity suitable for integration into early warning systems. It provides sufficient lead times for many emergency measures and delivers significantly more detailed and actionable outcomes compared to conventional flood early warning systems. The detailed and time-sensitive depth and velocity data and further categories of impact offer clearer anticipation of flood severity, enabling further analysis to derive impact estimation. Moreover, this information is far more accessible to the general public, managers, and emergency responders compared to alerts based solely on, for instance, rainfall data (Thieken et al., 2023).
Initially, the city's official flood hazard maps (provided by the city administration) were utilized, comprising max water depth maps for events with return periods of 30, 100, and 1000 years. These maps were produced with the 2D HydroAS (version 5.2.4) hydrodynamic model with the basis of the DGM1 elevation product (also used in this study with RIM2D) under spatially–temporally uniform standard design rainfall as forcing. The rainfall depths associated with these events are 41.4, 50.6, and 75 mm, respectively, each lasting for 1 h. The flood maps were constructed through simulations involving 1 h of rain followed by 1 h of runoff. We apply identical boundary conditions to the RIM2D model for Braunschweig. To facilitate the comparison of the inundated areas of the RIM2D simulations with the official city maps, an extensive set of metrics are employed. These metrics are computed by evaluating the maximum inundation maps of the RIM2D simulations against the official city flood maps. Initially, cells are categorized based on Fig. A1. For this classification, RIM2D results are considered simulated and the city flood maps are considered observed. A confusion map is generated from each comparison, providing the total counts for the indices presented in Table A1. These counts are then utilized to compute the domain-wide inundation metrics as illustrated in Table A2. These metrics are based on works by Wing et al. (2017) and Bernini and Franchini (2013).
Table A1Inundation confusion matrix. Each cell in the domain for a given simulation is compared to the corresponding cell in the observed grid and classified according to this table.
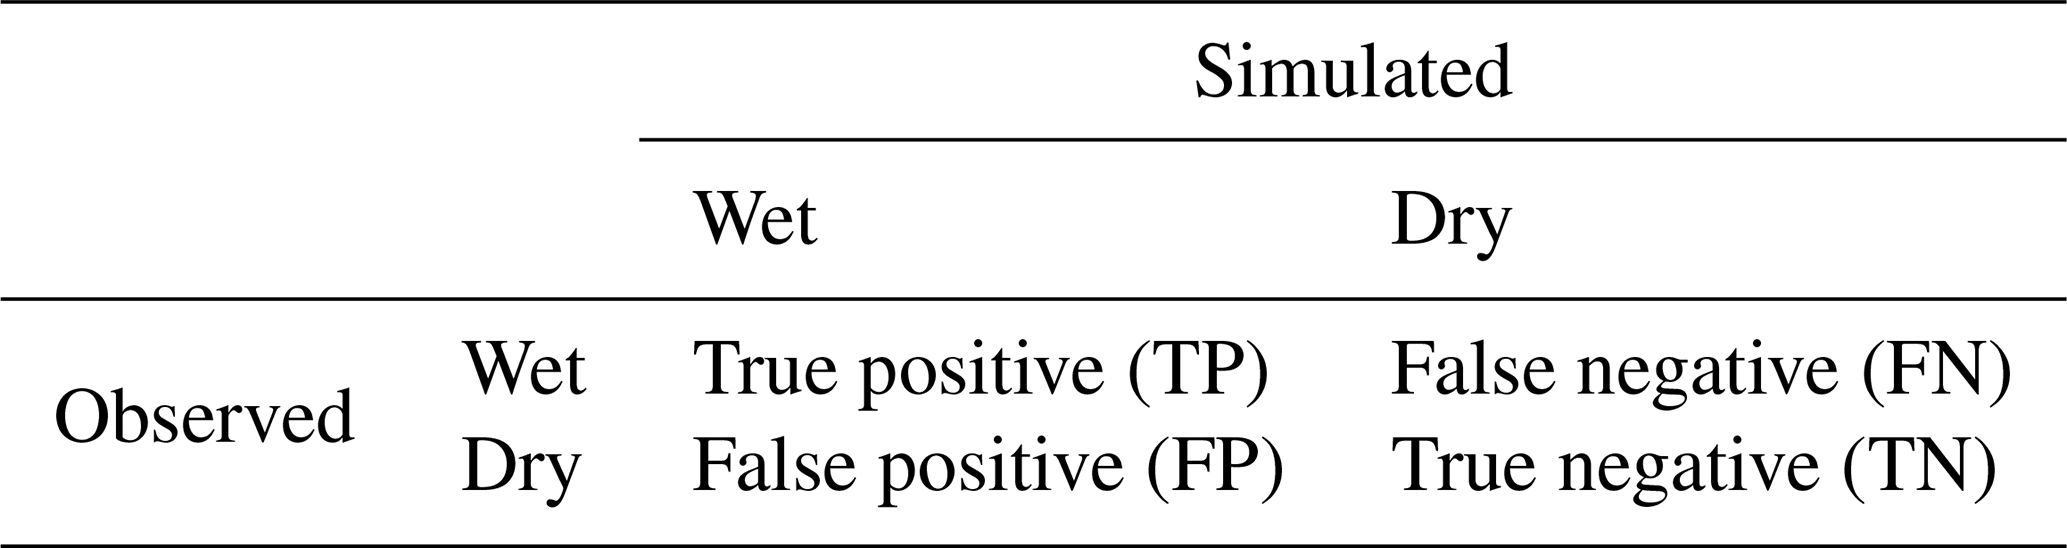

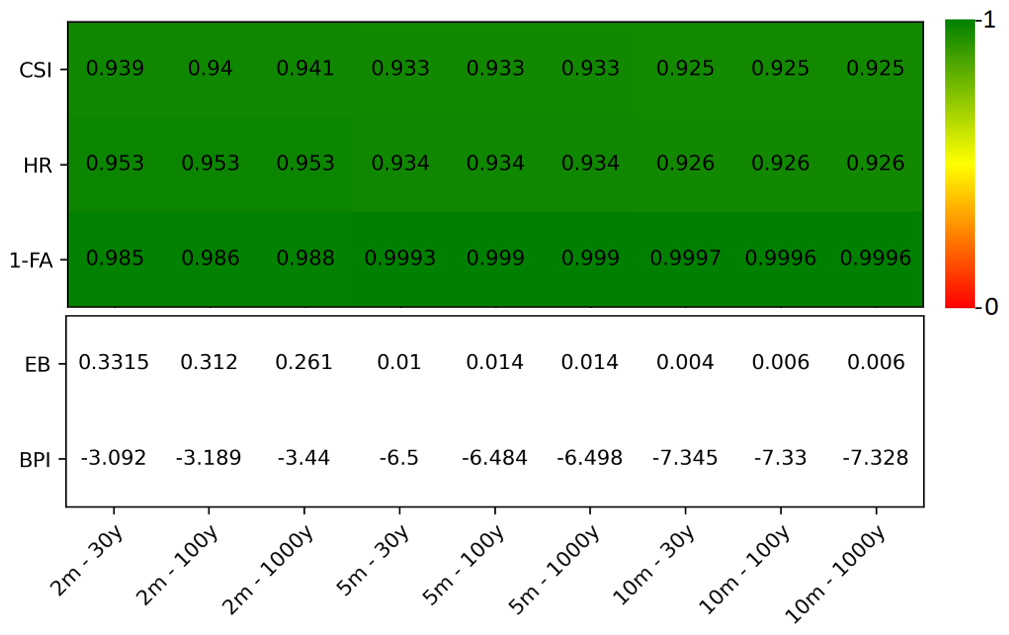
Figure A1Comparison of RIM2D flooded areas to the official city flood maps for resolutions of dx = 2, 5, and 10 m under 30-, 100-, and 1000-year event scenarios. The indices of critical success index (CSI), hit rate (HR), false alarm (1-FA), error bias (EB), and bias percentage indicator (BPI) are presented for the comparison.
Figure A1 illustrates the critical success index, hit rate, false alarm, error bias, and bias percentage indicator for comparing flooded areas between the outputs generated by RIM2D and the official flood hazard maps of Braunschweig. The results are presented for the 30-, 100-, and 1000-year events, each at resolutions of dx = 2, 5, and 10 m. In general, the results show a strong alignment between the RIM2D outputs and the official flood hazard maps of Braunschweig, with high scores across all indicators when considering flooded areas. It is important to note that the city's official flood hazard maps are also the product of hydrodynamic simulations; however, they have been robustly verified and validated by experts familiar with the city. In regard to the simulated event (30, 100, or 1000 years), there is minimal impact observed on the scores. The resolution of the simulations, however, has a slight effect, with higher resolutions yielding slightly higher scores compared to coarser setups. However, even at the coarse resolution of dx = 10 m, high scores are achieved, indicating the suitability of this model resolution for pluvial flood modeling in the city. Since these indicators solely assess the alignment of flooded areas, to assess the differences in simulated water depth values, we calculate the root mean square error (RMSE) in the inundated areas between the water depths of the official city maps and the RIM2D simulation results at dx = 2 m. This yields an RMSE of 0.075 m, indicating a strong match. It is important to mention that the existing RIM2D model is not calibrated, and these results could be even further enhanced through additional calibration efforts. It also has to be noted that the largest differences compared to the reference simulations occur in a few locations at the outskirts of the city, where culverts are present. As these are not considered in RIM2D, differences in the simulated inundation depth greater than the RMSE difference are observed. These are, however, very localized.
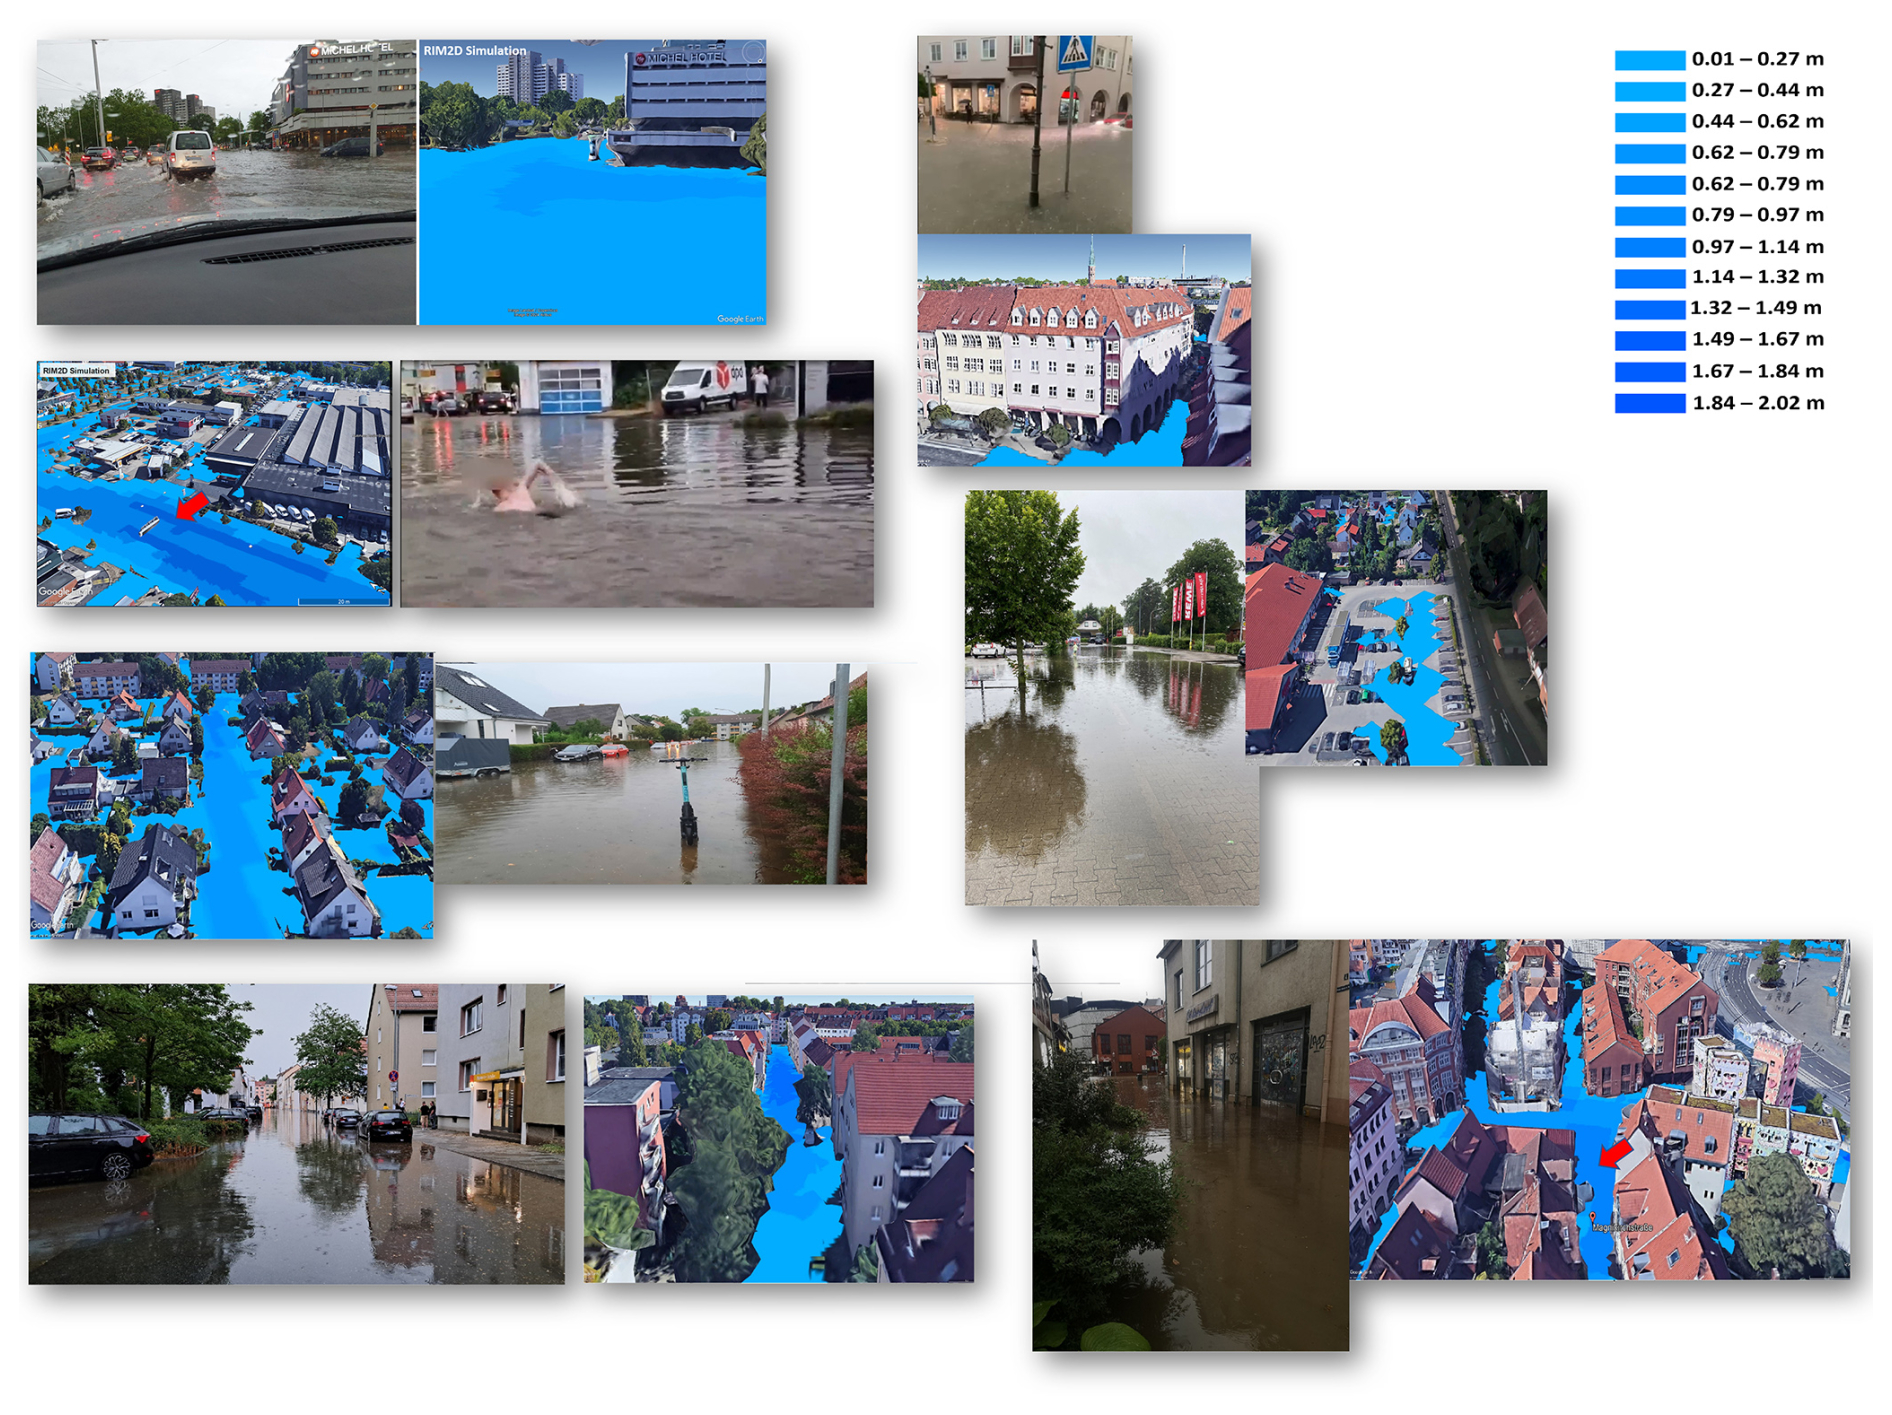
Figure B1Examples of comparisons between the dx = 5 m RIM2D simulation results and social media posts. Visualization of the RIM2D results and the background imagery are performed with and provided by Google Earth. Satellite imagery: © Google Earth 2024.
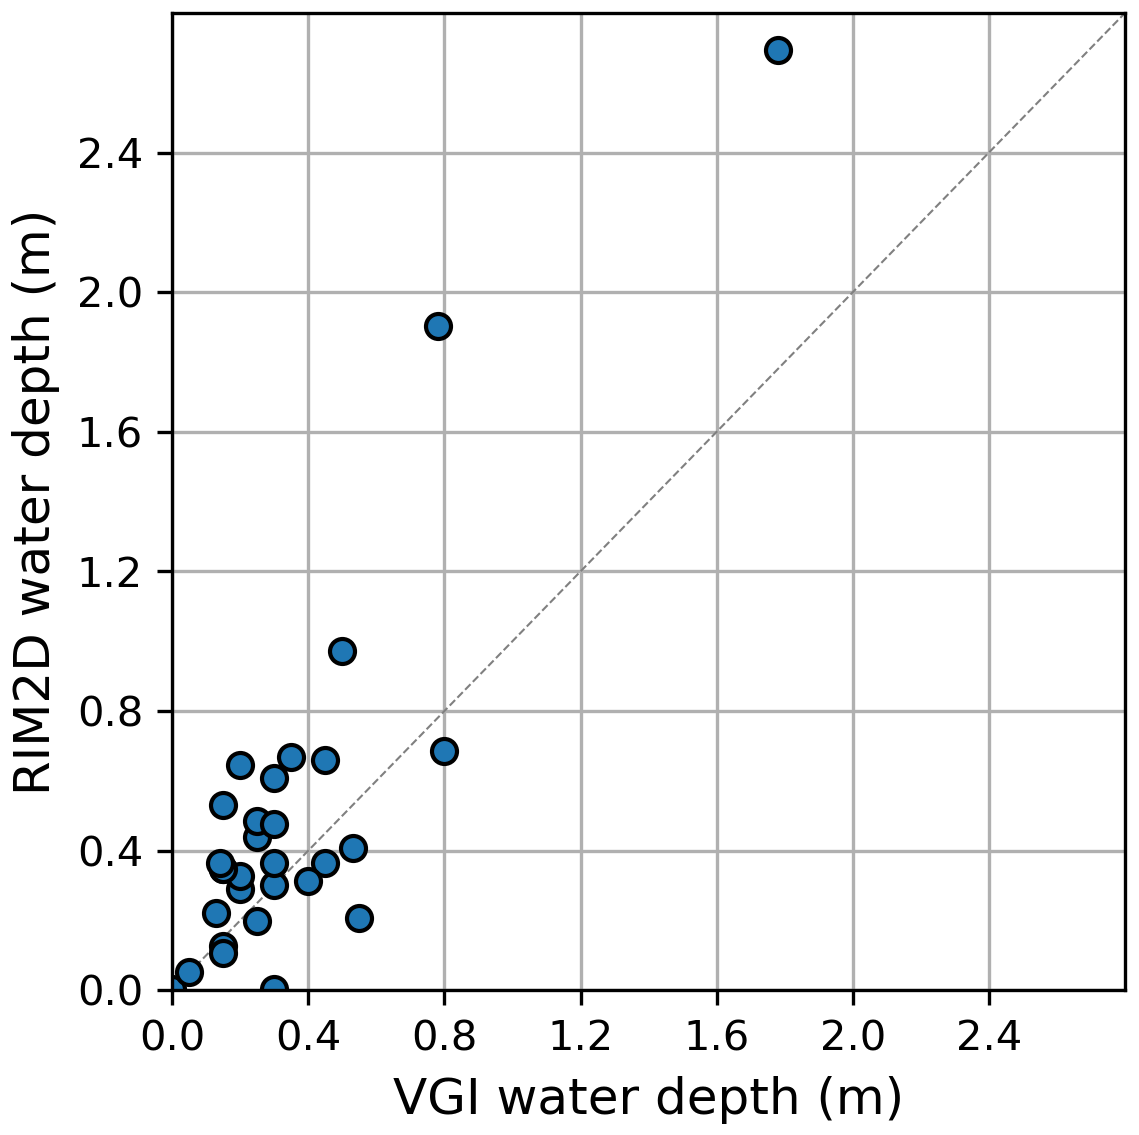
Figure B2Validation of the dx = 5 m RIM2D simulation water depths at 30 VGI validation locations in Braunschweig using measured water marks.
RIM2D is open-source for scientific use under European Union Public Licence (EUPL) v1.2. Access is granted upon request. The simulations were performed with version 0.2.
The OSM building shape files used in this research can be freely obtained from https://download.geofabrik.de/europe/germany.html (Geofabrik Downloads, 2025). The land cover raster, which was used to assign roughness values to the simulation domain, is openly accessible at https://www.mundialis.de/en/germany-2020-land-cover-based-on-sentinel-2-data/ (mundialis, 2021).
SKBG: conceptualization, methodology, investigation, simulation, software, analysis, visualization, writing. HA: RIM2D software, conceptualization, review, writing. KSL: conceptualization, review, writing. MS: conceptualization, simulation, software, review.
At least one of the (co-)authors is a member of the editorial board of Natural Hazards and Earth System Sciences. The peer-review process was guided by an independent editor, and the authors also have no other competing interests to declare.
Publisher’s note: Copernicus Publications remains neutral with regard to jurisdictional claims made in the text, published maps, institutional affiliations, or any other geographical representation in this paper. While Copernicus Publications makes every effort to include appropriate place names, the final responsibility lies with the authors.
This research was performed within the frame of the DIRECTED Project (https://directedproject.eu/, last access: 5 May 2025). Funding of the DIRECTED Project within the European Union's Horizon Europe – the Framework Programme for Research and Innovation (grant agreement no. 101073978, HORIZON-CL3-2021-DRS-01) is gratefully acknowledged. This work utilized high-performance computing resources made possible by funding from the Ministry of Science, Research and Culture of the State of Brandenburg (MWFK), and these resources are operated by the IT Services and Operations unit of the Helmholtz Centre Potsdam. We thank the contributors of VGI data in Braunschweig and Lennard Marks for his contributions to the validation dataset.
This research has been supported by EU Horizon 2020 (grant no. 101073978, HORIZON-CL3-2021-DRS-01).
The article processing charges for this open-access publication were covered by the GFZ Helmholtz Centre for Geosciences.
This paper was edited by Maria-Carmen Llasat and reviewed by two anonymous referees.
Alfonso, L., Mukolwe, M., and Di Baldassarre, G.: Probabilistic flood maps to support decision-making: Mapping the value of information, Water Resour. Res., 52, 1026–1043, 2016. a
Apel, H., Vorogushyn, S., and Merz, B.: Brief communication: Impact forecasting could substantially improve the emergency management of deadly floods: case study July 2021 floods in Germany, Nat. Hazards Earth Syst. Sci., 22, 3005–3014, https://doi.org/10.5194/nhess-22-3005-2022, 2022. a, b, c, d
Apel, H., Benisch, J., Helm, B., Vorogushyn, S., and Merz, B.: Fast urban inundation simulation with RIM2D for flood risk assessment and forecasting, Frontiers in Water, 6, 1310182, https://doi.org/10.3389/frwa.2024.1310182, 2024. a, b, c, d, e, f
Assumpção, T. H., Popescu, I., Jonoski, A., and Solomatine, D. P.: Citizen observations contributing to flood modelling: opportunities and challenges, Hydrol. Earth Syst. Sci., 22, 1473–1489, https://doi.org/10.5194/hess-22-1473-2018, 2018. a
Bates, P. D., Horritt, M. S., and Fewtrell, T. J.: A simple inertial formulation of the shallow water equations for efficient two-dimensional flood inundation modelling, J. Hydrology, 387, 33–45, https://doi.org/10.1016/j.jhydrol.2010.03.027, 2010. a, b, c
Bernini, A. and Franchini, M.: A rapid model for delimiting flooded areas, Water Resour. Manag., 27, 3825–3846, 2013. a
Caviedes-Voullième, D., Morales-Hernández, M., Norman, M. R., and Özgen-Xian, I.: SERGHEI (SERGHEI-SWE) v1.0: a performance-portable high-performance parallel-computing shallow-water solver for hydrology and environmental hydraulics, Geosci. Model Dev., 16, 977–1008, https://doi.org/10.5194/gmd-16-977-2023, 2023. a
Costabile, P., Costanzo, C., Kalogiros, J., and Bellos, V.: Toward Street-Level Nowcasting of Flash Floods Impacts Based on HPC Hydrodynamic Modeling at the Watershed Scale and High-Resolution Weather Radar Data, Water Resour. Res., 59, e2023WR034599, https://doi.org/10.1029/2023wr034599, 2023. a
de Almeida, G. A. and Bates, P.: Applicability of the local inertial approximation of the shallow water equations to flood modeling, Water Resour. Res., 49, 4833–4844, 2013. a, b, c
de Almeida, G. A., Bates, P., Freer, J. E., and Souvignet, M.: Improving the stability of a simple formulation of the shallow water equations for 2-D flood modeling, Water Resour. Res., 48, W05528, https://doi.org/10.1029/2011WR011570, 2012. a
de Moel, H. and Aerts, J.: Effect of uncertainty in land use, damage models and inundation depth on flood damage estimates, Nat. Hazards, 58, 407–425, 2011. a
Drews, M., Steinhausen, M., Larsen, M. A. D., Dømgaard, M. L., Huszti, L., Rácz, T., Wortmann, M., Hattermann, F. F., and Schröter, K.: The utility of using Volunteered Geographic Information (VGI) for evaluating pluvial flood models, Sci. Total Environ., 894, 164962, https://doi.org/10.1016/j.scitotenv.2023.164962, 2023. a, b, c
Evertsbusch, S., Prause, D., Dieler, S., Sbresny, J., and Gehrt, E.: Erläuterungen zur Bodenkarte von Niedersachsen 1 : 50.000 (BK50), LBEG, https://www.lbeg.niedersachsen.de/download/159050/BK50-Erlaeuterungen_Teil_4_-_Technische_Dokumentation_.pdf/ (last access: 5 May 2025), 2020. a
Geofabrik Downloads: Download OpenStreetMap data for this region: Germany, Geofabrik Downloads [data set], https://download.geofabrik.de/europe/germany.html, last access: 5 May 2025. a
Khosh Bin Ghomash, S., Bachmann, D., Caviedes-Voullième, D., and Hinz, C.: Impact of rainfall movement on flash flood response: A synthetic study of a semi-arid mountainous catchment, Water, 14, 1844, https://doi.org/10.3390/w14121844, 2022. a
Khosh Bin Ghomash, S., Apel, H., and Caviedes-Voullième, D.: Are 2D shallow-water solvers fast enough for early flood warning? A comparative assessment on the 2021 Ahr valley flood event, Nat. Hazards Earth Syst. Sci., 24, 2857–2874, https://doi.org/10.5194/nhess-24-2857-2024, 2024. a, b
Kreibich, H., Hudson, P., and Merz, B.: Knowing what to do substantially improves the effectiveness of flood early warning, B. Am. Meteorol. Soc., 102, E1450–E1463, 2021. a, b
Merz, B., Kreibich, H., Schwarze, R., and Thieken, A.: Review article “Assessment of economic flood damage”, Nat. Hazards Earth Syst. Sci., 10, 1697–1724, https://doi.org/10.5194/nhess-10-1697-2010, 2010. a
Merz, B., Kuhlicke, C., Kunz, M., Pittore, M., Babeyko, A., Bresch, D. N., Domeisen, D. I., Feser, F., Koszalka, I., Kreibich, H., Pantillon, F., Parolai, S., Pinto, J. G., Punge, H. J., Rivalta, E., Schröter, K., A Strehlow, K., Weisse, R., and Wurpts, A.: Impact forecasting to support emergency management of natural hazards, Rev. Geophys., 58, e2020RG000704, https://doi.org/10.1029/2020RG000704, 2020. a, b
mundialis: Germany 2020 – Land cover based on Sentinel-2 data, mundialis [data set], https://www.mundialis.de/en/germany-2020-land-cover-based-on-sentinel-2-data/ (last access: 5 April 2025), 2021. a
Najafi, H., Shrestha, P. K., Rakovec, O., Apel, H., Vorogushyn, S., Kumar, R., Thober, S., Merz, B., and Samaniego, L.: High-resolution impact-based early warning system for riverine flooding, Nat. Commun., 15, 3726, https://doi.org/10.1038/s41467-024-48065-y, 2024. a, b, c
Ospina, R. and Ferrari, S. L.: Inflated beta distributions, Statistical papers, 51, 111–126, 2010. a
Paprotny, D., Morales-Nápoles, O., and Jonkman, S. N.: HANZE: a pan-European database of exposure to natural hazards and damaging historical floods since 1870, Earth Syst. Sci. Data, 10, 565–581, https://doi.org/10.5194/essd-10-565-2018, 2018. a
Pasculli, A., Cinosi, J., Turconi, L., and Sciarra, N.: Learning case study of a shallow-water model to assess an early-warning system for fast alpine muddy-debris-flow, Water, 13, 750, https://doi.org/10.3390/w13060750, 2021. a
Riembauer, G., Weinmann, A., Xu, S., Eichfuss, S., Eberz, C., and Neteler, M.: Germany-wide Sentinel-2 based land cover classification and change detection for settlement and infrastructure monitoring, in: Proceedings of the 2021 Conference on Big Data from Space (BiDS'21), Virtual, 18–20 May 2021, Publication Office of the European Union, Luxembourg, 53–56, https://doi.org/10.2760/125905, 2021. a
Rözer, V., Kreibich, H., Schröter, K., Müller, M., Sairam, N., Doss-Gollin, J., Lall, U., and Merz, B.: Probabilistic models significantly reduce uncertainty in Hurricane Harvey pluvial flood loss estimates, Earth's Future, 7, 384–394, 2019. a
Šakić Trogrlić, R., van den Homberg, M., Budimir, M., McQuistan, C., Sneddon, A., and Golding, B.: Early warning systems and their role in disaster risk reduction, in: Towards the “perfect” weather warning: bridging disciplinary gaps through partnership and communication, edited by: Golding, B., Springer International Publishing, Cham, 11–46, https://doi.org/10.1007/978-3-030-98989-7_2, 2022. a
See, L.: A review of citizen science and crowdsourcing in applications of pluvial flooding, Frontiers in Earth Science, 7, 44, https://doi.org/10.3389/feart.2019.00044, 2019. a
Skougaard Kaspersen, P., Høegh Ravn, N., Arnbjerg-Nielsen, K., Madsen, H., and Drews, M.: Comparison of the impacts of urban development and climate change on exposing European cities to pluvial flooding, Hydrol. Earth Syst. Sci., 21, 4131–4147, https://doi.org/10.5194/hess-21-4131-2017, 2017. a
Stan Development Team: RStan: the R interface to Stan, r package version 2.32.6, https://mc-stan.org/ (last access: 5 May 2025), 2024. a
Steinhausen, M., Paprotny, D., Dottori, F., Sairam, N., Mentaschi, L., Alfieri, L., Lüdtke, S., Kreibich, H., and Schröter, K.: Drivers of future fluvial flood risk change for residential buildings in Europe, Global Environ. Chang., 76, 102559, https://doi.org/10.1016/j.gloenvcha.2022.102559, 2022. a
Tatem, A. J.: WorldPop, open data for spatial demography, Scientific Data, 4, 170004, https://doi.org/10.1038/sdata.2017.4, 2017. a
Thieken, A. H., Bubeck, P., Heidenreich, A., von Keyserlingk, J., Dillenardt, L., and Otto, A.: Performance of the flood warning system in Germany in July 2021 – insights from affected residents, Nat. Hazards Earth Syst. Sci., 23, 973–990, https://doi.org/10.5194/nhess-23-973-2023, 2023. a
Wing, O. E., Bates, P. D., Sampson, C. C., Smith, A. M., Johnson, K. A., and Erickson, T. A.: Validation of a 30 m resolution flood hazard model of the conterminous United States, Water Resour. Res., 53, 7968–7986, 2017. a
- Abstract
- Introduction
- Methods
- Results and discussion
- Conclusions
- Appendix A: Model comparison with official city flood hazard maps
- Appendix B: Examples of model comparison with VGI data
- Code availability
- Data availability
- Author contributions
- Competing interests
- Disclaimer
- Acknowledgements
- Financial support
- Review statement
- References