the Creative Commons Attribution 4.0 License.
the Creative Commons Attribution 4.0 License.
 | 08 May 2025
Unravelling the capacity–action gap in flood risk adaptation
Anne von Streit
Matthias Garschagen
Against the backdrop of increasing climate risks, strengthening the adaptive capacity of citizens is crucial. Yet, the usefulness of the concept of adaptive capacity is currently limited for science and policy, as it is not clear what exactly constitutes adaptive capacity nor whether capacity translates into adaptation action. Drawing on survey data from 1571 households in southern Germany collected in 2022, we use regression analysis to examine the relationship between adaptive capacity indicators and the implementation of pluvial flood risk adaptation measures. Our results confirm a capacity–action gap, as high levels of adaptive capacity do not necessarily translate into household adaptation action. Widely used generic capacity indicators such as income and education are less important for adaptation decisions, while specific capacity indicators, such as risk perception, damage experience, and motivation, lead to action. We found initial evidence of a nonlinear effect: while a certain stock of financial and human capital is required, additional capital gains do not translate into additional adaptation action. Thus, enhancing the specific capacity of households should be a priority, as generic assets alone will not suffice in coping with climate risk.
- Article
(5405 KB) - Full-text XML
- BibTeX
- EndNote


As climate change advances, it becomes increasingly clear that mitigation efforts alone will not suffice and societies have to adapt to more frequent and severe extreme weather conditions. In European welfare states, protection against natural hazards was often provided by structural, mainly government-led, interventions in the past. Nowadays, private actors are increasingly being called upon to take action (Mees et al., 2016; Uittenbroek et al., 2019; Doorn et al., 2021) and nudged or even obligated by law to protect themselves and to limit damage. The possession of adaptive capacity is an important precondition for adaptation action (Doorn et al., 2021).
Although the importance of adaptive capacity is widely acknowledged in academic debate, ambiguity exists as to what exactly constitutes adaptive capacity (Whitney et al., 2017; Siders, 2019). Firstly, the numerous existing definitions in the literature provide little guidance for conceptualising adaptive capacity, as many are very broad and sometimes even contradictory (Siders, 2019, p. 9). Secondly, no standard metrics and methods have been developed so far, leading to a proliferation of different indicators and assessments (Whitney et al., 2017; Siders, 2019). While it is beneficial that researchers have become more open to considering diverse capacities, this vagueness also has brought along limitations. Research is diverse and fragmented, lacking comparative analyses as well as actionable policy guidance (Siders, 2019).
Furthermore, the possession of adaptive capacity is often used as a proxy for adaptation (e.g. Andrijevic et al., 2023) without critically questioning this assumption. For more than a decade, the question of whether higher levels of adaptive capacity translate into adoption action has been a major concern in adaptation research (Adger and Barnett, 2009, p. 2802; Ara Begum et al., 2022, p. 164). In our opinion, the usefulness of the adaptive capacity concept for adaptation research and governance is inherently linked to its ability to infer adaptation behaviour. Therefore, more research on the capacity–action relation is urgently needed.
Case studies are extraordinarily useful research methodologies in this context, as they enable the consideration of the scale- and context-dependent nature of adaptive capacity. Based on the assumption that “adaptations are manifestations of adaptive capacity” (Smit and Wandel, 2006, p. 286), they can provide insights into relevant capacities for different actors and settings and also help to identify general patterns across diverse contexts.
So far, only a handful of studies have empirically examined the relationship between adaptive capacity indicators and adaptation action (Grothmann and Patt, 2005; Mortreux et al., 2020; Barnes et al., 2020; Green et al., 2021; Bartelet et al., 2023), and, to our knowledge, no study has yet assessed how generic and specific adaptive capacities translate into adaptation action within a European context. The majority of studies concentrate on assessing the adaptive capacity of households, communities, and companies in coastal areas, thereby considering climate stressors such as sea level rise, the degradation of reef ecosystems, and associated fisheries and tourism activities (Barnes et al., 2020; Green et al., 2021; Bartelet et al., 2023).
This paper contributes to this under-researched topic by analysing the adaptive capacity and subsequent adaptive behaviour of German households to urban pluvial flooding. To this end, we draw on data from a household survey to take stock of generic and specific capacities and link them with private flood risk adaptation measures. Our case study area is an affluent and dynamically growing urban–rural region with comparatively high levels of income and wealth in the vicinity of Munich in southern Germany. The area can serve as a window into a world with increasing heavy precipitation events and pluvial flood risks. The region is already a hotspot for heavy precipitation events (Lengfeld et al., 2021a) and subsequent pluvial flooding due to its geographical location in the foothills of the Alps. Many local authorities currently provide only limited public pluvial flood protection and little information (von Streit et al., 2024), thereby increasingly requiring households to deal with adaptation privately.
After conceptualising adaptation capacity and identifying commonly used indicators based on previous literature in Sect. 2, we outline our methodological approach and give more context about the case study region. Our empirical findings are presented and discussed in Sects. 4 and 5. Finally, we summarise our main findings and their implications for research and policy.
2.1 Evolution of the concept
Research on adaptive capacity has grown exponentially in recent years (Siders, 2019), moving from an asset-based understanding towards a more holistic assessment of adaptive capacity. To describe the evolution of the concept, scholars have identified three research generations (Mortreux and Barnett, 2017; Elrick-Barr et al., 2023). The first generation defines adaptive capacity as a function of access to resources and entitlements, whereby education, health, land ownership, income, material assets, and social capital form the core set of indicators at the household level. This first generation thus concentrates on generic capacities which “[address] deficiencies in basic human development needs” (Eakin et al., 2014, p. 2). Drawing on the sustainable livelihood framework (Scoones, 1998; Ellis, 2000), this conceptualisation is often employed in the context of resource-dependent societies such as farmers or coastal communities (e.g. Nelson et al., 2010; Thulstrup, 2015). In the second generation, the research attention expanded to factors which mobilise capacities. Besides generic capacities, studies evaluate threat-specific capacities such as risk awareness, coping capabilities, previous experience, and responsibility appraisal (e.g. Cinner et al., 2018; Barnes et al., 2020; Green et al., 2021). This body of research is driven by various theoretical frameworks, e.g. the norm activation model (Schwartz, 1977), the theory of planned behaviour (Ajzen, 1991), the protection motivation theory (Rogers, 1983; Grothmann and Reusswig, 2006), the model of private proactive adaptation to climate change (Grothmann, 2005; Grothmann and Patt, 2005), the protection action decision model (Lindell and Perry, 2012), and the augmented protection motivation theory (Oakley et al., 2020), as well as by studies which demonstrated the importance of psycho-social characteristics for adaptation (Grothmann and Patt, 2005; Bamberg et al., 2017; van Valkengoed and Steg, 2019). However, recent publications criticise the isolated view of single actors, thus neglecting the transference and cross-level interactions of adaptive capacities within a system (Vallury et al., 2022; Elrick-Barr et al., 2023). Elrick-Barr et al. (2023) therefore call for a more holistic, third generation of adaptive capacity assessment, which considers the transfer of capacity between individuals, communities, and authorities.
Our understanding and conceptualisation of adaptive capacity are informed by all three generations, encompassing both generic and specific capacity, while also acknowledging that households' capacities are shaped by social, economic, and political processes at the macroscale. Our conceptual understanding of adaptive capacity is best mirrored in the definition provided by Nelson et al. (2007, p. 397), who define adaptive capacity as “preconditions necessary to enable adaptation, including social and physical elements, and the ability to mobilize these elements”.
2.2 Identifying adaptive capacity indicators
With the evolution and broadening of the concept, the range of indicators employed in empirical studies has similarly expanded. The list of potential adaptive capacity indicators has become so extensive that a coherent and comparable assessment is hardly possible. For example, Siders (2019) points out that most studies use indicators with little reference to prior work and identifies more than 150 determinants in her literature review. Taking stock of the adaptive capacity indicators currently in use as proxy for adaptive behaviour and empirically evaluating their relevance are crucial to enhancing the concept's applicability for both research and policy.
We conducted a review of the current literature to take stock of commonly used adaptive capacity indicators, irrespective of our own judgement on whether or not these indicators explain adaptive actions. While many studies focus on explaining household adaptive behaviour (e.g. Bamberg et al., 2017; van Valkengoed and Steg, 2019), we restricted our review to papers that explicitly address the concept of adaptive capacity. We scanned the current literature from the Web of Science and Scopus databases, searching for peer-reviewed articles with “adaptive capacity” in the title. From this body of literature, we identified (a) 11 highly cited conceptual papers and reviews on adaptive capacity indicators at the household level (e.g. Whitney et al., 2017; Mortreux and Barnett, 2017; Cinner et al., 2018; Siders, 2019) and (b) 5 quantitative empirical papers on the capacity–action relationship (Grothmann and Patt, 2005; Mortreux et al., 2020; Barnes et al., 2020; Green et al., 2021; Bartelet et al., 2023). Table A1 in the appendix provides an overview of studies from both bodies of literature that have significantly shaped the conceptualisation and operationalisation of adaptive capacity in this research. In line with previous work (Mortreux and Barnett, 2017), we found that in both bodies of literature earlier studies (from the 2000s to the 2010s) tend to focus on capital-based generic capacity, whereas more recent studies increasingly consider both generic and threat-specific capacity. In terms of study contexts, households in rural and coastal communities in Africa, Australia, and the tropics dominate, whereas the adaptive capacity of European households has received limited attention so far. The selection of indicators to measure adaptive capacities is mostly done through a literature-based analysis, with theoretical frameworks rarely being explicitly addressed. For empirical studies examining the capacity–action relationship, we identified only a small number of studies. They use diverse sets of indicators, with partial overlaps, reflecting the wide variety of study contexts (for an overview, see Table A1). Consequently, findings are difficult to compare across case studies, and strategic meta-studies are still lacking.
Based on the literature review, we compiled a comprehensive list containing 49 indicators drawn from the capacity–action studies presented in Table A1, regardless of conflicting findings or null results. To ensure comparability, we focused our indicator selection exclusively on the quantitative empirical studies examining the capacity–action relationship. A cross-check confirmed that these indicators are also supported by the highly cited literature. In contrast to other studies (e.g. Grothmann and Patt, 2005; Barnes et al., 2020), we chose not to consider personal characteristics such as age, migrant background, or sex of the primary decision-maker in the household, as these factors are unalterable and not necessarily representative of the household as a whole. After grouping indicators that refer to the same indicator but use different terms (e.g. social connectivity and bonding social capital), we discussed the relevance of the resulting 32 indicators for the German context within the author team. A total of 14 indicators were excluded as they specifically refer to resource-dependent communities. For example, while livelihood diversification is often understood as a form of flexibility in societies with a natural-resource-based economy, we consider this capacity not relevant in our study setting.
This process resulted in 18 indicators representing the adaptive capacity of households in the German pluvial flood context. Although we derived the indicators empirically, many are also grounded in the theoretical frameworks mentioned above (e.g. protection motivation theory, sustainable livelihood framework). Table 1 provides an overview of the indicators, our operational definitions, key references, and theoretical foundations. To facilitate interpretation, we mapped the indicators into generic and specific capacities.
Grothmann and Patt (2005); Mortreux and Barnett (2017); Whitney et al. (2017); Cinner et al. (2018); Barnes et al. (2020); Mortreux et al. (2020)(Scoones, 1998; Ellis, 2000)(Grothmann, 2005; Grothmann and Patt, 2005)Grothmann and Patt (2005); Mortreux and Barnett (2017); Cinner et al. (2018); Mortreux et al. (2020); Green et al. (2021)(Scoones, 1998; Ellis, 2000)(Grothmann, 2005; Grothmann and Patt, 2005)Mortreux et al. (2020); Barnes et al. (2020)(Scoones, 1998; Ellis, 2000)Grothmann and Patt (2005); Mortreux et al. (2020)(Scoones, 1998; Ellis, 2000)(Grothmann, 2005; Grothmann and Patt, 2005)Whitney et al. (2017); Cinner et al. (2018); Mortreux et al. (2020)Mortreux and Barnett (2017); Whitney et al. (2017); Cinner et al. (2018); Green et al. (2021)Whitney et al. (2017); Cinner et al. (2018); Barnes et al. (2020); Mortreux et al. (2020); Green et al. (2021)(Scoones, 1998; Ellis, 2000)Cinner et al. (2018); Mortreux et al. (2020); Green et al. (2021)(Scoones, 1998; Ellis, 2000)Whitney et al. (2017); Barnes et al. (2020)(Grothmann, 2005; Grothmann and Patt, 2005)Mortreux and Barnett (2017); Whitney et al. (2017); Mortreux et al. (2020); Green et al. (2021)(Schwartz, 1977)(Rogers, 1983; Grothmann and Reusswig, 2006)(Grothmann, 2005; Grothmann and Patt, 2005)(Lindell and Perry, 2012)(Oakley et al., 2020)Mortreux and Barnett (2017); Mortreux et al. (2020); Barnes et al. (2020)(Grothmann, 2005; Grothmann and Patt, 2005)Mortreux and Barnett (2017); Mortreux et al. (2020)(Schwartz, 1977)(Ajzen, 1991)(Grothmann, 2005; Grothmann and Patt, 2005)(Lindell and Perry, 2012)(Oakley et al., 2020)Mortreux and Barnett (2017); Mortreux et al. (2020)(Schwartz, 1977)(Ajzen, 1991)(Grothmann, 2005; Grothmann and Patt, 2005)(Lindell and Perry, 2012)(Oakley et al., 2020)Mortreux and Barnett (2017); Barnes et al. (2020)(Grothmann, 2005; Grothmann and Patt, 2005)(Lindell and Perry, 2012)(Oakley et al., 2020)Mortreux and Barnett (2017); Mortreux et al. (2020); Green et al. (2021)(Grothmann, 2005; Grothmann and Patt, 2005)(Lindell and Perry, 2012)Mortreux and Barnett (2017); Cinner et al. (2018); Bartelet et al. (2023)(Schwartz, 1977)(Ajzen, 1991)(Rogers, 1983; Grothmann and Reusswig, 2006)(Grothmann, 2005; Grothmann and Patt, 2005)(Lindell and Perry, 2012)(Oakley et al., 2020)Cinner et al. (2018); Green et al. (2021)(Rogers, 1983; Grothmann and Reusswig, 2006)(Grothmann, 2005; Grothmann and Patt, 2005)(Lindell and Perry, 2012)Mortreux and Barnett (2017); Bartelet et al. (2023)(Grothmann, 2005; Grothmann and Patt, 2005)Table 1Conceptualisation of households' adaptive capacity to pluvial flooding.
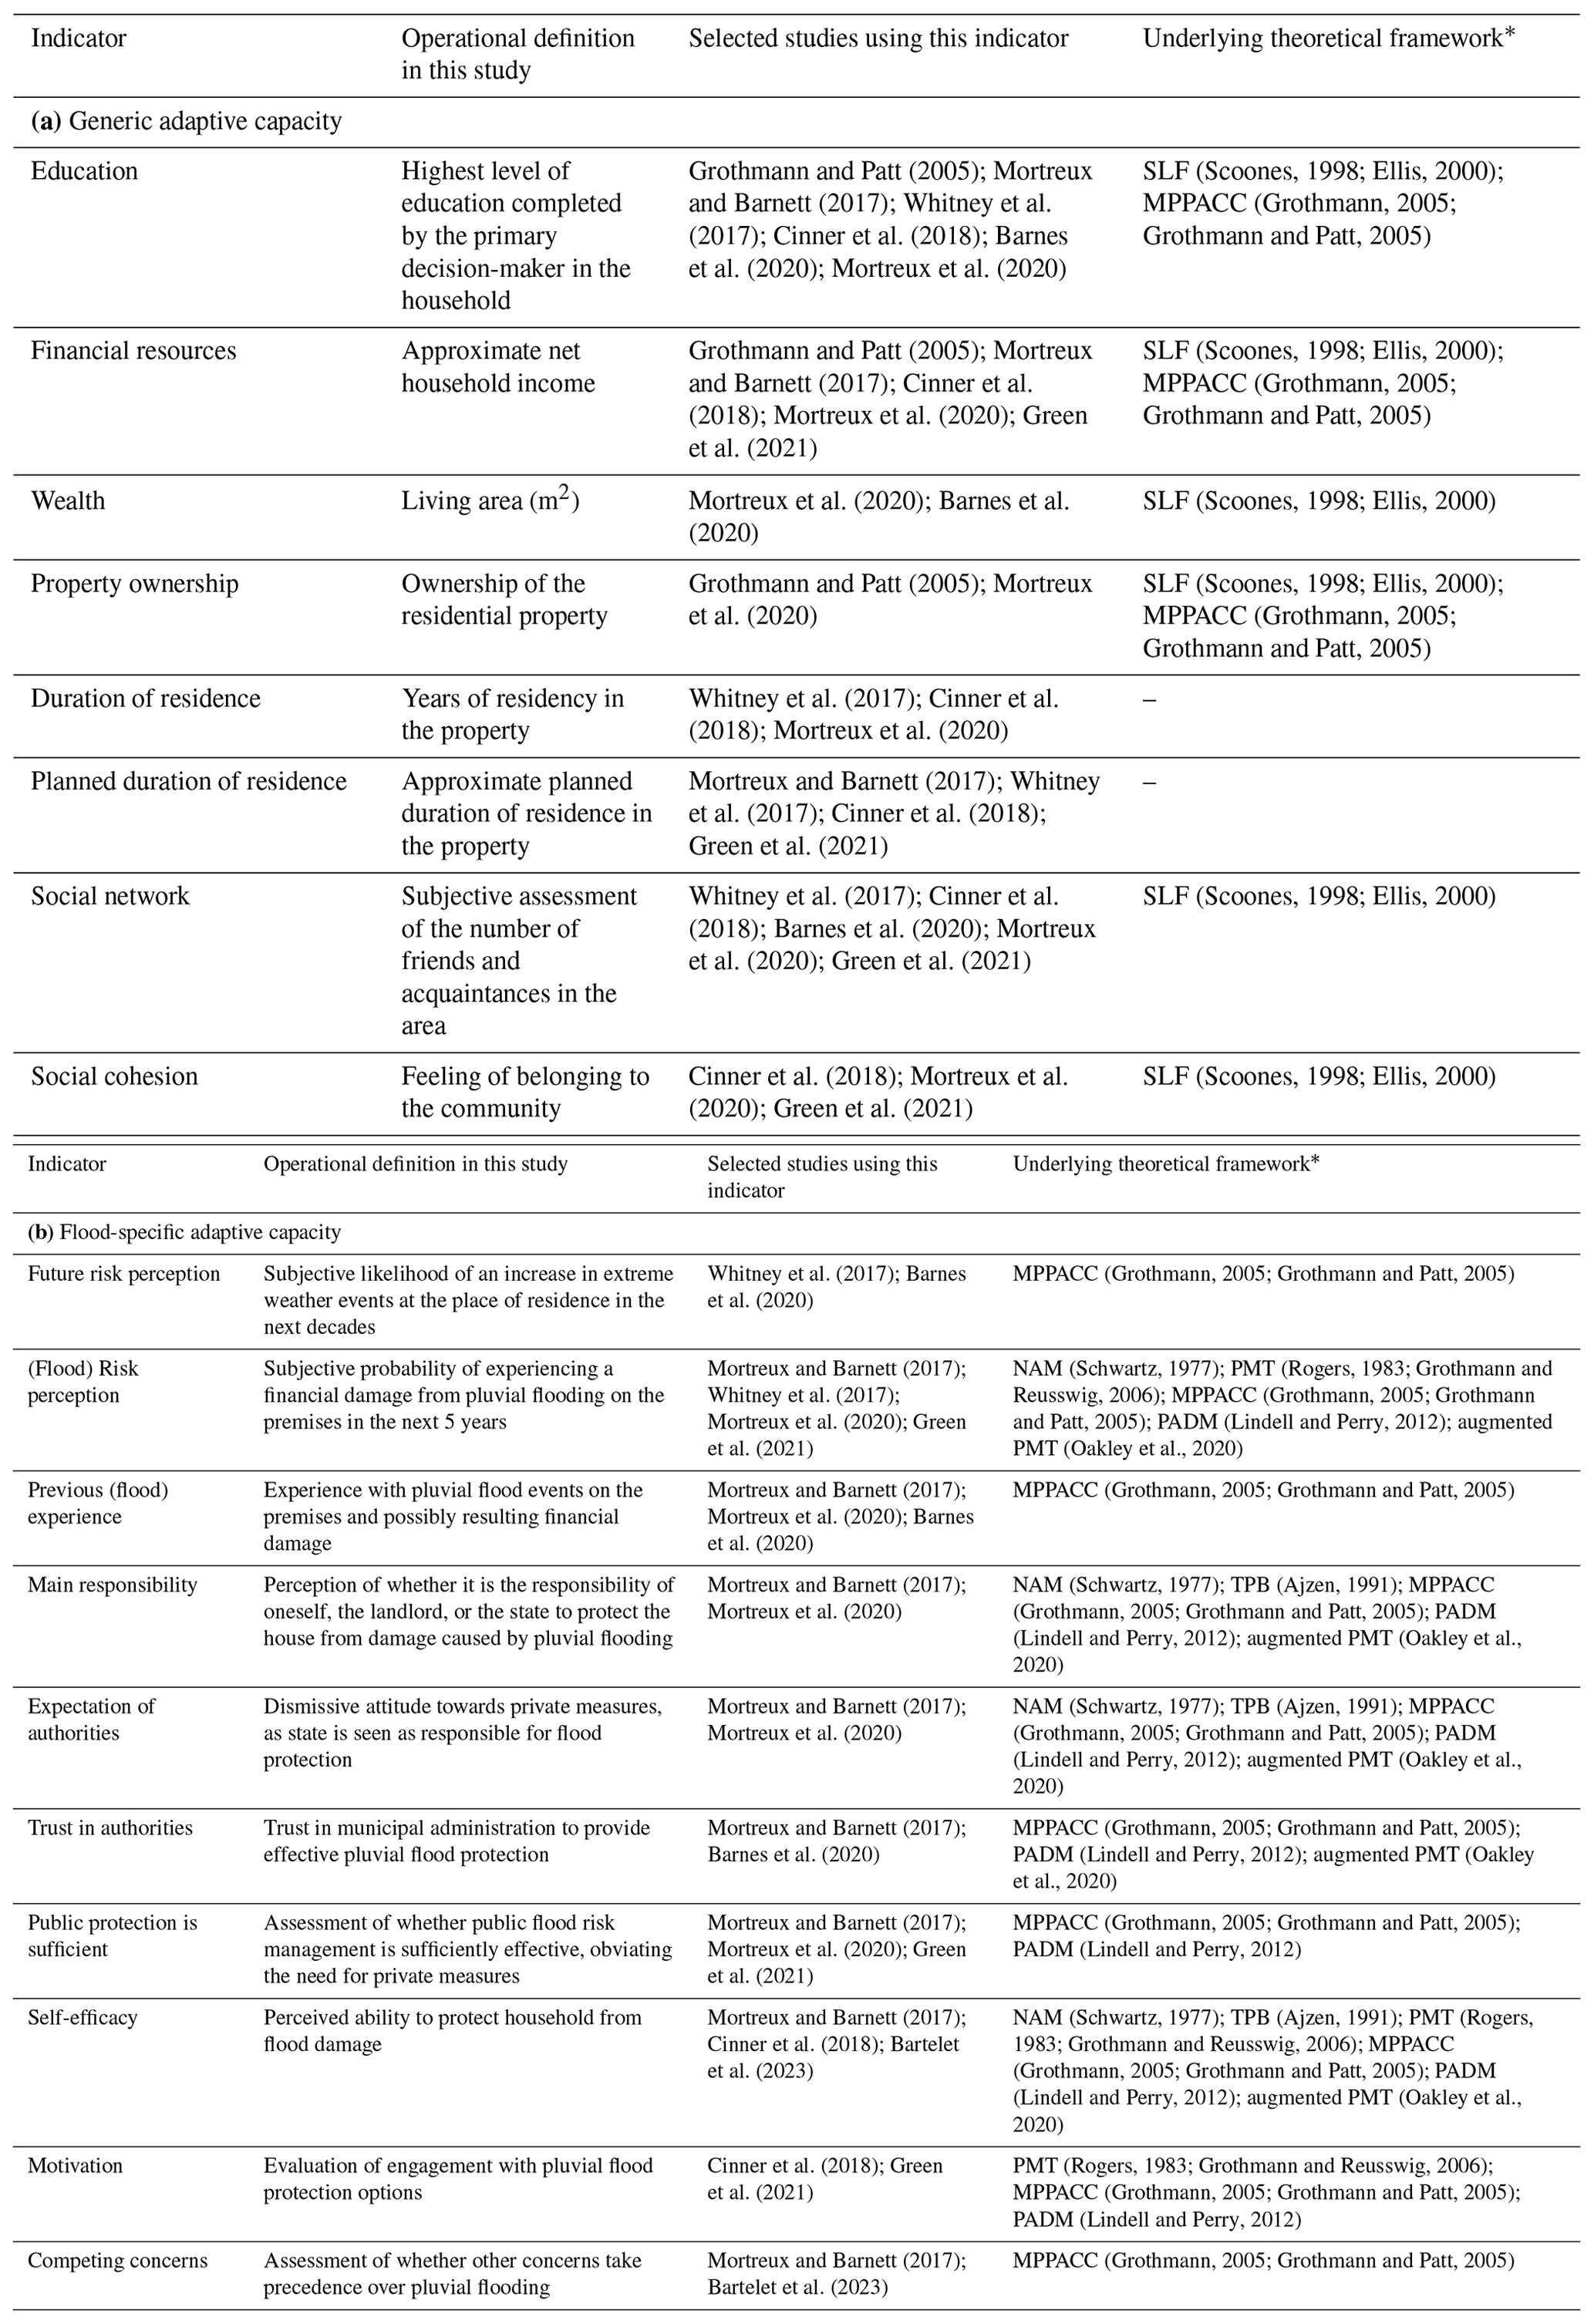
* Abbreviations are as follows: NAM (norm activation model), MPPACC (model of private proactive adaptation to climate change), PADM (protection action decision model), PMT (protection motivation theory), augmented PMT (augmented protection motivation theory), SLF (sustainable livelihood framework), TPB (theory of planned behaviour).
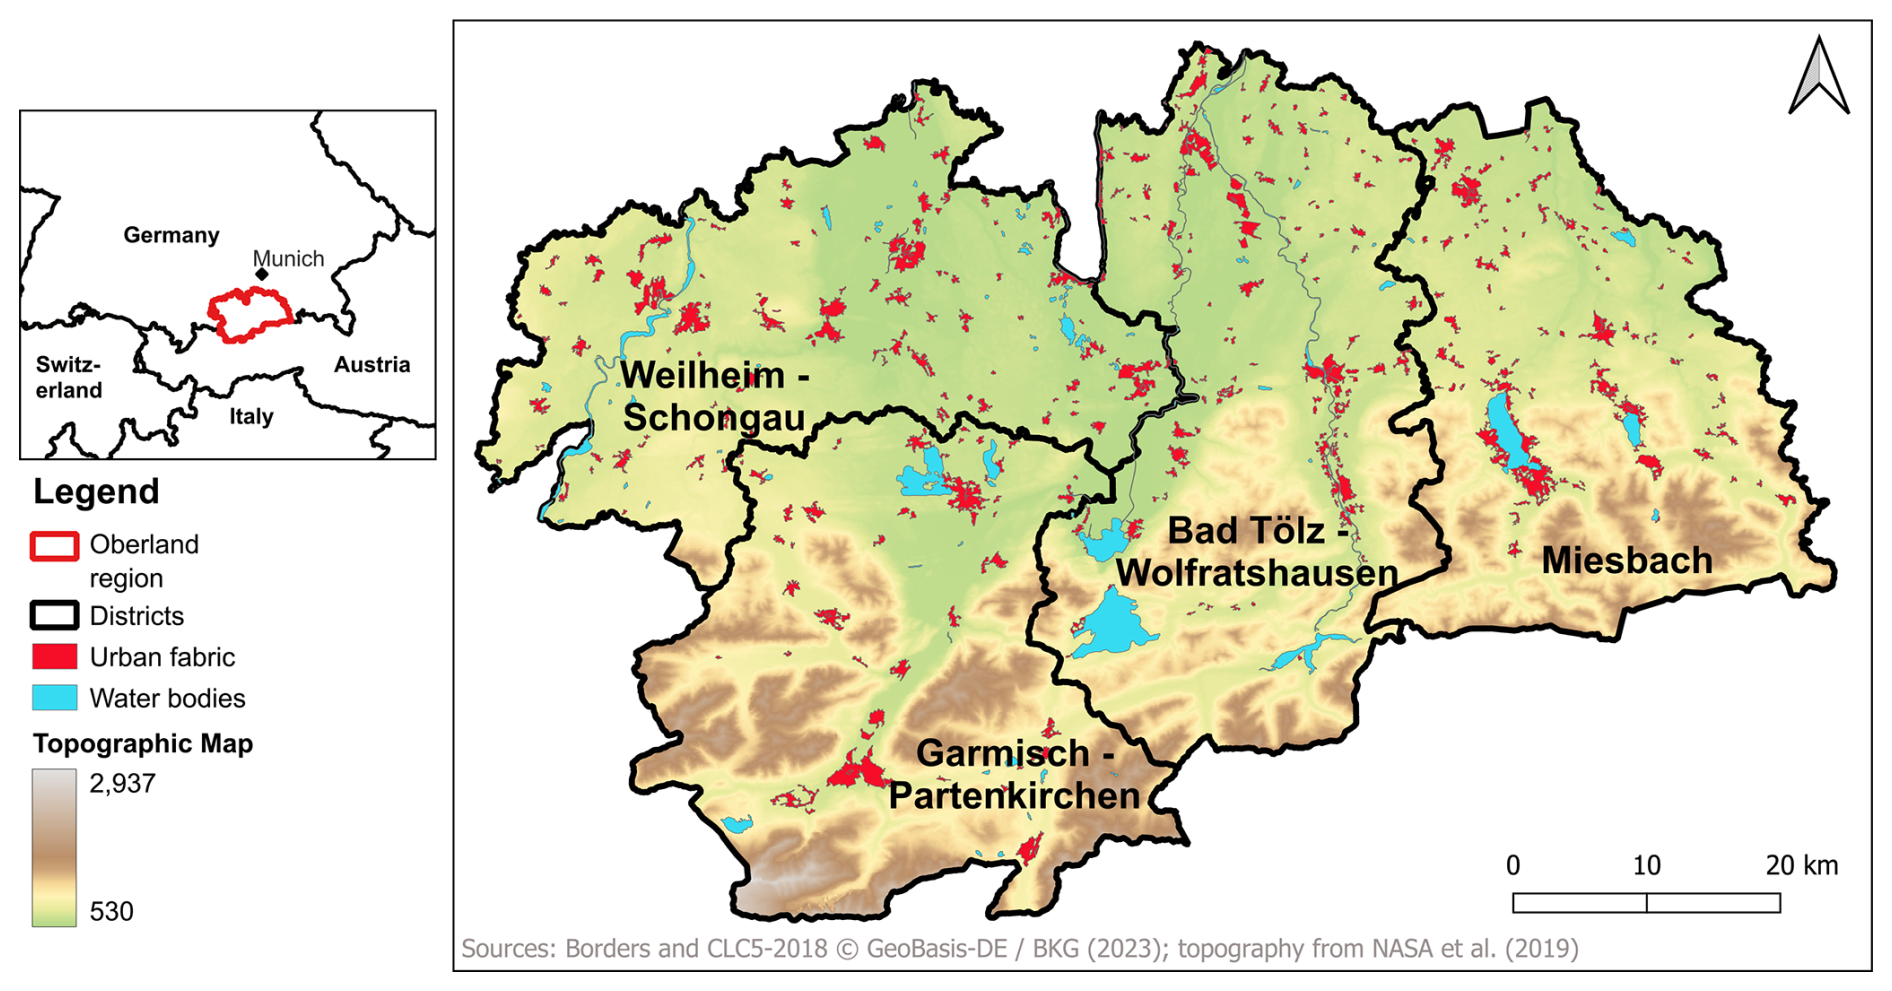
Figure 1Location and topographic map of the study area.
3.1 Study area
The Oberland was chosen as case study area because it offers a glimpse into a future world with growing climate risks and urban growth pressure. The region consists of four districts located south of Munich in Upper Bavaria, southern Germany (Fig. 1). It is one of the most affluent and dynamically growing regions in Germany with comparatively high levels of income and wealth (Bundesinstitut für Bau-, Stadt- und Raumforschung, 2021; Heider et al., 2023). The region is typical of prosperous urban–rural areas in metropolitan regions of western Germany which benefit significantly from their proximity to economic centres and their own dynamic economic structures (Heider et al., 2023, p. 9). However, the dynamic growth also brings challenges. Property prices in the Oberland rank among the highest in Bavaria (Sparkassen-Immobilien-Vermittlungs-GmbH, 2024); the real estate market is highly competitive and housing is scarce, and development pressure on land in and around cities is growing. The Oberland area is today already prone to more intense precipitation, due to its geographical location in the foothills of the Alps, and has experienced the highest number of heavy precipitation events in Germany (Lengfeld et al., 2021a). Future climate projections indicate that heavy precipitation will become more frequent (Bednar-Friedl et al., 2022), and changing precipitation patterns reveal that climate change is already advancing in the area (Emeis, 2021).
An analysis of weather prediction data of the region shows that heavy precipitation and resulting pluvial flooding are caused by different weather patterns. First, a blockage of northerly flows of humid air masses at the northern edge of the Alps can cause heavy continuous rain for 2 or 3 d, which then leads to flooding along pre-Alpine rivers heading northward (Emeis, 2021). This weather situation caused severe flooding in the region, e.g. in August 2002, August 2005, and June 2013. Second, deep convection, partly triggered by the mountainous terrain of the Alps, can lead to heavy and often slow-moving thunderstorms which affect only small areas in the region but cause up to 100 L of rain per square metre within a few hours (Emeis, 2021). In June 2016 such events triggered numerous pluvial floods with devastating effects in the region. For example, in the small village of Polling (see Fig. 2), building damage amounting to several million euros occurred (Bayerisches Landesamt für Umwelt, 2017). Our analysis of regional fire brigade data revealed that approximately 3000 operations in the years 2011 to 2021 are attributable to heavy rainfall events (Koç et al., 2022). From the map in Fig. 2, it is apparent that both short- and long-lasting precipitation events cause fire brigade operations and damage in the region.
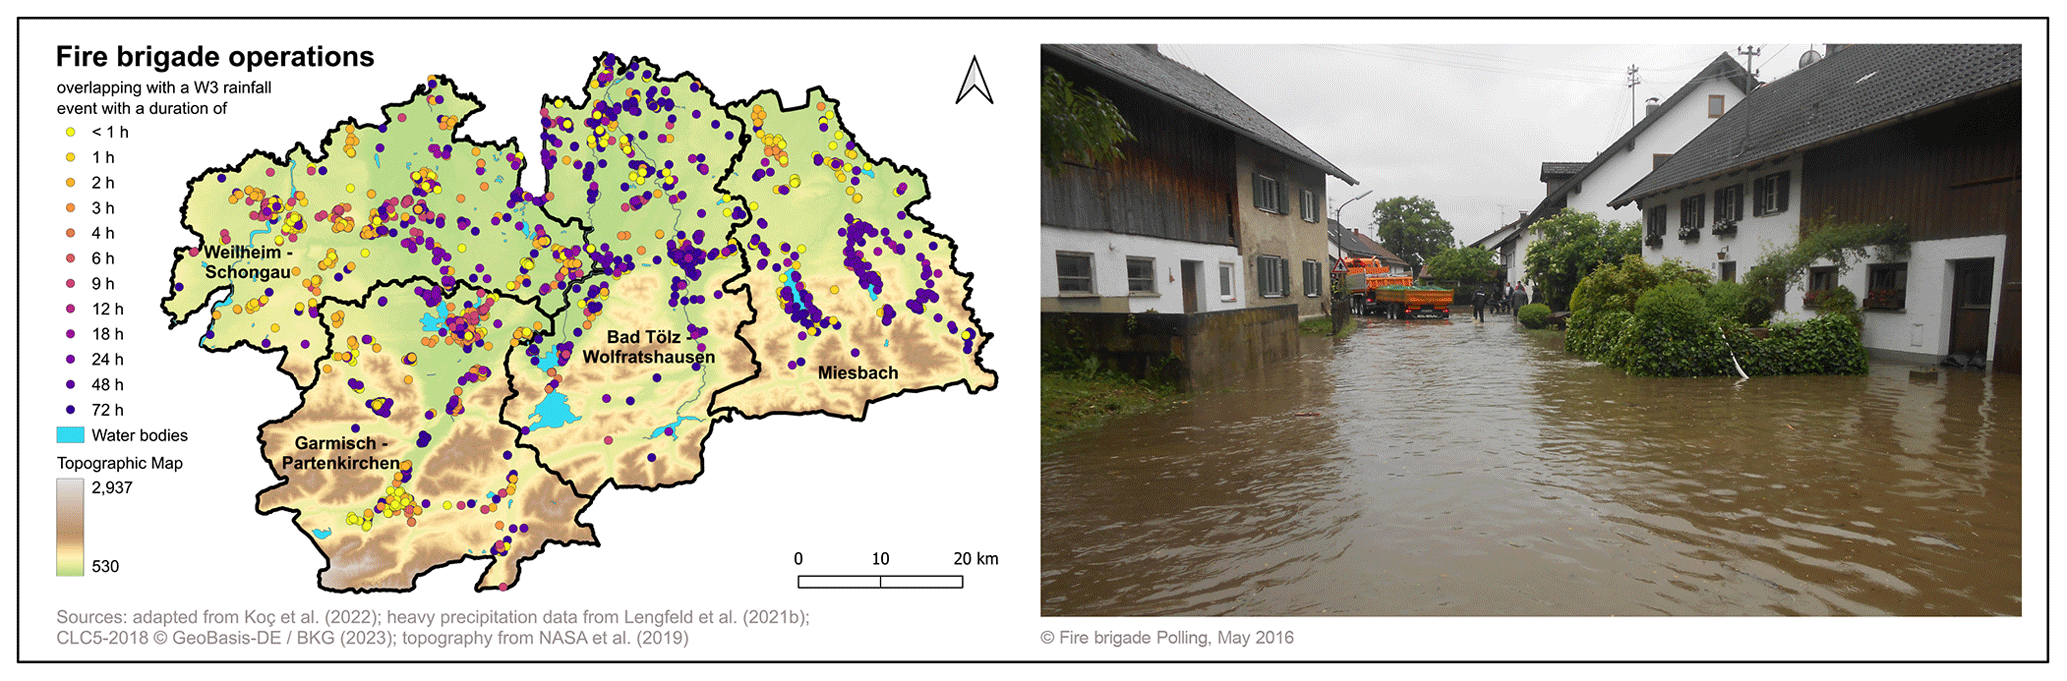
Figure 2Fire brigade operations in response to heavy precipitation events and pluvial flooding in the Oberland region. The map on the left displays operations overlapping with heavy rainfall events (Deutscher Wetterdienst (DWD) warning level 3 (W3)) from 2011 to 2021, with colours indicating the duration of the rainfall event. The picture on the right was taken during an operation of the fire brigade in the village of Polling, which was severely affected by pluvial flooding in May 2016.
3.2 Data
Our study is based on a household survey which was conducted in the Oberland in early 2022. Through a literature review, we identified adaptive capacity indicators (see Sect. 2) and existing questionnaires related to pluvial flooding adaptation (Elmer et al., 2010; Riedl et al., 2016; Kussel and Larysch, 2017; Osberghaus et al., 2020; Dillenardt et al., 2022), which then formed the basis for our questionnaire. This process resulted in a questionnaire with an average length of 36 min which covered a broad range of topics such as perceptions about climate change and extreme weather events, risk awareness, pluvial flood damage and event characteristics, private flood risk adaptation measures, housing characteristics, and socio-demographic characteristics. The questionnaire is publicly available (Schubert et al., 2024a). We included 10 common adaptation options for pluvial flooding, thereby covering a broad range of different actions: low-cost behavioural measures such as information seeking, risk transfer through the purchase of natural hazard insurance coverage, and more expensive structural measures. For each item, respondents were asked to indicate whether they have implemented it, planned it, or neither realised nor planned it. Five cognitive pre-tests were conducted to refine the questions.
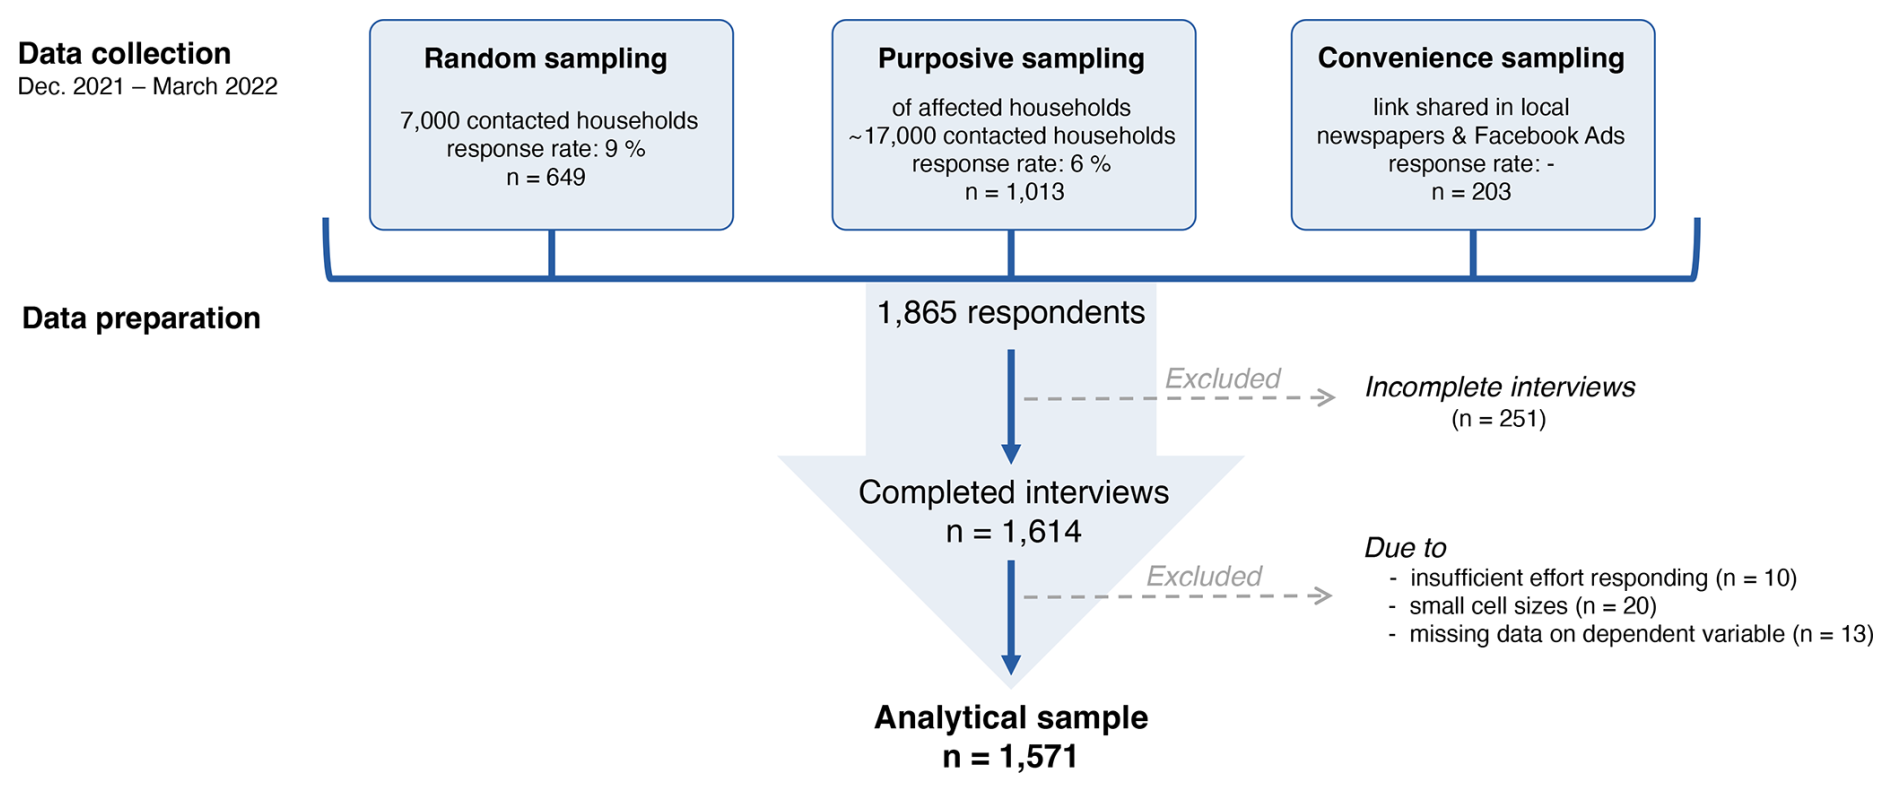
A total of 1865 survey responses were collected, of which 1571 were included in this analysis. The steps undertaken in the data collection and preparation process are illustrated in Fig. 3. To draw meaningful conclusions about both households affected by heavy precipitation and those not affected, we combined three sampling methods: a random sample, a purposive sample of affected households, and a convenience sample. We identified addresses and streets affected by pluvial flooding events by collecting data from fire brigades and combining them with radar-based heavy rainfall events (see Fig. 2). To ensure that all participating households were at risk of flooding, two screening questions checked whether the household used rooms in the basement and/or on the ground floor. Within the household, the household member with a leading role in household (financial) decision-making was selected for the interview. The survey used a mixed-mode approach, whereby respondents could choose between a computer-assisted web interview (CAWI) or telephone interview (CATI). To ensure high data quality, we used standard metrics to detect careless responding, such as the intra-individual response variability (IRV), resampled individual reliability (RIR), and response time (Curran, 2016; Brühlmann et al., 2020; Ward and Meade, 2023).
Despite efforts to increase the response rates such as a mixed-mode design, response rates were rather low (8 % for the randomly selected households and 5 % for the purposive sample). A comparison of the survey data with microcensus data for the Oberland region reveals that male, older, highly educated, and high-earning respondents are overrepresented, while foreign, female, younger, low-educated, and low-earning citizens are underrepresented (see the appendix for details, Table B1). Similar selection biases have been reported in other flood-related studies (Poussin et al., 2015; Spekkers et al., 2017; Dillenardt and Thieken, 2024). This exogenous sample selection can be easily corrected in multivariate models by conditioning on these variables (Wooldridge, 2013, p. 325). However, uni- and bivariate statistics are biased and thus not generalisable.
3.3 Statistical analysis
To examine household adaptation comprehensively, we draw on two dependent variables in our analysis: whether a household adapts (yes or no) and the number of implemented adaptation measures. A binary variable indicates whether a household has implemented at least one adaptation measure (1 for yes and 0 for no). While many studies simply focus on such a binary variable (Barnes et al., 2020; Dillenardt et al., 2022; Bartelet et al., 2023), we assume that adaptation is a continuum and that adaptation cannot be realised by the implementation of a single measure. To this end, we constructed a second discrete variable by summing up the number of implemented measures. The maximum number of implemented measures is 10 for property owners, whereas tenants could only implement 4 non-structural measures. “Don't know” answers were counted as 0 since – even if they have been implemented – they do not pose a deliberate adaptation action.
Missing data on the independent variables were imputed to increase statistical power and reduce bias in parameter estimates. For the majority of variables, the number of item nonresponses is rather low, ranging from 0 % to 6 % (Table 2). Only income – a survey variable which is traditionally prone to higher nonresponse rates (Yan et al., 2010) – is missing for 13.24 % of the sample. Missing-data patterns and mechanisms were explored with graphical diagnostics from the VIM package (Templ et al., 2012). Multiple imputation generally starts by assuming a missing-at-random (MAR) mechanism (van Buuren, 2018, p. 165). To make this assumption more plausible, we estimated a predictor matrix and included all correlated variables as predictors (van Buuren, 2018, p. 182). Since distinguishing between MAR and missing not at random (MNAR) is not possible (van Buuren, 2018, p. 36), we cannot rule out the presence of MNAR in our data. Nevertheless, multiple imputation is remarkably robust against MNAR (Collins et al., 2001), and even if MAR is falsely assumed, estimates remain less biased than those from a complete-case analysis (van Buuren, 2018, p. 57). We followed a multiple imputation then deletion (MID) approach (von Hippel, 2007). Based on von Hippel (2020), the required number of imputations for replicable standard error estimates was determined. A total of 30 imputed datasets were generated with the mice package (van Buuren and Groothuis-Oudshoorn, 2011). By this means, the sample size increased from 1020 complete cases (without missing data on the variables of interest) to 1571 households. We also analysed the subset of complete cases and obtained similar findings (see Appendix C2). A comparison of the p values and effect sizes reveals that the imputed models (Appendix C1) are more efficient than a complete-case analysis.
We utilise descriptive as well as regression analysis to explore the capacity–action relationship. As a first analytical step, we briefly take stock of private adaptation actions, adaptive capacities, and their relationship in the Oberland using descriptive statistics. Given the exogenous sample selection as well as the interdependence of adaptive capacity indicators (Smit and Wandel, 2006, p. 288), we then turn to multivariate regression analysis. A logistic regression was fitted to the binary adaptation action variable, a Poisson regression for the discrete number of implemented measures. The models were computed for each of the 30 imputed datasets; the resulting parameter estimates were then pooled together into a single set of estimates. As property owners face greater flexibility in their adaptation actions (Laudan et al., 2020; Grothmann and Reusswig, 2006), models were estimated separately for owners and tenants.
For each model, assumptions were checked to ensure the validity and reliability of the results. Predictors are not affected by multicollinearity (variance inflation factor <2), and the Poisson model is neither overdispersed nor zero-inflated. The violation of the random-sampling assumptions is accounted for in two ways. Firstly, we estimate cluster-robust standard errors at the municipal level to account for the fact that respondents from the same municipality might be more similar to each other in terms of adaptive capacity and action. Even though we cannot quantify cross-scale dynamics with this method, this is an important analytical step to acknowledge the embeddedness of an actor within a system and the alternating influence this has on adaptive capacity and their mobilisation (Elrick-Barr et al., 2023). Secondly, the exogenous sample selection is removed by conditioning on the characteristics which are over- and underrepresented (e.g. age, income, education) (Wooldridge, 2013, p. 325). To fulfil the exogeneity assumption and eliminate spurious correlations, additional variables such as house characteristics and the survey mode are controlled for. To address the problem of unobserved heterogeneity in logistic and Poisson models, all effects are presented as average marginal effects (AMEs) (Mood, 2010; Arel-Bundock et al., 2024). All analyses were performed with the statistical software R (version 4.3.1).
To explore whether adaptive capacity translates into adaptation, we first take stock of the households' adaptive capacity and adaptation actions in our sample using descriptive statistics. Subsequently, we utilise correlation and regression analysis to examine how adaptive capacity influences households' decisions to implement pluvial flood adaptation measures.
4.1 Adaptive capacity of households in the Bavarian Oberland
While the generic capacities in the sample are above-average, specific capacities are more varied. Table 2 provides a detailed overview of the adaptive capacity present in our sample.
Generic capacity indicators such as income, education level, and living area are above the German average. More than half of the respondents have an upper-secondary education, the median net household income is between EUR 3500 and 4000, and the average living area is roughly 140 m2. Most respondents are quite rooted in their city. They report an average duration of residence of 33 years, with the majority expressing intentions to continue residing there for the long term. Additionally, many respondents possess high social capital, indicated by a large social network and a high sense of belonging. In terms of general capacities, there is a slight discrepancy between homeowners and tenants. Owners tend to be more prosperous, with higher income levels and a larger living area, as well as stronger bonding social capital and attachment to their residence.
In contrast, specific capacity, such as risk perception, responsibility appraisal, and coping capabilities, is less pronounced and more varied in the sample. The research sample is well-informed about climate change, as the majority of them gauge an increase in extreme weather events in the coming decades as likely. However, the risk perception of suffering from damage in the next 5 years is rather low, which indicates that heavy precipitation events are regarded as future problems. Two-thirds of the respondents assess their perceived probability of being flooded in the next 5 years as not likely at all or rather unlikely. This may also be a result of limited experience with heavy precipitation events. So far, 38 % of respondents have experienced pluvial flooding on their premises, with 20 % suffering financial losses, while 18 % did not.
Concerning responsibility for flood protection, perceptions of who is responsible for protecting their premises differ. Owners mostly regard themselves as responsible, while the majority of tenants hold the landlord accountable. However, roughly one-third of the sample think it is the state's responsibility. Many respondents are willing to implement private measures; only 21 % agree that they are not taking private measures as protection is a state task. However, opinions on the effectiveness of public flood risk management (FRM) provided by the state vary greatly. Half of the respondents trust the municipality to effectively protect them from flooding and agree that FRM is so good that private measures are not needed, while the other half do not. Tenants tend to evaluate public FRM slightly better than owners.
Self-efficacy and protection motivation also show high variability. The answers to these questions are almost uniformly distributed across the six-point agree–disagree scale. The median and mean for these variables is 3, indicating that roughly half of the respondents feel somewhat incapable of and not engaged in protecting their household from flooding. Things other than flooding to worry about are reported by 46 % of the respondents. Tenants report slightly more competing concerns, less ability to protect themselves, and lower engagement.
Table 2Summary statistics.
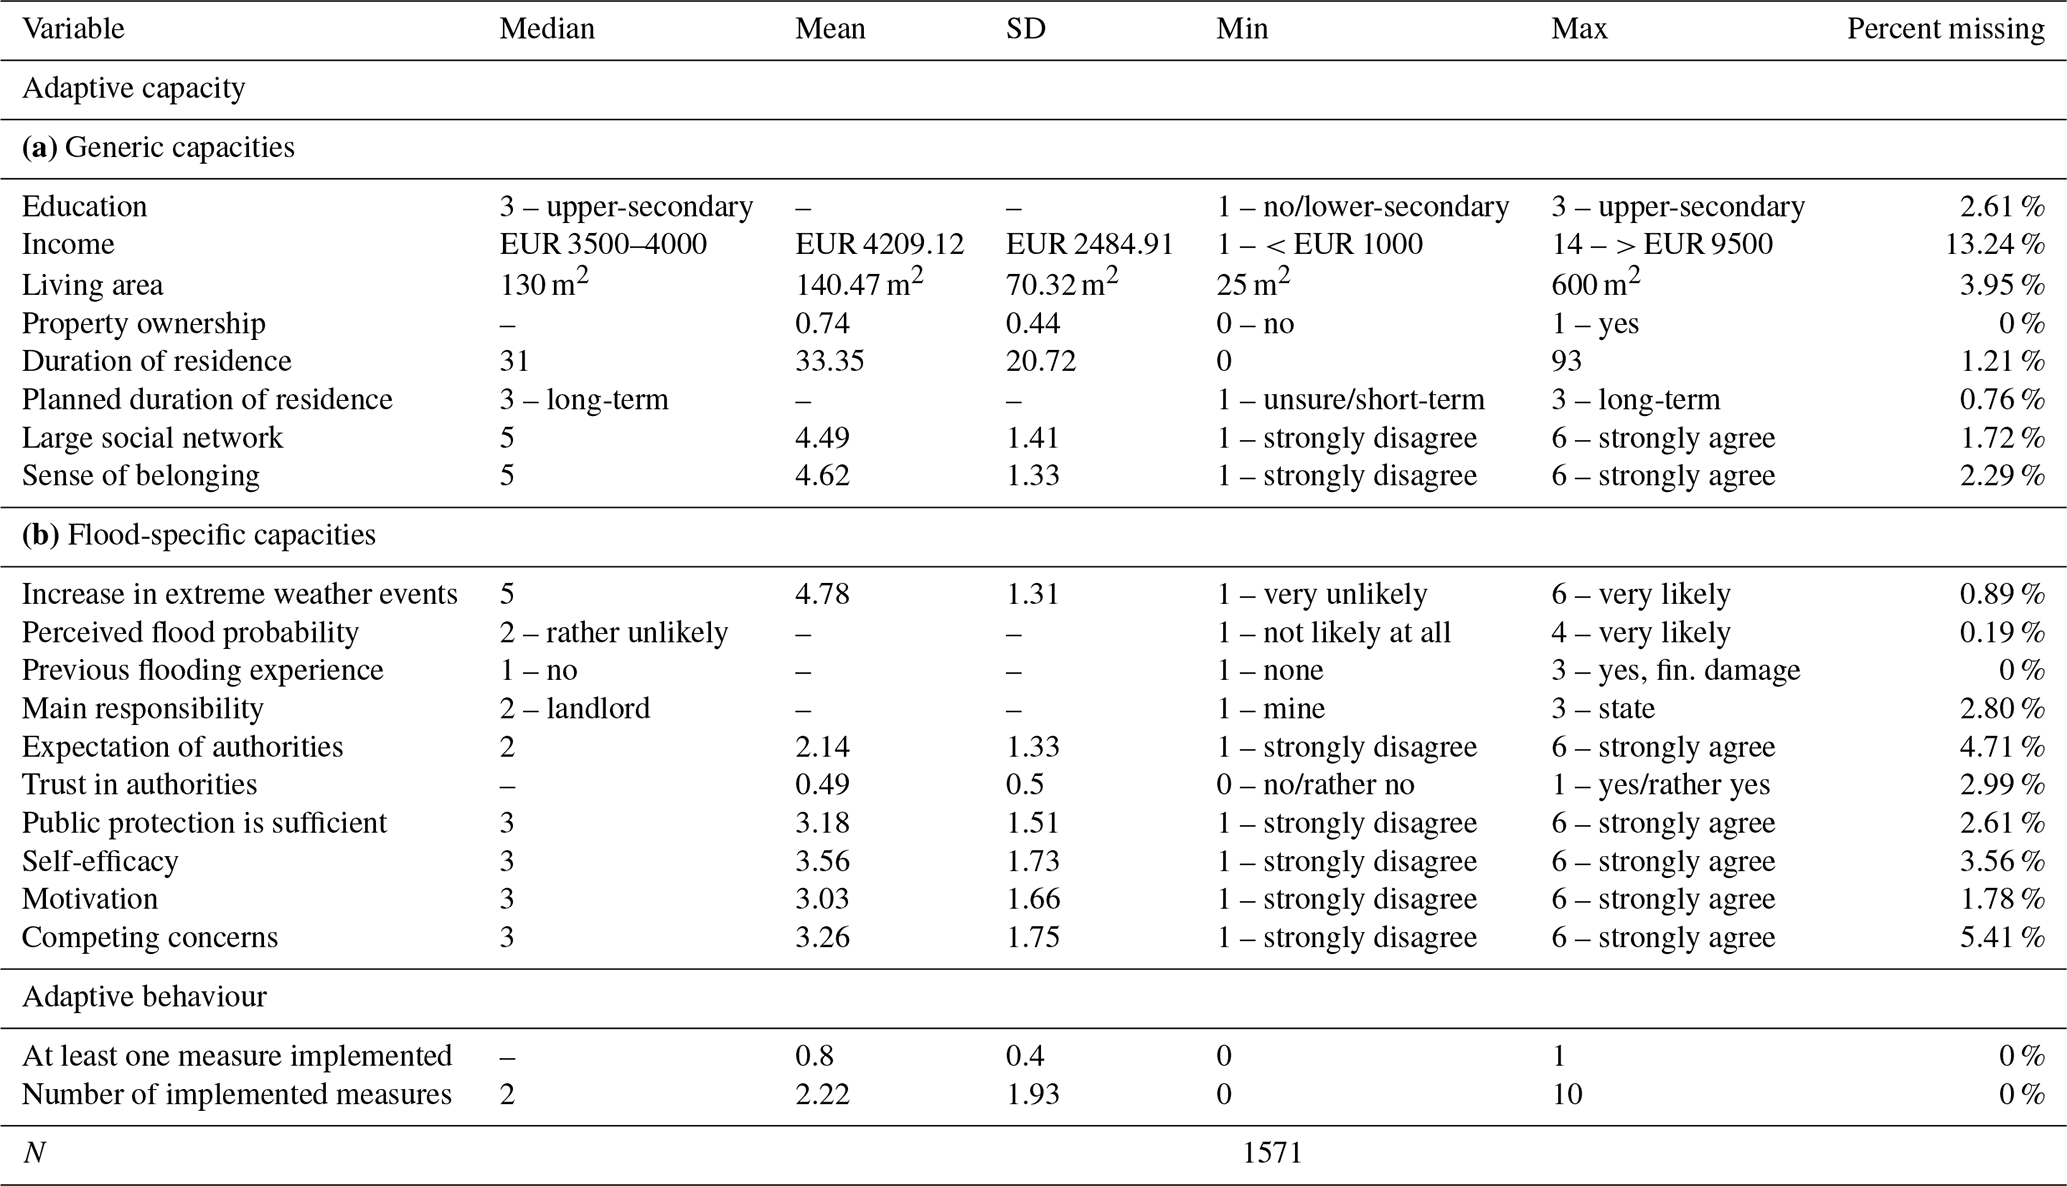
Based on the assumption of equidistance of the response categories, six-point Likert scales with endpoint labels were treated as a quasi-metric in the analyses. To reduce nonresponses, income was measured as binned data in the questionnaire. For the analyses, we decided to approximate it by the bin midpoints. Even when including it as categorical variable, we would still assume that “there is no income effect … within the income interval that happens to have been fixed arbitrarily by the survey design, but there can be income effects across income intervals” (Lee and Bhattacharya, 2019). Stauder and Hüning (2004) demonstrated with the German microcensus that especially middle-income classes, which contain the majority of observations, are well represented by the midpoints and that the approximation is good for bins with small widths. A robust harmonic Pareto midpoint estimator (RPME) (von Hippel et al., 2016) was used to calculate the missing midpoint for the upper bins (single households: bin 11, > EUR 7500; multi-person households: bin 14, > EUR 9500). We additionally conducted robustness checks to make sure that our results are not driven by this approximation. Source: calculations made for this study, based on data from the 2022 KARE (Klimawandelanpassung auf regionaler Ebene) household survey.
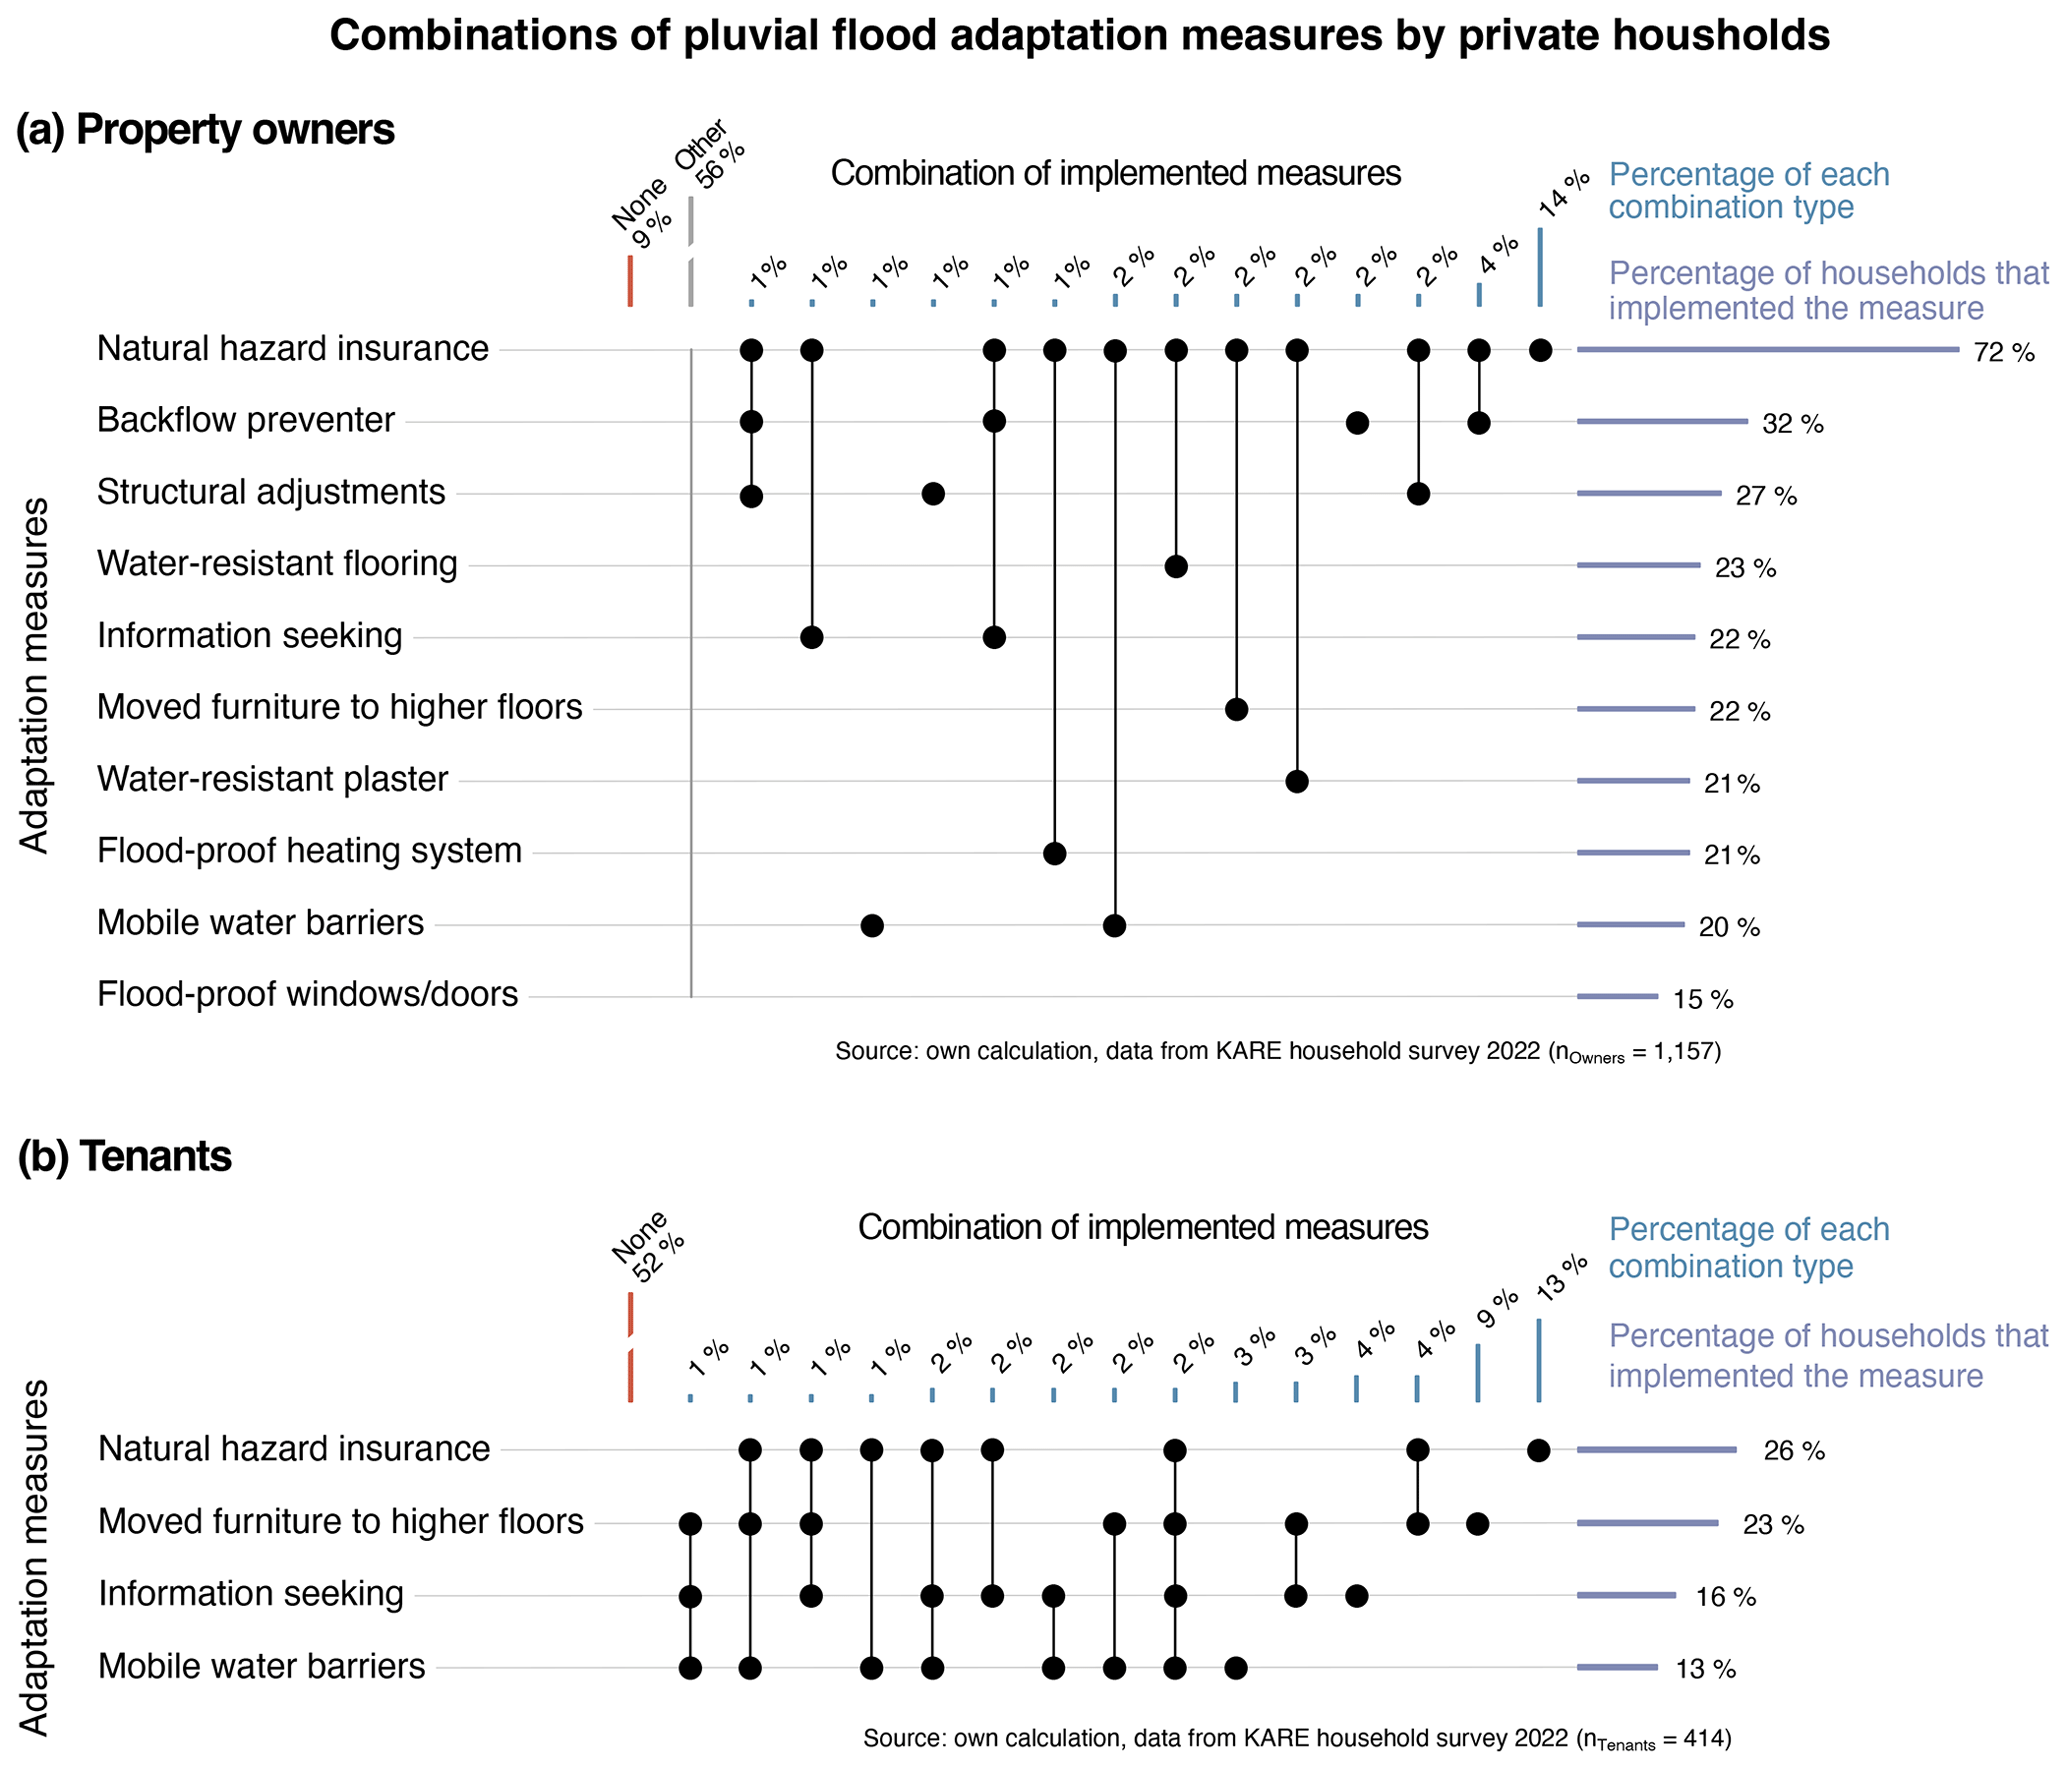
Figure 4Implemented adaptation measures by (a) property owners and (b) tenants. Relative frequency for each measure displayed (horizontal purple bars), as well as how often this measure was solely implemented (single dot and vertical blue bars) or in combination with other measures (connected dots and vertical blue bars).
4.2 Adaptation actions of households in the Bavarian Oberland
Given the heterogeneous flood-specific capacity in the sample, the proportion of households that are already adapting is surprisingly high. A total of 80 % of the respondents indicate that they have implemented at least one adaptation measure (Table 2). However, the level of involvement differs based on property ownership, with owners demonstrating significantly higher activity compared to tenants (91 % of owners vs. 48 % of tenants, χ2=333.09, p<0.01). Figure 4 shows an overview of the implemented adaptation measures by ownership status. The most popular measure for both owners and tenants is to take out natural hazard insurance coverage for the building and/or its contents (72 % and 26 %, respectively). Regarding structural measures, homeowners most frequently reported the installation of a backflow preventer (32 %) and structural adjustments to the driveway or garden (27 %). Taking out insurance and installing a backflow preventer also are reported by other studies as common measures (Rözer et al., 2016; Dillenardt et al., 2022; Wamsler, 2016). High-cost measures, such as a flood-resistant heating system or flood-resistant windows and doors, are less prevalent but still implemented by approximately one in six property owners. Surprisingly, seeking information about flood protection was reported by only a fifth of the sample despite being a low-effort and low-cost measure. Similar to Rözer et al. (2016), our results indicate that information is more frequently obtained by those households which have already experienced a pluvial flooding event.
When examining the number and combination of implemented measures in more detail, it becomes evident that the depth and scope of adaptation efforts is still limited. The distribution of the number of private measures is right-skewed, with the majority of households implementing between zero and three measures. On average, owners implement 2.74 measures (median: 2), whereas tenants undertake 0.78 measures (median: 0). However, some households report high implementation rates; 8.73 % of owners indicate the implementation of six or more measures, while 6.52 % of tenants report three or four measures.
Examining the combination of implemented measures reveals that a strategic, informed combination of complementary measures rarely takes place at the household level. Figure 4 displays which measures are combined. While taking out natural hazard insurance is the most prominent standalone measure, it is also regularly combined with other adaptive measures. For example, homeowners combine it with structural measures such as the installation of a backflow preventer (4 %) or structural adjustments (2 %). This result may be partly explained by the fact that a backflow preventer is mandatory for some insurance policies. Moreover, the analysis reveals that structural measures are only combined with each other on a case-by-case basis (e.g. 1 % of the respondents combine insurance, backflow preventer, and structural adjustments). For tenants, who have limited options to protect themselves, a common strategy involves adapting the use of flood-prone floors by permanently relocating valuable furniture (9 %). This approach is also often combined with other measures, such as obtaining insurance (4 %) or seeking information (3 %). Seeking information is anyhow rarely pursued as a standalone measure; instead, it is typically undertaken in conjunction with other adaptation actions. Overall, it is noteworthy that the data do not reveal clear sets of measures which are frequently implemented together. The low and dispersed frequencies suggest that households are not strategically combining complementary adaptation measures but rather decide on a case-by-case basis what to implement.
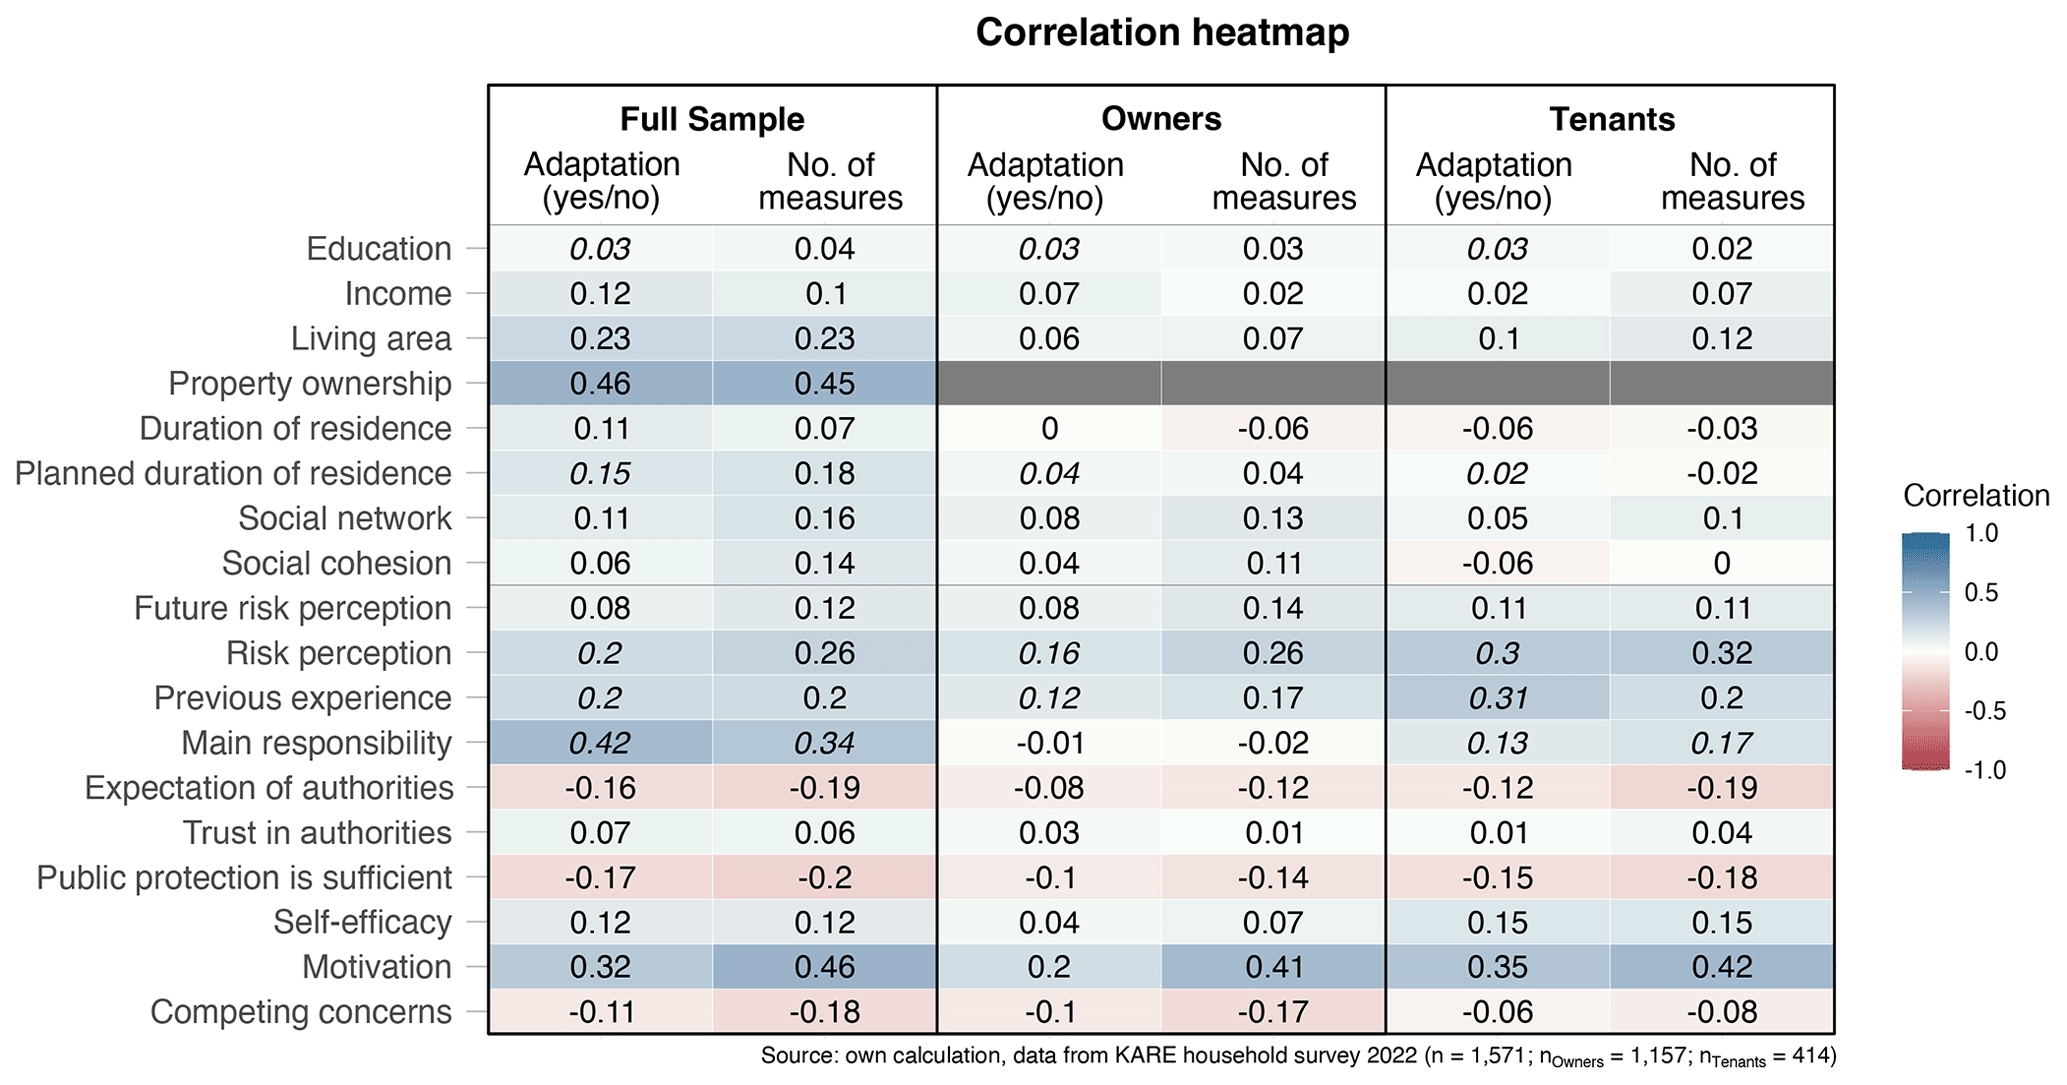
Figure 5Correlation heatmap showing bivariate associations between adaptive capacity indicators and adaptation action. The appropriate measure of association is determined based on the level of measurement; displayed are Pearson correlation coefficients (r), Spearman rank correlation coefficients (rs), point-biserial correlation coefficients (rpb), phi coefficients (rφ), and Cramér's V (φC). Colours indicate the strength and direction of the association: blue indicates a positive relationship, while red indicates a negative relationship; darker colours denote stronger relationships. Cramér’s V measures are italicised, as only the strength of association can be quantified (range: 0 to 1).
4.3 Exploring the capacity–action relationship
4.3.1 Correlation analysis: exploring the strength and direction of the association
Adaptive capacity indicators are weakly to moderately related to adaptive behaviour. The correlation heatmap in Fig. 5 illustrates the relationship for the full sample, as well as for the property owners' and tenants' subsamples. Weak to moderate linear associations exist in the full sample, most of which are in the expected directions. Generic capacities are positively correlated with adaptation action and the number of implemented measures, suggesting that as generic capacity increases, adaptation also tends to increase. Property ownership shows the strongest association (rφ=0.46 for adaptation (yes/no), rpb=0.45 for the number of adaptation measures). Similarly, the specific capacity indicators are weak to moderately correlated with adaptation behaviour. Most indicators are positively associated; however, expectation of authorities, competing concerns, and the attitude that public flood protection is sufficient show the expected negative relationship. The strongest associations exist between main responsibility and adaptation (yes/no) (φC=0.42) and motivation to protect the household and the number of implemented measures (r=0.46). Overall, the results vary only slightly between the two dependent variables of adaptation (yes/no) and the number of implemented measures.
The analysis shows that bivariate correlations can lead to contradictory and misleading findings regarding the role of adaptive capacity for adaptation. When calculating the correlations for property owners and tenants separately, the positive association of the generic capacity indicators vanishes, leaving only effects which are negligible (all effect sizes <0.15). The specific capacity associations remain unaltered, except for the effect of main responsibility, which weakens in the tenants' subset and disappears in the owners' subset. It appears that the correlation between the generic capacity indicators and adaptation action is spurious. As outlined in Sect. 4.1, property owners tend to have higher generic capacity and implement more measures than tenants. Therefore, the results for the full model do not represent a “pure” effect of income or living area but are confounded by other factors, such as property ownership.
This highlights the importance of contextual factors when exploring the capacity–action relationship. Correlations provide evidence of relationships; however, this does not mean that the adaptive capacity indicators cause the adaptation action. This can only be evaluated with regression models, which control for contextual effects such as property ownership, socio-demographic characteristics (age, sex, migration background), and house characteristics (house type, age of the building).
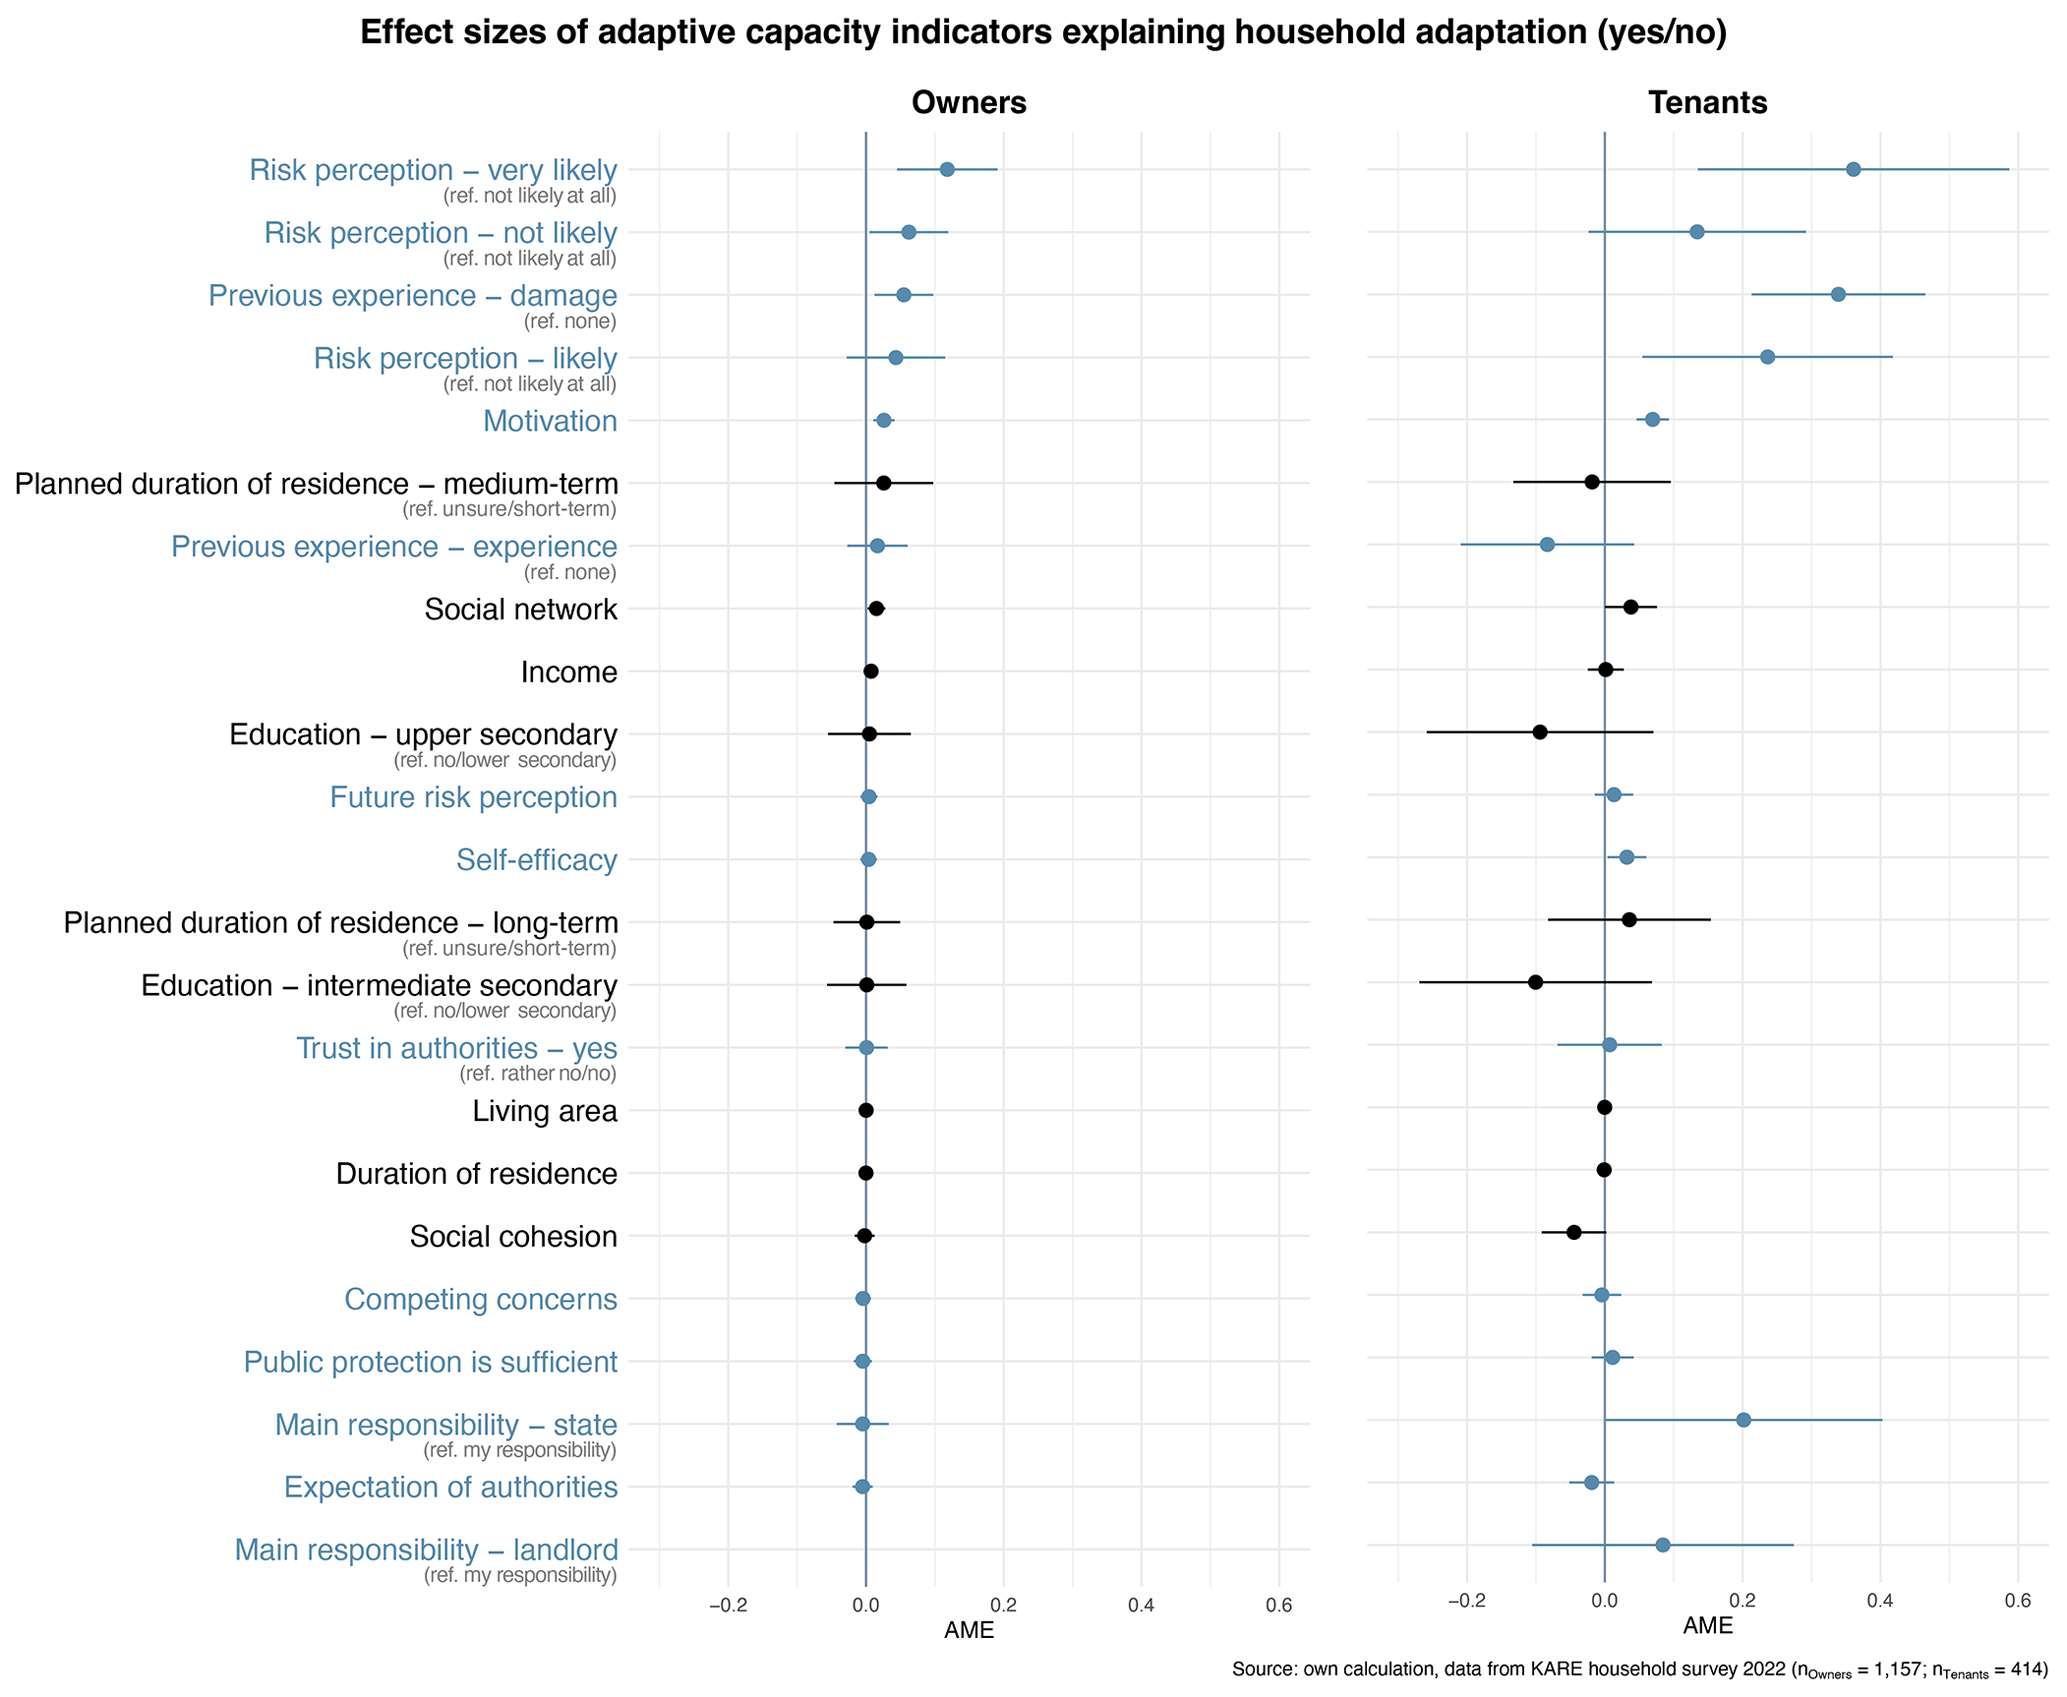
Figure 6Forest plot summarising the results from the logistic regression explaining household pluvial flood adaptation (yes/no). Average marginal effects (AMEs) and 95 % confidence intervals (CIs) are depicted. Effects are sorted by effect size; generic capacity indicators are displayed in black, and flood-specific capacity indicators are in blue. The estimated coefficients of categorical predictors are relative to the reference (ref.) group indicated in brackets. The vertical grey line represents the line of null effect; effects which do not cross this line are statistically significant at α=5 %.
4.3.2 Logistic regression: explaining household adaptation (yes/no)
The household adaptation decisions of property owners and tenants are mainly driven by specific capacity indicators. Detailed results for the logistic regression explaining whether households implemented at least one adaptation measure (adaptation (yes/no)) are presented graphically in Fig. 6 and in tabular form in Appendix C1 (Model 1 to 3). Effects with a p value of <0.05 are considered statistically significant in the following. In the owner model, only 4 of the 17 adaptive capacity indicators have a statistically significant effect on adaptation. It appears that the owners' decision to implement at least one measure is primarily driven by specific capacity, as three of these four significant variables belong to this group. Higher risk perception and previous damage experience increase the probability of implementing at least one private flood risk adaptation measure, ceteris paribus (c.p.). Similarly, the motivation to protect one's own premises has a positive effect. The social network variable is the only generic capacity with a statistically significant effect. Accordingly, a one-unit better evaluation of the social network is associated with an increase of 1.51 percentage points in the probability of adapting, c.p. However, this effect size is rather small from a practical perspective.
The results for tenants are similar. Of the 17 adaptive capacity indicators, 6 are statistically significant, most of which belong to the realm of specific capacity. The confidence intervals are wider compared to the owners' model due to the smaller sample size, and effect sizes are slightly larger. Higher risk perception, damage experience, and motivation are again positively and statistically significantly associated with adaptation. Additionally, higher self-efficacy significantly increases the likelihood of household adaptation for tenants. Holding the state for mainly responsibility for flood protection has a significant effect, likely due to the small size of the reference group. The only significant generic capacities refer to social capital; however, their effects are converse. While a larger social network increases the probability of implementing at least one measure, stronger social cohesion decreases the adaptation likelihood (p<0.1).
In summary, the logistic regression results underline the importance of specific adaptive capacity in household adaptation decisions. Generic capacity indicators, such as income and education, show neither a statistically nor practically significant effect. However, generic capacity may be more important when it comes to implementing multiple adaptation measures, as this potentially requires more money, time, and knowledge.
4.3.3 Poisson regression: explaining the number of implemented measures
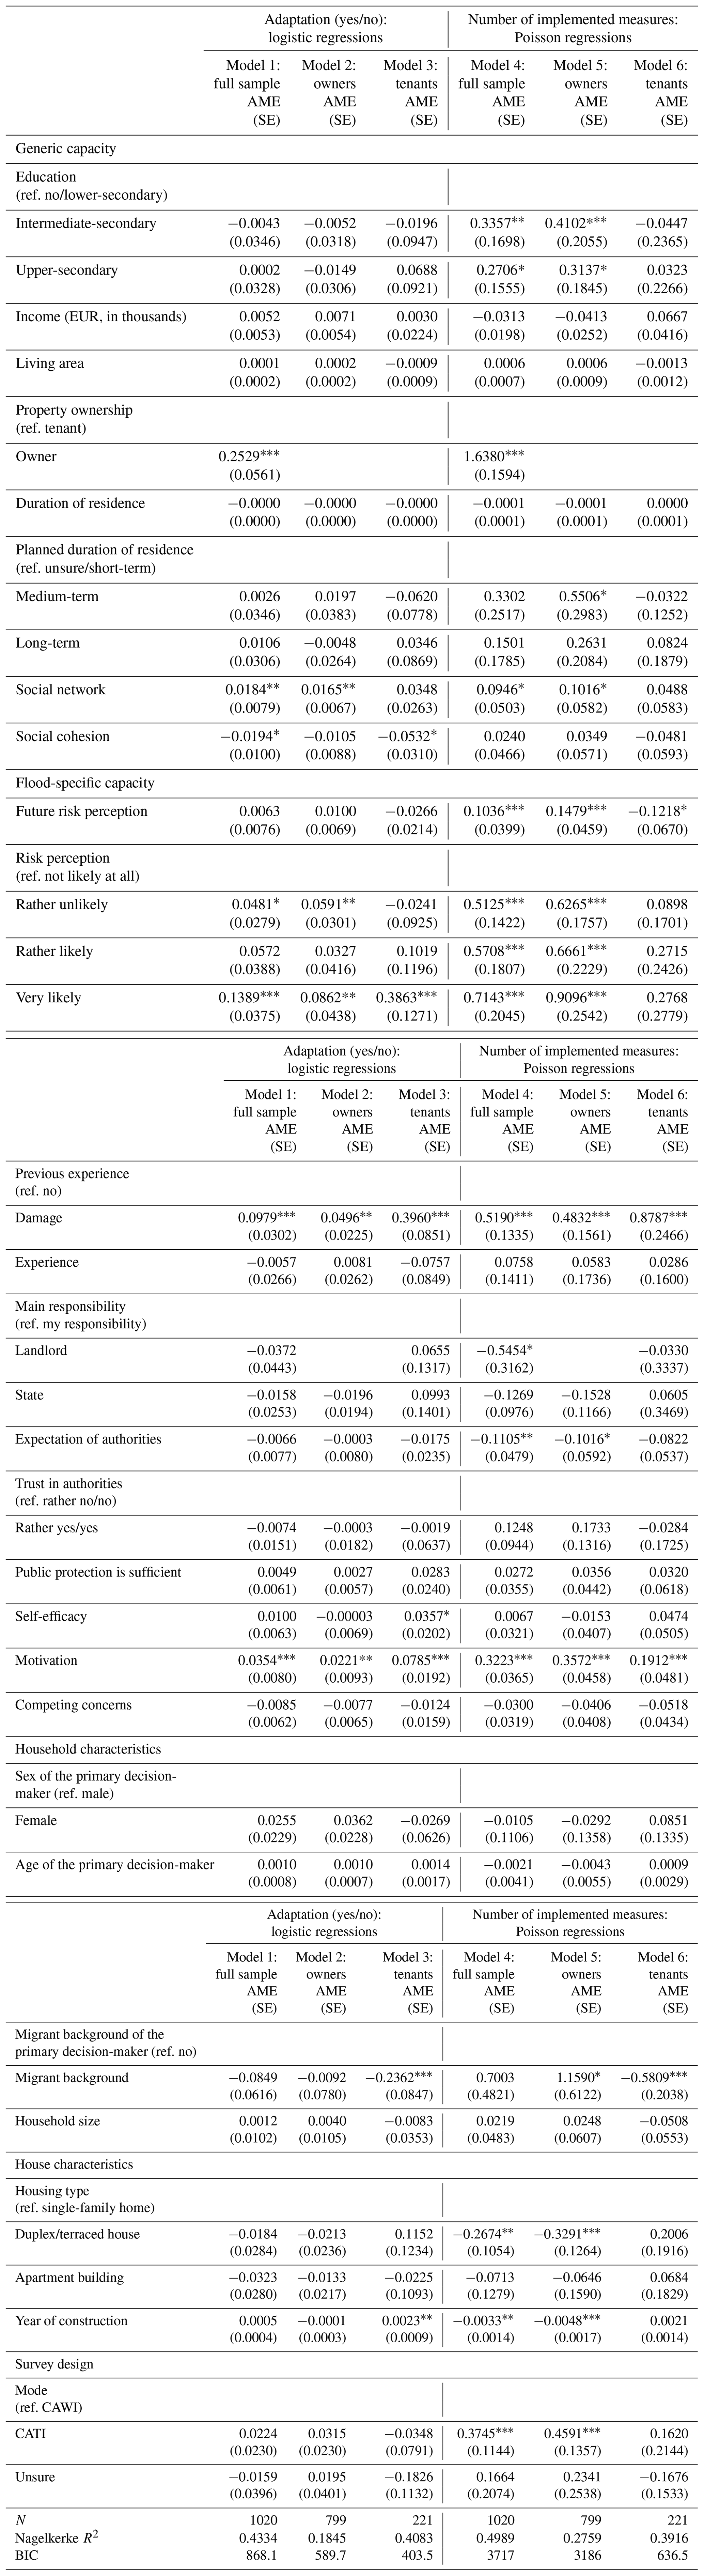
The Poisson regression results demonstrate that specific adaptive capacity indicators translate into private flood risk adaptation action, while the role of generic capacity is much less clear. The effects are visualised in Fig. 7 and tabulated in Appendix C1 (Model 4 to 6). Risk perception, damage experience, and motivation are important predictors for both property owners and tenants. Furthermore, ownership appraisal indicators substantially influence the number of implemented measures. The social network variable is the only generic adaptive capacity indicator which significantly positively affects adaptation for owners and tenants.
For property owners, four specific capacity indicators and four generic capacity indicators show a statistically significant effect (p value <0.05). Strong effect sizes are again found for higher risk perception, previous damage experience, and motivation. Additionally, a higher perceived probability of extreme weather events in the future (future risk expectation) significantly increases the number of measures. Regarding generic capacity, education has a strong positive effect on the number of implemented measures. Interestingly, the effect size is stronger for the group with a medium level of education (0.54) than for the group with a high level of education (0.36), c.p. Income is significantly negatively associated with the number of implemented measures. A EUR 1000 income increase is, on average, associated with 0.04 fewer measures, c.p. However, the effect size is quite small, which means that it is practically less relevant. The social capital indicators both positively impact owners’ measurement implementation (social network p<0.05, social cohesion p<0.1). Conversely, the duration of residence negatively affects the number of adaptation measures implemented. Besides the statistical significance, the owners' model also contains some variables which might be substantially and socially significant due to comparatively large effect sizes (Bernardi et al., 2017). This mainly refers to the variables capturing responsibility appraisal. Viewing that state as mainly responsible for flood protection and a high level of expectation of authorities to provide flood protection decrease the number of implemented measures considerably. Yet, a high level of trust in the municipal administration to provide effective pluvial flood protection increases the implementation of one's own measures (p<0.1).
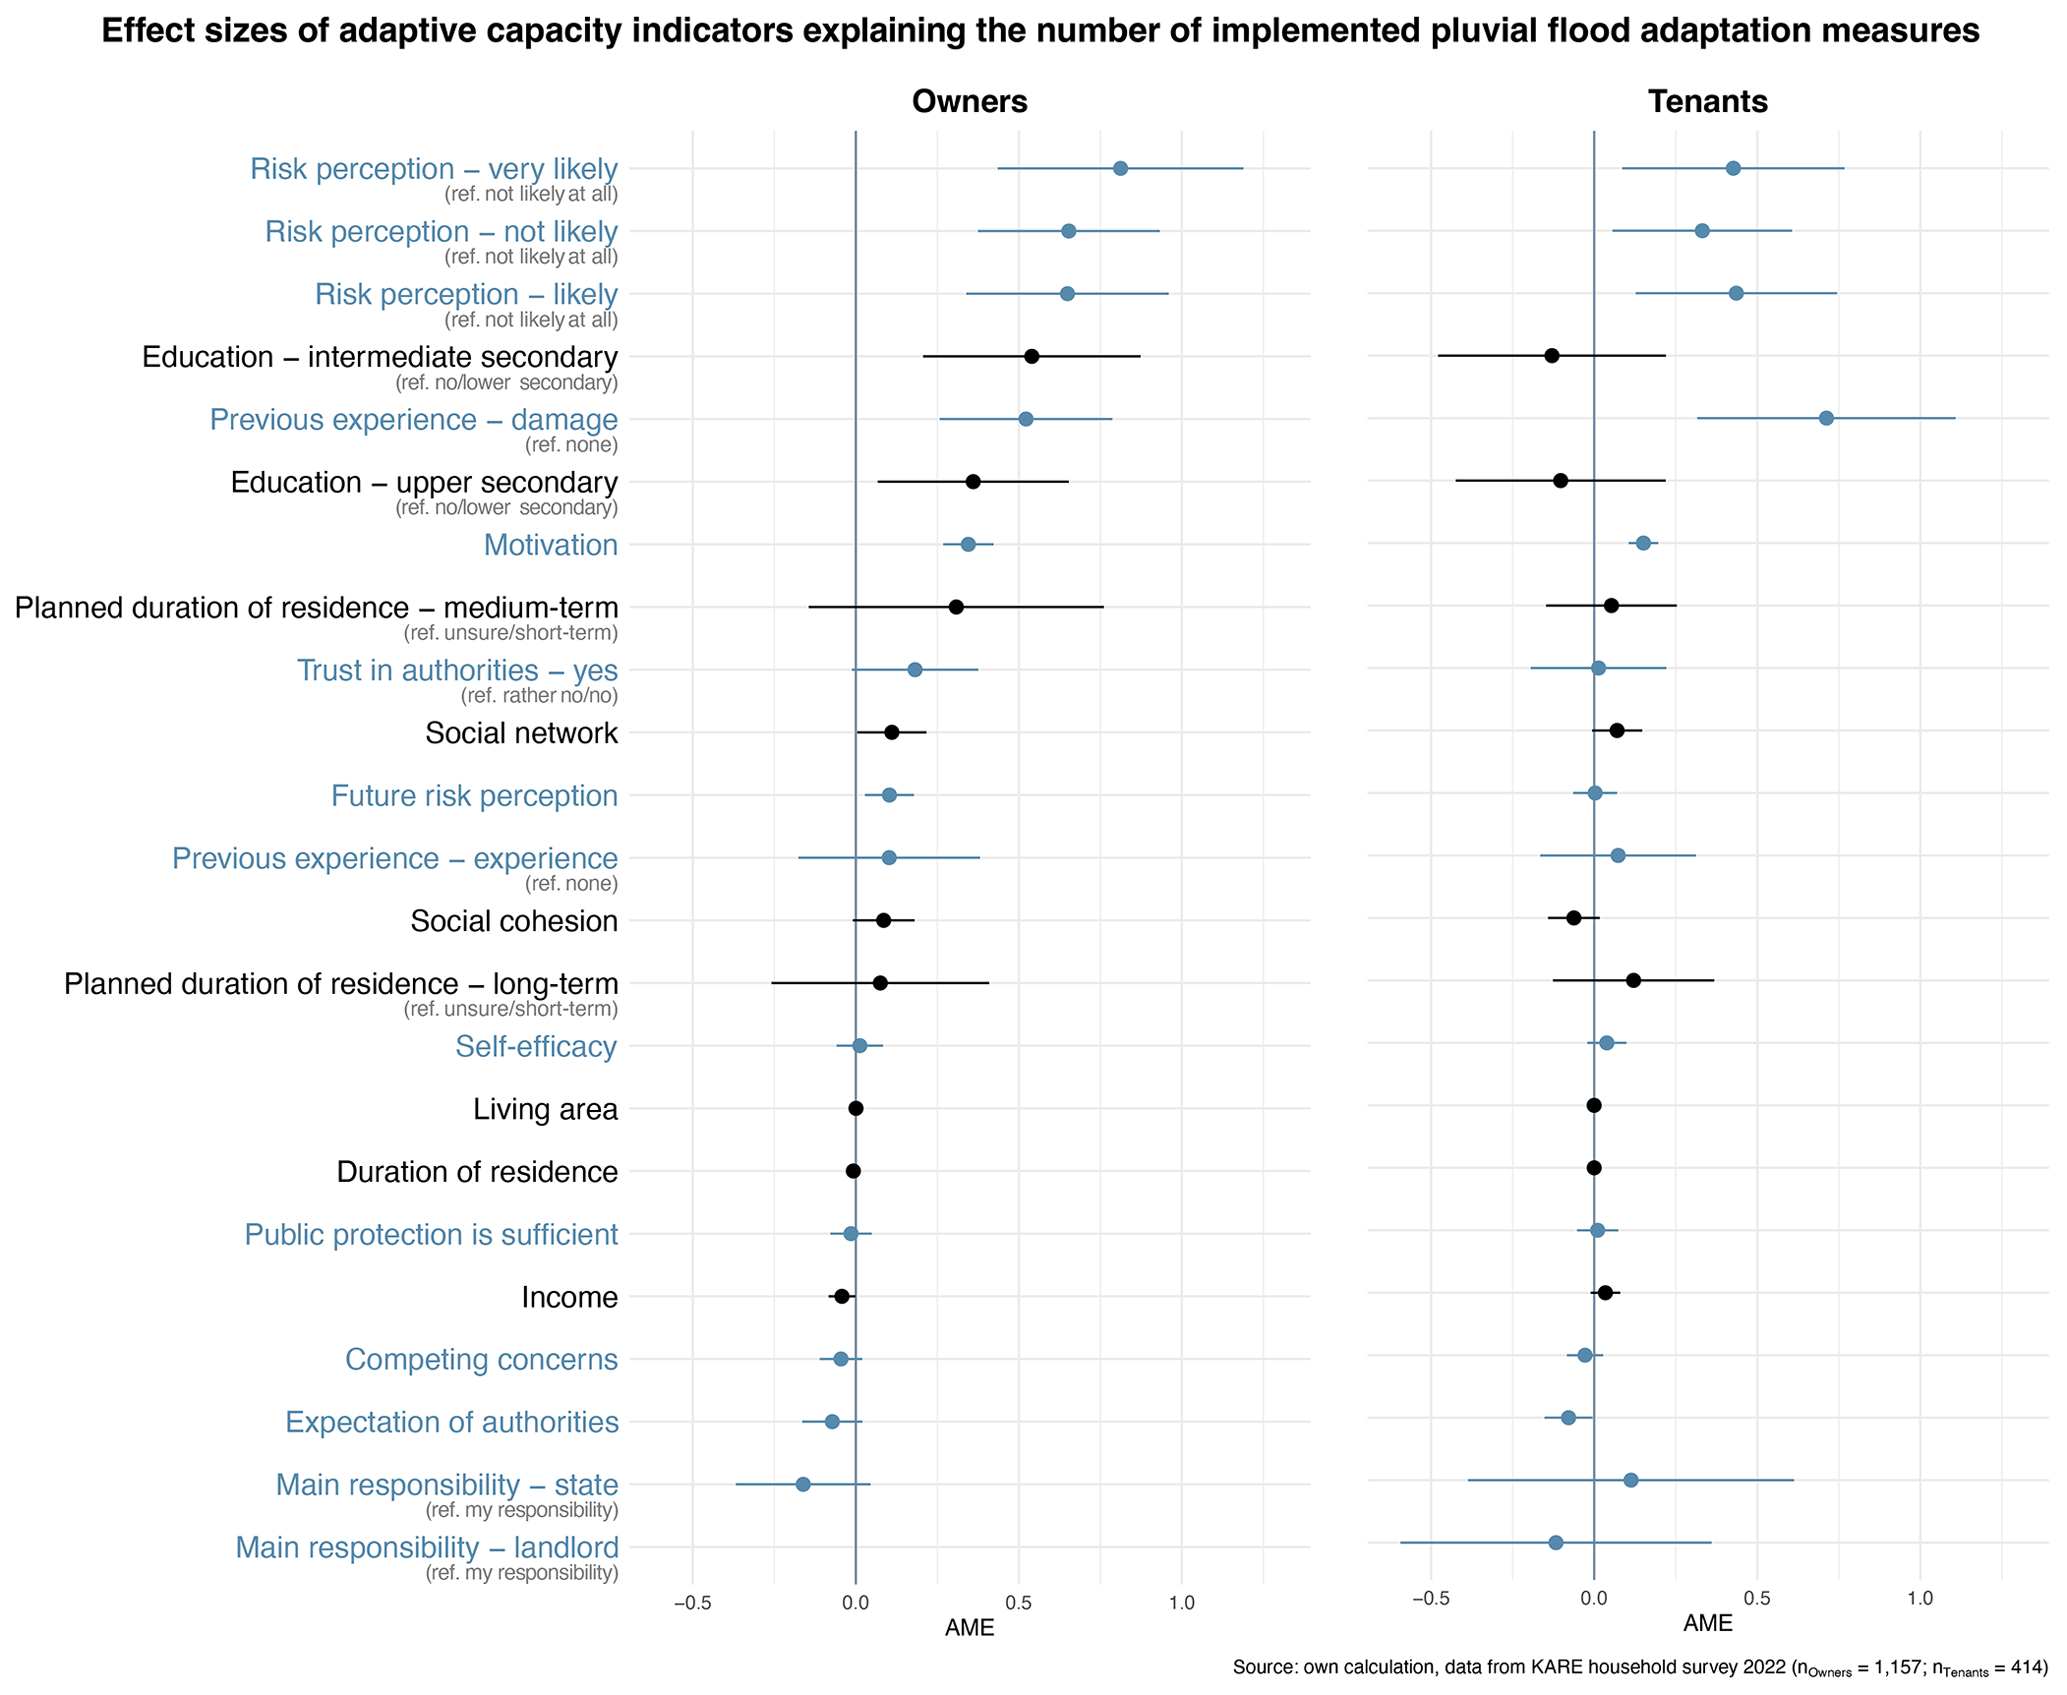
Figure 7Forest plot summarising the results from the Poisson regression explaining the number of implemented pluvial flood adaptation measures. Average marginal effects (AMEs) and 95 % confidence intervals (CIs) are depicted. Effects are sorted by effect size; generic capacity indicators are displayed in black, and flood-specific capacity indicators are in blue. The estimated coefficients of categorical predictors are relative to the reference group indicated in brackets. The vertical grey line represents the line of null effect; effects which do not cross this line are statistically significant at α=5 %.
For tenants, only four specific capacity indicators are statistically significant (p<0.05). Previous damage experience, high risk perception, and motivation have a strong positive influence on measurement implementation. Additionally, responsibility appraisal shapes adaptation decisions of tenants. A high level of expectation of authorities reduces the number of implemented measures. Due to a small reference group, results for the main responsibility variable cannot be interpreted in the tenants’ model. However, the full model (Model 4) in Appendix C1 indicates a strong landlord effect. Respondents who consider their landlord as mainly responsible implement, on average, 0.61 fewer measures than respondents who consider themselves responsible, c.p. None of the generic capacity indicators are significant at the 5 % level; however, the social network variable is significant with p<0.1. In contrast to the owners’ results, education has a negative and income has a positive effect on measurement implementation for tenants. However, the effects are not significant and the confidence interval (CI) for education is rather wide, indicating a greater amount of uncertainty.
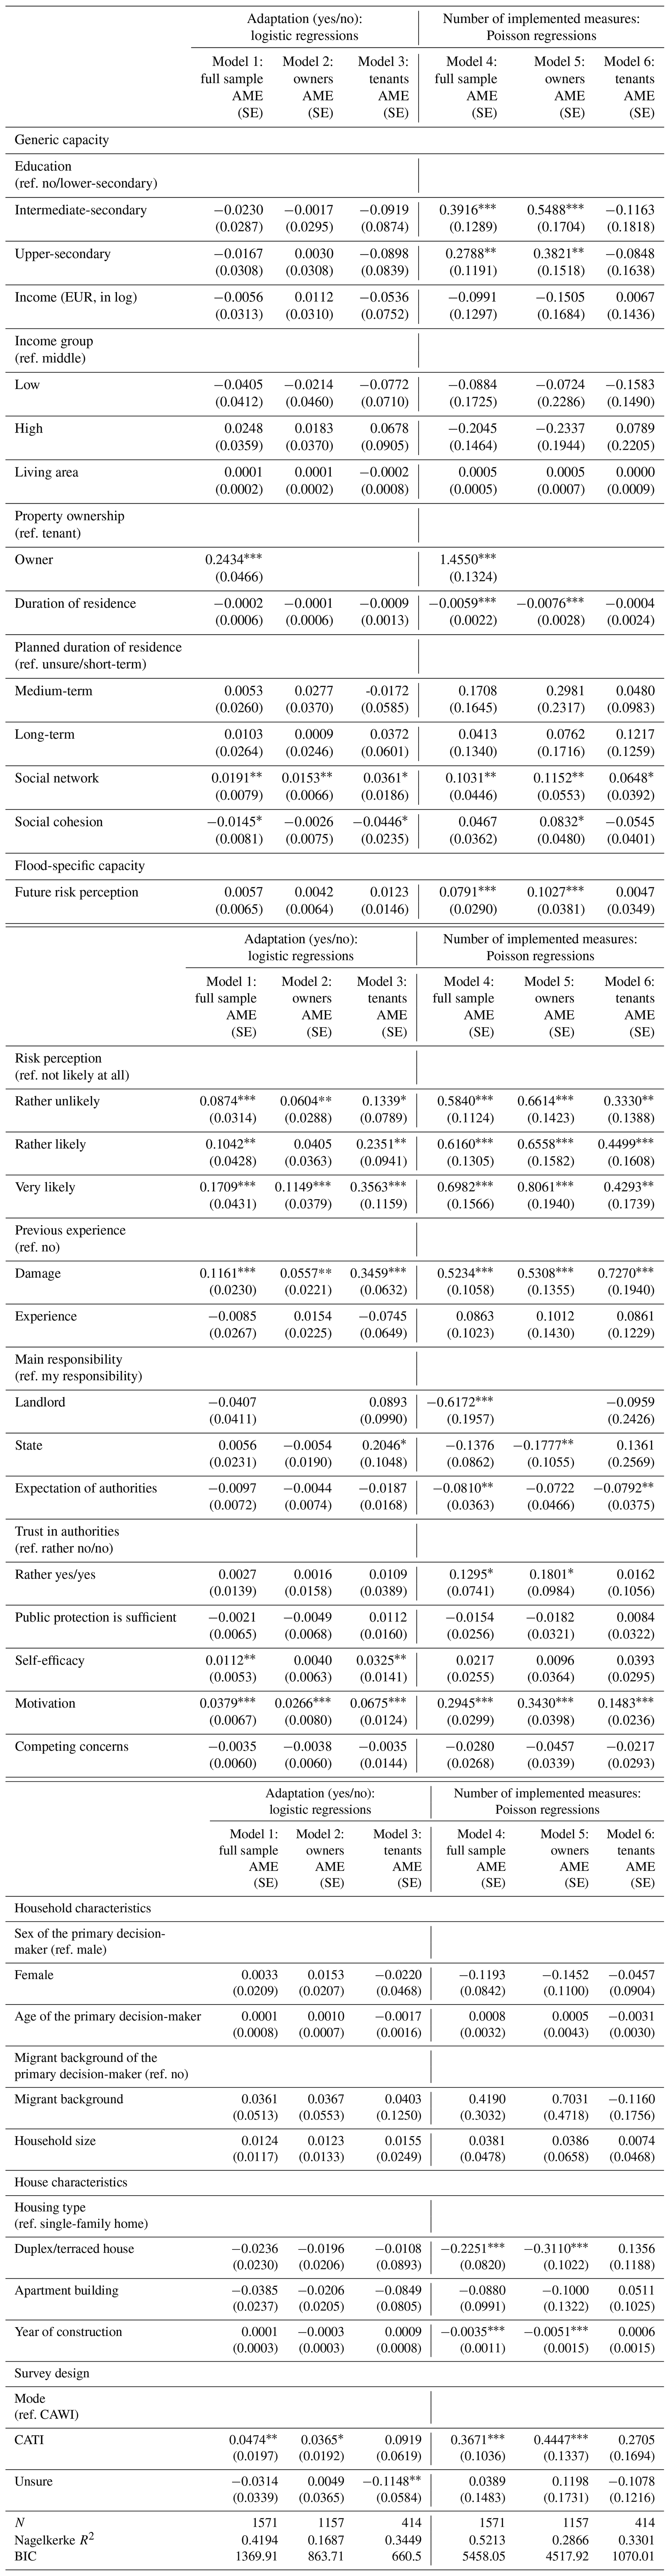
We estimated additional models to test the robustness of the income effect and found tentative evidence that income groups differ in their adaptation behaviour. Robustness checks for the income effect were necessary, as household net income was originally collected as binned data, but bin midpoints were used in the models to approximate income (see also the note under Table 2). Research has proven that this method works well for middle-income classes (Stauder and Hüning, 2004); however, there are deviations in the tails due to small numbers of observations and broader bins. To compress the range of higher incomes and make the distribution more symmetric, the income variable was log-transformed. Additionally, we account for differences between income groups. Households with an equalised disposable net income below EUR 1300 (10 % quantile) were classified as low-income, those between EUR 1300 and 4000 were classified as middle-income, and those above EUR 4000 (85 % quantile) were classified as high-income. These data-based income groups are roughly in line with official classifications for Bavaria (Niehues et al., 2023, p. 37). Our results are robust as these adjustments do not alter the findings; the income effect remains nonsignificant with an effect size close to zero (see Appendix C3, Model 1 to 6). Yet, the income group effects suggest that the income effect might vary between different income groups. The effect sizes are insignificant but substantial in the Poisson models. Having an equalised disposable net income below EUR 1300 is associated with fewer implemented measures compared to the middle-income group (Appendix C3, Model 3 to 6). The rich effect is not consistent across models, but it is negative in the full sample and owners’ subsample. Compared with the middle-income group, having an equalised disposable net income is, on average, associated with a decrease of 0.2 implemented measures, c.p. (Appendix C3, Model 4 and 5). These findings indicate that income per se is not a decisive factor in adaptation decisions but that income groups potentially differ in how they translate their financial assets into adaptation actions.
5.1 Unravelling the capacity–action gap
The results of our case study provide evidence of a “capacity–action gap” in the German context, as high levels of adaptive capacity do not necessarily translate into household adaptation action. We demonstrate that disaggregating adaptive capacity into generic and threat-specific components enhances our understanding of the divergence between adaptive capacity and adaptation action, thereby unravelling the capacity–action gap. In our study context, specific capacity clearly drives adaptation behaviour of households, whereas the role of generic capacity is much less clear. Generic capacity indicators, which are typically highlighted in the scientific literature and policy documents (Andrijevic et al., 2023), are limited in their ability to infer and explain household adaptation. In the following, we illustrate this capacity–action gap and outline the role of generic and specific adaptive capacity indicators in more detail. Additionally, we discuss two possible explanations for the capacity–action gap: the “safe development paradox” (Eakin et al., 2014) and the often implicitly assumed but potentially misleading “the more, the better” understanding of adaptive capacity.
Despite a high level of exposure to heavy precipitation events and above-average generic capacity, our analysis reveals that household adaptation remains small in scale and incoherent. The share of households which already engage in adaptation action is surprisingly high with 80 %; however, property owners are considerably more active than tenants (91 % and 48 %, respectively). Yet, the most popular measure is taking out natural hazard insurance, which does not reduce the risk per se but only shifts financial losses to another party. This finding is in line with other research on pluvial flood risk adaptation in the German context (Rözer et al., 2016; Dillenardt et al., 2022). Additionally, households mostly do not follow a strategic, informed approach in combining private flood risk measures. On average, Oberland households implement two measures; however, households are not well-informed about complementary measures and decide on a case-by-case basis. For Europe, the Intergovernmental Panel on Climate Change (IPCC) states that “although adaptation is happening …, it is not implemented at the scale, depth and speed needed to avoid the risks” (Bednar-Friedl et al., 2022, p. 1820); this is also true for the Oberland region.
Our analysis shows generic indicators are not the primary drivers for implementing private measures; thus, characterising households as able to adapt solely based on high levels of generic capacity is misleading. In our models, only two generic indicators substantially affect adaptation decision-making. Owning a property and having a larger social network make flood risk adaptation more likely; both effects are also well documented in the adaptation literature (for ownership, see Grothmann and Reusswig, 2006; Kuhlicke et al., 2020; Dillenardt et al., 2022; for social networks, see, for example, Adger, 2003; Pelling and High, 2005). Similar positive effects for social capital have also been reported in the capacity–action literature (Barnes et al., 2020; Bartelet et al., 2023). The finding that neither wealth nor income is a driver of adaptation action at the household level is consistent with studies on household flood adaptation in Germany (Grothmann and Reusswig, 2006; Dillenardt et al., 2022), as well as previous findings on the capacity–action relationship (Mortreux et al., 2020; Barnes et al., 2020; Green et al., 2021). Our results also provide some tentative evidence of a nonlinear relationship between generic capacity and adaptation action. For example, we found that for property owners higher levels of education are associated with more implemented adaptation measures. Notably, the positive effect is stronger for the group with a middle level of education than for the group with a high level of education. A similar, although nonsignificant, effect was discovered for income groups, where the middle-income group is, on average, more likely to implement adaptation measures than both the low- and high-income group.
By contrast, specific capacity indicators are important predictors of household adaptation and could potentially be an important leverage point for increasing private adaptation efforts. Risk perception, previous damage experience, and motivation are important predictors for both property owners and tenants, as well as for two different adaptation outcomes (adaptation (yes/no) and the number of implemented measures). The importance of these factors has also been demonstrated in recent meta-analyses (Bamberg et al., 2017; van Valkengoed and Steg, 2019), various flood-related studies (e.g. Grothmann and Reusswig, 2006; Bubeck et al., 2023; Dillenardt and Thieken, 2024), and within the capacity–action literature (Mortreux et al., 2020; Barnes et al., 2020; Bartelet et al., 2023).
5.2 Methodological limitations
Despite being consistent with previous findings, our methodological approach is not without limitations. Low response rates are a major concern in survey research and might have also affected our results. Even though a low response rate does not directly imply low validity, it greatly increases the risk of bias due to nonresponses. Our study suffers from nonresponse patterns, which are similar to those reported in other flood-related studies (Poussin et al., 2015; Spekkers et al., 2017; Dillenardt and Thieken, 2024). Due to the rather small sample size, our findings for tenants are characterised by greater uncertainty in the estimates. Our additive, unweighted approach to measuring the number of implemented measures might be disputable but provides an important first step towards moving beyond the currently dominant dichotomous yes–no measurement of adaptation (see, for example, Barnes et al., 2020; Dillenardt et al., 2022; Bartelet et al., 2023). Finally, adaptive capacity and adaptation actions are determined not only by micro-level variables but also by the institutional context. A more detailed analysis, including macro-level effects, is required but has been hindered due to the unavailability of municipal-level adaptation data.
5.3 Explaining the capacity–action gap
The “safe development paradox” proposed by Eakin et al. (2014) aids in determining the transferability of our findings and provides an explanation for the capacity–action gap. Accordingly, the safe development paradox occurs in societies with high generic and low specific capacity, where institutional contexts such as public risk management and safety nets decrease incentives for private adaptation (Eakin et al., 2014). Overall, this explanation fits well with our study region with high generic, low specific adaptive capacity and a strong institutional context. Yet, two arguments speak against it. Firstly, our results show that trust in the municipal administration to provide effective flood protection significantly increases private adaptation action. This indicates that public protection does not create a moral hazard but rather motivates households to become active. Secondly, and more importantly, similar findings regarding generic capacity have been reported for both affluent (e.g. Mortreux et al., 2020, for Australian households in the context of wildfire risks) and less affluent contexts (e.g. the meta-analysis of Green et al., 2021, on small-scale fishing communities and Mesfin et al., 2020, for a rural Ethiopian region). Nevertheless, we agree with Mesfin et al. (2020, p. 18) that “care must be taken not to underestimate the role of assets as they present the sine qua non of adaptive capacity”.
A diminishing marginal utility might offer a second explanation for the missing link between generic capacity and adaptation action. In our models, the groups with a middle level of education and a middle income are most likely to implement multiple measures. Even though not statistically significant, it seems that the highest-earning 10 % of our respondents might be even less likely to implement private measures than the lowest-earning 15 %. This indicates a nonlinear relationship and challenges the often inherent assumption of the more, the better in the adaptive capacity literature. It is often presumed that as the socio-economic conditions improve, people become less vulnerable and better able to cope with disasters (see, for example, Kuhlicke et al., 2011, p. 809). However, our analysis and existing research (Eriksen et al., 2020) hint that this is not necessarily the case. Instead of claiming that generic capacity is irrelevant, we suggest that its role in explaining the uptake of adaptation measures is more complicated than previously hypothesised.
The ongoing fixation on material capacity in vulnerability assessments and the assumed linear relationship between material affluence and derived social vulnerability have also been problematised by Eriksen et al. (2020). Generic capacity seems to be a necessary but not a sufficient condition for adaptation (Eakin et al., 2014, p. 5), which means that affluence alone will not suffice in coping with climate risks.
5.4 Policy implications
Based on our findings, we recommend two key policy measures to enhance local adaptive capacity and household adaptation efforts: (a) promoting local adaptation information and participation initiatives (e.g. led by municipalities) to strengthen risk awareness and self-efficacy among citizens and (b) creating targeted funding programmes or financial incentives aimed at supporting low-income households.
Our results demonstrate that measures which increase specific capacity are key and benefit all societal groups. Risk perception and previous risk experience are the strongest drivers of adaptation actions for both homeowners and tenants. Unlike generic capacity, specific capacity, such as risk awareness, “can potentially be altered within the short to medium term, and the power to do so lies at least partially with local policy makers” (Werg et al., 2013, p. 1614). Municipalities could play a key role in this, for example by hosting information events to inform citizens or by sharing experiences of affected residents and successful adaptation efforts. However, recent surveys and research show that the majority of German municipalities are still not actively informing citizens about flood risks and protection measures (von Streit et al., 2024; Friedrich et al., 2024), let alone engaging them in risk management (Wamsler, 2016).
Another major finding of our study is that income groups in our sample differ in how they translate their financial assets into adaptation actions. This suggests that undifferentiated distribution approaches like tax incentives or public funding may be less effective than differentiated measures and interventions targeting underprivileged groups. While middle- and high-income households have the financial capacity to implement adaptation measures, they often fail to fully realise this potential due to a lack of specific capacity. For these groups, policy should focus on enhancing risk awareness, self-efficacy, and motivation for protective action, whereas funding programmes are crucial for low-income households to enable the implementation of more costly adaptation measures.
Against the backdrop of increasing climate risks and the debate on the privatisation of risk, strengthening the adaptive capacity of citizens and households is crucial. Yet, the concept's usefulness is currently limited, as it is not clear what exactly constitutes adaptive capacity nor whether capacity translates into adaptation action. Our case study on pluvial flooding in Germany confirms a gap between the adaptive capacity and adaptation action of households. We additionally demonstrate that disaggregating the adaptive capacity into generic and specific components helps unravel the underlying mechanisms of this capacity–action gap. In our study context, adaptation decisions of households are mainly driven by specific capacity. The role of generic capacity is less clear; however, we offer some initial evidence of a nonlinear relationship. The marginal utility of generic capacity such as income and education diminishes, which means that a stock of generic capacity is needed for adaptation but does not yield any benefits after a certain threshold is reached. Strengthening generic capacity is thus more important for underprivileged groups, while increasing specific capacity can benefit all societal groups. To develop a deeper understanding of these nonlinear effects, additional studies should be undertaken. Taken together, these findings have implications for both the scientific assessment and the practical enhancement of adaptive capacity. Regarding the assessment of household adaptive capacity, a stronger emphasis on specific capacity is urgently needed. The six domains of adaptive capacity, proposed by Cinner and Barnes (2019), provide an important step in that direction. Yet, considering specific capacity is often a challenge due to data constraints. For specific capacity to be included in large-scale population surveys, a reduction in indicators is indispensable. More case studies as well as a better integration of meta-analyses of psychosocial factors motivating household adaptive behaviour (Bamberg et al., 2017; van Valkengoed and Steg, 2019) could assist in identifying a set of relevant household adaptive capacity indicators across spatial and cultural contexts. Additionally, greater focus should be placed on enhancing the specific capacity of households, as this can be an effective way to promote household adaptation. Thus, collaborations between households and municipalities in flood risk management, which foster knowledge exchange about risks and establish a clear distribution of responsibilities for adaptation, could be central to promoting adaptation at the local level. More research is urgently needed in this area as adaptive capacity transfers are still scientifically poorly understood.
Table A1Literature informing the adaptive capacity (AC) conceptualisation and indicator selection for households.
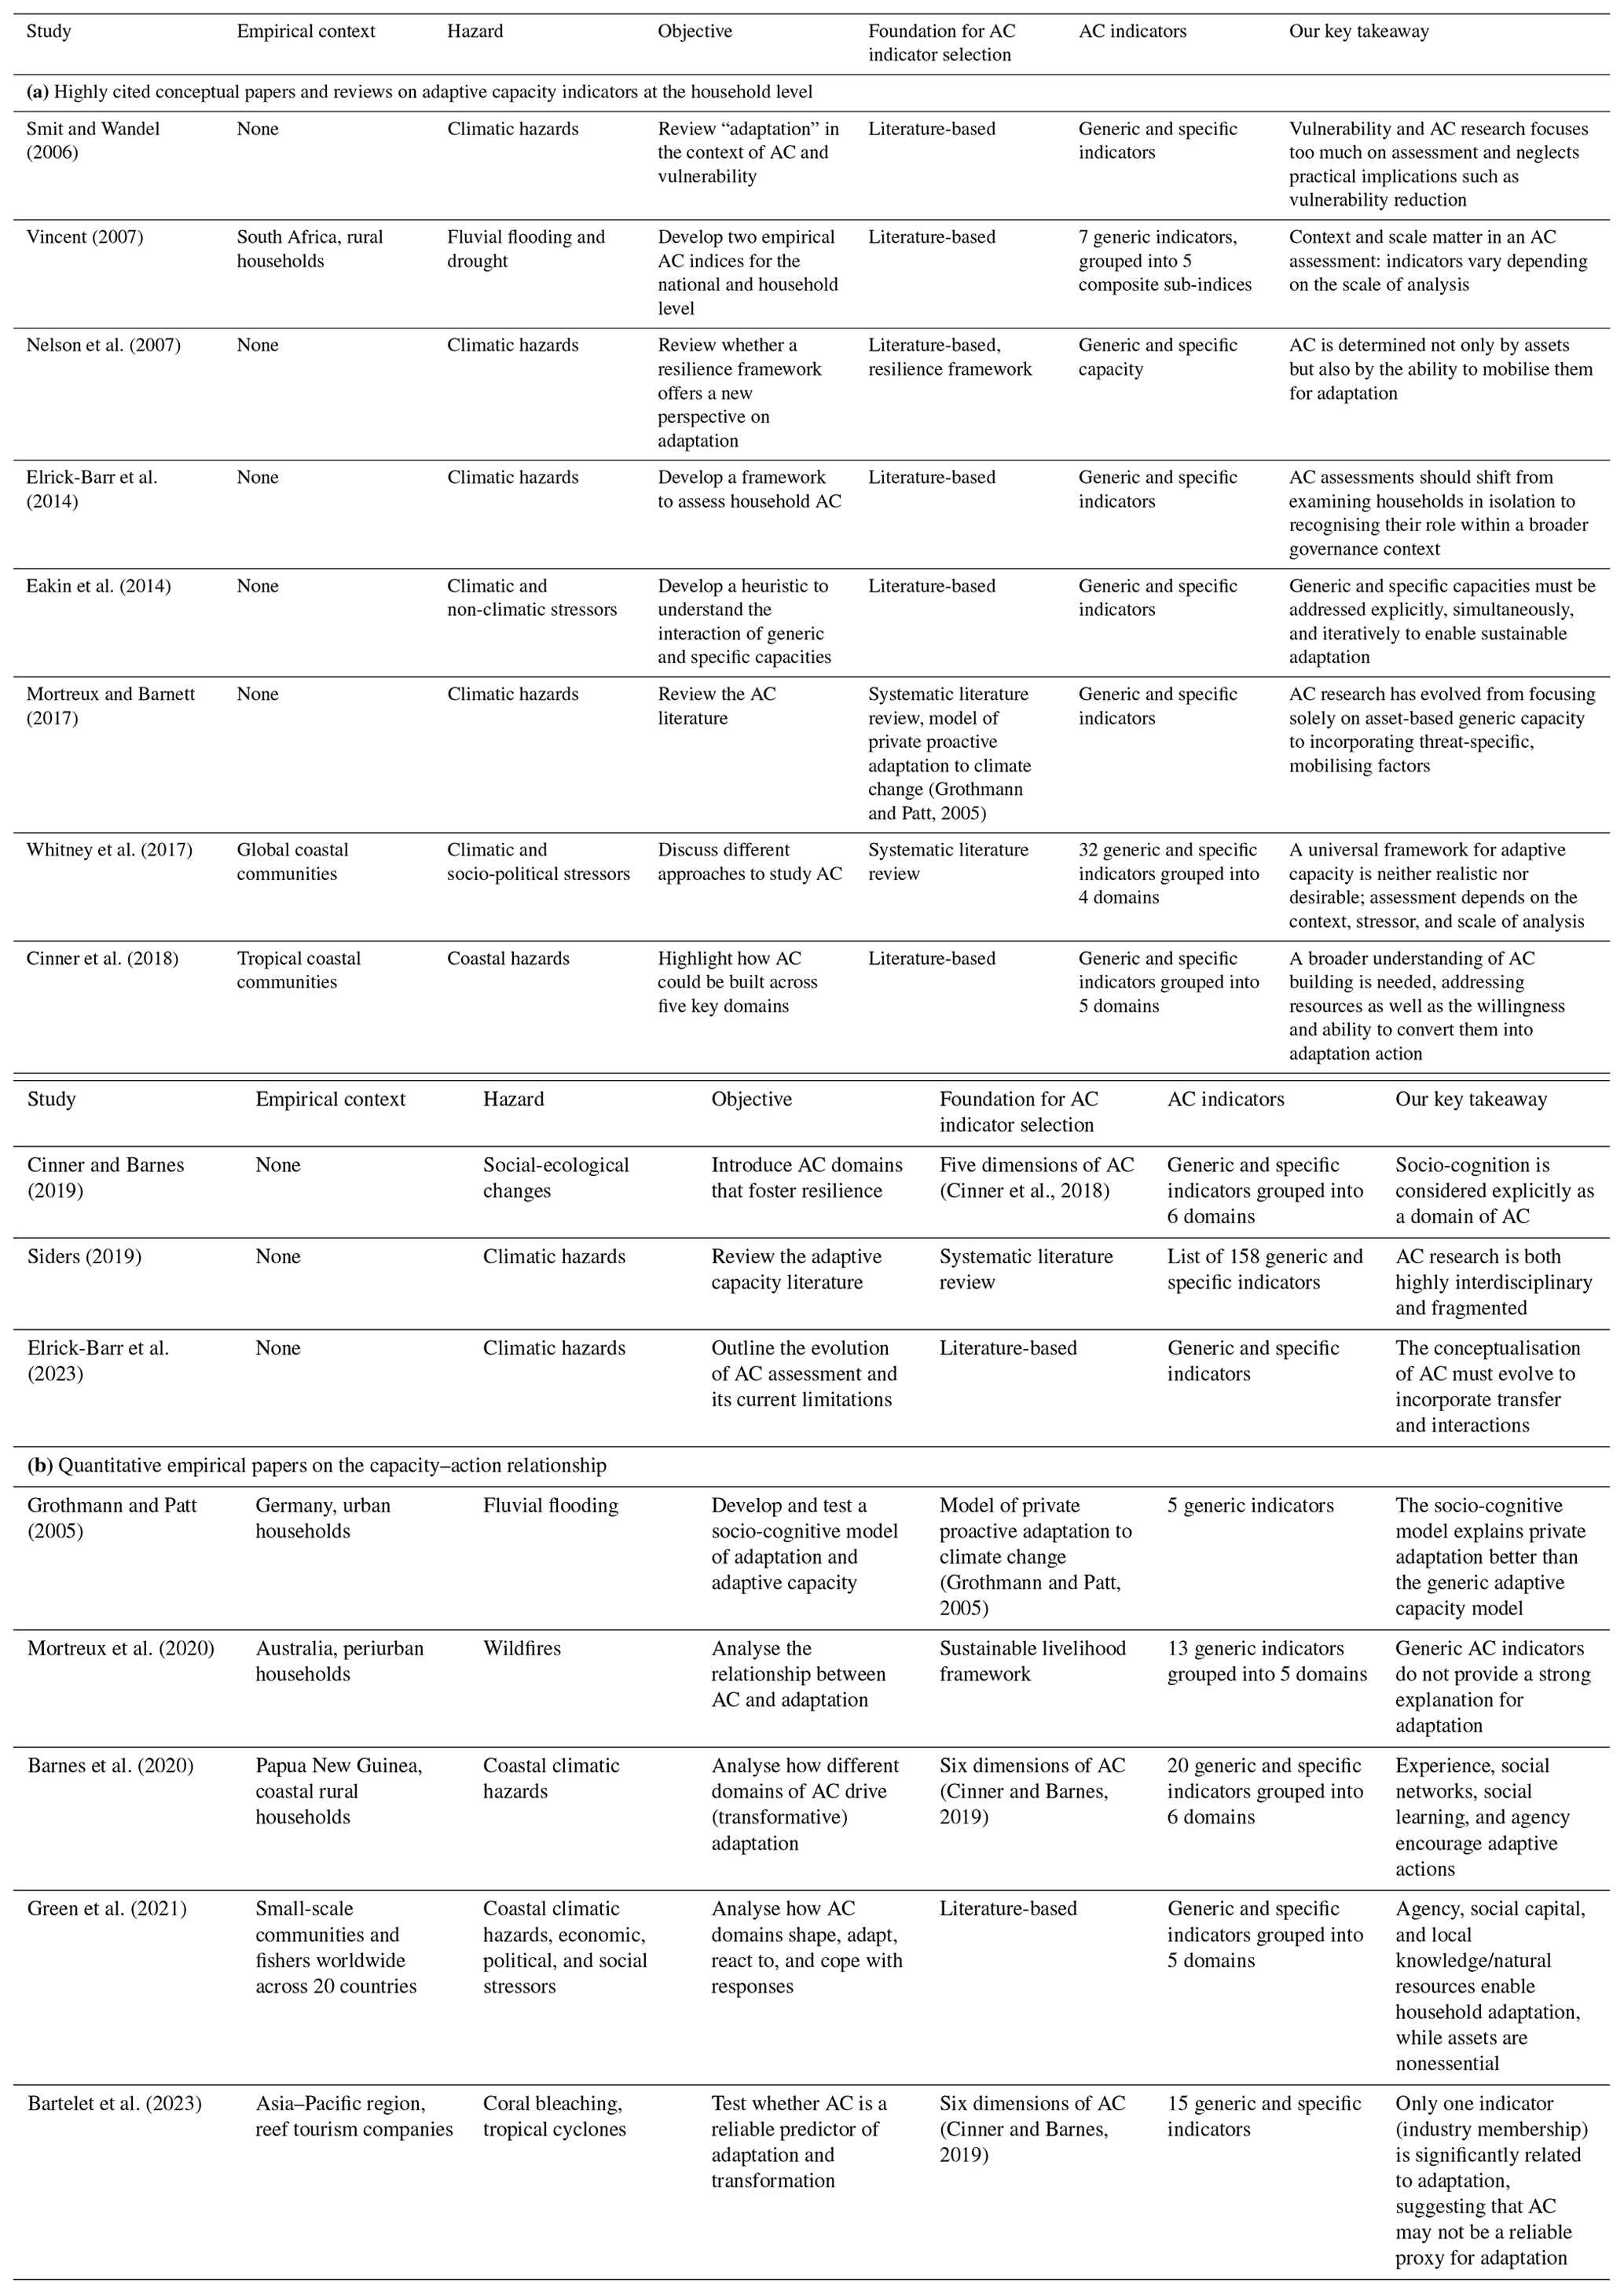
Table B1Comparison of socio-demographic sample characteristics and microcensus data for the Oberland region.
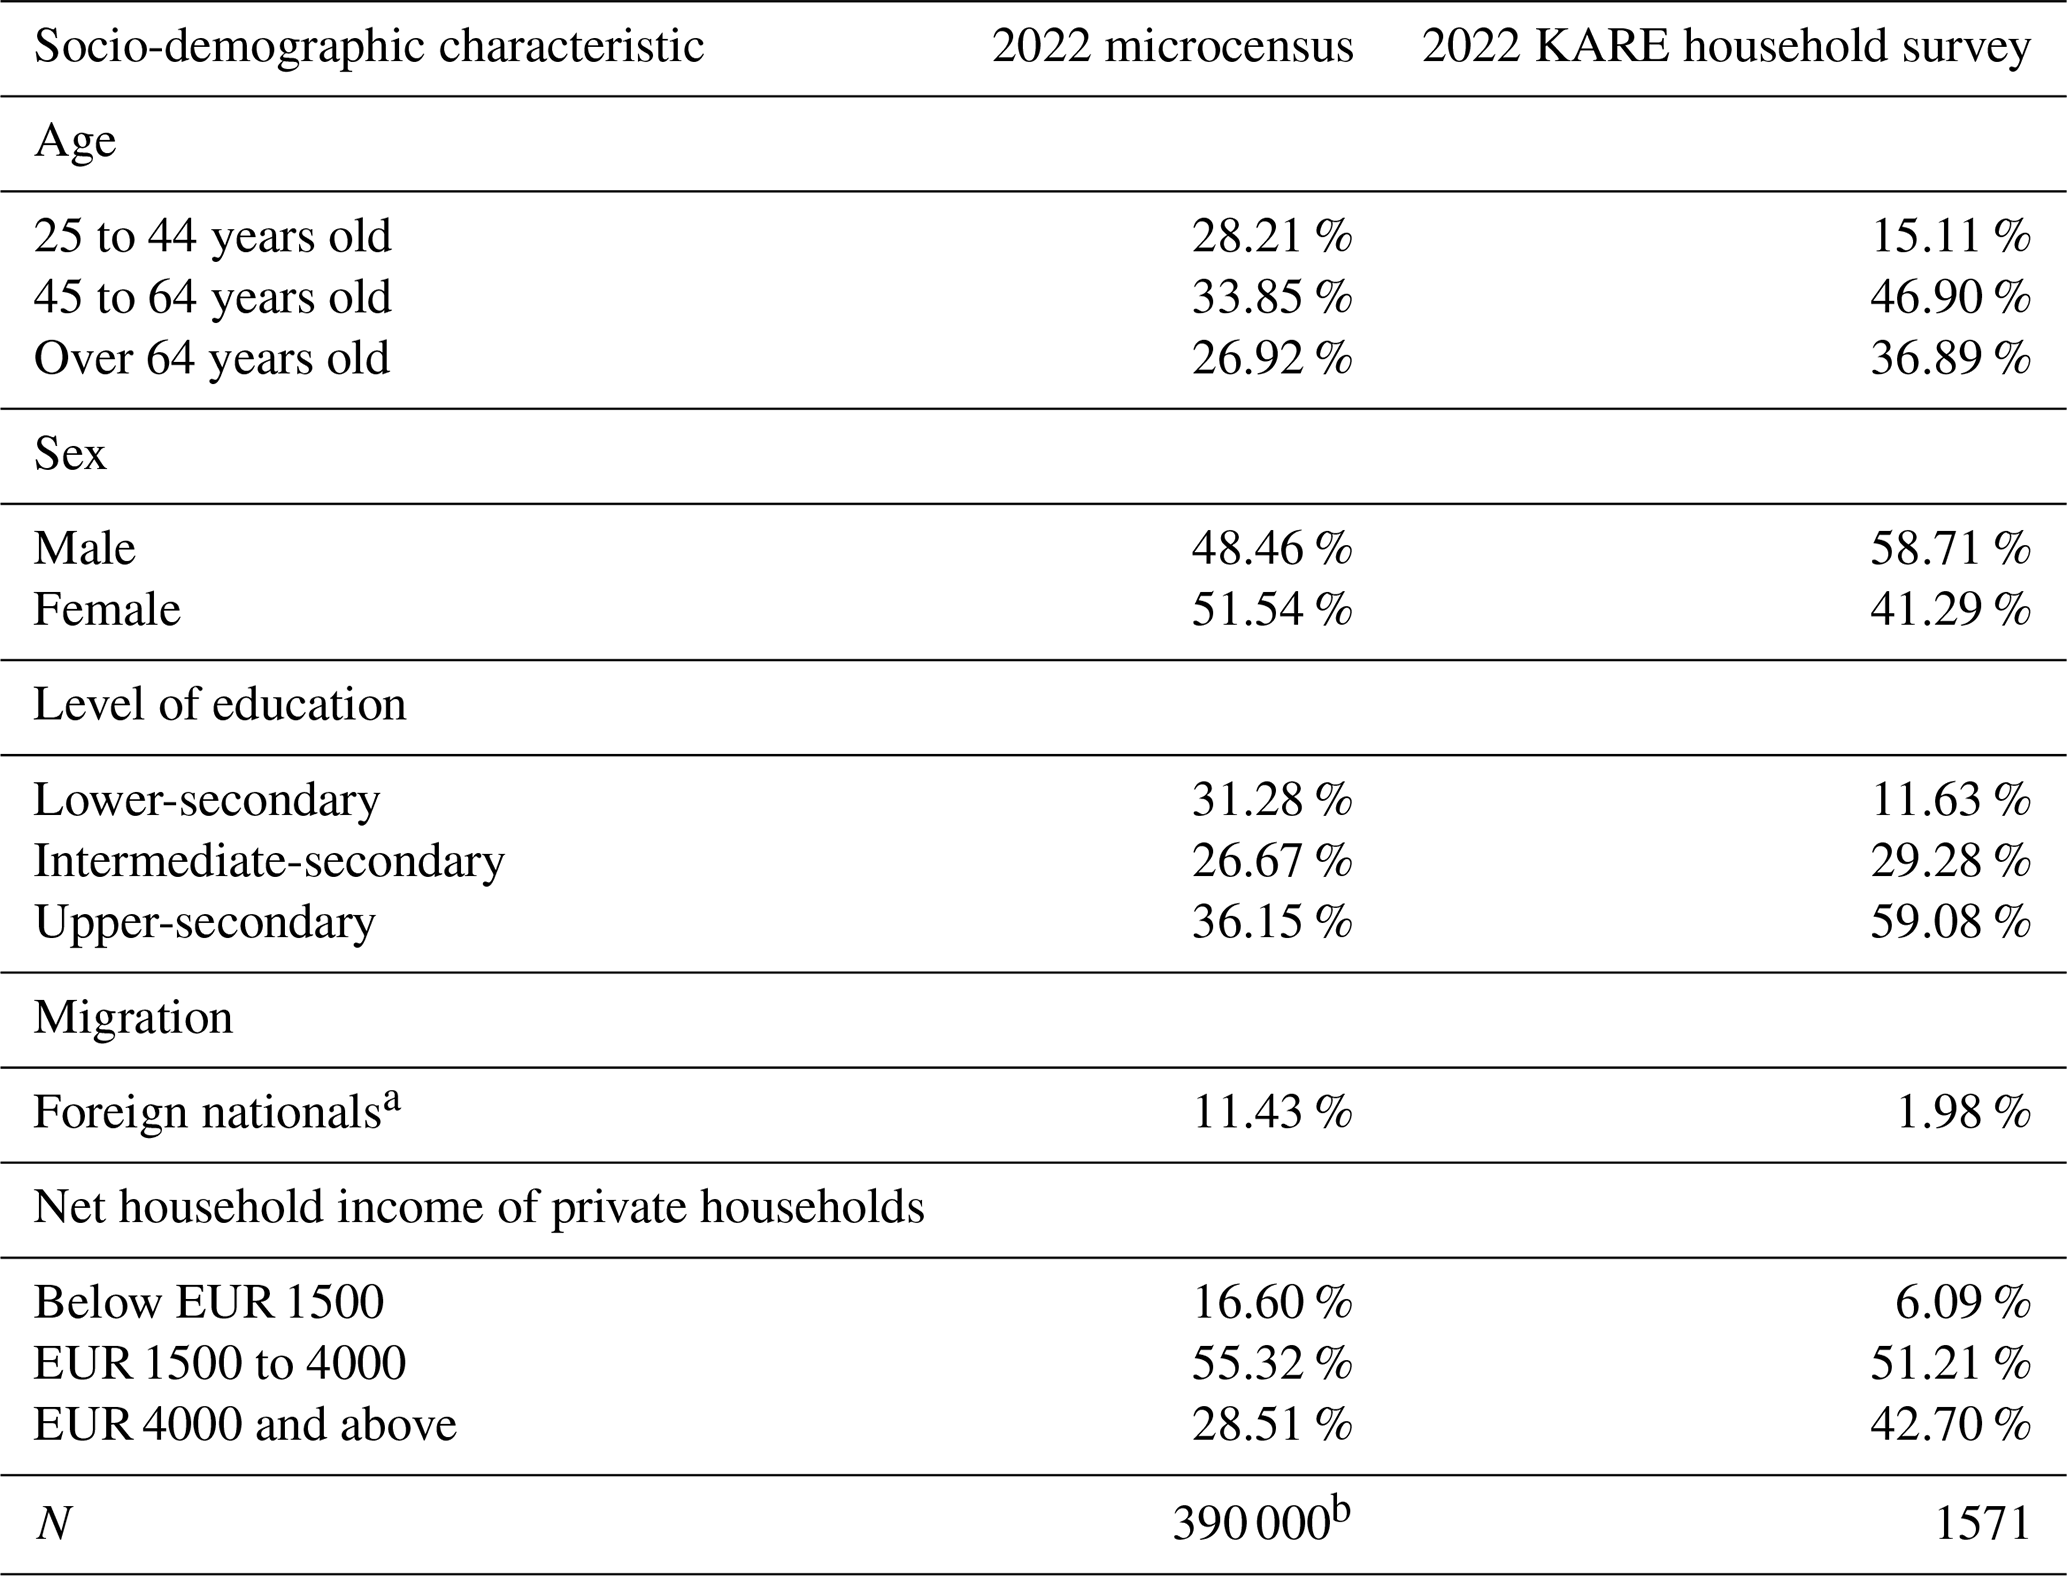
a Data from the 2019 microcensus as the number of foreign nationals is no longer provided at the regional level from 2020 onwards. b We excluded data from respondents younger than 15 from the microcensus calculations as the youngest respondent in our survey was 19 years old. Source: calculations made for this study, based on data from the 2022 KARE household survey, regional data from the 2019 microcensus (Bayerisches Landesamt für Statistik, 2021), and unpublished data from the 2022 microcensus (provided by the Bavarian State Statistical Office based on a data request from the authors).
Table C1Effects of adaptive capacity indicators on adaptation action (regression results).
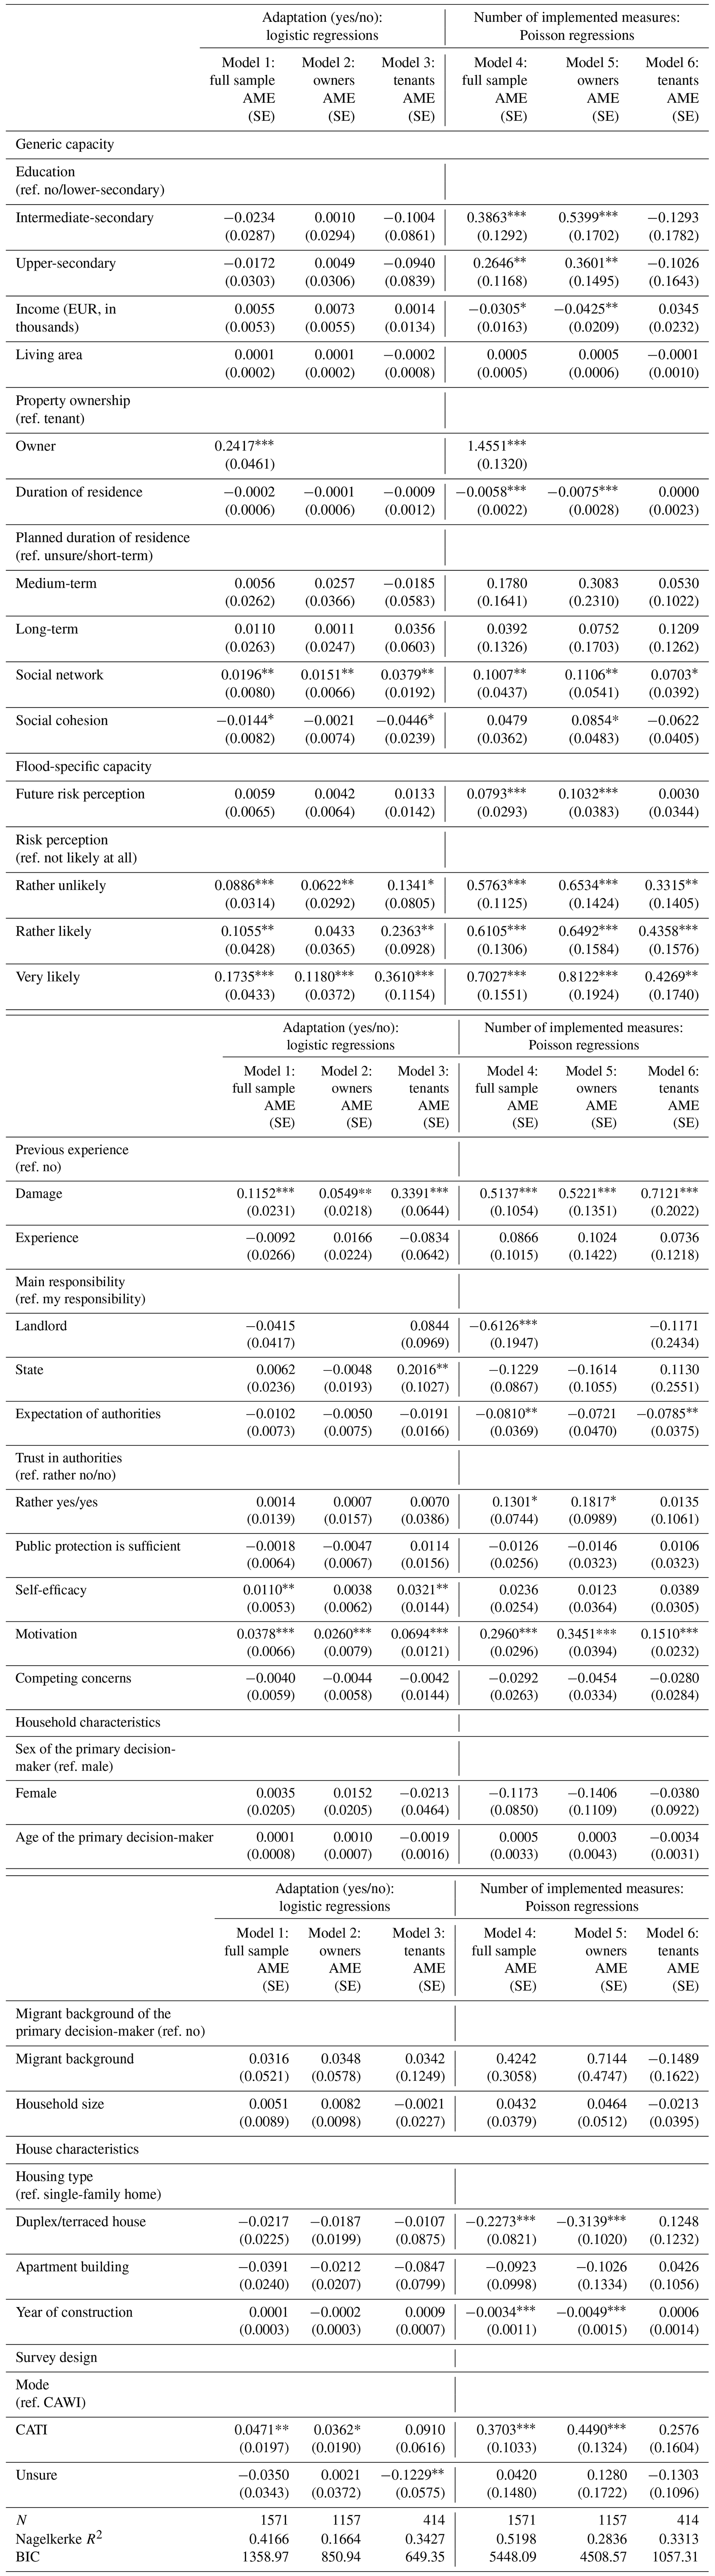
Entries are pooled AMEs from a binary logistic regression (Model 1–3) and a Poisson regression (Model 4–6) with cluster-robust standard errors at the household level. Multiple imputation with a Markov chain Monte Carlo (MCMC) algorithm was performed to account for missingness in the predictors (m=30). The impact of missing data on parameter estimations in a particular model of interest was captured by the fraction of information missing due to nonresponses (FMI) and the proportion of the variation attributable to the missing data (λ) (van Buuren, 2018, p. 46). The severity of the missing-data problem in our regression models can be classified as moderate to moderately large (FMI =0.23 for income (Model 2) and FMI =0.23 for year of house construction (Model 3 and 6), FMI ≤0.2 for all remaining coefficients). However, the presented results are not highly dependent on the handling of missing data (λ≤0.23 for all coefficients). Statistical significance level: , , . Abbreviations: AME – average marginal effect, BIC – Bayesian information criterion, SE – standard error. Source: calculations made for this study, based on data from the 2022 KARE household survey.
Table C2Effects of adaptive capacity indicators on adaptation action (regression results, complete-case analysis).
Entries are AMEs from a binary logistic regression (Model 1–3) and a Poisson regression (Model 4–6) with cluster-robust standard errors at the household level. Statistical significance level: , , . Abbreviations: AME – average marginal effect, BIC – Bayesian information criterion, SE – standard error. Source: calculations made for this study, based on data from the 2022 KARE household survey.
Table C3Effects of adaptive capacity indicators of adaptation action (regression results for detailed income analysis).
Entries are pooled AMEs from a binary logistic regression (Model 1–3) and a Poisson regression (Model 4-6) with cluster-robust standard errors at the household level. Multiple imputation with a Markov chain Monte Carlo (MCMC) algorithm was performed to account for missingness in the predictors (m=30). The impact of missing data on parameter estimations in a particular model of interest was captured by the fraction of information missing due to nonresponses (FMI) and the proportion of the variation attributable to the missing data (λ) (van Buuren, 2018, p. 46). The severity of the missing-data problem in our regression models can be classified as moderate to moderately large (FMI =0.23 for income (Model 2) and FMI =0.23 for year of house construction (Model 3 and 6), FMI ≤0.2 for all remaining coefficients). However, the presented results are not highly dependent on the handling of missing data (λ≤0.23 for all coefficients). Statistical significance level: , , . Abbreviations: AME – average marginal effect, BIC – Bayesian information criterion, SE – standard error. Source: calculations made for this study, based on data from the 2022 KARE household survey.
The data required to reproduce the above findings cannot be shared as the data contain information that could compromise research participant privacy and consent. The data analysis scripts used for this article are available as R scripts and an interactive R Markdown notebook at https://doi.org/10.17605/osf.io/8fygh (Schubert et al., 2024b).
AS: conceptualisation, methodology, software, formal analysis, investigation, data curation, writing (original draft and review and editing), visualisation. AvS: conceptualisation, investigation, writing (original draft and review and editing), project administration, funding acquisition. MG: conceptualisation, writing (original draft and review and editing), supervision, funding acquisition. All authors have read and agreed to the published version of the paper.
The contact author has declared that none of the authors has any competing interests.
Publisher's note: Copernicus Publications remains neutral with regard to jurisdictional claims made in the text, published maps, institutional affiliations, or any other geographical representation in this paper. While Copernicus Publications makes every effort to include appropriate place names, the final responsibility lies with the authors.
This article is part of the special issue “Strengthening climate-resilient development through adaptation, disaster risk reduction, and reconstruction after extreme events”. It is a result of the EGU General Assembly 2023, session NH9.3 “Resilience building and risk reduction: Assessments, frameworks, tools and experiences”, Vienna, Austria, 24 April 2023.
We acknowledge the use of ChatGPT 3.5 (OpenAI, https://chat.openai.com, last access: 18 December 2024) and DeepL Translate (DeepL SE, https://www.deepl.com/translator, last access: 18 December 2024) to provide assistance in sentence editing and the correction of grammar of an earlier version of this paper.
We thank Andrea Reimuth and the two reviewers, Samar Momin and an anonymous referee, for their valuable feedback on the manuscript and Luna Ciesla and Felix Bauer for their assistance with figure editing. Finally, we are grateful to our survey respondents who donated their time and personal data for this research.
This research has been supported by the Bundesministerium für Bildung und Forschung (grant no. 01LR2006A).
This paper was edited by Marvin Ravan and reviewed by Samar Momin and one anonymous referee.
Adger, W. N.: Social Capital, Collective Action, and Adaptation to Climate Change, Econ. Geogr., 79, 387–404, 2003. a
Adger, W. N. and Barnett, J.: Four reasons for concern about adaptation to climate change, Environ. Plann. A, 41, 2800–2805, 2009. a
Ajzen, I.: The theory of planned behavior, Organ. Behav. Hum. Dec., 50, 179–211, https://doi.org/10.1016/0749-5978(91)90020-T, 1991. a, b, c
Andrijevic, M., Schleussner, C.-F., Crespo Cuaresma, J., Lissner, T., Muttarak, R., Riahi, K., Theokritoff, E., Thomas, A., van Maanen, N., and Byers, E.: Towards scenario representation of adaptive capacity for global climate change assessments, Nat. Clim. Change, 13, 778–787, https://doi.org/10.1038/s41558-023-01725-1, 2023. a, b
Ara Begum, R., Lempert, R., Ali, E., Benjaminsen, T. A., Bernauer, T., Cramer, W., Cui, X., Mach, K., Nagy, G., Stenseth, N. C., Sukumar, R., and Wester, P.: Point of Departure and Key Concepts, in: Climate Change 2022 – Impacts, Adaptation and Vulnerability, edited by IPCC, Cambridge University Press, Cambridge, UK and New York, NY, USA, 121–196, ISBN 9781009325844, https://doi.org/10.1017/9781009325844.003, 2022. a
Arel-Bundock, V., Greifer, N., and Heiss, A.: How to Intepret Statistical Models Using marginaleffects in R and Python, J. Stat. Softw., 111, 1–32, https://doi.org/10.18637/jss.v111.i09, 2024. a
Bamberg, S., Masson, T., Brewitt, K., and Nemetschek, N.: Threat, coping and flood prevention – A meta-analysis, J. Environ. Psychol., 54, 116–126, https://doi.org/10.1016/j.jenvp.2017.08.001, 2017. a, b, c, d
Barnes, M. L., Wang, P., Cinner, J. E., Graham, N. A. J., Guerrero, A. M., Jasny, L., Lau, J., Sutcliffe, S. R., and Zamborain-Mason, J.: Social determinants of adaptive and transformative responses to climate change, Nat. Clim. Change, 10, 823–828, https://doi.org/10.1038/s41558-020-0871-4, 2020. a, b, c, d, e, f, g, h, i, j, k, l, m, n, o, p, q
Bartelet, H. A., Barnes, M. L., Bakti, L. A., and Cumming, G. S.: Testing the reliability of adaptive capacity as a proxy for adaptive and transformative responses to climate change, Global Environ. Chang., 81, 102700, https://doi.org/10.1016/j.gloenvcha.2023.102700, 2023. a, b, c, d, e, f, g, h, i, j
Bayerisches Landesamt für Statistik: Struktur der Bevölkerung und der Haushalte in Bayern 2019: Regionalergebnisse des Mikrozensus Teil V der Ergebnisse der 1 %-Mikrozensuserhebung 2019, https://www.statistik.bayern.de/mam/produkte/veroffentlichungen/statistische_berichte/a6205c_201900.pdf (last access: 4 June 2024), 2021. a
Bayerisches Landesamt für Umwelt: Sturzfluten- und Hochwasserereignisse Mai/Juni 2016: Wasserwirtschaftlicher Bericht, Bayerisches Landesamt für Umwelt (LfU), Augsburg, 2017. a
Bednar-Friedl, B., Biesbroek, R., Schmidt, D. N., Alexander, P., Børsheim, K. Y., Carnicer, J., Georgopoulou, E., Haasnoot, M., Le Cozannet, G., Lionello, P., Lipka, O., Möllmann, C., Muccione, V., Mustonen, T., Piepenburg, D., and Whitmarsh, L.: Europe, in: Climate Change 2022 – Impacts, Adaptation and Vulnerability, edited by IPCC, Cambridge University Press, Cambridge, UK and New York, NY, USA, 1817–1928, ISBN 9781009325844, https://doi.org/10.1017/9781009325844.015, 2022. a, b
Bernardi, F., Chakhaia, L., and Leopold, L.: `Sing Me a Song with Social Significance': The (Mis)Use of Statistical Significance Testing in European Sociological Research, Eur. Sociol. Rev., 33, 1–15, https://doi.org/10.1093/esr/jcw047, 2017. a
Brühlmann, F., Petralito, S., Aeschbach, L. F., and Opwis, K.: The quality of data collected online: An investigation of careless responding in a crowdsourced sample, Methods in Psychology, 2, 100022, https://doi.org/10.1016/j.metip.2020.100022, 2020. a
Bubeck, P., Osberghaus, D., and Thieken, A. H.: Explaining Changes in Threat Appraisal, Coping Appraisal, and Flood Risk-Reducing Behavior Using Panel Data From a Nation-Wide Survey in Germany, Environ. Behav., 55, 001391652311760, https://doi.org/10.1177/00139165231176069, 2023. a
Bundesinstitut für Bau-, Stadt- und Raumforschung: Laufende Raumbeobachtung des BBSR: Wachsende und schrumpfende Kreise, https://www.bbsr.bund.de/BBSR/DE/forschung/raumbeobachtung/Raumabgrenzungen/deutschland/kreise/wachsend-schrumpfend-kreise/wachsend-schrumpfend-kreise.html (last access: 18 October 2024), 2021. a
Cinner, J. E. and Barnes, M. L.: Social Dimensions of Resilience in Social-Ecological Systems, One Earth, 1, 51–56, https://doi.org/10.1016/j.oneear.2019.08.003, 2019. a, b, c, d
Cinner, J. E., Adger, W. N., Allison, E. H., Barnes, M. L., Brown, K., Cohen, P. J., Gelcich, S., Hicks, C. C., Hughes, T. P., Lau, J., Marshall, N. A., and Morrison, T. H.: Building adaptive capacity to climate change in tropical coastal communities, Nat. Clim. Change, 8, 117–123, https://doi.org/10.1038/s41558-017-0065-x, 2018. a, b, c, d, e, f, g, h, i, j, k, l
Collins, L. M., Schafer, J. L., and Kam, C.-M.: A comparison of inclusive and restrictive strategies in modern missing data procedures, Psychol. Methods, 6, 330–351, https://doi.org/10.1037/1082-989X.6.4.330, 2001. a
Curran, P. G.: Methods for the detection of carelessly invalid responses in survey data, J. Exp. Soc. Psychol., 66, 4–19, https://doi.org/10.1016/j.jesp.2015.07.006, 2016. a
Dillenardt, L. and Thieken, A. H.: Individual Flood Risk Adaptation in Germany: Exploring the Role of Different Types of Flooding, EGUsphere [preprint], https://doi.org/10.5194/egusphere-2024-162, 2024. a, b, c
Dillenardt, L., Hudson, P., and Thieken, A. H.: Urban pluvial flood adaptation: Results of a household survey across four German municipalities, J. Flood Risk Manag., 15, e12748, https://doi.org/10.1111/jfr3.12748, 2022. a, b, c, d, e, f, g
Doorn, N., Brackel, L., and Vermeulen, S.: Distributing Responsibilities for Climate Adaptation: Examples from the Water Domain, Sustainability, 13, 3676, https://doi.org/10.3390/su13073676, 2021. a, b
Eakin, H. C., Lemos, M. C., and Nelson, D. R.: Differentiating capacities as a means to sustainable climate change adaptation, Global Environ. Chang., 27, 1–8, https://doi.org/10.1016/j.gloenvcha.2014.04.013, 2014. a, b, c, d, e, f
Ellis, F.: Rural Livelihoods and Diversity in Developing Countries, Oxford University PressOxford, ISBN 9780198296959, https://doi.org/10.1093/oso/9780198296959.001.0001, 2000. a, b, c, d, e, f, g
Elmer, F., Seifert, I., Seifert, J., Kunert, U., Ackermann, V., Kreibich, H., Schwarze, R., and Thieken, A.: Vorschläge für Mindesterhebungen in verschiedenen Schadenssektoren, in: Hochwasserschäden, edited by: Thieken, A., Seifert, I., and Merz, B., 81–138, Oekom-Verlag, München, ISBN 9783865811868, 2010. a
Elrick-Barr, C. E., Preston, B. L., Thomsen, D. C., and Smith, T. F.: Toward a new conceptualization of household adaptive capacity to climate change: applying a risk governance lens, Ecol. Soc., 19, 12, https://doi.org/10.5751/ES-06745-190412, 2014. a
Elrick-Barr, C. E., Plummer, R., and Smith, T. F.: Third-generation adaptive capacity assessment for climate-resilient development, Clim. Dev., 15, 518–521, https://doi.org/10.1080/17565529.2022.2117978, 2023. a, b, c, d, e
Emeis, S.: Analysis of decadal precipitation changes at the northern edge of the Alps, Meteorol. Z., 30, 285–293, https://doi.org/10.1127/metz/2021/1053, 2021. a, b, c
Eriksen, C., Simon, G. L., Roth, F., Lakhina, S. J., Wisner, B., Adler, C., Thomalla, F., Scolobig, A., Brady, K., Bründl, M., Neisser, F., Grenfell, M., Maduz, L., and Prior, T.: Rethinking the interplay between affluence and vulnerability to aid climate change adaptive capacity, Clim. Change, 162, 25–39, https://doi.org/10.1007/s10584-020-02819-x, 2020. a, b
Friedrich, T., Stieß, I., Sunderer, G., Böhmer, C., Murawski, W., Knirsch, F., Otto, A., Wutzler, B., and Thieken, A.: Kommunalbefragung Klimaanpassung 2023, vol. 34 of Climate Change, Dessau-Roßlau, https://www.umweltbundesamt.de/publikationen/kommunalbefragung-klimaanpassung-2023 (last access: 18 October 2024), 2024. a
Green, K. M., Selgrath, J. C., Frawley, T. H., Oestreich, W. K., Mansfield, E. J., Urteaga, J., Swanson, S. S., Santana, F. N., Green, S. J., Naggea, J., and Crowder, L. B.: How adaptive capacity shapes the Adapt, React, Cope response to climate impacts: insights from small-scale fisheries, Clim. Change, 164, 15, https://doi.org/10.1007/s10584-021-02965-w, 2021. a, b, c, d, e, f, g, h, i, j, k, l, m, n
Grothmann, T.: Klimawandel, Wetterextreme und private Schadensprävention. Entwicklung, Überprüfung und praktische Anwendbarkeit der Theorie privater proaktiver Wetterextrem-Vorsorge: Dissertation, Universitätsbibliothek Magdeburg, Magdeburg, https://doi.org/10.25673/4665, 2005. a, b, c, d, e, f, g, h, i, j, k, l, m
Grothmann, T. and Patt, A.: Adaptive capacity and human cognition: The process of individual adaptation to climate change, Global Environ. Chang., 15, 199–213, https://doi.org/10.1016/j.gloenvcha.2005.01.002, 2005. a, b, c, d, e, f, g, h, i, j, k, l, m, n, o, p, q, r, s, t, u, v, w
Grothmann, T. and Reusswig, F.: People at Risk of Flooding: Why Some Residents Take Precautionary Action While Others Do Not, Nat. Hazards, 38, 101–120, https://doi.org/10.1007/s11069-005-8604-6, 2006. a, b, c, d, e, f, g
Heider, B., Scholz, B., Siedentop, S., Radzyk, J., Rönsch, J., and Weck, S.: Ungleiches Deutschland: Sozioökonomische Disparitäten 2023: wissenschaftlicher Hintergrundbericht, FES diskurs, Friedrich-Ebert-Stiftung, Bonn, ISBN 978-3-98628-409-1, 2023. a, b
Koç, G., von Streit, A., Schubert, A., and Garschagen, M.: Understanding of floods on regional scale: aggravating pathways, Understanding of floods on regional scale: aggravating pathways, vulnerability, and adaptive capacity: A case study for Oberland Region (Upper Bavaria), Germany, in: Book of Abstracts zur 1. KAHR Book of Abstracts zur 1. KAHR Wissenschaftskonferenz, 29–30 Juni 2022, KAHR Wissenschaftskonferenz, 36, https://hochwasser-kahr.de/images/KAHR_BoA_final_20April.pdf (last access: 20 June 2024), 2022. a
Kuhlicke, C., Steinführer, A., Begg, C., Bianchizza, C., Bründl, M., Buchecker, M., de Marchi, B., Di Masso Tarditti, M., Höppner, C., Komac, B., Lemkow, L., Luther, J., McCarthy, S., Pellizzoni, L., Renn, O., Scolobig, A., Supramaniam, M., Tapsell, S., Wachinger, G., Walker, G., Whittle, R., Zorn, M., and Faulkner, H.: Perspectives on social capacity building for natural hazards: outlining an emerging field of research and practice in Europe, Environ. Sci. Policy, 14, 804–814, https://doi.org/10.1016/j.envsci.2011.05.001, 2011. a
Kuhlicke, C., Seebauer, S., Hudson, P., Begg, C., Bubeck, P., Dittmer, C., Grothmann, T., Heidenreich, A., Kreibich, H., Lorenz, D. F., Masson, T., Reiter, J., Thaler, T., Thieken, A. H., and Bamberg, S.: The behavioral turn in flood risk management, its assumptions and potential implications, WIREs Water, 7, e1418, https://doi.org/10.1002/wat2.1418, 2020. a
Kussel, G. and Larysch, T.: Sozial-Ökologisches Panel: Datenbeschreibung der Haushaltsbefragung, vol. Heft 110 of RWI Materialien, RWI Leibniz-Institut für Wirtschaftsforschung, Essen, ISBN 978-3-86788-772-4, https://hdl.handle.net/10419/149892, 2017. a
Laudan, J., Zöller, G., and Thieken, A. H.: Flash floods versus river floods – a comparison of psychological impacts and implications for precautionary behaviour, Nat. Hazards Earth Syst. Sci., 20, 999–1023, https://doi.org/10.5194/nhess-20-999-2020, 2020. a
Lee, Y.-Y. and Bhattacharya, D.: Applied welfare analysis for discrete choice with interval-data on income, J. Econ., 211, 361–387, https://doi.org/10.1016/j.jeconom.2019.02.007, 2019. a
Lengfeld, K., Walawender, E., Winterrath, T., and Becker, A.: CatRaRE: A Catalogue of radar-based heavy rainfall events in Germany derived from 20 years of data, Meteorol. Z., 30, 469–487, https://doi.org/10.1127/metz/2021/1088, 2021a. a, b
Lengfeld, K., Walawender, E., Winterrath, T., Weigl, E., and Becker, A.: CatRaRE_W3_Eta_v2021.01: Catalogues of heavy precipitation events exceeding DWD's warning level 3 for severe weather based on RADKLIM-RW Version 2017.002, https://doi.org/10.5676/DWD/CatRaRE_W3_Eta_v2021.01, 2021b.
Lindell, M. K. and Perry, R. W.: The protective action decision model: theoretical modifications and additional evidence, Risk Anal., 32, 616–632, https://doi.org/10.1111/j.1539-6924.2011.01647.x, 2012. a, b, c, d, e, f, g
Mees, H., Tempels, B., Crabbé, A., and Boelens, L.: Shifting public-private responsibilities in Flemish flood risk management. Towards a co-evolutionary approach, Land Use Policy, 57, 23–33, https://doi.org/10.1016/j.landusepol.2016.05.012, 2016. a
Mesfin, D., Simane, B., Belay, A., Recha, J. W., and Schmiedel, U.: Assessing the Adaptive Capacity of Households to Climate Change in the Central Rift Valley of Ethiopia, Climate, 8, 106, https://doi.org/10.3390/cli8100106, 2020. a, b
Mood, C.: Logistic Regression: Why We Cannot Do What We Think We Can Do, and What We Can Do About It, Eur. Sociol. Rev., 26, 67–82, https://doi.org/10.1093/esr/jcp006, 2010. a
Mortreux, C. and Barnett, J.: Adaptive capacity: exploring the research frontier, Wiley Interdisciplinary Reviews: Climate Change, 8, e467, https://doi.org/10.1002/wcc.467, 2017. a, b, c, d, e, f, g, h, i, j, k, l, m, n, o
Mortreux, C., O'Neill, S., and Barnett, J.: Between adaptive capacity and action: new insights into climate change adaptation at the household scale, Environ. Res. Lett., 15, 074035, https://doi.org/10.1088/1748-9326/AB7834, 2020. a, b, c, d, e, f, g, h, i, j, k, l, m, n, o, p, q, r
NASA, METI, AIST, Japan Spacesystems, and U.S./Japan ASTER Science Team: ASTER Global Digital Elevation Model V003 [data set], https://doi.org/10.5067/ASTER/ASTGTM.003, 2019.
Nelson, D. R., Adger, W. N., and Brown, K.: Adaptation to Environmental Change: Contributions of a Resilience Framework, Annu. Rev. Environ. Resour., 32, 395–419, https://doi.org/10.1146/annurev.energy.32.051807.090348, 2007. a, b
Nelson, R., Kokic, P., Crimp, S., Martin, P., Meinke, H., Howden, S. M., de Voil, P., and Nidumolu, U.: The vulnerability of Australian rural communities to climate variability and change: Part II – Integrating impacts with adaptive capacity, Environ. Sci. Pol., 13, 18–27, https://doi.org/10.1016/j.envsci.2009.09.007, 2010. a
Niehues, J., Stockhausen, M., and Calderón, M.: Faktencheck Verteilung – Bayern und Gesamtdeutschland im Vergleich: Gutachten im Auftrag der Vereinigung der Bayerischen Wirtschaft e. V. (vbw), Köln/Berlin, https://www.vbw-bayern.de/Redaktion/Frei-zugaengliche-Medien/Abteilungen-GS/Sozialpolitik/2023/Downloads/Studie-Faktencheck-Verteilung__final.pdf (last access: 4 October 2024), 2023. a
Oakley, M., Mohun Himmelweit, S., Leinster, P., and Casado, M.: Protection Motivation Theory: A Proposed Theoretical Extension and Moving beyond Rationality – The Case of Flooding, Water, 12, 1848, https://doi.org/10.3390/w12071848, 2020. a, b, c, d, e
Osberghaus, D., Achtnicht, M., Bubeck, P., Frondel, M., Kükenthal, V. C., Larysch, T., and Thieken, A.: Klimawandel in Deutschland: Risikowahrnehmung und Anpassung in privaten Haushalten 2020, Ergebnisse und Fragebogen einer Haushaltsbefragung in Deutschland, Mannheim, https://hdl.handle.net/10419/230967, 2020. a
Pelling, M. and High, C.: Understanding adaptation: What can social capital offer assessments of adaptive capacity?, Global Environ. Chang., 15, 308–319, https://doi.org/10.1016/j.gloenvcha.2005.02.001, 2005. a
Poussin, J. K., Wouter Botzen, W. J., and Aerts, J. C.: Effectiveness of Flood Damage Mitigation Measures: Empirical Evidence from French Flood Disasters, Global Environ. Chang., 31, 74–84, https://doi.org/10.1016/j.gloenvcha.2014.12.007, 2015. a, b
Riedl, J., Drews, W., Jager, A., and Kurze, K.: Krisen- und Risikokommunikation bei Hochwasser- und Unwetterereignissen (Version 1.0.0), GESIS Data Archive [data set], https://doi.org/10.4232/1.12593, 2016. a
Rogers, R. W.: Cognitive and physiological processes in fear appeals and attitude change: A revised theory of protection motivation., in: Social psychophysiology, edited by: Cacioppo, J. T. and Petty, R. E., 153–176, Guilford Press, London, ISBN 978-0898626261, 1983. a, b, c
Rözer, V., Müller, M., Bubeck, P., Kienzler, S., Thieken, A., Pech, I., Schröter, K., Buchholz, O., and Kreibich, H.: Coping with Pluvial Floods by Private Households, Water, 8, 304, https://doi.org/10.3390/w8070304, 2016. a, b, c
Schubert, A., von Streit, A., and Garschagen, M.: Haushaltsbefragung “Schäden durch Extremwetterereignisse im Oberland” – Variablenreport: KARE Methodenbericht 1, https://doi.org/10.17605/osf.io/bfqcu, 2024a. a
Schubert, A., von Streit, A., and Garschagen, M.: R code from: Unravelling the capacity-action gap in flood risk adaptation, Open Science Framework [code], https://doi.org/10.17605/osf.io/8fygh, 2024b. a
Schwartz, S. H.: Normative Influences on Altruism, in: Advances in Experimental Social Psychology, edited by: Berkowitz, L., Academic Press, 10, 221–279, ISBN 0065-2601, https://doi.org/10.1016/S0065-2601(08)60358-5, 1977. a, b, c, d
Scoones, I.: Sustainable Rural Livelihoods: A Framework for Analysis, IDS Working Paper, 72, https://hdl.handle.net/20.500.12413/3390, 1998. a, b, c, d, e, f, g
Siders, A. R.: Adaptive capacity to climate change: A synthesis of concepts, methods, and findings in a fragmented field, Wiley Interdisciplinary Reviews: Climate Change, 10, e573, https://doi.org/10.1002/wcc.573, 2019. a, b, c, d, e, f, g, h
Smit, B. and Wandel, J.: Adaptation, adaptive capacity and vulnerability, Global Environ. Chang., 16, 282–292, https://doi.org/10.1016/j.gloenvcha.2006.03.008, 2006. a, b, c
Sparkassen-Immobilien-Vermittlungs-GmbH: Marktspiegel für Oberbayern 2024, https://www.sparkassen-immo.de/media/file/marktspiegel24-obb.pdf (last access: 31 May 2024), 2024. a
Spekkers, M., Rözer, V., Thieken, A., ten Veldhuis, M.-C., and Kreibich, H.: A comparative survey of the impacts of extreme rainfall in two international case studies, Nat. Hazards Earth Syst. Sci., 17, 1337–1355, https://doi.org/10.5194/nhess-17-1337-2017, 2017. a, b
Stauder, J. and Hüning, W.: Die Messung von Äquivalenzeinkommen und Armutsquoten auf der Basis des Mikrozensus, Statistische Analysen und Studien Nordrhein-Westfalen, 13, 9–31, 2004. a, b
Templ, M., Alfons, A., and Filzmoser, P.: Exploring incomplete data using visualization techniques, Adv. Data Anal. Classi., 6, 29–47, https://doi.org/10.1007/s11634-011-0102-y, 2012. a
Thulstrup, A. W.: Livelihood Resilience and Adaptive Capacity: Tracing Changes in Household Access to Capital in Central Vietnam, World Dev., 74, 352–362, https://doi.org/10.1016/j.worlddev.2015.05.019, 2015. a
Uittenbroek, C. J., Mees, H. L. P., Hegger, D. L. T., and Driessen, P. P. J.: From Public to Citizen Responsibilities in Urban Climate Adaptation: A Thick Analysis, in: Urban climate politics, edited by: van der Heijden, J., Bulkeley, H., and Certomà, C., The earth system governance series, Cambridge University Press, Cambridge, UK and New York, NY and Port Melbourne and New Delhi and Singapore, ISBN 9781108632157, 2019. a
Vallury, S., Smith, A. P., Chaffin, B. C., Nesbitt, H. K., Lohani, S., Gulab, S., Banerjee, S., Floyd, T. M., Metcalf, A. L., Metcalf, E. C., Twidwell, D., Uden, D. R., Williamson, M. A., and Allen, C. R.: Adaptive capacity beyond the household: a systematic review of empirical social-ecological research, Environ. Res. Lett., 17, 063001, https://doi.org/10.1088/1748-9326/ac68fb, 2022. a
van Buuren, S.: Flexible imputation of missing data, Chapman & Hall/CRC Interdisciplinary statistics series, CRC Press Taylor & Francis Group, Boca Raton and London and New York, second edition, ISBN 9781138588318, 2018. a, b, c, d, e, f
van Buuren, S. and Groothuis-Oudshoorn, K.: mice : Multivariate Imputation by Chained Equations in R, J. Stat. Softw., 45, 1–67, https://doi.org/10.18637/jss.v045.i03, 2011. a
van Valkengoed, A. M. and Steg, L.: Meta-analyses of factors motivating climate change adaptation behaviour, Nat. Clim. Change, 9, 158–163, https://doi.org/10.1038/s41558-018-0371-y, 2019. a, b, c, d
Vincent, K.: Uncertainty in adaptive capacity and the importance of scale, Global Environ. Chang., 17, 12–24, https://doi.org/10.1016/j.gloenvcha.2006.11.009, 2007. a
von Hippel, P. T.: Regression with Missing Ys: An Improved Strategy for Analyzing Multiply Imputed Data, Sociol. Methodol., 37, 83–117, https://doi.org/10.1111/j.1467-9531.2007.00180.x, 2007. a
von Hippel, P. T.: How Many Imputations Do You Need? A Two-stage Calculation Using a Quadratic Rule, Sociol. Meth. Res., 49, 699–718, https://doi.org/10.1177/0049124117747303, 2020. a
von Hippel, P. T., Scarpino, S. V., and Holas, I.: Robust Estimation of Inequality from Binned Incomes, Sociol. Methodol., 46, 212–251, https://doi.org/10.1177/0081175015599807, 2016. a
von Streit, A., Schubert, A., and Garschagen, M.: Starkregenrisikomanagement zur Klimawandelanpassung als neues Handlungsfeld für Kommunen: Anforderungen, Umsetzungsmöglichkeiten und strukturelle Hemmnisse, RaumPlanung, 227, 60–68, 2024. a, b
Wamsler, C.: From Risk Governance to City–Citizen Collaboration: Capitalizing on individual adaptation to climate change, Environ. Policy Gov., 26, 184–204, https://doi.org/10.1002/eet.1707, 2016. a, b
Ward, M. K. and Meade, A. W.: Dealing with Careless Responding in Survey Data: Prevention, Identification, and Recommended Best Practices, Annu. Rev. Psychol., 74, 577–596, https://doi.org/10.1146/annurev-psych-040422-045007, 2023. a
Werg, J., Grothmann, T., and Schmidt, P.: Assessing social capacity and vulnerability of private households to natural hazards – integrating psychological and governance factors, Nat. Hazards Earth Syst. Sci., 13, 1613–1628, https://doi.org/10.5194/nhess-13-1613-2013, 2013. a
Whitney, C. K., Bennett, N. J., Ban, N. C., Allison, E. H., Armitage, D., Blythe, J. L., Burt, J. M., Cheung, W., Finkbeiner, E. M., Kaplan-Hallam, M., Perry, I., Turner, N. J., and Yumagulova, L.: Adaptive capacity: from assessment to action in coastal social-ecological systems, Ecol. Soc., 22, 22, https://doi.org/10.5751/ES-09325-220222, 2017. a, b, c, d, e, f, g, h, i, j
Wooldridge, J. M.: Introductory econometrics: A modern approach, South-Western Cengage Learning, Mason, Ohio, 5th edn., ISBN 978-1-111-53104-1, 2013. a, b
Yan, T., Curtin, R. T., and Jans, M. E.: Trends in Income nonresponse over two decades, J. Off. Stat., 26, 145–164, 2010. a
- Abstract
- Introduction
- Conceptualising and measuring adaptive capacity
- Data and methods
- Results
- Discussion
- Conclusions
- Appendix A: Literature informing the adaptive capacity conceptualisation and indicator selection for households
- Appendix B: Comparison of socio-demographic sample characteristics and microcensus data for the Oberland region
- Appendix C: Regression tables
- Code and data availability
- Author contributions
- Competing interests
- Disclaimer
- Special issue statement
- Acknowledgements
- Financial support
- Review statement
- References