the Creative Commons Attribution 4.0 License.
the Creative Commons Attribution 4.0 License.
Monitoring snow depth variations in an avalanche release area using low-cost lidar and optical sensors
Annelies Voordendag
Thierry Hartmann
Julia Glaus
Andreas Wieser
Yves Bühler
Snow avalanches threaten people and infrastructure in mountainous areas. For the assessment of temporal protection measures of infrastructure when the avalanche danger is high, local and up-to-date information from the release zones and the avalanche track is crucial. One main factor influencing the avalanche situation is wind-drifted snow, which causes variations in snow depth across a slope. We developed a monitoring system using low-cost lidar and optical sensors to measure snow depth variations in an avalanche release area at a high spatiotemporal scale (centimetre to low decimetre spatial resolution and hourly temporal resolution). We analyse data obtained from such a monitoring system, installed within an avalanche release area at 2200 m a.s.l. close to Davos in the Swiss Alps. The system comprises two measurement stations and has been operational since November 2023. We present the experiences and insights gained from a preliminary analysis of the data obtained so far. The temporal variations of the spatial coverage show the potential and limitations of the system under varying weather conditions. A comparison of the surface elevation models derived from the lidar data and from photogrammetric processing of UAV-based images shows a good agreement, with a mean vertical difference of 0.005 m and standard deviation of 0.15 m. An avalanche event and a period of snowfall with strong winds, chosen as case studies, show the potential and limitations of the proposed system to detect changes in the snow depth distribution on a low decimetre level or better. The results obtained so far indicate that a measurement system with a few setups in or near an avalanche slope can provide information about the small-scale snow depth distribution changes in near real time. We expect that such systems and the related data processing have the potential to support experts in their decisions on avalanche safety measures in the future.
- Article
(10966 KB) - Full-text XML
- BibTeX
- EndNote
People and infrastructure in mountainous areas with seasonal snow cover face avalanche danger. There are different possibilities to mitigate the associated risks. Common routines in temporary avalanche mitigation include (1) avalanche warning, (2) closing of infrastructure (e.g. roads), (3) evacuation of people, and (4) triggering small-sized avalanches using explosives. Such measures have a significant impact on people and their economy, so the aim is to apply such measures as precisely as possible. However, local experts have in most cases limited information to base their decisions on. They mainly rely on the avalanche bulletin, the weather forecast, automated weather stations, and most importantly their own intuition and experience. Among other parameters, the current snow depth distribution in the avalanche release areas would be valuable information. When snow during a snowfall event or old snow from near-surface layers is redistributed by the wind, this modifies the total amount of snow available for avalanche release and changes the composition of the snowpack. The redistribution may lead to the formation of a slab (wind slab), denser than the layer below (EAWS, 2024). Soft and loose old snow beneath the wind slab often turns into a weak layer. Changes in wind speed during the redistribution can cause the formation of weak layers even within a wind slab. Observing and quantifying variations in snow depth, particularly when related to wind-driven distribution, are therefore important to capture one of the major drivers causing avalanches (Schweizer et al., 2003).
There are different methods to measure snow depths. The most traditional method is to stick a pole or stake with a scale into the snow cover and read off the snow depth, which gives a point measurement at a specific time. This type of measurement can also provide a time series if the pole is permanently installed and a camera is set up to automatically take pictures of the pole (Garvelmann et al., 2013; Dong and Menzel, 2017; Kopp et al., 2019). Other methods for the measurement of snow depth as a time series are the use of ultrasonic sensors, often as part of automatic weather stations (Lehning et al., 1999), or global navigation satellite system (GNSS) reflectometry (Larson et al., 2009). However, most of these are single point measurements and typically do not reveal the variations of snow depth across a slope.
For areal acquisitions of the snow cover, the most used systems are lidar (light detection and ranging) sensors and photographic cameras. Both systems are used either from the air or on the ground. Airborne systems have the advantages of better spatial coverage (less topographic occlusions) and potentially more favourable acquisition angles (sensing direction can be roughly orthogonal to terrain). Civilian uncrewed aerial vehicles (UAVs) typically operate at low altitudes above ground (e.g. up to about 200 m). When used as a carrier platform for photographic cameras or lidar sensors, they enable high spatial resolution (cm level) (Bühler et al., 2016; Harder et al., 2016; Jacobs et al., 2021), but the area that can be covered for each campaign is limited to a few square kilometres. When using aeroplanes (Bühler et al., 2015; Nolan et al., 2015; Bührle et al., 2023) or satellite platforms (Romanov et al., 2003; Marti et al., 2016; Shaw et al., 2020), the covered area can be much larger, but the achievable spatial resolution decreases. Due to high costs, one disadvantage of airborne systems is the limited temporal resolution. With a ground-based system that can measure (almost) continuously and autonomously, an area of interest can be acquired with higher temporal resolution but with the drawback of having shadowing effects due to topography and often unfavourable acquisition angles (large angles between the sensor and the surface normal).
For the computation of a 3D model using photogrammetry, each point needs to be captured in at least two images from different viewpoints. This can be achieved with a setup of multiple cameras (Basnet et al., 2016; Deschamps-Berger et al., 2020; Filhol et al., 2019; Mallalieu et al., 2017) or one moving camera capturing overlapping images (Liu et al., 2021; Bühler et al., 2015; Bührle et al., 2023; Marti et al., 2016; Shaw et al., 2020; Bernard et al., 2017). Photogrammetric approaches rely on recognizable features in the acquired images. For the application on snow, it is important that the snow cover shows certain features, e.g. structures induced by wind, and that illumination conditions are favourable, such that those features are visible in the captured images (Bühler et al., 2016, 2017).
Lidar sensors, on the other hand, use an active measurement technique, where modulated light is emitted (e.g. a light pulse), the direction of emission and the time of flight until reception of the reflected light are recorded, and the position of the reflecting surface relative to the lidar sensor is calculated. Therefore, compared to photogrammetric acquisitions, lidar sensors are less dependent on the ambient light, do not require radiometric surface texture, and can also operate during the night. An important criterion for the application of lidar sensors on snow is the operating wavelength. Most available lidar sensors use a wavelength of 1550 nm, where the reflectance of snow has a local minimum. It is possible to measure snow at that wavelength, but the achievable maximum range will likely be much lower than the range specification of the sensor. The highest reflectance of snow is at around 500 nm, but at this wavelength the penetration of the signal into the snowpack reaches about 0.1 m (Deems et al., 2013), so the reflected signal does not just represent the snow surface. The optimal wavelengths are at 900–1100 nm, where the reflectance of snow is high and where the majority of the signal is reflected from the top 0.01 m (Deems et al., 2013). A lidar sensor especially developed for application to snow and ice is the Riegl VZ6000 terrestrial laser scanner (TLS). It uses a wavelength of 1064 nm and has a measurement range of up to 6000 m. It is used in various applications, often to measure glaciers at large scales (Voordendag et al., 2021; LeWinter et al., 2014), or studies to monitor snow surface variations and avalanche properties (Hancock et al., 2018a, b, 2020; Fey et al., 2019). However, the Riegl VZ6000 TLS is very costly; it operates in laser class 3B and is not eye-safe in its optimal operation mode at short ranges (few hundred metres). Autonomous operation is very challenging during winter in an alpine environment because of the required power supply, stable setup of the sensor, and weather protection (Voordendag et al., 2023).
Alternatives can be found in the automotive industry, where the market for low-cost lidar sensors is evolving fast. Many of these sensors have a wavelength of around 900 nm, are mechanically and environmentally robust, are designed for year-round outdoor use, and operate in the short-to-medium range (maximum of a few hundred metres). Snow scientists have already used such sensors to measure snow cover properties using either UAVs (Jacobs et al., 2021; Dharmadasa et al., 2022; Koutantou et al., 2022) or ground-based mobile platforms (Jaakkola et al., 2014; Donager et al., 2021; Goelles et al., 2022; Kapper et al., 2023).
Herein, we present a monitoring system that uses a low-cost lidar sensor in a static ground-based setting with automatic and autonomous operation. The aim is to monitor the snow depth variations in an avalanche release area at high spatiotemporal resolution. In this paper, we describe the monitoring system and the experiences from the first operating season. We also present preliminary results and case studies that show the potential and limitations of the proposed system.
The purpose of the monitoring system is to build up a snow depth database of high spatial and temporal resolution, covering an avalanche release area. The main snow depth measurements are done using lidar sensors. RGB images collected using single-lens reflex (SLR) cameras complement these data. Additionally, we installed meteorological sensors at the stations to observe wind speed and direction, air temperature, relative humidity, and snow surface temperature. These data will later serve as input data for a modelling approach, where we aim to predict the snow depth variations. The system is ground-based, operates autonomously (power supply by solar panel and wind turbine), and transfers the data regularly to a server (once per hour) that allows for remote monitoring and data analysis. In the remainder of this section, we elaborate on the study site and setup; the chosen instruments, power supply, and communication; and the photogrammetric data that we used for validation.
2.1 Study site and setup
The study site is the release area of the Wildi avalanche path at Braemabuel, in the Dischma valley, a high-alpine valley in the area of Davos in southeast Switzerland (Fig. 1). The valley is permanently inhabited, and the road is kept open in winter. Several avalanche paths threaten the road, and it had to be temporarily closed several times in the past years due to avalanche danger (Zweifel et al., 2019). The slope of the study site faces northeast and has an inclination of 30–45°. Figure 1 shows an overview of the study site with the mapped outlines of the Wildi avalanche from 2019, as an example of a recent large avalanche in this area. For a suitable coverage of the region of interest, we installed two stations. Their locations were determined in three steps: (1) checking the geometrically possible maximum viewshed for the laser beam in a GIS tool, (2) checking the typical snow depths using previous snow depth acquisitions of the area to ensure that the station would not get buried, and (3) checking the surroundings for possible locations on site in the field to find suitable mounting possibilities such as stable bedrock.
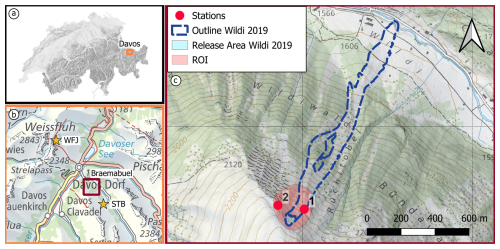
Figure 1Overview of the study area with (a) the location of Davos in Switzerland, (b) the location of Braemabuel in the area of Davos, and the locations of nearby weather stations Weissfluhjoch (WFJ) and Stillberg (STB), and (c) a close-up map of the study area Braemabuel, with the outline and release area of the Wildi avalanche in 2019, the region of interest (ROI) around the typical release area, and the location of the measurement stations Braema1 (1) and Braema2 (2) (map source: Federal Office of Topography).
Station Braema1 (Fig. 2a) is mounted on the side of a large rock in the middle of the slope, on a subtle ridge at an altitude of 2191 m a.s.l., where the snow depths are shallower than the average of the area, as the snow tends to be eroded by the wind at this location. Station Braema2 (Fig. 2b) is located on the top of the main ridge (altitude: 2255 m a.s.l.), just high enough to get more sunlight but low enough to be able to view into the region of interest. The pole carrying all equipment is screwed directly into the rock on the ground at this location. Both stations were installed on 23 November 2023.
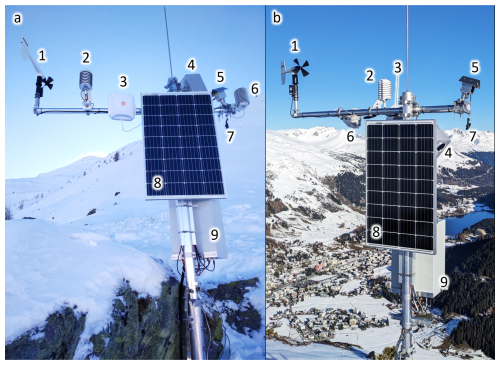
Figure 2Stations Braema1 (a) and Braema2 (b) with (1) anemometer (wind speed and direction), (2) HygroVUE10 (air temperature and relative humidity), (3) communication antenna, (4) camera system, (5) Livox Avia, (6) SnowSurf (snow surface temperature), (7) prism, (8) solar panel, and (9) control box (photo: Pia Ruttner).
In order to register the lidar point clouds between epochs, identifiable stable areas or targets in each scan are required. For this purpose, we mounted several mini-prisms in the region of interest, choosing places that are assumed to be stable and that are not completely covered in snow in the winter season (Fig. 3). However, there were no suitable locations for a geometrically ideal distribution of the prisms (surrounding the ROI such that no extrapolation is needed within the georeferencing), and no locations on the slope were visible from the upper station (Braema2). Looking from top, the terrain will be snow covered during the winter season. Therefore, we configured the viewing angle of the upper lidar sensor such that its point cloud has a maximum possible overlap with the point cloud from the lower sensor (Braema1). This gives the possibility to register the scans within each epoch directly using the point clouds from the two stations and to register them between the epochs by georeferencing using the prisms.
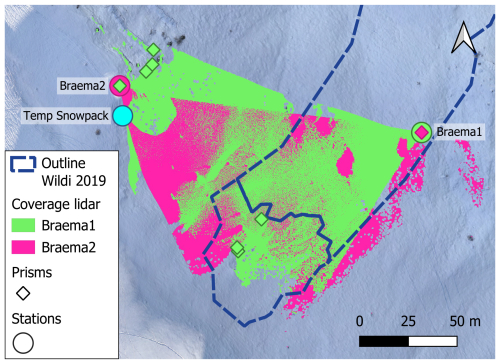
Figure 3Map of the study area, with the spatial coverage of the two lidar sensors, the measurement stations (including the station to measure temperatures within the snowpack “Temp Snowpack”), and the prism locations. The colour of the prisms indicates which prism is visible from which station. The coverage of the stations is derived from the acquisition on 23 December 2023. The background image is derived from UAV data from 19 December 2023.
For the purpose of relating the point clouds or the derived results, such as digital surface models (DSMs), to a superordinate coordinate system (e.g. the Swiss national system LV95), we measured the prism centres using a Leica TCR1203 total station and connected these measurements to a local network of benchmarks, which we measured using a Trimble real-time kinematic (RTK) global navigation satellite system (GNSS) unit.
2.2 Instrumentation
2.2.1 Lidar
The most important criteria for the lidar sensor in our application are the operating wavelength, maximum range, suitability for outdoor use, and cost. In the fast-evolving market of low-cost lidar sensors, most of the devices are now solid-state sensors operating with 32, 64, or 128 scan lines (Altuntas, 2022). In a mobile application, the scan lines sweep across the scene as the sensor itself moves, thereby increasing the spatial coverage. In a static setup, the fixed angular spacing between the scan lines of solid-state sensors results in relatively sparse coverage of the scanned scene, especially at far ranges.
Based on a market survey of lidar sensors and their technical specifications, we selected the Livox Avia lidar sensor for our measurement system. This sensor uses a Risley prism-based non-repetitive scanning pattern (Vuthea and Toshiyoshi, 2018) instead of fixed scan lines. This allows for a successively denser spatial coverage with increasing scanning times, also when not moving the sensor itself (Fig. 4). Furthermore, the selected sensor operates at a wavelength of 905 nm, has laser class 1 (i.e. it is eye-safe), has a maximum detection range of 450 m, has a low power consumption of 8 W, and costs around USD 1500. Further specifications, compared to similar lidar sensors on the market are listed in Table 1.
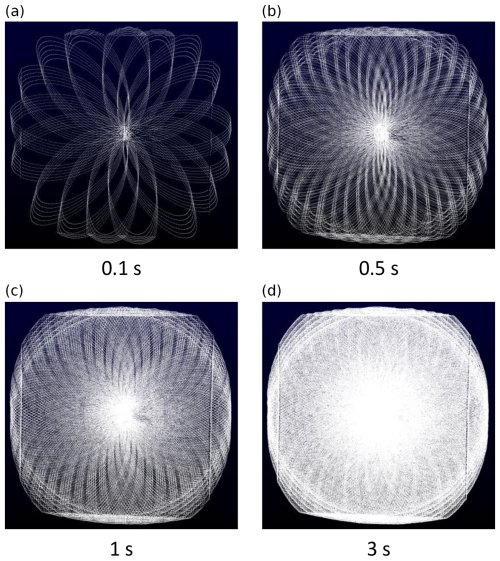
Figure 4Scanning pattern of the Livox Avia lidar sensor in an indoor test setting. We display the scanning pattern for 0.1 (a), 0.5 (b), 1.0 (c), and 3.0 s (d) scanning time (the flattening on top and bottom and the linear features on the sides are related to the shape of the scanned room).
2.2.2 Camera
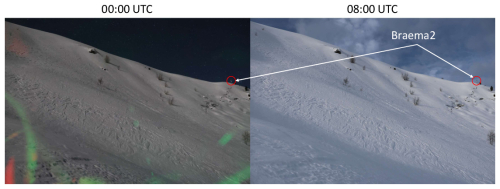
A camera provides visual information about the conditions and processes in the release area, such as weather conditions or traces of avalanche events, animals, and sportspersons. We chose a Canon EOS R7 32 megapixel camera with an RF-S 18–45 mm F4.5–6.3 IS STM zoom lens. This setup allows an on-site adjustment for capturing roughly the same area with the camera as for the lidar sensor. The camera operates in aperture-value (Av) mode, with the aperture set to f/8. The shutter speed is automatically adjusted by the camera for optimal exposure. This allows for acquisitions at day and – during periods with sufficiently strong moon light – at night (Fig. 5).
2.2.3 Meteorological sensors
We also installed various meteorological sensors. We record the wind speed and direction using a Young Wind Monitor 05103-L, the relative humidity and air temperature using a Campbell HygroVUE10, and the temperature of the snow surface using a Waljag SnowSurfSDI sensor. Additionally, we measure the temperature in the snowpack, in the vicinity of station Braema2, at the same height and exposition as the avalanche release area (see Fig. 3). To do this, we installed three poles with different heights (0.4, 0.6, and 0.8 m above ground) next to each other, each equipped with a GeoPrecision M-Log 5 W temperature sensor on top. We do not use these data in the present investigation, but we nevertheless list them here to complete the information on the equipment of the test site.
2.2.4 Power and communication
The measurement stations are designed to operate autonomously. Therefore, they are equipped with a solar panel (115 W), and station Braema1 is additionally expanded with a wind generator (Phaesun Stormy Wings 400 W) for times when the station does not get enough sunlight. The data collected on-site are regularly transmitted to a server so that they can be analysed in (near) real time. This makes it possible to recognize malfunctions at an early stage. The remote connection and control are particularly important, as it can be dangerous to access the measurement stations during the winter months due to occasional high avalanche danger.
2.3 Configuration and data processing
2.3.1 Measurement configuration
Figure 6 shows a schematic view of all sensors and connections. The measurement system is configured such that it uses a minimal amount of energy. This means that most instruments and sensors are turned off most of the time, except for the meteorological sensors, which need very little energy, and the data logger, which controls all measurements and data transfers. The data from the meteorological sensors are captured and locally stored by the data logger every 30 min. At a specified time interval (once per hour), the data logger supplies a Raspberry Pi computer, a mobile router and the Livox converter with power for 15 min. As soon as the Raspberry Pi is powered on, it tries to establish a connection with the lidar sensor through the mobile router and the Livox converter. In the case of successful communication, the Raspberry Pi triggers a lidar scan which takes 5 s. The scan data are then stored on the local solid-state drive (SSD) of the Raspberry Pi. If the Raspberry Pi is not able to connect with the Livox Avia sensor within 120 s, it sends an error message to the technical support system. After a successful scan, the Raspberry Pi sets the Livox sensor to power-saving mode and transfers the data from the local SSD to a remote server via mobile router and 5G antenna. During the time the router is switched on, the server also retrieves the meteorological measurement data from the logger. The operation of the camera works independently. The photos are triggered at the same time as the lidar scans and are immediately transmitted to the remote server through the 5G antenna.
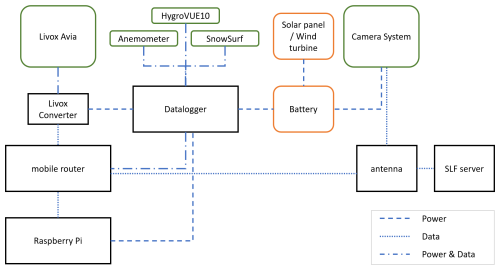
Figure 6Schematic view of all sensors and connections. Sensors are in green boxes, power-related components are in orange boxes and all communication modules are in black boxes. Dashed lines indicate power connections, dotted lines data communication and the combination of both, indicates a combined connection (power and data).
2.3.2 Data processing
The point clouds of the Livox Avia sensors are first converted from the sensor's binary LVX format to the standard LAS format. Afterwards, the point cloud from station Braema2 is transformed to the local scanner's own coordinate system of the point cloud from station Braema1 using the Open3D data-processing library (Zhou et al., 2018) implementation of the iterative closest point (ICP) plane-to-plane algorithm (Besl and McKay, 1992; Chen and Medioni, 1992). In order to register the different scan epochs with each other and reference them to a global coordinate system, we use the prisms, which are installed in the area of interest (see Fig. 3). To determine the prism centre coordinates in the local scans, we filter the points in the scan that belong to the prism and perform a 2D Gaussian fit using the intensity values (Schmid et al., 2024). With the known global coordinates of the prism centres (see Sect. 2.1), we compute the transformation matrix from the local to the global coordinate system.
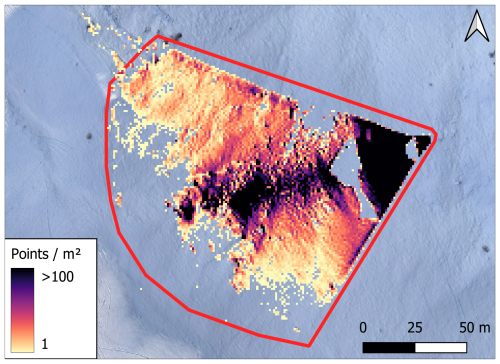
For the computation of snow depth changes, we create a gridded DSM per epoch, using the open-source software CloudCompare, and we calculate the difference between the DSMs. In particular, we perform the following steps: we define a grid with a cell size of 0.1 m×0.1 m, which is the average resolution of the point cloud. The elevation value assigned to each cell is the average elevation value of all points that fall within that cell. Empty cells are filled with the linearly interpolated height value from the nearest-neighbour cells that are not empty. This is based on Delaunay triangulation, where we define the maximum edge length as 1 m. Empty cells beyond the maximum edge length are filled with the empty cell value “−999”. For the analysis of the temporal variations of the spatial coverage of our ROI, we define a horizontal 1 m×1 m grid, counting each grid cell as covered if there is at least one scan point whose horizontal coordinates are within that cell. We then quantify the coverage as percentage of the grid (ROI, red outline in Fig. 7, approx. 14 500 m2) that was covered by the lidar.
2.4 Photogrammetric UAV data for validation
We acquired a reference dataset using a WingtraOne Gen II fixed-wing UAV with a Sony DSC-RX1RM2 42 megapixel camera. The UAV is equipped with an onboard high-precision global navigation satellite system (GNSS) receiver which records the position of each captured image. We used data from a reference station nearby (3 km distance to the measurement site), operated by the Swiss Positioning Service (swipos), to compute the coordinates in the Swiss national coordinate system LV95/LN02, using post-processing kinematics (PPK). For further photogrammetric processing, we used the software Agisoft Metashape Professional, Version 1.6.5. The photogrammetric workflow, using structure from motion (Koenderink and Doorn, 1991), is described in previous publications (Bühler et al., 2016; Adams et al., 2018; Eberhard et al., 2021) and the software manual (Agisoft, 2020). For the accuracy assessment of the photogrammetric model, we used checkpoints during the acquisition, which are square black and white checkerboard targets, with a side length of 0.4 m. We measured the centre of the targets with a Trimble RTK GNSS unit. The targets are visible in the photogrammetric model as well and can be used as independent checkpoints. This means that the targets are not used in the photogrammetric processing but serve to validate the accuracy of the model. The resulting photogrammetric model has a horizontal resolution of 0.1 m. The area covered by the UAV is 1.4 km2 and includes the entire area covered by the lidar. By subtracting a snow-free DSM, acquired in autumn with the same drone and sensor, we generate a spatially continuous snow depth map.
In order to compare the lidar scans with the photogrammetric model, both datasets need to be in the same coordinate system. Therefore, we transform the local lidar scans to the superordinate coordinate system (LV95/LN02), using the prisms in the study area, as described in Sect. 2.3.2. Due to the unfavourable geometric distribution of the prism locations, we use this approach for a coarse alignment and the ICP algorithm for the fine registration.
In this section, we present preliminary results derived from the data acquired during the first season of operation, i.e. until 14 April 2024. On this day, a large glide-snow avalanche destroyed station Braema1. We have investigated the relation between the meteorological parameters and the lidar coverage of the region of interest (Sect. 3.1), carried out a first comparison of the snow surface obtained from our system and a photogrammetry-derived surface from a UAV (Sect. 3.2), and performed two case studies showing an avalanche event and a snowfall event, respectively (Sect. 3.4).
3.1 Lidar spatial coverage of region of interest
The maximum spatial coverage of the area of interest depends on the sensor specifications (e.g. the measurement range); the number, spatial distribution, and orientation of the lidar sensors; the angle of incidence of the laser beams; shadowing effects due to the topography; the weather situation; and the snow surface conditions. As an example, Fig. 3 shows the spatial coverage at our study site (including both stations) on 23 December 2023, 16:00 UTC. However, changes over time are to be expected. We analyse this in detail for station Braema1. Figure 8b shows the spatial coverage of station Braema1 over time, together with relevant meteorological parameters, namely incoming shortwave radiation (ISWR), snow surface temperature (TSS), height of new snow (HN) within 24 h, and relative humidity (RH). The ISWR data (Fig. 8a, colour) are from the nearby weather station Stillberg (STB), about 2 km away from Braema1 and with a similar exposition and elevation (see Fig. 1). The TSS observations are from the instrument at station Braema1 (Fig. 8a, line). The amount of new snow HN (Fig. 8c, colour) is taken from the nearby weather station Weissfluhjoch (WFJ), about 5.5 km away from Braema1, but at a similar elevation (see Fig. 1). In this context, we use the value of HN as an indicator of if there was a snowfall event and how intense it was. The relative humidity is measured directly at Braema1 (Fig. 8c, line).
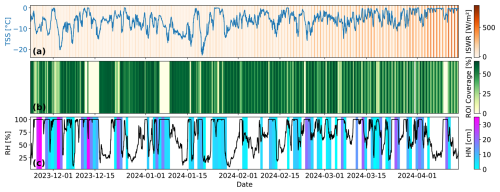
Figure 8(a) Incoming shortwave radiation (ISWR, colour) and snow surface temperature (TSS, line), (b) spatial coverage of the ROI (colour), and (c) new snow height (HN, colour, white indicates no new snow) and relative humidity (RH, line).
The maximum spatial coverage of the ROI obtained from Braema1 is about 70 % (Fig. 8b), as the surfaces that are more than 120–150 m away from the station are hardly covered by the lidar sensor (Fig. 7). This uncovered area is, however, mostly covered by Braema2 (see Fig. 3). The spatial coverage decreases during snowfall events and with high relative humidity. It can be as low as 0 %. Even if HN indicates accumulation of new snow, this does not mean that it has been snowing continuously during the preceding 24 h. Due to the high temporal resolution of the lidar system, a short weather window during a snowstorm will allow the system to capture the area and provide current information about the snowpack.
There are three periods with large data gaps: one in mid-December 2023, one at the beginning of January 2024, and one at the beginning of April 2024 (Fig. 8b, light yellow areas). A review of the camera images shows that the camera's lens was covered by snow on these dates. We conclude that, most likely, the front side of the lidar sensor was also covered by snow, and the sensor could therefore not scan the area of interest. However, the coverage increases again as soon as the humidity drops. We assume that the drop in humidity indicates the end of the precipitation and that this coincides with the clearing of the lidar lens.
A comparison of the spatial coverage with the ISWR, especially during periods without precipitation, shows a clear diurnal pattern. Around the time of the winter solstice, there is no direct sunlight in the ROI at any time of the day, and there is no significant difference between coverage at day and at night (e.g. the period after 15 December 2023). With the beginning of the year, the ISWR in the ROI increases, and a diurnal pattern of changing spatial coverage with better coverage during the nights becomes apparent. The difference in spatial coverage between day and night reaches up to 30 % in mid-March. Later in the season, the spatial coverage decreases also during nighttime, when the TSS is at or gets close to 0 °C.
3.2 Comparison with photogrammetric data
Figure 9 shows the vertical differences between the DSMs, which are derived from a UAV photogrammetric acquisition and the lidar point clouds on 19 December 2023, 11:00 UTC. The difference in the two DSMs has a mean of 0.005 m and a standard deviation of 0.15 m. The differences in the DSMs are larger and noisier at the respective far ends of the lidar data. There are also some artefacts which are due to the raw processing status of the lidar point cloud, e.g. at the border of geometrically occluded areas where the angles of incidence are large and where the point clouds likely contain mixed pixels (points that are in erroneous locations due to the comparably large lidar footprint and the impact of signal back-scattering by objects/surfaces at different distances).
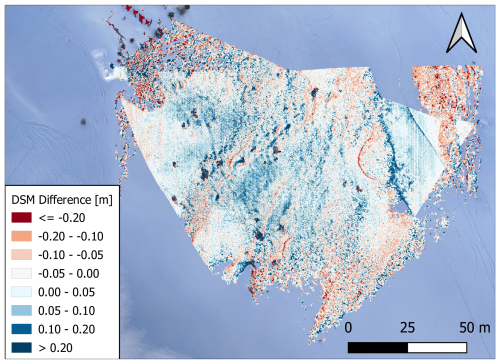
Figure 9Difference in the DSMs from a UAV photogrammetric acquisition and the lidar point clouds on 19 December 2023, 11:00 UTC. The background image is derived from the UAV data. Ski and snowboard tracks are visible outside of as well as cutting through the monitored area.
Figure 10 shows the relative differences in snow depth between 19 December 2023 and 6 February 2024 from two lidar point clouds (Fig. 10a) and, analogously, from two photogrammetric UAV acquisitions (Fig. 10b). The observed snow depth changes from the lidar point clouds range between −1.2 and 0.8 m, which is similar to the ones obtained from the photogrammetric data with a range between −1.3 and 1.0 m. The largest disagreement between the acquisition methods is again visible towards the edges of the lidar swath at areas far away from the sensor (Fig. 10c). Overall, the results differ by a mean of 0.03 m, and the standard deviation of the differences between the UAV results and the lidar results is 0.19 m; see Fig. 10c.
3.3 Uncertainty assessment
The accuracy of the photogrammetric model is evaluated with the use of checkpoints. The GNSS-based coordinates of the checkpoint centres have an accuracy of 0.01 m horizontally and 0.02 m vertically. The distances between the measured (GNSS) and the estimated (photogrammetric model) positions of the checkpoint centres are 0.03 and 0.02 m, horizontally and vertically. The accuracy of the photogrammetrically derived snow depths are not explicitly examined in this study, but from the literature we assume a vertical accuracy of around 0.1 m (Nolan et al., 2015; Vander Jagt et al., 2015).
The uncertainty assessment of the lidar data needs further research and investigation. Here we give an overview of the most common error sources (Schaer et al., 2007; Voordendag et al., 2023) and a rough estimation of the expected magnitudes:
-
Registration: The intra-epoch alignment of the point clouds of both scanners is done with ICP, where the root mean square error (RMSE) of corresponding inliers is of the order of 0.05–0.1 m.
-
Scanning geometry: The beam divergence and incidence angle define the size of the footprint of the laser beam on the reflecting surface. With a beam divergence of 0.03° (horizontal) × 0.28° (vertical), the footprint measures 0.05 m×0.5 m on a target at 100 m distance, perpendicular to the scanning direction (incidence angle of 0°). In our study area, the incidence angles are between 30 and 85°. For example, following the methods in Voordendag et al. (2023) and Schaer et al. (2007), a point at 50 m distance from our sensor, with an incidence angle of 50°, in an area of 30° slope gradient, results in a vertical uncertainty of 0.06 m. However, this value strongly depends on the distance from the station, the incidence angle and the local slope gradient. With a more unfavourable geometry (100 m distance, 70° incidence angle, 35° slope gradient), the vertical uncertainty becomes as large as 0.3 m.
-
Atmospheric conditions: Measurement errors due to changing atmospheric conditions are on the level of a few millimetres at short measurement ranges (100 m) and can therefore be neglected in our application.
Further important limitations are given by the hardware, the surface reflectivity of the snow (in particular with free water present), and the final combination of all mentioned uncertainties. With the steadily growing dataset from our stations, we plan to further investigate these uncertainties. With the current knowledge and the comparison to the photogrammetric data, we assume the lidar data to have an uncertainty in the range of 0.1–0.3 m.
3.4 Case study I: avalanche event
On 10 December 2023 a small avalanche occurred in the ROI. Figure 11 shows the snow depth changes from before and after this avalanche event. Dark red areas indicate snow erosion and blue areas indicate snow deposition. The release area, crown (fracture line), and track of the avalanche are clearly visible, and the areas not affected by the avalanche do not show large differences between the consecutive epochs.
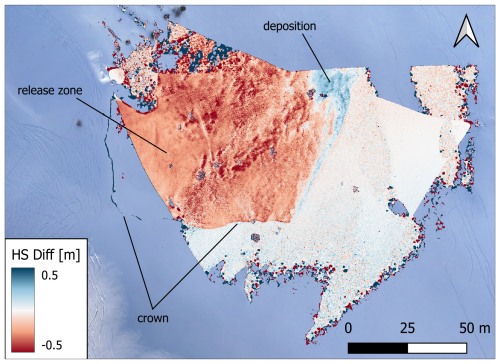
Figure 11Snow depth (HS) differences derived from lidar acquisitions on 10 December 2023 at 11:00 and 12:00 UTC, showing an avalanche event in the ROI. The background image is derived from UAV data from 19 December 2023.
The crown has a height of approximately 0.2 m, and the eroded area has a width and a length of 100 m. However, the length of the eroded area can only be approximated, since the avalanche path extends outside of the monitored area. The upper part of the release area is not covered by Braema2, due to its limited field of view, and scarcely covered by Braema1, due to its range limitation with the high incidence angles in that area. The influence of the incidence angle on the range limitation is demonstrated by the appearance of the crown in the second epoch. There were no points recorded in that area before the avalanche, but with the decreased incidence angle on the crown, we can observe it in the second epoch. This captured avalanche data, combined with the meteorological observations, will become useful input data in future avalanche modelling of the Wildi avalanche path.
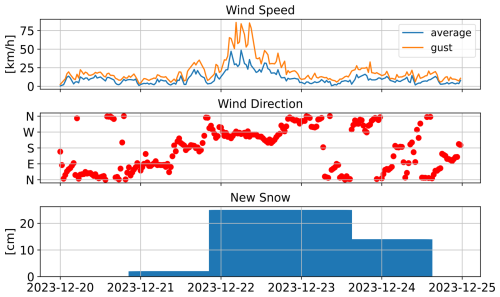
3.5 Case study II: snowfall event with wind
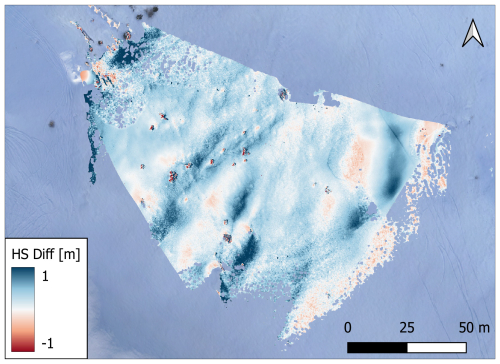
Strong winds accompanied by snowfall were observed in the ROI between 22 and 23 December 2023. Figure 12 shows the meteorological conditions around this period, including the wind speed and direction from station Braema2 (30 min average values in blue, and the maximum gusts in orange), and the 24 h new snow amount from the measurement station at Weissfluhjoch. On 22 December 2023, the wind was coming from the west, with an average speed around 25 km h−1 and gusts up to 80 km h−1. On that day, there was 0.25 m of new snow recorded at Weissfluhjoch. The influence of the strong west wind is clearly visible in the redistribution in the snow depth from 21 and 23 December 2023 (Fig. 13). The snow redistribution was influenced by small terrain features within the ROI, such as erosion on taller small sub-ridges and deposition in leeward depressions and small gullies. This snow redistribution is also visible in the snow depth changes from the lidar data and agree with the recorded, mainly westward, wind direction on this day.
Here we will discuss the potential and limitations of the system, looking at the aspect of meteorological influences on the possible coverage of the region of interest, the comparison of the lidar data with a photogrammetrically derived model, and its applicability and practical implications.
4.1 Meteorological influences on region of interest coverage
Some meteorological conditions, e.g. fog and precipitation, can hamper lidar acquisitions, resulting in a reduction of lidar transmission and reflectance. One factor of the received intensity of signals at the surface is the solar radiation. With the presence of ambient radiation in the same range of wavelengths as the sensor emits, the signal-to-noise ratio decreases, which leads to missing weak signals, e.g. at far ranges from the sensor or at low incidence angles on the measured surface (Prokop, 2008). Another factor is the presence of liquid water, which can be derived from the TSS being close to or above 0 °C. Since the spectral refractive index of water and ice are very close, the main effect of decreased returned intensity is the increase of snow grain sizes, which leads to increased absorption and spectral reflection (Wiscombe and Warren, 1980; Warren, 1982; Prokop, 2008). Precipitation and fog strongly limit the possible field of view. Depending on the intensity of snowfall, we are still able to measure up to about 100 m during light snowfall, but the view can also become limited to only a few metres during strong snowfall. The high temporal resolution in our setup enables acquisitions in short weather windows, which offers a valuable alternative for when other methods (e.g. UAV flights) would not be feasible.
4.2 Comparison of lidar data and a photogrammetric model
While there are discrepancies between the photogrammetric UAV-based acquisitions and the early processing results from our lidar system, we consider the agreement between the photogrammetric data and our lidar acquisitions an indication that the lidar-based system is able to provide snow depth differences with high spatial and temporal coverage. The comparison with the photogrammetric model shows the largest uncertainties at the far ranges from the lidar sensors and where the pattern changes from ablation to accumulation. Although we performed a horizontal alignment between the models, there remain unavoidable imperfections, which result in deviations most visible in the mentioned areas. Due to the ground-based setup, the accuracy of the lidar measurements strongly varies across the slope with varying distances to the measured points from the sensor and varying angles of incidence. With airborne acquisitions, it is possible to keep the sensor at a (roughly) constant distance above ground and achieve more favourable angles of incidence over the whole measurement area. This implies less variation in measurement uncertainty due to a more constant measurement configuration.
The quantification of the currently achieved and achievable accuracy will need further investigation and dedicated experiments, including an extended assessment of the quality of the photogrammetrically derived snow depths from the UAV, as well as an improved co-registration of UAV and lidar products, and the impacts of large angle of incidence and mixed pixels in the lidar data.
4.3 System applicability and practical implications
In comparison to current state-of-the-art methods, our system design has a few advantages. The ground-based, autonomous measurements allow for higher temporal resolution than airborne approaches (Bühler et al., 2016; Bührle et al., 2023; Jacobs et al., 2021). The use of lidar technology enables acquisitions with high spatial resolution at day and night, as opposed to purely photogrammetric methods that are limited by daylight (Basnet et al., 2016; Filhol et al., 2019). Ground-based, autonomously operating lidar sensors have been installed before but at significantly higher costs and effort, in terms of sensor protection, stability, and power supply (Voordendag et al., 2021). When selecting the sensors for our system, we therefore explicitly focused on outdoor suitability, low power consumption, and low cost.
However, finding a suitable location for installation of the system might be challenging in some areas. There needs to be a suitable setup possibility (e.g. large rocks, stable ground), at locations where the geometrically possible view of the system can cover the desired area of interest. There is always a compromise between possible ROI coverage and risk exposure when setting up a station in or close to an avalanche release zone. For a meaningful comparison between epochs, and with data from other platforms, identifiable and stable targets are needed in the ROI. However, these are not always naturally available, and suitable locations where artificial targets can be installed may be limited. However, the system itself is designed in such a way that the configuration can be easily adopted. Because it runs autonomously, it can be used in areas that would be too dangerous to carry out manual snow sampling campaigns, and due to it is low-cost, multiple systems can be installed and used simultaneously.
The two presented case studies show the potential and some limitations of the proposed system. We can detect small-scale snow depth variations, and also an avalanche is clearly visible in the data. The high temporal resolution of the lidar system enables us to capture an avalanche event by measuring the snowpack surface shortly before and after an event. This allows for the estimation of release depth and volume from the measurements. With the limitation of the maximum possible range of the lidar system, we are not able to cover the full slope or whole avalanche tracks. However, we can capture small release areas or parts of larger ones. This may help to assess the conditions in a release area, determine local snow drift patterns, and in the case of an avalanche at what depth the weak layer was. Jointly, this is important information for avalanche formation research and simulations.
Wind-drifted snow can strongly influence slope stability, but local and up-to-date information is rarely available. Therefore, we developed a low-cost monitoring system to deliver near-real time data of the snow depth variations in avalanche release areas. The monitoring system presented herein autonomously captures snow depth variations at high spatial (centimetre to low decimetre) and temporal (hourly) resolution. We designed two stations that are installed in an avalanche release area close to Davos in Switzerland. They were in operation from November 2023 through to April 2024.
The analysis of the relative changes in spatial coverage of the region of interest provides an initial indication of the influence of the snow surface and weather conditions on the measurement performance. A comparison of snow surface models derived from lidar and photogrammetric UAV data shows a mean height difference of 0.005 m with a standard deviation of 0.15 m, indicating an accuracy of the lidar data at a low decimetre level. We achieve a similar agreement between the two systems (lidar and photogrammetric UAV data) when comparing snow depth changes between acquisitions from 19 December 2023 and 6 February 2024. On 10 December 2023 an avalanche event occurred in the study area, which was captured well by the system, allowing estimates of the width of the release area (about 100 m), as well as the average release height (about 0.2 m). In a second case study, we were able to demonstrate the potential for investigating wind-induced snow depth redistribution during a 3 d snowfall event with strong winds.
The first season of system operation also revealed some limitations and areas of opportunity for improvement. Limitations include the maximum possible range of the sensor and achievable accuracies. This is due to the sensor specifications but also unfavourable scanning geometries due to the setup configuration. The latter, i.e. ground-based installation in the same slope as the monitored area, also causes unavoidable shadowing effects in the acquired data. We see room for improvement in further processing of the data, including automated procedures for data filtering, smoothing, and georeferencing. Future investigations will also include additional comparisons with other sensors (e.g. the Riegl VZ6000 laser scanner and DJI L2 lidar UAV) and dedicated experiments (e.g. the effect of light on the sensors) in order to better quantify the performance of the monitoring system.
The newly established database will be expanded in the following seasons, including data from additional sensor installations at a nearby avalanche release area with different expositions and at the Nordkette, close to Innsbruck, in collaboration with the Austrian Research Centre for Forests (BFW). We will compare the nearby weather stations in Davos with long data records, currently applied as the main information source for decision-making during avalanche periods, to the snow distribution dynamics within the monitored avalanche release zones. Furthermore, we will use the high spatiotemporal resolution data of snow depth changes, together with the recorded meteorological parameters, for the refinement of avalanche simulations, as well as for the validation of existing and the development of new small-scale wind-drifting snow models. Such models can, for example, be applied to better inform large-scale avalanche hazard indication modelling (Bühler et al., 2022; Issler et al., 2023), where the assumptions on the impact of wind-drifted snow on avalanche release depths are still very basic.
In the future, we plan to make the measurements from the release zones available to the local hazard experts by a digital information platform to support their decisions on temporary avalanche mitigation and safety measures.
The data and codes applied will be available on ENVIDAT at https://doi.org/10.16904/envidat.581 (Ruttner et al., 2025).
Study design: YB, PR, and JG. Technical implementation: TH. Fieldwork: PR, JG, and TH. Data processing: PR, with inputs from AV, AW, and YB. Manuscript: PR, with contributions from all co-authors.
At least one of the (co-)authors is a member of the editorial board of Natural Hazards and Earth System Sciences. The peer-review process was guided by an independent editor, and the authors also have no other competing interests to declare.
Publisher's note: Copernicus Publications remains neutral with regard to jurisdictional claims made in the text, published maps, institutional affiliations, or any other geographical representation in this paper. While Copernicus Publications makes every effort to include appropriate place names, the final responsibility lies with the authors.
This article is part of the special issue “Latest developments in snow science and avalanche risk management research – merging theory and practice”. It is a result of the International snow science Workshop, Bend, Oregon, USA, 8–13 October 2023.
We thank the SLF workshop for designing and producing the hardware for the measurement stations, Andreas Stoffel for operating the Wingtra UAV and Jor Fergus Dal and Justine Sommerlatt for their support during field work. We thank the reviewers Katreen Wikstrom Jones and Alexander Prokop and the editor Hans-Peter Marshall for their valuable feedback which significantly improved the paper.
This research has been supported by the Swiss National Science Foundation (SNSF) (grant no. 207519).
This paper was edited by Hans-Peter Marshall and reviewed by Katreen Wikstrom Jones and Alexander Prokop.
Adams, M. S., Bühler, Y., and Fromm, R.: Multitemporal Accuracy and Precision Assessment of Unmanned Aerial System Photogrammetry for Slope-Scale Snow Depth Maps in Alpine Terrain, Pure Appl. Geophys., 175, 3303–3324, https://doi.org/10.1007/s00024-017-1748-y, 2018. a
Agisoft, LLC: Agisoft Metashape User Manual – Professional Edition, Version 1.6, https://www.agisoft.com/pdf/metashape-pro_1_6_en.pdf (last access: 6 September 2024), 2020. a
Altuntas, C.: POINT CLOUD ACQUISITION TECHNIQUES BY USING SCANNING LIDAR FOR 3D MODELLING AND MOBILE MEASUREMENT, Int. Arch. Photogramm. Remote Sens. Spatial Inf. Sci., XLIII-B2-2022, 967–972, https://doi.org/10.5194/isprs-archives-XLIII-B2-2022-967-2022, 2022. a
Basnet, K., Muste, M., Constantinescu, G., Ho, H., and Xu, H.: Close range photogrammetry for dynamically tracking drifted snow deposition, Cold Reg. Sci. Technol., 121, 141–153, https://doi.org/10.1016/j.coldregions.2015.08.013, 2016. a, b
Bernard, E., Friedt, J. M., Tolle, F., Griselin, M., Marlin, C., and Prokop, A.: Investigating snowpack volumes and icing dynamics in the moraine of an Arctic catchment using UAV photogrammetry, Photogramm. Rec., 32, 497–512, https://doi.org/10.1111/phor.12217, 2017. a
Besl, P. J. and McKay, N. D.: Method for registration of 3-D shapes, in: Proc. SPIE 1611, Sensor Fusion IV: Control Paradigms and Data Structures, Boston, MA, 14–15 November 1991, SPIE, 586–606, https://doi.org/10.1117/12.57955, 1992. a
Bühler, Y., Marty, M., Egli, L., Veitinger, J., Jonas, T., Thee, P., and Ginzler, C.: Snow depth mapping in high-alpine catchments using digital photogrammetry, The Cryosphere, 9, 229–243, https://doi.org/10.5194/tc-9-229-2015, 2015. a, b
Bühler, Y., Adams, M. S., Bösch, R., and Stoffel, A.: Mapping snow depth in alpine terrain with unmanned aerial systems (UASs): potential and limitations, The Cryosphere, 10, 1075–1088, https://doi.org/10.5194/tc-10-1075-2016, 2016. a, b, c, d
Bühler, Y., Adams, M. S., Stoffel, A., and Boesch, R.: Photogrammetric reconstruction of homogenous snow surfaces in alpine terrain applying near-infrared UAS imagery, Int. J. Remote Sens., 38, 3135–3158, https://doi.org/10.1080/01431161.2016.1275060, 2017. a
Bühler, Y., Bebi, P., Christen, M., Margreth, S., Stoffel, L., Stoffel, A., Marty, C., Schmucki, G., Caviezel, A., Kühne, R., Wohlwend, S., and Bartelt, P.: Automated avalanche hazard indication mapping on a statewide scale, Nat. Hazards Earth Syst. Sci., 22, 1825–1843, https://doi.org/10.5194/nhess-22-1825-2022, 2022. a
Bührle, L. J., Marty, M., Eberhard, L. A., Stoffel, A., Hafner, E. D., and Bühler, Y.: Spatially continuous snow depth mapping by aeroplane photogrammetry for annual peak of winter from 2017 to 2021 in open areas, The Cryosphere, 17, 3383–3408, https://doi.org/10.5194/tc-17-3383-2023, 2023. a, b, c
Chen, Y. and Medioni, G.: Object modelling by registration of multiple range images, Image Vision Comput., 10, 145–155, https://doi.org/10.1016/0262-8856(92)90066-C, 1992. a
Deems, J. S., Painter, T. H., and Finnegan, D. C.: Lidar measurement of snow depth: a review, J. Glaciol., 59, 467–479, https://doi.org/10.3189/2013JoG12J154, 2013. a, b
Deschamps-Berger, C., Gascoin, S., Berthier, E., Deems, J., Gutmann, E., Dehecq, A., Shean, D., and Dumont, M.: Snow depth mapping from stereo satellite imagery in mountainous terrain: evaluation using airborne laser-scanning data, The Cryosphere, 14, 2925–2940, https://doi.org/10.5194/tc-14-2925-2020, 2020. a
Dharmadasa, V., Kinnard, C., and Baraër, M.: An Accuracy Assessment of Snow Depth Measurements in Agro-Forested Environments by UAV Lidar, Remote Sens.-Basel, 14, 1649, https://doi.org/10.3390/rs14071649, 2022. a
Donager, J., Sankey, T. T., Sánchez Meador, A. J., Sankey, J. B., and Springer, A.: Integrating airborne and mobile lidar data with UAV photogrammetry for rapid assessment of changing forest snow depth and cover, Science of Remote Sensing, 4, 100029, https://doi.org/10.1016/j.srs.2021.100029, 2021. a
Dong, C. and Menzel, L.: Snow process monitoring in montane forests with time-lapse photography, Hydrol. Process., 31, 2872–2886, https://doi.org/10.1002/hyp.11229, 2017. a
EAWS: Standards: Avalanche Problems, https://www.avalanches.org/standards/avalanche-problems/ (last access: 21 August 2024), 2024. a
Eberhard, L. A., Sirguey, P., Miller, A., Marty, M., Schindler, K., Stoffel, A., and Bühler, Y.: Intercomparison of photogrammetric platforms for spatially continuous snow depth mapping, The Cryosphere, 15, 69–94, https://doi.org/10.5194/tc-15-69-2021, 2021. a
Fey, C., Schattan, P., Helfricht, K., and Schöber, J.: A compilation of multitemporal TLS snow depth distribution maps at the Weisssee snow research site (Kaunertal, Austria), Water Resour. Res., 55, 5154–5164, https://doi.org/10.1029/2019WR024788, 2019. a
Filhol, S., Perret, A., Girod, L., Sutter, G., Schuler, T. V., and Burkhart, J. F.: Time-Lapse Photogrammetry of Distributed Snow Depth During Snowmelt, Water Resour. Res., 55, 7916–7926, https://doi.org/10.1029/2018WR024530, 2019. a, b
Garvelmann, J., Pohl, S., and Weiler, M.: From observation to the quantification of snow processes with a time-lapse camera network, Hydrol. Earth Syst. Sci., 17, 1415–1429, https://doi.org/10.5194/hess-17-1415-2013, 2013. a
Goelles, T., Hammer, T., Muckenhuber, S., Schlager, B., Abermann, J., Bauer, C., Expósito Jiménez, V. J., Schöner, W., Schratter, M., Schrei, B., and Senger, K.: MOLISENS: MObile LIdar SENsor System to exploit the potential of small industrial lidar devices for geoscientific applications, Geosci. Instrum. Method. Data Syst., 11, 247–261, https://doi.org/10.5194/gi-11-247-2022, 2022. a
Hancock, H., Prokop, A., Eckerstorfer, M., Borstad, C., and Hendrikx, J.: Monitoring cornice dynamics and associated avalanche activity with a terrestrial laser scanner, International Snow Science Workshop Proceedings 2018, Innsbruck, Austria, 7–12 October 2018, Montana State University Library, 323–327, https://arc.lib.montana.edu/snow-science/item.php?id=2544 (last access 25 March 2025), 2018a. a
Hancock, H., Prokop, A., Eckerstorfer, M., and Hendrikx, J.: Combining high spatial resolution snow mapping and meteorological analyses to improve forecasting of destructive avalanches in Longyearbyen, Svalbard, Cold Reg. Sci. Technol., 154, 120–132, https://doi.org/10.1016/j.coldregions.2018.05.011, 2018b. a
Hancock, H., Eckerstorfer, M., Prokop, A., and Hendrikx, J.: Quantifying seasonal cornice dynamics using a terrestrial laser scanner in Svalbard, Norway, Nat. Hazards Earth Syst. Sci., 20, 603–623, https://doi.org/10.5194/nhess-20-603-2020, 2020. a
Harder, P., Schirmer, M., Pomeroy, J., and Helgason, W.: Accuracy of snow depth estimation in mountain and prairie environments by an unmanned aerial vehicle, The Cryosphere, 10, 2559–2571, https://doi.org/10.5194/tc-10-2559-2016, 2016. a
Issler, D., Gisnås, K. G., Gauer, P., Glimsdal, S., Domaas, U., and Sverdrup-Thygeson, K.: Naksin – a New Approach to Snow Avalanche Hazard Indication Mapping in Norway, SSRN [preprint], https://doi.org/10.2139/ssrn.4530311, 2023. a
Jaakkola, A., Hyyppä, J., and Puttonen, E.: Measurement of Snow Depth Using a Low-Cost Mobile Laser Scanner, IEEE Geosci. Remote S., 11, 587–591, https://doi.org/10.1109/LGRS.2013.2271861, 2014. a
Jacobs, J. M., Hunsaker, A. G., Sullivan, F. B., Palace, M., Burakowski, E. A., Herrick, C., and Cho, E.: Snow depth mapping with unpiloted aerial system lidar observations: a case study in Durham, New Hampshire, United States, The Cryosphere, 15, 1485–1500, https://doi.org/10.5194/tc-15-1485-2021, 2021. a, b, c
Kapper, K. L., Goelles, T., Muckenhuber, S., Trügler, A., Abermann, J., Schlager, B., Gaisberger, C., Eckerstorfer, M., Grahn, J., Malnes, E., Prokop, A., and Schöner, W.: Automated snow avalanche monitoring for Austria: State of the art and roadmap for future work, Frontiers in Remote Sensing, 4, 1156519, https://doi.org/10.3389/frsen.2023.1156519, 2023. a
Koenderink, J. J. and Doorn, A. J. V.: Affine structure from motion, J. Opt. Soc. Am. A, 8, 377–385, https://doi.org/10.1364/JOSAA.8.000377, 1991. a
Kopp, M., Tuo, Y., and Disse, M.: Fully automated snow depth measurements from time-lapse images applying a convolutional neural network, Sci. Total Environ., 697, 134213, https://doi.org/10.1016/j.scitotenv.2019.134213, 2019. a
Koutantou, K., Mazzotti, G., Brunner, P., Webster, C., and Jonas, T.: Exploring snow distribution dynamics in steep forested slopes with UAV-borne LiDAR, Cold Reg. Sci. Technol., 200, 103587, https://doi.org/10.1016/j.coldregions.2022.103587, 2022. a
Larson, K. M., Gutmann, E. D., Zavorotny, V. U., Braun, J. J., Williams, M. W., and Nievinski, F. G.: Can we measure snow depth with GPS receivers?, Geophys. Res. Lett., 36, L17502, https://doi.org/10.1029/2009GL039430, 2009. a
Lehning, M., Bartelt, P., Brown, B., Russi, T., Stöckli, U., and Zimmerli, M.: snowpack model calculations for avalanche warning based upon a new network of weather and snow stations, Cold Reg. Sci. Technol., 30, 145–157, https://doi.org/10.1016/S0165-232X(99)00022-1, 1999. a
LeWinter, A. L., Finnegan, D. C., Hamilton, G. S., Stearns, L. A., and Gadomski, P. J.: Continuous Monitoring of Greenland Outlet Glaciers Using an Autonomous Terrestrial LiDAR Scanning System: Design, Development and Testing at Helheim Glacier, 2014, C31B–0292, https://ui.adsabs.harvard.edu/abs/2014AGUFM.C31B0292L (last access: 12 December 2022), 2014. a
Liu, J., Chen, R., Ding, Y., Han, C., and Ma, S.: Snow process monitoring using time-lapse structure-from-motion photogrammetry with a single camera, Cold Reg. Sci. Technol., 190, 103355, https://doi.org/10.1016/j.coldregions.2021.103355, 2021. a
Mallalieu, J., Carrivick, J. L., Quincey, D. J., Smith, M. W., and James, W. H. M.: An integrated Structure-from-Motion and time-lapse technique for quantifying ice-margin dynamics, J. Glaciol., 63, 937–949, https://doi.org/10.1017/jog.2017.48, 2017. a
Marti, R., Gascoin, S., Berthier, E., de Pinel, M., Houet, T., and Laffly, D.: Mapping snow depth in open alpine terrain from stereo satellite imagery, The Cryosphere, 10, 1361–1380, https://doi.org/10.5194/tc-10-1361-2016, 2016. a, b
Nolan, M., Larsen, C., and Sturm, M.: Mapping snow depth from manned aircraft on landscape scales at centimeter resolution using structure-from-motion photogrammetry, The Cryosphere, 9, 1445–1463, https://doi.org/10.5194/tc-9-1445-2015, 2015. a, b
Prokop, A.: Assessing the applicability of terrestrial laser scanning for spatial snow depth measurements, Cold Reg. Sci. Technol., 54, 155–163, https://doi.org/10.1016/j.coldregions.2008.07.002, 2008. a, b
Romanov, P., Tarpley, D., Gutman, G., and Carroll, T.: Mapping and monitoring of the snow cover fraction over North America, J. Geophys. Res.-Atmos., 108, 8619, https://doi.org/10.1029/2002JD003142, 2003. a
Ruttner, P., Voordendag, A., Hartmann, T., Glaus, J., Wieser, A., and Bühler, Y.: Snow depth mapping by lidar station Braemabuel, EnviDat [data set], https://doi.org/10.16904/envidat.581, 2025. a
Schaer, P., Skaloud, J., Landtwing, S., and Legat, K.: Accuracy Estimation for Laser Point Cloud Including Scanning Geometry, in: 5th International Symposium on Mobile Mapping Technology, Padova, Italy, 29–31 May 2007, https://infoscience.epfl.ch/handle/20.500.14299/17191 (last access: 25 March 2025), 2007. a, b
Schmid, L., Medic, T., Frey, O., and Wieser, A.: Target-based georeferencing of terrestrial radar images using TLS point clouds and multi-modal corner reflectors in geomonitoring applications, ISPRS Open Journal of Photogrammetry and Remote Sensing, 13, 100074, https://doi.org/10.1016/j.ophoto.2024.100074, 2024. a
Schweizer, J., Bruce Jamieson, J., and Schneebeli, M.: Snow avalanche formation, Rev. Geophys., 41, 1016, https://doi.org/10.1029/2002RG000123, 2003. a
Shaw, T. E., Deschamps-Berger, C., Gascoin, S., and McPhee, J.: Monitoring Spatial and Temporal Differences in Andean Snow Depth Derived From Satellite Tri-Stereo Photogrammetry, Front. Earth Sci., 8, 579142, https://doi.org/10.3389/feart.2020.579142, 2020. a, b
Vander Jagt, B., Lucieer, A., Wallace, L., Turner, D., and Durand, M.: Snow Depth Retrieval with UAS Using Photogrammetric Techniques, Geosciences, 5, 264–285, https://doi.org/10.3390/geosciences5030264, 2015. a
Voordendag, A., Goger, B., Klug, C., Prinz, R., Rutzinger, M., Sauter, T., and Kaser, G.: Uncertainty assessment of a permanent long-range terrestrial laser scanning system for the quantification of snow dynamics on Hintereisferner (Austria), Front. Earth Sci., 11, 1085416, https://doi.org/10.3389/feart.2023.1085416, 2023. a, b, c
Voordendag, A. B., Goger, B., Klug, C., Prinz, R., Rutzinger, M., and Kaser, G.: AUTOMATED AND PERMANENT LONG-RANGE TERRESTRIAL LASER SCANNING IN A HIGH MOUNTAIN ENVIRONMENT: SETUP AND FIRST RESULTS, ISPRS Ann. Photogramm. Remote Sens. Spatial Inf. Sci., V-2-2021, 153–160, https://doi.org/10.5194/isprs-annals-V-2-2021-153-2021, 2021. a, b
Vuthea, V. and Toshiyoshi, H.: A Design of Risley Scanner for LiDAR Applications, in: 2018 International Conference on Optical MEMS and Nanophotonics (OMN), Lausanne, Switzerland, 29 July–2 August 2018, IEEE, https://doi.org/10.1109/OMN.2018.8454641, 2018. a
Warren, S. G.: Optical properties of snow, Rev. Geophys., 20, 67–89, https://doi.org/10.1029/RG020i001p00067, 1982. a
Wiscombe, W. J. and Warren, S. G.: A Model for the Spectral Albedo of Snow. I: Pure Snow, J. Atmos. Sci., 37, 2712–2733, https://doi.org/10.1175/1520-0469(1980)037<2712:AMFTSA>2.0.CO;2, 1980. a
Zhou, Q.-Y., Park, J., and Koltun, V.: Open3D: A Modern Library for 3D Data Processing, arXiv [preprint], https://doi.org/10.48550/arXiv.1801.09847, 2018. a
Zweifel, B., Lucas, C., Hafner, E., Techel, F., Marty, C., and Stucki, T.: Schnee und Lawinen in den Schweizer Alpen. Hydrologisches Jahr 2018/19, WSL Berichte, WSL-Institut für Schnee- und Lawinenforschung SLF; Eidg. Forschungsanstalt für Wald, Schnee und Landschaft WSL, https://www.dora.lib4ri.ch/wsl/islandora/object/wsl%3A22232/ (last access: 27 February 2024), 2019. a


